investigating the determinants and endogenous …
TRANSCRIPT
Southern Illinois University CarbondaleOpenSIUC
Dissertations Theses and Dissertations
12-1-2017
INVESTIGATING THE DETERMINANTSAND ENDOGENOUS INFLUENCES OFENVIRONMENTAL REPUTATIONYoung Soo ShimSouthern Illinois University Carbondale, [email protected]
Follow this and additional works at: http://opensiuc.lib.siu.edu/dissertations
This Open Access Dissertation is brought to you for free and open access by the Theses and Dissertations at OpenSIUC. It has been accepted forinclusion in Dissertations by an authorized administrator of OpenSIUC. For more information, please contact [email protected].
Recommended CitationShim, Young Soo, "INVESTIGATING THE DETERMINANTS AND ENDOGENOUS INFLUENCES OF ENVIRONMENTALREPUTATION" (2017). Dissertations. 1459.http://opensiuc.lib.siu.edu/dissertations/1459
brought to you by COREView metadata, citation and similar papers at core.ac.uk
provided by OpenSIUC
INVESTIGATING THE DETERMINANTS AND ENDOGENOUS INFLUENCES OF
ENVIRONMENTAL REPUTATION
by
Young Soo Shim
B.S., Hanyang University, 1978
M.A., Southern Illinois University Carbondale, 1998
PhD., Southern Illinois University Carbondale, 2004
B.S., Southern Illinois University Carbondale, 2009
M.A., Southern Illinois University Carbondale, 2010
A Dissertation
Submitted in Partial Fulfillment of the Requirements for the
Doctor of Philosophy in Business Administration (Concentration: Accounting)
Department of Business Administration
in the Graduate School
Southern Illinois University Carbondale
December, 2017
Copyright by YOUNG SHIM, 2017
All Rights Reserved
INVESTIGATING THE DETERMINANTS AND ENDOGENOUS INFLUENES OF
ENVIRONMENTAL REPUTATION
By
Young Soo Shim
A Dissertation Submitted in Partial
Fulfillment of the Requirements
for the Degree of
Doctor of Philosophy
in the field of Accountancy
Approved by:
Royce D. Burnett, Chair
Carl Flowers
Allan Karnes
Marc Morris
Raymond Wacker
Graduate School
Southern Illinois University Carbondale
03/10/2017

i
AN ABSTRACT OF THE DISSERTATION OF
Young Soo Shim, for the Doctor of Philosophy degree in Accountancy, presented on 03/10/2017,
at Southern Illinois University Carbondale.
TITLE: INVESTIGATING THE DETERMINANTS AND ENDOGENOUS INFLUENES OF
ENVIRONMENTAL REPUTATION
MAJOR PROFESSOR: Dr. Royce D. Burnett
This study investigates (1) the determinants of a firm’s environmental reputation and (2)
the impact of this reputation on employee productivity and financial performance. I extend
existing work in this area by focusing on both the endogenous and exogenous benefits of the
reputation. The endogenous benefits refer to positive impacts of the reputation on employee
morale and employee productivity, which have generally been ignored by prior research. In
developing my research hypotheses, I draw on the following five well-established theories: the
costly signaling theory, the resource-based view of firm, the Porter’s eco-efficiency perspective,
the social identity theory, and the third-person effect theory. A sample of 271 companies was
drawn from the 500 largest U.S. public companies listed in the 2010 Newsweek’s green report.
The corporate environmental data for this study were gathered from this report. Meanwhile, the
corporate financial data were obtained from the Mergent database. Via multiple regression
analyses, I find (1) environmental reputation is significantly and positively predicted by
environmental management when firm environmental reputation is high; (2) environmental
reputation is significantly and positively related to environmental performance when firm
environmental reputation is low; (3) across the board, environmental reputation does not predict
employee productivity; (4) environmental reputation is a significant and positive predictor of
financial performance only for firms with high environmental reputation; and (5) employee

ii
productivity positively and significantly predicts financial performance only for firms with a
high environmental reputation.

iii
DEDICATION
to my family who has sacrificed too much for me
iv
ACKNOWLEDGMENTS
My foremost acknowledgment naturally goes to my committee chairperson Dr. Royce
Burnett. Without his truly extraordinary and patient guidance and support, I would not have
been where I am. Above all, he is a great person of peerless courage and conviction whose
likes I may not be able to see again. Any amount of words could never fully describe what a
person he is. Lastly, I owe my profound gratitude to my committee members Dr. Carl Flowers,
Dr. Allan Karnes, Dr. Marc Morris, and Dr. Raymond Wacker for their thoughtful words of
encouragement.
v
TABLE OF CONTENTS
CHAPTER PAGE
ABSTRACT ..................................................................................................................................... i
ACKNOWLEDGMENTS ...............................................................................................................v
LIST OF FIGURES ...................................................................................................................... vii
CHAPERS
CHAPTER 1 – Introduction.................................................................................................1
CHAPTER 2 – Literature Review .....................................................................................10
CHAPTER 3 – Research Model and Hypotheses .............................................................31
CHAPTER 4 – Research Methodology ............................................................................38
CHAPTER 5 – Results and Analysis ................................................................................45
CHAPTER 6 – Conclusions and Discussions ...................................................................52
REFERENCES .............................................................................................................................62
APPENDICES
Appendix A – Table 1: Descriptive Statistics ..................................................................74
Appendix B – Table 2: Correlations ...............................................................................75
Appendix C – Table 3: Multiple Regression Analysis for Hypotheses 1 and 2
(Full Sample) ...........................................................................................76
Appendix D – Table 4: Multiple Regression Analysis for Hypotheses 1 and 2
(High-Reputation Sample) ......................................................................77
Appendix E – Table 5: Multiple Regression Analysis for Hypotheses 1 and 2
(Low-Reputation Sample) .......................................................................78

vi
Appendix F – Table 6: Multiple Regression Analysis for Hypothesis 3
(Full Sample) ...........................................................................................79
Appendix G – Table 7: Multiple Regression Analysis for Hypothesis 3
(High-Reputation Sample) ......................................................................80
Appendix H – Table 8: Multiple Regression Analysis for Hypothesis 3
(Low-Reputation Sample) .......................................................................81
Appendix I – Table 9: Multiple Regression Analysis for Hypotheses 4 and 5
(Full Sample) ...........................................................................................82
Appendix J – Table 10: Multiple Regression Analysis for Hypotheses 4 and 5
(High-Reputation Sample) ......................................................................83
Appendix K – Table 11: Multiple Regression Analysis for Hypotheses 4 and 5
(Low-Reputation Sample) .......................................................................84
Appendix L – Table 12: Recap of Hypotheses Testing ...................................................85
VITA ...........................................................................................................................................86
vii
LIST OF FIGURES
FIGURE PAGE
Figure 1 Research Model to Investigate Determinants and Impact of Environmental
Reputation ......................................................................................................................31
1
CHAPTER 1
INTRODUCTION
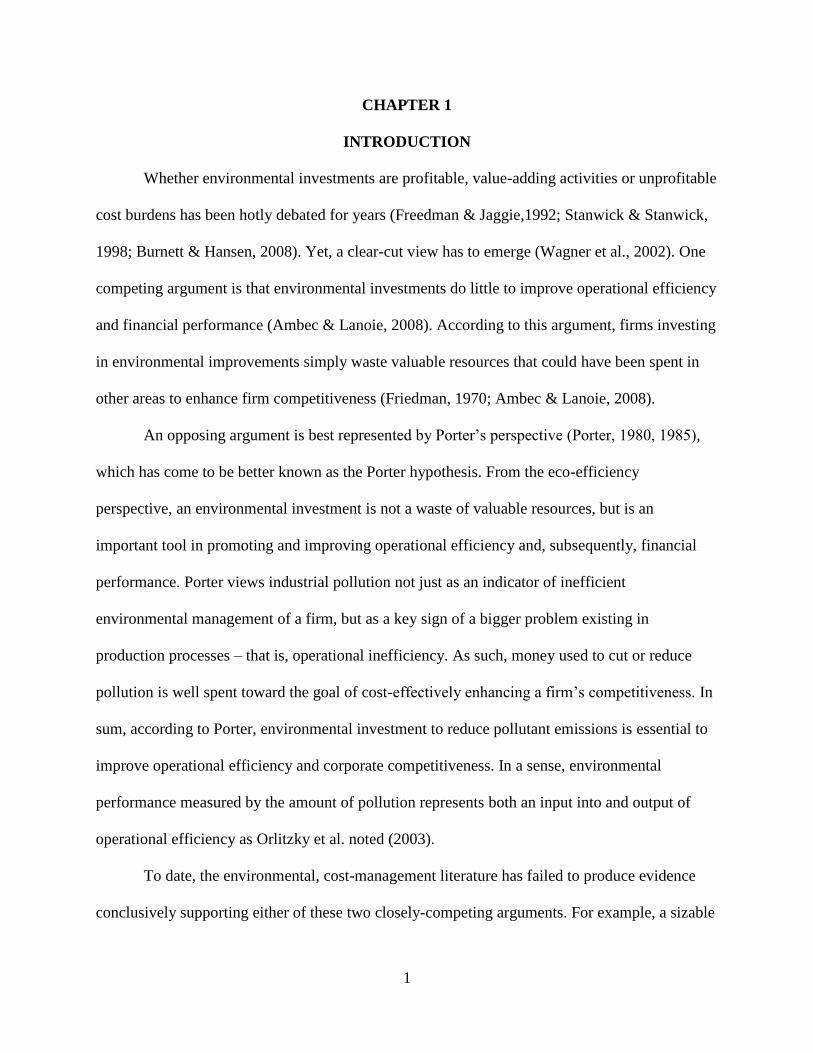
Whether environmental investments are profitable, value-adding activities or unprofitable
cost burdens has been hotly debated for years (Freedman & Jaggie,1992; Stanwick & Stanwick,
1998; Burnett & Hansen, 2008). Yet, a clear-cut view has to emerge (Wagner et al., 2002). One
competing argument is that environmental investments do little to improve operational efficiency
and financial performance (Ambec & Lanoie, 2008). According to this argument, firms investing
in environmental improvements simply waste valuable resources that could have been spent in
other areas to enhance firm competitiveness (Friedman, 1970; Ambec & Lanoie, 2008).
An opposing argument is best represented by Porter’s perspective (Porter, 1980, 1985),
which has come to be better known as the Porter hypothesis. From the eco-efficiency
perspective, an environmental investment is not a waste of valuable resources, but is an
important tool in promoting and improving operational efficiency and, subsequently, financial
performance. Porter views industrial pollution not just as an indicator of inefficient
environmental management of a firm, but as a key sign of a bigger problem existing in
production processes – that is, operational inefficiency. As such, money used to cut or reduce
pollution is well spent toward the goal of cost-effectively enhancing a firm’s competitiveness. In
sum, according to Porter, environmental investment to reduce pollutant emissions is essential to
improve operational efficiency and corporate competitiveness. In a sense, environmental
performance measured by the amount of pollution represents both an input into and output of
operational efficiency as Orlitzky et al. noted (2003).
To date, the environmental, cost-management literature has failed to produce evidence
conclusively supporting either of these two closely-competing arguments. For example, a sizable

2
body of previous work provides evidence that appears to support the beneficial impacts of
environmental investment on firm market value (Konar & Cohen, 1997) and financial
performance (Bragdon & Marlin, 1972; Nehrt, 1996; Hart & Ahuja, 1996; Orlitzky et al., 2003;
Klassen & Mclaughlin, 1996; Jacobs et al., 2010). Other work, meanwhile, presents opposite
results (Konar & Cohen, 2001). Still others (e.g., Jiangning, 2006) find no evidence of either a
positive or negative link between environmental investments and financial performance (i.e.,
return on assets, return on revenue, and operating revenue).
For these conflicting findings, several factors have been discussed. They include
differences in sample size and investigation methods (Salama, 2003; Tang et al., 2012), the use
of outdated data (Konar & Cohen, 2001), and the application of different criteria used to define
environmental and financial performance (Soana, 2011; Dixon-Fowler, 2013).
Worthy of special note is one potential factor, which has been relatively overlooked in
the literature when assessing the environmental-economic link. It is the intangible benefit
accruing from environmental investments, the most notable of which is environmental reputation
(Toms, 2002). As defined by Fombrun (1996), environmental reputation is a perception, on the
part of a firm’s key constituents or shareholders, of the firm’s past environmental initiatives and
future prospects, relative to the firm’s leading rivals.
Hence, Barney (1991) even suggests, in articulating the resource view of the firm theory,
that it is intangible assets (e.g., reputation and employee capacity) rather than tangible assets that
give rise to a long-lasting competitive advantage. This clearly suggests that any attempt to gain a
deeper insight into the beneficial impact of environmental investment on financial performance
would be futile without understanding the potentially positive influence of intangible assets in
the form of environmental reputation.

3
Only two previous studies (Salama, 2003; Tang et al., 2012) have attempted to
investigate the financial impact of environmental reputation. Both, however, had methodological
shortcomings. Salama’s (2003) work had a critical weakness in that it employed an inadequate
proxy to measure environmental reputation. Tang et al. (2012), meanwhile, failed to adequately
control for potential extraneous (confounding) variables in investigating the financial impact of
environmental reputation, which was proxied by Newsweek’s environmental reputation ranking
of the 500 largest publicly-held U.S. companies. Because environmental reputation and financial
performance can also be significantly influenced by other factors, such as firm size and type of
firm (e.g., whether or not a firm’s product requires heavy release of environmental pollutants),
making a comparison without controlling for these extraneous factors and making all else equal,
naturally, is unlikely to produce any meaningful results.
In another environmental reputation research study, Cho et al. (2012) examined the
determinants of environmental reputation using Newsweek’s environmental reputation ranking of
the 500 largest publicly-held U.S. companies. The study, however, also had some
methodological flaws. Specifically, the study used a questionably small sample of 92 firms out of
the 500 companies listed in Newsweek’s green reputation report. Attempting to explain why they
examined only 92 out of the 500 firms, the researchers said that the firms were chosen because
they belonged to ‘environmentally-sensitive industry groups’ (e.g., basic materials, oil and gas,
and utilities). The clearly inadequate sample size limits the generalizability of their research
findings, which is a hallmark of good research.
Finally, past studies to investigate the link between reputation and financial performance
have largely drawn on anecdotal evidence rather than established theories. This type of research,
not grounded on theories while still possibly informative, lacks credibility. For example, both

4
Tang et al. (2012) and Cho et al. (2012) attempted to answer their research questions using
hypotheses not founded on established theories. As Libby et al. (2002) famously argued, it is a
theory that provides internal validity to any relationship between independent and dependent
variables.
This study addresses this limitation by drawing on five well-established theories in
developing its research hypotheses and explaining the results. The theories are costly signaling,
resources-based view of firm, social identity, Porter’s eco-efficiency perspective, and third-
person effect. The above-discussed shortcomings of previous studies – a significant lack of
attention to and a methodologically inadequate examination of environmental reputation – also
motivate this study.
Specifically, this study attempts to answer three research questions. First, what
contributes to environmental reputation? Second, how does environmental reputation impact
operational efficiency? Third, how does environmental reputation enhance financial
performance? Answering these questions will help assess whether and to what extent
environmental reputation makes an impact on a firm’s financial performance, both endogenously
and exogenously.
From a theoretical perspective, the first research question is investigated through the lens
of costly signaling theory (Grafen, 1990; Zahavi, 1975). In a nutshell, costly signaling theory
posits that an entity’s altruistic act signals the entity’s willingness and ability to make a self-
sacrifice for public good (Bird & Smith, 2005; Griskevicius et al., 2007), which are most likely
to engender a favorable perception of the firm and thus enhance the firm’s image. Clearly,
environmental initiatives are likely to be perceived as examples of such altruistic acts, given that

5
such initiatives often are intended to benefit not only the firm itself but also the wider
stakeholders.
The second research question is examined from the perspective of Barney’s (1991)
resources-based view of firm (RBVF), social identity theory (Ellemers et al., 1999), and
Davison’s third-person effect (1983). First, RBVF argues that a firm can maintain its
competitive edge over the long term, using inimitable, intangible assets (e.g., corporate images
and reputation) rather than easily-imitable tangible resources. If environmental reputation, as
suggested by RBVF, is an inimitable, intangible asset, which provides a firm with a sustainable
competitive edge, it is most likely to do so endogenously – that is, via contributing to internally
improving operational efficiency. Importantly, this potential endogenous contribution factor –
increasing operational efficiency – has been overlooked by previous environmental reputation
literature. Indeed, this recognition of environmental reputation as a driver of operational
efficiency may also help support the Porter hypothesis (1985), whose validity researchers have
frequently questioned.
Finally, the third research question relies upon social identity theory (Ellemers et al.,
1999), and Davison’s third-person effect (1983), which, in tandem, suggest that a firm’s
improved environmental reputation is likely to help its employees feel a greater attachment to
and affection for the firm. Also, employees working for a firm with a superior reputation tend to
have greater satisfaction (Dowling, 2001) as well as superior creativity and effort (Jackson,
2004). It is not hard to imagine that employees’ greater affection for their workplace is likely to
lead to higher employee productivity, which will ultimately translate to improved financial
outcomes.
6
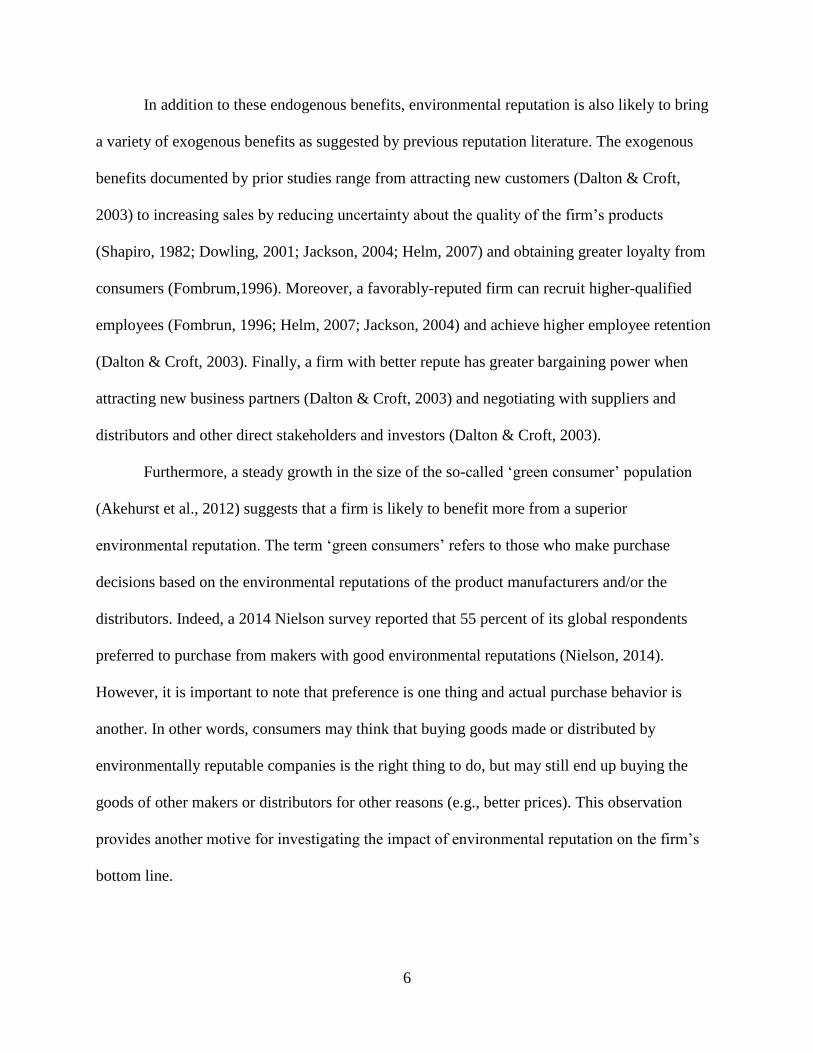
In addition to these endogenous benefits, environmental reputation is also likely to bring
a variety of exogenous benefits as suggested by previous reputation literature. The exogenous
benefits documented by prior studies range from attracting new customers (Dalton & Croft,
2003) to increasing sales by reducing uncertainty about the quality of the firm’s products
(Shapiro, 1982; Dowling, 2001; Jackson, 2004; Helm, 2007) and obtaining greater loyalty from
consumers (Fombrum,1996). Moreover, a favorably-reputed firm can recruit higher-qualified
employees (Fombrun, 1996; Helm, 2007; Jackson, 2004) and achieve higher employee retention
(Dalton & Croft, 2003). Finally, a firm with better repute has greater bargaining power when
attracting new business partners (Dalton & Croft, 2003) and negotiating with suppliers and
distributors and other direct stakeholders and investors (Dalton & Croft, 2003).
Furthermore, a steady growth in the size of the so-called ‘green consumer’ population
(Akehurst et al., 2012) suggests that a firm is likely to benefit more from a superior
environmental reputation. The term ‘green consumers’ refers to those who make purchase
decisions based on the environmental reputations of the product manufacturers and/or the
distributors. Indeed, a 2014 Nielson survey reported that 55 percent of its global respondents
preferred to purchase from makers with good environmental reputations (Nielson, 2014).
However, it is important to note that preference is one thing and actual purchase behavior is
another. In other words, consumers may think that buying goods made or distributed by
environmentally reputable companies is the right thing to do, but may still end up buying the
goods of other makers or distributors for other reasons (e.g., better prices). This observation
provides another motive for investigating the impact of environmental reputation on the firm’s
bottom line.
7
This study makes several significant contributions to the literature. First and most
importantly, this study crafts a unique approach to explain that if environmental reputation
improves financial performance indeed, then such an improvement may occur not only
exogenously but also endogenously. This approach is a drastic break from the previous studies,
which focused only on exogenous benefits or impacts (e.g., greater customer loyalty and
satisfaction, better deals with business partners).
In a nutshell, endogenous impact refers to various changes that environmental reputation
hypothetically brings a firm through interaction with the firm’s internal stakeholders. The
endogenous changes that this study focuses on include higher employee morale, commitment,
consequent employee productivity and overall operational efficiency. Given that operational
efficiency is one of the most important factors for financial performance, the importance of
investigating the endogenous impact of environmental reputation cannot be overemphasized.
Second, this study is, to the best of my knowledge, one of the first major systematic
investigations made, to date, to answer both whether and how environmental reputation affects
financial performance. Only two previous studies (Salama, 2003; Tang et al., 2012) attempted to
examine the relationship between environmental reputation and financial performance. As
discussed earlier, these studies have multiple shortcomings such as using inadequate proxy
mechanisms (Salama, 2003) and a failure to control for extraneous variables or to establish
research hypotheses based on scientific theories (Tang et al., 2012). Clearly, a study done
without solid methodological and theoretical foundations cannot establish reliable and valid
results. This study addresses these issues with increased reliability and validity.
Finally, this study uses a unique, two-step data analysis rather than a traditional one-step
method. The first step is to analyze the full sample. The second step involves splitting the data

8
into two subgroups – a high environment reputation group and a low environment reputation
group. The rationale for this data-splitting is that when it comes to a reputation, the high-
reputation group and the low-reputation group may consist of and require treatment as two
distinct populations, because of likely differences in the way that audiences evaluate a firm’s
rank between the two subsamples. To be more specific, individuals are likely to be more
discerning about the reputation ranks among the members of a high-reputation group, rather than
those of a low-reputation group. In other words, customers and other entities are likely to be
interested in knowing which firm(s) in the high-reputation group are ranked as the first or the
second or the third in environmental reputation, but they may not care at all to learn which firm
in the low-reputation group is ranked at the bottom or the second from the bottom.
This study has a significant implication for industry practitioners and academics.
Specifically, it is important and valuable to learn if environmental reputation indeed affects
financial performance endogenously. If it is found that endogenous impacts really and
significantly exist, then managers of firms with a high environmental reputation will need to pay
more attention to fully informing employees about the firms’ superior environmental reputation,
which, as social identity theory and third-person effect theory predict, will arouse greater
company loyalty and consequently increase employee productivity. For academics, this study
hopefully will spur them to consider expanding the familiar horizon of existing research and look
beyond the exogenous impacts into the endogenous benefits of environmental reputation.
Moreover, for both parties, learning which – environmental management or
environmental performance – contributes more significantly to environmental reputation is
valuable for the following reason: knowledge of the two factors’ relative contribution to
environmental reputation can help industry practitioners to attain such a reputation cost-

9
efficiently. For instance, if environmental management is found to be equally important in
enhancing environmental reputation as environmental performance, managers, ceteris paribus,
will be obliged to focus their resources on improving environmental management rather than
environmental performance. This obligation would result because improving environmental
performance records often requires more significant firm investment and time.
Finally, the rest of this paper is organized as follows. Chapter 2 reviews theoretical
perspectives directly relevant to this study. Chapter 3 develops a research model and a set of
hypotheses that are designed to answer the identified research questions. Chapter 4 describes the
research methodology. Chapter 5 presents the results and analysis. Finally, chapter 6 provides the
conclusions and limitations of the study.
10
CHAPTER 2
LITERATURE REVIEW
2.1 Environmental Performance and Financial Performance
Porter’s (1985) eco-efficiency theory and the concomitantly growing popular
consciousness of the need for a green environment in the face of global climate change have
inspired an ample body of research. As the mixed findings of the consequent studies to date
indicate, however, there is no conclusive empirical evidence either supporting or rejecting the
eco-efficiency perspective that environmental performance (EP) is positively associated with
financial performance (FP).
Although Al-Tuwaijri et al. (2004) observed that early studies generally favor the eco-
efficiency perspective, the more recent empirical investigations at large fail to support the
viewpoint. In one of the early studies, which empirically documented a positive EP-FP link, Hart
and Ahuja (1996) analyzed the environmental data of a sample of 127 S&P 500 firms for the
period of 1988-1989 and found that emissions reduction was positively associated with financial
performance. Notably, the authors reported a time lag between the environmental initiatives (t)
and any significant improvement in financial performance. Specifically, firm performance,
proxied by returns on sales (ROS) and returns on assets (ROA), became significantly stronger
only for the two years (t+1 and t+2) following emission reduction. icant improvement in
financial performance.
Similarly, Stanwick and Stanwick (1998) examined profitability and pollution emission
data of more than 100 firms listed in the Fortune corporate reputation index for the period 1987
through 1992. The results suggest that an inverse relationship exists between pollution emissions
and profitability. This finding supports the notion that environmental performance measured by a
11
decrease in the amount of pollutant discharge can predict financial performance. The authors
obtained a similar result when also controlling for variations in the firm size by using
standardized pollution emissions.
Evidence provided to assess how firms operate in the face of the need to be economically
and operationally efficient has been mixed. Al-Tuwaijri et al. (2004), for example, analyzed the
environmental and business data of 198 S&P companies for the year 1994, and reported that
environmental performance is positively related to financial performance. In obtaining these
results, the authors uniquely controlled for several factors, such as past environmental disclosure
over the preceding three years and public visibility (proxied by the number of Wall Street
Journal news articles about the firm) to bolster the validity of their inquiry.
Burnett and Hansen (2008), meanwhile, presented empirical evidence supporting the eco-
efficiency perspective by comparing two different (lower- vs. higher-polluting) groups of U.S.
power plants and the gains that they achieved in emissions reduction and operational efficiency
for the first five years after the 1990 Clean Air Act went into effect. The authors found that
during this period, the higher polluting plants made a statistically significant increase in
operational efficiency while also significantly reducing emissions during the same period.
More recently, Nakamura (2011) examined environmental data for the year 2006 and
financial performance data for the years 2006 through 2008 of 3,237 Japanese firms, and
reported that environmental investment is positively associated with financial performance.
However, the association emerged one year following the investment (t+1). These findings are
consistent with Hart and Ahuja’s (1996), which suggested that a time lag exists between
environmental performance and financial performance.

12
Finally, Jaggi and Freedman (1992) found a negative link between environmental and
financial performance via an analysis of the pollution and financial data for 13 U.S. pulp and
paper firms for the year 1978. However, Wagner et al. (2002) analyzed the environmental and
financial data of three dozen firms in four European countries – Germany, Italy, Netherlands,
and Britain – during the period 1995-1997 and failed to find any significant association between
environmental and financial performance.
Such discrepancies between the findings of earlier and more recent studies may be
attributable to methodological shortcomings. Indeed, in obtaining the results that failed to
support the eco-efficiency perspective, Jaggi and Freedman (1992) and Wagner et al. (2002) both
used relatively small samples of 13 and 36, respectively. Retrospectively, existing literature
suggests that such spurious results could be attributable to using an inadequate size of sample
(Wagner et al., 2002), outdated data (Konar & Cohen, 1997), a sample biased toward large firms
(Hart & Ahuja, 1996), the use of dubious proxies, particularly for environmental performance
(Cohen et al., 1995), a failure to account for factors, which can affect the relationship between
environmental and financial performance, or a failure to consider the time-lag inherent in the
effect of environmental improvement on economic performance (e.g., al-Tuwaijri et al., 2004).
The above review of the prior work suggests that it still is an elusive, though not
impossible task to convincingly determine if environmental performance benefits financial
performance despite decades of research efforts. The task could clearly be facilitated when
research is guided by well-established theories and carefully-crafted methodologies.
13
2.2 Environmental Reputation
2.2.1 Definition of Environmental Reputation
Even though the term ‘environmental reputation’ has frequently been used in the
environmental literature (e.g., Toms, 2002; Hasseldine et al., 2005; Deak & Hadju, 2012), it has
not yet been explicitly defined, especially in relation to how it creates value. One plausible
explanation for this is that some might feel that there might not be any need to laboriously define
the term because it is self-explanatory – that is, environmental reputation is the reputation of an
organization relative to its environmental performance. Clearly, this definition is too simplistic,
given the complex, diverse, and broad (i.e., not necessarily limited to environmental
performance) nature of factors that could influence environmental reputation.
Hence, this study defines environmental reputation broadly as the perceived image and
representation of an organization that internal organizational members and external stakeholders
hold, regarding how effectively or ineffectively the organization, relative to its peers, has done
on a wide range of environmental issues. The issue of interest is how well or poorly a firm has
protected the environment through emissions reduction, recycled use of materials, adoption of
advanced environmental management standards, and improved operational efficiency proactively
and reactively, and how faithfully and transparently the firm has disclosed its environmental
performance, policies and strategies.
This definition is drawn from the corporate reputation literature. Unlike environmental
reputation, there are several, well-established definitions of reputation (e.g., Fombrun, 1996;
Gardberg & Fombrun, 2002). The most frequently quoted definition is Fombrun’s (1996), which
views reputation as “a perceptual representation of a company’s past actions and future prospects
that describe the firm’s overall appeal to all of its constituents when compared with other leading
14
rivals” (p. 72). The popularity and strength of Fombrun’s (1996) definition may lie with his apt
valuation of the relative (comparative) nature of reputation. The relativity suggests that a
company can earn a positive reputation by either outperforming its peers or doing something
distinct that its peers would or could not do.
Similarly, Gardberg and Fombrun (2002) view reputation as “a collective representation
of a firm’s past actions and results that describes the firm’s ability to deliver valued outcomes to
multiple stakeholders” (p. 304). Some other researchers (e.g., Shenkar & Yuchtman-Yaar, 1997)
tend to equate reputation with image. Reputation here is generally thought to reflect past
performance, whereas an image is thought of as representing the desired perception of the “most
central, enduring and distinctive” (Fombrun, 1996, p. 36) aspect of what an individual or an
organization can be viewed or thought of as, particularly when performance is being evaluated.
Out of these observations, then, a fundamental question arises: Overall, what drives
corporate reputation? The most common drivers identified by prior studies include financial
performance (Sabate & Puente, 2003; Orlitzky et al., 2003; Rhee & Valdez, 2009) and corporate
social responsibility (Worcester, 2009; Gallego-Alvarez et al., 2010). Some researchers (e.g., Sur
& Sirsley, 2013) also suggest that a firm’s reputation can be influenced by the reputation of the
industry within which the firm operates, via a so-called ‘nested effect.’ That is, if a firm is nested
in an industry with a relatively good (or bad) reputation, the firm is likely to also be accorded a
more favorable (or bad) reputation. Given that the focus here is on environmental reputation,
factors most likely to affect how a firm is valued should be related to how well it specifically
handles its interaction with the environment. Two key factors affecting environmental reputation
have been identified to date: environment-related disclosure and environment management.

15
2.2.2 Determinants of Environmental Reputation
2.2.2.1 Disclosure
A handful of prior studies (e.g., Toms, 2002) have empirically documented the positive
impact of environmental disclosures on environmental reputation. As noted in these studies, the
reputation of a firm can be created only when, through media reports or corporate annual reports,
the audience first gets to learn about, and then is able to form a more informed opinion
(perception), favorably and unfavorably, about the firm. When a firm provides only a scanty
amount of information about its environmental performance or even fails to disclose any
environmental information, the audience may not be able to have or formulate any perception of
the firm’s environmental performance. The only other way to get to know a firm is for the
audience to have a first-hand experience with the firm (e.g., a tour of the facility and operation),
which is improbable.
Thus, disclosure is equated with proactive signals present in a communication link
(Brammer & Pavelin, 2006). Clearly, when no signal is sent, there is no communication initiated
and, thus, no perception or opinions are formed for or against anyone or any party. To extend this
analogy, it is only through access to and the use of signals (disclosure) sent by a firm that an
audience gets to know of and form an opinion about the firm, which represents the formation of a
reputation. In short, environmental disclosure is a key antecedent of environmental reputation.
The term ‘environmental disclosure’ used by this research and previous studies also
refers to the act of companies making public their environmental performance, plans and visions
on both a compulsory and voluntary basis in hopes of building a favorable corporate image or
reputation. As defined by Owusu-Ansah (1998), disclosure is “the communication of economic
information, whether financial or nonfinancial, quantitative or otherwise concerning a company’s

16
financial position and performance” (p. 608). Notably, the medium of disclosure investigated by
most research, to date, has been limited to the environment section in the compulsory, annual 10-
K report and a voluntary, separate environmental report or corporate sustainability report.
More recently, Cho et al. (2012) found that environmental disclosure is positively related
to environmental reputation. These findings emerged via an analysis of the relationship between
the Newsweek’s environmental reputation score for 92 U.S. firms in 2009, and the firms'
environmental disclosures in their annual financial reports and corporate social responsibility
reports.
Environmental disclosure can be a powerful strategic tool, particularly for companies
actively pursuing environmental initiatives to enhance reputation, because the initiatives
themselves can be perceived as representing the firms’ sensitivities to popular concerns about
environmental protection. Also, when the targeted audience begins to understand that the
company uses valuable resources to address environmental initiatives, instead of using resources
to promote short-term returns, members of such an audience are likely to feel more favorably
toward the firm (Abbott & Monsen, 1979).
Even for a less environmentally-active company, an environmental disclosure can be a
good reputation builder because the disclosure can be perceived as an acknowledgement of a
firm’s commitment to transparency and social responsibility. For this reason, a primary
motivator for environmental disclosure is a desire to define the reputation of a firm as
environmentally sensitive and accordingly sensitive to stakeholders’ financial and environmental
interests (Belkaoui & Karpik, 1989; Friedman & Miles, 2001; Michelon, 2011).
The positive link between voluntary environmental disclosure and environmental
reputation is supported by the three above-discussed theories – costly signaling theory,
17
legitimacy theory, and stakeholder theory. According to the signaling theory, environmentally
well-performing companies use environmental disclosures as a tool to signal that they are better
than their peers (Campbell et al, 2001). Legitimacy theory and stakeholder theory also suggest
that when a firm, as a responsible component of society, behaves in conformity with the
expectations of society, the society will respond, in kind, by bestowing on the firm a certain level
of legitimacy and respect.
However, there has been a debate about the credibility of environmental disclosures
because credibility critically determines the value of disclosed information. In one of the early
empirical studies investigating the influence of environmental disclosures on environmental
reputation, Toms (2002) reported that environmental disclosures significantly contribute to
environmental reputation, but only to the extent that the disclosed information is perceived to be
credible rather than cheap rhetoric.
Other environmental disclosure literature reported that quantified information can be
more easily verified and thus is more credible, when compared to qualitative disclosures. This
report is consistent with observations made by Teoh and Shiu (1990) who found that institutional
investors paid significant attention to whether or not disclosed information is quantified and
specific.
Similarly, Hasseldine et al. (2005), in an interesting twist, provided empirical evidence
that quantitative and qualitative disclosures were both positively associated with environmental
reputation, but that qualitative disclosures had a much stronger relation with it. The superior
influence of qualitative disclosures relative to quantitative disclosures is based on the widely-
shared belief that a company with a record of superior environmental performance is more likely
to make voluntary, faithful, objectively verifiable (hard) disclosures, whereas an environmentally

18
underperforming company is more inclined to provide a report that includes less specific and
hard-to-verify (soft) information (Clarkson et al., 2008).
2.2.2.2 Environmental Management
The question of whether environmental management benefits environmental reputation
remains an open issue because of the dearth of conclusive empirical evidence that supports such
a relationship. Indeed, to date, there is no substantive research that has attempted to directly
answer this question. However, indirectly, valuable insight relevant to this question may be
gleaned from previous studies (e.g., Fryxell & Szeto, 2002; Matuszak-Flejszman, 2009) that
investigated the motives for adopting and implementing the global, environmental management
standard of ISO 14001. Both studies reported that enhanced corporate reputation is a primary
motive for obtaining the ISO 14001 certification.
Notably, ISO 14001 specifically mentions an improved corporate image as one of the
four potential benefits that are likely to emerge when adopting environmental management. This
ISO statement may be partly substantiated by the fact that, contrary to general expectation, a
majority of ISO 14001-certified companies are in non-manufacturing sectors that produce
relatively little industrial wastes and pollutants. Hence, they do not have to become certified to
and implement the international environmental management standard. Of the nearly 270,000 ISO
14001 certificates as of the end of 2011, 20% or 53,399 were issued to entities in the services
industry (ISO Survey, 2011), which discharges barely any pollutants at all. This statistic may add
weight to the observation that a significant number of companies get the certificates to enhance
corporate image.
In sum, even though there is not yet conclusive evidence of beneficial influence on
environmental reputation of environmental management, it can be surmised from the above

19
discussion that environmental management is likely to positively affect a firm’s environmental
reputation. It should be noted that implementing the ISO 14001represents a key component of
corporate environmental management.
2.2.2.3 Environmental Performance
In a study investigating the link between environmental performance and reputation, Cho
et al. (2012) reported that, contrary to general expectations, the association was moderately
negative. That is, worse-performing firms received higher environmental reputation scores
compared to better-performing firms. The relationship was based on Newsweek’s green
performance score and green reputation score for 92 U.S. firms in 2010.
As for the unexpected result, the authors speculated that it may be attributable to the
mediating effect of environmental disclosure, where firms with lower environmental
performance scores made better disclosures than did firms with higher scores. To some degree,
the speculation, makes sense since reputation is the outcome of the audience's reception of
signals from the sender and disclosures, media publicity and advertisement, are a primary means
of transmitting signals. Without adequate signals, the general public may be left totally
uninformed about how a firm performs environmentally.
Another plausible speculation regarding the negative link between environmental
performance and environmental reputation is that Newsweek’s environmental performance
(impact) score may be biased towards large-size (in terms of revenue) firms which emit
relatively more pollutants. This possible bias arises because the score was normalized by
revenue, and, as a result, firms with large revenue were assessed with relatively low
environmental pollution. Thus, it seems apparent that normalizing by size clouded the genuine

20
relation between environmental performance and environmental reputation. For this reason, this
factor should be accounted for when developing a research model.
2.3 Environmental Reputation and Employee Productivity
Existing corporate reputation and organizational study literature (e.g., Riordan et al.,
1997; Carmeli et al., 2007; Kim et al., 2010; Stuebs & Sun, 2010) implicitly and explicitly posit
that a firm's good reputation breeds favorable feelings among the employees, and that such
affinity creates loyalty within the firm, which will subsequently be translated into improved
employee productivity and financial performance. Thus, it follows that firms with good
environmental reputation also will experience a similar effect.
Such desirable emotions, according to Kim et al. (2010), are activated by what is called
‘perceived external image.’ Perceived external image refers to the employees' perceptions of how
the external world views their firm. Interestingly, perceived external image affects the
employees' attitudes toward their company. That is, when employees feel, correctly or
incorrectly, that their company is regarded highly by people outside the firm, the employees will
also begin to feel proud of and have high esteem for their firm.
Prior research has documented that perceived external image triggers a chain of desirable
psychological states inside the employees, such as organizational identification with the firm
(Carmeli et al., 2007), job satisfaction (Riordan et al., 1997), and commitment and loyalty to the
firm (Kim et al., 2010). In a word, these psychological states are antecedents of employee
productivity (Stuebs & Lin, 2010).
Perceived external image has received much attention from researchers in organizational
studies. For instance, in one of the pioneering studies exploring external perceived image, Dutton
and Dukerich (1991) investigated factors thought to influence the shift – from initial total

21
indifference to later active humanitarian involvement – in the Port Authority of New York and
New Jersey’s attitude towards the hundreds of homeless people at its facilities in the 1980s and
1990s. Providing valuable insight into the then new construct of perceived external image, the
authors documented that the authority’s eventual attitude shift was forced by change in how the
port authority employees perceived general public opinion about the organization's handling of
the homeless.
Initially, the organization dismissed the homeless as an unpleasant distraction and burden
and failed to take any proactive action to fundamentally solve the issue when employees had
little awareness of their organization's external reputation. When the port authority's reputation,
however, began to dip as a result of negative publicity for ignoring the homeless issue, the
employees began to be concerned about the reputation of their organization, and soon, their own
reputation. In brief, the employees identified their organization’s reputation with their own.
Offering empirical support for Dutton and Dukerich's (1991) perceived external image
perspective, Riordan et al. (1997) documented an investigation of 174 employees of a small U.S.
utility company and found that the employees' perceived external image of their firm was
positively associated with their job satisfaction and turnover intention. It is, however, unclear
whether the researchers controlled for other, and potentially more powerful antecedents of job
satisfaction, such as pay and the types of work.
In a more recent attempt to provide empirical backing for Dutton and Dukerich's (1991)
perceived external image concept, Carmeli et al (2007) found that perceived social responsibility
was positively linked to organizational identification and job performance. The results of the
authors' investigation of 161 employees of four Israeli electronics and media firms show that
employees with high perceived external image of the firm's social responsibility displayed high

22
organizational identification, which is defined by Dutton et al. (1994) as a cognitive connection
between the organization and its employees.
Meanwhile, Kim et al. (2010) reported that corporate participation in socially responsible
initiatives has a positive relationship with perceived external image, which, in turn, influences
how employees feel identified with the firm and subsequently how strongly they are committed
to the success of the firm. Given that environmental initiatives represent an important part of
social responsibility, the authors' findings provide support for this study's proposition that
environmental reputation positively influences employee productivity.
Prior studies on perceived external image commonly use social identity theory as their
theoretical foundation. According to this theory, individuals tend to feel like they belong to a
social group and are inclined to behave in the best interest of that group to the extent that they
identify with the group (Ellemers et al., 1999). What this theoretical position suggests is that
when individuals identify with an organization, they feel committed or even loyal to it, and
naturally care for its well-being.
Most interestingly, social identity theory also suggests that individuals tend to feel a
stronger identification with a social group when they perceive their group has a more favorable
reputation or image than its peers (Abrams, 1992; Ashforth & Mael, 1989). Such a tendency may
reflect human beings’ inherent desire to be linked to a socially reputable group rather than a
socially disreputable group. In brief, human beings, as social beings, have a natural desire,
conscious and subconscious, to belong to a social group or an organization with which they can
identify; they use that identification to define themselves and to demonstrate their social status or
value. This may explain why people prefer to work for an organization with a good social
reputation.
23
Lastly, the premise of perceived external image can gain valuable traction from a classic
communication theory called the "third-person effect.” According to Davison (1983), individuals
tend to believe that mass communicated messages impact others more than themselves. In other
words, audiences tend to overestimate the impact of media messages on others, while
underestimating their own resulting impressions.
To illustrate the third-person effect, suppose that there is a media report that a company
won an award or a public acknowledgement for outstanding environmental performance.
According to the third-person effect theory, the employees of the firm are likely to believe that
the media report will help improve the company's image even better than they alone perceive.
This overestimation of the outsiders' likely reaction will subsequently influence the company
employees' perceived external image.
This perspective on the third-person effect on perceived external image has very
important practical and theoretical significance. Practically, managers can enhance employees'
perceived external image by publicizing the firm's environmental initiatives through paid
advertisements, news media coverage, and even the company's annual environmental reports.
The third-person effect perspective suggests that employees are likely to have a higher perceived
external image just by knowing that outsiders will get to know about the firm's superior
environmental endeavors.1 Some authors (e.g., Gunther & Mundy, 1993) argue that the third-
person effect only arises when the media message is negative. Other previous research (e.g.,
Paul et al., 2000), however, documented that the content of a message – that is, if a message is
socially desirable – is not a significant moderator of third-person effect.
1 This study expects Newsweek’s 2010 environmental reputation scores for the 500 largest U.S. companies to have a
similar third-person effect, given the high publicity of the scores. The scores are posted in Newsweek’s web page,
but also are publicized mostly by the companies, which are ranked highly.

24
Theoretically, the third-person effect may also help explain why the past research
endeavors to find a relationship between environmental investments and financial performance
was so mixed. The theory may also provide a new reason for why future research needs to
investigate how environmental activities affect environmental reputation and how environmental
reputation influences the employee's perceived external image. This observation may also be
augmented by prior research (Toms, 2002; Hasseldine et al., 2005) that empirically documented
that environmental disclosures are positively associated with environmental reputation.
2.4 Environmental Reputation and Financial Performance
Though environmental reputation (ER) has great potential to benefit financial
performance (FP) as implied by the resources-based view of firm (RBVF) and corporate
reputation literature, how exactly ER affects FP or how they are associated with each other has
received little research attention. One probable explanation for why such little attention has
been paid to this issue is an assumption that ER is nothing more than a part of overall corporate
reputation, whose impact on financial performance has already been extensively explored, and,
thus, investigating the ER-FP link is little more than a superfluous and meaningless effort.
If such a belief indeed exists, it can be viewed as hasty, considering the fast-growing
public consciousness of corporate environmental performance and reputation. Given that there
are some undeniable similarities between corporate reputation and environmental reputation, an
overview of the corporate reputation-financial performance link may provide valuable insight
into whether and how environmental reputation may benefit a firm’s bottom line.
Several studies (e.g., Roberts & Dowling, 2002) provide empirical evidence that corporate
reputation is an important potential driver of corporate profit and even sustained competitive
edge, an observation that is consistent with RBVF. For example, after analyzing the financial
25
performance of Fortune’s Most Admired American Companies during the period of 1984
through 1998, Roberts and Dowling (2002) reported that superior corporate reputation is
positively linked to sustained and superior financial performance. Also, Vergin and Qoronfleh
(1998) found that the companies ranked high in Fortune’s Most Admired American Companies
reported higher stock returns compared to the lower-ranked companies. Similarly, Brammer et
al. (2009) observed that corporate reputation is linked to abnormal stock returns.
Interestingly, Liu et al. (2011) found that reputation is linked to financial performance as
a mediator between socially-responsible firm activities and financial performance. The authors
obtained the results from analyzing environmental and financial data of an unspecified number
of U.S. firms listed in Fortune’s Most Admired Companies during the period 2006-2008.
Besides the above studies investigating the direct link between EP and FP, there also is a
sizable body of literature, which documented the indirect impact of good reputation on FP. For
instance, favorable corporate reputation helps attract new customers (Dalton & Croft, 2003),
increases employee satisfaction, loyalty (Fombrun, 1996; Lee et al., 2011) and retention (Dalton
& Croft, 2003), and boosts employee creativity (Jackson, 2004). Also, because of favorable
reputation, firms can raise capital at a better term (Beatty & Ritter, 1986), sell products at a
premium price (Klein & Leffler, 1981; Milgrom & Roherts, 1986b), better attract new investors
and business partners (Milgrom & Roberts, 1986a; Dalton & Croft, 2003), and recover quicker
from economic and financial upheavals (Rhee & Valdez, 2009).
More direct evidence that good reputation can lead to higher sales and better financial
performance is provided by the findings of some past surveys. For instance, a poll in 1989 by
Market and Opinion Research International found that 42 percent of consumers choose products
on the basis of the product makers’ environmental performance, up from 19 per cent in the

26
previous year (Elkington, 1989 as cited in Schlegelmilch et al., 1996). Also, a 2014 Nielson
survey reported that 55 percent of its respondents prefer to purchase from makers with a good
environmental reputation (Nielson, 2014). In a similar vein, according to a recent survey by the
OECD of more than 4,000 facilities in seven countries, 43% of those polled replied that they
evaluate their suppliers’ environmental performance when making purchase decisions (Johnstone
et al., 2007).
On the other hand, some early studies (e.g., Brown & Perry, 1994) reported that corporate
reputation is significantly influenced by prior financial performance in what is called ‘a halo
effect.’ But later studies (e.g., Roberts & Dowling, 2002; Toms, 2002; Sur & Sirsly, 2013) failed
to support a halo effect in the reputation-financial performance context. Using data from U.S.
companies listed in Fortune’s most admired corporations, Brown and Perry (1994) found that
prior-period financial performance accounted for only 15% of the variance in reputation
measure. A very similar finding came from Sur and Sirsly (2013) who documented that financial
performance in the prior periods explained just 19% of total reputational variation. Meanwhile,
Toms (2002) rejected the existence of the halo effect of financial performance on reputation after
analyzing financial data of a sample of 126 companies from the Britain’s Most Admired
Companies for 1996 and 1997.
It is important to note that a good reputation is unlikely to uniformly and equally benefit
firms across industries. For instance, firms in such non-manufacturing industries as service
industries are positioned to benefit more from a good reputation than firms in a manufacturing
industry for the following reason. Generally, the products of service industries are less tangible
and thus harder to evaluate in terms of quality, and, thus, consumers are likely to rely more on
27
the reputation of the service provider, compared to firms in manufacturing industries (Fombrun,
1996; Kim & Choi, 2003).
Most importantly, environmental reputation can benefit financial performance
endogenously and exogenously. Endogenously, a firm’s good environmental reputation will help
strengthen the employees’ identification with company (Carmeli & Waldman, 2007; Kim et al.,
2010), boost their morale and loyalty (SHRM, 2011), and recruit and retain good employees
(CEOs watch 2003) as suggested by the social identity theory (Tajfel, 1982). The theory suggests
that employees tend to have strong affective commitment or loyalty to the company when they
feel high perceived external prestige. According to the Corporate Reputation Watch conducted
by ORC International and published by Brand Strategy (CEOs watch, 2003), 71% of the CEOs
surveyed replied that recruiting and retaining employees are the most important benefits obtained
from their corporate social responsibility programs and good corporate images.
According to a poll in 2010 of SHRM, a global organization representing 250,000
members in more than 140 countries, 55 percent of the respondents viewed improved employee
morale as a major benefit from sustainability initiatives where environmental reputation is a core
consideration, and 38 percent saw increased employee loyalty as an important return from the
initiatives (SHRM, 2011). Naturally, such improved employee loyalty will then lead to stronger
job commitment (Kim et al., 2010) and improved job performance (Carmeli & Waldman, 2007).
Exogenously, a firm with good environmental reputation can win the heart of the fast-
growing ‘green consumers’ niche, which refers to the consumers with a high level of awareness
of environmental protection’s importance. This will inevitably lead to increased revenue and
better financial performance. There are already plenty of empirical studies documenting that
some consumers are so much aware of green (healthy) environment that they are even willing to
28
pay a premium to go green (D’Souza, 2004; Lee, 2008, 2009; Rahbar & Wahid, 2011; Cherian &
Jacob, 2012; Akehurst et al., 2012).
2.5 Resources-Based View of Firms (RBVF)
The resource-based view of firms (previously denoted as RBVF) provides a key
theoretical foundation for the argument that firms with a good environmental reputation are
likely to gain a lasting competitive edge over their rivals (1) endogenously through higher
employee productivity resulting from higher employee morale and loyalty and (2) exogenously
through increased sales to fast-growing green consumers. The original RBVF theorist Barney
(1991) contends that a firm is a bundle of resources, tangible and intangible, and the firm gains
competitive advantage when the resources are inimitable and hard to substitute. In this vein, one
can view environmental reputation as one of the inimitable, intangible resources, which enable a
firm to attain a sustainable, competitive edge over its peers.
Whereas the legitimacy theory and the stakeholder theory provide a compelling moral
rationale for corporate environmental initiatives, RBVF suggests a practical necessity for taking
such initiatives, viewing good environmental reputation as a real, essential corporate asset.
Specifically, RBVF asserts that it is intangible, rather than tangible, resources like reputation,
which help a firm to enjoy a long-lasting competitive edge over its rivals.
It is important to note that not anything that a firm has can become a resource. A resource,
according to Barney (1991), should uniquely be capable of helping a firm to “exploit
opportunities or neutralize threats” (106) in the firm’s environment and consequently achieve
sustainable competitive advantage. Hence, a resource must have three key attributes – namely,
rarity, inimitability, and unsubstitutability (Penrose, 1959; Barney, 1991) for the following
specific reason. If a resource lacks any of the three attributes, anyone can get the same resource

29
or an equivalent quality of resource through purchase, imitation, or duplication. When a large
number of firms have access to the same resource, the resource can no longer give any of the
firms any, let alone any lasting, competitive edge.
Resources, in the view of Barney (1991), can become the only things that a firm can
leverage to create superior value and to outperform its competitors. According to Barney, there
are three types of potential corporate resources – physical capital resources, human capital
resources, and organizational capital resources. Physical capital resources include not only a
firm’s plant and equipment, and physical technology, but also its geologically advantageous
location in terms of consumer markets and access to raw material.
For a firm seeking a sustainable, competitive edge, the other two categories of capital –
human capital and organizational capital – can be much more important than physical capital
because they inherently are much harder to imitate or replace. Human capital resources,
according to Barney (1991), include all distinct attributes and resources that a firm’s managers
and workers have – to name a few, experience, expertise, judgment and decision-making, insight,
and formal and informal relationships among colleagues and with external business partners.
Meanwhile, organizational capital mostly concerns a firm’s management control system (MCS),
which covers corporate reporting, planning, controlling, and coordinating within the firm and
with external business partners.
RBVF has withstood inquiry (e.g., Peteraf, 1993; Ray et al., 2004; Jang, 2013), becoming
now one of the most influential perspectives in the field of strategic management. For instance,
Ray et al. (2004) tested RBVF with data from 104 North American life and health insurance
firms and found that superior customer service performance was positively associated with

30
socially complex capabilities – that is, such resources as service climate and managerial IT
knowledge appear to be socially and economically advancing resources.
More recently, Crook et al. (2008) meta-analyzed 125 studies and found evidence
supporting RBVF. The evidence showed that resources meeting Barney’s (1991) resource
criteria – rarity, inimitability, and unsubstitutability – have stronger positive impacts on
organizational performance compared to resources not meeting the same criteria. Similarly, Tuan
and Mai (2012) conducted a multivariate analysis of survey responses from 102 Vietnamese
companies in Vietnamese service industries, and found, as predicted by RBVF, that firms’
unique organizational capabilities contributed to their competitive advantage and consequently
financial performance.
Even though RBVF has garnered respectable empirical support thus far, some researchers
(e.g., Godfrey & Hill, 1995; Spender & Grant, 1996) contend that the perspective has a critical
issue that needs to be addressed. According to Spender and Grant (1996), the issue is that “the
variables which are most theoretically interesting are those which are least identifiable and
measurable” (p. 8). Indeed, the most interesting variables in the RBVF perspective are highly
intangible and invisible constructs that are hard for the researchers to even identify, let alone
measure with reasonable accuracy. Thus, the remaining challenge for RBVF-based research is to
find metrics for identifying and measuring highly intangible and invisible elements.

31
CHAPTER 3
RESEARCH MODEL AND HYPOTHESES
Based on the theoretical reviews and analysis of prior research discussed in the preceding
chapter, this study proposes the research model depicted in Figure 1 below. In a nutshell, the
model posits two key propositions: (1) environmental reputation is a function of environmental
management and environmental performance; and (2) financial performance is a function of
environmental reputation and employee productivity.
Figure 1. Research model to investigate determinants and impact of environmental reputation.
Financial
Performance(ROA)
Environmental Performance (EP)
Employee
Productivity(PR)
Environmental
Reputation (ER)
Environmental Management (EM)
H1
H2
H3
H4
H5
32
The first proposition has its theoretical underpinning in the costly signaling theory
(Grafen, 1990; Zahavi, 1975). The theory suggests that any altruistic act by either an individual
or an entity will signal the sender’s willingness to self-sacrifice for the general public good,
which will engender a favorable image of the sender (Bird & Smith, 2005; Griskevicius et al.,
2007).
Given that corporate environmental initiatives generally are meant to serve not only the
interests of the firm but also the well-being of general public, it is not hard to imagine that such
initiatives are likely to be accepted as altruistic behavior. It is all the more so, considering that
environmental initiatives often require sizable investments where a short-run return is uncertain.
Hence, when examined from the perspective of the costly signaling theory, a likely primary
objective of environmental investments is to generate favorable public image.
Beneficial impacts on a firm’s reputation of environmental initiatives are also supported
by the corporate social responsibility literature (e.g., McQuite et al., 1988). This literature
suggests that social responsibility is closely related to a firm’s environmental reputation. Social
responsibility is defined by Prieto et al. (2014) as any activity “going beyond legal obligations
and their own interests to address and manage the impact their activities have on society and the
environment” (p. 55). Clearly, voluntary environmental initiatives fit this definition of social
responsibility.
Environmental initiatives and related voluntary disclosure are the core of environmental
management, which is likely to enhance a firm’s environmental reputation as suggested by the
above-discussed theories and prior research. Also, as discussed in the preceding section,
environmental reputation can be influenced by environmental performance.

33
Hence, this study proposes the following hypotheses:
H1: Environmental performance positively predicts environmental reputation.
H2: Environmental management positively predicts environmental reputation.
Hypotheses 1 and 2 are tested using the following ordinary least squares model (predicted signs
appear in parentheses):
ENV_REP = β0 + Β1 ENV_PERF + Β2 ENV_MGMT + Β3 HI_POL + Β4 SIZE +
Β5 HIGH_TECH + Β6 FORTUNE + Ԑ
where:
ENV_REP = Environmental reputation, which is proxied for by Newsweek’s 2010
environmental reputation score.
ENV_PERF (+) = Environmental performance, which is proxied for by Newsweek’s 2010
environmental impact score.
ENV_MGMT (+) = Environmental management, which is proxied for by Newsweek’s 2010
environmental management score.
HI_POL (+/-) = Dichotomous variable equal to 1 if a firm belongs to an industry, which
releases relatively high amount of pollutants and 0 otherwise.
SIZE (+/-) = Log of total equity as of 2010.
HI_TECH (+/-) = Dichotomous variable equal to 1 if a firm belongs to a high-technology
industry.
FORTUNE(+/-) = Dichotomous variable equal to 1 if a firm is included in Fortune’s 2010
list of America’s Most Admired Companies in 2010.
Although the exogenous impacts of a good environmental reputation can clearly
contribute to a firm’s financial success, endogenous impacts are likely to be equally important
factors for a firm’s long-term financial success. Within the context of this study, an endogenous
impact refers to an employee’s favorable motivational changes that are inspired by the firm’s
good environmental reputation.
As previous studies (e.g., Carmeli et al., 2007; Kim et al., 2010) found and the social
identity theory (Ellemers et al., 1999) suggests, employees of a firm with good reputation tend to
feel a greater perceived external image, stronger identification with the firm and, consequently,

34
stronger commitment to the firm. This emotional chain reaction is likely to lead to increased
operational efficiency and employee productivity.
A beneficial endogenous impact of environmental reputation can also be supported by
Davison’s theory of third-person effect (1983). To recap, the theory suggests that
superior/inferior environmental reputation can even further increase/decrease employees’
affection for their workplace, which can impact employee productivity and overall operational
efficiency. More importantly, such an endogenous factor is hard for competitors to uncover and
is even harder to imitate in a short time. As such, a firm with superior environmental reputation
is expected to enjoy superior employee productivity.
Based on the above discussion, the following hypothesis is formulated:
H3: Environmental reputation positively predicts employee productivity.
Hypothesis 3 is tested, using the following ordinary least squares model (predicted signs appear
in parentheses):
EMP_PROD = β0 + Β1 ENV_REP + Β2 ENV_PERF + Β3 ENV_MGMT + Β4 HI_POL
+ Β5 SIZE + Β6 HIGH_TECH + Β7 FORTUNE + Ԑ
where:
EMP_PROD = Employee productivity, which is measured by the logarithm of revenue
divided by the number of employees for 2011.
ENV_REP = Environmental reputation, which is proxied for by Newsweek’s 2010
environmental reputation score.
ENV_PERF (+) = Environmental performance, which is proxied for by Newsweek’s 2010
environmental impact score.
ENV_MGMT (+) = Environmental management, which is proxied for by Newsweek’s 2010
environmental management score.
HI_POL (+/-) = Dichotomous variable equal to 1 if a firm belongs to an industry, which
releases relatively high amount of pollutants and 0 otherwise.
SIZE (+/-) = Log of total equity as of 2010.
HI_TECH (+/-) = Dichotomous variable equal to 1 if a firm belongs to a high-technology
industry.
FORTUNE(+/-) = Dichotomous variable equal to 1 if a firm is included in Fortune’s 2010
list of America’s Most Admired Companies in 2010.

35
As defined by SFAC No. 6 (p. 6), given that assets are “probable future economic
benefits obtained or controlled by a particular entity as a result of past transactions or events,”
environmental reputation should also bring some specific benefits to the firm. Previous studies
(e.g., Barney, 1991; Roberts & Dowling, 2002) consistently viewed corporate reputation as an
important intangible asset, which can give a firm a sustainable competitive edge.
Specifically, environmental reputation can impact financial performance in two different
ways – exogenously and endogenously. Exogenously, good environmental reputation is expected
to directly help a firm to improve its bottom line. For instance, consumers prefer to buy from
firms with good green reputation, even at a premium price (Klein & Leffler, 1981; Milgrom &
Roherts,1986b; Johnstone et al., 2007). Also, by cultivating a good reputation, firms can also
attract better capital, investors and business partners (Beatty & Ritter, 1986; Milgrom & Roberts,
1986a; Dalton & Croft, 2003). Clearly, a lower cost of capital will result in a lower cost of
products and higher profitability. Hence, potential investors naturally are likely to prefer to
invest in firms with good environmental reputation.
Based on the above discussion, the following hypothesis is established:
H4: Environmental reputation positively predicts financial performance.
Hypothesis 4 is tested using the following ordinary least squares model (predicted signs appear
in parentheses):
FIN_PERF = β0 + Β1 EMP_PROD + Β2 ENV_REP + Β3 ENV_PERF
+ Β4 ENV_MGMT + Β5 HI_POL + Β6 SIZE + Β7 HIGH_TECH
+ Β8 FORTUNE + Ԑ
where:
FIN_PERF = Financial performance, which is measured by the return on assets (ROA)
of a firm for 2011.
EMP_PROD = Employee productivity, which is measured by the logarithm of revenue
divided by the number of employees for 2011.

36
ENV_REP = Environmental reputation, which is proxied for by Newsweek’s 2010
environmental reputation score.
ENV_PERF (+) = Environmental performance, which is proxied for by Newsweek’s 2010
environmental impact score.
ENV_MGMT (+) = Environmental management, which is proxied for by Newsweek’s 2010
environmental management score.
HI_POL (+/-) = Dichotomous variable equal to 1 if a firm belongs to an industry, which
releases relatively high amount of pollutants and 0 otherwise.
SIZE (+/-) = Log of total equity as of 2010.
HI_TECH (+/-) = Dichotomous variable equal to 1 if a firm belongs to a high-technology
industry.
FORTUNE(+/-) = Dichotomous variable equal to 1 if a firm is included in Fortune’s 2010
list of America’s Most Admired Companies in 2010.
Given that employee productivity (an endogenous component) has been defined by
Samuelson and Nordhaus (1989) as “total output divided by labor inputs” (p. 980) and has been
generally measured by sales per employee (SEP) or the logarithm of SEP (e.g., Huselid, 1995;
Chen, 2001; Suarez-Gonzalez, 2001; Yu & Park, 2006), any increase in employee productivity
should have a positive and direct impact on the firm’s financial performance. In addition,
previous studies (e.g., Cosmetatos & Eilon, 1983) pointed out labor productivity as a key factor
for improving industrial performance and profitability.
Based on the above discussion, the following hypothesis is formulated:
H5: Employee productivity positively predicts financial performance.
Hypothesis 5 is tested using the following ordinary least squares model (predicted signs appear
in parentheses):
FIN_PERF = β0 + Β1 EMP_PROD + Β2 ENV_REP + Β3 ENV_PERF
+ Β4 ENV_MGMT + Β5 HI_POL + Β6 SIZE + Β7 HIGH_TECH
+ Β8 FORTUNE + Ԑ

37
where:
FIN_PERF = Financial performance, which is measured by the return on assets (ROA)
of a firm for 2011.
EMP_PROD = Employee productivity, which is measured by the logarithm of revenue
divided by the number of employees for 2011.
ENV_REP = Environmental reputation, which is proxied for by Newsweek’s 2010
environmental reputation score.
ENV_PERF (+) = Environmental performance, which is proxied for by Newsweek’s 2010
environmental impact score.
ENV_MGMT (+) = Environmental management, which is proxied for by Newsweek’s 2010
environmental management score.
HI_POL (+/-) = Dichotomous variable equal to 1 if a firm belongs to an industry, which
releases relatively high amount of pollutants and 0 otherwise.
SIZE (+/-) = Log of total equity as of 2010.
HI_TECH (+/-) = Dichotomous variable equal to 1 if a firm belongs to a high-technology
industry.
FORTUNE(+/-) = Dichotomous variable equal to 1 if a firm is included in Fortune’s 2010
list of America’s Most Admired Companies in 2010.

38
CHAPTER 4
RESEARCH METHODOLY
4.1 Research Questions
This study is designed to answer the following research questions:
Research Question 1: Do environmental management and environmental performance positively
influence environmental reputation?
Research Question 2: Does environmental reputation positively impact employee productivity?
Research Question 3: Does environmental reputation positively affect financial performance?
Research Question 4: Does employee productivity benefit financial performance?
The research questions will be addressed by testing the following research hypotheses:
Hypothesis 1: Environmental reputation will be positively predicted by environmental
management.
Hypothesis 2: Environmental reputation will be positively influenced by environmental
performance.
Hypothesis 3: Environmental reputation will positively impact employee productivity.
Hypothesis 4: Environmental reputation will positively influence financial performance.
Hypothesis 5: Employee productivity will positively affect financial performance.
4.2 Sampling
The sample of this study is drawn from the list of the 500 largest U.S. publicly-traded
companies (in terms of revenue, market capitalization, and number of employees) reported in the
Newsweek’s green ranking for the year 2010 (Newsweek, 2010). Drawing from this pool is
suitable for this study for the following three reasons. First, large firms generally are more active
in environmental investments and more attentive to environmental reputation compared to
39
smaller firms (Gray et al., 2001) because of their larger resources (Elsayed, 2006), greater
visibility (Henriques & Sadorsky, 1996), and a desire to stay ahead relative to environmental
reputation. This tendency to be ‘environmentally active’ among large firms is expected to
facilitate our hypothesis testing.
Second, all of these firms are publicly traded. Generally, publicly-traded companies are
much more likely to have reliable and easily accessible financial and business data (e.g.,
employee numbers) that are publicly available not only through their compulsory 10-K reports to
the SEC and their voluntary environmental reports, but also through commercial databases (e.g.,
Mergent, 2016).
Of the initial sample of the 500 U.S. publicly-traded companies listed in the Newsweek
green ranking for the year 2010 (Newsweek, 2010), 229 companies had to be eliminated because
of the unavailability of complete and reliable data, closure, and going private. As a result, the
final sample is 271 firms.
4.3 Data Collection
The data for this study was collected from two sources. First, environmental data was
drawn from the 2010 Newsweek green rankings data, which included individual firm scores in
environmental policies, environmental performance, and environmental reputation. 2 Second,
financial and control variable data was gathered from Mergent, a commercial online database.
In tabulating the 2010 Green rankings, Newsweek collaborated with (1) MSCI ESG
Research, a leading environmental research organization (2) Truscot, a firm that specializes in
quantitatively assessing corporate environmental performance and (3) Corporate Register, the
2 These scores have been used by previous studies (e.g., Cho et al., 2012) as proxies for corporate environmental
performance and activities.
40
world’s largest online directory of social responsibility reporting, sustainability, and
environmental reports.
4.4 Variables and Measurement
4.4.1. Independent and Dependent Variables
4.4.1.1 Environmental Management
Environmental management is proxied for by Newsweek’s 2010 green policies score.
This score assesses the quality of each company’s environmental reporting, policies, programs,
and initiatives. Firms are ranked on a scale of 100 (highest) to l (lowest).
4.4.1.2 Environmental Performance
Environmental performance is measured using Newsweek’s 2010 environmental impact
score. This score indicates how well a firm performed in reducing negative externalities.
Notably, while other measures assess the environmental performance of firms in only relatively
heavy-polluting industries, the Newsweek score provides measures across all industrial sectors.
Firms are ranked on a scale of 100 (highest) to l (lowest).
4.4.1.3 Environmental Reputation
The Environmental Reputation Score (ERS) is measured by Newsweek’s 2010
environmental reputation survey score. The Newsweek ERS is based on an opinion survey of
thousands of environmental experts, and industry professionals as well as CEOs and other high-
ranking officials from some of the top U.S. companies. The survey respondents were selected
based on their specific professional knowledge in three key green areas – environmental
performance, commitment and communications (disclosure). Firms are ranked on a scale of 100
(highest) to l (lowest).
41
4.4.1.4 Employee Productivity
Borrowing from previous studies (e.g., Huselid, 1995; Chen, 2001; Suarez-Gonzalez,
2001; Yu & Park, 2006), this study measures by per-employee sales (total revenue divided by the
number of employees). Data that reflects total revenue and the employee numbers were collected
from the 2011 Mergent database. While the per-employee sales may not be a perfect measure of
employee productivity, it can be a relatively fair estimation of labor productivity. The rationale is
that sales can be equated to output, given that a company is most likely to produce only as much
as it can sell in order to avoid an excessive level of inventory. In the short term, production may
not match the ability of a company to sell the products. However, a company’s production over a
longer term should be close to the company’s sales. Therefore, it is reasonable to argue that per-
employee sales can serve as a fairly reliable proxy for labor productivity.
4.4.1.5 Financial Performance
Financial performance is measured by return on assets (ROA), a choice supported by
previous studies (e.g., Cochran & Wood, 1984; Al-Tuwaijri et al., 2004; Ellinger et al., 2002).
The data to compute ROA (total assets divided by net profit) was obtained from the Mergent
database. Previous studies found evidence that accounting returns such as ROA are most likely
to proxy for financial performance (Cochran & Wood, 1984), and ROA is an appropriate
measure to evaluate a firm’s financial performance over time when comparing firm performance
with peers in the same industry (Ellinger et al., 2002).
4.4.2. Control Variables
This study used the following four control variables – (1) high-low polluting firms (2)
high-low tech firms (3) firm size, and (4) corporate reputation. The sampled firms were classified

42
in the above four categories based on quantitative data and qualitative information from the
Mergent database.
4.4.2.1 High-Low Pollution and High-Low Technology
Controlling for whether a firm is high polluting vs. low polluting is important because a
high polluting firm is likely to be subject to stricter public scrutiny. Such tighter scrutiny will
ultimately induce firms to cut pollution, which inevitably helps the firm to improve its image and
reputation.
Meanwhile, high-tech firms often are equated with low-polluting firms as they generally
use less natural resources and discharge less pollutants, compared to low-tech firms. Also
compared to low-tech firms, high-tech firms, such as auto and semi-conductor firms, often have
highly-automated production systems, and, consequently, higher labor productivity.
For the reasons discussed above, it is critical for this study to control whether a firm
belongs to a high or low polluting category or a high or low tech category.
4.4.2.2 Firm Size
Firm size is measured by the logarithm of total equity for 2010. Firm size needs to be
controlled because, as prior research (e,g,, Fombrun & Shanley, 1990; Deephouse, 1996)
reported, size influences reputation in one way or another. For example, according to Fombrun
and Shanley (1990), larger firms naturally attract greater public attention and thus, tighter public
scrutiny (Fombrun & Shanley, 1990). Once placed under a tighter public watch, a company will
feel greater pressure to engage in any activity that could displease the public. Negligence in
environmental protection is one of the activities.
At the same time, larger firms can be viewed in a more favorable light because of their
generally lower systematic risk and higher financial performance (Fombrun & Shanley, 1990)

43
and greater availability of corporate information (Tversky & Kahneman, 1974). Also, larger
companies are expected to attain higher labor productivity compared to smaller-size ones,
because they generally have superior financial capability to invest in production automation.
4.4.2.3 Corporate Reputation
As suggested by previous studies (e.g., Cho et al., 2012; Tang et al., 2012), corporate
reputation clearly is linked to environmental reputation particularly via the halo effect. In this
study, corporate reputation is proxied by whether a firm is included in the Fortune’s list of
America’s Most Admired Companies in 2010.
4.5 Data Analysis
Uniquely, this study conducted its statistical analyses in two stages. First, for each
hypothesis, a regression analysis is conducted for the entire sample (i.e., the entire 271 firms).
Second, another test is applied for the same data after dividing it into two groups based on
environmental reputation score – namely, high-reputation firms and low-reputation firms. High-
reputation firms refer to the firms whose environmental reputation score is above the average of
the entire sample. Meanwhile, low-reputation firms are the ones whose environmental reputation
score is below the average. 3
The key rationale for the two-stage analysis is that the traditional, one-stage (applied only
for the entire data) analysis may not capture a likely systematic difference between the high-
reputation and low-reputation firms in terms of how the predictor variable (particularly,
environmental reputation) impacts the dependent variables. The two-stage analysis was adopted
based on the following specific observations.
3 High-reputation firms are those whose environmental reputation scores exceed the average of the entire sample
(49.28). Meanwhile, low-reputation firms are those whose ER scores fall below that same number.

44
As indicated in a recent survey, it is probable that external stakeholders of a firm,
particularly current and prospective consumers, may not be discerning the reputation scores or
the ranks of low environmental reputation firms because they are likely to see these firms as a
bunch of equally environmentally-irresponsible underperformers. In other words, the consumers
are unlikely to bother to find out which firm has the lowest reputation score, and which firm is
ranked the second or the third from the bottom.
However, when it comes to the high-reputation firms, the consumers are likely to be more
discriminating relative to firm reputation ranks. They are likely to be interested in learning about
which firm has the best environmental reputation, and which firm has the second best record,
because they equate the green rank to the firm’s commitment to social responsibility and also to
the quality of its products. Indeed, according to the survey cited above, nearly two-thirds of
Americans replied that they would recommend the products of top 20 socially responsible
companies to others, whereas only a quarter of American people would recommend the products
of the companies ranked in the bottom 20 (Brown & Dacin, 1997).
45
CHAPTER 5
RESULTS AND ANALYSIS
5.1 Hypothesis Testing
5.1.1 Hypotheses One and Two
It was hypothesized that the environmental reputation of a firm will be positively and
significantly influenced by the firm’s environmental performance (H1) and environmental
management (H2). A multiple regression analysis of the full-sample data rejected H1 (B = 0.040,
p > .05), but supported H2 (B = 0.298, p < 0.001). In other words, a firm’s environmental
reputation is positively predicted by the firm’s environmental management, but not by its
environmental performance. See Table 3. The B value of 0.298 (H2) indicates that a one-point
increase in the environmental management score is translated into a 0.298-point gain in the
company’s environmental reputation score above and beyond the effects of other variables.
Interestingly, when the data was re-analyzed after being split into the high-reputation
firms’ and low-reputation firms’ categories, the result was significantly different from the above
results for the entire set of firms. For the high-reputation group, environmental management is a
significant determinant of environmental reputation (B = 0.211, p < .001) as projected by H2.
However, environmental performance is not a significant predictor of environmental reputation
(B = 0.029, p > .05), not supporting H1. (See Table 4.) For the low-reputation group,
environmental performance, not environmental management, significantly predicts
environmental reputation (B = 0.071, p < .05). The outcome is consistent with H2, but not with
H1. See Table 5.
In a nutshell, what the findings suggest is that the key driver of a firm’s environmental
reputation depends on the level of the firm’s environmental reputation. That is, if a firm has a
46
superior environmental reputation, the key driver is the firm’s environmental management skills.
However, for the firms with an inferior environmental reputation, the driver is environmental
performance.
A further insight into the varying determinant of environmental reputation may be gained
from analyzing the also varying influence on environmental reputation of the four control
variables – (1) high-low-polluting firm (2) the size of a firm (3) high-low-tech firm and (4)
inclusion in the Fortune list of Most Admired Companies.
The analysis of the full-sample data shows that high-polluting firms scored significantly
higher in environmental reputation than did low-polluting firms (B = 4.720, p < .001). See Table
3. This unexpected finding is additionally remarkable, given that the high-polluting firms scored
significantly lower in environmental performance than did the low-polluting firms (F (1, 269) =
58.151, p < .001).
One plausible explanation may be that the high-polluting firms possibly received
favorable treatment in the environmental reputation evaluation process after the evaluators took
into consideration that, because of the nature of their products, the high-polluting firms have a
base level of pollution created when in operation. Indeed, even using today’s best technologies
available, manufacturing firms in oil and gas, for instance, and other heavy industries, cannot
avoid generating a significant amount of pollutants unless they completely stop their operations.
The result of the entire-sample analysis also indicated that environmental reputation is
significantly influenced by the size of a firm (B = 4.610, p < .001). These findings may suggest
that large-sized companies have more solid environmental policies in place compared to smaller-
sized companies in light-polluting industries. This observation may be backed by the results of a
supplementary correlation analysis that denoted a positive relationship between the size of a firm
47
and its environmental management score (r = .258, p < .001). An alternative and more likely
explanation may be that larger-sized firms were evaluated under a more favorable light thanks to
their superior financial capability.
To gauge the impact on environmental reputation of a firm’s inclusion/exclusion in the
Fortune list of Most Admired Companies, an additional sensitivity analysis was conducted for
the entire sample in testing H1 and H2. The inclusion/exclusion failed to significantly change the
result of the original test.
Again there is striking difference between the high-reputation sample and low-reputation
sample in terms of the influence of the control variables. As for the high-reputation sample,
environmental reputation is significantly and positively influenced by firm size (B = 5.532,
p < .01) and inclusion in the Fortune list of America’s Most Admired Companies (B = 4.323,
p < .05). As for the low-reputation firms, none of the control variables has significant impact on
environmental reputation.
One likely explanation for the varying impact of the two controlling variables may be that the
high-reputation firms exclusively benefit from the so-called halo effect, which is denied to the
low-reputation firms. That is, high-reputation firms’ environmental reputations may have been
influenced by their superior capital size (total equity) and also by their overall corporate
reputation (attributable to its inclusion in the Fortune list of Most Admired Companies).
Based on the results of the above analysis of the full sample, the following statistically
significant working model (F (6, 264) = 16.908, p < .001, R2 = 0.278), to predict environmental
reputation scores, was generated:
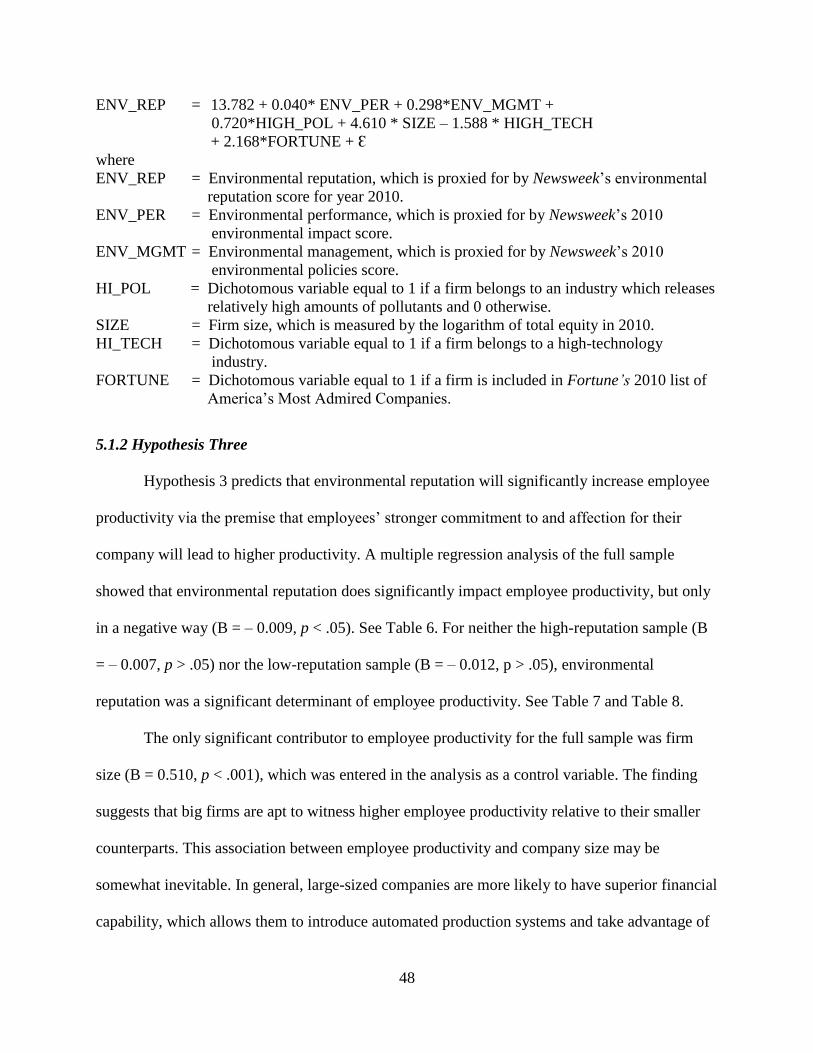
48
ENV_REP = 13.782 + 0.040* ENV_PER + 0.298*ENV_MGMT +
0.720*HIGH_POL + 4.610 * SIZE – 1.588 * HIGH_TECH
+ 2.168*FORTUNE + Ԑ
where
ENV_REP = Environmental reputation, which is proxied for by Newsweek’s environmental
reputation score for year 2010.
ENV_PER = Environmental performance, which is proxied for by Newsweek’s 2010
environmental impact score.
ENV_MGMT = Environmental management, which is proxied for by Newsweek’s 2010
environmental policies score.
HI_POL = Dichotomous variable equal to 1 if a firm belongs to an industry which releases
relatively high amounts of pollutants and 0 otherwise.
SIZE = Firm size, which is measured by the logarithm of total equity in 2010.
HI_TECH = Dichotomous variable equal to 1 if a firm belongs to a high-technology
industry.
FORTUNE = Dichotomous variable equal to 1 if a firm is included in Fortune’s 2010 list of
America’s Most Admired Companies.
5.1.2 Hypothesis Three
Hypothesis 3 predicts that environmental reputation will significantly increase employee
productivity via the premise that employees’ stronger commitment to and affection for their
company will lead to higher productivity. A multiple regression analysis of the full sample
showed that environmental reputation does significantly impact employee productivity, but only
in a negative way (B = – 0.009, p < .05). See Table 6. For neither the high-reputation sample (B
= – 0.007, p > .05) nor the low-reputation sample (B = – 0.012, p > .05), environmental
reputation was a significant determinant of employee productivity. See Table 7 and Table 8.
The only significant contributor to employee productivity for the full sample was firm
size (B = 0.510, p < .001), which was entered in the analysis as a control variable. The finding
suggests that big firms are apt to witness higher employee productivity relative to their smaller
counterparts. This association between employee productivity and company size may be
somewhat inevitable. In general, large-sized companies are more likely to have superior financial
capability, which allows them to introduce automated production systems and take advantage of

49
economies of scale. In addition, large firms are likely to have superior marketing networks.
Hence, they are more likely to be in a better position to report higher employee productivity.
To address whether the negative impact of environmental reputation on employee
productivity might be driven by differences between industries, an additional analysis (not
tabulated) was conducted to control for the differences. This was done in two ways. First, firms
were classified into six industrial groups – financial services, retail, internet, services, light
manufacturing, and heavy manufacturing. Second, the firms were grouped into 16 different
industrial groups as originally classified by the Newsweek data. Results obtained under each
approach did not yield any significant or differentiating outcomes.
Based on the above results of the analysis, the following statistically significant working
model (F (7, 263) = 5.694, p < .001, R2 = 0.114) to predict employee productivity for the full
sample was formulated:
EMP_PROD = – 2.309 – 0.009*ENV_REP – 0.004*ENV_PER – 0.004*ENV_MGMT
+ 0.18*POL + 0.587*SIZE – 0.157*HIGH_TECH – 0.054*FORTUNE + Ԑ.
where
EMP_PROD = Employee productivity, which is proxied for by total revenue divided by (total
number of employees * 100,000) in the year of 2011.
ENV_REP = Environmental reputation, which is proxied for by Newsweek’s 2010
environmental reputation score.
ENV_PER = Environmental performance, which is proxied for by Newsweek’s 2010
environmental impact score.
ENV_MGMT = Environmental management, which is proxied for by Newsweek’s 2010
environmental policies score.
HI_POL = Dichotomous variable equal to 1 if a firm belongs to an industry which releases
relatively high amount of pollutants and 0 otherwise.
SIZE = Firm size, which is measured by the logarithm of total equity in 2010.
HI_TECH = Dichotomous variable equal to 1 if a firm belongs to a high-technology
industry.
FORTUNE = Dichotomous variable equal to 1 if a firm is included in Fortune’s 2010 list of
America’s Most Admired Companies.
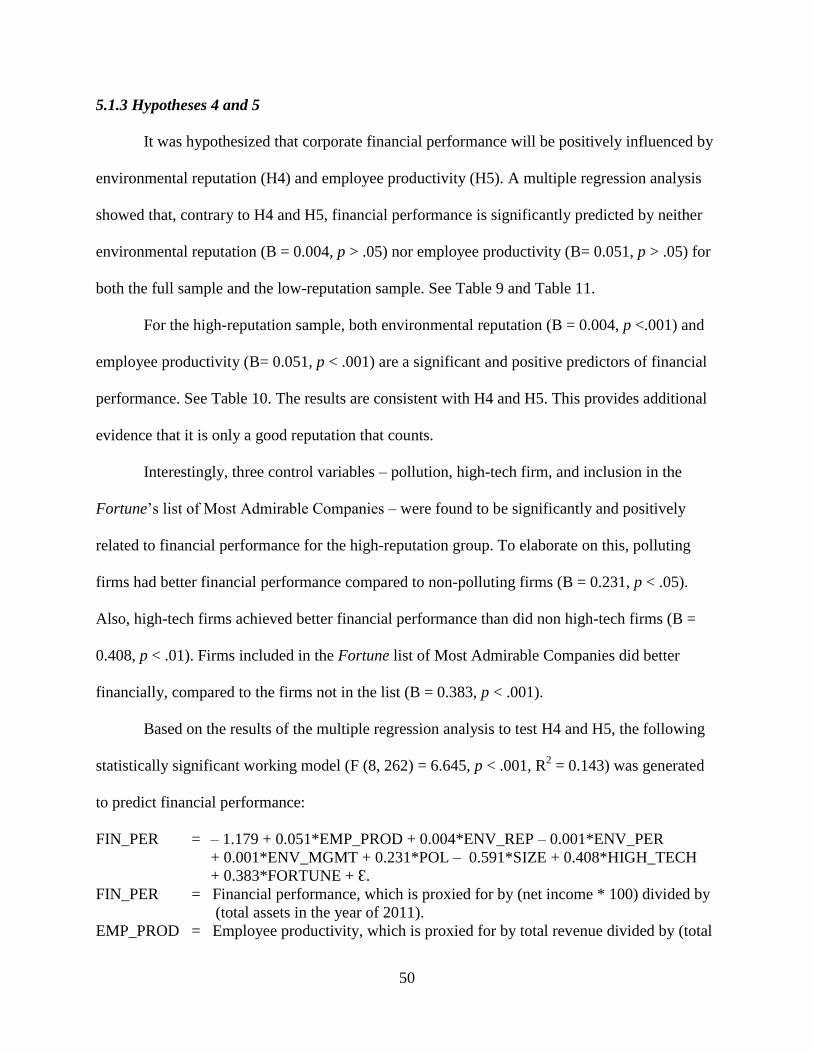
50
5.1.3 Hypotheses 4 and 5
It was hypothesized that corporate financial performance will be positively influenced by
environmental reputation (H4) and employee productivity (H5). A multiple regression analysis
showed that, contrary to H4 and H5, financial performance is significantly predicted by neither
environmental reputation (B = 0.004, p > .05) nor employee productivity (B= 0.051, p > .05) for
both the full sample and the low-reputation sample. See Table 9 and Table 11.
For the high-reputation sample, both environmental reputation (B = 0.004, p <.001) and
employee productivity (B= 0.051, p < .001) are a significant and positive predictors of financial
performance. See Table 10. The results are consistent with H4 and H5. This provides additional
evidence that it is only a good reputation that counts.
Interestingly, three control variables – pollution, high-tech firm, and inclusion in the
Fortune’s list of Most Admirable Companies – were found to be significantly and positively
related to financial performance for the high-reputation group. To elaborate on this, polluting
firms had better financial performance compared to non-polluting firms (B = 0.231, p < .05).
Also, high-tech firms achieved better financial performance than did non high-tech firms (B =
0.408, p < .01). Firms included in the Fortune list of Most Admirable Companies did better
financially, compared to the firms not in the list (B = 0.383, p < .001).
Based on the results of the multiple regression analysis to test H4 and H5, the following
statistically significant working model (F (8, 262) = 6.645, p < .001, R2 = 0.143) was generated
to predict financial performance:
FIN_PER = – 1.179 + 0.051*EMP_PROD + 0.004*ENV_REP – 0.001*ENV_PER
+ 0.001*ENV_MGMT + 0.231*POL – 0.591*SIZE + 0.408*HIGH_TECH
+ 0.383*FORTUNE + Ԑ.
FIN_PER = Financial performance, which is proxied for by (net income * 100) divided by
(total assets in the year of 2011).
EMP_PROD = Employee productivity, which is proxied for by total revenue divided by (total

51
number of employees * 100,000) in the year of 2011.
ENV_REP = Environmental reputation, which is proxied for by Newsweek’s 2010
environmental reputation score.
ENV_PER = Environmental performance, which is proxied for by Newsweek’s 2010
environmental impact score.
ENV_MGMT = Environmental management, which is proxied for by Newsweek’s 2010
environmental policies score.
HI_POL = Dichotomous variable equal to 1 if a firm belongs to an industry which
releases relatively high amount of pollutants and 0 otherwise.
SIZE = Firm size, which is measured by the logarithm of total equity in 2010.
HI_TECH = Dichotomous variable equal to 1 if a firm belongs to a high-technology
industry.
FORTUNE = Dichotomous variable equal to 1 if a firm is included in Fortune’s 2010 list of
America’s Most Admired Companies.
52
CHAPTER 6
CONCLUSIONS AND DISCUSSIONS
6.1 Conclusions
This study was specifically designed to answer the following three key research
questions. First, what contributes to corporate environmental reputation, environmental
performance (H1), environmental management (H2), or both? Second, is environmental
reputation a significant predictor of a firm’s employee productivity (H3) and financial
performance (H4)? Third, does employee productivity lead to financial performance (H5)?
To answer these questions, data for 271 firms selected from the 500 largest U.S. public
companies listed in the Newsweek’s 2010 green rankings were collected and analyzed. The 271
companies were specifically chosen because their complete and reliable data required for this
study were available. Excluded from the sample are the firms, which have ceased to exist as
public companies after going private or being merged into other entities, and the firms whose
data included at least an outliner.
These data were analyzed using multiple regression to test five research hypotheses in
two stages. In the first stage, the full sample (N=271) was analyzed. In the second stage, the full
sample was split into two subsamples – the high-reputation group and the low-reputation group –
before being analyzed separately. The high-reputation group refers to the firms whose
environmental reputation score is above the average of the full sample. Particularly, the second-
stage analysis of the high-reputation sample helped this study to make several important
findings, which would have been missed otherwise.
The key findings of this study are summarized as follows. First, for the full sample (N =
271), a firm’s environmental reputation is significantly predicted by its environmental
53
management, not by its environmental performance. Next, a firm’s environmental reputation is
not a significant determinant of its employee productivity. Lastly, neither employee productivity
nor environmental reputation significantly influences the firm’s financial performance.
Second, for the high-reputation sample, the significant determinant of a firm’s
environmental reputation is its environmental management. Also, as is the case for the full
sample, a firm’s environmental reputation does not significantly predict its employee
productivity. Most importantly, financial performance is significantly influenced by both
employee productivity and environmental reputation.
Third and last, for the low-reputation sample, a firm’s environmental reputation is
significantly affected by its environmental performance. Next, a firm’s environmental reputation
does not significantly influence its employee productivity. Finally, a firm’s financial
performance is not predicted by either its environmental reputation or its employee productivity.
Notably, the significant association between environmental management and
environmental reputation particularly for the high-reputation sample is consistent with the costly
signaling theory (Grafen, 1990; Zahavi, 1975). The theory suggests that when a firm voluntarily
engages in socially-responsible acts like environmental initiatives, this sends a signal that the
firm is willing to do more for the well-being of the general public, and thus, engenders a
favorable image of the firm (Bird & Smith, 2005; Griskevicius et al., 2007). As stated earlier, the
environmental management score reflects a firm’s voluntary environmental policies and
initiatives.
Next, the notable absence of any hypothesized significant relationship between
environmental reputation and employee productivity presents a challenge for two of the study’s
foundational theories – the social identity theory (Ellemers et al., 1999) and Davison’s third-

54
person effect (1983). The two theories together suggest that a firm’s superior environmental
reputation will stimulate the employees’ affection for the firm, which will naturally lead to
greater employee productivity.
Finally, the positive and significant impact on financial performance of environmental
reputation for the high-reputation group lends support to Barney’s (1991) resources-based view
of firm (RBVF) theory. RBVF proposes that it is intangible reputation that drives a firm’s lasting
competitive edge and financial success.
The following discussion section presents contributions and implications of the findings
of this study. Also discussed are limitations of this study and suggestions for future studies.
6.2 Discussions
6.2.1 Contributions and Implications
This study pioneered an investigation into environmental reputation’s endogenous impact
on a firm’s operational efficiency, breaking from the traditional focus on exogenous influence.
The endogenous impact examined by this study centered on employee productivity. This unique
approach was guided by two well-established social science theories – namely, social identity
theory and third-person effect theory. Both theories strongly suggest that superior corporate
reputation (e.g., environmental reputation) is likely to bring employees a chain of psychological
changes favorable to the firm’s operational efficiency. The changes most interesting to this study
are greater employee loyalty and commitment to the firm, which naturally seem to lead to greater
employee productivity.
Even though the results of this study failed to support the hypothesized, possible impact
on employee productivity of environmental reputation, this study makes a significant
contribution to reputation research by suggesting the innovative (endogenous impact focus)
55
approach. This new approach represents an important break from the traditional method, which
focused on reputation’s exogenous influence on financial performance while failing to pay
attention to endogenous impact.
Past reputation research (e.g., Tang et al., 2012) simply assumed that if a firm attained a
financial gain because of its superior reputation, the gain will solely be attributable to
reputation’s exogenous benefits (e.g., ease with recruiting higher quality of employees, greater
customer loyalty and satisfaction, better deals with business partners), which will help the firm to
increase sales and profits. That assumption comes under question, given the above-mentioned
theories (e.g., social identity theory).
In addition, this study is the first full-scale, theory-based investigation into the impact of
environmental reputation on corporate financial performance. Prior environmental reputation
studies (Salama, 2003; Tang et al., 2012) are sparse but also had some serious limitations and
shortcomings. For instance, Salama (2003) used inadequate proxy. Tang et al. (2012) failed to
adequately control extraneous variables. Unlike the previous studies, this study controlled
extraneous variables with relative adequacy and, more importantly, produced research results
while being guided by established theories.
In addition, this study suggests a new methodological direction in research investigating
the impact of environmental reputation and probably generic corporate reputation also. To
elaborate, the impact (on corporate financial performance for this study) of environmental
reputation can be better identified with the use of stratified samples than with the use of a full
sample only, as demonstrated by this study. This study stratified the full sample into high-
reputation and low-reputation subsamples.

56
Stratifying the full sample into two sub-samples based on environmental reputation
scores (dependent variable) was prompted by reasonable expectations that there may be a
significant difference, in the impact, if any, of environmental reputation on financial
performance, between the high-reputation group and the low-reputation group. As discussed in
the results section, the key rationale for utilizing and responding toing such expectations is the
likelihood that low-reputation firms can be fundamentally different from the high-reputation
firms, in the ways in which the general public views their reputation ranks.
For instance, people may dismiss the low-reputation firms as a bunch of entities, which
are equally irresponsible for environmental protection. Thus, people may not bother to learn,
which firm (e.g., firm A) is ranked higher than which firm (e.g., firm B), and may not feel like
having a higher regard for firm A than firm B because firm A is ranked higher than firm B. For
the high-reputation firms, it can be a totally different story. People may be keenly interested in
learning, which firm is ranked high and which firm is ranked lower, before making a purchase
decision or other business decision related to the firms. Indeed, there is a significant difference
between high-reputation and low-reputation firms, in terms of the pattern of association between
environmental reputation and financial performance, as the results of this study showed in the
previous section.
The bottom line is that if the data was analyzed by the conventional method as the full
sample only, the significant impact on financial performance of environmental reputation for the
full sample, and also for the high-reputation sample, could have been missed. For a similar
reason, the positive contribution of environmental performance to environmental reputation, only
for the low-reputation firms, could have not been identified also. To my best knowledge, no
environmental reputation research has used stratified sample analysis.

57
This study has one important practical implication. Finding that environmental reputation
is determined by environmental management, but not by environmental performance (with an
exception for the low-reputation firms) has a significant message for firm managers. This
evidence may suggest that when it comes to environmental reputation, words speak louder than
actions, contrary to the ages-old, common-sense wisdom that actions speak louder than words.
This finding particularly suggests for the high-reputation firms that well-publicized
environmental policies are much more effective in boosting a company’s environmental
reputation than is actual environmental performance. As such, a firm aspiring to improve its
environmental reputation might need to invest in improving its environmental management
rather than its environmental performance. Given that improving environmental performance
generally takes a considerable amount of time and financial resources, this finding has practical
significance particularly for companies and industries hoping to improve environmental
reputation. This insight also speaks to those who are interested in improving environmental
reputation with a minimal amount of investment.
6.2.2 Limitations
6.2.2.1 Noisy Proxies
One major limitation of this study is associated with using a number of proxies. Given
that proxies can inherently be noisy, what really matters are the degrees of noisiness, not whether
or not a proxy is free from noisiness.
First, it is acknowledged that the proxy for environmental reputation, one of this study’s
most important predictor variables, is likely to be noisy to some degree. Environmental
reputation is proxied for by Newsweek’s 2010 green reputation score, which is based on a survey
of so-called ‘sector specialists’ rather than average citizens. As such, a significant gap can exist
58
for the corporate reputation of a company, between the average citizens and the ‘sector
specialists,’ a term which refers to those with special knowledge of the company and the
industry. The saving grace, however, is that the Newsweek proxies have been used in others’
studies.
Also, this study’s proxy for employee productivity – per-employee sales – could be more
or less noisy even though a number of previous studies (e.g., Huselid, 1995; Chen, 2001; Suarez-
Gonzalez, 2001; Yu & Park, 2006) reported using the same proxy as this study. The concerns
over noise are prompted by significant inconsistency or variations between industries and
between firms in the way they report their numbers of employees.
For instance, some companies included only full-time employees in reporting the number
of their employees, while others included both full-time and part-time employees in the
employee number report. Particularly, some retailing companies like Walmart stores have a large
number of part-time employees who were included in their count of employees. Walmart reports
hiring 2.2 million employees according to its home page (Walmart, 2016). It is, however, a well-
known fact that a majority of the employees are hourly part-time workers. This discrepancy in
the way of tallying the number of employees makes it a challenge to make a valid comparison
between firms in their employee productivity, which is computed by dividing a firm’s revenue
by the number of its employees.
6.2.2.2 Cross-Sectional Investigation
This study has a limitation in examining environmental reputation for a single year of
2010, instead of multiple years. The constraint was unavoidable because Newsweek provided
environmental reputation scores only for the year. Nonetheless, the single-year, cross-sectional
analysis clearly has some disadvantages compared to multi-year longitudinal analysis. One of the

59
disadvantages is that establishing a cause-effect relationship is much more difficult in a cross-
sectional analysis. In the context of this study, if the proxy score for environmental reputation
was available for more than a year, the results of the analysis might have been more reliable.
A longitudinal analysis would have detected a time-lag effect. Considering that an
intangible asset like reputation is likely to have an effect lasting for more than a year or two, the
impact of environmental reputation should have been examined for multiple years. Indeed,
previous studies (e.g., Hart & Ahuja, 1996) reported two years of time-lag effect on financial
performance of environmental initiatives.
In addition, the fact that in 2010 the country was about to recover from the reeling impact
of the most severe economic recession since the great depression of 1929 makes a longitudinal
study more desirable. The impact of the recession could have clouded any positive impact of
environmental reputation on financial performance
6.2.3 Suggestions for Future Studies
A future study investigating environmental reputation will need to measure the corporate
reputation among a random sample of average citizens, rather than among those with special
knowledge of the firms. Obviously, it is millions of average citizens, not a small crop of industry
specialists, whose purchase in response to a firm’s green reputation will significantly affect the
firm’s bottom line, if, indeed, green reputation is significantly associated with financial
performance.
To investigate environmental reputation with better focus, it is recommended that a future
study examine firms in a single industry rather than a large number of industries as was the case
with this study. The 271 firms examined by this study came from 15 different industries.
60
Because of the constraint on the minimum sample size requirements for a multiple regression
analysis, an industry-by-industry analysis was inappropriate for this study.
When firms in a single industry are investigated, their relative homogeneity naturally
allows the researcher to study a certain aspect of the sample with better clarity, and with less
confounding effect of extraneous variables. Potential extraneous variables when investigating
environmental reputation may include whether an industry produces a consumer end product or
an intermediary industrial good or whether a firm is in a relative clean industry like finances and
banking or in relatively high-pollution industries like oil, paper and food. For instance, firms
working with intermediary industrial products can have their financial performance much less
affected by consumers’ reaction to their environmental reputation, as compared to the firms that
produce consumer end products.
Use of a homogeneous sample from an industry, rather than a heterogeneous sample from
a multiple number of industries, will also enable the researcher to make a more meaningful
assessment of the hypothesized positive impact on employee productivity of environmental
reputation. It is well known that some particular industries, like banking and retail, use a
relatively higher portion of part-time employees compared to other industries like auto, oil, and
gas. When a heterogeneous sample from the two drastically different (in terms of the portion of
part-time employees) groups of industries is analyzed together, employee productivity proxied
for by the sales divided by the number of employees can be less comparable.
Finally, a future investigation on the impact of environmental reputation on financial
performance is likely to better capture the impact if the study is designed longitudinally,
covering at least three years, instead of cross-sectionally, like this study. Because environmental

61
reputation is expected to last for years, a longitudinal investigation seems to be a must, not a
matter of choice.
62
REFERENCES
Abbott, W., and R. Monsen. 1979. On the measurement of corporate social responsibility: Self-
reported disclosures as a method of measuring Corporate Social Involvement. Academy
of Management Journal, 22(3): 501-515.
Abrams, D. 1992. Processes of social identification. In Breakwell, G. M. (Ed.), Social
Psychology of Identity and the Self-concept. London: Surrey University Press: 57-99.
Agus, A., and R. M. Sagir. 2001. The structural relationships between total quality management,
competitive advantage and bottom line financial performance: An empirical study of
Malaysian manufacturing companies. Total Quality Management, 12(7): 1018-1024.
Akehurst, G., C. Afonso, and H. M. Gonçalves. 2012. Re-examining green purchase behavior
and the green consumer profile: new evidences. Management Decision, 50(5): 972-988.
Al-Tuwaijri, S. A., T. E. Christensen, and K. E. Hughes II. 2004. The relations among
environmental disclosure, environmental performance, and economic performance: A
simultaneous equations approach. Accounting, Organizations & Society, 29(5/6):447-471.
Ambec, S., and P. Lanoie, P. 2008. Does it pay to be green? A systematic overview. Academy of
Management Perspectives, 22(4): 45-62.
Anton W., G. Deltas, and M. Khanna. 2004. Incentives for environmental self‐regulation and
implications for environmental performance. Journal of Environmental Economics and
Management, 48(1): 632–654.
Ashforth, B. E., and F. Mael. 1989. Social identity theory and the organization. Academy of
Management Review, 14(1): 20-39.
Azim, M. T. 2016. Corporate Social Responsibility and employee behavior: Mediating role of
organizational commitment. Revista Brasileira de Gestão de Negócios, 18(60): 207-225.
Barney, J. B. 1991. Firm resources and sustained competitive advantage. Journal of
Management, 17(1): 99-120.
Bhattacharya, C. B., S. Sen. 2003. Consumer–company identification: A framework for
understanding consumers' relationships with companies. Journal of Marketing, 67(2): 76-
88.
Beatty, R. P., and J. R. Ritter. 1986. Investment banking, reputation, and underpricing of initial
public offerings. Journal of Financial Economics, 15(1/2): 213-232.
Belkaoui, A., and P. G. Karpik. 1989. Determinants of the corporate decision to disclose social
information. Accounting, Auditing and Accountability Journal, 2(1): 36-51.
63
Bird, R., and E. A. Smith. 2005. Signaling theory, strategic interaction, and
symbolic capital. Current Anthropology, 46(2): 221-248.
Bragdon, J. H., and J. A. T. Marlin. 1972. Is pollution profitable? Risk Management, 19(4): 9-18.
Brammer, S. J., and S. Pavelin. 2006. Corporate reputation and social performance: The
importance of fit. Journal of Management Studies, 43(3): 435-455.
Brammer , S. , C. Brooks, and S. Pavelin. 2009. The stock performance of America’s 100 best
corporate citizens. Quarterly Review of Economics and Finance, 49(3): 1065-1080.
Brown, T. J., and P. A. Dacin. 1997. The company and the product: Corporate associations and
consumer product responses. Journal of Marketing, 61(1): 68-84.
Brown, B., and S. Perry. 1994. Removing the financial performance halo from Fortune’s ‘‘Most
Admired’’ companies. Academy of Management Journal, 37(5): 1347-1359.
Burnett, R. D., and D. R. Hansen. 2008. Ecoefficiency: Defining a role for environmental cost
management. Accounting, Organizations & Society, 33(6): 551-581.
Burnett, R. D., C. J. Skousen, and C. J. Wright. 2011. Eco-effective management: An empirical
link between firm value and corporate sustainability. Accounting & the Public Interest,
11(1): 1-15.
Campbell, D., P. Shrives, and H. B. Saager. 2001. Voluntary disclosure of mission statements in
corporate annual reports: Signaling what and to whom? Business and Society Review,
106(1): 65- 87.
Carmeli, A., G. Gilat, and D. A. Waldman. 2007. The Role of perceived organizational
performance in organizational identification, adjustment and job performance. Journal of
Management Studies, 44(6): 972-992.
CEOs watch their reputation. 2003. Brand Strategy, (issue 177) November 2003: 35-35.
Chen, P. 2001. Layoffs, shareholders' wealth, and corporate performance. Journal of Empirical
Finance, 8(2): 171-199.
Cherian, J., and J. Jacob. 2012. Green Marketing: A study of consumers' attitude towards
environment friendly products. Asian Social Science, 8(12): 117-126.
Cho, C. H., R. P. Guidry, A. M. Hageman, and D. M. Patten. 2012. Do actions speak louder than
words? An empirical investigation of corporate environmental reputation. Accounting,
Organizations & Society, 37(1): 14-25.
64
Clarkson, P. M., Y. Li, G. D. Richardson, and F. P. Vasvari. 2008. Revisiting the relation
between environmental performance and environmental disclosure: An empirical analysis.
Accounting, Organizations & Society, 33(4/5): 303-327.
Cochran, P. L., and R. A. Wood. 1984. Corporate social responsibility and financial performance.
Academy of Management Journal, 27(1): 42-56.
Cohen, M., S. Fenn, and J. Naimon. 1997. Environmental and financial performance: Are they
related? Working paper, Vanderbilt University, Nashville, TN. Available on January 30,
2017 at: http://citeseerx.ist.psu.edu/viewdoc/download?doi=10.1.1.498.9820&rep
=rep1&type=pdf
Cosmetatos, G. P., and S. Eilon. 1983. Effects of productivity definition and measurement on
performance evaluation. European Journal of Operational Research, 14(1): 31-35.
Crook, T. R., D. J. Ketchen Jr, J. G. Combs, and S. Y. Todd. 2008. Strategic resources and
performance: A meta-analysis. Strategic Management Journal, 29(11): 1141-1154.
Dalton J., and S. Croft. 2003. Managing corporate reputation: The new currency. London:
Thorogood.
Davison, W. P. 1983. The third-person effect in communication. Public Opinion Quarterly, 47
(1):1-15.
Deak, Z. S., and I. Hadju. 2012. Environmental reputation of food production industry and its
financial connotations. International Journal of Management Cases, 14(4): 105-116.
Deephouse, D. L. 1996. Does isomorphism legitimate? Academy of Management Journal, 39(4):
1024-1039.
Dixon-Fowler, H., D. Slater, J. Johnson, A. Ellstrand, and A. Romi. 2013. Beyond 'Does it pay
to be green?' : A meta-analysis of moderators of the CEP-CFP relationship. Journal of
Business Ethics, 112(2): 353-366.
Dowling, G. 2001. Creating corporate reputations: Identity, image, and performance. New York:
Oxford University Press.
D'Souza, C. 2004. Ecolabel programmes: A stakeholder (consumer) perspective. Corporate
Communications: An International Journal, 9(3):179-188.
Dutton, J. E., and J. M. Dukerich. 1991. Keeping an eye on the mirror: Image and identity in
organizational adaptation. Academy of Management Journal, 34(3): 517-554.
Dutton, J. E., J. M. Dukerich, and C. V. Harquail. 1994. organizational images and member
identification. Administrative Science Quarterly, 39(2): 239-263.

65
Elkington, J. 1989. Why it pays to be green. Weekend Financial Times, 14(October): 13.
Ellemers, N., P. Kortekaas, and J. W. Ouwerkerk. 1999. Self-categorisation, commitment to the
group and group self-esteem as related but distinct aspects of social identity. European
Journal of Social Psychology, 29(2/3): 371-389.
Ellinger, A. D., A. E. Ellinger, B. Yang, and S. W. Howton. 2002. The relationship between the
learning organization concept and firms' financial performance: An empirical assessment.
Human Resource Development Quarterly, 13(1): 5-22.
Elsayed, K. 2006. Reexamining the expected effect of available resources and firm size on firm
environmental orientation: An empirical study of UK firms. Journal of Business Ethics,
65(3): 297-308.
Fombrun, C. J. 1996. Reputation: Realizing value from the corporate image. Boston, MA:
Harvard Business School Press.
Freedman, M., and B. Jaggi. 1992. An investigation of the long-run relationship between
pollution performance and economic performance: The case of pulp-and-paper firms.
Critical Perspectives on Accounting, 3(4): 315-336.
Friedman, M. 1970. A Friedman doctrine – The social responsibility of business is to increase
profits. NY Times Magazine, 13(33) September 13, 1970.
Friedman, A. L., and S. Miles. 2001. Socially responsible investment and corporate social and
environmental reporting in the UK: An exploratory study. British Accounting Review, 33
(4): 523-548.
Gallego-Alvarez, I., J. M. Prado-Lorenzo, L. Rodriguez-Dominguez, and I. M. Garcia-Sanchez.
2010. Are social and environmental practices a marketing tool? Empirical evidence for
the biggest European companies. Management Decision, 48(10): 1440-1455.
Gardberg, N. A., and C. J. Fombrun. 2002. The global reputation quotient project: First steps
towards a cross nationally valid measure of corporate reputation. Corporate Reputation
Review, 4(4): 303-307.
Godfrey, P. C., and C. W. L. Hill. 1995. The problem of unobservables in strategic management
research. Strategic Management Journal, 16(7): 519-533.
Grafen, A. 1990. Biological signals as handicaps. Journal of Theoretical
Biology, 144(4): 517-546.
Gray, R., M. Javad, and D. Power. 2001. Social and environmental disclosure and corporate
characteristics: A research note and extension. Journal of Business Finance and
Accounting, 28(3/4): 327-356.

66
Griskevicius, V., J. M. Tybur, J. M. Sundie, R. B. Cialdini, G. F. Miller, and D. T. Kenrick. 2007.
Blatant benevolence and conspicuous consumption: When romantic motives elicit
strategic costly signals. Journal of Personality and Social Psychology, 93(1): 85-102.
Gunther, A. C., and P. Mundy. 1993. Biased optimism and the third-person effect. Journalism
Quarterly, 70(1): 58-67.
Hart, S. L., and G. Ahuja. 1996. Does it pay to be green? An empirical examination of the
relationship between emission reduction and firm performance. Business strategy and the
Environment, 5(1): 30-37.
Hasseldine, J., A. I. Salama, and J. S. Toms. 2005. Quantity versus quality: The impact of
environmental disclosures on the reputations of UK Plcs. British Accounting Review,
37(2): 231-248.
Helm, S. 2007. The role of corporate reputation in determining investor satisfaction and loyalty.
Corporate Reputation Review, 10(1): 22-37.
Henriques, I., and P. Sadorsky. 1996. The determinants of an environmentally responsive firm:
An empirical approach. Journal of Environmental Economics and Management, 30(3):
381-395.
Heras-Saizarbitoria, I., G. A. Landin, and J. F. Molina-Azorin. 2011. Do drivers matter for the
benefits of ISO 14001? International Journal of Operations & Production Management,
31(2): 192-215.
Herbig P, J. Milewicz, and J. Golden. 1994. A model of reputation building and destruction.
Journal of Business Research, 31(1): 23-31.
Huselid, M. A. 1995. The impact of human resource management practices on turnover,
productivity, and corporate financial performance. Academy of Management Journal,
38(3): 635-672.
ISO Survey 2011. ISO. Available on March 20, 2013 from http://www.iso.org/iso/home
/standards/certification/iso-survey.htm
Jackson, K. T. 2004. Building reputational capital: Strategies for integrity and fair play that
improve the bottom line. New York: Oxford University Press.
Jacobs, B.W., V. R. Singhal, and R. Subramanian. 2010. An empirical investigation of
environmental performance and the market value of the firm. Journal of Operations
Management, 28(5): 430-441
Jaggi, B., and M. Freedman. 1992. An examination of the impact of pollution performance on
economic and market performance: Pulp and paper firms. Journal of Business Finance &
Accounting, 19(5): 697-713.
67
Jang, S. H. 2013. The offensive framework of resource-based view (RBV): Inhibiting others
from pursuing their own values. Journal of Management & Strategy, 4(1): 62-69.
Jiangning, Z. 2006. The effect of the ISO-14001 environmental management system on
corporate financial performance (Thesis graduate). School of Maharishi University of
Management, Fairfield, Iowa, USA.
Johnstone, N., C. Serravalle, P. Scapecchi, and J. Labonne. 2007. Public environmental policy
and corporate behaviour: Project background, overview of the data and summary results.
In N. Johnstone (Ed.), Environmental Policy and Corporate Behavior. Cheltenham, UK:
Edward Elgar in association with OECD.
Keh, H. T., and Y. Xie. 2009. Corporate reputation and customer behavioral intentions: The roles
of trust, identification and commitment. Industrial Marketing Management, 38(7): 732-
742.
Kim, J. B., and C. J. Choi. 2003. Reputation and product tampering in service industries. Service
Industries Journal, 23(4): 3-11.
Kim, H. R., M. k. Lee, H. T. Lee, and N. M. Kim. 2010. Corporate social responsibility and
employee-company identification. Journal of Business Ethics, 95(4):557-569.
King, A.A. and M. J. Lenox. 2001. Does it really pay to be green? An empirical study of firm
environmental and financial performance. Journal of Industrial Ecology, 5(1):105-116.
Klassen, R.D., and C. P. McLaughlin.1996.The impact of environmental management on firm
performance. Management Science, 42(8): 1199-1214.
Klein, B., and K. Leffler. 1981. The role of market forces in assuring contractual performance.
Journal of Political Economy, 89(4): 615-641.
Konar, S., and M. Cohen. 1997. Information as regulation: The effect of community right to
know laws on toxic emissions. Journal of Environmental Economics and Management,
32(1): 109-124.
Konar, S., and M. A. Cohen 2001. Does the market value environmental performance? Review
of Economics & Statistics, 83(2): 281-289.
Lee, J., and J. J. Roh. 2012. Revisiting corporate reputation and firm performance link.
Benchmarking: An International Journal, 19(4/5): 649-664.
Lee, K. 2008. Opportunities for green marketing: Young consumers. Marketing Intelligence &
Planning, 26(6): 573-586.

68
Lee, K. 2009. Gender differences in Hong Kong adolescent consumers green purchasing
behavior. Journal of Consumer Marketing, 26(2): 87-96.
Lee, J., N. Pati, and J. J. Roh. 2011. Relationship between corporate sustainability performance
and tangible business performance: Evidence from oil and gas industry. International
Journal of Business Insights & Transformation, 3(S3): 72-82.
Libby, R., R. Bloomfield, and M. W. Nelson. 2002. Experimental research in financial
accounting. Accounting, Organizations & Society, 27(8): 775-810.
Liu, X., Wang, S., and J. Myers. 2011. Emerging issues in corporate social responsibility. The
missing bridge between corporate social performance and financial performance: Firm
reputation. AMA Summer Educators' Conference Proceedings, 22: 106-107.
Matuszak-Flejszman, A. 2009. Benefits of environmental management system in Polish
companies compliant with ISO 14001. Polish Journal of Environmental Studies, 18
(3):411-419.
McGuire, J. B., A. Sundgren, and T. Schneeweis. 1988. Corporate social responsibility and firm
financial performance. Academy of Management Journal, 31(4):854-872.
Melnyk, S. A., R. P. Sroufe, and R. Calantone. 2003. Assessing the impact of environmental
management systems on corporate and environmental performance. Journal of
Operations Management, 21(3): 329-351.
Mergent Online. 2016. Available on Oct. 1, 2016 at: http://www.mergentonline.com.proxy.
lib.siu.edu/basicsearch.php.
Michelon, G. 2011. Sustainability disclosure and reputation: A comparative study. Corporate
Reputation Review, 14(2): 79-96.
Milgrom, P., and J. Roberts. 1986a. Relying on the information of interested parties. Rand
Journal of Economics, 17(1): 18-32.
Milgrom. P., and J. Roberts. 1986b. Price and advertising signals of product quality. Journal of
Political Economy, 94(4): 796-821.
Nakamura, E. 2011. Does environmental investment really contribute to firm performance? An
empirical analysis using Japanese firms. Eurasian Business Review, 1(2): 91-111.
Nehrt, C. 1996. Timing and intensity effects of environmental investments. Strategic
Management Journal, 17(7): 535-547.
Newbert, S. L. 2007. Empirical research on the resource-based view of the firm: An assessment
and suggestions for future research. Strategic Management Journal, 28 (2): 121-146.
69
Newsweek’s. 2010. Green rankings 2010: U.S. companies. Available on June 21, 2015 at
http://www.Newsweek’s.com/2010/10/18/green-rankings-us-companies.html
Nielson. 2014. Doing well by doing good: Increasingly, consumers care about corporate social
responsibility, but does concern convert to consumption? Available on January 30, 2017
at: http://www.nielsen.com/content/dam/nielsenglobal/apac/docs/reports/2014/
Nielsen-Global-Corporate-Social-Responsibility-Report-June-2014.pdf
Orlitzky, M., Schmidt, F., and S. Rynes. 2003. Corporate social and financial performance: A
meta-analysis. Organization Studies, 24(3): 403-441.
Owusu-Ansah, S. 1998. The impact of corporate attributes on the extent of mandatory disclosure
and reporting by listed companies in Zimbabwe. The International Journal of Accounting,
33(5): 605-631.
Paul, B., M. B. Salwen, and M. Dupagne. 2000. The third-person effect: A meta-analysis of the
perceptual hypothesis. Mass Communication & Society, 3(1): 57-85.
Penrose, E. 1959. The theory of the growth of the firm. New York: John Wiley & Sons.
Peteraf, M. A. 1993. The cornerstones of competitive advantage: A resource-based view.
Strategic Management Journal, 14(3): 179-191.
Poksinska B, J. Dahlgaard, and J. Eklund. 2003. Implementing ISO 14001 in Sweden: Motives,
benefits and comparison with ISO 9000. International Journal of Quality and Reliability
Management, 20(5): 585-606.
Porter, M. E. 1980. Competitive Strategy. New York: Free Press.
Porter, M. E. 1985. Competitive advantage: Creating and sustaining superior performance.
New York: Free Press.
Porter, M. E., and C. V. D. Linde. 1995.Toward a new conception of the environment-
competitiveness relationship. Journal of Economic Perspectives, 9(4): 97-118.
Pratt, M. G. 1998. To be or not to be: Central questions in organizational identification. In David
A. Whetten, and Paul C. Godfrey (Eds.), Identity in organizations: Building theory
through conversations. Thousand Oaks, CA: Sage Publications
Prieto, L. C., S. T. A. Phipps, and I. Y. Addae. 2014. Is Wal-Mart a social enterprise? An
exploration of the relationship between corporate reputation, corporate social
responsibility & financial performance. Academy of Strategic Management Journal,
13(2): 51-60.

70
Rahbar, E., and N. A. Wahid. 2011. Investigation of green marketing tools' effect on consumers'
purchase behavior. Business Strategy Series, 12(2): 73-83.
Rao, A.R., and K. B. Monroe. 1989. The effect of price, brand name, and store name on buyers’
perceptions of product quality: An integrative review. Journal of Marketing Research,
26(3): 351–357.
Ray, G., J. B. Barney, and W. A. Muhanna. 2004. Capabilities, business processes, and
competitive advantage: Choosing the dependent variable in empirical tests of the
resource-based view. Strategic Management Journal, 25(1): 23-37.
Reputation Institute. 2008. The most respected U.S. companies 2008. Available at:
http://www.reputationcapital.org/files/uploaded/Free_CSRI_Report_2008.
pdf [15 December 2010].
Rhee, M., and M. E. Valdez. 2009. Contextual factors surrounding reputation damage with
potential implications for reputation repair. Academy of Management Review, 34(1):
146-168.
Riordan, C. M., R. D. Gatewood, and J. B. Bill. 1997. Corporate Image: Employee reactions and
implications for managing corporate social performance. Journal of Business Ethics, 16
(4): 401-412.
Roberts, P, W., and G. R., Dowling. 2002. Corporate reputation and sustained financial
performance. Strategic Management Journal, 23(12): 1077-1093.
Sabate, J. M. D. L. F., and E. D. Q. Puente. 2003. The concept and measurement of corporate
reputation: An application to Spanish financial intermediaries. Corporate Reputation
Review, 5(4): 280-301.
Salama, A. I. 2003. The relationship between corporate environmental disclosure, environmental
reputation, and firm financial performance: UK evidence (Order No. U174171).
Available on March 14, 2015 at: http://search.proquest.com/docview/301604945?
accountid=13864
Samuelson, P. A., and W. D. Nordhaus. 1989. Economics (13th Environmental disclosure). New
York: McGraw-Hill.
Schlegelmilch, B. B., Bohlen, G. M., and A. Diamantopoulos. 1996. The link between green
purchasing decisions and measures of environmental consciousness. European Journal
of Marketing, 30(5): 35-55.
Shenkar, O., and E. Yuchtman-Yaar. 1997. Reputation, image, prestige, and goodwill: An
interdisciplinary approach to organizational standing. Human Relations, 50(11): 1361-
1381.

71
SHRM(Society for Human Resource Management). 2011. Advancing sustainability: HR's role.
Available on March 15, 2015 at: http://www.shrm.org/Research/SurveyFindings/
Articles/Documents/11-0066_AdvSustainHR_FNL_FULL.pdf.
Soana, M.-G. 2011. The Relationship between corporate social performance and corporate
financial performance in the banking sector. Journal of Business Ethics, 104(1): 133-148.
Spender, J. C., and R. M. Grant. 1996. Knowledge and the firm: An overview. Strategic
Management Journal, 17(Special Issue): 5-9.
Stanwick, P.A. and S. D. Stanwick. 1998. The relationship between corporate social performance,
and organizational size, financial performance, and environmental performance: An
empirical examination. Journal of Business Ethics, 17(2): 195–204.
Stuebs, M., and L. Sun. 2010. Business reputation and labor efficiency, productivity, and cost.
Journal of Business Ethics, 96(2): 265-283.
Suarez-Gonzalez, I. 2001. Downsizing strategy: Does it really improve organizational
performance? International Journal of Management, 18(3): 301-307.
Sur, S., and C. A. Sirsly. 2013. What's in a name? Decomposing corporate reputation to assess
the relative impact of temporal, firm and industry level factors. Journal of Management
& Governance, 17(4): 1047-1072.
Tang, A. K. Y., K. H. Lai, and T. C. E. Cheng. 2012. Environmental governance of enterprises
and their economic upshot through corporate reputation and customer satisfaction.
Business Strategy & the Environment, 21(6): 401-411.
Teoh, H., and G. Shiu. 1990. Attitudes towards corporate social responsibility and perceived
importance of social responsibility information characteristics in a decision context.
Journal of Business Ethics, 9(1): 71-77.
Toms, J. S. 2002. Firm resources, quality signals and the determinants of corporate
environmental reputation: Some UK evidence. British Accounting Review, 34(3): 257-
282.
Tsiotsou, R. 2006. The role of perceived product quality and overall satisfaction on purchase
intentions. International Journal of Consumer Studies, 30(2): 207-217.
Tuan, N. P., and N. T. T. Mai. 2012. A firm analysis level of supporting industries in Hanoi city-
Vietnam: Application of resource-based view and industrial organization. International
Journal of Business & Management, 7(5): 53-72.
Tversky, A. and D. Kahneman. 1974. Judgment under uncertainty: Heuristics and biases.
Science, 185(4157): 1125-1131.

72
Wagner, M., N. Van Phu, T. Azomahou, and W. Wehrmeyer. 2002. The relationship between
the environmental and economic performance of firms: An empirical analysis of the
European paper industry. Corporate Social Responsibility and Environmental
Management, 9(3): 133-146.
Worcester, T. 2009. Reflections on corporate reputation. Management Decisions, 47(4): 573-589.
Yu, G. C., and J. S. Park. 2006. The effect of downsizing on the financial performance and
employee productivity of Korean firms. International Journal of Manpower, 27(3): 230-
250.
Zahavi, A. 1975. Mate selection: Selection for a handicap. Journal of Theoretical Biology, 53(1):
205-214.

APPENDICS

74
AP
PE
ND
IX A
:
Tab
le 1
Descrip
tive S
tatistics
Full S
ample (N
= 2
71)
Hig
h-R
eputatio
n S
ample (N
= 1
23) L
ow
-Rep
utatio
n S
ample (N
=148)
V
aria
ble
Mea
n
Std
Dev
Min
M
ax
M
ean
S
td D
ev M
in
Ma
x
Mea
n
Std
Dev
Min
M
ax
EN
V_
RE
P
49
.28
14
.76
1.0
0
10
0.0
0
6
1.0
4
12
.05
4
9.3
6
10
0.0
0
3
9.5
0
8.2
4
1.0
0
49
.25
EM
P_P
RO
D
6.5
7
8.8
1
0.2
5
77
.88
5
.72
5.7
6
0.2
5
41
.61
7
.27
1
0.6
8
0.4
4
77
.88
FIN
_P
ER
F
7.7
8
5.0
3
0.0
4
33
.43
7
.82
4.8
0
0.0
4
22
.28
7
.74
5
.23
0.1
4
33
.43
EN
V_
PE
RF
4
9.3
8
28
.23
1.0
0
98
.71
4
9.2
6
29
.66
1
.00
98
.71
4
9.4
8
27
.08
1.2
0
98
.52
EN
V_
MG
MT
4
3.3
4
19
.70
3.1
9
98
.86
5
1.4
4
20
.39
3
.19
98
.86
3
6.6
0
16
.34
4.3
7
85
.53
HI_
PO
L
0.5
5
0.5
0
0
1.0
0
0
.66
0.4
8
0.0
0
1.0
0
0
.46
0
.50
0.0
0
1.0
0
SIZ
E
3.7
7
0.5
2
1.9
2
5.2
1
3
.87
0.5
4
1.9
2
5.1
1
3
.69
0
.48
2.3
6
5.2
1
HI_
TE
CH
0
.23
0.4
2
0.0
0
1.0
0
0
.27
0.4
5
0.0
0
1.0
0
0
.20
0
.40
0.0
0
1.0
0
FO
RT
UN
E
0.4
6
0.5
0
0.0
0
1.0
0
0
.52
0.5
0
0.0
0
1.0
0
0
.41
0
.49
0
1.0
0
Th
e variab
les are defin
ed as fo
llow
s: FIN
_P
ER
F =
Fin
ancial p
erform
ance w
hich
is pro
xied
for b
y (n
et inco
me *
10
0) d
ivid
ed b
y (to
tal assets in th
e year o
f 20
11
). EM
P_
PR
OD
=
Em
plo
yee p
rod
uctiv
ity w
hich
is pro
xied
for b
y to
tal reven
ue d
ivid
ed b
y (to
tal nu
mb
er of em
plo
yees *
10
0,0
00
) in th
e year o
f 20
11
. EN
V_
RE
P =
En
viro
nm
ental rep
utatio
n
wh
ich is p
roxied
for b
y N
ewsw
eek’s 20
10
enviro
nm
ental rep
utatio
n sco
re. EN
V_P
ER
= en
viro
nm
ental p
erform
ance w
hich
is pro
xied
for b
y N
ewsw
eek’s 20
10
enviro
nm
ental
imp
act score. E
NV
_M
GM
T =
En
viro
nm
ental m
anag
emen
t wh
ich is p
roxied
for b
y N
ewsw
eek’s 20
10
enviro
nm
ental m
anag
emen
t score. H
I_P
OL
= D
icho
tom
ou
s variab
le equ
al
to 1
if a firm b
elon
gs to
an in
du
stry w
hich
releases relatively
hig
h am
ou
nt o
f po
llutan
ts and
0 o
therw
ise. S
IZE
= F
irm size w
hich
is measu
red b
y lo
garith
m o
f total eq
uity
in 2
01
0.
HI_
TE
CH
= D
icho
tom
ou
s variab
le equ
al to 1
if a firm b
elon
gs to
a hig
h-tech
no
logy an
d 0
oth
erwise. F
OR
TU
NE
= D
icho
tom
ou
s varia
ble eq
ual to
1 if a firm
is inclu
ded
in
Fo
rtun
e 20
10
list of A
merica’s M
ost A
dm
ired C
om
pan
ies in 2
010
and 0
oth
erwise.
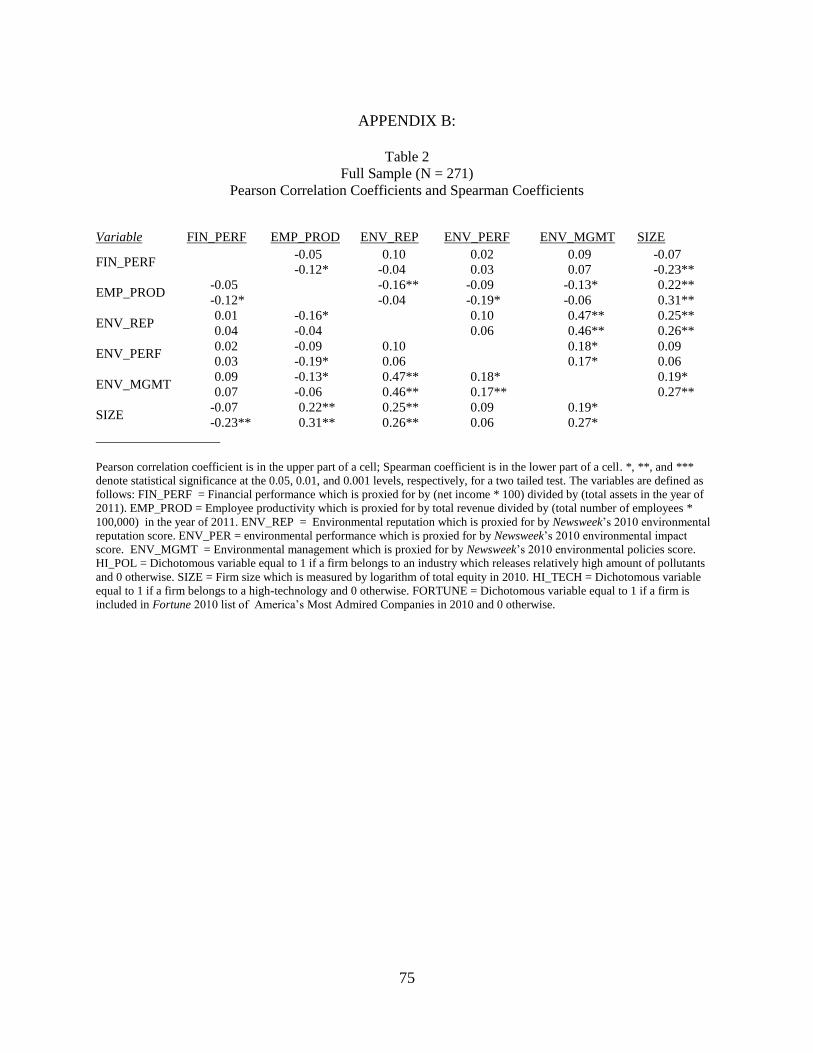
75
APPENDIX B:
Table 2
Full Sample (N = 271)
Pearson Correlation Coefficients and Spearman Coefficients
Variable FIN_PERF EMP_PROD ENV_REP ENV_PERF ENV_MGMT SIZE
FIN_PERF -0.05
-0.12*
0.10
-0.04
0.02
0.03
0.09
0.07
-0.07
-0.23**
EMP_PROD -0.05
-0.12*
-0.16**
-0.04
-0.09
-0.19*
-0.13*
-0.06
0.22**
0.31**
ENV_REP 0.01
0.04
-0.16*
-0.04
0.10
0.06
0.47**
0.46**
0.25**
0.26**
ENV_PERF 0.02
0.03
-0.09
-0.19*
0.10
0.06
0.18*
0.17*
0.09
0.06
ENV_MGMT 0.09
0.07
-0.13*
-0.06
0.47**
0.46**
0.18*
0.17**
0.19*
0.27**
SIZE -0.07
-0.23**
0.22**
0.31**
0.25**
0.26**
0.09
0.06
0.19*
0.27*
Pearson correlation coefficient is in the upper part of a cell; Spearman coefficient is in the lower part of a cell. *, **, and ***
denote statistical significance at the 0.05, 0.01, and 0.001 levels, respectively, for a two tailed test. The variables are defined as
follows: FIN_PERF = Financial performance which is proxied for by (net income * 100) divided by (total assets in the year of
2011). EMP_PROD = Employee productivity which is proxied for by total revenue divided by (total number of employees *
100,000) in the year of 2011. ENV_REP = Environmental reputation which is proxied for by Newsweek’s 2010 environmental
reputation score. ENV_PER = environmental performance which is proxied for by Newsweek’s 2010 environmental impact
score. ENV_MGMT = Environmental management which is proxied for by Newsweek’s 2010 environmental policies score.
HI_POL = Dichotomous variable equal to 1 if a firm belongs to an industry which releases relatively high amount of pollutants
and 0 otherwise. SIZE = Firm size which is measured by logarithm of total equity in 2010. HI_TECH = Dichotomous variable
equal to 1 if a firm belongs to a high-technology and 0 otherwise. FORTUNE = Dichotomous variable equal to 1 if a firm is
included in Fortune 2010 list of America’s Most Admired Companies in 2010 and 0 otherwise.
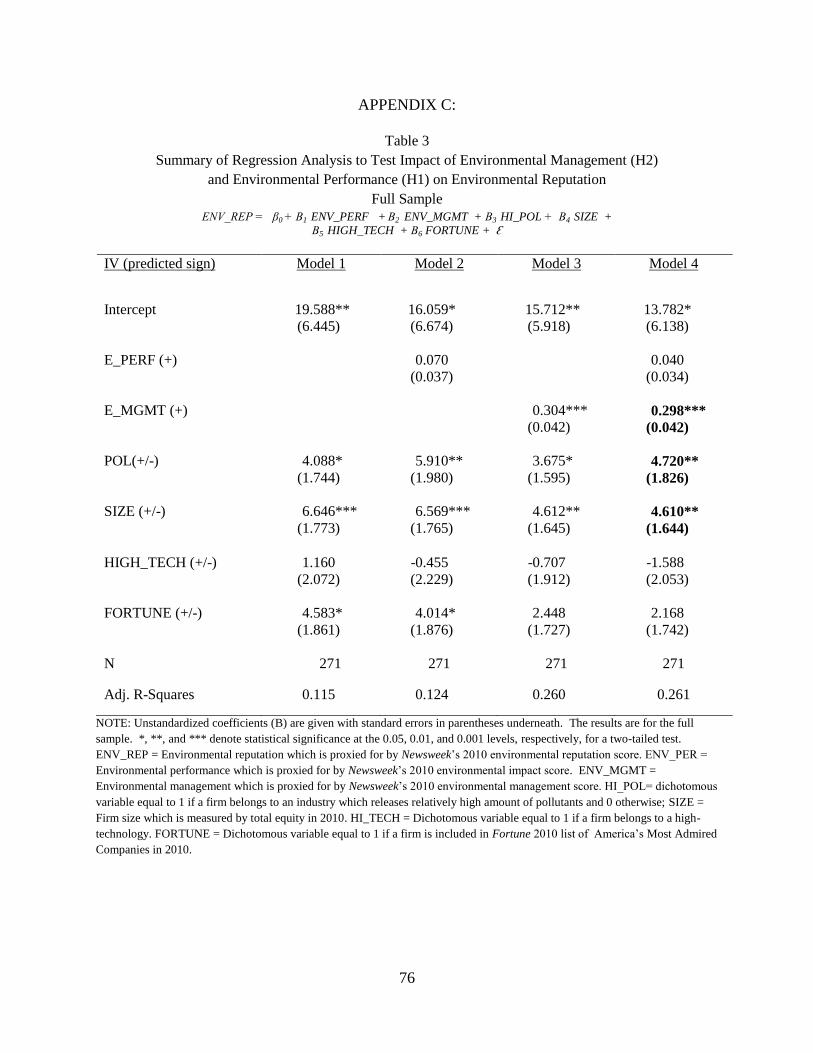
76
APPENDIX C:
Table 3
Summary of Regression Analysis to Test Impact of Environmental Management (H2)
and Environmental Performance (H1) on Environmental Reputation
Full Sample
ENV_REP = β0 + Β1 ENV_PERF + Β2 ENV_MGMT + Β3 HI_POL + Β4 SIZE +
Β5 HIGH_TECH + Β6 FORTUNE + Ԑ
NOTE: Unstandardized coefficients (B) are given with standard errors in parentheses underneath. The results are for the full
sample. *, **, and *** denote statistical significance at the 0.05, 0.01, and 0.001 levels, respectively, for a two-tailed test.
ENV_REP = Environmental reputation which is proxied for by Newsweek’s 2010 environmental reputation score. ENV_PER =
Environmental performance which is proxied for by Newsweek’s 2010 environmental impact score. ENV_MGMT =
Environmental management which is proxied for by Newsweek’s 2010 environmental management score. HI_POL= dichotomous
variable equal to 1 if a firm belongs to an industry which releases relatively high amount of pollutants and 0 otherwise; SIZE =
Firm size which is measured by total equity in 2010. HI_TECH = Dichotomous variable equal to 1 if a firm belongs to a high-
technology. FORTUNE = Dichotomous variable equal to 1 if a firm is included in Fortune 2010 list of America’s Most Admired
Companies in 2010.
IV (predicted sign) Model 1 Model 2 Model 3 Model 4
Intercept 19.588**
(6.445)
16.059*
(6.674)
15.712**
(5.918)
13.782*
(6.138)
E_PERF (+)
0.070
(0.037)
0.040
(0.034)
E_MGMT (+)
0.304***
(0.042)
0.298***
(0.042)
POL(+/-)
4.088*
(1.744)
5.910**
(1.980)
3.675*
(1.595)
4.720**
(1.826)
SIZE (+/-)
6.646***
(1.773)
6.569***
(1.765)
4.612**
(1.645)
4.610**
(1.644)
HIGH_TECH (+/-)
1.160
(2.072)
-0.455
(2.229)
-0.707
(1.912)
-1.588
(2.053)
FORTUNE (+/-)
4.583*
(1.861)
4.014*
(1.876)
2.448
(1.727)
2.168
(1.742)
N 271 271 271 271
Adj. R-Squares 0.115 0.124 0.260 0.261
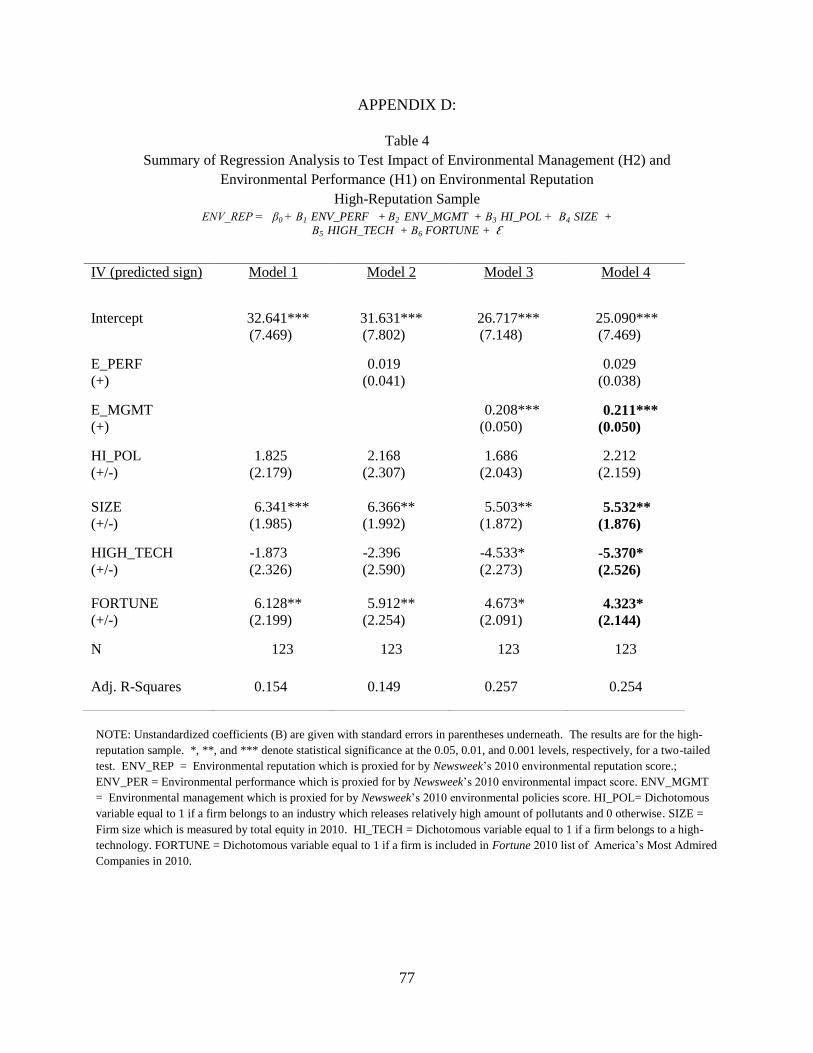
77
APPENDIX D:
Table 4
Summary of Regression Analysis to Test Impact of Environmental Management (H2) and
Environmental Performance (H1) on Environmental Reputation
High-Reputation Sample
ENV_REP = β0 + Β1 ENV_PERF + Β2 ENV_MGMT + Β3 HI_POL + Β4 SIZE +
Β5 HIGH_TECH + Β6 FORTUNE + Ԑ
NOTE: Unstandardized coefficients (B) are given with standard errors in parentheses underneath. The results are for the high-
reputation sample. *, **, and *** denote statistical significance at the 0.05, 0.01, and 0.001 levels, respectively, for a two-tailed
test. ENV_REP = Environmental reputation which is proxied for by Newsweek’s 2010 environmental reputation score.;
ENV_PER = Environmental performance which is proxied for by Newsweek’s 2010 environmental impact score. ENV_MGMT
= Environmental management which is proxied for by Newsweek’s 2010 environmental policies score. HI_POL= Dichotomous
variable equal to 1 if a firm belongs to an industry which releases relatively high amount of pollutants and 0 otherwise. SIZE =
Firm size which is measured by total equity in 2010. HI_TECH = Dichotomous variable equal to 1 if a firm belongs to a high-
technology. FORTUNE = Dichotomous variable equal to 1 if a firm is included in Fortune 2010 list of America’s Most Admired
Companies in 2010.
IV (predicted sign) Model 1 Model 2 Model 3 Model 4
Intercept 32.641***
(7.469)
31.631***
(7.802)
26.717***
(7.148)
25.090***
(7.469)
E_PERF
(+)
0.019
(0.041)
0.029
(0.038)
E_MGMT
(+)
0.208***
(0.050) 0.211***
(0.050)
HI_POL
(+/-)
1.825
(2.179)
2.168
(2.307)
1.686
(2.043)
2.212
(2.159)
SIZE
(+/-)
6.341***
(1.985)
6.366**
(1.992)
5.503**
(1.872) 5.532**
(1.876)
HIGH_TECH
(+/-)
-1.873
(2.326)
-2.396
(2.590)
-4.533*
(2.273) -5.370*
(2.526)
FORTUNE
(+/-)
6.128**
(2.199)
5.912**
(2.254)
4.673*
(2.091) 4.323*
(2.144)
N 123 123 123 123
Adj. R-Squares 0.154 0.149 0.257 0.254

78
APPENDIX E:
Table 5
Summary of Regression Analysis to Test Impact of Environmental Management (H2) and
Environmental Performance (H1) on Environmental Reputation
Low-Reputation Sample
ENV_REP = β0 + Β1 ENV_PERF + Β2 ENV_MGMT + Β3 HI_POL + Β4 SIZE +
Β5 HIGH_TECH + Β6 FORTUNE + Ԑ
NOTE: Unstandardized coefficients (B) are given with standard errors in parentheses underneath. The results are for the low-
reputation sample. *, **, and *** denote statistical significance at the 0.05, 0.01, and 0.001 levels, respectively, for a two-tailed
test. ENV_REP = Environmental reputation which is proxied for by Newsweek’s 2010 environmental reputation score.
ENV_PER = Environmental performance which is proxied for by Newsweek’s 2010 environmental impact score. ENV_MGMT
= Environmental management which is proxied for by Newsweek’s 2010 environmental policies score. HI_POL= dichotomous
variable equal to 1 if a firm belongs to an industry which releases relatively high amount of pollutants and 0 otherwise; SIZE =
Firm size which is measured by total equity in 2010. HI_TECH = Dichotomous variable equal to 1 if a firm belongs to a high-
technology. FORTUNE = Dichotomous variable equal to 1 if a firm is included in Fortune 2010 list of America’s Most Admired
Companies in 2010.
IV (predicted sign) Model 1 Model 2 Model 3 Model 4
Intercept 30.954***
(5.446)
26.942***
(5.567)
29.749***
(5.446)
26.676***
(5.566)
E_PERF
(+)
0.081*
(0.032)
0.071*
(0.033)
E_MGMT
(+)
0.076
(0.043)
0.050
(0.044)
HI_POL
(+/-)
-1.030
(1.390)
1.600
(1.706)
-0.888
(1.382)
1.351
(1.719)
SIZE
(+/-)
2.247
(1.520)
2.053
(1.494)
1.838
(1.526)
1.811
(1.507)
HIGH_TECH
(+/-)
2.468
(1.752)
0.911
(1.823)
2.581
(1.739)
1.187
(1.837)
FORTUNE
(+/-)
0.587
(1.507)
0.102
(1.491)
0.169
(1.514)
-0.108
(1.501)
N 148 148 148 148
Adj. R-Squares 0.013 0.050 0.028 0.052
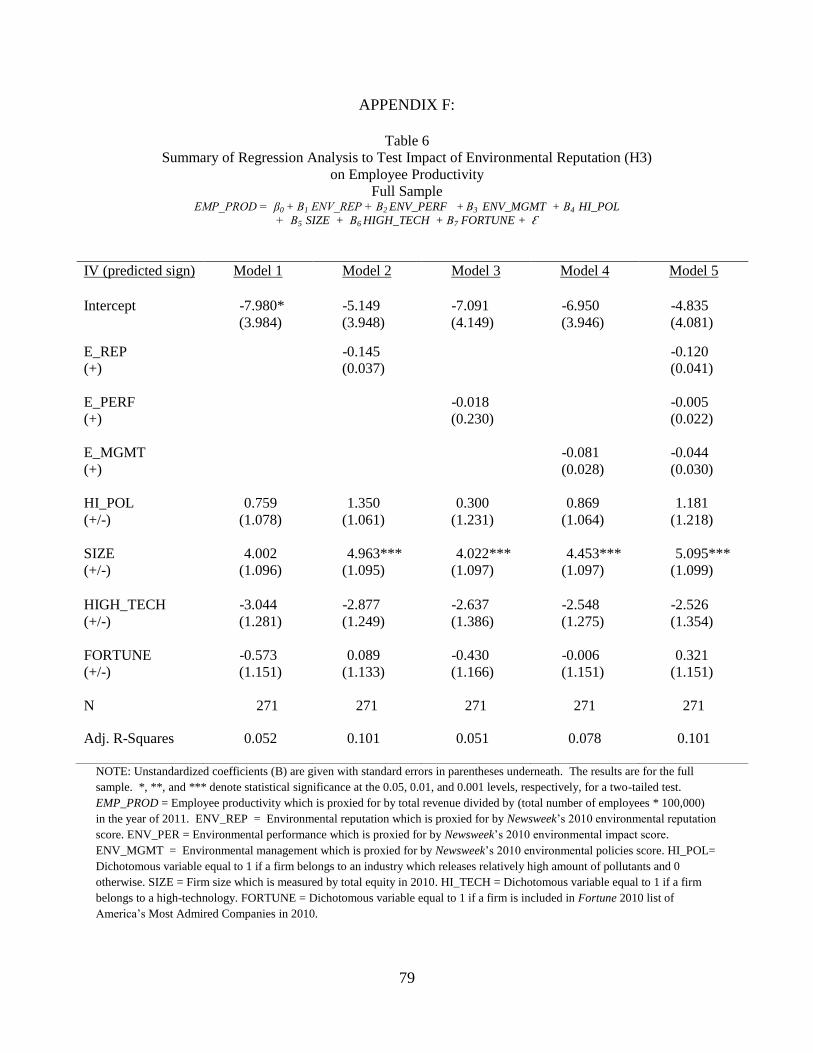
79
APPENDIX F:
Table 6
Summary of Regression Analysis to Test Impact of Environmental Reputation (H3)
on Employee Productivity
Full Sample EMP_PROD = β0 + Β1 ENV_REP + Β2 ENV_PERF + Β3 ENV_MGMT + Β4 HI_POL
+ Β5 SIZE + Β6 HIGH_TECH + Β7 FORTUNE + Ԑ
NOTE: Unstandardized coefficients (B) are given with standard errors in parentheses underneath. The results are for the full
sample. *, **, and *** denote statistical significance at the 0.05, 0.01, and 0.001 levels, respectively, for a two-tailed test.
EMP_PROD = Employee productivity which is proxied for by total revenue divided by (total number of employees * 100,000)
in the year of 2011. ENV_REP = Environmental reputation which is proxied for by Newsweek’s 2010 environmental reputation
score. ENV_PER = Environmental performance which is proxied for by Newsweek’s 2010 environmental impact score.
ENV_MGMT = Environmental management which is proxied for by Newsweek’s 2010 environmental policies score. HI_POL=
Dichotomous variable equal to 1 if a firm belongs to an industry which releases relatively high amount of pollutants and 0
otherwise. SIZE = Firm size which is measured by total equity in 2010. HI_TECH = Dichotomous variable equal to 1 if a firm
belongs to a high-technology. FORTUNE = Dichotomous variable equal to 1 if a firm is included in Fortune 2010 list of
America’s Most Admired Companies in 2010.
IV (predicted sign) Model 1 Model 2 Model 3 Model 4 Model 5
Intercept -7.980*
(3.984)
-5.149
(3.948)
-7.091
(4.149)
-6.950
(3.946)
-4.835
(4.081)
E_REP
(+)
-0.145
(0.037)
-0.120
(0.041)
E_PERF
(+)
-0.018
(0.230)
-0.005
(0.022)
E_MGMT
(+)
-0.081
(0.028)
-0.044
(0.030)
HI_POL
(+/-)
0.759
(1.078)
1.350
(1.061)
0.300
(1.231)
0.869
(1.064)
1.181
(1.218)
SIZE
(+/-)
4.002
(1.096)
4.963***
(1.095)
4.022***
(1.097)
4.453***
(1.097)
5.095***
(1.099)
HIGH_TECH
(+/-)
-3.044
(1.281)
-2.877
(1.249)
-2.637
(1.386)
-2.548
(1.275)
-2.526
(1.354)
FORTUNE
(+/-)
-0.573
(1.151)
0.089
(1.133)
-0.430
(1.166)
-0.006
(1.151)
0.321
(1.151)
N 271 271 271 271 271
Adj. R-Squares 0.052 0.101 0.051 0.078 0.101

80
APPENDIX G:
Table 7
Summary of Regression Analysis to Test Impact of Environmental Reputation (H3)
on Employee Productivity
High-Reputation Sample EMP_PROD = β0 + Β1 ENV_REP + Β2 ENV_PERF + Β3 ENV_MGMT + Β4 HI_POL
+ Β5 SIZE + Β6 HIGH_TECH + Β7 FORTUNE + Ԑ
NOTE: Unstandardized coefficients (B) are given with standard errors in parentheses underneath. The results are for the high-
reputation sample. *, **, and *** denote statistical significance at the 0.05, 0.01, and 0.001 levels, respectively, for a two-tailed
test. EMP_PROD = Employee productivity which is proxied for by total revenue divided by (total number of employees *
100,000) in the year of 2011. ENV_REP = Environmental reputation which is proxied for by Newsweek’s 2010 environmental
reputation score. ENV_PER = Environmental performance which is proxied for by Newsweek’s 2010 environmental impact
score. ENV_MGMT = Environmental management which is proxied for by Newsweek’s 2010 environmental policies score.
HI_POL= Dichotomous variable equal to 1 if a firm belongs to an industry which releases relatively high amount of pollutants
and 0 otherwise. SIZE = Firm size which is measured by total equity in 2010. HI_TECH = Dichotomous variable equal to 1 if a
firm belongs to a high-technology. FORTUNE = Dichotomous variable equal to 1 if a firm is included in Fortune 2010 list of
America’s Most Admired Companies in 2010.
IV (predicted sign) Model 1 Model 2 Model 3 Model 4 Model 5
Intercept -5.461
(3.771)
-1.371
(3.954)
-4.860
(3.937)
-3.274
(3.730)
-0.245
(4.043)
E_REP
(+)
-0.125
(0.045)
-0.087
(0.048)
E_PERF
(+)
-0.011
(0.021)
-0.013
(0.020)
E_MGMT
(+)
-0.077
(0.026)
-0.060
(0.028)
HI_POL
(+/-)
1.267
(1.100)
1.496
(1.073)
1.063
(1.164)
1.319
(1.066)
1.240
(1.121)
SIZE
(+/-)
2.783
(1.002)
3.577
(1.016)
2.768
(1.005)
3.092
(0.977)
3.560**
(1.005)
HIGH_TECH
(+/-)
-1.953
(1.174)
-2.187
(1.146)
-1.642
(1.307)
-0.971
(1.186)
-1.007
(1.331)
FORTUNE
(+/-)
0.218
(1.110)
0.986
(1.115)
0.346
(1.138)
0.755
(1.091)
1.313
(1.127)
N 123 123 123 123 123
Adj. R-Squares 0.057 0.107 0.051 0.114 0.128
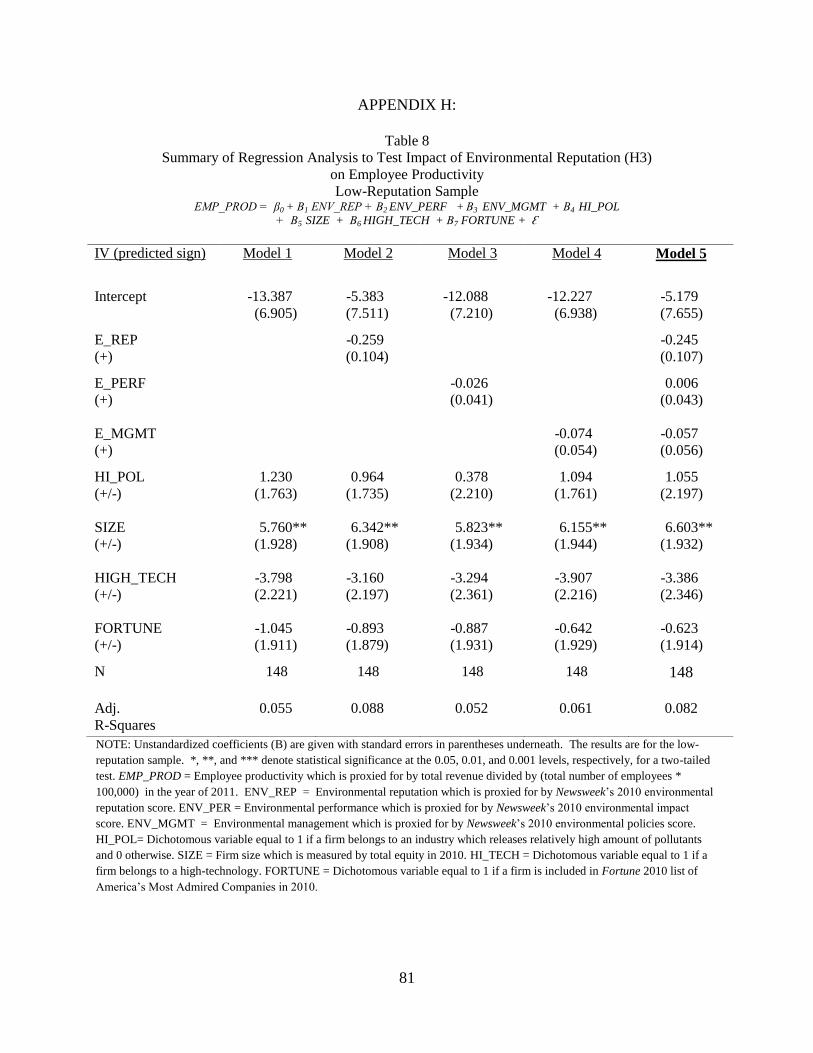
81
APPENDIX H:
Table 8
Summary of Regression Analysis to Test Impact of Environmental Reputation (H3)
on Employee Productivity
Low-Reputation Sample EMP_PROD = β0 + Β1 ENV_REP + Β2 ENV_PERF + Β3 ENV_MGMT + Β4 HI_POL
+ Β5 SIZE + Β6 HIGH_TECH + Β7 FORTUNE + Ԑ
NOTE: Unstandardized coefficients (B) are given with standard errors in parentheses underneath. The results are for the low-
reputation sample. *, **, and *** denote statistical significance at the 0.05, 0.01, and 0.001 levels, respectively, for a two-tailed
test. EMP_PROD = Employee productivity which is proxied for by total revenue divided by (total number of employees *
100,000) in the year of 2011. ENV_REP = Environmental reputation which is proxied for by Newsweek’s 2010 environmental
reputation score. ENV_PER = Environmental performance which is proxied for by Newsweek’s 2010 environmental impact
score. ENV_MGMT = Environmental management which is proxied for by Newsweek’s 2010 environmental policies score.
HI_POL= Dichotomous variable equal to 1 if a firm belongs to an industry which releases relatively high amount of pollutants
and 0 otherwise. SIZE = Firm size which is measured by total equity in 2010. HI_TECH = Dichotomous variable equal to 1 if a
firm belongs to a high-technology. FORTUNE = Dichotomous variable equal to 1 if a firm is included in Fortune 2010 list of
America’s Most Admired Companies in 2010.
IV (predicted sign) Model 1 Model 2 Model 3 Model 4 Model 5
Intercept -13.387
(6.905)
-5.383
(7.511)
-12.088
(7.210)
-12.227
(6.938)
-5.179
(7.655)
E_REP
(+)
-0.259
(0.104)
-0.245
(0.107)
E_PERF
(+)
-0.026
(0.041)
0.006
(0.043)
E_MGMT
(+)
-0.074
(0.054)
-0.057
(0.056)
HI_POL
(+/-)
1.230
(1.763)
0.964
(1.735)
0.378
(2.210)
1.094
(1.761)
1.055
(2.197)
SIZE
(+/-)
5.760**
(1.928)
6.342**
(1.908)
5.823**
(1.934)
6.155**
(1.944)
6.603**
(1.932)
HIGH_TECH
(+/-)
-3.798
(2.221)
-3.160
(2.197)
-3.294
(2.361)
-3.907
(2.216)
-3.386
(2.346)
FORTUNE
(+/-)
-1.045
(1.911)
-0.893
(1.879)
-0.887
(1.931)
-0.642
(1.929)
-0.623
(1.914)
N 148 148 148 148 148
Adj.
R-Squares
0.055 0.088 0.052 0.061 0.082

82
APPENDIX I:
Table 9
Summary of Regression Analysis to Test Impact of Environmental Reputation (H4)
and Employee Productivity (H5) on Financial Performance
Full Sample FIN_PERF = β0 + Β1 EMP_PROD + Β2 ENV_REP + Β3 ENV_PERF + Β4 ENV_MGMT + Β5 HI_POL + Β6 SIZE + Β7
HIGH_TECH + Β8 FORTUNE + Ԑ
NOTE: Unstandardized coefficients (B) are given with standard errors in parentheses underneath. The results are for the full
sample. *, **, and *** denote statistical significance at the 0.05, 0.01, and 0.001 levels, respectively, for a two-tailed test.
FIN_PERF = Financial performance which is proxied for by (net income * 100) divided by (total assets in the year of 2011). EMP_PROD =
Employee productivity which is proxied for by total revenue divided by (total number of employees * 100,000) in the year of 2011. ENV_REP =
Environmental reputation which is proxied for by Newsweek’s 2010 environmental reputation score. ENV_PER = Environmental performance
which is proxied for by Newsweek’s 2010 environmental impact score. ENV_MGMT = Environmental management which is proxied for by
Newsweek’s 2010 environmental policies score. HI_POL= Dichotomous variable equal to 1 if a firm belongs to an industry which releases
relatively high amount of pollutants and 0 otherwise. SIZE = Firm size which is measured by total equity in 2010. HI_TECH = dichotomous
variable equal to 1 if a firm belongs to a high-technology. FORTUNE = dichotomous variable equal to 1 if a firm is included in Fortune 2010 list
of America’s Most Admired Companies in 2010.
IV(predicted
sign)
Model 1 Model 2 Model 3 Model 4 Model 5 Model 6
Intercept 16.808***
(2.190)
16.912***
(2.210)
16.668***
(2.232)
17.057***
(2.283)
16.534***
(2.195)
17.065***
(2.316)
EMP_PROD
(+)
0.013
(0.034)
0.021
(0.035)
E_REP
(+)
0.006
(0.021)
-0.003
(0.023)
E_PERF
(+)
-0.005
(0.013)
-0.007
(0.013)
E_MGMT
(+)
0.021
(0.015)
0.025
(0.017)
HI_POL
(+/-)
1.159*
(0.593)
1.149*
(0.594)
1.134*
(0.600)
1.030*
(0.677)
1.130*
(0.592)
0.943*
(0.691)
SIZE
(+/-)
-2.965***
(0.603)
-3.017***
(0.618)
-3.006***
(0.619)
-2.960***
(0.604)
-3.109***
(0.610)
-3.186***
(0.647)
HIGH_TECH
(+/-)
2.079**
(0.704)
2.118**
(0.713)
2.071**
(0.706)
2.193**
(0.762)
1.947**
(0.709)
2.149**
(0.771)
FORTUNE
(+/-)
2.253***
(0.632)
2.260***
(0.634)
2.225***
(0.641)
2.293***
(0.642)
2.102***
(0.641)
2.159***
(0.652)
N 271 271 271 271 271 271
Adj.
R-Squares
0.119 0.117 0.116 0.117 0.122 0.115

83
APPENDIX J:
Table 10
Summary of Regression Analysis to Test Impact of Environmental Reputation (H4)
and Employee Productivity (H5) on Financial Performance
High-Reputation Sample FIN_PERF = β0 + Β1 EMP_PROD + Β2 ENV_REP + Β3 ENV_PERF + Β4 ENV_MGMT + Β5 HI_POL + Β6 SIZE + Β7
HIGH_TECH + Β8 FORTUNE + Ԑ
NOTE: Unstandardized coefficients (B) are given with standard errors in parentheses underneath. The results are for the high-reputation sample.
*, **, and *** denote statistical significance at the 0.05, 0.01, and 0.001 levels, respectively, for a two-tailed test. FIN_PERF = Financial
performance which is proxied for by (net income * 100) divided by (total assets in the year of 2011). EMP_PROD = Employee productivity
which is proxied for by total revenue divided by (total number of employees * 100,000) in the year of 2011. ENV_REP = Environmental
reputation which is proxied for by Newsweek’s 2010 environmental reputation score. ENV_PER = Environmental performance which is proxied
for by Newsweek’s 2010 environmental impact score. ENV_MGMT = Environmental management which is proxied for by Newsweek’s 2010
environmental policies score. HI_POL= Dichotomous variable equal to 1 if a firm belongs to an industry which releases relatively high amount of
pollutants and 0 otherwise. SIZE = Firm size which is measured by total equity in 2010. HI_TECH = dichotomous variable equal to 1 if a firm
belongs to a high-technology. FORTUNE = dichotomous variable equal to 1 if a firm is included in Fortune 2010 list of America’s Most
Admired Companies in 2010.
IV(predicted sign) Model 1 Model 2 Model 3 Model 4 Model 5 Model 6
Intercept 14.789***
(3.001)
15.446***
(3.006)
10.758***
(3.092)
14.328***
(3.134)
14.021***
(3.055)
10.466***
(3.131)
EMP_PROD
(+)
0.120
(0.073)
0.204**
(0.072)
E_REP
(+)
0.123***
(0.035)
0.139***
(0.038)
E_PERF
(+)
0.009
(0.016)
0.009
(0.015)
E_MGMT
(+)
0.027
(0.021)
0.014
(0.022)
HI_POL
(+/-)
0.015
(0.875)
-0.138
(0.874)
-0.211
(0.839)
0.171
(0.927)
-0.003
(0.873)
-0.344
(0.872)
SIZE
(+/-)
-2.351**
(0.798)
-2.686***
(0.817)
-3.135***
(0.794)
-2.340**
(0.800)
-2.460**
(0.800)
-3.847***
(0.819)
HIGH_TECH
(+/-)
2.923**
(0.935)
3.158***
(0.939)
3.155***
(0.896)
2.685*
(1.040)
2.579**
(0.972)
3.150**
(1.033)
FORTUNE
(+/-)
2.551**
(0.883)
2.524**
(0.877)
1.794*
(0.872)
2.452**
(0.905)
2.362**
(0.894)
1.450
(0.878)
N 123 123 123 123 123 123
Adj.
R-Squares
0.140 0.153 0.215 0.135 0.145 0.248
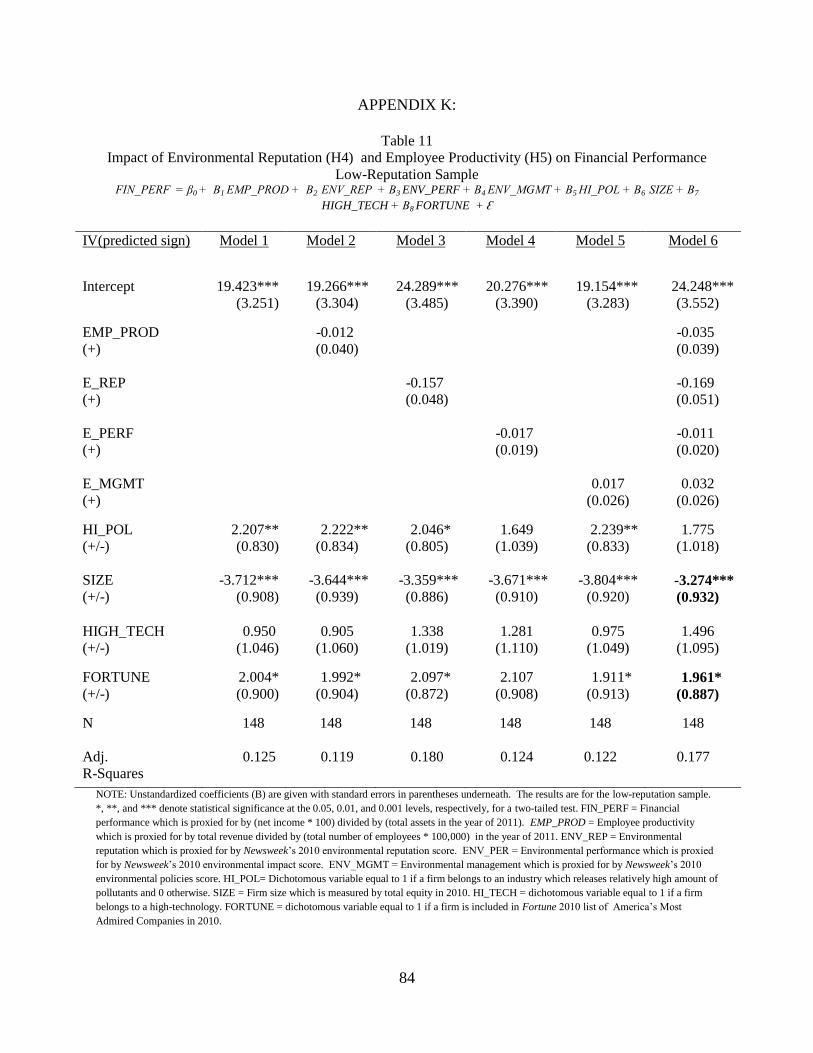
84
APPENDIX K:
Table 11
Impact of Environmental Reputation (H4) and Employee Productivity (H5) on Financial Performance
Low-Reputation Sample FIN_PERF = β0 + Β1 EMP_PROD + Β2 ENV_REP + Β3 ENV_PERF + Β4 ENV_MGMT + Β5 HI_POL + Β6 SIZE + Β7
HIGH_TECH + Β8 FORTUNE + Ԑ
NOTE: Unstandardized coefficients (B) are given with standard errors in parentheses underneath. The results are for the low-reputation sample.
*, **, and *** denote statistical significance at the 0.05, 0.01, and 0.001 levels, respectively, for a two-tailed test. FIN_PERF = Financial
performance which is proxied for by (net income * 100) divided by (total assets in the year of 2011). EMP_PROD = Employee productivity
which is proxied for by total revenue divided by (total number of employees * 100,000) in the year of 2011. ENV_REP = Environmental
reputation which is proxied for by Newsweek’s 2010 environmental reputation score. ENV_PER = Environmental performance which is proxied
for by Newsweek’s 2010 environmental impact score. ENV_MGMT = Environmental management which is proxied for by Newsweek’s 2010
environmental policies score. HI_POL= Dichotomous variable equal to 1 if a firm belongs to an industry which releases relatively high amount of
pollutants and 0 otherwise. SIZE = Firm size which is measured by total equity in 2010. HI_TECH = dichotomous variable equal to 1 if a firm
belongs to a high-technology. FORTUNE = dichotomous variable equal to 1 if a firm is included in Fortune 2010 list of America’s Most
Admired Companies in 2010.
IV(predicted sign) Model 1 Model 2 Model 3 Model 4 Model 5 Model 6
Intercept 19.423***
(3.251)
19.266***
(3.304)
24.289***
(3.485)
20.276***
(3.390)
19.154***
(3.283)
24.248***
(3.552)
EMP_PROD
(+)
-0.012
(0.040)
-0.035
(0.039)
E_REP
(+)
-0.157
(0.048)
-0.169
(0.051)
E_PERF
(+)
-0.017
(0.019)
-0.011
(0.020)
E_MGMT
(+)
0.017
(0.026)
0.032
(0.026)
HI_POL
(+/-)
2.207**
(0.830)
2.222**
(0.834)
2.046*
(0.805)
1.649
(1.039)
2.239**
(0.833)
1.775
(1.018)
SIZE
(+/-)
-3.712***
(0.908)
-3.644***
(0.939)
-3.359***
(0.886)
-3.671***
(0.910)
-3.804***
(0.920) -3.274***
(0.932)
HIGH_TECH
(+/-)
0.950
(1.046)
0.905
(1.060)
1.338
(1.019)
1.281
(1.110)
0.975
(1.049)
1.496
(1.095)
FORTUNE
(+/-)
2.004*
(0.900)
1.992*
(0.904)
2.097*
(0.872)
2.107
(0.908)
1.911*
(0.913) 1.961*
(0.887)
N 148 148 148 148 148 148
Adj.
R-Squares
0.125 0.119 0.180 0.124 0.122 0.177

85
APPENDIX L:
Table 12
Recap of Results of Hypotheses Testing
Hypothesis
Results
Accept Reject
H1: Environmental performance is positively associated with environmental reputation
Full Sample X
High-Reputation Sample X
Low-Reputation Sample X
H2:Environmental management is positively associated with environmental reputation
Full Sample X
High-Reputation Sample X
Low-Reputation Sample X
H3: Environmental reputation positively associated with employee productivity
Full Sample X
High-Reputation Sample X
Low-Reputation Sample X
H4: Environmental reputation is positively associated with financial performance
Full Sample X
High-Reputation Sample X
Low-Reputation Sample X
H5: Employee productivity is positively associated with financial performance
Full Sample X
High-Reputation Sample X
Low-Reputation Sample X
NOTE: This table recaps the results of the hypotheses testing for H1, H2, H3, H4, and H5 for the full, high-reputation, and low-
reputation samples.

86
VITA
Graduate School
Southern Illinois University
Young Soo Shim
Hanyang University in Seoul, South Korea
Bachelor of Science, in Architectural Engineering, August, 1978
Southern Illinois University Carbondale
Master of Arts in Journalism, May, 1998
Southern Illinois University Carbondale
Doctor of Philosophy in Mass Communication and Media Arts, December, 2004
Southern Illinois University Carbondale
Bachelor of Science in Information Systems and Technology, May 2009
Southern Illinois University Carbondale
Master of Arts in Accounting, May, 2010
Dissertation Title: Investigating the Determinants and Endogenous Influences of Environmental
Reputation
Major Professor: Royce D. Burnett