investigating the effect of utilizing learning …
TRANSCRIPT

INVESTIGATING THE EFFECT OF UTILIZING LEARNING ANALYTICS ON
STEM TEACHERS’ EFFICACY, RESILIENCY, AND
DATA ANALYTICS KNOWLEDGE
by
Cheng Yu Lin
Dissertation Committee:
Professor Sandra Okita, Sponsor Professor Jin Kuwata
Approved by the Committee on the Degree of Doctor of Education
Date: October 21, 2020
Submitted in partial fulfillment of the requirements for the Degree of Doctor in Education in
Teachers College, Columbia University
2020

ABSTRACT
INVESTIGATING THE EFFECT OF UTILIZING LEARNING ANALYTICS ON
STEM TEACHERS’ EFFICACY, RESILIENCY, AND
DATA ANALYTICS KNOWLEDGE
Cheng Yu Lin
High novice teacher turnover rate and shortage of skilled novice teachers continue
to be an unsolved issue in the U.S. educational system. Novice teachers often suffer low
teaching efficacy which may reduce their teacher resiliency and lead to teacher turnover.
Past studies suggested that novice teachers’ low teaching efficacy results from their scant
teaching experience and their inability to assess impacts of their teaching on students.
The failure for novice teachers to utilize effective pedagogies and improve student
learning often results in elevated professional anxiety, frustration, and motivation to quit
teaching. Recent studies pointed out that learning analytics could help novice teachers to
teach more effectively by tapping into student data and data analytics. But how to
structure a professional development for novice teachers to learn to utilize learning
analytics in teaching remains a question. To address these issues, a survey study and a
case study are conducted in this research. The survey study analyzed 72 teachers’
perceptions and experience of using learning analytics in teaching. The results indicated
common barriers for teachers to use learning analytics such as lack of awareness of
learning analytics, insufficient computer skills and math/statistics knowledge. Also, when

teachers considered learning analytics useful, their usage of learning analytics correlated
positively with teaching efficacy and teacher resiliency. Built upon insights from the
survey study, the case study recruited five novice teachers and investigated the effects of
a learning analytics professional development.
The results suggested that after the learning analytics professional development,
all participants have generally improved their learning analytics knowledge, teaching
efficacy, teacher resiliency, and developed higher confidence and intention to use
learning analytics in future teaching. One implication of these results is that using
teaching scenario could be an effective format to structure learning analytics professional
development to improve novice teachers’ competence in assessing teaching practices and
their teaching efficacy. Another implication is that learning analytics professional
development could be implemented as intervention in teacher education programs to
reduce the likelihood of teacher turnover before novice teachers start teaching formally.

ii
© Copyright Cheng Yu Lin 2020
All Rights Reserved

iii
ACKNOWLEDGEMENTS
Throughout the writing of this doctoral dissertation I have received a great deal of
support and assistance.
I would first like to thank my advisor, Dr. Sandra Okita, who worked tirelessly to
mentor me throughout this dissertation research. I have benefited largely from every
discussion I had with her in terms of not only this particular dissertation but also
experimental methodologies in general. I would also like to thank Dr. Okita for her
encouragement and inspiration along this dissertation writing process. It is her
wholehearted support that helped me power through the most challenging moments in
this journey.
I also want to thank Dr. Jin Kuwata for his encouragement and advice on my
dissertation research. I will miss the late nights that we worked in the i-Design office and
the fun academic and casual conversations we had together. I also want to thank all of my
fellows from the GIZMO EdTech Lab. I will not be able to finish my doctoral study
without your support, help, and the jokes as a family. I would like to show my
appreciation for the Instructional Technology & Media Program and Teachers College. I
have received so much inspiration through my coursework, projects, and discussions with
many brilliant colleagues at Teachers College which culminated in my research ideas in
this dissertation
Last but not least, I want to thank my wife Natalie and my son Edison for their
infinite support and overwhelming love. There were many unexpected turns and tough
times during my doctoral study in New York City, and I won’t be able to complete my
doctoral degree without you. I love you both, Natalie and Edison. CYL
iv
TABLE OF CONTENTS
Chapter I – INTRODUCTION ............................................................................................ 1 Statement of the Problem ........................................................................................ 2 Purpose of the Study ................................................................................................ 4 Research Questions ................................................................................................. 5 Chapter II – LITERATURE REVIEW ................................................................................ 7 High Teacher Turnover Rates and Teacher Shortage .............................................. 7 Challenges in Teaching Practices Among Preservice and Novice Teachers in Comparison to Experienced Teachers ..................................................... 9 Importance of Teaching Efficacy, Teacher Resiliency, and Professional Development .............................................................................................. 12 The Use of Learning Analytics and Educational Data Mining for Pedagogical Improvement ......................................................................... 16 Suggested Approach to Professional Development in Learning Analytics with Novice Teachers ................................................................................ 19 Chapter III – LEARNING ANALYTICS SURVEY STUDY .......................................... 22 Methodology .......................................................................................................... 22 Participants ................................................................................................ 23 Procedure ................................................................................................... 23 Measures .................................................................................................... 24 Learning Analytics Survey ............................................................ 24 Technological and pedagogical Knowledge (TPK) Questionnaire ............................................................................ 26 Teaching Efficacy Questionnaire .................................................. 26 Results ................................................................................................................... 27 Sub-question 1: How Commonly Do In-Service and Preservice STEM Teachers Use Learning Management Systems and Learning Analytics? ...................................................................................... 27 Usage gap between in-service and preservice teachers regarding LMS .......................................................................... 27 Most commonly used platforms .................................................... 30 Sub-question 2: What Are the Barriers to Teachers in Using Learning Analytics? ...................................................................................... 30 Barriers to using LMS learning analytics ...................................... 30 Perceived usefulness of LMS learning analytics between in-service and preservice teachers ............................................. 31 Sub-question 3: What Are the In-service and Preservice Teachers’ Perceptions of Their Technological Pedagogical Knowledge and Teaching Efficacy? ................................................................. 32 Comparison of technological pedagogical knowledge (TPK) ....... 32 Comparison of teaching efficacy ................................................... 33 Intention to quit teaching ............................................................... 34

v
Chapter III (continued) Sub-question 4: How Are These Barriers and Usage of Learning Analytics Related to In-Service Teachers’ Perceptions of Their Technological Pedagogical Knowledge and Teaching Efficacy? . 36 Perceived usefulness of LMS/learning analytics ........................... 37 School workload, professional development, support from school leadership ....................................................................... 37 TPK and teaching efficacy ............................................................ 38 Number of LMS/learning analytics functions use ......................... 38 Correlations between number of LMS/learning analytics functions use and TPK ............................................................... 39 Correlations between number of LMS/learning analytics functions use and teaching efficacy ........................................... 39 In-service teachers’ perceptions of LMS/learning analytics usefulness, actual use of LMS learning analytics, and TPK/teaching efficacy ............................................................... 40 Discussion .............................................................................................................. 42 Gap Between Preservice and In-service Teachers Regarding LMS Use ... 42 Reasons for Not using Learning Analytics ................................................ 43 Technological Pedagogical K knowledge (TPK): Gap Due to Experience of Using Technologies to Teach ................................. 45 Teaching Efficacy: Gap Due to Lack of Confidence of Assessing Students’ Learning ......................................................................... 45 Intention to Quit Teaching ......................................................................... 47 Insights from In-service Teachers ............................................................. 47 Chapter IV – CASE STUDY ............................................................................................. 51 Methodology .......................................................................................................... 52 Participants ................................................................................................ 52 Procedure ................................................................................................... 54 Common Structure Across All Learning Analytics Tutorials and Activities ........................................................................................ 56 Engaging in one-to-one interactive session with facilitator .......... 56 Hands-on learning analytics exercises ........................................... 56 Learning analytics embedded in a teaching scenario .................... 57 First week of learning analytics professional development .......... 58 Second week of learning analytics professional development ...... 59 Third week of learning analytics professional development ......... 60 Measures ................................................................................................................ 62 Survey Packet: PK, TPK, Teaching Efficacy, Teacher Resiliency ........... 62 Interview questions .................................................................................... 64 General Scenario Question from the Case Study ...................................... 64 Learning Analytics Knowledge and Skill Questions ................................. 65

vi
Chapter IV (continued) Results of the Case Study ...................................................................................... 68 Sub-question 1: At the Group Level, Can Professional Development in Learning Analytics Assist Novice Teachers in Developing Skills to Assess Teaching Practices and Student Performance? ... 68 Learning gains after the 3-week learning analytics professional development sessions ................................................................ 68 Learning analytics knowledge increase by tutorial topic .............. 70 Learning analytics knowledge increase by question levels ........... 72 Sub-question 2: At the Group Level, How Does Professional Development in Learning Analytics Influence Novice Teachers’ Pedagogical Knowledge (PK), Technological Pedagogical Knowledge (TPK), Teaching Efficacy, and Teacher Resiliency? ....................................................................... 75 Profile and Learning Progress Description for Individual Teachers in the Case Study ........................................................................... 80 Abby ............................................................................................... 80 Betty ............................................................................................... 86 Cindy .............................................................................................. 92 Daisy .............................................................................................. 98 Ellen ............................................................................................. 104 Power Analysis for a Relevant Future Study ...................................................... 109 Chapter V – GENERAL DISCUSSION ......................................................................... 111 Benefits of Applying Teaching Scenario in Learning Analytics Professional Development ....................................................................... 111 Influence of Teaching Experience on PK ............................................................ 114 Prior Experience of Using LMS Learning Analytics to Moderate Growth of TPK ........................................................................................ 115 Confidence and Intention to Apply Learning Analytics to Teaching .................. 116 Limitations and Future Research ......................................................................... 119 Implications ......................................................................................................... 121 Summary .............................................................................................................. 124 REFERENCES ................................................................................................................ 125

vii
APPENDICES Appendix A Questionnaire ........................................................................................... 132 Appendix B Demographic and Basic Information Survey .......................................... 138 Appendix C Week 1: Pretest Survey ........................................................................... 141 Appendix D Learning Analytics Activity .................................................................... 155 Appendix E Interview Questions ................................................................................. 156 Appendix F Getting Familiar with Student Data ......................................................... 157 Appendix G Week 2: Tutorial ...................................................................................... 162 Appendix H Week 2: Survey ....................................................................................... 170 Appendix I Week 3: Tutorial ...................................................................................... 175 Appendix J Week 3: Posttest Survey .......................................................................... 181

viii
LIST OF TABLES
Table 1 Reasons for Not Using MLS Learning Analytics .................................................. 31 2 Categorization of Teaching Efficacy Measure Questions ..................................... 46 3 Learning Analytics Professional Development ..................................................... 55 4 Overview of Measures Used in the Exploratory Case Study ................................ 61

ix
LIST OF FIGURES
Figure 1 Comparison of General LMS Functions Use (%) ................................................. 28 2 Comparison of Learning Analytics Features Use (%) ........................................... 29 3 Aspects of Student Learning That Teachers Think LMS Data Can Reflect ......... 30 4 Is LMS Learning Analytics Useful in Teaching/Curriculum Design? .................. 32 5 Comparison of Technological Pedagogical Knowledge (TPK) ............................ 33 6 Comparison of Teaching Efficacy ......................................................................... 34 7 Comparison of Intention to Quit as a Teacher ....................................................... 35 8 Example of Basic-level Learning Analytics Question .......................................... 66 9 Example of Inference-level Learning Analytics Question .................................... 67 10 Example of Applied-level Learning Analytics Question ...................................... 67 11 Change in Learning Analytics Knowledge after Learning Analytics Professional Development for All Participants ..................................................... 69 12 Change in Learning Analytics Knowledge by Subject: Mean and median ........... 70 13 Change in Learning Analytics Knowledge by Subject: Variance and Correlation ............................................................................................................. 71 14 Change in Learning Analytics Knowledge by Subject: Regression ...................... 72 15 Change in Learning Analytics Knowledge by Question Type: Basic ................... 73 16 Change in Learning Analytics Knowledge by Question Type: Inference ............. 74 17 Change in Learning Analytics Knowledge by Question Type: Applied ............... 75 18 Average Change in PK, TPK, Teacher Resiliency (as a Group) ........................... 76 19 Average Change in PK, TPK, Teaching Efficacy ................................................. 77 20 Comparison of PK Between Preservice and In-service Teachers ......................... 78

x
Table 21 Comparison of TPK Between Participants ............................................................ 79 22 Change in Abby’s PK and TPK ............................................................................. 81 23 Change in Abby’s Teaching Efficacy .................................................................... 82 24 Change in Abby’s Teacher Resiliency ................................................................... 82 25 Change in Betty’s PK and TPK ............................................................................. 89 26 Change in Betty’s Teaching Efficacy .................................................................... 90 27 Change in Betty’s Teacher Resiliency ................................................................... 90 28 Change in Cindy’s PK and TPK ............................................................................ 94 29 Change in Cindy’s Teacher Efficacy ..................................................................... 94 30 Change in Cindy’s Teacher Resiliency .................................................................. 95 31 Change in Daisy’s PK and TPK .......................................................................... 100 32 Change in Daisy’s Teaching Efficacy ................................................................. 101 33 Change in Daisy’s Teacher Resiliency ................................................................ 101 34 Change in Ellen’s PK and TPK ........................................................................... 105 35 Change in Ellen’s Teaching Efficacy .................................................................. 106 36 Change in Ellen’s Teacher Resiliency ................................................................. 106

1
Chapter I
INTRODUCTION
Our inability to support high-quality teaching in many of our schools is driven not by too few teachers coming in, but by too many going out. We need to balance our efforts to prepare high-quality teachers with strong strategies to support good teaching in our schools. (Tom Carroll, National Commission on Teaching & America’s Future [NCTAF] Report, 2003)
There is continuing high demand for skilled teachers in the Science, Technology,
Engineer, Mathematics (STEM) subject areas, but the chronic shortage of qualified
STEM teachers has continued to grow as an unresolved issue in the U.S. educational
system. One reason for this shortage may have to do with the low enrollment in STEM
teacher education programs. STEM majors are often attracted by more lucrative rewards
in job areas other than education. Comparing the 2010 to 2016 school year, total
enrollment in teacher education programs nationwide has decreased by more than one-
third. This suggests a decrease of 340,000 people who could potentially become teachers
during that interval. Even after students have successfully enrolled into a teacher
education program, there is the issue of decreased completion rate. For students who have
joined a STEM teacher education program, a 22% decline was seen between 2012 and
2018 in the number of students who completed their program and began teaching in a
STEM subject area (Partelow, 2019). The number of new STEM teachers entering the
public-school system is declining, and there is an estimate that U.S. schools will be short

2
by 200,000 new teachers every year. By 2025, that number is expected to increase to
316,000 annually (Sutcher, Darling-Hammond, & Carver-Thomas, 2016). This shortage
of teachers is seen across all STEM subject areas. For example, in 2019, there were about
30,000 vacancies for physics teachers nationwide, but only 6,000 students majoring in
physics education.
Statement of the Problem
Even after teachers enter the school system, this teacher shortage continues to
grow, as high teacher turnover rates are seen within the first few years. Of the 9,200 new
teachers entering the school system, more than 39% are likely to leave their jobs within
the first 5 years of teaching (Ingersoll, 2000). This high turnover rate is seen more
frequently among STEM subject teachers. Such loss has cost the U.S. about $7 billion per
year (Sutcher et al., 2016). Marder, Plisch, and Brown (2017) described this as one of the
largest challenges that U.S. public schools are facing, and that teacher shortage is one of
the predominant reasons to explain U.S. students’ low performance on STEM subjects as
seen in international assessments such as PISA and TIMSS (Organisation for Economic
Co-operation and Development [OECD], 2016).
More recently, studies have pointed to the gap between theory and practice in
current teacher education curricula. Loughran (2014) found that many preservice
teachers’ teaching skills are not applicable due to their lack of teaching experience. This
may be due to many teacher training programs shortening their teacher training curricula
and graduating students early to make up for the high demand for new teachers. As a

3
result, student teachers are left with limited experience before they start teaching full-
time (Sutcher et al., 2016).
Limited teacher training and experience have not only led to the lack of teaching
competency but also to the lack of teaching efficacy for novice teachers. Research has
suggested that this lack of teaching efficacy may have triggered elevated stress,
disappointment in work performance, and occupational fatigue in novice teachers,
leading to high teacher turnover rate (Gu & Day, 2013). A plethora of studies has
suggested that building teaching efficacy can lead to higher teacher resiliency (Coladarci,
1992; Evans & Tribble, 1986; Gibson & Dembo, 1984). Studies have found that resilient
teachers often have high self-efficacy in teaching (Gu & Day, 2013). Teaching efficacy
has been described as “a little idea with big impact” on teacher resiliency, and an
especially important ability for novice teachers to develop as they begin their teaching
career (Kitching, 2009; Tait, 2008; Tschannen-Moran & Hoy, 2007). These studies have
revealed that for both preservice and in-service teachers, having high teaching efficacy
can increase their commitment to teaching and possibly reduce teacher turnover.
Many studies have focused on utilizing different formats of professional
development to enhance teachers’ pedagogical competence (Colbert, Brown, Choi, &
Thomas, 2008; Donna, 2013; Grigg, Kelly, Gamoran, & Borman, 2012; Heller, Daehler,
Wong, Shinohara, & Miratrix, 2012), but these studies have focused heavily on in-service
teachers but not preservice or novice teachers. While these research findings are
informative in terms of their approaches to increase in-service teachers’ teaching skills,
Ingersoll (2000) pointed out that experienced teachers tend to be concerned about their
relationship with the parents and school leadership, while novice teachers are more
4
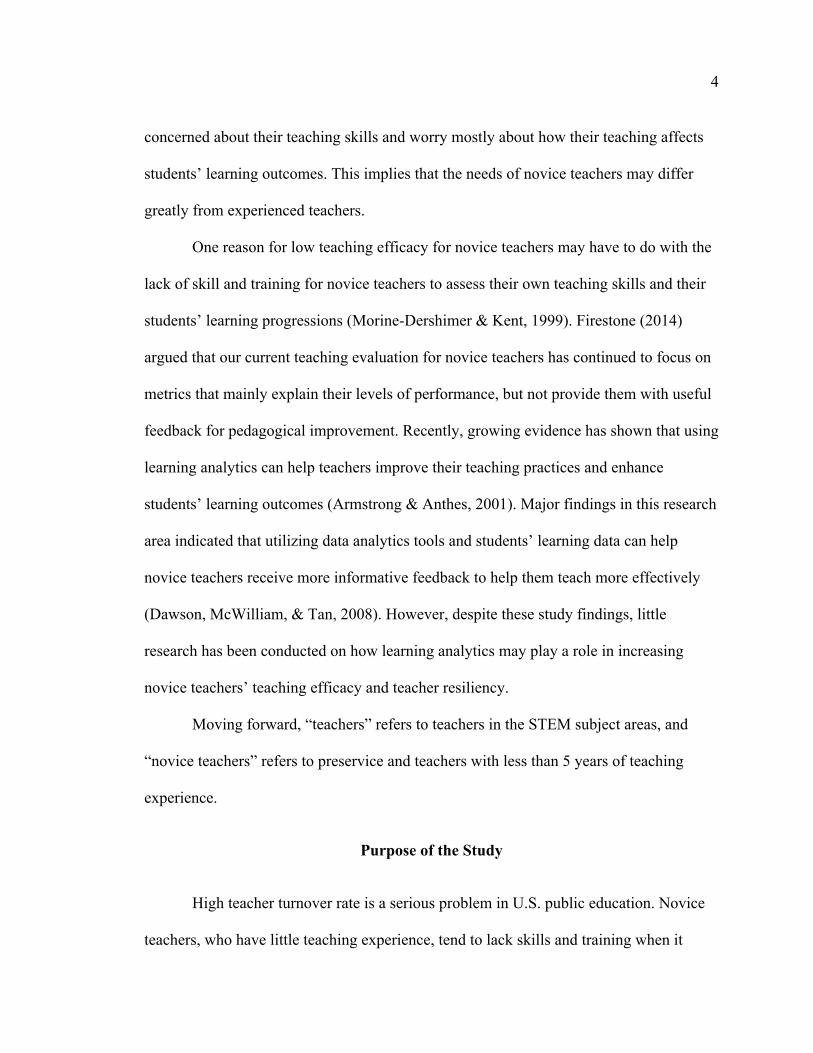
concerned about their teaching skills and worry mostly about how their teaching affects
students’ learning outcomes. This implies that the needs of novice teachers may differ
greatly from experienced teachers.
One reason for low teaching efficacy for novice teachers may have to do with the
lack of skill and training for novice teachers to assess their own teaching skills and their
students’ learning progressions (Morine-Dershimer & Kent, 1999). Firestone (2014)
argued that our current teaching evaluation for novice teachers has continued to focus on
metrics that mainly explain their levels of performance, but not provide them with useful
feedback for pedagogical improvement. Recently, growing evidence has shown that using
learning analytics can help teachers improve their teaching practices and enhance
students’ learning outcomes (Armstrong & Anthes, 2001). Major findings in this research
area indicated that utilizing data analytics tools and students’ learning data can help
novice teachers receive more informative feedback to help them teach more effectively
(Dawson, McWilliam, & Tan, 2008). However, despite these study findings, little
research has been conducted on how learning analytics may play a role in increasing
novice teachers’ teaching efficacy and teacher resiliency.
Moving forward, “teachers” refers to teachers in the STEM subject areas, and
“novice teachers” refers to preservice and teachers with less than 5 years of teaching
experience.
Purpose of the Study
High teacher turnover rate is a serious problem in U.S. public education. Novice
teachers, who have little teaching experience, tend to lack skills and training when it

5
comes to assessing their own teaching and their students’ learning performance.
Oftentimes, this may lead to novice teachers having low teaching efficacy and teacher
resiliency (Gibson & Dembo, 1984). This dissertation research examined if learning
analytics professional development can assist teachers in developing skills to assess their
own teaching practices and student performance, and how such skills may influence their
teaching efficacy and teacher resiliency. The main purpose of this research was to see if
learning analytics can serve as an effective intervention to make novice teachers more
professionally resilient.
Research Questions
1. What are the challenges, perspectives, and usage patterns of learning analytics
in STEM teachers/educators, and how does that influence their teaching
efficacy?
2. Can learning analytics professional development assist teachers in developing
skills to assess their own teaching practices and student performance, and how
does such skills and training influence their teaching efficacy and teacher
resiliency?
To answer these two research questions, I conducted a learning analytics survey
study and a case study for this dissertation. The learning analytics survey study explored
the first research question to identify the challenges, perspectives, and usage patterns of
learning analytics for STEM teachers. The findings were used to inform the intervention
design for the case study which explored the second research question.

6
This dissertation is organized in the following sequence. First, I provide a
literature review that leads to the two research questions. Then, I elaborate on the details
and results of the learning analytics survey study to answer the first research question.
Afterwards, I explain the details of the case study and its findings to answer the second
question. This dissertation concludes with a general discussion, research limitation,
implications, and suggestions for future research.

7
Chapter II
LITERATURE REVIEW
In this chapter, I first give an overview on the current high teacher turnover rate
and how it relates to our teacher education system. The next section takes a closer look
on how the needs of novice teachers may differ from experienced teachers, exploring the
challenges novice teachers have in accurately assessing their teaching and their students’
learning outcomes. Later, this review considers how professional development may help
address these issues to increase novice teachers’ teaching efficacy and teacher resiliency.
Finally, I discuss the use of learning analytics in professional development and address
the applicable format to conduct this type of professional development for novice
teachers.
High Teacher Turnover Rates and Teacher Shortage
Several contextual and individual factors could contribute to high teacher
turnover. In this section, I review relevant literature and explain why more research
attention should be paid to novice teachers instead of school administration/leadership in
order to address high teacher turnover and teacher shortage.
Past literature has pointed out that some contextual risk factors affect teachers’
teaching commitment and job retention. Boyd, Grossman, Lankford, Loeb, and Wyckoff

8
(2005) found that school location could affect teacher retention. Teachers who taught at
schools located in high-poverty urban areas tended to leave their teaching sooner than
other teachers. School location also seems to connect with educational resources and
investments, which is another factor that influences teacher turnover. Darling-Hammond
and Carver-Thomas (2017) found that teachers in the southern states exhibited higher
turnover rates than those in the northern states. This difference was due to a smaller class
size and a higher number of investments in educational resources in northeastern states.
These advantages in northeastern states led to less workload, better pedagogical support,
and a higher retention rate for teachers in those regions.
Student demographics and backgrounds are also associated with teacher turnover.
Howard and Johnson (2004) conducted a study on novice teachers who taught a high
portion of disadvantageous students in their class. Common challenges these teachers
encountered included disobedient or violent student behaviors in class on a daily basis.
Howard and Johnson suggested a positive correlation between these teachers’
experiences of coping with these disadvantageous students and their motivation to quit
teaching.
Support from colleagues and school leadership also matters in terms of teacher
retention. When novice teachers perceived they could acquire assistance from school
leadership through professional development and colleague mentoring, they showed a
higher tendency to stay in teaching (Jenkins, Smith, & Maxwell, 2009; Simon & Johnson,
2015). In contrast, Anderson and Olsen (2006) and Yost (2006) found that poor collegial
relationships, lack of teaching resources, and heavy workload contributed largely to
novice teachers’ burnout and turnover.
9
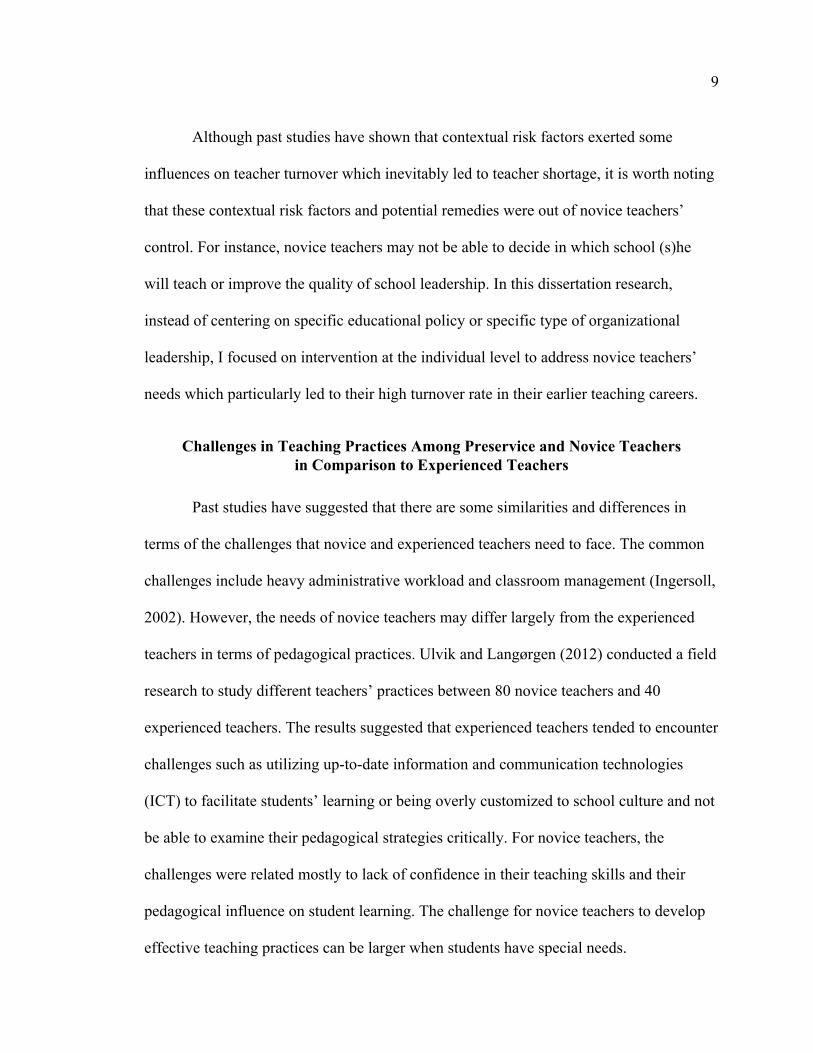
Although past studies have shown that contextual risk factors exerted some
influences on teacher turnover which inevitably led to teacher shortage, it is worth noting
that these contextual risk factors and potential remedies were out of novice teachers’
control. For instance, novice teachers may not be able to decide in which school (s)he
will teach or improve the quality of school leadership. In this dissertation research,
instead of centering on specific educational policy or specific type of organizational
leadership, I focused on intervention at the individual level to address novice teachers’
needs which particularly led to their high turnover rate in their earlier teaching careers.
Challenges in Teaching Practices Among Preservice and Novice Teachers
in Comparison to Experienced Teachers
Past studies have suggested that there are some similarities and differences in
terms of the challenges that novice and experienced teachers need to face. The common
challenges include heavy administrative workload and classroom management (Ingersoll,
2002). However, the needs of novice teachers may differ largely from the experienced
teachers in terms of pedagogical practices. Ulvik and Langørgen (2012) conducted a field
research to study different teachers’ practices between 80 novice teachers and 40
experienced teachers. The results suggested that experienced teachers tended to encounter
challenges such as utilizing up-to-date information and communication technologies
(ICT) to facilitate students’ learning or being overly customized to school culture and not
be able to examine their pedagogical strategies critically. For novice teachers, the
challenges were related mostly to lack of confidence in their teaching skills and their
pedagogical influence on student learning. The challenge for novice teachers to develop
effective teaching practices can be larger when students have special needs.

10
Fantilli and McDougall (2009) pointed out that novice teachers often had
difficulties creating instruction for exceptional students or students who required special
education due to their lack of teaching experience. Novice teachers often feel insecure
and inexperienced, and lack preparation for teaching (Beltman, Mansfield, & Price,
2011). To address novice teachers’ insufficient teaching experience and teaching skills,
some researchers have directed their attention to creating additional assistance for novice
teachers once they start teaching.
Hogan, Rabinowitz, and Craven (2003) contended that support from school
leadership and school districts to provide subject-specific professional development for
novice teachers could help novice teachers transition from their teacher education
programs to formal school teaching. Fantilli and McDougall (2009) emphasized that the
timeframe to onboard a novice teacher is oftentimes short and not enough for a novice
teacher to become familiar with the school culture and teaching curriculum. Novice
teachers’ perception of underpreparedness for teaching could easily overwhelm them, and
this issue could be ameliorated by changing the hiring process (p. 824). These findings
about additional assistance which novice teachers may need are constructive. But it is
worth noting that the timing of remedial strategies is after novice teachers have begun
their teaching careers, and their overwhelming workload, mental burden, work stress, and
challenge to balance their personal and professional life may reduce the effectiveness of
these supports (Beltman et al., 2011). A more productive approach to address novice
teachers’ lack of teaching experience and teaching skills may be examining issues
underlying their teaching practice in their teaching education programs.

11
There are two major issues regarding teaching practice for novice teachers. The
first major issue is that novice teachers often lack constructive feedback on their teaching.
Teaching practice for most novice teachers often involves a structured teaching internship
or practicum, where novice teachers are given the opportunity to practice teaching during
their teacher education programs (Dieker, Hughes, Hynes, & Straub, 2017). Novice
teachers are usually assessed by other senior teachers or mentors which will determine
their qualification to become formal teachers. Firestone (2014) suggested that most of the
current teacher education programs in the United States place an excessive emphasis on
different metrics to evaluate preservice teachers’ teaching performance, but do not give
useful feedback for them to examine their pedagogical impact on students. The second
major issue about teaching practice novice teachers is that novice teachers might not
know how to evaluate the effects of their instructional approach on students. Novice
teachers’ inability to assess their own teaching may lead them to repeat less effective
pedagogies unconsciously (Roberson & Roberson, 2009), or fail to adjust the pace or
depth of their teaching practices for different students (Dieker et al., 2017). The ability to
utilize information and feedback to improve teaching is crucial not only to students’
learning outcomes, but also to novice teachers’ well-being and motivation to teach. Jamil,
Downer, and Pianta (2012) conducted a survey to examine 509 preservice teachers’
performance, well-being, and teachers’ self-efficacy at the beginning of the teaching
practicum and at the end of their teacher education programs. The results showed that
novice teachers’ perceptions of their failure to improve their teaching and using
ineffective pedagogies repeatedly were major contributors to novice teachers’ frustration,
dissatisfaction, low teaching efficacy, and program incompletion.

12
Importance of Teaching Efficacy, Teacher Resiliency, and
Professional Development
Teaching efficacy is important to make novice teachers more resilient in their
teaching careers (Tschannen-Moran & Hoy, 2007). In this section, I review past studies
on how professional development can increase novice teachers’ teaching efficacy and
teacher resiliency. I first describe the concept of teaching efficacy and explain its
connection with teacher resiliency. I also discuss how to utilize professional development
as an approach to potentially enhance novice teachers’ teaching efficacy and resiliency,
and how it can possibly reduce teacher turnover.
Bandura (1993) described self-efficacy as a personal judgment of how well one
can execute courses of action required to deal with prospective situations. According to
Bandura, there are several different ways for individuals to gain self-efficacy, such as
mastery experience of a task, positive psychological feedback, social persuasion (e.g.,
encouragement), and vicarious experience by modeling others’ successful behaviors. The
concept of teaching efficacy was derived from self-efficacy. Teaching efficacy is defined
as a teacher’s belief that one is able to complete various activities, including structuring
and implementing lesson plans, responding to students’ needs during their learning task,
managing the classroom, and applying various teaching practices to improve students’
learning outcomes (Bandura, 1997; Tschannen-Moran & Hoy, 1998). Teaching efficacy
is not a direct measure of one’s competence; instead, it is a measure of a teacher’s
confidence in a projected teaching circumstance within a given context (Hoy, 2000).
Resilience was described as positive emotions, such as joy, interest, contentment,
and love, which could become individuals’ physical and intellectual resources to increase

13
the odds of successful coping and survival (Fredrickson & Neill, 2004, p. 1367). Teacher
resiliency is defined as teachers’ ability to persist in challenging teaching scenarios and
cope with stress for teachers (Beltman et al., 2011). Teacher resiliency can also be seen as
a psychological property. Gu and Day (2007) suggested teacher resiliency as teachers’
emotional intelligence to maintain commitment and effectiveness in teaching in the face
of adversity in teachers’ professional work and personal life. Teacher resiliency has been
considered key for novice teachers’ thriving (Tait, 2008).
There is a plethora of empirical evidence for the positive connection between
teaching efficacy and teacher resiliency. Many studies have found teachers with higher
teaching efficacy tended to be more resilient in terms of coping with work stress and
anxiety, avoiding professional burnout (Kitching, 2009; Tait, 2008; Tschannen-Moran &
Hoy, 2007), and increasing longevity for their teaching careers (Gibson & Dembo, 1984).
The first few years of teaching experience matter a lot to novice teachers’ retention in
teaching. Burley, Hall, Villeme, and Brockmeier (1991) concluded that novice teachers
with higher teaching efficacy also had a higher tendency to stay in teaching after they
started their first teaching jobs. For novice teachers who quit their jobs in the early years
of teaching, it was found that they had lower teaching efficacy and decided to stay in
teaching (Glickman & Tamashiro, 1982). Tschannen-Moran and Hoy (2001) did an
extensive review of past measures that attempted to capture the construct of teaching
efficacy. Through repetitive and rigorous tests with different preservice and in-service
teacher populations, Tschannen-Moran and Hoy established a reliable teaching efficacy
measure that has been widely used by other researchers who were interested in the same

14
topic. Tschannen-Moran and Hoy also validated that teaching efficacy is the key to
teachers’ persistence, enthusiasm, commitment, and student achievement.
The connection between teaching efficacy and teacher resiliency has encouraged
many researchers to focus on using professional development to enhance teaching
efficacy and increase teacher resiliency for novice teachers. Those past studies focused
on the connection between teachers’ technological pedagogical content knowledge
(TPACK) and teaching efficacy. TPACK is defined as teachers’ knowledge of using
various technologies, pedagogical designs in different teaching settings, and their deep
understanding of the subjects they teach in order to enhance students’ learning outcomes
(Schmidt et al., 2009). TPACK could be measured by different sub-measures such as PK
(pedagogical knowledge) and TPK (technological pedagogical knowledge) developed by
Schmidt et al. Other studies have adopted the original TPACK measure with research
focus on professional development. For example, Banas and York (2014) modified the
original PK and TPK measures by removing questions about teachers’ perceptions of
their teacher education program and classroom management ability to focus on effects of
the professional development in their study. Banas and York’s measures were also
adopted by Byker, Putman, Handler, and Polly’s (2017) study of 63 elementary school
preservice teachers’ intention to integrate technologies to engage students in social
studies. Their results suggested that in order to help teachers successfully use educational
technologies in teaching, it is important that teachers have examples, guidance, and time
to develop a comprehensive teaching plan to use technologies in their own teaching.
Byker et al.’s results also suggested that teachers’ TPK and intentions to utilize
technologies in teaching correlated positively with their teaching efficacy.

15
The connection between teachers’ TPACK, teaching efficacy, and teacher
resiliency has spurred many researchers to focus on different formats of professional
development. For instance, Colbert et al. (2008) found that using a teacher-driven
professional development in which teachers could decide the format and process of
professional development was more helpful to increase their teaching skills than lecturer-
led seminars. Grigg et al. (2012) suggested that using case study in professional
development, where teachers can imagine themselves in an actual challenging situation,
could help them put their teaching theories into practice to create more student-centered
instructions. Other professional development formats such as engineering-oriented
(Donna, 2013) and scientific inquiry-based approaches (Heller et al., 2012) have also
shown the potential to enhance teachers’ TPACK and teaching efficacy.
Despite these fruitful research findings, these professional development studies
focused on in-service teachers but not preservice or novice teachers (O’Brien & Jones,
2014). Although TPACK is imperative to teachers’ pedagogical performance (Harris &
Hofer, 2011), novice teachers are concerned about “if they are able to teach” rather than
“which ways they should use to teach” (Fimian & Blanton, 1987; Ingersoll, 2000). Hong
(2012) conducted an in-depth study to analyze a group of 14 novice teachers who had
less than 5 years of teaching experience. The author compared the novice teachers who
left their teaching jobs with those who stayed in teaching after they completed their
teacher education program. The results showed that one of the major factors that affected
novice teachers’ leave/stay choice was if they received any kind of professional
development which focused on strengthening their confidence and ability to teach. Hong
concluded that professional development which focused on novice teachers’ teaching

16
efficacy is the key to teacher resiliency. This type of professional development should
have training content that focuses on teaching practice, self-assessment, and reflection for
novice teachers to strengthen their teaching efficacy (Morine-Dershimer & Kent, 1999).
The Use of Learning Analytics and Educational Data Mining
for Pedagogical Improvement
In this section, I discuss how learning analytics and educational data mining have
become popular research subjects to improve teachers’ teaching practices. I first
distinguish learning analytics from educational data mining and then discuss past studies
that focused on using learning analytics to enhance teaching and learning outcomes.
Educational data mining develops and adopts statistical, machine-learning, and
data-mining methods to study educational data generated basically by students and
instructors. Their application may help to analyze student learning processes, considering
their interaction with the environment (Liñán & Pérez, 2015, p. 100). Learning analytics
is defined as the measurement, collection, analysis, and reporting of data about learners
and their contexts for the purposes of understanding and optimizing learning and the
environments in which they occur (p. 103). The similarities between educational data
mining and learning analytics are that both areas of research focus on using data to
extract useful insights in order to enhance teaching and learning outcomes for teachers
and students. The difference is that educational data mining focuses on educational
software, automating data analysis, and modeling, while learning analytics centers on
empowering students and instructors, use of human judgment, and design of interventions
to enhance educational outcomes (Liñán & Pérez, 2015).

17
There have been many successful applications of educational data mining.
Hübscher and Puntambekar (2008) applied data mining techniques to extract information
from a web-based educational system to provide insights for pedagogical scaffolding.
Based on data insights, students can receive different prompts in the same learning
systems to solve physics questions more easily. Slater et al. (2016) used data mining to
map semantic features and correlations between mathematical questions created by
teachers’ and students’ responses in a learning system. Slater et al. discovered
correlations between certain question semantics with students’ learning engagement
reflected by response semantics such as boredom, frustration, and confusion. These
semantic discoveries could be used for pedagogical design in an online learning
environment.
Although there have been many successful cases of using educational data mining
for pedagogical design, this dissertation focused on the teachers’ use of learning analytics
to improve their teaching. Pedagogical design and improvement rely heavily on teachers’
subject and pedagogical knowledge. Compared to educational data mining, learning
analytics highlights instructors’ role in discovering, analyzing, and utilizing educational
data insights. Learning analytics also emphasizes a systematic view of educational data
and intervention design to improve learning. In that regard, learning analytics fits into the
scope of this dissertation research, with its focus on professional development for
teachers, teaching efficacy, and teacher resiliency. In the following, I review past studies
that applied learning analytics for pedagogical improvement.
Data-driven approaches have been proven to improve curriculum design
effectively by teaching design. As more and more school districts and teachers are

18
adopting data analytics into their professional development, an increasing body of
evidence indicates that using learning analytics in instructional strategies can increase
students’ achievement (Armstrong & Anthes, 2001). Large volumes of student learning
data are stored in learning management systems (LMSs), which school administrators and
teachers can use to make good administrative and pedagogical decisions. For instance,
Campbell, DeBlois, and Oblinger (2007) have used massive course management system
data at a university to capture important factors of at-risk students in order to implement
early learning interventions. Morris (2004) analyzed data from 354 students from several
asynchronous online classes and identified student characteristics that could increase
students’ persistence in course activities. Morris used these students’ characteristics for a
learning intervention design and successfully improved students’ academic performance.
Student interaction is an important social element for students’ learning outcomes. To
overcome the shortcoming of online courses which often lack in-person interaction,
Poon, Kong, Yau, Wong, and Ling (2017) used data visualization to investigate students’
online participation, while Dawson et al. (2008) used online discussion forum data to
increase students’ interaction. Both studies identified the benefits of using various types
of data to improve students’ engagement and learning outcomes in the online learning
environment.
Learning analytics can potentially increase teachers’ TPK, teaching efficacy, and
teacher resiliency, especially for novice teachers who lack teaching experience and skills
to assess their teaching. The key to unlocking the pedagogical values of student data is
teachers’ learning analytics knowledge and skills (Dawson et al., 2008). As learning
analytics is not part of the regular curricula for teacher education programs, an ideal

19
alternative could be a learning analytics professional development catered specifically for
novice teachers.
Suggested Approach to Professional Development in Learning Analytics
with Novice Teachers
Although many past studies have suggested the promise of using learning
analytics to enhance novice teachers’ teaching efficacy, very little research has
illuminated which format of professional development would be appropriate to teach
novice teachers to use learning analytics in teaching. Different professional development
formats may have different advantages and disadvantages in terms of teacher training.
Some of the most common formats of professional development for teachers included
workshop, class observation, and case study. Villegas-Reimers (2003) published a
booklet with UNESCO’s International Institute of Educational Planning that focused on
an international literature review of teachers’ professional development. In that booklet,
the author elaborated how different formats of professional development have been
applied to attain various teachers’ training purposes along with their pros and cons.
Villegas-Reimers described that workshops, seminars, and course lectures were the most
common and traditional format of professional development for in-service teachers.
These formats of professional development shared the nature of direct teaching. Also, this
type of direct teaching professional development was relatively convenient to organize.
However, the drawbacks of this type of direct-teaching professional development are that
they are oftentimes “one-shot” knowledge delivery and their content might not be related
to teachers’ actual needs. Studies have shown that this type of one-shot and direct-
teaching professional development can be more effective if teachers could join the

20
decision-making process to decide the topics for their own professional development
workshop or course lectures (Colbert et al., 2008).
Another widely used format of professional development is case-based learning.
Case-based learning in professional development focuses on real-world teaching
scenarios that engage teachers in building their ability to unravel complex, ambiguous,
and conflicting teaching problems without best answers (Harrington, 1995). Compared to
workshops or seminars, case-based learning may be a more appropriate format to conduct
learning analytics professional development because it focuses on applying conceptual or
theoretical knowledge to create practical pedagogical solutions. Goeze, Zottmann, Vogel,
Fischer, and Schrader (2014) applied case-based learning to train novice teachers’
analytical competence to identify good and poor instructional practices based on teaching
videos. The results showed that by observing various teaching practices in real teaching
scenarios, even through videos, novice teachers could improve their abilities to examine
effectiveness of instruction from both student’s and teacher’s perspectives. Case-based
learning using teaching scenarios also bears opportunities for teachers to learn through
problem-solving. Merseth (1990) suggested that this kind of professional development
could be particularly useful for preservice teachers as they prepare to teach and tackle
various scenarios in the classroom setting. Although case-based learning may be an ideal
format for professional development for novice teachers, Shkedi (1998) cautioned that
clear guidance and goals would be an important basis with regard to the openness of
problems presented in case study.
Goeze et al. (2014) suggested that teachers’ analytical competence is crucial to
their teaching and students’ learning. Teachers’ analytical competence enables them to

21
observe, analyze, and assess different teaching scenarios and it is the key to their teaching
competence (p. 4). The ability to interpret the pedagogical situations in the teachers’ own
expertise domains is the determinant for teachers’ teaching efficacy and variances in
students’ achievement (Berliner, 2001; Hattie, 2009). Ball and Cohen (1999) also argued
that in order for teachers to assess their teaching accurately and attend to students’
individual learning needs, it is important for teachers to evaluate their teaching not only
from their own perspective but also from the students’ perspectives. Hogan et al. (2003)
compared experienced and novice teachers in terms of their ability to evaluate their own
teaching and lesson planning. The authors found that novice teachers tended to apply
primarily their own perspective as a teacher when interpreting the outcomes of their
teaching, while the experienced teachers were able to balance both teachers’ and
students’ perspectives. The ability to take different perspectives to analyze teaching
performance is important but hard for novice teachers, due to their lack of teaching
experiences.
In this dissertation research, I focused on integrating professional development
with a teaching scenario to train novice teachers in learning analytics knowledge and
skills. By using a teaching scenario, this kind of professional development exposes
novice teachers to real-world teaching scenarios and allows them to experience various
perspectives when considering their pedagogical approach. Synthesizing learned
pedagogical theories to their teaching practice and applying the skills learned from
learning analytics may help novice teachers to better assess their own teaching and
student learning and, in turn, increase their teaching efficacy and teacher resiliency.

22
Chapter III
LEARNING ANALYTICS SURVEY STUDY
The learning analytics survey study was developed and administered to address
the first research question: What are the challenges, perspectives, and usage patterns of
learning analytics in STEM teachers/educators, and how does that influence their
teaching efficacy? This research question was examined further through the following
sub-questions:
1. How commonly do in-service and preservice STEM teachers use learning
management systems and learning analytics?
2. What are the barriers to teachers in using learning analytics?
3. What are the in-service and preservice teachers’ perceptions of their
technological pedagogical knowledge and teaching efficacy?
4. How are these barriers and usage of learning analytics related to in-service
teachers’ perceptions of their technological pedagogical knowledge and
teaching efficacy?
Methodology
The data for this survey study were collected from volunteer participants on two
occasions: once in Spring 2019 and once in Fall 2019 during an annual college-wide

23
academic festival event where alumni, faculty, and students in the field of education
come together to participate in symposia, talks, workshops, panels, display/demos, and
hands-on workshops.
Participants
A total of 72 participants voluntarily participated in this survey study. Forty-seven
of the participants were in-service teachers who were teaching as full-time teachers.
Another 16 participants were former teachers (e.g., retirees, left the teaching profession
and went on to other educational sectors, and taking time off from teaching to pursue an
advanced degree). The remaining nine participants were preservice teachers in math
education. In the in-service teacher group, excluding one participant who did not share
gender information, 76% were females and 24 % were males. The average age of the in-
service teacher group was 38.9 years old. Also, 68.1% of in-service teachers were
teaching at elementary school, 10.6% were teaching at middle schools, and 23.4% were
teaching at high school. In the former teacher group, 75% were females and 25% were
males. The average age of this former teacher group was 35.5 years old. In the preservice
teacher group, excluding one participant who did not share gender information, 67% were
females and 33% were males. The average age of this teacher group was 25.7 years old.
Procedure
Participants were recruited on-site through announcement and word-of-mouth at
the annual college-wide academic festival event. Interested participants were asked to
give consent and then seated to fill out the questionnaire. On average, participants spent
about 5 minutes to complete the survey.
24
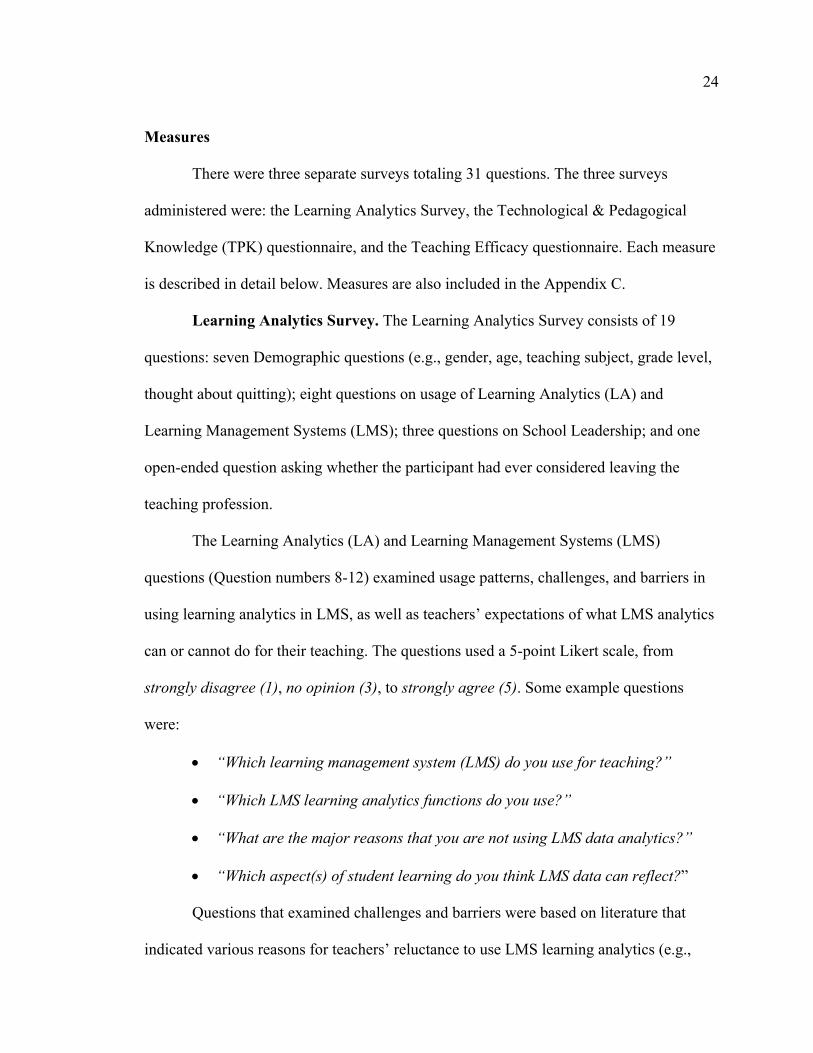
Measures
There were three separate surveys totaling 31 questions. The three surveys
administered were: the Learning Analytics Survey, the Technological & Pedagogical
Knowledge (TPK) questionnaire, and the Teaching Efficacy questionnaire. Each measure
is described in detail below. Measures are also included in the Appendix C.
Learning Analytics Survey. The Learning Analytics Survey consists of 19
questions: seven Demographic questions (e.g., gender, age, teaching subject, grade level,
thought about quitting); eight questions on usage of Learning Analytics (LA) and
Learning Management Systems (LMS); three questions on School Leadership; and one
open-ended question asking whether the participant had ever considered leaving the
teaching profession.
The Learning Analytics (LA) and Learning Management Systems (LMS)
questions (Question numbers 8-12) examined usage patterns, challenges, and barriers in
using learning analytics in LMS, as well as teachers’ expectations of what LMS analytics
can or cannot do for their teaching. The questions used a 5-point Likert scale, from
strongly disagree (1), no opinion (3), to strongly agree (5). Some example questions
were:
• “Which learning management system (LMS) do you use for teaching?”
• “Which LMS learning analytics functions do you use?”
• “What are the major reasons that you are not using LMS data analytics?”
• “Which aspect(s) of student learning do you think LMS data can reflect?”
Questions that examined challenges and barriers were based on literature that
indicated various reasons for teachers’ reluctance to use LMS learning analytics (e.g.,

25
lack of computer skills, objection from parents). Similarly, questions on what kind of
expectations teachers have towards LMS learning analytics and how it can assist their
curriculum/instructional design (Question numbers 13-15) were also generated from past
literature in this area (e.g., know students’ learning process, identify at-risk students).
Example questions included:
• “LMS data analytics provide useful information to improve my teaching.”
• “LMS data analytics make curriculum/instruction design more effective.”
Questions on school leadership (Question numbers 28-30) asked participants
about their personal perceptions of workload at school and support they gained through
professional development and school leadership. These questions were asked because
past research has indicated that teachers’ perceptions of workload and/or support
leadership could impact their adoption of technologies in teaching (Buabeng-Andoh,
2012). These questions included:
• “How do you feel about your workload at school?”
• “I feel that my school provides support in professional development for
improving teaching.”
• “I feel that my school leadership is supportive of implementing new
technologies for improving teaching.”
The questions used a 5-point Likert scale.
The last open-ended question asked participants: “Have you thought about
quitting being a teacher? If so, when (e.g., 1st year, 2nd year of teaching) and why?”
This question was asked to see if teacher burnout occurs in the beginning years, as
26
suggested by past literature. A blank text box was used for the participants to write their
responses.
Technological and Pedagogical Knowledge (TPK) Questionnaire. The
Technological & Pedagogical Knowledge (TPK) Questionnaire consists of four questions
(Question numbers 16 to 19) that measure how teachers use technologies in their teaching
and how they see technology as a way to change instruction. The measure from Banas
and York (2014) is an adjusted version from the original TPACK questionnaire
developed by Schmidt et al. (2009). The reliability of this measure has been well
established (Cronbach’s alpha = .84) (see the literature review for more details on the
original TPACK questionnaire). Banas and York’s (2014) TPK measure was
administered because the selected questions were more relevant to the case study that
focused on teachers’ integration of technology (i.e., Learning Management Systems-
LMS) in teaching. This TPK was administered to measure teachers’ perceived ability to
use LMS and Learning Analytics (LA) technologies in their teaching and student
learning. Example questions included:
• “Do you feel you can choose technologies that enhance your teaching
approaches for a lesson?”
• “Do you feel you can choose technologies to enhance students’ learning for a
lesson?”
The responses were set using a 5-point Likert scale going from strongly disagree (1), no
opinion (3), to strongly agree (5).
Teaching Efficacy Questionnaire. Questions 20 to 27 concerned participants’
perceived teaching efficacy. The teaching efficacy questionnaire was established by

27
Tschannen-Moran and Hoy (2001) and measures teachers’ efficacy and confidence in
instructional practices and student engagement. The measure has good reliability
(Cronbach alpha = .91) and is often used to survey preservice and in-service teachers.
Some example questions included:
• “To what extent can you use a variety of assessment strategies?”
• “To what extent can you craft good questions for your students?”
• “How well can you implement alternative strategies in your classroom?”
Based on the original measure, the responses to these questions were arranged by using a
9-point Likert scale going from nothing (1), very little (3), some (5), quite a bit (7), and a
great deal (9).
Results
The learning analytics survey study was developed and administered to address
the first research question: What are the challenges, perspectives, and usage patterns of
learning analytics in STEM teachers/educators, and how does that influence their
teaching efficacy? The results from the learning analytics survey were examined closely
by answering each of the sub-questions listed below.
Sub-question 1. How Commonly Do In-Service and Preservice STEM Teachers Use
Learning Management Systems and Learning Analytics?
Usage gap between in-service and preservice teachers regarding LMS.
Regarding the use of LMS, in-service teachers had a higher tendency to use different
LMS functions in general (see Figure 1). For the function of upload assignment, reading,
videos, etc., about 40.4 % of the in-service teachers have used this function, while about
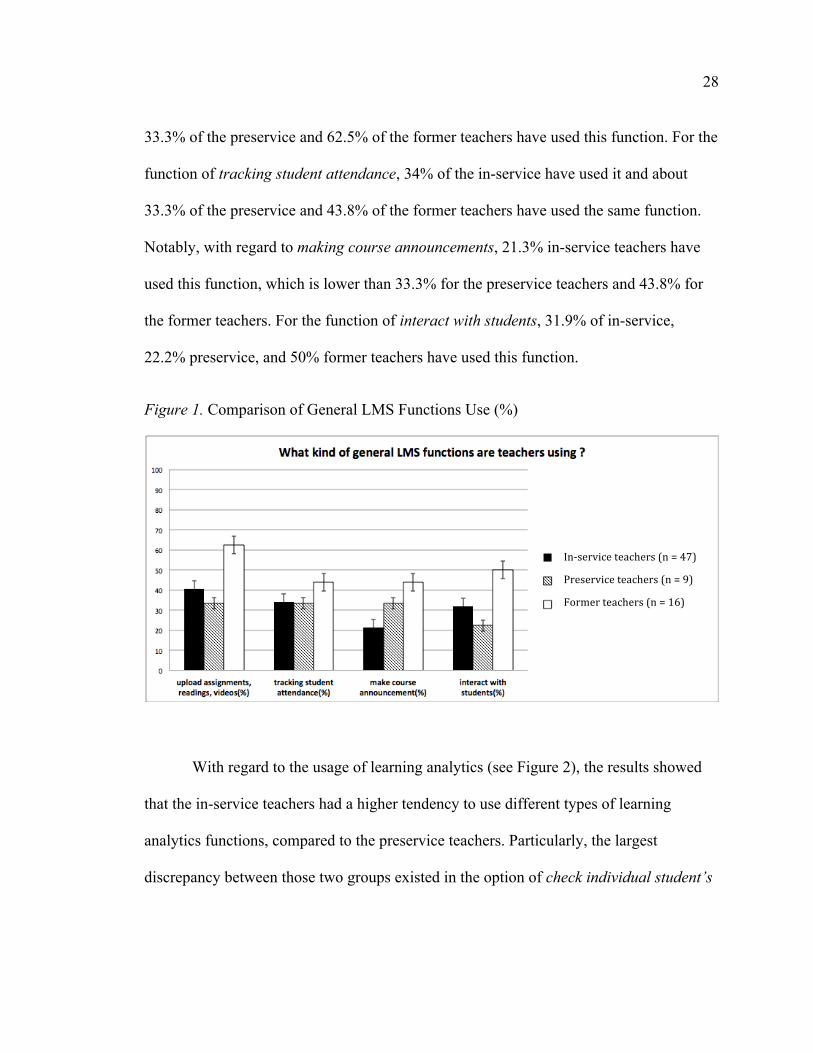
28
33.3% of the preservice and 62.5% of the former teachers have used this function. For the
function of tracking student attendance, 34% of the in-service have used it and about
33.3% of the preservice and 43.8% of the former teachers have used the same function.
Notably, with regard to making course announcements, 21.3% in-service teachers have
used this function, which is lower than 33.3% for the preservice teachers and 43.8% for
the former teachers. For the function of interact with students, 31.9% of in-service,
22.2% preservice, and 50% former teachers have used this function.
Figure 1. Comparison of General LMS Functions Use (%)
With regard to the usage of learning analytics (see Figure 2), the results showed
that the in-service teachers had a higher tendency to use different types of learning
analytics functions, compared to the preservice teachers. Particularly, the largest
discrepancy between those two groups existed in the option of check individual student’s
In-serviceteachers(n=47)Preserviceteachers(n=9)Formerteachers(n=16)

29
learning progress (43.6% vs. 0%), examine average class learning performance (27.7%
vs. 11.1%), and send report to themselves (i.e., teachers) (12.8% vs. 0%).
Figure 2. Comparison of Learning Analytics Features Use (%)
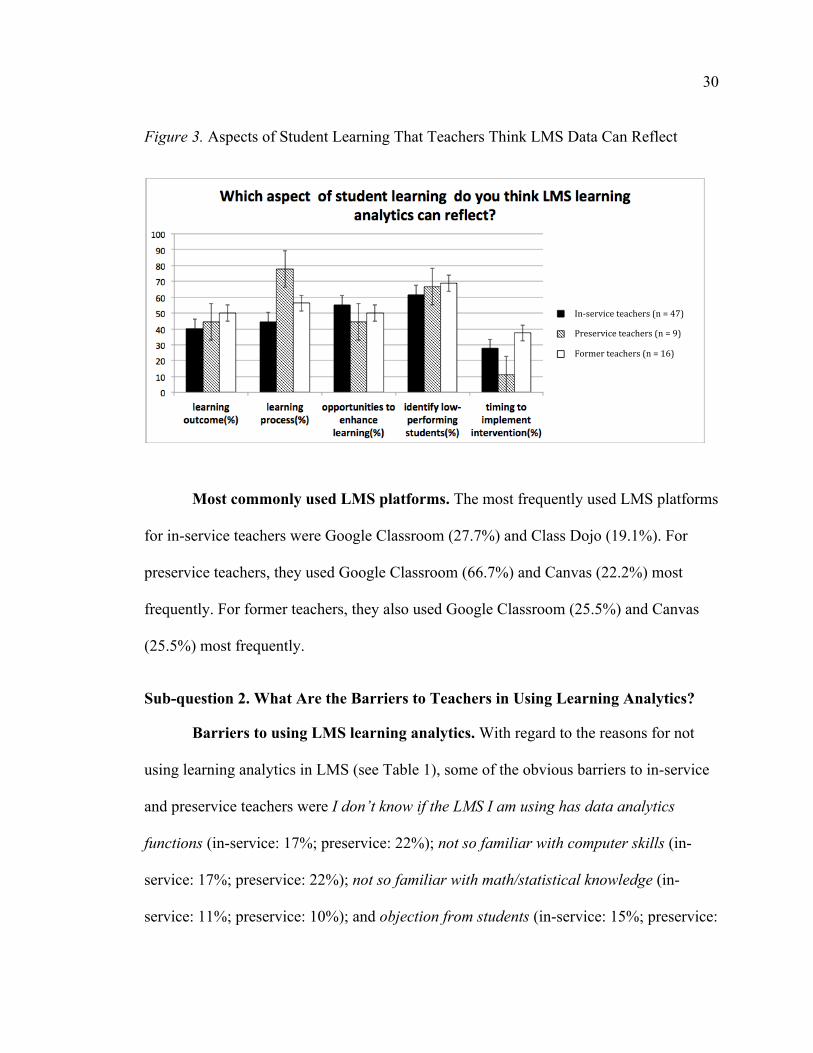
When asked about the aspects of student learning that LMS data can reflect (see
Figure 3), preservice teachers had a higher tendency to believe that LMS learning
analytics can reflect learning outcomes (preservice: 44.4%; in-service: 40%) and learning
process (preservice: 77.8%; in-service: 44.7%). Preservice teachers also considered LMS
learning analytics can identify low-performing students more than in-service students
(preservice: 66.7%; in-service: 61.7%). However, for opportunities to enhance learning
and timing to implement intervention, in-service teachers gave a higher rating score than
the preservice teachers.
In-serviceteachers(n=47)Preserviceteachers(n=9)Formerteachers(n=16)
30
Figure 3. Aspects of Student Learning That Teachers Think LMS Data Can Reflect
Most commonly used LMS platforms. The most frequently used LMS platforms
for in-service teachers were Google Classroom (27.7%) and Class Dojo (19.1%). For
preservice teachers, they used Google Classroom (66.7%) and Canvas (22.2%) most
frequently. For former teachers, they also used Google Classroom (25.5%) and Canvas
(25.5%) most frequently.
Sub-question 2. What Are the Barriers to Teachers in Using Learning Analytics?
Barriers to using LMS learning analytics. With regard to the reasons for not
using learning analytics in LMS (see Table 1), some of the obvious barriers to in-service
and preservice teachers were I don’t know if the LMS I am using has data analytics
functions (in-service: 17%; preservice: 22%); not so familiar with computer skills (in-
service: 17%; preservice: 22%); not so familiar with math/statistical knowledge (in-
service: 11%; preservice: 10%); and objection from students (in-service: 15%; preservice:
In-serviceteachers(n=47)
Preserviceteachers(n=9)
Formerteachers(n=16)

31
11%). Also, objection from parents was also an obvious reason for in-service teachers not
to use LMS Learning Analytics (16%).
Table 1. Reasons for Not Using LMS Learning Analytics
Reason Group Count/ Total
I don’t know if the LMS I am using has data analytics functions In-service 8/47 (17%)
Preservice 2/9 (22%)
Former 2/16 (13%)
Objection from students
In-service 15/47 (15%)
Preservice 1/9 (11%)
Former 1/16 (6%)
Objection from parents
In-service 8/47 (16%)
Preservice 0/9 (0%)
Former 0/16 (0%)
Not so familiar with computer skills
In-service 8/47 (17%)
Preservice 2/9 (22%)
Former 3/16 (19%)
Not so familiar with math/statistical knowledge
In-service 5/47 (11%)
Preservice 1/9 (10%)
Former 1/16 (6%)
LMS data may be used against me on my work performance evaluation
In-service 2/47 (4%)
Preservice 0/9 (0%)
Former 1/16 (6%)
LMS data can’t truly reflect students’ learning outcomes
In-service 4/47 (9%)
Preservice 1/9 (11%)
Former 1/16 (6%)
Perceived usefulness of LMS learning analytics between in-service and
preservice teachers. With regard to the perceived usefulness of learning analytics (see
Figure 4), on a scale from 1 (strongly disagree) to 5 (strongly agree), the in-service
teachers gave an average score of 3.7 (No opinion–Agree) and 3.4 (No opinion–Agree)
when they considered the usefulness of learning analytics in teaching and instructional
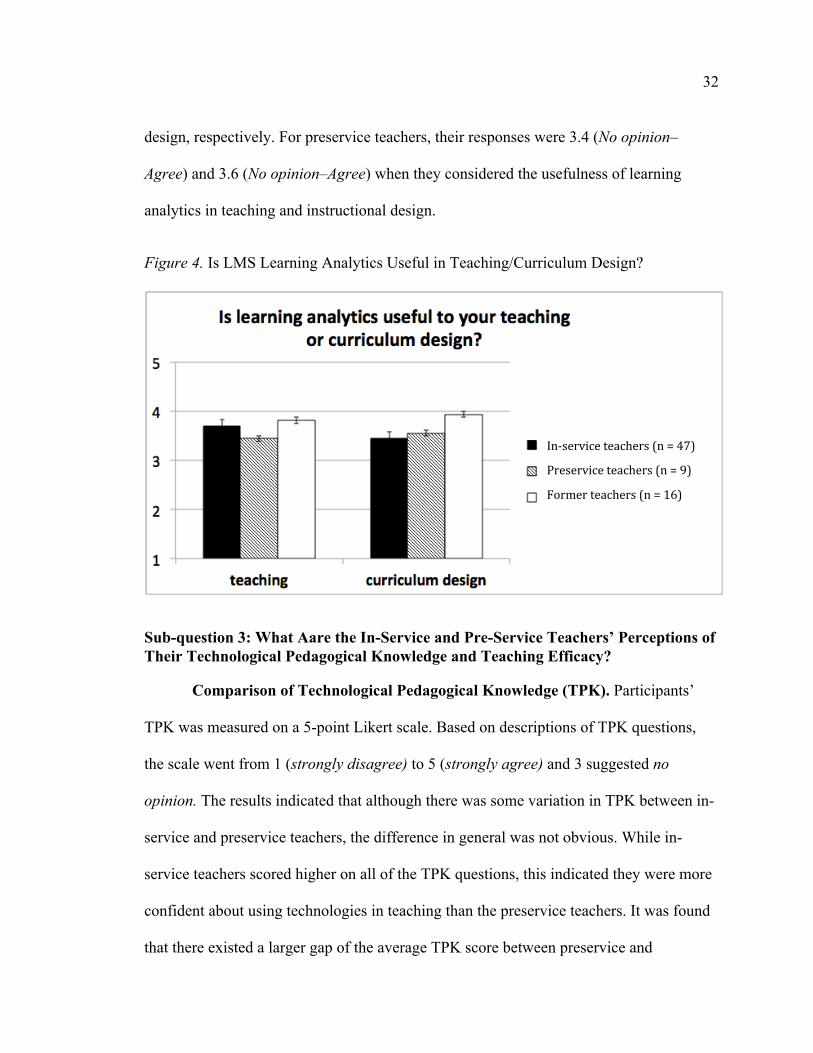
32
design, respectively. For preservice teachers, their responses were 3.4 (No opinion–
Agree) and 3.6 (No opinion–Agree) when they considered the usefulness of learning
analytics in teaching and instructional design.
Figure 4. Is LMS Learning Analytics Useful in Teaching/Curriculum Design?
Sub-question 3: What Aare the In-Service and Pre-Service Teachers’ Perceptions of
Their Technological Pedagogical Knowledge and Teaching Efficacy?
Comparison of Technological Pedagogical Knowledge (TPK). Participants’
TPK was measured on a 5-point Likert scale. Based on descriptions of TPK questions,
the scale went from 1 (strongly disagree) to 5 (strongly agree) and 3 suggested no
opinion. The results indicated that although there was some variation in TPK between in-
service and preservice teachers, the difference in general was not obvious. While in-
service teachers scored higher on all of the TPK questions, this indicated they were more
confident about using technologies in teaching than the preservice teachers. It was found
that there existed a larger gap of the average TPK score between preservice and
In-serviceteachers(n=47)Preserviceteachers(n=9)Formerteachers(n=16)

33
in-service teachers on the first and the last question (TPK-Q1 and TPK-Q4). These two
questions were “Do you feel you can choose technologies that enhance your teaching
approaches for a lesson?” and “Do you feel you can adapt different technologies to
different teaching activities?” The difference between the two groups for TPK-Q1 and
TPK-Q4 was about 0.3 (see Figure 5).
Figure 5. Comparison of Technological Pedagogical Knowledge (TPK)
Comparison of teaching efficacy. Participants’ teaching efficacy was measured
on a 9-point Likert scale. The scale for this measure went from 1 (nothing) to 9 (a great
deal), with the middle point of 5 indicating some. When comparing preservice teachers’
teaching efficacy scores to in-service teachers’ scores (see Figure 6), the results showed
that for all of the eight teaching efficacy questions in general, preservice teachers had
lower scores than in-service teachers. It was also found that on questions 1, 6, 7, and 8
(TE-Q1, -Q6, -Q7), the two groups of teachers differed the most regarding their scores.
In-serviceteachers(n=47)Preserviceteachers(n=9)Formerteachers(n=16)

34
For these three questions (listed below), in-service teachers exhibited much higher
confidence than preservice teachers.
TE-Q1. To what extent can you use a variety of assessment strategies?
TE-Q6. How much can you do to adjust your lessons to the proper level for
individual students?
TE-Q7. To what extent can you gauge student comprehension of what you have
taught?
Figure 6. Comparison of Teaching Efficacy
Intention to quit teaching. The results showed that about a quarter of the in-
service teachers have had the intention to quit teaching, and about one-fifth of the
preservice teachers have thought about quitting teaching. Notably, over 50% of the
former teachers (e.g., retirees, left the teaching profession and went on to other
In-serviceteachers(n=47)
Preserviceteachers(n=9)
Formerteachers(n=16)

35
educational sectors, and taking time off from teaching to pursue an advanced degree)
have had the intention to quit teaching (see Figure 7).
Figure 7. Comparison of Intention to Quit as a Teacher
The qualitative feedback from the participants provided useful insights to explain
this discrepancy between different groups of participants regarding the timing and major
reasons why they wanted to quit teaching. Most of the preservice teachers expressed that
they liked teaching and have not considered quitting teaching. However, for preservice
teachers, some of the reasons for wanting to quit were as follows:
“I feel my teaching is never perfect.” (preservice teacher-03)
“Teaching is stressful.” (preservice teacher-03)
“Students complain a lot.” (preservice teacher-03)
“I am considering becoming a professor at college to teach in higher education.” (preservice teacher-04)
In-serviceteachers(n=47)
Preserviceteachers(n=9)
Formerteachers(n=16)

36
Most of the in-service teachers expressed that they liked teaching and have not
considered quitting teaching. However, some teachers shared the reasons why they would
want to quit in the following:
“Not yet.” (in-service teacher-03)
“Yes, sometimes I feel teaching is too demanding.” (in-service teacher-07)
For those who have stopped teaching and are pursuing advanced degrees in
education, the data showed that their intention to quit teaching occurred mostly in the
beginning years and later in their teaching career. Some of the former teachers’ reasons to
quit teaching were:
“I wanted to quit teaching at the first and the twentieth year of being a teacher.” (former teacher-04)
“About seven years of teaching I wanted to quit because I felt overworked and the administration is corrupted.” (former teacher-07)
“I wanted to quit the first year of teaching. The elementary system is too rigid and hard to change.” (former teacher-10)
“First year, when I felt frustrated when students ignored me.” (former teacher-14)
“Second year, because of the lack of career progression options.” (former teacher-15)
“Yes, because of it is difficult to manage a large classroom of 30-50 kids.” (former teacher-16)
Sub-question 4: How Are These Barriers and Usage of Learning Analytics Related
to In-Service Teachers’ Perceptions of Their Technological Pedagogical Knowledge
and Teaching Efficacy?
Further statistical analysis was conducted with the 47 in-service teachers to see if
there were any correlations across different measures. Only the in-service teacher data
were used in the analysis due to the larger sample size (n = 47), compared to the number

37
of participants for preservice (n = 9) and former teachers (n = 16). Although there were
16 participants in the former teacher group, due to the limitation in the survey questions,
it was not clear how long these teachers had been away from teaching. Because of the
potential variation in the amount of time away from teaching between all the former
teachers, their data were not analyzed for correlation analyses. Also, because the
continuous data on different measures in the survey used different scales, the data were
first standardized, and all correlation analyses were conducted based on Z-scores.
Perceived usefulness of LMS/learning analytics. The results showed that there
was a strong positive correlation (Pearson r = 0.73, p-value = 0.00) between in-service
teachers’ perceived usefulness of LMS learning analytics in teaching and curriculum/
instructional design (i.e., LMS data analytics provide useful information to improve my
teaching and LMS data analytics make curriculum/instructional design more effective).
School workload, professional development, support from school leadership.
On the administrative side, the results showed that in-service teachers’ perceived school
workload had a positive correlation with their perceived professional development
support (i.e., I feel that my school provides support in professional development for
improving teaching) (Pearson r = 0.4, p-value = 0.01). Meanwhile, perceived professional
development support also had a positive correlation with perceived support from school
leadership (i.e., I feel that my school leadership is supportive of implementing new
technologies for improving teaching) (Pearson r = 0.56, p-value = 0.00). However, it was
found that in-service teachers’ perceived workload had a moderate negative correlation
with their perceived usefulness of LMS learning analytics in teaching (Pearson r = -0.38,
p-value = 0.01).

38
TPK and teaching efficacy. With regards to TPK and teaching efficacy
questions, although there was no significant correlation between the average teaching
efficacy and average teaching efficacy score, there were some insightful findings when
examining correlations between questions in the two measures separately. Specifically,
there was a positive correlation between the first question of TPK (i.e., Do you feel you
can choose technologies that enhance your teaching approaches for a lesson?) and the
eighth question of teaching efficacy (i.e., How well can you provide appropriate
challenges for very capable students?) (Pearson r = 0.32, p-value = 0.03). There was also
a positive relationship between the third TPK question (i.e., Do you feel you can think
critically about how to use technology in your future classroom?) and the second
teaching efficacy question (i.e., To what extent can you provide an alternative
explanation or example when students are confused?) (Pearson r = 0.29, p-value =
0.049). The third TPK question also had a positive relationship with the fourth teaching
efficacy question (i.e., How well can you implement alternative strategies in your
classroom?) (Pearson r = 0.31, p-value = 0.03).
Number of LMS/learning analytics functions use. In the survey study, in-
service teachers were asked to mark each kind of LMS and learning analytics functions
they have used in teaching. Examples of LMS functions included upload assignments,
readings, videos, track students’ attendance, create tests, and the like. Also, examples of
learning analytics functions included monitor students’ course participation, check
individual student’s learning progress, predict students’ learning outcomes, and so on.
The total number of functions use was tallied for LMS and learning analytics separately.

39
The correlation analysis exhibited some informative results between the number of
LMS/learning analytics functions use and other measures.
First, for in-service teachers, there was a strong positive correlation between the
number of LMS functions and learning analytics functions they used (Pearson r = .71,
p-value = 0.0). In-service teachers’ total number of learning analytics functions use also
had a positive correlation with the number of learning aspects they thought LMS can
reflect (Pearson r = .41, p-value = 0.00). Different learning aspects in the survey question
included learning outcome, learning process, identification of low-performing/at-risk
students, and so on. An important factor that impeded in-service teachers to use LMS or
learning analytics seemed to be their school workload. The results showed that perceived
workload had a negative correlation with both the number of LMS functions use (Pearson
r = -.29, p-value = 0.046) and learning analytics functions use (Pearson r = -.38, p-value =
0.01).
Correlations between number of LMS/learning analytics functions use and
TPK. The results of correlation analysis also showed that there was positive correlation
between the number of LMS functions in-service teachers used and their TPK (r = 0.36,
p = 0.01). However, between the number of learning analytics functions in-service
teachers used and their TPK, there was no significant correlation (Pearson r = 0.24,
p = 0.11).
Correlations between number of LMS/learning analytics functions use and
teaching efficacy. For teaching efficacy, the results showed that teaching efficacy had a
positive correlation with the number of LMS functions used by the in-service teachers
(Pearson r = 0.35, p = 0.02). Also, it was found that teaching efficacy had a positive

40
correlation with the number of learning analytics functions in-service teachers used
(Pearson r = 0.31, p = 0.04).
In-service teachers’ perceptions of LMS learning analytics usefulness, actual
use of LMS learning analytics, and TPK/teaching efficacy. The correlation analysis
showed insightful results when taking into account the influence of in-service teachers’
perceptions of LMS learning analytics usefulness. Previous correlation results
demonstrated a positive correlation between how many LMS/learning analytics functions
in-service teachers used and their TPK. When I further analyzed the data by separating
the 47 in-service teachers into two groups, namely, those who perceived LMS learning
analytics useful in teaching/curriculum/instructional design versus those who did not, the
two groups of in-service teachers demonstrated different patterns regarding the
correlation between their use of LMS learning analytics and their TPK.
Specifically, 29 out of the 47 in-service teachers had positive perceptions that the
LMS learning analytics was helpful in their teaching (i.e., those who marked higher than
three points [no opinion] for LMS learning analytics usefulness); the number of LMS
functions they used correlated positively with their TPK (Spearman r = 0.44, p = 0.02)
and teaching efficacy (Spearman r = 0.5, p = 0.01). In contrast, 18 out of the 47 in-service
teachers did not have positive perceptions of LMS learning analytics as helpful in their
teaching (i.e., those who ranked lower than three points [no opinion] for LMS learning
analytics usefulness); the number of LMS functions they used did not correlate with their
TPK (Spearman r = 0.2, p = 0.42) or teaching efficacy (Spearman r = 0.23, p = 0.37).
In addition to the number of LMS functions, correlation between the number of
LA functions used by in-service teachers and their TPK and teaching efficacy also
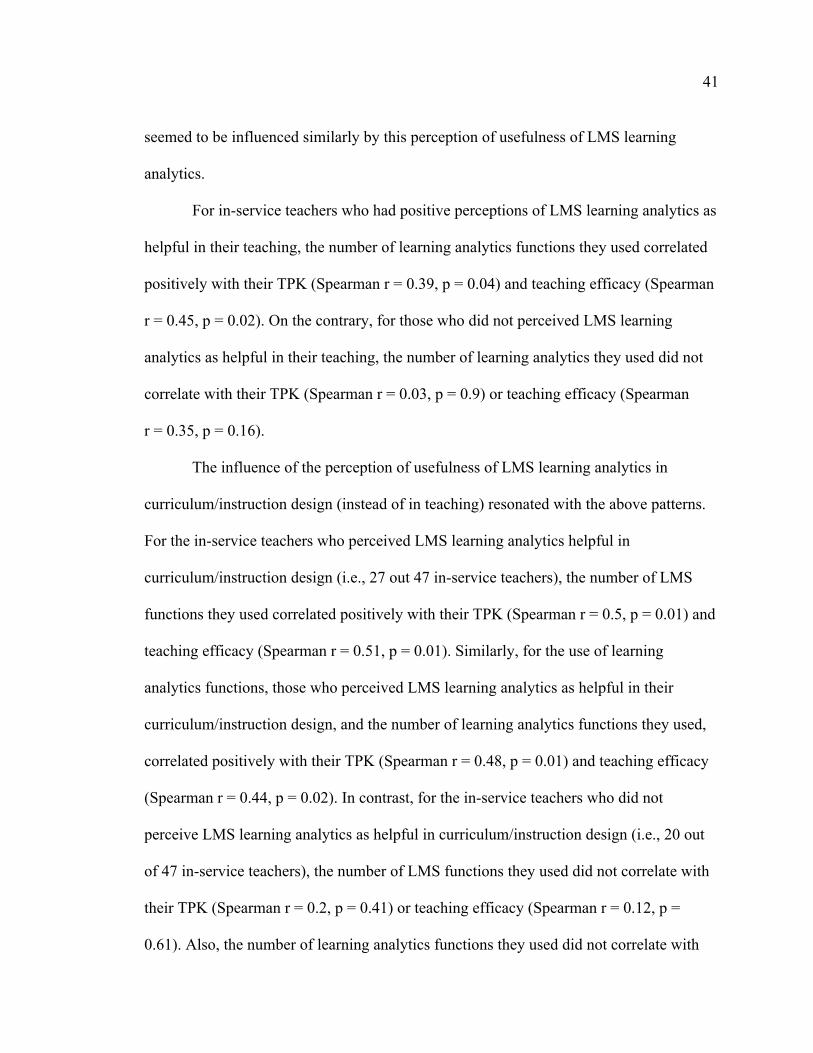
41
seemed to be influenced similarly by this perception of usefulness of LMS learning
analytics.
For in-service teachers who had positive perceptions of LMS learning analytics as
helpful in their teaching, the number of learning analytics functions they used correlated
positively with their TPK (Spearman r = 0.39, p = 0.04) and teaching efficacy (Spearman
r = 0.45, p = 0.02). On the contrary, for those who did not perceived LMS learning
analytics as helpful in their teaching, the number of learning analytics they used did not
correlate with their TPK (Spearman r = 0.03, p = 0.9) or teaching efficacy (Spearman
r = 0.35, p = 0.16).
The influence of the perception of usefulness of LMS learning analytics in
curriculum/instruction design (instead of in teaching) resonated with the above patterns.
For the in-service teachers who perceived LMS learning analytics helpful in
curriculum/instruction design (i.e., 27 out 47 in-service teachers), the number of LMS
functions they used correlated positively with their TPK (Spearman r = 0.5, p = 0.01) and
teaching efficacy (Spearman r = 0.51, p = 0.01). Similarly, for the use of learning
analytics functions, those who perceived LMS learning analytics as helpful in their
curriculum/instruction design, and the number of learning analytics functions they used,
correlated positively with their TPK (Spearman r = 0.48, p = 0.01) and teaching efficacy
(Spearman r = 0.44, p = 0.02). In contrast, for the in-service teachers who did not
perceive LMS learning analytics as helpful in curriculum/instruction design (i.e., 20 out
of 47 in-service teachers), the number of LMS functions they used did not correlate with
their TPK (Spearman r = 0.2, p = 0.41) or teaching efficacy (Spearman r = 0.12, p =
0.61). Also, the number of learning analytics functions they used did not correlate with

42
their TPK (Spearman r = 0.01, p = 0.99) or teaching efficacy (Spearman r = 0.31,
p = 0.19).
In sum, based on the above correlation results, although using more LMS or
learning analytics functions was correlated with higher TPK and teaching efficacy for the
in-service teachers, it appeared that having the perception that LMS learning analytics
was useful in teaching or curriculum design was the prerequisite for this correlation to be
established.
Discussion
This survey study revealed several important findings that I review in this
discussion section. I discuss each key finding separately below.
Gap Between Preservice and In-service Teachers Regarding LMS Use
Regarding the use of LMS, it is not surprising that in-service teachers have used
more different general LMS functions as well as LMS learning analytics functions
compared to preservice teachers. The survey results suggested that Google Classroom,
Class Dojo, and Canvas are the three LMS that preservice and in-service teachers used
most frequently. Google Classroom and Canvas generally provide LA tools such as
charts, tables, graphs, and other data visualizations to give teachers insights into students’
learning performance and progress through data dashboards. Only a few preservice
(6.7%) and a small portion of in-service teachers (19.1%) indicated that they used such
functions, but many teachers still claimed they have used learning analytics to examine
students’ learning performance and progress. Such response revealed a gap between what

43
learning analytics function teachers say they are using and the functions they are actually
using. Both preservice and in-service teachers seemed to believe they were using learning
analytics in LMS while in reality they were not.
Another interesting finding emerged. When in-service teachers were asked
“Which aspects of student learning do you think LMS data can reflect?”(see Figure 3),
their responses resonated with the earlier question, “Which learning analytics function do
you use?” (see Figure 2). This implied that in-service teachers had some sense of which
learning analytics tools can potentially reflect or monitor students’ learning outcomes and
learning processes. In contrast, nearly none of preservice teachers noted any use of LMS
function (Figure 2), but they still believed (more than in-service teachers) that LMS data
can truly reflect students’ learning processes and learning outcomes (Figure 3).
Perhaps preservice teachers are more optimistic about the potential of LMS
learning analytics in assessment and teaching, even without much prior experience in
using it. Another explanation could be that in-service teachers are more aware of the
limitations of LMS and learning analytics with regards to how much such tools can
reflect students’ learning outcomes and learning processes. Such perceptions may come
from their own user experience as in-service teachers and the complexities surrounding
student learning.
Reasons for Not Using Learning Analytics
In contrast to the wide range of potential barriers noted from the literature, only a
small portion was selected by in-service and preservice teachers as potential barriers to
using LMS and learning analytics (see Table 1). It is also interesting to discuss the

44
similarities and differences in the barriers perceived by in-service and preservice
teachers. The first similarity is that both preservice and in-service teachers reported they
were not aware if there was any learning analytics functions in the LMS systems they
were using. Google Classroom and Canvas (the two major LMS systems most commonly
used by the teachers) do have different learning analytics functions such as data
dashboards, data visualization features, and student performance tracking, but the
preservice and in-service teachers’ responses seemed to imply they may not be familiar
with such functions. Other similarities between preservice and in-service teachers were
perceived barriers due to the lack of computer skills and objection from students. This
may suggest that for both preservice and in-service teachers alike, their teacher education
program or professional development may not have familiarized them to utilize LMS and
learning analytics functions. Also, the perceived objection from students may also
suggest that teachers have to work on communication with students to build more trust
with regards to using learning analytics tools to assess students’ learning.
Barriers perceived by in-service but not preservice teachers included lack of
math/statistics knowledge and objection from parents. This may suggest that in-service
teachers may not have had enough statistical training, or they needed to refresh statistical
knowledge after they graduated from their teacher education program. The in-service (but
not preservice) teachers’ concern about parents’ objection in using learning analytics
showed that experienced teachers were generally more concerned about their parent-
teacher relationships and communication (Ingersoll, 2000). This also suggested that in-
service teachers need to be able to explain to parents how learning analytics will be used
to assess student learning objectively.

45
Technological Pedagogical Knowledge (TPK): Gap Due to Experience
of Using Technologies to Teach
The results indicated that in-service teachers have a higher average (see Figure 6)
on most of the TPK questions. Initially, the anticipation was that preservice teachers, who
are generally younger in age than in-service teachers, may be more technology-savvy, but
the results showed preservice teachers were less confident about the pedagogical use of
technology. When comparing the responses from the four TPK questions, the results
showed a large gap in the average TPK score between preservice and in-service teachers
on the first and last questions (TPK-Q1 and TPK-Q4). These two questions were “Do
you feel you can choose technologies that enhance your teaching approaches for a
lesson?” and “Do you feel you can adapt different technologies to different teaching
activities?” For these two questions, participants were asked to refer to their classroom
teaching practice/activities, which may be the reason for the differences between
preservice and in-service teachers. Because classroom teaching was limited with
preservice teachers, the lack of experience using technology to teach may have led them
to feel less prepared.
Teaching Efficacy: Gap due to Lack of Confidence of Assessing Students’ Learning
When comparing teaching efficacy scores between preservice and in-service
teachers (see Figure 7), preservice teachers had lower scores than in-service teachers.
Results seemed to reflect the lack of confidence coming from limited teaching
experience. After taking a closer look at each teaching efficacy question, the results
showed that preservice and in-service teachers differed most on questions 1, 6, 7 (see
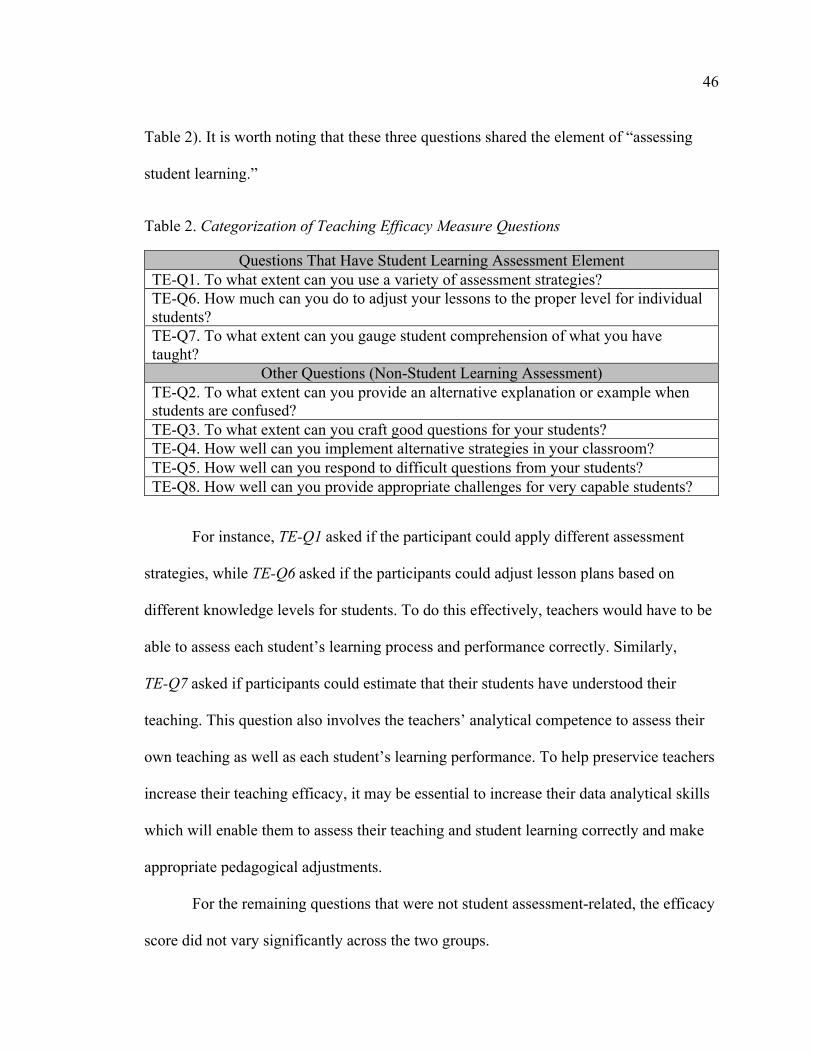
46
Table 2). It is worth noting that these three questions shared the element of “assessing
student learning.”
Table 2. Categorization of Teaching Efficacy Measure Questions
Questions That Have Student Learning Assessment Element TE-Q1. To what extent can you use a variety of assessment strategies? TE-Q6. How much can you do to adjust your lessons to the proper level for individual students? TE-Q7. To what extent can you gauge student comprehension of what you have taught?
Other Questions (Non-Student Learning Assessment)
TE-Q2. To what extent can you provide an alternative explanation or example when students are confused?
TE-Q3. To what extent can you craft good questions for your students? TE-Q4. How well can you implement alternative strategies in your classroom?
TE-Q5. How well can you respond to difficult questions from your students?
TE-Q8. How well can you provide appropriate challenges for very capable students?
For instance, TE-Q1 asked if the participant could apply different assessment
strategies, while TE-Q6 asked if the participants could adjust lesson plans based on
different knowledge levels for students. To do this effectively, teachers would have to be
able to assess each student’s learning process and performance correctly. Similarly,
TE-Q7 asked if participants could estimate that their students have understood their
teaching. This question also involves the teachers’ analytical competence to assess their
own teaching as well as each student’s learning performance. To help preservice teachers
increase their teaching efficacy, it may be essential to increase their data analytical skills
which will enable them to assess their teaching and student learning correctly and make
appropriate pedagogical adjustments.
For the remaining questions that were not student assessment-related, the efficacy
score did not vary significantly across the two groups.
47
Intention to Quit Teaching
The qualitative feedback for teachers who expressed they wanted to quit teaching
can be summarized in a few major categories. The first category is contextual/
environmental factors, such as school culture or school system that is not supportive for
the teachers and their teaching activities. The second category is about student/classroom
management. Responses in this category are mostly about challenges dealing with a large
class size, not being able to fulfill student needs, and student complaints. Further
investigation is needed as data on student management were not gathered in this survey;
however, it may be reasonable to assume that part of this issue could result from
ineffective teacher practice. The third category is about the high demand and expectations
placed on teachers. Responses in this category involved teachers’ concerns about their
own teaching performance and the high level of work stress from teaching. The findings
from the response were aligned with previous literature on teacher turnover and teacher
resiliency. Contextual and environmental factors should not be ignored, but more
attention should be placed on teachers as individuals, as their teaching efficacy can affect
work satisfaction, commitment, and intention to continue or quit as a teacher.
Insights from In-service Teachers
The correlation analysis focusing on in-service teachers demonstrated several
important insights. First, it was found that for in-service teachers, the more LMS or
learning analytics function they used, the higher TPK and teacher efficacy they would
attain. This result based on correlation analysis did not assume any causality or any
direction of influence. For in-service teachers, the use of LMS or learning analytics

48
functions could potentially increase their TPK and teacher efficacy. On the other hand,
this relationship could also be vice versa, where higher TPK or teaching efficacy could
increase the use of LMS or learning analytics functions. Another important finding was
in-service teachers’ perceptions of the usefulness of LMS learning analytics in teaching
and curriculum design. The correlation results showed that the perception of LMS
learning analytics as useful seemed to be the prerequisite for the positive correlation
between the use of LMS/learning analytics functions and their TPK/teaching efficacy. In
other words, as previously assumed, if using LMS/learning analytics functions could
increase teachers’ TPK and teaching efficacy, then this connection may hold true only for
those who have a prior perception that LMS learning analytics is helpful. The particular
result could offer three important points for studies going forward. First, when teachers
do not believe LMS learning analytics is helpful for their teaching or curriculum design,
using LMS learning analytics functions, even very often, may just be a routine in their
teaching work without the benefits of enhancing their TPK or teaching efficacy. Second,
for professional development that aims to teach teachers to use LMS learning analytics
and increase their TPK and teaching efficacy, both technical knowledge and teachers’
confidence are important. The training content should focus on giving teachers both the
technical skills as well as the confidence that LMS learning analytics can really be
helpful in their teaching. The last insight is for novice teachers. Naturally, due to the lack
of teaching experience, novice teachers may not have had much experience of using LMS
or learning analytics in teaching. However, based on the findings about in-service
teachers in the survey study, it may be safe to assume that if novice teachers are trained to
utilize various learning analytics functions and also develop a perception that learning

49
analytics is useful for their teaching, their TPK and teaching efficacy could also grow at
the same time.
Summary
The results from the learning analytics survey not only revealed important
information on how preservice and in-service teachers are utilizing LMS learning
analytics, but also pointed out a potential solution to increase teachers’ knowledge and
application of learning analytics in teaching.
The results of the learning analytics survey helped identify the gaps in using
learning analytics for both in-service and preservice teachers as well as different barriers
in using learning analytics between the two groups of teachers. Compared to in-service
teachers, preservice teachers’ lack of teaching practice, lack of analytical competence to
evaluate teaching outcomes, and low teaching efficacy appeared to be associated.
Preservice teachers also seemed to lack the knowledge of what LMS learning analytics is
capable of, although they were optimistic about using LMS learning analytics in their
teaching. These results motivated me to design a training intervention based on a learning
analytics professional development and an exploratory case study. The goal of this
dissertation research was to examine if a learning analytics professional development
would increase learning analytics knowledge and application for novice teachers. In
addition, it is imperative to know if a learning analytics professional development can
help novice teachers self-assess their teaching and also assess students’ learning
outcomes. If novice teachers become more capable of utilizing learning analytics in

50
teachers in this manner, this may lead to an increase in their teaching efficacy and help
reduce teacher turnover rates in the long run.

51
Chapter IV
CASE STUDY
Based on the findings from the survey study, I developed an exploratory case
study to investigate the effects of professional development in learning analytics for
novice teachers. The case study also examined if preliminary training in learning
analytics influenced novice and former teachers’ pedagogical knowledge (PK),
technological pedagogical knowledge (TPK), teaching efficacy, and teacher resiliency.
The case study was meant to explore the second research question, Can learning
analytics professional development assist teachers in developing skills to assess their
own teaching practices and student performance, and how do such skills and training
influence their teaching efficacy and teacher resiliency? This research question was
examined further through the following sub-questions:
1. Can professional development in learning analytics assist novice and former
teachers in developing skills to assess teaching practices and student
performance, and develop teachers’ confidence in using learning analytics for
teaching?
2. How does professional development in learning analytics influence novice
and former teachers’ pedagogical knowledge (PK) and technological

52
pedagogical knowledge (TPK), teaching efficacy, teacher resiliency, and their
intentions to use learning analytics in their teaching?
Methodology
This case study implemented a professional development in learning analytics as
an intervention. It was an exploratory study to examine the effects of this intervention on
novice teachers’ teaching efficacy, teaching resiliency, and learning analytics knowledge.
The following section describes in detail the design and measures for this exploratory
study.
Participants
There were five participants in this case study. All participants were Asian
females and their ages ranged between 22 and 28 years old. Among the five participants,
two were preservice math teachers. The remaining three participants were former English
teachers who temporarily stopped teaching while pursuing their master’s degrees.
Pseudonyms are used for all five participants when describing their participation in this
case study. Their background information is as follows.
Abby is a first-year preservice math teacher in a teacher education program. She
comes with 2 years of math teaching experience at a learning center prior to entering the
teacher education program, but has never taken on any formal teaching position.
Currently she is gaining teaching experience through the practicum in her teacher
education program. She has a statistics background and has worked as a statistician in the

53
past. She has some experience using LMS (i.e., Canvas) only as a student and has never
used any learning analytics functions.
Betty is a second-year preservice math teacher in a teacher education program.
She has never taken on any formal teaching position in schools. She has some experience
using LMS (i.e., Canvas, Class Dojo) as a student, and has never used any learning
analytics functions.
Cindy is a graduate student and a former English teacher with 6 years of formal
teaching experience in high school in Japan and the United States. She has experience
using LMS (i.e., Moodle, Canvas, and Schoology) both as a student and a teacher, and
has used learning analytics functions to monitor students’ learning progress and
outcomes.
Daisy is a graduate student and a former English teacher with 3 years of formal
teaching experience at a middle school. She has experience using LMS (i.e., Blackboard)
in her teaching for more than 2 years, and has used Blackboard to make course
announcements, monitor students’ learning outcomes, and make pedagogical decisions.
Ellen is a graduate student and a former English teacher with 6 months of formal
teaching experience at an elementary school and adult learning center. She has
experience using LMS (i.e., Canvas) only as a student but never while teaching.
The participants were recruited through announcement via school group email,
flyers posted in public spaces at school, and word-of-mouth through a collegiate
instructor with whom the author has a connection. There was a basic screening process to
make sure participants either resided in a preservice teacher education program or had
54
some formal teaching experience. The compensation for the participants was $45 upon
finishing the 3 weeks of learning analytics professional development. No additional
course credits, course bonus points, benefits, or rewards were given to the participants.
Procedure
After giving their consent to participate in this case study, each participant met
one-to-one with the facilitator (i.e., researcher conducting the study) and completed the
survey packet and a pretest (i.e., learning analytics to check for prior knowledge). All
participants individually engaged with the facilitator in a one-to-one session covering the
same learning analytics professional development for the next 3 weeks. Each week, the
session lasted between 90-100 minutes, which consisted of a 40-50-minute tutorial/
review session and some time to answer surveys/scenario/interview questions (please
refer to the Measures section). Each week, participants received a learning analytics
professional development in a different topic area in learning analytics (see Table 3), and
were then asked to fill out a survey packet and answer short interview questions. On
completion of the Week 3 tutorial, participants were asked to fill out the survey packet,
answer scenario questions, complete the posttest, and respond to a final exit interview.
This completed the 3-week study. The next section explains a common structure across
all tutorials and activities in the professional development. This section is followed by a
week-by-week description of the tutorial session.
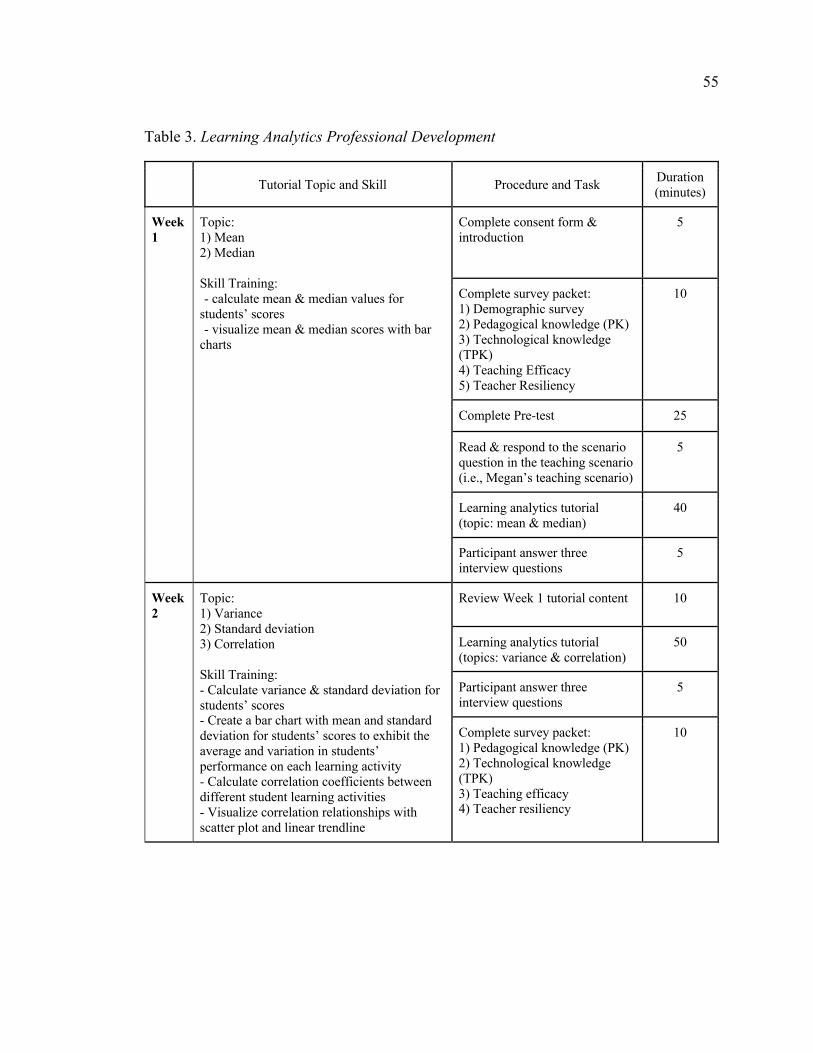
55
Table 3. Learning Analytics Professional Development
Tutorial Topic and Skill Procedure and Task Duration (minutes)
Week 1
Topic: 1) Mean 2) Median Skill Training: - calculate mean & median values for
students’ scores - visualize mean & median scores with bar
charts
Complete consent form & introduction
5
Complete survey packet: 1) Demographic survey 2) Pedagogical knowledge (PK) 3) Technological knowledge (TPK) 4) Teaching Efficacy 5) Teacher Resiliency
10
Complete Pre-test 25
Read & respond to the scenario question in the teaching scenario (i.e., Megan’s teaching scenario)
5
Learning analytics tutorial (topic: mean & median)
40
Participant answer three interview questions
5
Week 2
Topic: 1) Variance 2) Standard deviation 3) Correlation Skill Training: - Calculate variance & standard deviation for students’ scores - Create a bar chart with mean and standard deviation for students’ scores to exhibit the average and variation in students’ performance on each learning activity - Calculate correlation coefficients between different student learning activities - Visualize correlation relationships with scatter plot and linear trendline
Review Week 1 tutorial content 10
Learning analytics tutorial (topics: variance & correlation)
50
Participant answer three interview questions
5
Complete survey packet: 1) Pedagogical knowledge (PK) 2) Technological knowledge (TPK) 3) Teaching efficacy 4) Teacher resiliency
10
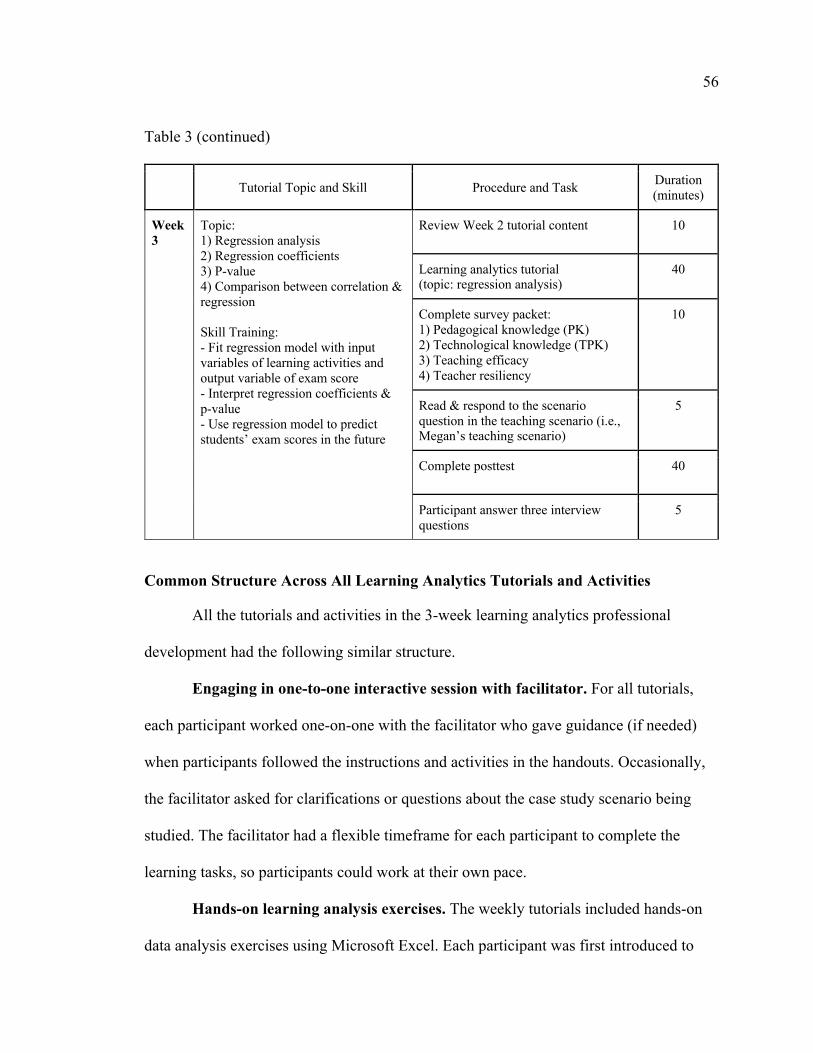
56
Table 3 (continued)
Tutorial Topic and Skill Procedure and Task Duration (minutes)
Week 3
Topic: 1) Regression analysis 2) Regression coefficients 3) P-value 4) Comparison between correlation & regression Skill Training: - Fit regression model with input variables of learning activities and output variable of exam score - Interpret regression coefficients & p-value - Use regression model to predict students’ exam scores in the future
Review Week 2 tutorial content 10
Learning analytics tutorial (topic: regression analysis)
40
Complete survey packet: 1) Pedagogical knowledge (PK) 2) Technological knowledge (TPK) 3) Teaching efficacy 4) Teacher resiliency
10
Read & respond to the scenario question in the teaching scenario (i.e., Megan’s teaching scenario)
5
Complete posttest 40
Participant answer three interview questions
5
Common Structure Across All Learning Analytics Tutorials and Activities
All the tutorials and activities in the 3-week learning analytics professional
development had the following similar structure.
Engaging in one-to-one interactive session with facilitator. For all tutorials,
each participant worked one-on-one with the facilitator who gave guidance (if needed)
when participants followed the instructions and activities in the handouts. Occasionally,
the facilitator asked for clarifications or questions about the case study scenario being
studied. The facilitator had a flexible timeframe for each participant to complete the
learning tasks, so participants could work at their own pace.
Hands-on learning analysis exercises. The weekly tutorials included hands-on
data analysis exercises using Microsoft Excel. Each participant was first introduced to

57
different learning analytics concepts and methods (i.e., mean, median, variance,
correlation, regression), then worked on example questions, and were asked to explain
their thought process so the facilitator could confirm participants had a good
understanding of the topic. An example excerpt from the first week is presented below:
Mean is a value that represents an average of an array of numbers. To calculate a mean value, you will need to add the numbers together and divide it by the total count of numbers supplied. For example, the mean of (2,4,6) will be 4.
Once the participant demonstrated good understanding of the concept and
method, she would then continue with the tutorial, following the instructions in the
handout and completing other learning analytics tasks using Microsoft Excel.
Learning analytics embedded in a teaching scenario. All the learning analytics
tutorials, activities, and tasks were structured around a teaching scenario about a fictitious
teacher colleague, Megan, who asked the participant for advice regarding her teaching
plan and student performance. Participants were told they were presented with Megan’s
student data to help answer various learning analytics questions for Megan. The
participants used these data to complete the tutorial activity, and then gave appropriate
advice to Megan based on their findings. Below is an excerpt from the Week 1 tutorial on
computing the mean value:
Your colleague Megan has been teaching a few mathematical concepts to her students. She has also collected several students’ scores on various learning activities. She has shared these learning data with you. [Participants are guided to view the data in Excel.] Now Megan wants to know the mean score for each learning activity her students have finished. She wants to compare the mean of the quiz, assignment, and test scores across the three math concepts she has taught to her students. [Participants are guided to next steps to compute different mean score with the help from the author.]
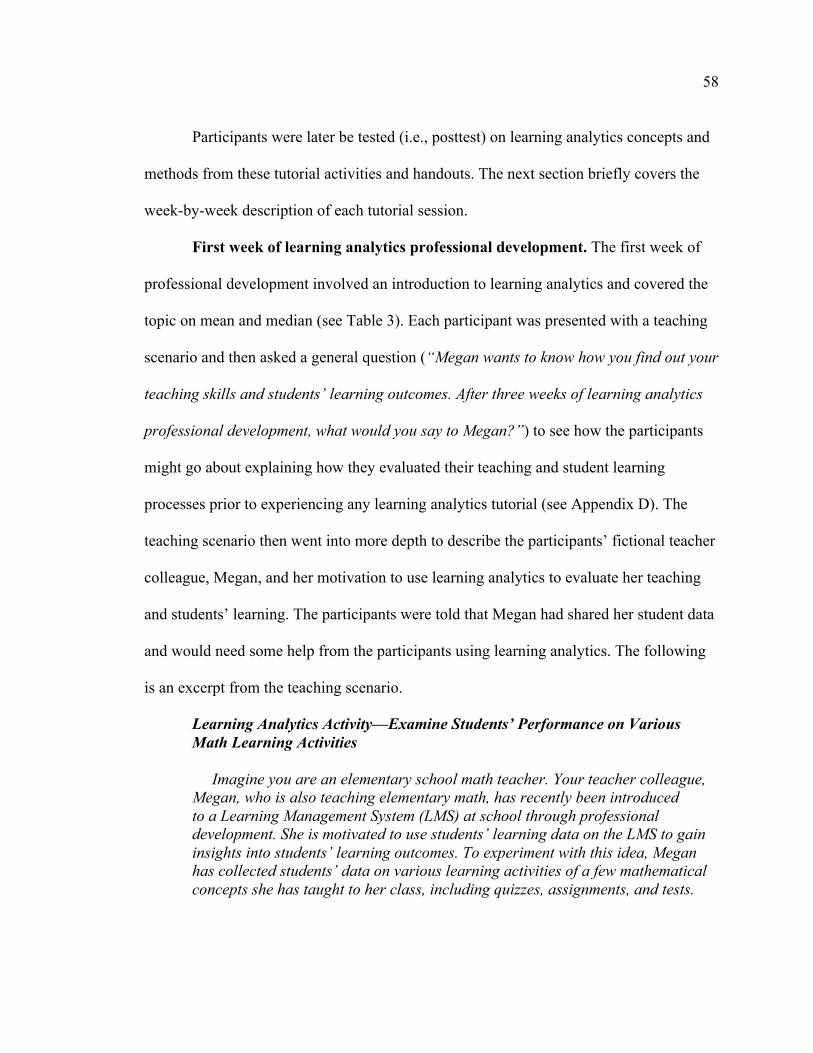
58
Participants were later be tested (i.e., posttest) on learning analytics concepts and
methods from these tutorial activities and handouts. The next section briefly covers the
week-by-week description of each tutorial session.
First week of learning analytics professional development. The first week of
professional development involved an introduction to learning analytics and covered the
topic on mean and median (see Table 3). Each participant was presented with a teaching
scenario and then asked a general question (“Megan wants to know how you find out your
teaching skills and students’ learning outcomes. After three weeks of learning analytics
professional development, what would you say to Megan?”) to see how the participants
might go about explaining how they evaluated their teaching and student learning
processes prior to experiencing any learning analytics tutorial (see Appendix D). The
teaching scenario then went into more depth to describe the participants’ fictional teacher
colleague, Megan, and her motivation to use learning analytics to evaluate her teaching
and students’ learning. The participants were told that Megan had shared her student data
and would need some help from the participants using learning analytics. The following
is an excerpt from the teaching scenario.
Learning Analytics Activity—Examine Students’ Performance on Various Math Learning Activities Imagine you are an elementary school math teacher. Your teacher colleague, Megan, who is also teaching elementary math, has recently been introduced to a Learning Management System (LMS) at school through professional development. She is motivated to use students’ learning data on the LMS to gain insights into students’ learning outcomes. To experiment with this idea, Megan has collected students’ data on various learning activities of a few mathematical concepts she has taught to her class, including quizzes, assignments, and tests.

59
Although Megan is excited about the insights that students’ learning data may bring on this LMS system, she is trying to understand how the different learning activities she designs help students learn different math concepts. Megan wants to know how you find out your teaching skills, and students’ learning outcomes.
After participants responded to the scenario question (“Megan wants to know how
you find out your teaching skills and students’ learning outcomes. What would you say to
Megan?”) the participants began the learning analytics tutorial for the first week (see
Appendix F). The tutorial topics in the first week were mean and median in statistics.
During the tutorial, the facilitator ensured the participants developed a solid
understanding of the tutorial content. At the end of the /Week 1 tutorial, the participants
were asked three interview questions on their perceived importance and relevance of the
tutorial content to their own teaching, and how they might apply the learning analytics
skills to their teaching (see Appendix E).
Second week of learning analytics professional development. The second week
of professional development covered the topics variance, standard deviation, and
correlation (see Table 3). The facilitator began the session by asking several review
questions from the first week. The facilitator made sure the participants understood each
question before asking the next question. If the participants gave incorrect responses, the
facilitator would review relevant content from the previous week. The facilitator then
revisited the ongoing teaching scenario with the fictitious colleague, Megan, and
continued the learning analytics tutorial for the second week (see Appendix G). After the
tutorial, participants were asked the same three interview questions on the relevance,
importance, and application of this week’s tutorial to their own teaching. Participants

60
were then asked to complete a survey packet (see Appendix H) that consisted the
pedagogical knowledge (PK), technological pedagogical knowledge (TPK), teaching
efficacy, and teaching resiliency survey (see Table 3).
Third week of learning analytics professional development. The third week of
professional development covered the topics regression analysis, regression coefficients,
P-value, and comparisons between correlation and regression (see Table 3). The
facilitator began the session asking several review questions from the second week. The
facilitator made sure the participants understood each question before asking the next
question. If the participants gave incorrect responses, the facilitator would review
relevant content from the previous weeks. The facilitator then revisited the ongoing
teaching scenario with their fictitious colleague, Megan, and continued the learning
analytics tutorial for the third week (see Appendix I). After the tutorial, participants
answered the same three interview questions on the relevance, importance, and
application of this week’s tutorial to their own teaching. Participants were then asked to
respond to the general scenario question from the first week (“Megan wants to know how
you find out your teaching skills and students’ learning outcomes. After three weeks of
learning analytics professional development, what would you say to Megan?”). This
question was asked a second time to see how the participants responded after
experiencing the 3-week tutorial. The participants then filled out the survey packet and
continued on to the posttest (see Appendix J).

61
Measures
Several quantitative and qualitative measures were used in this exploratory case
study. Table 4 below lists the name, type of measure, source, and number of times
administered, followed by a detailed description of each.
Table 4. Overview of Measures Used in the Exploratory Case Study
Name of Measure Type/Reliability Source # of Times
Administered
Pedagogical knowledge (PK)
6 quantitative questions/ Cronbach’s alpha = 0.85
Banas & York (2014)
Week 1, 2, 3
Technological pedagogical knowledge (TPK)
4 quantitative questions/Cronbach’s alpha = 0.84
Banas & York (2014)
Week 1, 2, 3
Teaching efficacy 12 quantitative questions/ Cronbach’s alpha = 0.91
Tschannen-Moran & Hoy (2001)
Week 1, 2, 3
Teacher resiliency 25 quantitative questions/Cronbach’s alpha = 0.91
Wagnild & Young (1993)
Week 1, 2, 3
Post-professional development interview questions
3 quantitative questions Developed by author
Week 1, 2, 3
Response to general scenario question in the case study
1 qualitative question Developed by author
Week 1, 3
Learning analytics knowledge questions (pretest)
20 multiple-choice and blank-filling questions
Developed by author
Week 1
Learning analytics knowledge questions (posttest)
21 multiple-choice and blank-filling questions
Developed by author
Week 3

62
Survey Packet: PK, TPK, Teaching Efficacy, Teacher Resiliency
The survey packet consisted of several surveys (i.e., PK, TPK, teaching efficacy,
and teacher resiliency) that were administered throughout the 3-week learning analytics
professional development (see Table 4). The Technological & Pedagogical Knowledge
(TPK) Questionnaire consists of four questions that measure how teachers use
technologies in their teaching and how they see technology as a way to change
instruction. TPK is the same measure administered in the learning analytics survey study
(please refer to the Measures section in Chapter III). To estimate the effect of the
professional development on novice teachers’ general pedagogical knowledge, another
pedagogical knowledge (PK) from Banas and York (2014) was also incorporated. Banas
and York’s PK measure came from the original PK measure developed by Schmidt et al.
(2009). The only difference in the Banas and York version was that they removed one
question (“I know how to organize and maintain classroom management”) from the
original measure because classroom management was not an integral part for the teacher
training in their study. Banas and York’s PK measure was also administered in this case
study because classroom management was also not the focus of the learning analytics
professional development. Example questions from the PK measure included: “I can
assess student performance in the classroom” and “I can adapt my teaching style to
different learners.” For both PK and TPK measures, participants were asked to respond
to these statements using a 7-point Likert scale, where 1 indicated disagree and 7
indicated agree. The PK and TPK measures have been validated to have high reliability
where Cronbach’s alpha for PK = 0.85 (6 questions) and Cronbach’s alpha for TPK =
0.84 (4 questions).

63
Teaching Efficacy is the same questionnaire administered in the learning analytics
survey study (please refer to the Measures section in Chapter III). This questionnaire
developed by Tschannen-Moran and Hoy (2001) measures teacher’s efficacy and
confidence in instructional practices and student engagement and has a high reliability of
Cronbach’s alpha = .91 (12 questions). An example question in this measure is “To what
extent can you use a variety of assessment strategies?” For each question in this measure,
participants were asked to respond on a 9-point Likert scale where 1 indicated Nothing
and 9 indicated A great deal.
The new measure added to this case study was the Teacher Resiliency
questionnaire developed by Wagnild and Young (1993) as a 25-item Resilience Scale
(RS). It is a widely used resilience measure for research with teachers. Pretsch, Flunger,
and Schmitt (2012) adopted Wagnild and Young’s measure and found teacher resiliency
could predict their well-being, which included their general health perception, job
satisfaction, exhaustion, and physical illness. The reliability of this teacher resiliency
questionnaire is high, with Cronbach’s alpha at 0.91 (Wagnild & Young, 1993). In
Pretsch et al.’s (2012) study that focused primarily on teachers, Cronbach’s alpha was
0.85. Example questions in this measure included “I am able to depend on myself more
than anyone else” and “My belief in myself gets me through hard times.” This measure
was conducted with a 7-point Likert scale, where on that scale 1 indicated disagree and
7 indicated agree.
It is important to note the timing of when the survey packet (PK, TPK, teaching
efficacy, teacher resiliency) was administered. For the first week, all these measures were
administered before the tutorial in order to set a benchmark. For the second and third
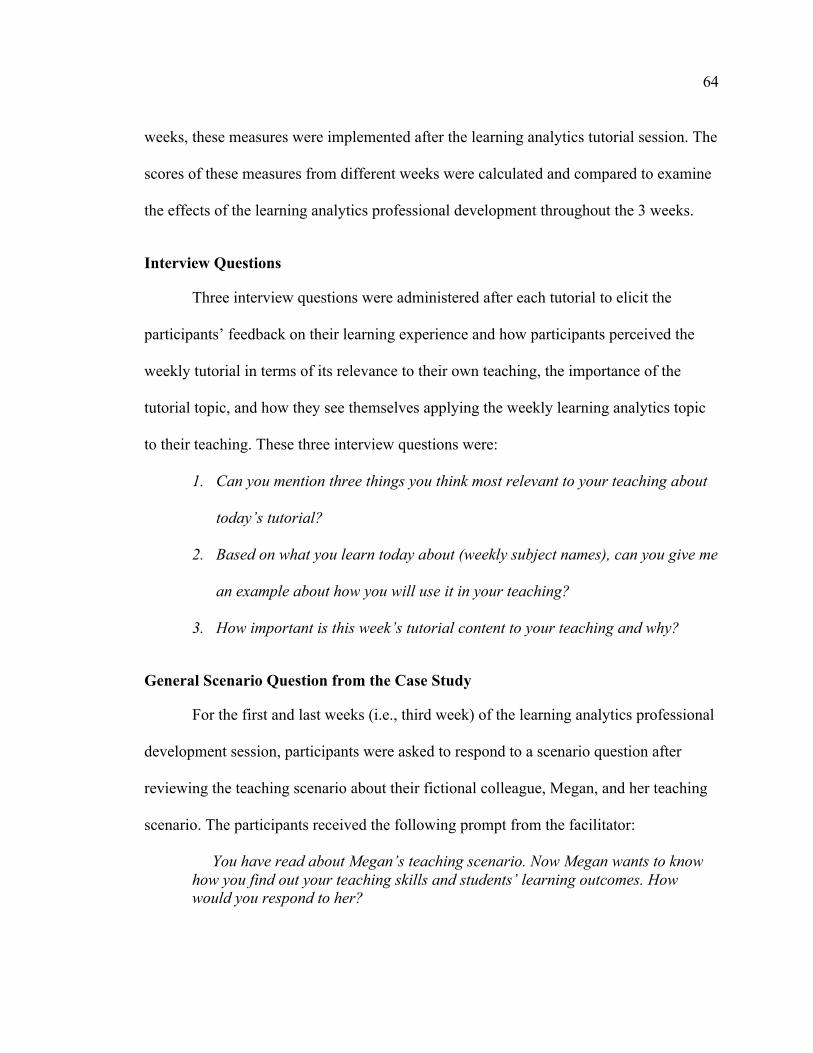
64
weeks, these measures were implemented after the learning analytics tutorial session. The
scores of these measures from different weeks were calculated and compared to examine
the effects of the learning analytics professional development throughout the 3 weeks.
Interview Questions
Three interview questions were administered after each tutorial to elicit the
participants’ feedback on their learning experience and how participants perceived the
weekly tutorial in terms of its relevance to their own teaching, the importance of the
tutorial topic, and how they see themselves applying the weekly learning analytics topic
to their teaching. These three interview questions were:
1. Can you mention three things you think most relevant to your teaching about
today’s tutorial?
2. Based on what you learn today about (weekly subject names), can you give me
an example about how you will use it in your teaching?
3. How important is this week’s tutorial content to your teaching and why?
General Scenario Question from the Case Study
For the first and last weeks (i.e., third week) of the learning analytics professional
development session, participants were asked to respond to a scenario question after
reviewing the teaching scenario about their fictional colleague, Megan, and her teaching
scenario. The participants received the following prompt from the facilitator:
You have read about Megan’s teaching scenario. Now Megan wants to know how you find out your teaching skills and students’ learning outcomes. How would you respond to her?
65
Participants were asked to respond freely to this question on two occasions (Week
1 and Week 3) to see how their response might change before and after experiencing the
learning analytics professional development.
Learning Analytics Knowledge and Skill Questions
In the first week as a pretest and the last week as a posttest, a set of learning
analytics knowledge and skill questions was administered to measure the participants’
learning gains from the three tutorials (see Table 4). The questions from the pretest and
posttest covered the 3-week learning analytic tutorial content. The questions were slightly
rephrased from pretest to posttest. Some questions were the same, but asked as a two-part
question, covering the same content. Participants’ responses to these questions included
multiple-choices, explanation for multiple-choice questions, blank-filling questions, and
the calculation process for those blank-filling questions. Some questions asked for
explanations to ensure that multiple-choice questions were not answered correctly by
chance and participants truly understood the statistical concept. Because some questions
were changed from a single question to a two-part question, it may appear there was a
different total number of questions from pretest to posttest, but the tests placed equal
weight on each question, totaling to the same 54 points. Originally, two new additional
questions on the posttest were later removed due to redundancy and limited time.
There were three types of questions on both the pretest and posttest, which were
categorized as (1) basic, (2) inference, or (3) applied and increased in difficulty levels.
For example, for concepts on mean and median, a basic-level question appeared as
follows in Figure 8.

66
Figure 8. Example of Basic-level Learning Analytics Question
For all learning analytics questions in the pretest and posttest, to answer a basic-
level question correctly required participants to recall the steps to compute a numeric
value. In the above example, participants needed to remember the steps to compute the
median value for the two given number lists (i.e., sort numbers in each list and retrieve
the middle number).
The second level of the learning analytics knowledge question was inference
questions. For inference-level questions, participants needed to think more critically,
where interpretation may need to be drawn from multiple sources of information to get an
answer. For example, in the inference-level question below, participants needed to think
critically about how to sort each number list after adding the new number 88 and how to
get the median when the total number in each list was an even number.1
1 The correct steps to get a median value when there is an even number of numbers in a list is: (1) sort all the numbers based on the values of the number, (2) take the mean of the two middle numbers. For instance, for the number list (1,2,3,4), the median will be (2+3)/2=2.5.

67
Figure 9. Example of Inference-level Learning Analytics Question
The third type of question was the applied questions. The applied questions tested
participants’ ability to synthesize their basic- and inference-level knowledge and use it in
a practical scenario. Not only did participants need to know the concept and be able to
perform basic computation, but they also needed to be able to compare different answer
options in a near-reality scenario. An example application-level question is shown below
in Figure 10.
Figure 10. Example of Applied-level Learning Analytics Question

68
For this applied question, participants needed to: (1) know the basic definition of
mean and median; (2) identify steps to compute mean and median values of the same
number list; (3) compare mean and median value; (4) think critically if mean or median
can better represent the center of students’ scores in a real teaching setting; and (5) write
down their reasoning to explain their answer. Thus, applied questions could be seen as
the integration of the basic- and inference-level hands-on questions in real life that
extended learning analytics knowledge from the conceptual to the pedagogical level.
Results of the Case Study
This section describes the results from the learning analytics professional
development in this case study. I begin by providing the results of the intervention at the
group level that included all five participants (i.e., Abby, Betty, Cindy, Daisy, and Ellen).
I then take a closer look at each participant individually with regards to their knowledge
from the intervention, TPK, PK, teaching efficacy, and teaching resiliency.
Sub-question 1. At the Group Level, Can Professional Development in Learning
Analytics Assist Novice Teachers in Developing Skills to Assess Teaching Practices
and Student Performance?
Learning gains after the 3-week learning analytics professional development
sessions. There was a total of 32 questions with a total score of 54 points in both pretest
and posttest. For the convenience of data analysis, participants’ raw scores were
converted into an accuracy percentage. For instance, if a participant scored 40 out of 54
total points, then her accuracy percentage score was 40/54 x 100 = 74.1 points. The same
accuracy percentage conversion was applied to participants’ posttest scores as well.

69
The results showed that after 3 weeks of the learning analytics professional
development, nearly all participants had increased their learning analytics knowledge
with the exception of Betty (see Figure 11). For the first novice teacher, Abby, her
learning analytics knowledge score increased from 74.1 to 87 points. The second novice
teacher, Betty, was the only participant who showed a slight decline in the score after the
learning analytics professional development; her score went from 94.4 to 87 points.
Despite the slight score decline, Betty’s pretest and posttest scores were still the highest
among all participants. The third teacher, Cindy, showed a significant score increase from
63 to 85.2 points. Similarly, Daisy’s score also increased significantly from 51.9 to 89.8
points. The last novice teacher, Ellen, demonstrated the largest growth in the learning
analytics knowledge score: Her score increased from 38.9 to 88.9 points between the
pretest and posttest.
Figure 11. Change in Learning Analytics Knowledge after Learning Analytics Professional Development for All Participants
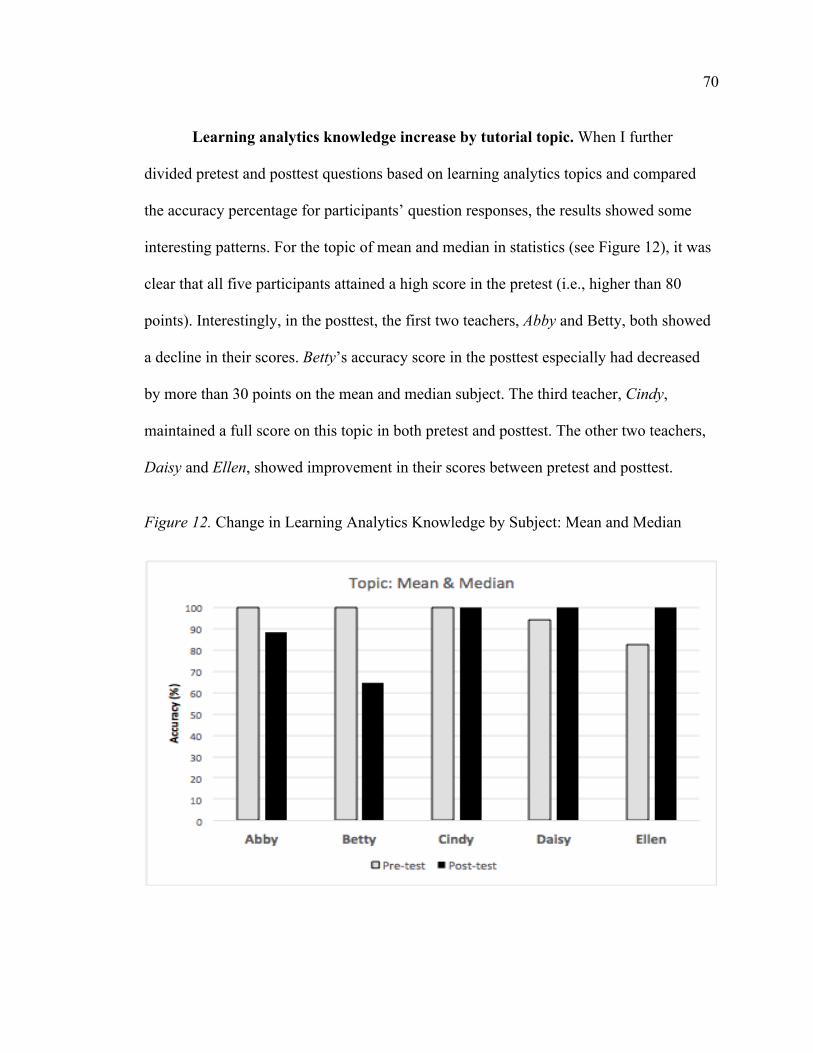
70
Learning analytics knowledge increase by tutorial topic. When I further
divided pretest and posttest questions based on learning analytics topics and compared
the accuracy percentage for participants’ question responses, the results showed some
interesting patterns. For the topic of mean and median in statistics (see Figure 12), it was
clear that all five participants attained a high score in the pretest (i.e., higher than 80
points). Interestingly, in the posttest, the first two teachers, Abby and Betty, both showed
a decline in their scores. Betty’s accuracy score in the posttest especially had decreased
by more than 30 points on the mean and median subject. The third teacher, Cindy,
maintained a full score on this topic in both pretest and posttest. The other two teachers,
Daisy and Ellen, showed improvement in their scores between pretest and posttest.
Figure 12. Change in Learning Analytics Knowledge by Subject: Mean and Median

71
With regard to the topics of variance and correlation, all five participants showed
improvement in their scores between pretest and posttest. The first three teachers, Abby,
Betty, and Cindy, increased around 10 points between pretest and posttest. For Daisy and
Ellen, their scores showed a dramatic change. Daisy increased around 45 points, while
Ellen improved around 55 points between their pretest and posttest on the subject of
variance and correlation. All the participants except for Cindy were able to attain 80%
accuracy in their posttest scores. Cindy’s posttest score was a bit over 70% (see Figure
13).
Figure 13. Change in Learning Analytics Knowledge by Subject: Variance and Correlation
Regarding the last learning analytics topic of regression, all five participants
showed improvement in their scores between pretest and posttest, with the exception of
Betty, who maintained a full score between pretest and posttest. In general, participants
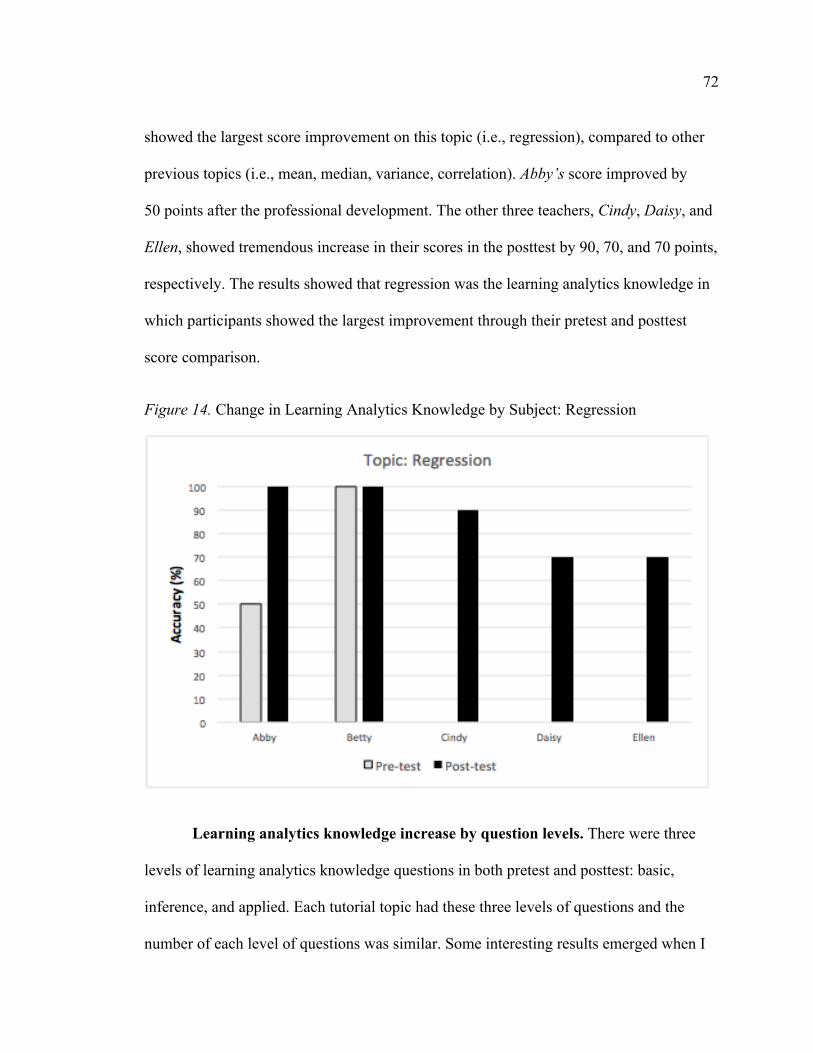
72
showed the largest score improvement on this topic (i.e., regression), compared to other
previous topics (i.e., mean, median, variance, correlation). Abby’s score improved by
50 points after the professional development. The other three teachers, Cindy, Daisy, and
Ellen, showed tremendous increase in their scores in the posttest by 90, 70, and 70 points,
respectively. The results showed that regression was the learning analytics knowledge in
which participants showed the largest improvement through their pretest and posttest
score comparison.
Figure 14. Change in Learning Analytics Knowledge by Subject: Regression
Learning analytics knowledge increase by question levels. There were three
levels of learning analytics knowledge questions in both pretest and posttest: basic,
inference, and applied. Each tutorial topic had these three levels of questions and the
number of each level of questions was similar. Some interesting results emerged when I
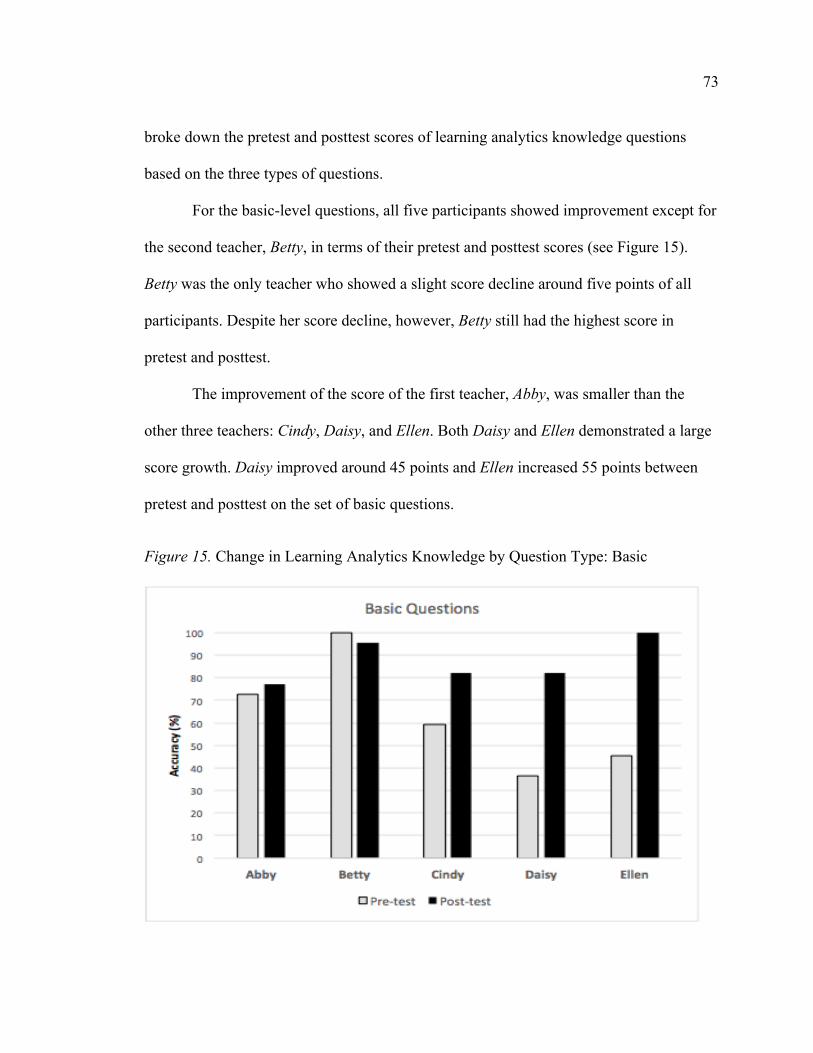
73
broke down the pretest and posttest scores of learning analytics knowledge questions
based on the three types of questions.
For the basic-level questions, all five participants showed improvement except for
the second teacher, Betty, in terms of their pretest and posttest scores (see Figure 15).
Betty was the only teacher who showed a slight score decline around five points of all
participants. Despite her score decline, however, Betty still had the highest score in
pretest and posttest.
The improvement of the score of the first teacher, Abby, was smaller than the
other three teachers: Cindy, Daisy, and Ellen. Both Daisy and Ellen demonstrated a large
score growth. Daisy improved around 45 points and Ellen increased 55 points between
pretest and posttest on the set of basic questions.
Figure 15. Change in Learning Analytics Knowledge by Question Type: Basic
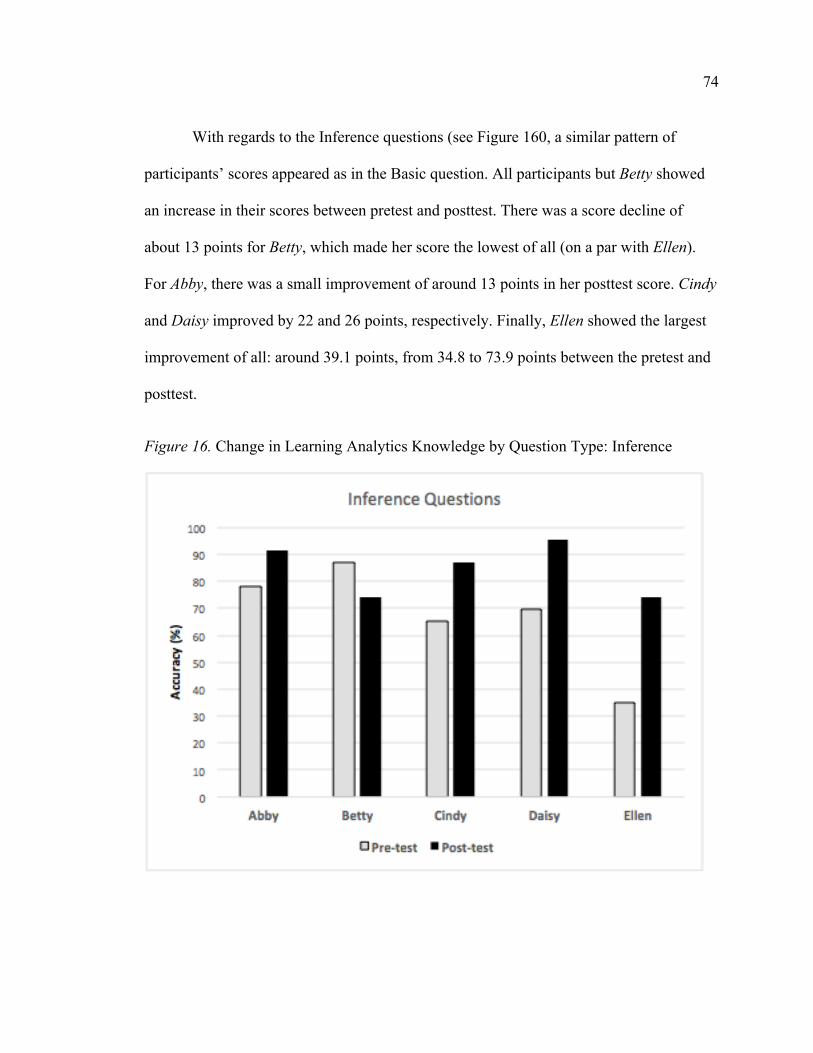
74
With regards to the Inference questions (see Figure 160, a similar pattern of
participants’ scores appeared as in the Basic question. All participants but Betty showed
an increase in their scores between pretest and posttest. There was a score decline of
about 13 points for Betty, which made her score the lowest of all (on a par with Ellen).
For Abby, there was a small improvement of around 13 points in her posttest score. Cindy
and Daisy improved by 22 and 26 points, respectively. Finally, Ellen showed the largest
improvement of all: around 39.1 points, from 34.8 to 73.9 points between the pretest and
posttest.
Figure 16. Change in Learning Analytics Knowledge by Question Type: Inference

75
For Applied questions, all five participants exhibited an improvement in their
scores between pretest and posttest. Abby, Betty, and Ellen achieved a perfect full posttest
score of 100. Ellen showed the biggest improvement with 66.7 points, while Abby, Cindy,
and Daisy also showed some significant improvement by about 33, 22, and 50 points,
respectively. Although Betty did not show a large improvement comparatively, her
pretest and posttest scores remained the highest among all participants.
Figure 17. Change in Learning Analytics Knowledge by Question Type: Applied
Sub-question 2. At the Group Level, How Does Professional Development in
Learning Analytics Influence Novice Teachers’ Pedagogical Knowledge (PK) and
Technological Pedagogical Knowledge (TPK), Teaching Efficacy, and Teacher
Resiliency?
In general, there was an increase in the average PK, TPK, and teacher resiliency
combining all five novice teachers after the intervention. The group average PKs
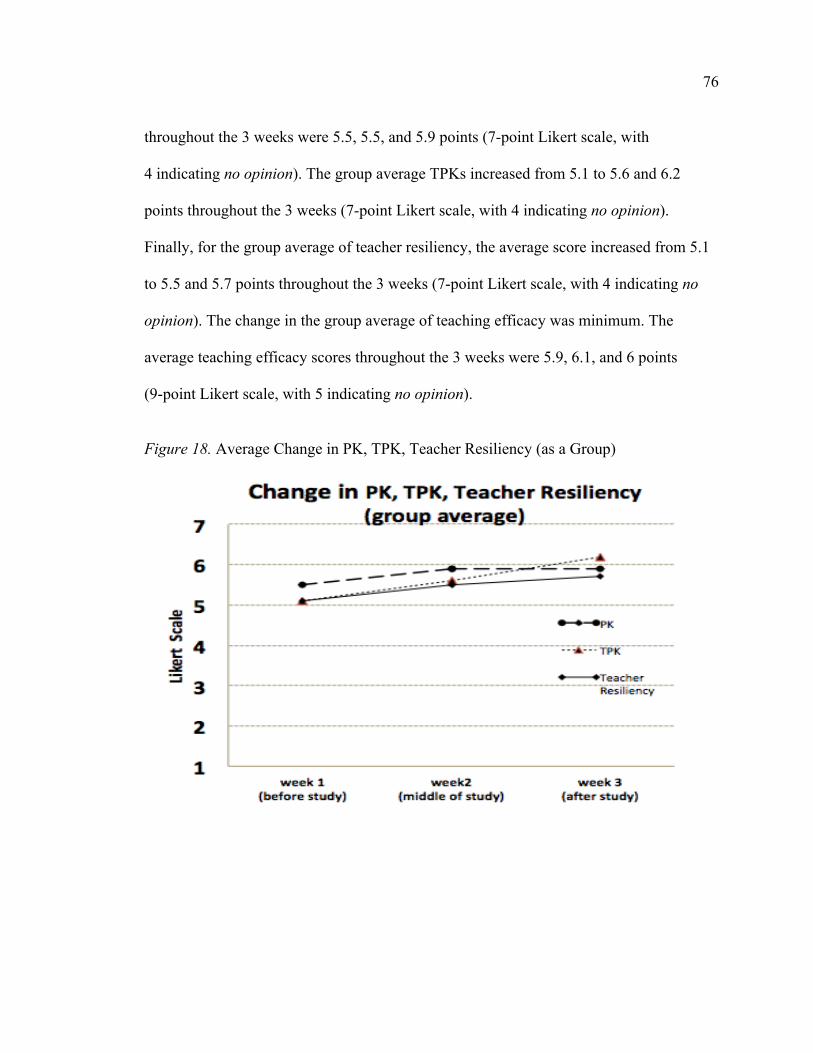
76
throughout the 3 weeks were 5.5, 5.5, and 5.9 points (7-point Likert scale, with
4 indicating no opinion). The group average TPKs increased from 5.1 to 5.6 and 6.2
points throughout the 3 weeks (7-point Likert scale, with 4 indicating no opinion).
Finally, for the group average of teacher resiliency, the average score increased from 5.1
to 5.5 and 5.7 points throughout the 3 weeks (7-point Likert scale, with 4 indicating no
opinion). The change in the group average of teaching efficacy was minimum. The
average teaching efficacy scores throughout the 3 weeks were 5.9, 6.1, and 6 points
(9-point Likert scale, with 5 indicating no opinion).
Figure 18. Average Change in PK, TPK, Teacher Resiliency (as a Group)

77
Figure 19. Average Change in PK, TPK, Teacher Efficacy (as a Group)
Another important result emerged when I compared participants’ PK based on
their levels of teaching experience (see Figure 20). The three former teachers (i.e., Cindy,
Daisy, and Ellen) had more prior teaching experience than the two other preservice
teachers (i.e., Abby and Betty). When I compared former teachers’ and preservice
teachers’ PK as two groups, the former teachers’ PK scores were higher than the
preservice teachers’ PK scores in the third week’s posttest. For the pretest in the first
week, except for one former teacher, Ellen, the other two former teachers’ PK scores
were also higher than those of the two preservice teachers.
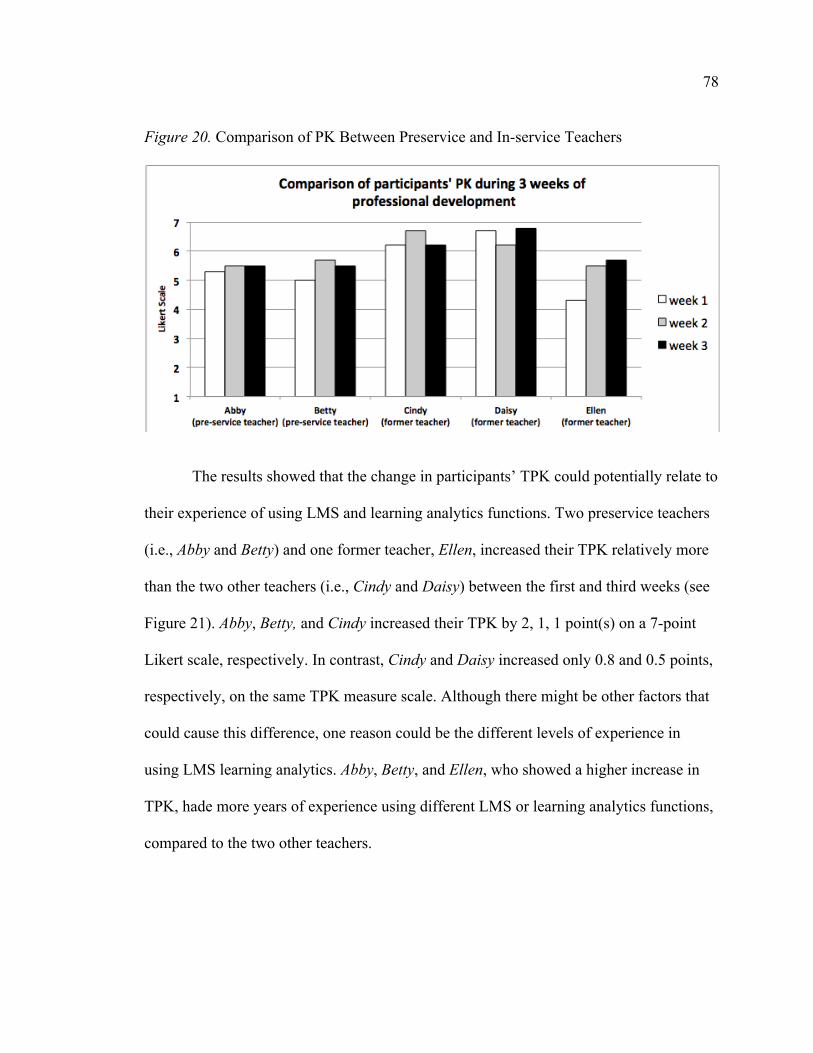
78
Figure 20. Comparison of PK Between Preservice and In-service Teachers
The results showed that the change in participants’ TPK could potentially relate to
their experience of using LMS and learning analytics functions. Two preservice teachers
(i.e., Abby and Betty) and one former teacher, Ellen, increased their TPK relatively more
than the two other teachers (i.e., Cindy and Daisy) between the first and third weeks (see
Figure 21). Abby, Betty, and Cindy increased their TPK by 2, 1, 1 point(s) on a 7-point
Likert scale, respectively. In contrast, Cindy and Daisy increased only 0.8 and 0.5 points,
respectively, on the same TPK measure scale. Although there might be other factors that
could cause this difference, one reason could be the different levels of experience in
using LMS learning analytics. Abby, Betty, and Ellen, who showed a higher increase in
TPK, hade more years of experience using different LMS or learning analytics functions,
compared to the two other teachers.
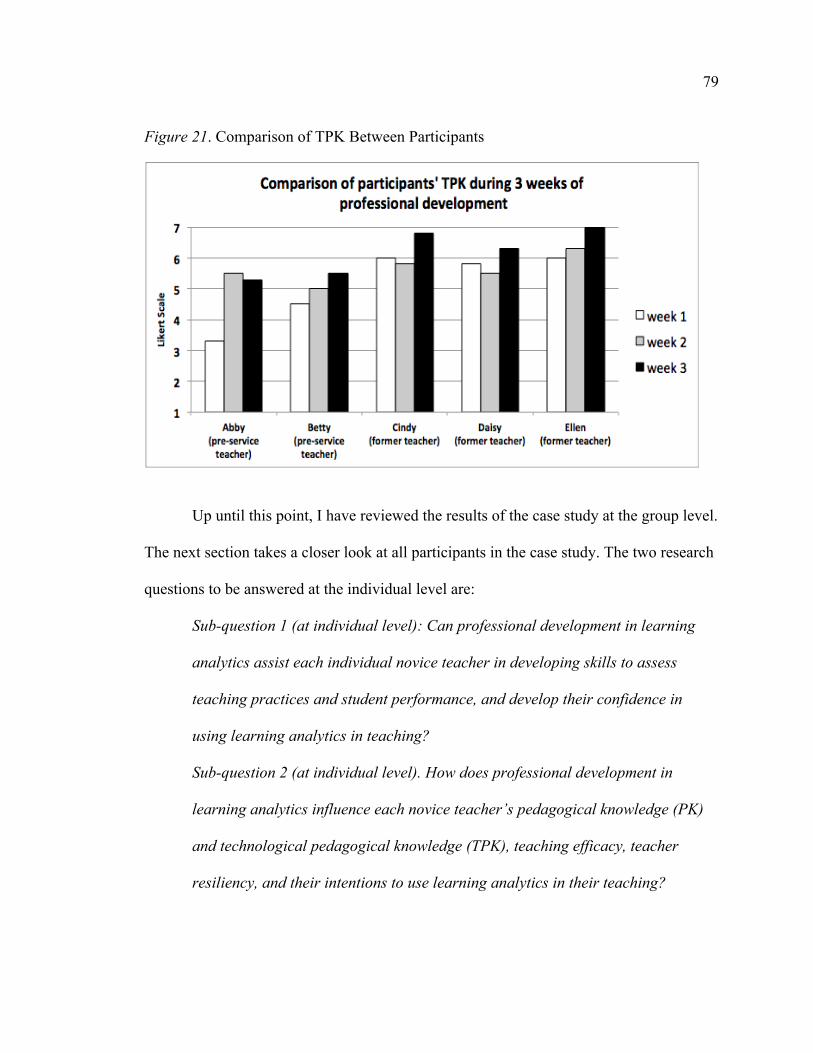
79
Figure 21. Comparison of TPK Between Participants
Up until this point, I have reviewed the results of the case study at the group level.
The next section takes a closer look at all participants in the case study. The two research
questions to be answered at the individual level are:
Sub-question 1 (at individual level): Can professional development in learning
analytics assist each individual novice teacher in developing skills to assess
teaching practices and student performance, and develop their confidence in
using learning analytics in teaching?
Sub-question 2 (at individual level). How does professional development in
learning analytics influence each novice teacher’s pedagogical knowledge (PK)
and technological pedagogical knowledge (TPK), teaching efficacy, teacher
resiliency, and their intentions to use learning analytics in their teaching?
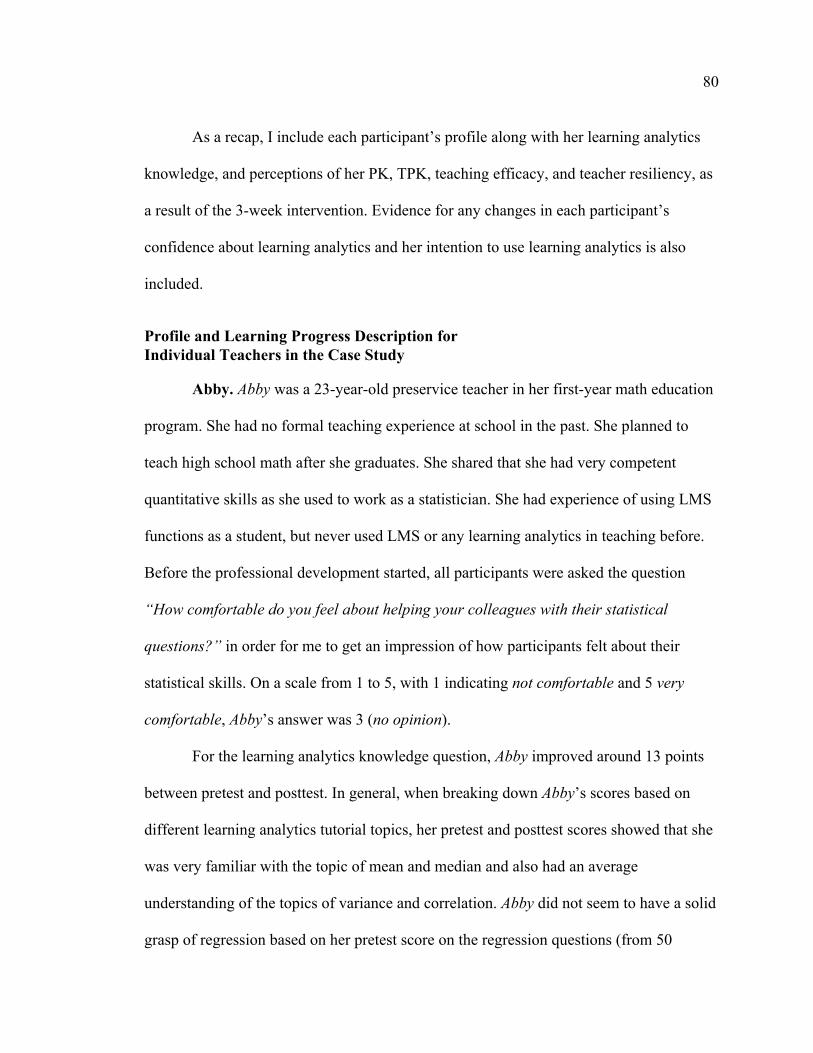
80
As a recap, I include each participant’s profile along with her learning analytics
knowledge, and perceptions of her PK, TPK, teaching efficacy, and teacher resiliency, as
a result of the 3-week intervention. Evidence for any changes in each participant’s
confidence about learning analytics and her intention to use learning analytics is also
included.
Profile and Learning Progress Description for
Individual Teachers in the Case Study
Abby. Abby was a 23-year-old preservice teacher in her first-year math education
program. She had no formal teaching experience at school in the past. She planned to
teach high school math after she graduates. She shared that she had very competent
quantitative skills as she used to work as a statistician. She had experience of using LMS
functions as a student, but never used LMS or any learning analytics in teaching before.
Before the professional development started, all participants were asked the question
“How comfortable do you feel about helping your colleagues with their statistical
questions?” in order for me to get an impression of how participants felt about their
statistical skills. On a scale from 1 to 5, with 1 indicating not comfortable and 5 very
comfortable, Abby’s answer was 3 (no opinion).
For the learning analytics knowledge question, Abby improved around 13 points
between pretest and posttest. In general, when breaking down Abby’s scores based on
different learning analytics tutorial topics, her pretest and posttest scores showed that she
was very familiar with the topic of mean and median and also had an average
understanding of the topics of variance and correlation. Abby did not seem to have a solid
grasp of regression based on her pretest score on the regression questions (from 50
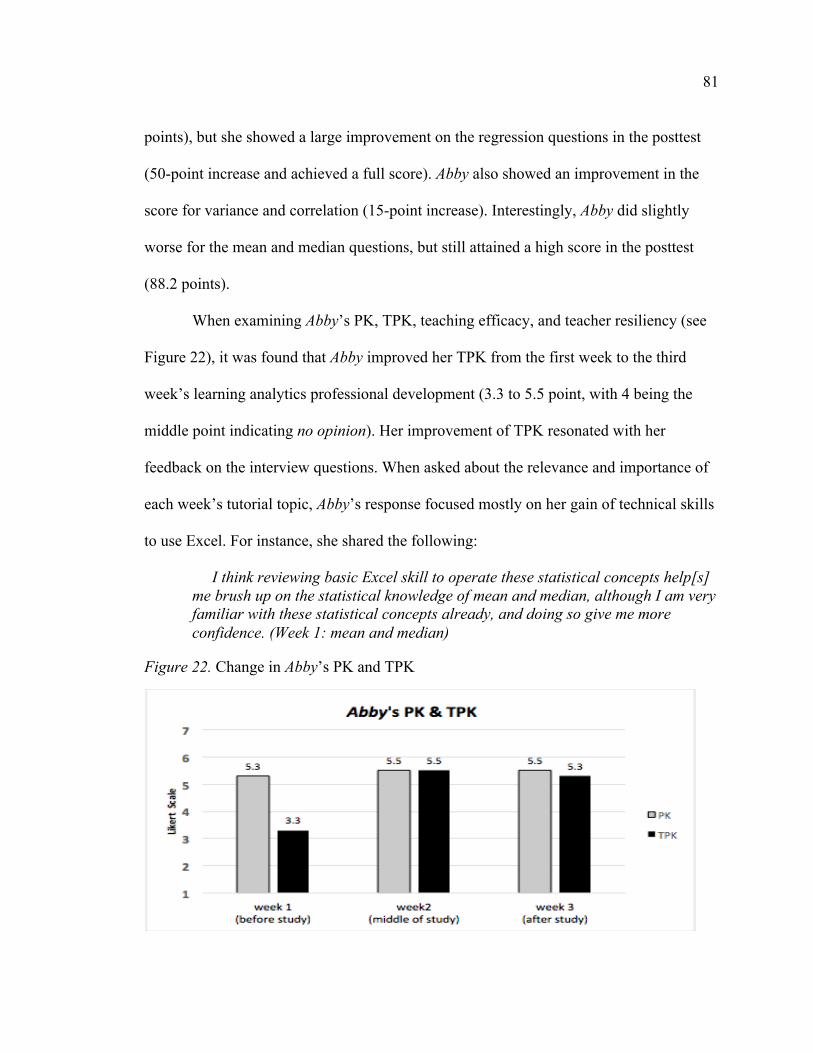
81
points), but she showed a large improvement on the regression questions in the posttest
(50-point increase and achieved a full score). Abby also showed an improvement in the
score for variance and correlation (15-point increase). Interestingly, Abby did slightly
worse for the mean and median questions, but still attained a high score in the posttest
(88.2 points).
When examining Abby’s PK, TPK, teaching efficacy, and teacher resiliency (see
Figure 22), it was found that Abby improved her TPK from the first week to the third
week’s learning analytics professional development (3.3 to 5.5 point, with 4 being the
middle point indicating no opinion). Her improvement of TPK resonated with her
feedback on the interview questions. When asked about the relevance and importance of
each week’s tutorial topic, Abby’s response focused mostly on her gain of technical skills
to use Excel. For instance, she shared the following:
I think reviewing basic Excel skill to operate these statistical concepts help[s] me brush up on the statistical knowledge of mean and median, although I am very familiar with these statistical concepts already, and doing so give me more confidence. (Week 1: mean and median)
Figure 22. Change in Abby’s PK and TPK
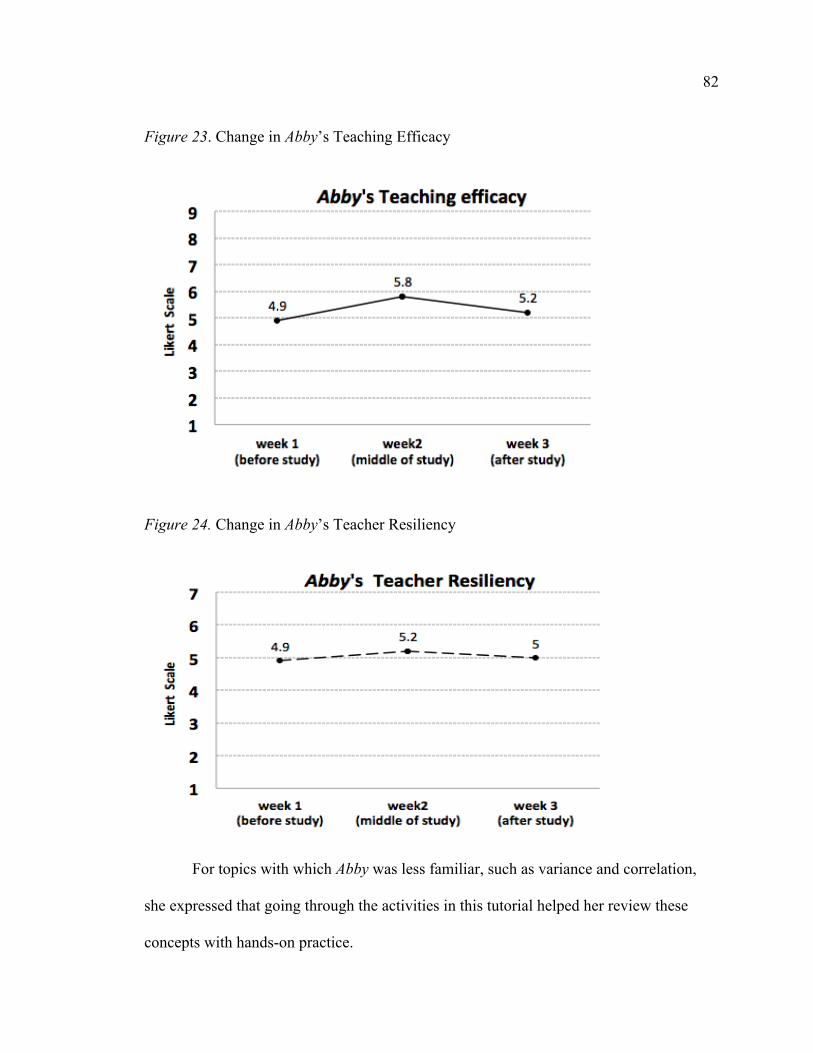
82
Figure 23. Change in Abby’s Teaching Efficacy
Figure 24. Change in Abby’s Teacher Resiliency
For topics with which Abby was less familiar, such as variance and correlation,
she expressed that going through the activities in this tutorial helped her review these
concepts with hands-on practice.

83
I used to be a statistician, and it is very helpful for me to go through this tutorial to reconsolidate these concepts. Also, it is useful for me to know how to run correlation analysis in Excel. I didn’t know how to do this before this tutorial…. (Week 2: variance and correlation)
Abby’s PK score went from 5.3 to 5.5 points on a 7-point Likert scale between the
first and third weeks. While not a large increase, the scores showed a sign that she
remained with a moderate-to-positive perception of her PK. Similarly, her teaching
efficacy score did not change much after the professional development (4.9 to 5.2 points,
with 5 being the middle point indicating no opinion) on a 9-point Likert scale. Yet the
results showed the direction of a positive perception of her teaching efficacy.
Interestingly, Abby attained the highest teaching efficacy score in the second week (5.8
points), but the score dropped at the end of the third week. This score decline could be
due to her unfamiliarity with the topic of regression. Although she believed she was
familiar with regression in statistics, her low pretest score on regression questions and her
response during the interview might have shown that she may not have been very
knowledgeable of regression analysis. She shared:
Reviewing the concepts of coefficients and p-value for regression has given me more confidence as I was re-consolidating these knowledge. It is useful to look into and learn together with the facilitator about the meaning of coefficients in regression. Although I used to be a statistician, this tutorial has really helped me to know how to explain these coefficients in a more understandable way especially to Megan in the case study. Now I know how to explain these to other teachers without statistical background. The last thing is knowing how to read and explain a regression table output. Being able to know how to produce and read a big regression statistical table in the Excel really helps me to review because I didn’t get much opportunity before. (Week 3: regression)
It is unusual for someone who has worked as a statistician not to know how to
read a statistical table for regression in statistics, even in Excel. Therefore, it is likely that
after the third week’s tutorial, which focused on the topic of regression, Abby

84
encountered some “reality check” about her knowledge of regression and realized she did
not have sufficient knowledge of regression analysis. This wake-up moment could
potentially hurt her confidence and thus reduce her teaching efficacy. Although a similar
pattern also emerged in Abby’s TPK and teacher resiliency, where her scores dropped
slightly from the second to the third week, these declines were very minimal, and it was
less certain whether these declines were associated with the same reason about her
learning experience with regression in the third week. Abby’s teacher resiliency did not
change much after the intervention. Her teaching resiliency score remained around 5
points on a 7-point Likert scale (with 4 being the middle point indicating no opinion).
This result might imply that Abby had maintained a slightly positive perception of her
teacher resiliency. It is important to point out that despite some of Abby’s changes on the
measure in this study being obvious, these quantitative results are presented in the
manner of descriptive statistics rather than inferential statistics. In other words, the
changes in Abby’s outcome metrics are not meant to make any statistical generalization
or inference for a larger teacher population. Moving forward, the same caveat will also
apply to the other participants in this case study. During the interview, Abby was also
asked how she planned to apply the knowledge she learned from the professional
development to her teaching, and she gave the following feedback for each week’s
tutorial topic:
As a teacher, it is very important to know how to use mean or median at the right time. If students’ scores deviate too much from the mean or median, it would be something that a teacher like me should be concerned about. (Week 1: mean and median) I would try to do the same thing like what we practiced in this tutorial. I will plug in students’ scores and try to see the correlation between different learning
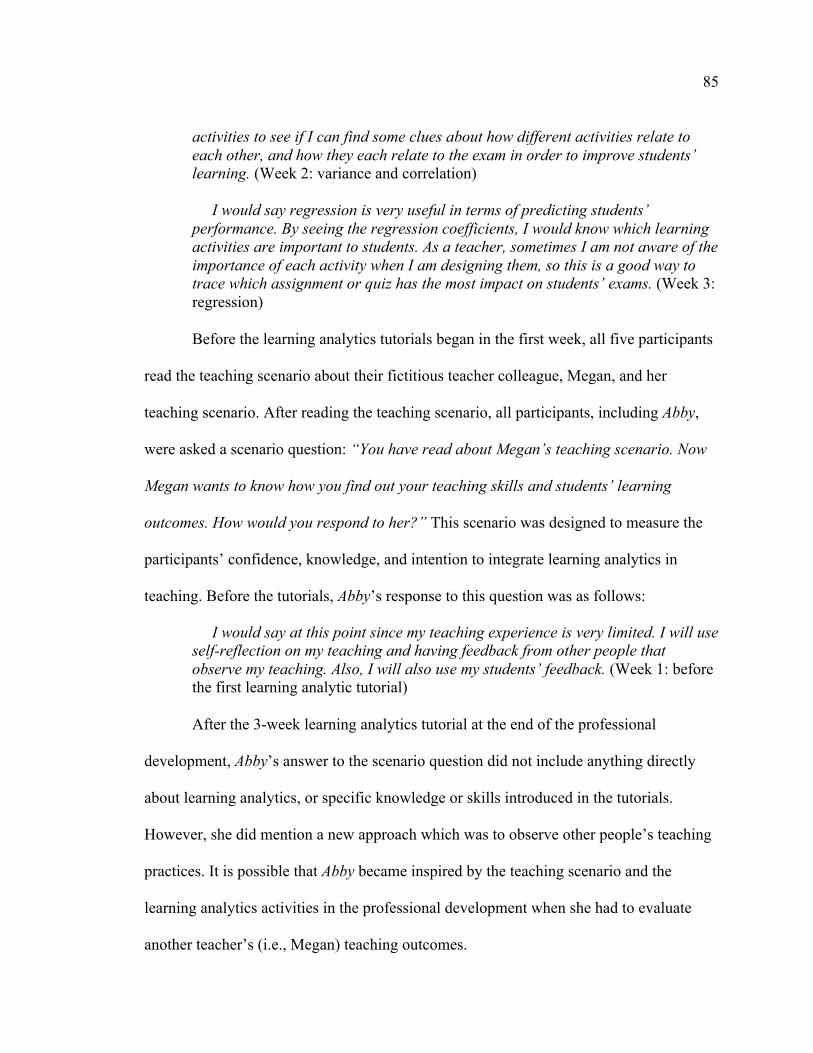
85
activities to see if I can find some clues about how different activities relate to each other, and how they each relate to the exam in order to improve students’ learning. (Week 2: variance and correlation) I would say regression is very useful in terms of predicting students’ performance. By seeing the regression coefficients, I would know which learning activities are important to students. As a teacher, sometimes I am not aware of the importance of each activity when I am designing them, so this is a good way to trace which assignment or quiz has the most impact on students’ exams. (Week 3: regression)
Before the learning analytics tutorials began in the first week, all five participants
read the teaching scenario about their fictitious teacher colleague, Megan, and her
teaching scenario. After reading the teaching scenario, all participants, including Abby,
were asked a scenario question: “You have read about Megan’s teaching scenario. Now
Megan wants to know how you find out your teaching skills and students’ learning
outcomes. How would you respond to her?” This scenario was designed to measure the
participants’ confidence, knowledge, and intention to integrate learning analytics in
teaching. Before the tutorials, Abby’s response to this question was as follows:
I would say at this point since my teaching experience is very limited. I will use self-reflection on my teaching and having feedback from other people that observe my teaching. Also, I will also use my students’ feedback. (Week 1: before the first learning analytic tutorial)
After the 3-week learning analytics tutorial at the end of the professional
development, Abby’s answer to the scenario question did not include anything directly
about learning analytics, or specific knowledge or skills introduced in the tutorials.
However, she did mention a new approach which was to observe other people’s teaching
practices. It is possible that Abby became inspired by the teaching scenario and the
learning analytics activities in the professional development when she had to evaluate
another teacher’s (i.e., Megan) teaching outcomes.

86
I think everyone has their teaching styles and preferences. And I think I can benefit from observing others’ teaching and use other people’s good teaching practices in my own teaching. It took me a long time to adjust my teaching so I can get to a level of feeling good enough to teach my students. A lot of practice will help. To evaluate my own teaching, I would see the reactions from my students in the classroom. For example, if they are falling asleep or leaving the classroom. I will also focus on the students’ feedback in the comment section in my teaching evaluation. (Week 3: after the last learning analytics tutorial)
Betty. Betty was a second-year preservice teacher in a math education program.
She was 22 years old and planned to teach middle school or high school math after
graduating from her teacher education program. She did not have any former teaching
experience as a full-time teacher at a school. She has used different LMS such as Canvas
and Class Dojo as a student, but never as a teacher, nor has she ever used any learning
analytics tools as a teacher. Betty was confident about her statistical knowledge and
skills. When asked the question “How comfortable do you feel about helping your
colleagues with their statistical questions?” before the tutorials started, Betty’s answer
was 5, “very comfortable,” on a scale from 1 to 5, where 1 indicated “not comfortable”
and 5 indicated “very comfortable.”
Betty was the only participant who showed a slight decline between the pretest
and posttest scores of the learning analytics knowledge questions (5.7 points decrease).
Despite this score decrease, her pretest (94.4 points) and posttest scores (87 points) were
still the highest among all participants. When breaking down Betty’s scores based on
different learning analytics tutorial topics, I found that Betty’s score decrease resulted
from her responses to the mean and median questions in the posttest. A deeper review of
her handwritten calculation process for those mean and median questions showed that she
misunderstood a median question as a mean question and thus lost three points in the

87
original posttest score. She answered the similar mean and median question correctly in
the pretest and also demonstrated a slight improvement in her scores for the variance and
correlation questions. Her scores for the regression analysis in both pretest and posttest
were perfect full scores. Therefore, it could be inferred that Betty’s decline in the learning
analytics knowledge question score was due mainly to her mistake of reading the
instructions incorrectly for the mean and median questions in the posttest. Overall,
Betty’s performance on the learning analytics knowledge questions was the highest
among all participants. This result resonated with her confidence in her statistical
knowledge that she expressed in the survey before the tutorials.
When examining Betty’s PK, TPK, teaching efficacy, and teacher resiliency (see
Figure 25), the results showed that, overall, there was an incremental improvement on
these outcome measures for her. Between the first and third weeks of the professional
development, her PK increased from 5 to 5.5 on a 7-point Likert scale. Her TPK also rose
from 4.5 to 5.5 on a 7-point Likert scale. For teaching efficacy, which was measured
based on a 9-point Likert scale with 5 being no opinion, her score increased from 5.8 to
6.9. In the end, her teacher resiliency score increased slightly from 5.4 to 5.8 on a 7-point
Likert scale, implying a positive perception of her teacher resiliency after the professional
development.
Betty’s growth in TPK and teaching efficacy was obvious. After the professional
development, her perception of her own TPK and teaching efficacy turned from neutral
(i.e., no opinion) to positive. From her interview responses, it is possible to see that the
growth in her TPK and teaching efficacy may have come from the improvement in her
technical skills to utilize Excel to perform learning analytics functions. For instance, here

88
is how Betty felt about the first week’s learning analytics tutorial for the topic of mean
and median:
Since I am already familiar with the concepts of mean and median, I think knowing how to operate these concepts using Excel as a tool is really important to me. The Excel skills in today’s tutorial are useful. (Week 1: mean and median)
Also, for the second and third weeks, although Betty was already familiar with the
weekly tutorial topics (i.e., variance, correlation, regression) based on her reactions
during the tutorials and her performance on the pretest scores on those types of learning
analytics knowledge questions, she found that this professional development extended
her knowledge of those topics and helped her think of how to use them in her teaching.
Here is some feedback from her when she was asked about the relevance and importance
of the second and third weeks’ tutorial to her:
Using correlation could help me know the underlying patterns. Another useful thing I would say is the correlation between students’ academic performance and non-academic things, like students’ average sleep hours in the tutorial. Something like tutoring time may correlates with students’ performance at school and it will be interesting to know. (Week 2: variance and correlation) Regression model is the most important concept to me so far because it can predict students’ performance. Also, by checking regression coefficients, I will know which learning activity contributes the most the exam and I can plan my teaching accordingly. (Week 3: regression)
Meanwhile, by the second week, Betty had already started integrating and
comparing the learning analytics knowledge she learned in the professional development
and was thinking about the advantages and limitations of each learning analytics concept.
Here is her feedback on the second and third weeks:
I think mean and median from the first week could only tell us how students perform, but correlation can give me ideas about how to help students improve their learning by giving them additional support. (Week 2: variance and correlation)

89
Knowing how to use coefficients in a regression model is definitely helpful. In Week Two, I learned about correlation, but the correlation relationship probably can’t provide strong evidence to tell us which variable contributes to which one so it is limited. But this week using regression can tell me about the causal relationship. (Week 3: regression)
Overall, it seemed that Betty’s weekly growth in PK, TPK, and TPK could have
been connected to her learning of how to utilize Excel to perform learning analytics
concepts and put them into use for teaching design and teaching assessment.
Betty’s teaching resiliency score did not change much after the professional
development and remained around 5.5 points on a 7-point Likert scale, although there
was a tendency of increase throughout those 3 weeks. This result implies that she
exhibited a positive perception of her teacher resiliency.
Figure 25. Change in Betty’s PK and TPK

90
Figure 26. Change in Betty’s teaching efficacy
Figure 27. Change in Betty’s teacher resiliency

91
During the interview, Betty was also asked how she planned to apply the knowledge
she learned from the professional development to her teaching. She shared some rather
specific thoughts about her plans to use the variance, correlation, and regression
knowledge to assess her own teaching and students’ learning outcomes:
I will use variance to see my teaching performance. If there is high variance between students’ performance, then it probably means there is something I can improve in my teaching. The second thing is to use correlation to see what correlate with the test score to see which learning activity is critical with regard to the test score. (Week 2: variance and correlation) Since I am doing student teaching for seventh graders and they will have the state test in April, if I could access students’ scores from last year, I will input different scores on different activities in a regression model to use it to predict on the state test score. Doing so can tell me which activity is important with regard to preparation for the test. It can also help me predict which students are likely to pass the state test. All of these can help me to help my students to prepare for their tests. (Week 3: regression)
Finally, before and after the 3-week learning analytics tutorials, Betty was asked
to answer the scenario question “How you find out your teaching skills and students’
learning outcomes” if Megan asked her. From her responses, it is possible to see that
after the professional development, Betty developed confidence in using more and
different tools and learning analytics knowledge to assist her to assess her own teaching:
When I have students’ learning data, I would calculate mean and median scores to compare students’ performance on different activities. Also, I would use variance to see about my teaching performance. If my teaching performance is good, then I should see the small variance in student scores. Regarding tools, I would just use Microsoft Excel to do all these data analysis, because I don’t want to use tools that are too complicated to understand. (Week 1: before the first learning analytic tutorial) Based on the data, for students’ learning outcomes, I can use data visualization to visualize students’ learning outcomes to help me better understand their learning progress. Also, I am able to use correlation analysis and regression analysis between my teaching skills and students’ learning results. With regard to tools, I will still use Excel as my default tool to use, but I am now

92
also open to other data analysis tools that can help me perform the same data analysis functions. (Week 3: after the last learning analytic tutorial)
Cindy. Cindy was a former full-time English teacher at a high school. She did not
share her age, but she reported that she had 6 years of full-time teaching experience in the
past. At the time this case study was conducted, she was pursuing her master’s degree
and has temporarily stopped teaching. She shared that she had previously used
Schoology, an LMS platform, for less than a year for her teaching. The LMS functions
she has used as a teacher included upload assignment, course reading, video, monitoring
students’ course participation, organizing course materials, and the like. The learning
analytics functions she has used in teaching included checking students’ learning
progress and outcomes through data dashboards. Compared to other participants, Cindy
had the most formal teaching experience and the most experience using LMS learning
analytics in teaching. However, when she was asked the question “How comfortable do
you feel about helping your colleagues with their statistical questions?” before the
tutorials started, Cindy’s answer was 1, “not comfortable,” on a scale from 1 to 5, where
1 indicated “not comfortable” and 5 indicated “very comfortable.” She was not
confident about her statistical knowledge and skills before the professional development
started.
With regard to her change in her learning analytics knowledge, Cindy showed
improvement, where her score rose from 63 points in the pretest to 85.2 points in the
posttest. When breaking down the questions by learning analytics topics, Cindy showed
that she had a pretty solid understanding of mean and median in statistics—she received a
full score for questions of those concepts in the pretest and posttest. She made a

93
noticeable improvement in variance and correlation questions as her score changed from
63 points in the pretest to 74.1 points in the posttest. The area in which Cindy showed the
largest improvement was regression. In the pretest, Cindy received zero points for the
regression questions, but attained a high score of 90 points afterwards. It was unknown if
the zero point from her pretest was due to her lack of regression knowledge or because
she did not have enough time to answer the regression questions.
When examining Cindy’s PK, TPK, teaching efficacy, and teacher resiliency (see
Figure 28), the results showed that, overall, there was improvement on these outcome
measures for her. Between the first and second weeks of the professional development,
her PK changed from 6.2 to 6.7 points on a 7-point Likert scale. Interestingly, in the third
week, her PK score decreased a bit to 6.2 points, the same score as in the first week. Her
TPK score exhibited a steady increase from 6 points in the first week to 6.8 points in the
last week on a 7-point Likert scale. Relatively, Cindy’s PK and TPK scores were high,
especially compared to the previous two preservice math teachers, whose end-of-
professional development PK and TPK scores were only around 5 points. Another
interesting result about Cindy was her change of teaching efficacy and teacher resiliency.
Her teaching efficacy score went down from 5.6 points to 4.8 points from the first to the
second week. Then, the same score climbed to 5.8 points in the last week. Teaching
efficacy was measured by using a 9-point Likert scale. This result indicated that Cindy’s
perception of her teaching efficacy changed from neutral to negative from the first week
to the second week, and then her perception became neutral to positive again in the last
week. Cindy’s teacher resiliency improved significantly after the professional
development. Her teacher resiliency rose from 4 points in the first week to 6 points in the

94
last week on a 7-point Likert scale. Overall, although there was some obvious increase in
Cindy’s TPK and teacher resiliency, her PK score remained high throughout the 3 weeks.
When paralleling her interview responses with her change in TPK, teaching efficacy, and
teacher resiliency, some interesting results emerged.
Figure 28. Change in Cindy’s PK and TPK
Figure 29. Change in Cindy’s teacher efficacy

95
Figure 30. Change in Cindy’s teacher resiliency
When asked about the relevance and importance of weekly tutorial topics to her
teaching, Cindy’s feedback suggested that she was much more familiar with the first
week’s topics, mean and median, than the topics in the second and third weeks, namely
variance, correlation, and regression.
I used to only use mean value to see students’ average performance. But now I know there is an alternative of using median. I also didn’t know how to calculate median before and now I am able to. It is also to know that sometimes mean and median can tell a very different stories based on the same students’ scores, so I can be careful about this. (Week 1: mean and median)
From Cindy’s responses, it could be inferred that the first week’s tutorial content
was more of a knowledge extension to learn about median based on her existing
knowledge of mean. She also suggested her ideas about the pros and cons of using each
approach to see students’ performance. This might suggest that she has started to apply
her learning analytics knowledge of mean and median at this time. However, her

96
feedback about the second week’s topics, variance and regression, showed less
confidence in her knowledge acquisition and application of this topic:
This week I learned how to calculate variance, how to create a bar chart with error bar. Those are things I didn’t know how to do before and it is helpful. Especially knowing the difference between variance and standard deviation. I was aware of these two concepts but didn’t know the difference between them till this week’s tutorial…. (Week 2: variance and correlation)
If her responses in the first and second weeks are compared, it is possible to see
that she might not have been very familiar with the topics in the second week, as she said,
“I learned how to calculate…and I didn’t know the difference [between variance and
standard deviation] till this week’s tutorial.” At the time of interview, Cindy might still
be processing the new knowledge about variance and correlation and was not ready to
apply this knowledge as she did with mean and median in the first week. The concepts of
variance and correlation could have been challenging to Cindy. Her learning analytics
scores showed that her pretest score was around 60 points and her posttest score was
around 70 points on the variance and correlation questions, respectively. In contrast, her
posttest score on mean and median questions was a full score of 100 points and her
posttest score on regression questions was a high score of 90 points. Also, compared to
other participants, Cindy was the only teacher whose posttest score on variance and
correlation was around 70 points, while the others achieved at least 80 points or higher on
the same questions. All in all, the decrease in Cindy‘s teaching efficacy between the first
and second weeks might be explained by the presumption that she encountered some
unfamiliar learning analytics concepts in the second week. But in the end, Cindy’s
teaching efficacy score peaked in the third week back to the level she was at in the first
week. Despite the fluctuation in the teaching efficacy score, Cindy’s teacher resiliency

97
score was on a rise throughout the professional development. Her perception of teaching
resiliency changed from neutral to rather positive in the end, which might also suggest
that the non-incremental increase in her teaching efficacy did not affect her growth in
teacher resiliency.
Cindy also shared how she planned to apply the learning analytics knowledge she
learned from the professional development to her future teaching. She was able to be
specific about connecting various learning analytics concepts with assessing her students’
performance and her teaching. With regards to using mean and median, she shared:
Now I know that mean tends to be influenced by outlier scores, such as few really high scores from a few students. In that case and in my own teaching, I will consider both mean and median as a way to represent students’ performance. (Week 1: mean and median)
For variance, correlation, and regression, Cindy also suggested the approach she
planned to take to use these learning analytics concepts:
I will use both mean and standard deviation to examine students’ scores when I teach multiple concepts to my students. In that case, I can have a more comprehensive view of students’ scores and their performance. (Week 2: variance and correlation)
For regression, I think I can estimate the contribution each assignment makes toward exam score by using the coefficients in the model, so I can know which assignment to focus on to plan my teaching make improvement on for students’ learning. (Week 3: regression)
Cindy has the most experience in teaching and using LMS learning analytics of all
the participants. When she was invited to answer the scenario question, “How you find
out your teaching skills and students’ learning outcomes?” there was a big difference in
terms of how she would use LMS learning analytics. The following is what she shared
before and after the professional development:

98
I used to use Schoology, which is a software through which I could see my students posts about the courses I taught. I could see if my students understood the content I taught by seeing if my students really used the materials I gave them and the presentation they gave. But in that software, most of the functions I used were sharing course materials, making announcements, and have students post their assignments there. (Week 1: before the first learning analytics tutorial)
After the tutorials in this professional development, I have learned how to use different approaches to evaluate students’ learning outcomes. In the past, I only used means to see students’ average performance, but now I know that variance is also important. Because if the variance is high then that means students’ performance very differently and that may have to do with my teaching. Also, I also know how to use regression to see how different activities contribute a test score so I can help students to review. Also, it is important to use graphs to see the patterns in students’ performance. Moving forward, I will also use other indications such as variance, standard deviation, et cetera, but not just mean to check students’ learning outcomes. (Week 3: after the last learning analytic tutorial)
Daisy. Daisy was a former full-time English teacher at a middle school. She was
27 years old and had 3 years of full-time teaching experience in the past. She was
currently pursuing her master’s degree and has stopped teaching at the moment. She
shared that she has used Blackboard and another Chinese App called “Yi-Xiao-Tong
(翼校通)” in teaching for more than 2 years. The LMS functions she has used as a
teacher included making course announcements and sending messages to students’
parents. She has also used learning analytics functions in these tools to check students’
learning outcomes, monitor students’ learning, and make pedagogical suggestions. Of all
participants, Daisy was more aware that there was a variety of learning analytics
functions in different LMS, although she has not used them extensively. When she was
asked the question “How comfortable do you feel about helping your colleagues with
their statistical questions?” before the tutorials started, Daisy’s answer was 5, “no

99
opinion,” on a scale from 1 to 5, where 1 indicated “not comfortable” and 5 indicated
“very comfortable.”
With regard to her change in her learning analytics knowledge, Daisy showed a
large improvement when her score rose from 51.9 points in the pretest to 89.8 points in
the posttest. Breaking down the questions by the learning analytics topics showed that
Daisy already had a good command of knowledge of mean and median since her pretest
and posttest scores on this topic were both higher than 90 points. She improved around 46
points on correlation and variance questions (44.4 to 90.7 points) between pretest and
posttest question. She also made a noticeable improvement on regression questions as her
score changed from zero points in the pretest to 70 points in the posttest. Just like the
previous teacher Cindy, Daisy may have received zero points for regression questions
because she did not have enough time to complete all those questions in the pretest.
When examining Daisy’s PK, TPK, teaching efficacy, and teacher resiliency (see
Figure 31), it was found that she exhibited a different pattern in the quantitative measures
compared to the other participants. First, there was nearly no change in her PK score
between the first and third weeks (6.7 to 6.8 points). She had a little improvement in the
TPK (5.8 to 6.3 points). Both PK and TPK were measured by using a 7-point Likert
scale, so her final PK and TPK scores were rather high and showed she had a very
positive perception of herself on this front. Surprisingly, Daisy’s teaching efficacy score
was 7.5 points in the first and second weeks (9-point Likert scale), but her teaching
efficacy score in the third week dropped to 5.5 points at the end of the professional
development. This might have shown that her perception of her own teaching efficacy

100
changed from very positive to somewhat neutral (i.e., no opinion). Daisy’s teacher
resiliency scores remained around 5.5 points throughout the 3 weeks, implying that she
had a positive but not strongly positive perception in this measure. The special aspect
about Daisy was that her teaching efficacy score dropped from the second to the third
week, but she had a high PK and TPK score throughout the 3-week professional
development. Her teaching resiliency also remained constantly positive. When
investigating her interview feedback more closely, I could potentially presume what
caused this drop in her teaching efficacy without affecting the other measures.
Figure 31. Change in Daisy’s PK and TPK

101
Figure 32. Change in Daisy’s teaching efficacy
Figure 33. Change in Daisy’s teacher resiliency
102
From her responses during the interviews, Daisy tended to give different levels of
detail when she described the relevance of different learning analytics concepts to her
teaching. For example, for the topics of mean and median in the first week, and variance
and correlation in the second week, she was able to elaborate the usefulness and
importance of these knowledge in her teaching:
Although the concepts of mean and median were not new to me since I was using them when I was a teacher to evaluate students’ performance, the technique to use Excel to calculate mean and median was useful. Also, using the bar chart to visualize the performance of the whole class, and also knowing when to use mean and median in teaching is important. (Week 1: mean and median) I think standard deviation is very useful especially when it comes with the mean as they can describe students’ performance very well. Normally, teachers and parents put a lot of emphasis on mean, and they also tend to overlook the low-performing students but just look at the mean to estimate students’ performance. So the standard deviation is really useful in this case. Also, the correlation chart is also helpful for teachers to tell the quality of and the relationship between different learning activities..(Week 2: variance and correlation)
When looking at her feedback in the third week about her perception of
regression, Daisy mentioned she was not familiar with the concept of regression although
she acknowledged its importance:
I have never used a regression function to analyze students’ exams or performance. I have also never seen my colleagues doing this before. I will use this kind of regression analysis in my teaching in the future. By checking regression coefficients, I will know which learning activity contributes the most the exam and I can plan my teaching accordingly. (Week 3: regression)
Daisy’s sharing about the regression in her teaching application sent a somewhat
mixed message. On one hand, she sounded motivated to try implementing regression to
adjust her teaching practices; on the other hand, she sounded as if she lacked confidence
since she never used a regression analysis or has seen anyone using it in teaching until

103
this professional development. This lack of confidence might also have resulted from her
lack of solid prior knowledge of regression and its application. Regarding her scores of
learning analytics knowledge questions, in the posttest Daisy was able to attain a full
score of 100 points and a high score of 90 points on the questions based on mean,
median, variance, and correlation statistical knowledge. In contrast, her posttest score on
the regression question was 70 points. While 70 points was technically not a low score, it
was apparently a departure from her performance on questions of other learning analytics
topics. Concerning the decline in Daisy’s teaching efficacy score in the last week, this
uncertainty about her ability to apply regression in her teaching may have been the cause.
However, if any, this cause did not seem to have influenced Daisy’s PK, TPK, and
teacher resiliency negatively.
In the end, like other participants, Daisy was also asked the scenario question
after reviewing the teaching scenario and Megan’s teaching scenario. Daisy’s response to
the question “How do you find out your own teaching?” prior to the tutorials centered on
her past teaching experience and the technological tools she has used before. It showed
that she was already using learning analytics to help her assess her own teaching and
students’ performance:
I would adjust my teaching based on my students’ performance and learning outcomes. For example, I will look into their assignment and course quizzes or test scores. Also, I would have conversations with my students at different levels about their feelings about the course I teach. For tools, I used to use an App, in which if I type students’ scores in it, it will predict the likely performance and learning obstacles a student is likely to achieve and encounter. Another App I used could help me know the patterns in the mistakes students are likely to make. It could help me adjust my teaching and help students to learning better. (Week 1: before the first learning analytics tutorial)

104
After the 3-week learning analytics tutorials, Daisy’s answer became rather
general when asked the same question:
I would say, after three weeks of tutorials, I can be more clear about my teaching performance on my different parts of teaching work. Also, I can know which learning activities I should put more energy on to help my students learn better. (Week 3: after professional development)
Based on her response, it is possible that Daisy might have recalled her learning
experience about correlation and regression when she answered this scenario question
since knowing the contribution of different learning activities was the focus of the
tutorials that taught correlation and regression. However, she did not elaborate with
further details about her specific approaches as she did at the beginning of the
professional development.
Ellen. Ellen used to be an elementary school where she taught English for half a
year in the past. Ellen was 28 years old and has stopped teaching as a full-time teacher to
pursue her master’s degree. She has used Canvas, an LMS, as a student for a year. She
said that she has never used any LMS or learning analytics in teaching in the past. She
gave 3 points (no opinion) to the question “How comfortable would you feel about
answering your colleagues’ statistical questions if they come to you for help?”
Ellen showed tremendous improvement in her learning analytics knowledge. On
average, her scores between the pretest and posttest improved the most among all
participants. Her total improvement was around 50 points (38.9 to 88.9 points). Breaking
down the questions by the learning analytics topics showed that Ellen already had a good
command of knowledge of mean and median (pretest: 82.4 points; posttest: 100 points on
accuracy score on mean and median). She was much less familiar with the topics of

105
variance and correlation (pretest: 25.9 points; posttest: 88.9 points on accuracy score on
variance and correlation) as well as the topic of regression (pretest: 0 points; posttest: 70
points on accuracy score on regression). In general, Ellen was able to achieve moderate to
high levels of posttest scores for all different learning analytics questions.
Ellen’s improvement in her learning analytics knowledge resonated with the
patterns in her growth in PK, TPK, teaching efficacy, and teacher resiliency (see Figure
34). Her PK score improved from 4.3 to 5.7 points (7-point Likert scale). The change in
her PK score implied that her attitude about her PK changed from no opinion to positive
or confident. As for TPK, her score improved from 6 to 7 points (on a 7-point Likert
scale). Her teaching efficacy also changed from 5.6 to 6.6 (on a 9-point Likert scale),
implying that her perception of her teaching efficacy changed from no opinion to
positive. In the end, her teacher resiliency score also grew from 5.5 to 6 points (7-point
Likert scale).
Figure 34. Change in Ellen’s PK and TPK
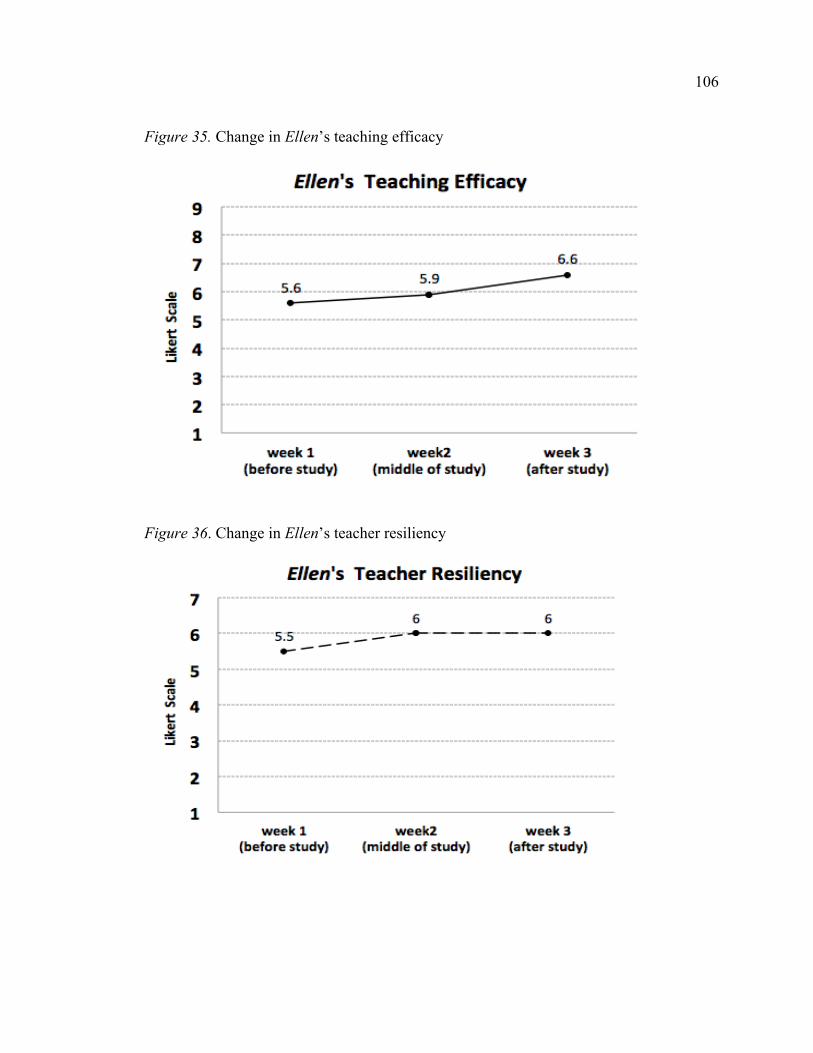
106
Figure 35. Change in Ellen’s teaching efficacy
Figure 36. Change in Ellen’s teacher resiliency

107
Ellen’s growth in the above outcome measures resonated with her interview
feedback. Throughout different weeks of the learning analytics tutorials, she expressed
that she felt the learning analytics topics introduced in the tutorials were useful and
important for her teaching. For example, in the first week after she learned the concepts
of mean and median through the tutorials, she shared:
I think oftentimes in my teaching I always use mean to generalize my students’ performance. But after today’s tutorial, I know that I need to be careful about individual differences between students and look at the whole picture instead of just looking at a single number such as mean value. Also, it is useful to know how to visualize the data in Excel and how to use different formulas to calculate the results I need to like mean and median. (Week 1: mean and median)
Ellen’s feedback suggested that she started to compare different methods to
estimate students’ learning performance (i.e., using mean or median). Her learning
experience of using Excel to perform data visualization was also helpful for her. In the
second week when variance and correlation were introduced in the tutorial, she gave
similar positive feedback:
I think knowing the contrast between correlation and regression is very important. I think sometimes teachers tend to jump quickly into conclusion about our assumptions. So this is a good reminder that we need to be cautious of other possibilities when we are interpreting students’ performance. Learning about correlation and knowing how to use data visualization certainly helps to analyze students’ data. Last week we were learning about mean and median, and this week we are discussing variance and correlation. I could see how these learning analytics concepts add on top of each other. (Week 2: variance and correlation)
After Ellen completed the tutorial and learned the topic of regression at the end of
the third week, she again appreciated how the learning analytics topics were arranged to
build on top of each other. She was also able to elaborate how she would use regression
as a learning analytics approach to assess students’ learning and her own teaching:

108
Regression is useful for me to take a look at my own teaching design and testing tools with regard to students’ exam scores, so I can be sure all the learning activities are meaningful. Also, it is useful to learn about the meaning of p-value so I can be sure which activity is significant to put my emphasis on. The last point is that I am now able to use a more complicated approach to analyze my own teaching results. Till last week I could only do correlation, but now I am able to do regression so that I can further analyze students’ learning and my teaching outcomes. (Week 3: regression)
Furthermore, Ellen also explained specifically how she planned to use some of
her learning analytics knowledge from the tutorials in her teaching. For example, for the
topic of variance and correlation, she said:
I would use variance to give myself more ideas about students’ performance. Especially I can know how students receive my teaching content differently. About correlation, I think it is a useful tool for teachers to test our assumptions about our teaching design especially based on the positive and negative correlations. (Week 2: variance and correlation)
For knowledge of regression, Ellen also mentioned she could use it to assess
students’ learning and her own teaching as well:
I would use regression to analyze my students’ performance in the future. I will also try to use it to predict students’ performance and way[s] to improve my own teaching design. (Week 3: regression) Ellen’s teacher resiliency seemed to grow parallel with her PK, TPK, and teaching
efficacy. Although there was a lack of further statistical evidence to justify the causality,
Ellen’s teacher resiliency showed an increasing pattern along with her PK, TPK, and
teaching efficacy. She reached a high teacher resiliency score (6 out of 7) in the second
and third weeks, the highest teacher resiliency score (as Cindy’s) among all participants.
At the beginning and end of the professional development, Ellen was asked to
review the teaching scenario and answer the scenario question :“You have read Megan’s
teaching scenario, now Megan wants to know how you find out your teaching skills and
109
students’ learning outcomes. How would you respond to her?” Ellen said the following
before the professional development:
I would understand my teaching skills based on the assessment of my students. For example, their scores and activities in my classroom. However, I didn’t use any specific tools to make these assessments. I am a pretty rookie teacher so I don’t know if there are tools that I can use. (Week 1: before the first learning analytics tutorial)
After the 3-week learning analytics professional development, Ellen said the
following as her answer to the same scenario question:
I would say my skills of evaluating students’ learning outcomes have definitely improved a lot after three weeks of tutorials. Before the tutorials, I would use mean, median, and maybe variance. But now I am able to use regression analysis to see students’ learning outcomes. This gives me more dimensions to see how my students are doing rather than just relying on the techniques I was using before. (Week 1: after the last learning analytics tutorial)
In general, Ellen’s growth patterns for PK, TPK, teaching efficacy, and teacher
resiliency were ideal in terms of the purpose and design of the learning analytics
professional development in this dissertation research.
Power Analysis for a Relevant Future Study
The current case study with five novice teachers was exploratory, but the results
demonstrated promising preliminary outcomes. The design of the current learning
analytics professional development and its different measures can bear the potential to
evolve into a full experimental study at a larger scale. Specifically, the same quantitative
measures can be implemented before and after the learning analytics professional
development to investigate its effects on participants’ learning analytics knowledge,
teaching efficacy, and teacher resiliency. After running a power analysis by using

110
G*Power 3.1 software to achieve a sufficient 0.8 statistical power and a satisfactory 95%
confidence level with an estimated small effect size (i.e., 0.2), I would need
approximately 199 participants for this experimental study. Participants’ measures can be
computed and analyzed by using two dependent matched samples t-test. In this scenario,
I would make a statistical conclusion about the effects of the current learning analytics
professional development. In the next chapter, I discuss the results of this case study
along with the findings from the survey study. At the end of the chapter, I discuss the
limitations and implications of this dissertation research, followed by a final summary.
111
Chapter V
GENERAL DISCUSSION
The findings from the case study provided several insights into the effects of case-
based learning in professional development on learning analytics. This general discussion
section reflects on the findings from both the learning analytics survey study and the case
study.
Benefits of Applying Teaching Scenario in
Learning Analytics Professional Development
In general, the professional development in learning analytics (i.e., intervention)
had several positive effects on novice teachers. Except for one teacher (i.e., Betty), all
other novice teachers who participated in the case study research significantly improved
their learning analytics knowledge after 3 weeks of professional development in learning
analytics. The only exception, Betty, did not exhibit an improvement mainly because she
made some mistakes in reading the instructions of two questions in the posttest
incorrectly, so she lost points which she could have been able to receive. Before the
intervention, three of the novice teachers (i.e., the three English teachers) received rather
low scores (around and below 60 points) in the learning analytics knowledge pretest.
After the professional development, all five novice teachers were able to achieve over 80
points when they took the learning analytics knowledge posttest. This large increase in

112
the regression score might have had to do with three of the five teachers running out of
time and not being able to complete the pretest questions on regression. In general, all
five novice teachers demonstrated the largest learning analytics knowledge growth in
regression in statistics, compared to variance/correlation and mean/median knowledge.
Furthermore, the five novice teachers’ learning analytics knowledge growth spread
evenly across three types of questions: basic, inference, and applied. This suggested that
there is no serious knowledge gap in the question design itself, and the professional
development could successfully extend novice teachers’ learning analytics knowledge
across basic-, inference-, and applied-level questions.
The 3-week learning analytics professional development also enhanced
psychological outcomes for the five novice teachers. In general, all five novice teachers
increased their PK and TPK after the intervention. For all the novice teachers, except
Ellen, their PK seemed to be a more static characteristic that did not increase dramatically
throughout the professional development. All five novice teachers showed a larger-
degree of increase in their TPK compared to PK, most likely because of their intensive
practice of using Excel to perform learning analytics in the learning analytics professional
development.
In a general comparison, participants’ increase in teacher resiliency was not as
obvious as in their teaching efficacy during the intervention. The effects of the
professional development on the novice teachers’ teaching efficacy and teacher resiliency
also seemed to be a mixed pattern. For novice teachers such as Betty and Ellen, their
teaching efficacy and teacher resiliency increased in parallel throughout the 3 weeks.
Their PK and TPK also grew in the same direction with teaching efficacy and teacher
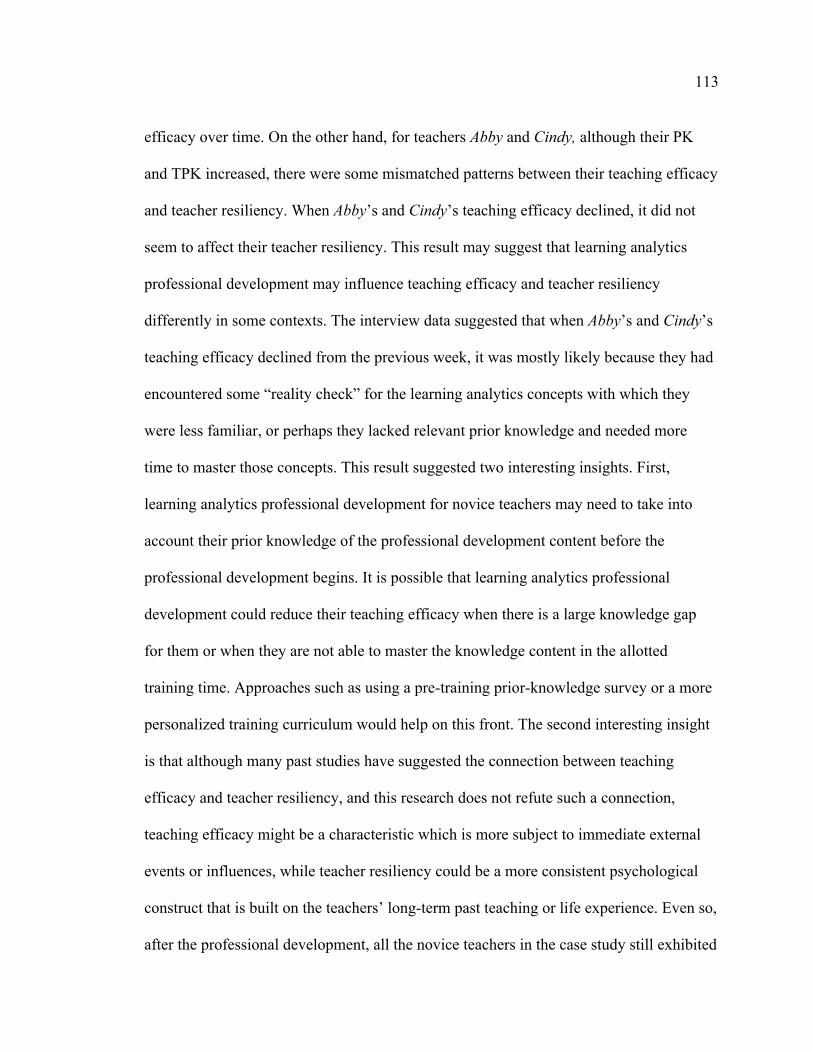
113
efficacy over time. On the other hand, for teachers Abby and Cindy, although their PK
and TPK increased, there were some mismatched patterns between their teaching efficacy
and teacher resiliency. When Abby’s and Cindy’s teaching efficacy declined, it did not
seem to affect their teacher resiliency. This result may suggest that learning analytics
professional development may influence teaching efficacy and teacher resiliency
differently in some contexts. The interview data suggested that when Abby’s and Cindy’s
teaching efficacy declined from the previous week, it was mostly likely because they had
encountered some “reality check” for the learning analytics concepts with which they
were less familiar, or perhaps they lacked relevant prior knowledge and needed more
time to master those concepts. This result suggested two interesting insights. First,
learning analytics professional development for novice teachers may need to take into
account their prior knowledge of the professional development content before the
professional development begins. It is possible that learning analytics professional
development could reduce their teaching efficacy when there is a large knowledge gap
for them or when they are not able to master the knowledge content in the allotted
training time. Approaches such as using a pre-training prior-knowledge survey or a more
personalized training curriculum would help on this front. The second interesting insight
is that although many past studies have suggested the connection between teaching
efficacy and teacher resiliency, and this research does not refute such a connection,
teaching efficacy might be a characteristic which is more subject to immediate external
events or influences, while teacher resiliency could be a more consistent psychological
construct that is built on the teachers’ long-term past teaching or life experience. Even so,
after the professional development, all the novice teachers in the case study still exhibited
114
slight growth in their teacher resiliency. One former English teacher, Cindy, also
demonstrated a significant increase in her teacher resiliency (increased from 4-6 points on
a scale of 7).
Influence of Teaching Experience on PK
The results of the case study suggested that teachers’ backgrounds could moderate
the influences of learning analytics professional development. Although generally all five
novice teachers grew their PK after the professional development, when juxtaposing all
five participants’ PK scores and separating them by preservice and former teachers, the
three former teachers had a higher average PK score than the in-service teachers by the
end of the professional development. Also, at the beginning before any tutorials or
learning activities, the former teachers, except for Ellen, had a higher PK score than the
preservice teachers as well. This difference may reflect the effect of teaching experience.
Another particularly interesting point of the result on PK is the moderation that the length
of teaching experience seemed to have. To specify, the third former English teacher,
Ellen, had only 6 months of formal teaching experience. The other two former English
teachers, Cindy and Daisy, had 3 and 6 years, respectively, of formal teaching experience.
By comparing their PK increase, it might be assumed that learning analytics professional
development could have a larger impact on novice teachers’ PK when they have little
formal teaching experience but less of an impact on teachers who have several years of or
no formal teaching experience. It is intuitive to assume that preservice teachers have a
relatively lower average PK compared to former teachers, both before and after the
professional development, due mostly to the lack of formal teaching experience. In

115
contrast, while the degree of PK increase is similar for preservice and former teachers,
the exception of Ellen may suggest that having some teaching experience (e.g., less than
a year) may become a sweet spot for learning analytics professional development to
increase PK. On the other hand, the change in PK may tend to be smaller when teachers
have years of teaching experience through which their perception of their PK may have
already been shaped.
Prior Experience of Using LMS Learning Analytics to Moderate Growth of TPK
Another important point is the experience of using LMS learning analytics and
how it may moderate the effect of learning analytics professional development on
teachers’ TPK. The results showed that generally all participants increased their TPK
after the professional development. But it is noteworthy that there was a larger TPK
increase for the two preservice teachers (i.e., Abby and Betty) and the last former English
teacher (i.e., Ellen). These three teachers increased their TPK by 2, 1, and 1 point(s),
respectively. When examining these three teachers’ information and teaching experience,
they reported they did not have any experience with using LMS learning analytics
functions in the past. In contrast, the other two participants, Cindy and Daisy, whose TPK
increased a bit less than the previous three teachers, have used LMS such as Blackboard
and Schoology for years in their past teaching. This result may suggest that while this
learning analytics professional development could help teachers to increase TPK in
general, this positive effect could especially be more significant for those who have not
used any LMS learning analytics in teaching.

116
Confidence and Intention to Apply Learning Analytics to Teaching
There are several important findings from the learning analytics survey study.
First, regarding the barriers teachers face in using LMS learning analytics in their
teaching, the three major barriers are: (1) lack of awareness (e.g., teachers do not know if
the LMS they are using has learning analytics functions); (2) lack of math/statistical
skills; and (3) lack of computer skills to use learning analytics. In light of these barriers, it
is clear that a successful learning analytics professional development must not only
introduce what learning analytics is to teachers, but, more importantly, teachers will need
to acquire the statistical and computer skills to perform learning analytics. Another
critical finding from the survey study was the perception of usefulness of LMS learning
analytics. In the survey study, the frequency of using LMS learning analytics was found
to correlate positively with teaching efficacy and teacher resiliency. But this correlation
existed only for teachers who had a prior perception that LMS learning analytics was
useful for their teaching and curriculum design. In other words, prompting teachers to
practice learning analytics exercises repeatedly would probably not benefit them much if
they considered it as another routine or school policy without the belief that LMS
learning analytics could actually help with their teaching.
All these findings from the survey study helped formulate the design of the
learning analytics professional development in the case study. The purpose of the
learning analytics professional development was threefold. First, the professional
development was designed to help novice teachers develop statistical knowledge and
computer skills to perform learning analytics. Through the pretest and posttests of the

117
learning analytics knowledge questions, this research showed that novice teachers
increased their learning analytics knowledge after the 3-week learning analytics
professional development. Also, participants’ interview feedback also suggested that they
had become familiar with and capable of using Excel as a computer tool to conduct
learning analytics.
Second, the objectives of the professional development was meant to establish
novice teachers’ confidence and capacity to use learning analytics to self-assess their
teaching as well as their students’ learning. Through participants’ responses to the
interview questions on the importance and relevance of different learning analytics
topics, all five participants expressed that they considered learning analytics topics in this
professional development important and useful in assessing their own teaching and
students’ learning outcomes. In the exploratory case study, although a stronger statistical
test is required to make a more definitive conclusion, it is obvious that the five novice
teachers had become more knowledgeable of utilizing learning analytics after the
professional development. Some of the quantitative feedback from the five novice
teachers also provided evidence to support this observation. For example, one of the
novice teachers, Abby, shared how the learning analytics knowledge she gained after the
professional development could help her monitor her teaching: “As a teacher, sometimes
I am not aware of the importance of each activity when I am designing them, so [using
regression in learning analytics] is a good way to trace which assignment or quiz has the
most impact on students’ exams” (after the third week’s professional development). She
also explained how the learning analytics knowledge of variance and correlation could
help her assess students’ learning processes: “I will [use students’ scores] to see the

118
correlation between different student learning activities…and to find some clues about
how different activities relate to each other and how they each relate to the exam in order
to improve students’ learning” (after the second week’s professional development).
Lastly, although a longitudinal study to trace participants’ use of learning
analytics was beyond the scope of this study, through the interview question “How do
you plan to apply the weekly learning analytics skills/knowledge in your teaching?” and
the scenario question “Your teacher colleague, Megan, wants to know how would you
find out your teaching performance and students’ learning progress?” it is possible to
see from the five participants’ responses that they developed the intention and initial
plans to utilize learning analytics in their future teaching. For instance, some of them
mentioned that “they will use both mean and median to avoid the outlier student scores
in order to get a correct estimate of students’ performance as a group” (Cindy). Other
participants also mentioned that “they would use variance to examine their own teaching
performance to see if students receive their teaching practices equally or if there is a
knowledge gap between students” (Betty, Daisy, Ellen). The other participants also
shared that “I would use correlation and regression to help them determine which
learning activities are crucial in preparing students for their exams” (Abby, Betty,
Cindy). These qualitative feedback statements could be the evidence to demonstrate
participants’ intention to integrate learning analytics into their future teaching. In sum,
the results of the case study demonstrated that the learning analytics professional
development could be an effective intervention not only to enhance novice teachers’
knowledge and skills of learning analytics, but also to establish their perception that

119
learning analytics could be useful in teaching and motivate them to develop various ideas
to use it in their own teaching.
Limitations and Future Research
There were some limitations in this dissertation research. First, the size and the
source of data collection for the survey study and the case study were limited. In the
survey study, the number of preservice teachers was nine, while the number of in-service
teachers was 47. The imbalanced number of preservice and in-service teachers inevitably
reduced the representativeness of the results with regards to what kinds of LMS or
learning analytics functions each group used, the similar and different barriers they
encountered, and the comparison of two groups of teachers’ TPK and teaching efficacy,
among other aspects. Also, when participants were recruited for the survey study, they
did not need to identify their schools. Therefore, there might be a risk of homogeneity in
the survey results regarding the LMS or learning analytics functions participants used if
many of them were from the same school. Future studies could consider using a larger
teacher population to include teachers from different areas, school types, teaching
experience, and other demographics to make the research results more representative. For
the exploratory case study, it is worth mentioning that the recruitment process was
disrupted by the COVID-19 pandemic. Several potential participants who were initially
interested in joining this 3-week-long study dropped out of the study because they
decided to relocate outside of New York City for their health and safety considerations.
Unfortunately, this Act of God limited the number of participants. Yet, a small participant
group provided the author with availability for an in-depth elaboration on the influence of

120
the professional development on each participant. Due to the small sample size, the
quantitative measures were analyzed mostly through descriptive statistics in this study.
Future research could consider adopting a similar research structure with a larger sample
size, which would offer opportunities to analyze the same quantitative measures through
inferential statistics and an experimental design. In that case, interesting questions to be
explored could include the correlation between TPK, teaching efficacy, and teacher
resiliency, as well as examining salient predictors for teacher resiliency through
regression analysis.
The second limitation was the authenticity of participants’ feedback during the
interviews in the professional development. All five participants were giving rather
positive feedback with regards to the learning analytics skills and knowledge they
acquired. They also expressed that these learning analytics concepts were highly valuable
and useful for them, and they planned to integrate learning analytics into their teaching.
However, since the researcher also played the facilitator role and all participants were
aware that he was the designer of the professional development, they may have felt some
pressure not to give positive feedback when asked various interview questions. Also,
participants could have also been subject to the effect of social desirability to give the
facilitator (i.e., author of this research) the interview feedback they thought best fit the
facilitator’s interests. A way to reduce pressure on participants to give positive feedback
for future studies is to inform them that the facilitator has no interest conflicts in the
outcomes of the professional development.
The last limitation was the timing of implementing posttest measures in the case
study. Although during the tutorials the facilitator adopted a flexible schedule and

121
professional development curriculum whereby participants would pace their learning, and
although the facilitator also set different checkpoints to ensure participants’ knowledge/
skills acquisition, all the posttest measures, including quantitative survey and interview
questions, were implemented right after weekly tutorials. It is possible that the effects of
the learning analytics professional development on some outcome measures in the case
study (e.g., teaching efficacy, teacher resiliency) may appear more significantly with
some latency. However, due to the design of the case study, participants were not given
much leeway to reflect on and digest their learning experience of the weekly tutorials
before they had to complete posttest questions. Future research may consider a
longitudinal format for this type of research to see if the effects of learning analytics
professional development could be measured at various time points after the professional
development, and how would the effects differ in terms of their direction, magnitude, and
continuity.
Implications
This dissertation research can contribute to the literature in three different ways.
First, although past studies have shown that teachers’ application of learning analytics
and professional development which used actual teaching scenario can both enhance
teaching efficacy (Dawson, McWilliam, & Tan, 2008; Zottmann et al., 2012), very little
research has attempted to connect these two areas. The learning analytics professional
development in this research utilized a teaching scenario in the learning analytics
professional development for novice teachers. The positive results of the five novice
teachers’ learning outcomes provided valuable empirical evidence and pedagogical

122
implications for how to operationalize professional development effectively in order to
enhance teachers’ PK, TPK, teaching efficacy, teacher resiliency, and learning analytics
knowledge.
The second implication of this dissertation research is the benefits which learning
analytic professional development may be able bring into many teacher educations
programs. Many schools are motivated to incorporate a variety of learning management
systems (LMS) in their classroom to improve students’ learning by analyzing the student
data they collect. However, in most teacher education programs across the country,
preservice teachers are not trained to utilize students’ data and improve their teaching
practices based on data analyses. As the exploratory case study in this dissertation
research showed, though some preservice teachers might have had a healthy
mathematical or statistical foundation to understand the information they viewed through
learning analytics, there remains a large gap between understanding analytical results and
putting the analytical findings into pedagogical actions for the novice teachers without
proper learning analytics professional development. There are two potential approaches
to address this gap. For preservice teachers, learning analytics could be integrated into the
curriculum in the teacher education programs. In this case, preservice teachers will have
opportunities to train and cultivate their technical and statistical knowledge relevant to
learning analytics before they begin teaching formally. For in-service or experienced
teachers, given that it might be challenging for them to complete a semester-long learning
analytics coursework with their work schedules, a short-term learning analytics summer
institute or professional development during the weekends could be a feasible solution.

123
Another implication of this study is to extend the definition of teachers’ analytical
competence. Although past studies have suggested that professional development which
used teaching scenarios such as teaching videos could effectively increase teachers’
analytical competence (Zottmann et al., 2012), analytical competence in this area has a
generic definition, described as teachers’ ability to observe, analyze, and assess
classroom situations that can help them improve teaching (Goeze et al., 2014). This
research has concretized the conventional definition of teachers’ analytical competence
by extending it to teachers’ ability, confidence, and planned strategies to utilize learning
analytics in assessing their own teaching and students’ learning outcomes in an actual
teaching scenario. Also, by connecting teachers’ enhanced learning analytics skills to
teaching efficacy and teacher resiliency, this research has provided an important
reference to address the current issue that novice teachers lack skills to assess and
improve their teaching as well as their consequential professional fatigue, frustration, and
burnout.
In the end, the findings in this research also offer valuable economic and policy
implications. While other contextual factors may still be likely to lead to high turnover
rates for novice teachers in the United States, such as school poverty, lack of school
leadership support, and so on, this research focused on one of the major challenges in
most U.S. teacher education programs, in which novice teachers need a more effective
approach to improve their pedagogical practices with the assistance of learning analytics.
Similar learning analytics professional development with a special focus on novice
teachers could be conducted at a larger scale and could potentially alleviate teacher
turnover and derivative economic costs in the United States. In the long run, students

124
could also benefit from teachers who are empowered to teach more effectively and
efficaciously to improve their learning performance.
Summary
This dissertation research aimed to tackle the issue of high turnover rate for
novice teachers because of their lack of teaching efficacy and teacher resiliency. This
research proposed learning analytics professional development as an effective
intervention to help novice teachers teach more effectively and efficaciously by better
assessing their teaching practices. The results of this research showed that learning
analytic professional development is an effective approach to improve novice teachers’
learning analytics knowledge, teaching efficacy, and teacher resiliency, and to develop
higher confidence and intention to use learning analytics in future teaching.

125
REFERENCES
Anderson, L., & Olsen, B. (2006). Investigating early career urban teachers’ perspectives on and experiences in professional development. Journal of Teacher Education, 57(4), 359-377.
Armstrong, J., & Anthes, K. (2001). How data can help. American School Board Journal, 188(11), 38-41.
Ball, D. L., & Cohen, D. K. (1999). Developing practice, developing practitioners: Toward a practice-based theory of professional education. In G. Syke & l. Darling-Hammond (Eds.), Teaching as the learning profession: Handbook of policy and practice (pp. 3-22). San Francisco, CA: Jossey-Bass.
Banas, J. R., & York, C. S. (2014). Authentic learning exercises as a means to influence preservice teachers’ technology integration self-efficacy and intentions to integrate technology. Australasian Journal of Educational Technology. 30(6), 728-746.
Bandura, A. (1993). Perceived self-efficacy in cognitive development and functioning. Educational Psychologist, 28(2), 117-148.
Bandura, A. (1997). The anatomy of stages of change. American Journal of Health Promotion: AJHP, 12(1), 8.
Beltman, S., Mansfield, C., & Price, A. (2011). Thriving not just surviving: A review of research on teacher resilience. Educational Research Review, 6(3), 185-207.
Berliner, D. C. (2001). Learning about and learning from expert teachers. International Journal of Educational Research, 35(5), 463-482.
Boyd, D., Grossman, P., Lankford, H., Loeb, S., & Wyckoff, J. (2005). How changes in entry requirements alter the teacher workforce and affect student achievement. NBER Working Paper No. 11844. National Bureau of Economic Research.
Buabeng-Andoh, C. (2012). Factors influencing teachers’ adoption and integration of information and communication technology into teaching: A review of the literature. International Journal of Education and Development Using ICT, 8(1).
Burley, W. W., Hall, B. W., Villeme, M. G., & Brockmeier, L. L. (1991). A path analysis of the mediating role of efficacy in first-year teachers’ experiences, reactions, and plans. Presentation at American Educational Research Association (AERA) Conference.

126
Byker, E. J., Putman, S. M., Handler, L., & Polly, D. (2017). Educational technology and student voice: Examining teacher candidates’ perceptions. World Journal on Educational Technology: Current Issues, 9(3), 119-129.
Campbell, J. P., DeBlois, P. B., & Oblinger, D. G. (2007). Academic analytics: A new tool for a new era. EDUCAUSE Review, 42(4), 40-57.
Coladarci, T. (1992). Teachers’ sense of efficacy and commitment to teaching. Journal of Experimental Education, 60(4), 323-337.
Colbert, J. A., Brown, R. S., Choi, S., & Thomas, S. (2008). An investigation of the impacts of teacher-driven professional development on pedagogy and student learning. Teacher Education Quarterly, 35(2), 135-154.
Darling-Hammond, L., & Carver-Thomas, D. (2017). Teacher turnover: Why it matters and what we can do about it. Washington, DC: Learning Policy Institute.
Dawson, S. P., McWilliam, E., & Tan, J. (2008). Teaching smarter: How mining ICT data can inform and improve learning and teaching practice. Presentation at Annual Conference of the Australasian Society for Computers in Learning in Tertiary Education (pp. 221-230). Melbourne, Australia: Deakin University.
Dieker, L. A., Hughes, C. E., Hynes, M. C., & Straub, C. (2017). Using simulated virtual environments to improve teacher performance. School-University Partnerships, 10(3), 62-81.
Donna, J. (2013). A model for professional development to promote engineering design as an integrative pedagogy within STEM education. Journal of Pre-College Engineering Education Research, 2(2), 1-8.
Evans, E. D., & Tribble, M. (1986). Perceived teaching problems, self-efficacy, and commitment to teaching among preservice teachers. Journal of Educational Research, 80(2), 81-85.
Fantilli, R. D., & McDougall, D. E. (2009). A study of novice teachers: Challenges and supports in the first years. Teaching and Teacher Education, 25(6), 814-825.
Fimian, M. J., & Blanton, L. P. (1987). Stress, burnout, and role problems among teacher trainees and first-year teachers. Journal of Occupational Behaviour, 8(2), 157-165.
Firestone, W. A. (2014). Teacher evaluation policy and conflicting theories of motivation. Educational Researcher, 43(2), 100-107.
Fredrickson, W. E., & Neill, S. (2004). “Is it Friday yet?” Perceptions of first-year music teachers. Bulletin of the Council for Research in Music Education, 91-98.

127
Gibson, S., & Dembo, M. H. (1984). Teacher efficacy: A construct validation. Journal of Educational Psychology, 76(4), 569.
Glickman, C. D., & Tamashiro, R. T. (1982). A comparison of first-year, fifth-year, and former teachers on efficacy, ego development, and problem solving. Psychology in the Schools, 19(4), 558-562.
Goeze, A., Zottmann, J. M., Vogel, F., Fischer, F., & Schrader, J. (2014). Getting immersed in teacher and student perspectives? Facilitating analytical competence using video cases in teacher education. Instructional Science, 42, 91-114.
Grigg, J., Kelly, K. A., Gamoran, A., & Borman, G. D. (2012). Effects of two scientific inquiry professional development interventions on teaching practice. Educational Evaluation and Policy Analysis, 35(1), 38-56.
Gu, Q., & Day, C. (2007). Teachers resilience: A necessary condition for effectiveness. Teaching and Teacher Education, 23(8), 1302-1316.
Gu, Q., & Day, C. (2013). Challenges to teacher resilience: Conditions count. British Educational Research Journal, 39(1), 22-44.
Harrington, H. L. (1995). Fostering reasoned decisions: Case-based pedagogy and the professional development of teachers. Teaching and Teacher Education, 11(3), 203-214.
Harris, J. B., & Hofer, M. J. (2011). Technological pedagogical content knowledge (TPACK) in action: A descriptive study of secondary teachers’ curriculum-based, technology-related instructional planning. Journal of Research on Technology in Education, 43(3), 211-229.
Hattie, J. (2009). The black box of tertiary assessment: An impending revolution. In L. H. Mayer, S. Davidson, H. Anderson, R. Fletcher, P. M. Johnston, & M. Rees (Eds.), Tertiary assessment and higher education student outcomes: Policy, practice, and research (pp. 259-275). Wellington, New Zealand: Ako Aotearoa.
Heller, J. I., Daehler, K. R., Wong, N., Shinohara, M., & Miratrix, L. W. (2012). Differential effects of three professional development models on teacher knowledge and student achievement in elementary science. Journal of Research in Science Teaching, 49(3), 333-362.
Hogan, T., Rabinowitz, M., & Craven III, J. A. (2003). Representation in teaching: Inferences from research of expert and novice teachers. Educational Psychologist, 38(4), 235-247.
128
Hong, J. Y. (2012). Why do some beginning teachers leave the school, and others stay? Understanding teacher resilience through psychological lenses. Teachers and Teaching, 18(4), 417-440.
Howard, S., & Johnson, B. (2004). Resilient teachers: Resisting stress and burnout. Social Psychology of Education, 7, 399-420.
Hoy, A. W. (2000). Changes in teacher efficacy during the early years of teaching changes in teacher efficacy during the early years of teaching. Annual Meeting of the American Educational Research Association, 1–26.
Hübscher, R., & Puntambekar, S. (2008). Integrating knowledge gained from data mining with pedagogical knowledge. Educational Data Mining 2008, 1st International Conference on Educational Data Mining, Proceedings.
Ingersoll, R. (2000). Turnover among mathematics and science teachers in the US. GSE Publications, 96.
Ingersoll, R. M. (2002). The teacher shortage: A case of wrong diagnosis and wrong prescription. NASSP Bulletin, 86(631), 16-31.
Jamil, F. M., Downer, J. T., & Pianta, R. C. (2012). Association of pre-service teachers’ performance, personality, and beliefs with teacher self-efficacy at program completion. Teacher Education Quarterly, 39(4), 119-138.
Jenkins, K., Smith, H., & Maxwell, T. (2009). Challenging experiences faced by beginning casual teachers: Here one day and gone the next! Asia-Pacific Journal of Teacher Education, 37(1), 63-78.
Kitching, K. (2009). Teachers’ negative experiences and expressions of emotion: Being true to yourself or keeping you in your place? Irish Educational Studies, 28(2), 141-154.
Liñán, L. C., & Pérez, Á. A. J. (2015). Educational data mining and learning analytics: Differences, similarities, and time evolution. International Journal of Educational Technology in Higher Education, 12(3), 98-112.
Loughran, J. (2014). Professionally developing as a teacher educator. Journal of Teacher Education, 65(4), 271-283.
Marder, M., Plisch, M., & Brown, R. C. (2017, May 16). We need more STEM teachers; Higher ed. can help. Education Week, 36(31). Retrieved April 15, 2020 from https://www.edweek.org/ew/articles/2017/05/17/we-need-more-stem-teachers-higher-ed.html

129
Merseth, K. K. (1990). Case studies and teacher education. Teacher Education Quarterly, 17(1), 53-62.
Morine-Dershimer, G., & Kent, T. (1999). The complex nature and sources of teachers’ pedagogical knowledge. In J. Gess-Newsome & N. G. Lederman (Eds.), Examining pedagogical content knowledge (pp. 21-50). Science and Technology Education Library, 6. Dordrecht: Springer. https://doi.org/10.1007/0-306-47217-1_2
Morris, M. (2004). Lessons learned teaching a large online class. SITE 2004—Society for Information Technology and Teacher Education International Conference.
National Commission on Teaching & America’s Future (NCTAF). (2003). No dream denied: A pledge to America’s children. Washington, DC: Author.
O’Brien, J., & Jones, K. (2014). Professional learning or professional development? Or continuing professional learning and development? Changing terminology, policy and practice. Professional Development in Education, 40(5), 683-687. doi:10.1080/19415257.2014.960688
Organisation for Economic Co-operation and Development (OECD). (2016). Low-performing students: Why they fall behind and how to help them succeed. Retrieved April 15, 2020 from http://dx.doi.org/10.1787/9789264250246-en
Partelow, L. (2019). What to make of declining enrollment in teacher preparation programs. Washington, DC: Center for American Progress. https://www.american progress.org/issues/education12/reports/2019/12/03/4773, 11.
Poon, L. K., Kong, S. C., Yau, T. S., Wong, M., & Ling, M. H. (2017, June). Learning analytics for monitoring students’ participation online: Visualizing navigational patterns on learning management system. In International Conference on Blended Learning (pp. 166-176). Cham: Springer.
Pretsch, J., Flunger, B., & Schmitt, M. (2012). Resilience predicts well-being in teachers, but not in non-teaching employees. Social Psychology of Education, 15(3), 321-336.
Roberson, S., & Roberson, R. (2009). The role and practice of the principal in developing novice first-year teachers. The Clearing House: A Journal of Educational Strategies, Issues and Ideas, 82(3), 113-118.
Schmidt, D. A., Baran, E., Thompson, A. D., Mishra, P., Koehler, M. J., & Shin, T. S. (2009). Technological pedagogical content knowledge (TPACK): The development and validation of an assessment instrument for preservice teachers. Journal of Research on Technology in Education, 42(2), 123-149.

130
Shkedi, A. (1998). Experienced teachers react to a case. The Teacher Educator, 34(2), 116-133.
Simon, N. S., & Johnson, S. M. (2015). Teacher turnover in high-poverty schools: What we know and can do. Teachers College Record, 117(3), 1-36.
Slater, S., Baker, R., Ocumpaugh, J., Inventado, P., Scupelli, P., & Heffernan, N. (2016). Semantic features of math problems: Relationships to student learning and engagement. Proceedings of the 9th International Conference on Educational Data Mining, EDM 2016.
Sutcher, L., Darling-Hammond, L., & Carver-Thomas, D. (2016). A coming crisis in teaching? Teacher supply, demand, and shortages in the US. Washington, DC: Learning Policy Institute.
Tait, M. (2008). Resilience as a contributor to novice teacher success, commitment, and retention. Part of the Special Issue, Democracy, Social Justice and the Lives of Teachers, 35(4), 57-75.
Tschannen-Moran, M., & Hoy, A. W. (2001). Teacher efficacy: Capturing an elusive construct. Teaching and Teacher Education, 17(7), 783-805.
Tschannen-Moran, M., & Hoy, A. W. (2007). The differential antecedents of self-efficacy beliefs of novice and experienced teachers. Teaching and Teacher Education, 23(6), 944-956.
Tschannen-Moran, M., Hoy, A. W., & Hoy, W. K. (1998). Teacher efficacy: Its meaning and measure. Review of Educational Research, 68(2), 202-248.
Ulvik, M., & Langørgen, K. (2012). What can experienced teachers learn from newcomers? Newly qualified teachers as a resource in schools. Teachers and Teaching, 18(1), 43-57.
Villegas-Reimers E. (2003, February 26). Teacher professional development: An international review of the literature. Paris: International Institute for Educational Planning.
Wagnild, G. M., & Young, H. (1993). Development and psychometric. Journal of Nursing Measurement, 1(2), 165-178.
Yost, D. S. (2006). Reflection and self-efficacy: Enhancing the retention of qualified teachers from a teacher education perspective. Teacher Education Quarterly, 33(4), 59-76.

131
Zottman, J. M. Goeze, A., Frank, C., Zentner, U., Fischer, F., & Schrader, J. (2012). Fostering the analytical competency of pre-service teachers in a computer-supported case-based learning environment: A matter of perspective? Interactive Learning Environments, 20(6), 513-532.
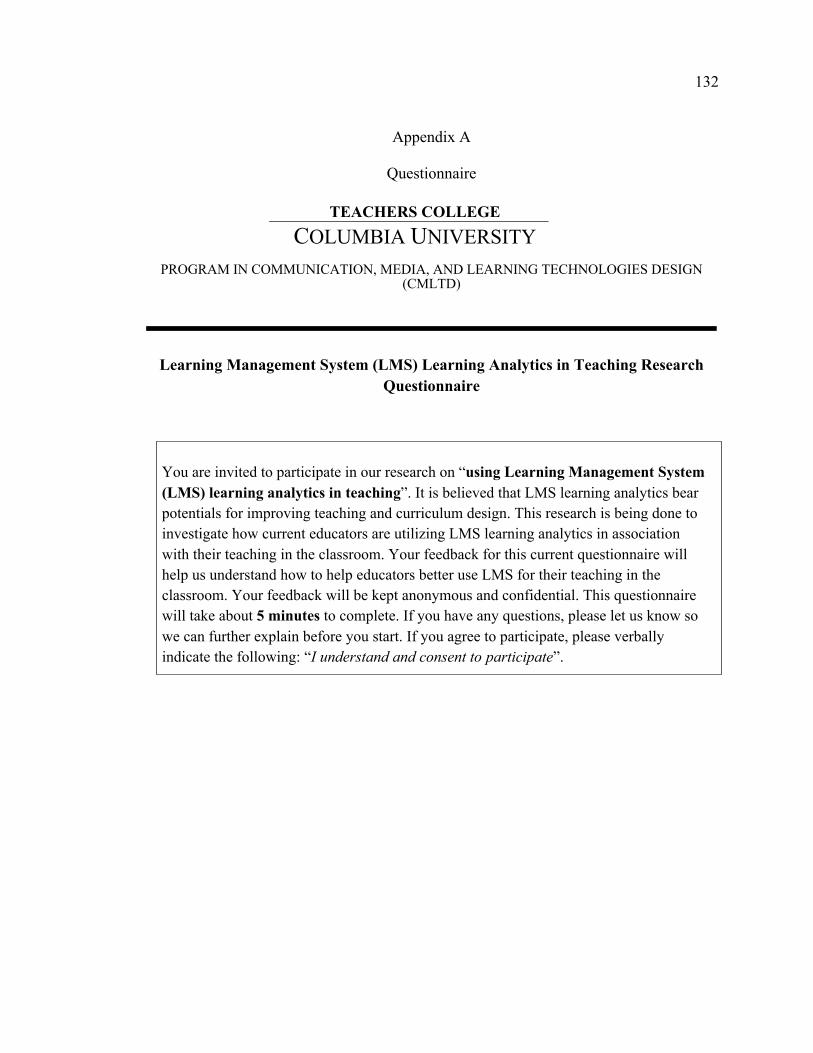
132
Appendix A
Questionnaire
TEACHERS COLLEGE
COLUMBIA UNIVERSITY
PROGRAM IN COMMUNICATION, MEDIA, AND LEARNING TECHNOLOGIES DESIGN (CMLTD)
Learning Management System (LMS) Learning Analytics in Teaching Research
Questionnaire
You are invited to participate in our research on “using Learning Management System (LMS) learning analytics in teaching”. It is believed that LMS learning analytics bear potentials for improving teaching and curriculum design. This research is being done to investigate how current educators are utilizing LMS learning analytics in association with their teaching in the classroom. Your feedback for this current questionnaire will help us understand how to help educators better use LMS for their teaching in the classroom. Your feedback will be kept anonymous and confidential. This questionnaire will take about 5 minutes to complete. If you have any questions, please let us know so we can further explain before you start. If you agree to participate, please verbally indicate the following: “I understand and consent to participate”.

133
(1) Gender:
☐ Male ☐ Female ☐ Preferred way to identify:
(2) Age:
(3) What is your field of study? (e.g. majors, degrees, certificates):
_________________________________________________________
(4) Which subject(s) do you teach?
_________________________________________________________
(5) Which school do you teach at? (optional)
_________________________________________________________
(6) Which grade level do you teach?
☐ Elementary school ☐ Middle school ☐ High school ☐ Other:
(7) Which kind of school do you teach at?
☐ Public school ☐ Private school ☐ Charter school ☐ Magnet school ☐ College preparatory school ☐ Other:
(8) Which learning management system (LMS) do you use for teaching? (select all that apply)
☐ Google Classroom ☐ Moodle ☐ Canvas ☐ Blackboard ☐ Class Dojo ☐ Schoology
☐ Edmodo ☐ Quizlet ☐ Haiku Learning ☐ Pearson SuccessNet ☐ Desire2Learn ☐ Other:

134
(9) At your school, how is LMS introduced to the teachers/staff? (select all that apply)
☐ Seminar/workshop ☐ Tutorials ☐ Webinar
☐ Other: ___________________________________________
(10) Which kinds of general LMS functions are you using? (select all that apply)
☐ Upload assignments, readings, videos, etc.
☐ Track students’ attendance
☐ Make course announcement
☐ Group students for course activities
☐ Grading/Assessment
☐ Interact with students (e.g. discussion board, message)
☐ Generate learning content
☐ Create tests
☐ Other: _______________________________________
(11) What kinds of LMS data analytics functions are you using? (select all that apply) ☐ None
☐ Monitor students’ course participation
☐ Check individual student’s learning progress
☐ Examine average class learning performance
☐ Predict students’ learning outcomes
☐ Send periodical learning report to yourself (teacher)
☐ Send notification to students based on certain student actions
☐ Visualize students’ activities in dashboard
☐ Other:
(12) What are the major reason(s) that you may not use LMS data analytics functions? (select all that apply) ☐ I don’t know if the LMS I am using has data analytics functions
☐ Objection from students (e.g. students don’t know how to use, have no Internet access)
☐ Objection from parents (e.g. privacy concern)
☐ Not so familiar with computer skills
☐ Not so familiar with math/statistical knowledge
☐ LMS data may be used against me on my work performance evaluation
☐ LMS data can’t truly reflect students’ learning outcomes
☐ Other:
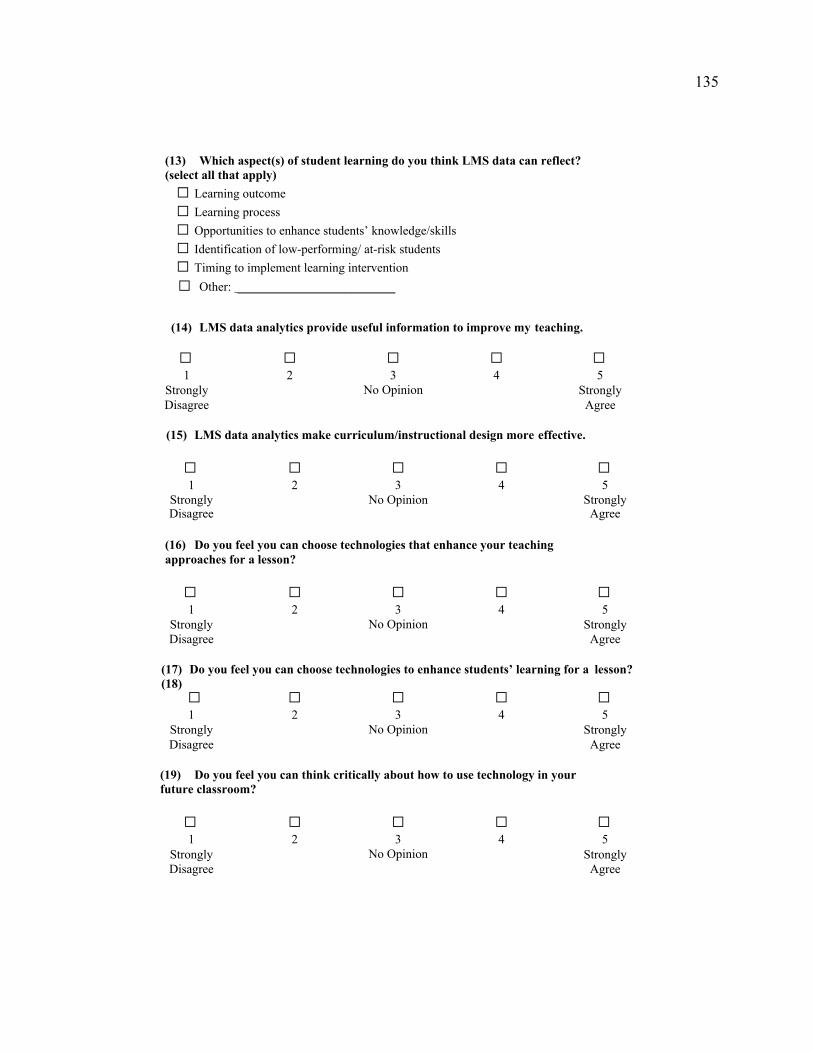
135
(13) Which aspect(s) of student learning do you think LMS data can reflect? (select all that apply) ☐ Learning outcome ☐ Learning process ☐ Opportunities to enhance students’ knowledge/skills ☐ Identification of low-performing/ at-risk students ☐ Timing to implement learning intervention ☐ Other: _________________________
(14) LMS data analytics provide useful information to improve my teaching.
☐ ☐ ☐ ☐ ☐ 1
Strongly Disagree
2 3 No Opinion
4 5 Strongly
Agree
(15) LMS data analytics make curriculum/instructional design more effective. ☐ ☐ ☐ ☐ ☐
1 Strongly Disagree
2 3 No Opinion
4 5 Strongly
Agree
(16) Do you feel you can choose technologies that enhance your teaching approaches for a lesson?
☐ ☐ ☐ ☐ ☐ 1
Strongly Disagree
2 3 No Opinion
4 5 Strongly
Agree
(17) Do you feel you can choose technologies to enhance students’ learning for a lesson? (18)
☐ ☐ ☐ ☐ ☐ 1
Strongly Disagree
2 3 No Opinion
4 5 Strongly
Agree
(19) Do you feel you can think critically about how to use technology in your future classroom?
☐ ☐ ☐ ☐ ☐
1 Strongly Disagree
2 3 No Opinion
4 5 Strongly
Agree

136
(20) Do you feel you can adapt different technologies to different teaching activities? ☐ ☐ ☐ ☐ ☐
1 Strongly Disagree
2 3 No Opinion
4 5 Strongly
Agree (21) To what extent can you use a variety of assessment strategies?
☐ ☐ ☐ ☐ ☐ ☐ ☐ ☐ ☐
1 Nothing
2 3 Very Little
4 5 Some
6 7 Quite A Bit
8 9 A Great
Deal
(22) To what extent can you provide an alternative explanation or example when students are confused?
☐ ☐ ☐ ☐ ☐ ☐ ☐ ☐ ☐
1 Nothing
2 3 Very Little
4 5 Some
6 7 Quite A Bit
8 9 A Great
Deal
(23) To what extent can you craft good questions for your students?
☐ ☐ ☐ ☐ ☐ ☐ ☐ ☐ ☐ 1
Nothing 2 3
Very Little
4 5 Some
6 7 Quite A Bit
8 9 A Great
Deal
(24) How well can you implement alternative strategies in your classroom?
☐ ☐ ☐ ☐ ☐ ☐ ☐ ☐ ☐ 1
Nothing 2 3
Very Little
4 5 Some
6 7 Quite A Bit
8 9 A Great
Deal
(25) How well can you respond to difficult questions from your students?
☐ ☐ ☐ ☐ ☐ ☐ ☐ ☐ ☐ 1
Nothing 2 3
Very Little
4 5 Some
6 7 Quite A Bit
8 9 A Great
Deal
(26) How much can you do to adjust your lessons to the proper level for individual students?
☐ ☐ ☐ ☐ ☐ ☐ ☐ ☐ ☐ 1
Nothing 2 3
Very Little
4 5 Some
6 7 Quite A Bit
8 9 A Great
Deal
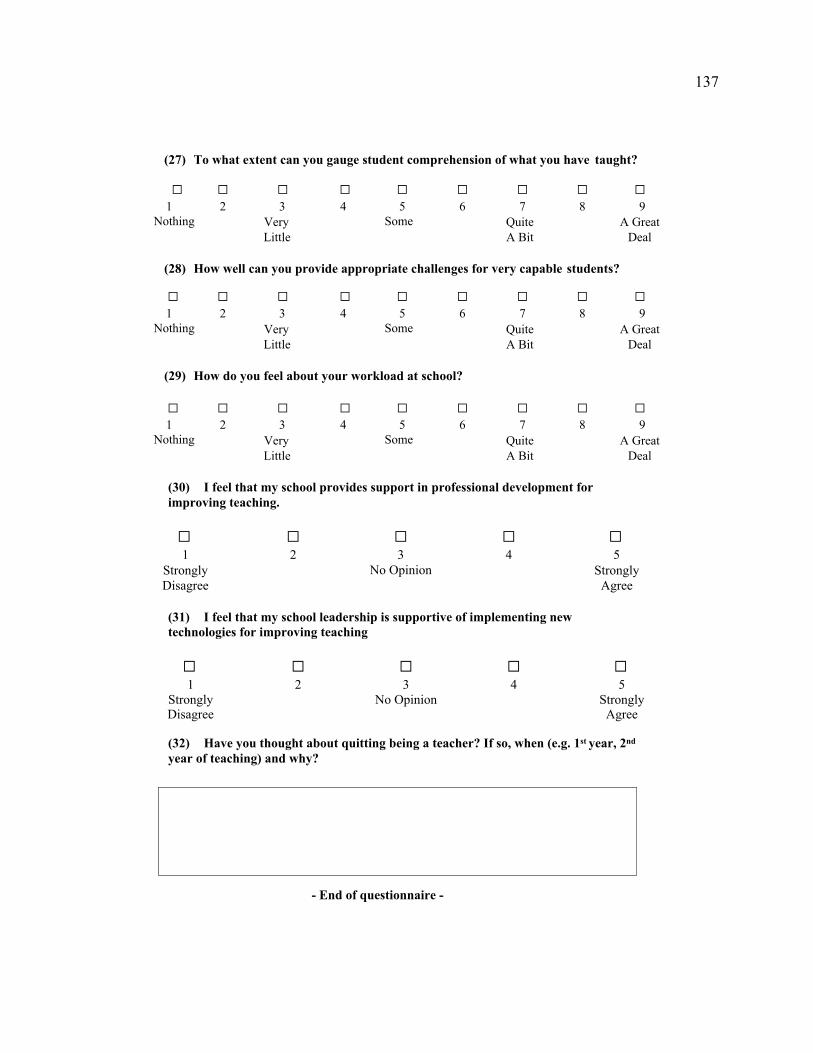
137
(27) To what extent can you gauge student comprehension of what you have taught?
☐ ☐ ☐ ☐ ☐ ☐ ☐ ☐ ☐
1 Nothing
2 3 Very Little
4 5 Some
6 7 Quite A Bit
8 9 A Great
Deal
(28) How well can you provide appropriate challenges for very capable students?
☐ ☐ ☐ ☐ ☐ ☐ ☐ ☐ ☐
1 Nothing
2 3 Very Little
4 5 Some
6 7 Quite A Bit
8 9 A Great
Deal
(29) How do you feel about your workload at school?
☐ ☐ ☐ ☐ ☐ ☐ ☐ ☐ ☐
1 Nothing
2 3 Very Little
4 5 Some
6 7 Quite A Bit
8 9 A Great
Deal
(30) I feel that my school provides support in professional development for
improving teaching.
☐ ☐ ☐ ☐ ☐ 1
Strongly Disagree
2 3 No Opinion
4 5 Strongly
Agree
(31) I feel that my school leadership is supportive of implementing new
technologies for improving teaching
☐ ☐ ☐ ☐ ☐
1 Strongly Disagree
2 3 No Opinion
4 5 Strongly
Agree
(32) Have you thought about quitting being a teacher? If so, when (e.g. 1st year, 2nd
year of teaching) and why?
- End of questionnaire -

138
Appendix B
Demographic and Basic Information Survey
(1) Your name (for data analysis purpose only): (2) Gender:
☐ Male ☐ Female ☐ Preferred way to identify:
(3) Age:
(4) Have you ever taken a teaching position before?
☐ Yes ☐ No
If your response is “Yes”, please indicate:
(4.1) How long is your teaching experience: _______________
(4.2) Where have you taught? (e.g. learning center, after school program,
tutoring): ___________________________________________
(5) Which year are you in for your teacher education program (if
applied)?
_____________________________
(6) Which subject do you plan to teach in the future/have you taught?
_______________________________
(7) Which grade level do you plan to teach in the future/have you taught?
☐ Elementary school ☐ Middle school ☐ High school ☐ Other: ___________________________
(Please continue on the next page)
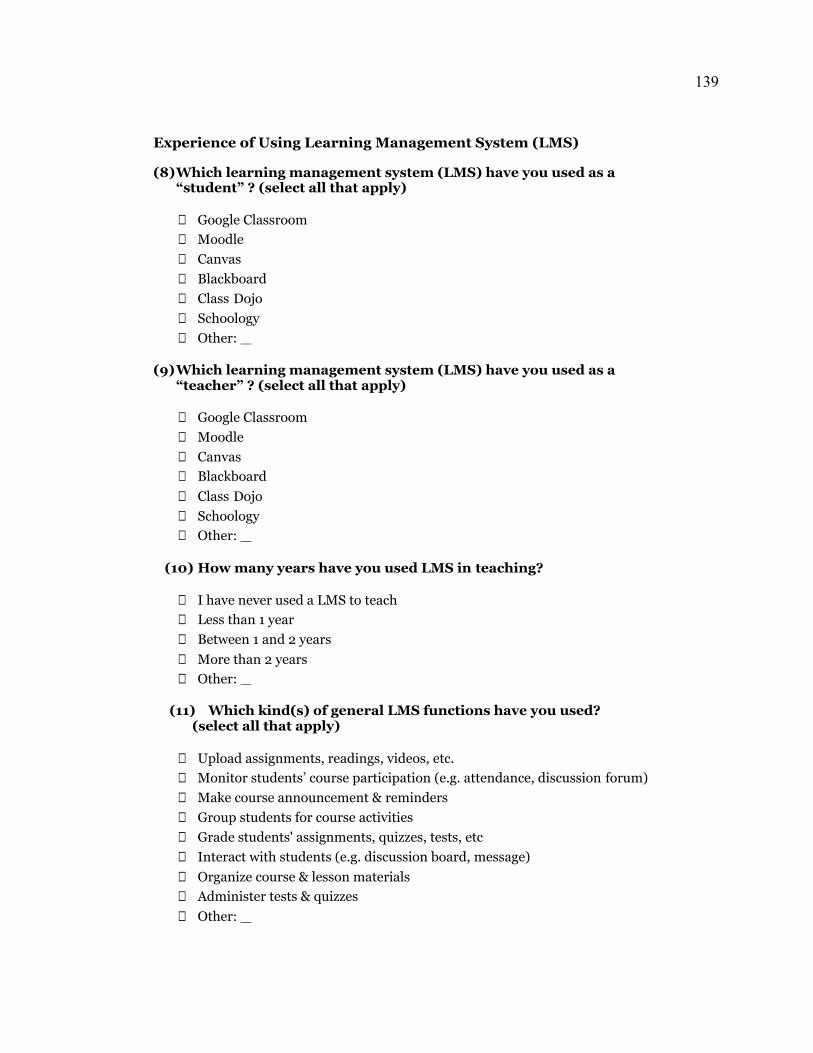
139
Experience of Using Learning Management System (LMS)
(8) Which learning management system (LMS) have you used as a “student” ? (select all that apply)
☐ Google Classroom ☐ Moodle ☐ Canvas ☐ Blackboard ☐ Class Dojo ☐ Schoology ☐ Other:
(9) Which learning management system (LMS) have you used as a “teacher” ? (select all that apply)
☐ Google Classroom ☐ Moodle ☐ Canvas ☐ Blackboard ☐ Class Dojo ☐ Schoology ☐ Other:
(10) How many years have you used LMS in teaching?
☐ I have never used a LMS to teach ☐ Less than 1 year ☐ Between 1 and 2 years ☐ More than 2 years ☐ Other:
(11) Which kind(s) of general LMS functions have you used? (select all that apply)
☐ Upload assignments, readings, videos, etc. ☐ Monitor students’ course participation (e.g. attendance, discussion forum) ☐ Make course announcement & reminders ☐ Group students for course activities ☐ Grade students' assignments, quizzes, tests, etc ☐ Interact with students (e.g. discussion board, message) ☐ Organize course & lesson materials ☐ Administer tests & quizzes ☐ Other:

140
(12) Which kind(s) of general LMS functions have you used? (select all that apply)
☐ None ☐ Check class & individual student’s learning progress ☐ Check class & individual student’s learning outcomes ☐ Identify & alert low-performing/ at-risk students ☐ Predict students’ learning outcomes ☐ Monitor students' learning to make pedagogical suggestions for teachers ☐ Identify appropriate pedagogical approach & detect the timing to intervene ☐ Other:
(13) If a colleague has some statistical questions that (s)he
wants to ask you for your help, how comfortable do you feel about helping him/her? Not 1 2 3 4 5 Very comfortable comfortable
(end of this survey—Thank you!)

141
Appendix C
Week 1: Pretest Survey
Your name (for data analysis purpose only):
Data Analytics Knowledge Questions
1.1 To get a sense of students' average performance, you can calculate mean. Given two student groups' scores below, please write down your calculation process and the mean for each group below:
Group 1 scores: (60, 77, 55, 97, 81) Group 2 scores: (88, 42, 30, 95, 100)
Group 1 mean: Group 2 mean:
1.2 To get a sense of students' average performance, you can also calculate median. Given the same student scores as in the previous question, please write down the median for each group below:
Group 1 scores: (60, 77, 55, 97, 81) Group 2 scores: (88, 42, 30, 95, 100)
Group 1 median: Group 2 median:
Please put your calculation process here:
Please put your calculation process here:

142
1.3 If there is a new score 60 to be added into each of the two group scores, what is the new mean for each group? Group 1 scores: (60, 77, 55, 97, 81) Group 2 scores: (88, 42, 30, 95, 100)
Group 1 mean: Group 2 mean:
1.4 If there is a new score 60 to be added into each of the two group scores, what is the new
median for each group?
Group 1 scores: (60, 77, 55, 97, 81) Group 2 scores: (88, 42, 30, 95, 100)
Group 1 median: Group 2 median:
Please put your calculation process here:
Please put your calculation process here:
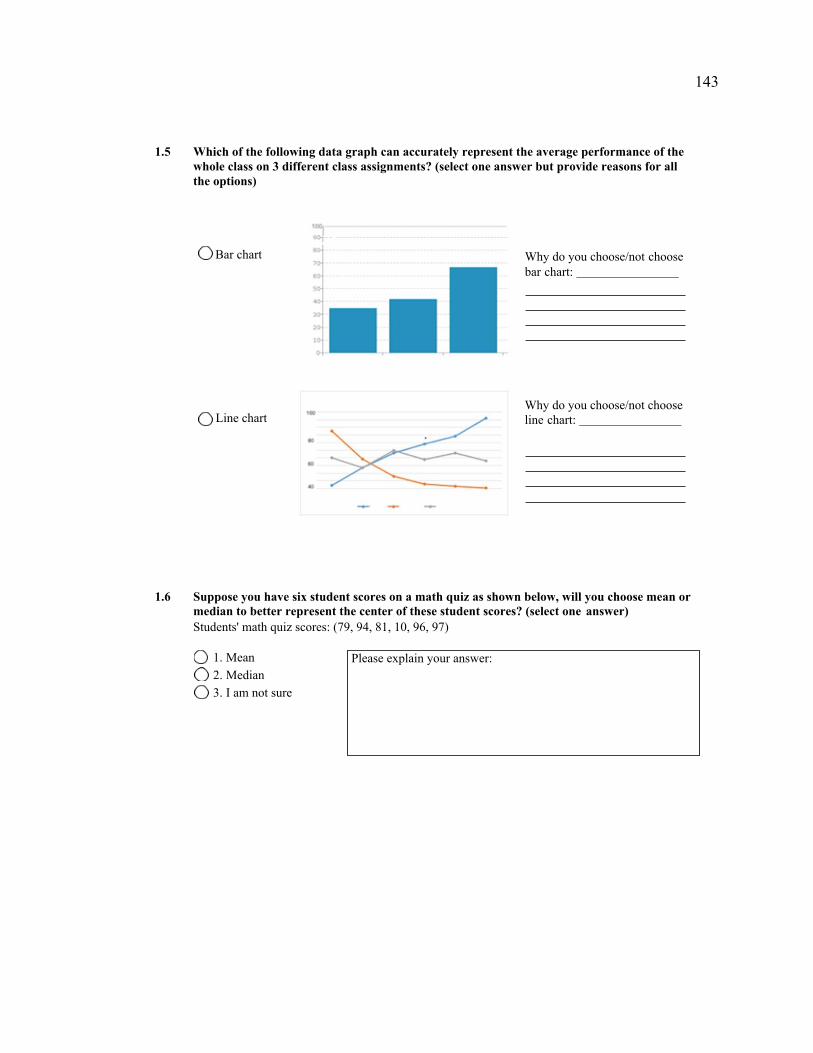
143
1.5 Which of the following data graph can accurately represent the average performance of the whole class on 3 different class assignments? (select one answer but provide reasons for all the options)
Bar chart Why do you choose/not choose bar chart:
Line chart Why do you choose/not choose line chart:
1.6 Suppose you have six student scores on a math quiz as shown below, will you choose mean or median to better represent the center of these student scores? (select one answer) Students' math quiz scores: (79, 94, 81, 10, 96, 97)
1. Mean 2. Median 3. I am not sure
Please explain your answer:

144
2.1 Variance can be generally defined as the average distance of students' scores from their group mean. Given two groups of students' scores below, please write down your calculation process and the variance for group 1 & 2 separately:
Group 1 scores: (42, 65, 58, 85) Group 2 scores: (66, 81, 74, 69)
Group 1 variance: Group 2 variance:
2.2 For the same two sets of student scores in the previous question, if there is a new score 100 to be added into each group, which of the following is true? (select all that apply)
☐ 1. The variance will not change in both group 1 & group 2 ☐ 2. The variance will increase in both group 1 & group 2 ☐ 3. The variance will decrease in both group 1 & group 2 ☐ 4. The variance will increase more in group 1 than in group 2 ☐ 5. The variance will increase more in group 2 than in group 1 ☐ 6. I am not sure
2.3 If you have two new student groups, and the variance for group 1 is 78 while the variance for
group 2 is 18, how will you interpret students' performance in group 1 and 2 regarding their variance? (select one answer)
1. Students' performance in group 1 is more similar to each other than that in group 2 2. Students' performance in group 1 is less similar to each other than that in group 2 3. In order to know the variation of student performance in both group, you can’t use variance 4. I am not sure
Please put your calculation process here:
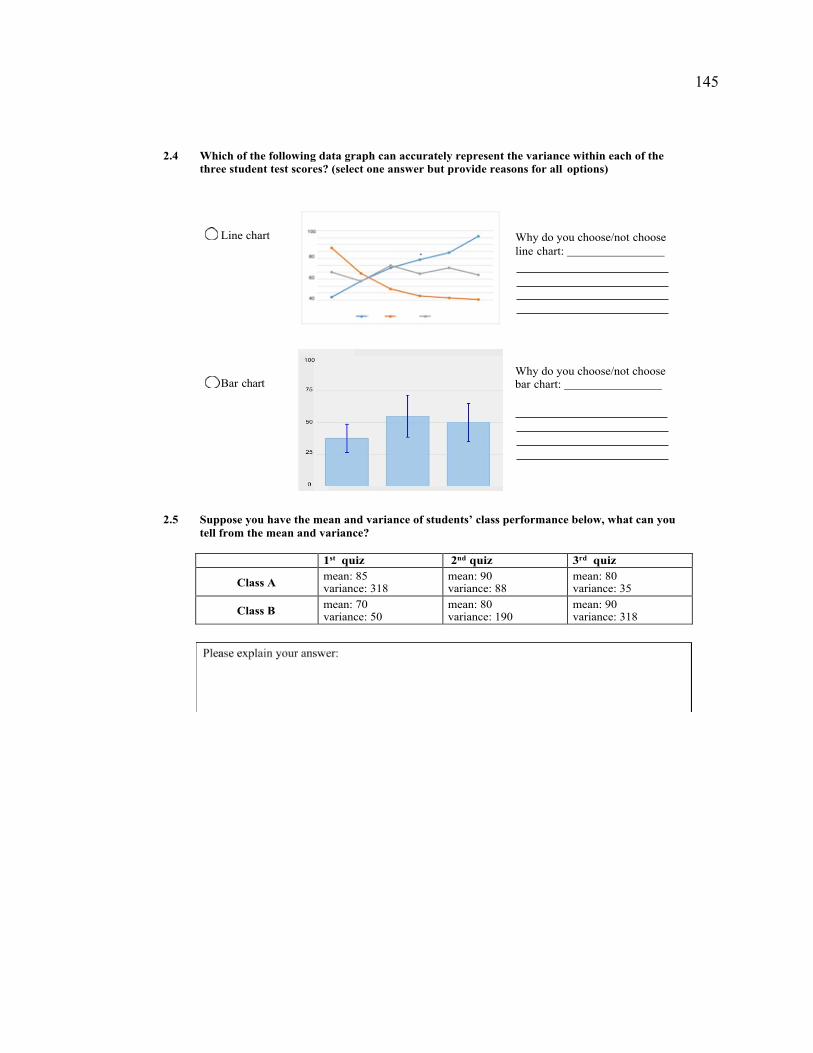
145
2.4 Which of the following data graph can accurately represent the variance within each of the three student test scores? (select one answer but provide reasons for all options)
Line chart Why do you choose/not choose line chart:
Bar chart Why do you choose/not choose bar chart:
2.5 Suppose you have the mean and variance of students’ class performance below, what can you tell from the mean and variance?
1st quiz 2nd quiz 3rd quiz
Class A mean: 85 variance: 318
mean: 90 variance: 88
mean: 80 variance: 35
Class B mean: 70 variance: 50
mean: 80 variance: 190
mean: 90 variance: 318

146
3.1 A correlation coefficient (Pearson's r) is a numerical measure of a statistical relationship between two variables ranging from −1 to +1. If you have identified that r = 0.8 between students' quiz 1 & 2 score, and r = 0.2 between quiz 1 & 3, and r= -0.3 between quiz 2 & 3, which of the following is true? (select all that apply) * assuming all correlation coefficients are statistically significant
☐ 1. There is a strong positive relation between quiz 1 & 2 score ☐ 2. There is a strong negative negative relation between quiz 2 & 3 score ☐ 3. There is a weak positive relation between quiz 1 & 3 score ☐ 4. There is a moderate positive relation between quiz 1, 2, & 3 ☐ 5. I am not sure
3.2 Please pair each of the following correlation coefficients (Pearson's r) with their
corresponding data visualization which best describes the relationship between X and Y
r = 0 : r = +1 : r = - 1: r = + 0.7: r = - 0.7:
A. B. C. D. E.
Please explain your answer:
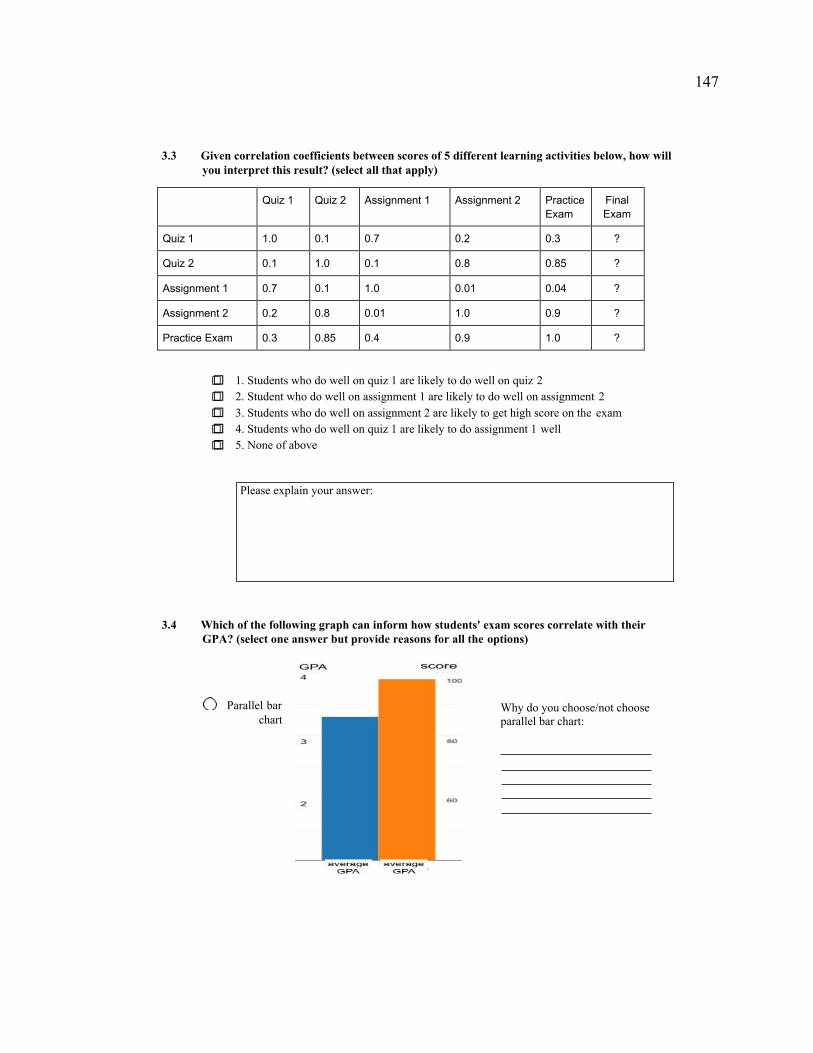
147
3.3 Given correlation coefficients between scores of 5 different learning activities below, how will you interpret this result? (select all that apply)
Quiz 1 Quiz 2 Assignment 1 Assignment 2 Practice
Exam Final Exam
Quiz 1 1.0 0.1 0.7 0.2 0.3 ?
Quiz 2 0.1 1.0 0.1 0.8 0.85 ?
Assignment 1 0.7 0.1 1.0 0.01 0.04 ?
Assignment 2 0.2 0.8 0.01 1.0 0.9 ?
Practice Exam 0.3 0.85 0.4 0.9 1.0 ?
☐ 1. Students who do well on quiz 1 are likely to do well on quiz 2 ☐ 2. Student who do well on assignment 1 are likely to do well on assignment 2 ☐ 3. Students who do well on assignment 2 are likely to get high score on the exam ☐ 4. Students who do well on quiz 1 are likely to do assignment 1 well ☐ 5. None of above
3.4 Which of the following graph can inform how students' exam scores correlate with their GPA? (select one answer but provide reasons for all the options)
Parallel bar chart
Why do you choose/not choose parallel bar chart:
Please explain your answer:
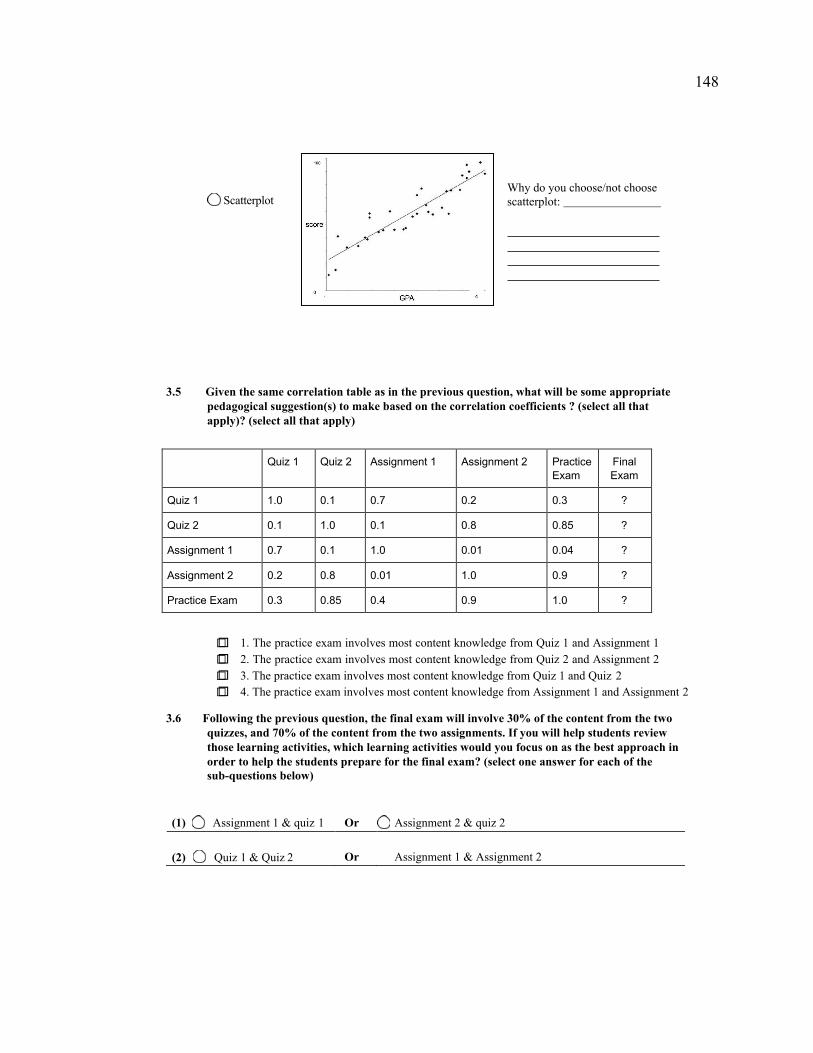
148
Scatterplot Why do you choose/not choose scatterplot:
3.5 Given the same correlation table as in the previous question, what will be some appropriate pedagogical suggestion(s) to make based on the correlation coefficients ? (select all that apply)? (select all that apply)
Quiz 1 Quiz 2 Assignment 1 Assignment 2 Practice Exam
Final Exam
Quiz 1 1.0 0.1 0.7 0.2 0.3 ?
Quiz 2 0.1 1.0 0.1 0.8 0.85 ?
Assignment 1 0.7 0.1 1.0 0.01 0.04 ?
Assignment 2 0.2 0.8 0.01 1.0 0.9 ?
Practice Exam 0.3 0.85 0.4 0.9 1.0 ?
☐ 1. The practice exam involves most content knowledge from Quiz 1 and Assignment 1 ☐ 2. The practice exam involves most content knowledge from Quiz 2 and Assignment 2 ☐ 3. The practice exam involves most content knowledge from Quiz 1 and Quiz 2 ☐ 4. The practice exam involves most content knowledge from Assignment 1 and Assignment 2
3.6 Following the previous question, the final exam will involve 30% of the content from the two
quizzes, and 70% of the content from the two assignments. If you will help students review those learning activities, which learning activities would you focus on as the best approach in order to help the students prepare for the final exam? (select one answer for each of the sub-questions below)
(1) Assignment 1 & quiz 1 Or Assignment 2 & quiz 2 (2) Quiz 1 & Quiz 2
Or
Assignment 1 & Assignment 2

149
4.1 Which of the following is the purpose of using regression analysis? (select all that apply)
☐ 1. Understand the causal relationship between a dependent variable and independent variable(s) ☐ 2. Forecasting (predicting) an outcome based on effect of independent variable(s) ☐ 3. Identify the trends of dependent variable given the change in the independent variable(s) ☐ 4. Identify if the difference between two sets of values is statistically significant
4.2 Please link each of the following questions with the type function in regression analysis in the following:
1. Does the number of class attendance affect student mid-term exam score?
2. What is the relationship between students’ quiz score and their test score?
3. With a regression formula: final exam score = 20 + 0.60 x class attendance, what is the effect on the final exam score every time a student misses a class?
4. Give a regression formula: test score = 15 + 0.85 x homework score , what is the test score that a student is likely to get if she gets 90 for her homework?
5. Is there a significant difference of average math test score between two school classes?
● ● Causal relationship
● ● Forecast student’s score based on independent variables
● ● Understand the correlation relation between two variables
● ● Inferential statistical t-test
● ● Predicting trends in student score based on change in independent variable(s)
4.3 Following the previous question, if your goal is to know how each learning activity is likely to affect student final exam score, which of the following actions would you take? (select all that apply)
☐ 1. Run a correlation analysis on students’ scores on all learning activities ☐ 2. Run a regression analysis by using learning activities scores to predict the final exam scores ☐ 3. Check statistical significance and compare coefficients to see how each learning activity
contributes to final exam score ☐ 4. Check statistical significance on each correlation coefficient between any of the two learning
activities ☐ 5. Identify the direction and strength of each correlation coefficient ☐ 6. Identify the direction and strength of each regression coefficient
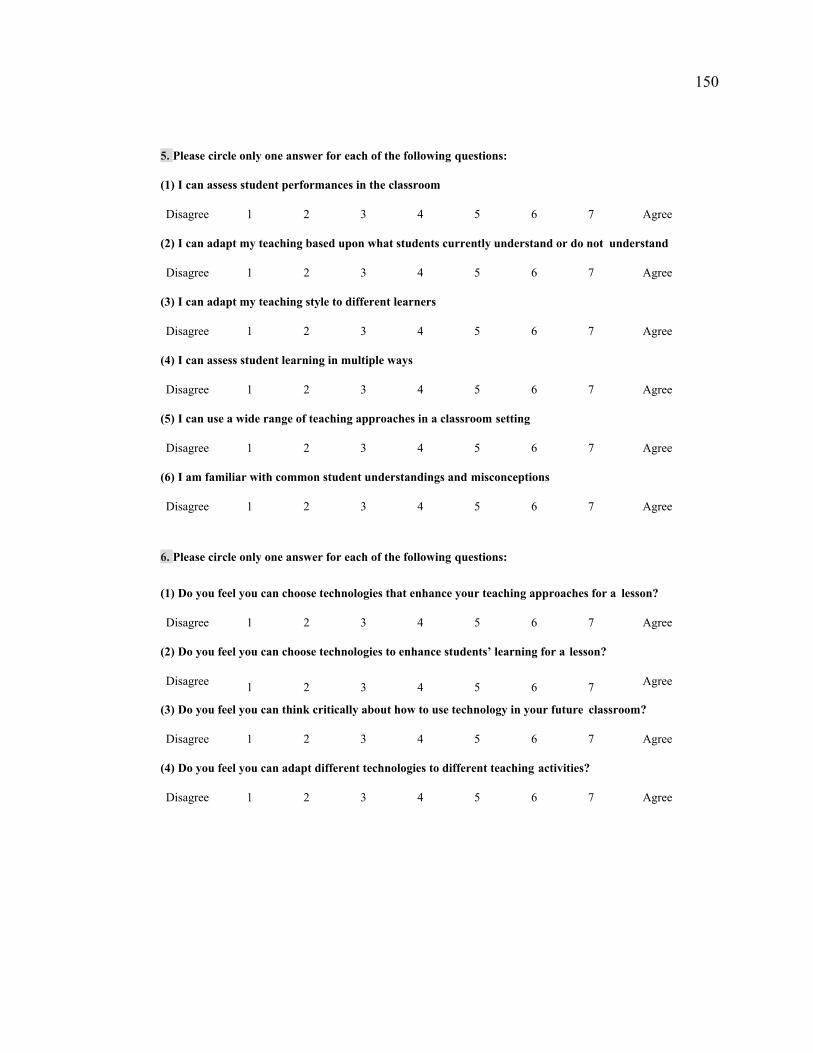
150
5. Please circle only one answer for each of the following questions:
(1) I can assess student performances in the classroom
Disagree 1 2 3 4 5 6 7 Agree
(2) I can adapt my teaching based upon what students currently understand or do not understand
Disagree 1 2 3 4 5 6 7 Agree
(3) I can adapt my teaching style to different learners
Disagree 1 2 3 4 5 6 7 Agree
(4) I can assess student learning in multiple ways
Disagree 1 2 3 4 5 6 7 Agree
(5) I can use a wide range of teaching approaches in a classroom setting
Disagree 1 2 3 4 5 6 7 Agree
(6) I am familiar with common student understandings and misconceptions
Disagree 1 2 3 4 5 6 7 Agree
6. Please circle only one answer for each of the following questions:
(1) Do you feel you can choose technologies that enhance your teaching approaches for a lesson?
Disagree 1 2 3 4 5 6 7 Agree
(2) Do you feel you can choose technologies to enhance students’ learning for a lesson?
Disagree 1 2 3 4 5 6 7 Agree
(3) Do you feel you can think critically about how to use technology in your future classroom?
Disagree 1 2 3 4 5 6 7 Agree
(4) Do you feel you can adapt different technologies to different teaching activities?
Disagree 1 2 3 4 5 6 7 Agree

151
7. Please circle only one answer for each of the following questions:
(1) To what extent can you use a variety of assessment strategies?
Nothing 1 2 3 4 5 6 7 8 9 A great deal
(2) To what extent can you provide an alternative explanation or example when students are confused?
Nothing 1 2 3 4 5 6 7 8 9 A great deal
(3) To what extent can you craft good questions for your students?
Nothing 1 2 3 4 5 6 7 8 9 A great deal
(4) How well can you implement alternative strategies in your classroom?
Nothing 1 2 3 4 5 6 7 8 9 A great deal
(5) How much can you do to control disruptive behavior in the classroom?
Nothing 1 2 3 4 5 6 7 8 9 A great deal
(6) How much can you do to get children to follow classroom rules?
Nothing 1 2 3 4 5 6 7 8 9 A great deal
(7) How much can you do to calm a student who is disruptive or noisy?
Nothing 1 2 3 4 5 6 7 8 9 A great deal
(8) How well can you establish a classroom management system with each group of students?
Nothing 1 2 3 4 5 6 7 8 9 A great deal
(9) How much can you do to get students to believe they can do well in school?
Nothing 1 2 3 4 5 6 7 8 9 A great deal
(10) How much can you do to help your students value learning?
Nothing 1 2 3 4 5 6 7 8 9 A great deal
(11) How much can you do to motivate students who show low interest in school?
Nothing 1 2 3 4 5 6 7 8 9 A great deal (12) How much can you assist families in helping their children do well in school?
Nothing 1 2 3 4 5 6 7 8 9 A great deal

152
8. Please circle only one answer for each of the following questions:
(1) When I make plans I follow through with them
Disagree 1 2 3 4 5 6 7 Agree
(2) I usually manage one way or another
Disagree 1 2 3 4 5 6 7 Agree
(3) I am able to depend on myself more than anyone else
Disagree 1 2 3 4 5 6 7 Agree
(4) Keeping interested in things is important to me
Disagree 1 2 3 4 5 6 7 Agree
(5) I can be on my own if I have to
Disagree 1 2 3 4 5 6 7 Agree
(6) I feel proud that I have accomplished things in my life
Disagree 1 2 3 4 5 6 7 Agree
(7) I usually take things in stride
Disagree 1 2 3 4 5 6 7 Agree
(8) I am friends with myself
Disagree 1 2 3 4 5 6 7 Agree
(9) I feel that I can handle many things at a time
Disagree 1 2 3 4 5 6 7 Agree
(10) I am determined
Disagree 1 2 3 4 5 6 7 Agree
(11) I seldom wonder what the point of it all is
Disagree 1 2 3 4 5 6 7 Agree
(12) I take things one day at a time
Disagree 1 2 3 4 5 6 7 Agree

153
(13) I can get through difficult times because I’ve experienced difficulty before
Disagree 1 2 3 4 5 6 7 Agree
(14) I have self-discipline
Disagree 1 2 3 4 5 6 7 Agree
(15) I keep interest in things
Disagree 1 2 3 4 5 6 7 Agree
(16) I can usually find something to laugh about
Disagree 1 2 3 4 5 6 7 Agree
(17) My belief in myself gets me through hard times
Disagree 1 2 3 4 5 6 7 Agree
(18) In an emergency, I am someone people generally can rely on
Disagree 1 2 3 4 5 6 7 Agree
(19) I can generally look at a situation in a number of ways
Disagree 1 2 3 4 5 6 7 Agree
(20) Sometimes I make myself do things whether I want to or not
Disagree 1 2 3 4 5 6 7 Agree
(21) My life has meaning
Disagree 1 2 3 4 5 6 7 Agree
(22) I do not dwell on things that I can’t do anything about
Disagree 1 2 3 4 5 6 7 Agree
(23) When I am in a difficult situation, I can usually find my way out of it
Disagree 1 2 3 4 5 6 7 Agree
(24) I have enough energy to do what I have to do
Disagree 1 2 3 4 5 6 7 Agree

154
(25) It’s okay if there are people who don’t like me
Disagree 1 2 3 4 5 6 7 Agree
End of this survey, thank you!

155
Appendix D
Learning Analytics Activity
Learning Analytics Activity — Examine Students’ Performance on Various Math Learning Activities
Imagineyouareanelementaryschoolmathteacher.YourteachercolleagueMegan,whoisalsoteachingelementarymath,hasrecentlybeenintroducedtoaLearningManagementSystem(LMS)1atschoolthroughprofessionaldevelopment.Sheismotivatedtousestudents’learningdataontheLMStogaininsightsintostudents’learningoutcomes.Toexperimentwiththisidea,Meganhascollectedstudents’dataonvariouslearningactivitiesofafewmathematicalconceptsshehastaughttoherclass,includingquizzes,assignments,andtests.
AlthoughMeganisexcitedabouttheinsightsthatstudents’learningdatamaybringonthisLMSsystem,sheistryingtounderstandhowthedifferentlearningactivitiesshedesignshelpstudentslearndifferentmathconcepts.Meganwantstoknowhowyoufindoutyourteachingskills,andstudents’learningoutcomes?
**Pleaselettheexperimenterknowwhenyoufinishreadingtheinformationonthispage**
\
1 LMS is a digital learning management system such as Google Classroom, Canvas, or Class Dojo.

156
Appendix E
Interview Questions
1. Can you mention 3 things you think most relevant to your teaching about today’s tutorial?
2. Based on what you learn today about (weekly subject names), can you give me an example about how you will use it in your teaching?
3. On the scale from 1 to 5, how important is this week’s tutorial content to your teaching and why?
157
Appendix F
Getting Familiar with Student Data
1) Please open the Microsoft Excel file that the experimenter shares with
you and make sure you can see the content. There are several tabs at the bottom of that Excel file, which you will use throughout this tutorial:
● tab1_raw_data ● tab2_mean ● tab3_median ● tab4_variance(1) ● tab5_variance(2)
YourcolleagueMeganhasbeenteachingafewmathematicalconceptstoherstudents.Shealsohascollectedseveralstudentscoresonvariouslearningactivities.Shehassharedtheselearningdatawithyou.
2) First, please click on the first tab (tab1_raw_data), and take a look at
the data as well as each column. You can see the definition of each variable column below:
● student_id: unique identifier for each student in this class ● gender: student’s gender ● group: learning group that each student is assigned to in this class ● ratios_quiz1: student’s grade of the first quiz on ratios ● ratios_quiz2: student’s grade of the second quiz on ratios ● rates_quiz1: student’s grade of the first quiz on rates ● rates_quiz2: student’s grade of the second quiz on rates ● percents_quiz1: student’s grade of the first quiz on percents ● percents_quiz2: student’s grade of the second quiz on percents ● ratios_assignment: student’s assignment grade on ratios ● rates_assignment: student’s assignment grade on rates ● percents_assignment: student’s assignment grade on percents ● ratios_test: student’s test grade on ratios ● rates_test: student’s test grade on rates ● percents_test: student’s test grade on percents

158
NowMeganwantstoknowthemeanscoreforeachofthelearningactivitiesthatherstudentshavefinished.Shealsowantstocomparethesemeanscoresacrossthe3differentmathconceptsshehastaughttoherstudents.
Calculate mean for student quiz, assignment, and test score
NOTE:Meanisavaluethatrepresentsanaverageofanarrayofnumbers.Tocalculateameanvalue,youwilladdthenumberstogetheranddivideitbythetotalcountofnumberssupplied.Forexample,themeanof(2,4,6)willbe4.
1) Click on the second tab(tab2_mean). In this tab, you will calculate the
mean for students’ average scores of their quizzes, assignments, and tests for each mathematical concepts: ratios, rates, percents
2) You will need to calculate different mean values and put them in
specific cells. For instance, in the following, “Mean for ratios quiz 1 & 2 scores (Q2)” suggests that you will need to calculate mean for two ratios quizzes and put it in the Q2 cell. The nine mean values that need to be calculated are:
○ Mean for ratios quiz 1 & 2 scores ○ Mean for rates quiz 1 & 2 scores ○ Mean for percents quiz 1 & 2 scores ○ Mean for ratio assignment score ○ Mean for rates assignment score ○ Mean for percents assignment score ○ Mean for ratios test score ○ Mean for rates test score ○ Mean for percents test score
3) To get the mean for ratios quiz 1 & 2 scores, click on cell Q2, and in
the formula function box at the top, enter =AVERAGE(D2:E22), which indicates the range of cells required to calculate this mean value. Afterwards, hit ‘enter’ and you should be seeing a mean value for ratios quiz 1 & 2 scores.
4) Similarly, You can get the mean for ratio assignment score and ratio
test score R2 and S2 by using the =AVERAGE() function and select appropriate data range

159
5) Now, using the same approach and calculate the remaining mean values
6) Now you have 9 different mean scores, which represent students’
average performance for each learning activity (i.e. quiz, assignment, test) for each mathematical concept (ratio, rates, percents). Take a moment to compare these mean scores and summarize your findings on the note paper. What kind of information will you report to your colleague Megan?
7) Next, you will visualize these mean values by using bar chart. Bar
chart helps you see the difference in scores and patterns more intuitively. For example, to create a bar chart for quiz, assignment, and test score for the math concept of ratio, you can do the following:
1. Select all the column name and data, that means select from Q2 to S2
2. Click on 'Insert' and select ’Chart’ and 'Column' at the top of the page on the toolbar
3. After finishing the previous steps, you should see the bar chart. Feel welcome to modify the layout and details of the bar chart by using clicking on the chart, and then under ‘Chart Design’ select ‘Quick Layouts’ under on the toolbar, and editing the details of your chart.

160
8) Following the same approach, you can continue to create two more bar charts for the math concept of rates and percents. Please let your partner know if you have trouble finishing this.
9) Your colleague Megan has informed you that student No.21 is a
new student that has just transferred from another school. She wants to know how this new student’s mean scores compares to the class on different learning activities, please share with your partner how would you analyze it?
Next,Meganwantstoknowthemedianscoreforeachofthelearningactivities.Shewantstocomparethesemedianscoresacrossthe3differentmathconceptsshehastaughttoherstudents.
Calculate median for student quiz, assignment, and test score
NOTE: Median is a value that represents another type of average of an array of numbers. It is the middle number in an array of supplied numbers. For example, the median of (1,2,3,4,5) will be 3. On the other hand, if the total count of numbers in the array is an even number, such as (1,4,3,2), then the median will be the mean of the two middle numbers. In this case, the median will be (2+3)/2 = 2.5
1) To calculate the median scores for each learning activity and each math
concept, you can click on the third tab (tab3_median), and you should see a similar template for student scores as in the previous exercise.
2) Now you need to calculate 9 different median values. To do so, click
Q2, and in the formula function box at the top, use MEDIAN(. ) function and select appropriate data range, and hit ‘enter’. Following the same approach, calculate the rest of the median scores using the MEDIAN(. ................................................................................... ) function.
3) As you are updating these median values, you should also see
their associated bar charts changing accordingly below the table.

161
4) After you are done, take a minute to observe these median values and also compare them with the mean values you have previously calculated and plotted. What kind of information would you like to share with Megan?
5) Megan wants to know how median works. Take the percents test score
for example, can you explain to Megan how the function =MEDIAN() works when you used it to get the median for the percents test score?
6) Similarly, Megan is wondering if the function =MEDIAN() will work
differently if one student score is missing from the percents test column. Can you explain it to her?
7) Lastly, when Megan looks at your visualizations for mean and median,
she has found that there is a large difference in the percent test score when you used mean versus median to calculate the average. Can you explain to Megan why this is the case?
End of week 1 tutorial

162
Appendix G
Week 2: Tutorial
YourcolleagueMeganhastaughtafewmathematicalconceptstoherstudents.Shehasalsocollectedseveralstudentscoresonvariouslearningactivities.LastweekyouhelpedMegantounderstandthemeanandmedianofherstudents’scores.Thisweeksheneedsyourhelpwithotherdataanalyticsquestions.
Meganwantstoknowthevarianceofthetestscoresforallthreemathconcepts:ratio,rate,andpercent.Shehastaughtthesethreeconceptstoherstudentsandherstudentshavetakenthosetests.
Calculate variance for ratios, rates, and percents test scores
NOTE: Variance in statistics is a measurement of the spread between numbers in a data array. It measures how far each number in a number set is from their collective mean in that number set. For example, the two number arrays (1, 1, 4) and (2, 2, 2) both have the same mean value of 2, but the first number array has a larger variance since each number spread from their collective mean more in the first array than in the second array. Here is a visualization and the formula for variance to help you understand:

163
1) You will practice calculating variance for test score on each math
concept (ratios, rates, percents). Please click on the fourth tab (tab4_variance(1)), where you can see in cell Q2, R2, and S2 you will need to calculate the variance for each test.
2) To calculate the variance value for the ratio test score, click on Q2,
and in the formula function box at the top type in =VAR(M2:M21) and then hit ‘enter’.
3) Similarly, please finish calculating the variance value for rate test
(R2) and percent test (S2) by using the same =VAR(...) function and selecting their corresponding data range.
MeganwantstoknowhowtheVAR(...)functionworksinExcel.CanyouexplaintoMeganthatwhatarethestepsthatExceltakestogetthevarianceforatestscore?
4) Take a moment to observe different variance values across three
different tests. Summarize your findings on the note paper.
5) Oftentimes, we will want to know mean and variance for a test score
at the same time, so that we know not only the average performance on that test, but also how similarly or differently students perform on that test. Since variance can’t be plotted directly with the mean, we will use standard deviation, which is just the square root of the variance. For example, if the variance of a test score is 9, then its standard deviation is √9 = 3.
Meganthinksitisnotveryusefultoknowonlythevariance,andshewantstoseebothmeanandstandarddeviationatthesametime.Next,let’strytoplotbothonthesamegraph.
6) To do so, click on tab5_variance(2), and first you need to
calculate the mean value for the three tests as you have done previously by using =AVERAGE(...). Fill in Q2, R2, and S2 cells with mean value for each test score. Please let your partner know if you have questions.

164
7) To visualize both the mean and standard deviation across the three tests, you will need to plot a bar chart that shows 3 mean values. You have done this previously, just to review, here are the steps:
1. Select all the column name and data, that means select from Q1 to S2
2. Click on 'Insert' and ‘Chart’, and’ select 'Column' at the top of the page on the toolbar
3. After finishing the previous steps, you should see the bar chart. Feel welcome to modify the layout and details of the bar chart by using Chart Design’ and ‘Quick Layouts’.
8) After you have plotted the bar chart that shows three mean values for
all the tests, you can add the standard deviation onto the same bar chart. Standard deviation is just the square root of the variance. The standard deviation for each math concept has been pre-calculated from Q5 to S5 cell for you.
9) To add standard deviation on the bar plot, first click on the bar chart
you have created, then on the top click on ‘Chart Design’ and ‘Add Chart Element’. Click on ‘Error Bars’ and choose the last option ‘Error Bars Options’. Afterwards, choose ‘Custom’ and click on ‘Specify Value’. In both boxes where it says ‘Positive Error Value’ and ‘Negative Error Value’, click on the small colorful windows next to them and select cell Q5 to S5 in this Excel tab. Click ‘OK’ and you should see standard deviation added on to the mean values(see image below).

165
10) After you are done, take a minute to observe and compare the mean and standard deviation value across the three math tests. What kind of information would you like to share with Megan?
11) Megan wants to know what it means to have high standard
deviation(variance), take a look at a test score, and explain to Megan.
12) Megan wants to know what she should do? What would you say?
Meganappreciatesallthedataanalyticsinsightsyouprovided.Nowsheisinterestedininvestigatinganotherdatasetwhichhasstudents’datafromanotherclasssheteaches.
Investigate dataset from Megan’s 2nd class
1) Please open the Microsoft Excel file that the experimenter shares with you and make sure you can see the content. There are several tabs at the bottom of that Excel file, which you will use throughout this tutorial:
● tab1_raw_data ● tab2_correlation ● tab3_correlation(2) ● tab4_correlation(3) ● tab5_regression ● tab6_regression_prediction

166
2) First, please click on the first tab (tab1_raw_data), and take a look at the data as well as each column. You can see the definition of each variable column below:
● student_id: unique identifier for each student in this class ● gender: student’s gender ● quiz1_ratio: student’s quiz 1 score ● quiz2_percent: student’s quiz 2 score ● assignment1_ratio: student’s assignment 1 score ● assignment2_geometry: student’s assignment 2 score ● exam_score: student’s exam score
Meganwantstoknowthecorrelationrelationsbetweendifferentlearningactivities.
Calculate correlation coefficients between different learning activities
NOTE: We use correlation coefficient (a value between -1 and 1) to display how strongly two variables are related to each other, but not to use one to predict the other. If the correlation coefficient is positive between two variables, that means there is a positive relationship between the two variables. This means if one goes up the other goes up, too. In contrast, if the correlation coefficient is negative, then that means there is a negative relationship between the two variables. This means if one goes up, the other goes down. The strength of correlation coefficient is indicated by the coefficient value, below is a convention to define correlation strength:
○ Exactly - 1: A perfect negative correlation ○ - 0.70: A strong negative correlation ○ - 0.50: A moderate negative correlation ○ - 0.30: A weak negative correlation ○ 0: No correlation relationship ○ +0.30:Aweakpositivecorrelation○ +0.50.Amoderatepositivecorrelation○ +0.70.Astrongpositivecorrelation○ Exactly + 1: A perfect positive correlation

167
1) You will use Excel to calculate correlation coefficients, which will give you some insights into the relationship between different learning activities. To examine the correlation between different learning activities, click on tab2 (tab2_correlation)
2) On the right-hand side of the excel page, you will see a table in
which you will calculate and fill in different correlation coefficients.
3) You will notice that the diagonal is filled up with the value 1. This
makes sense because correlation coefficient 1 suggests perfect positive correlation between a variable and the variable itself. In other words, quiz1 scores positively correlates with itself perfectly. However, to get correlation coefficients between different learning activities, you will need to use the Excel function =CORREL(. )
4) For example, to get the correlation coefficient between quiz 1 and
quiz 2, you need to first click on cell J5, then click on the formula
icon next to the fx at the top on the toolbar, then type =CORREL(. ............................................................................... ). You should then see an image like this:
5) To get the correlation coefficient between quiz 1 & quiz 2, you will
need to select their data range separately. For correlation between quiz 1 and quiz 2, you need to select B2:B21 select C2:C21. So the final formula should be =CORREL(B2:B21, C2:C21).In the end, hit ‘enter’ key and then you should see the correlation coefficient 0.98 between quiz 1 & 2. This suggests there is a strong positive correlation between the two. In other words, students that do well on quiz 1 are also likely to do well on quiz 2.
6) Now, repeat the same procedure and calculate all other correlation
coefficients between different learning activities. For each of the remaining

168
empty cell in the correlation table, remember to select their corresponding data range. Please note, you will only need to fill out the rest of the cells below the diagonal numbers of 1.
Meganisimpressedbythecorrelationtableyoucreated,butshewantstosummarizeit,whatwouldyoudo?
7) In the end, you can also visualize correlation between any two
learning activities. For example, to visualize correlation between assignment 1 and assignment 2, click and select both column D and E which correspond to their data range(use command key to select both columns). Then, on the toolbar, click on Insert, Charts, and choose X Y Scatter. After the scatter plot pops up, you can also adjust the details and layout under Chart Design and using Add Chart Element. For instance, you can add a linear trend line under Trendline In the end, you should see an image that is similar to the one in the following:
8) After you are done, click on tab3_correlation(2), you will see two correlation plots about quiz 1, assignment 1 and 2. What kind of information would you like to share with Megan?

169
9) On the other hand, Megan has done a survey to ask students about their weekly average sleep time (hours) and shared the data with you in tab4_correlation(3). She plotted the students’ sleep time and their exam scores. She realized that there is a high correlation (r=+0.91) between the two. She wants to know how would you explain this result?
End of week 2 tutorial

170
Appendix H
Week 2: Survey
Your name (for data analysis purpose only):
1. Please circle only one answer for each of the following questions:
(1) I can assess student performances in the classroom
Disagree 1 2 3 4 5 6 7 Agree
(2) I can adapt my teaching based upon what students currently understand or do not understand
Disagree 1 2 3 4 5 6 7 Agree
(3) I can adapt my teaching style to different learners
Disagree 1 2 3 4 5 6 7 Agree
(4) I can assess student learning in multiple ways
Disagree 1 2 3 4 5 6 7 Agree
(5) I can use a wide range of teaching approaches in a classroom setting
Disagree 1 2 3 4 5 6 7 Agree
(6) I am familiar with common student understandings and misconceptions
Disagree 1 2 3 4 5 6 7 Agree
2. Please circle only one answer for each of the following questions:
(1) Do you feel you can choose technologies that enhance your teaching approaches for a lesson?
Disagree 1 2 3 4 5 6 7 Agree
(2) Do you feel you can choose technologies to enhance students’ learning for a lesson?
Disagree 1 2 3 4 5 6 7 Agree
(3) Do you feel you can think critically about how to use technology in your future classroom?
Disagree 1 2 3 4 5 6 7 Agree
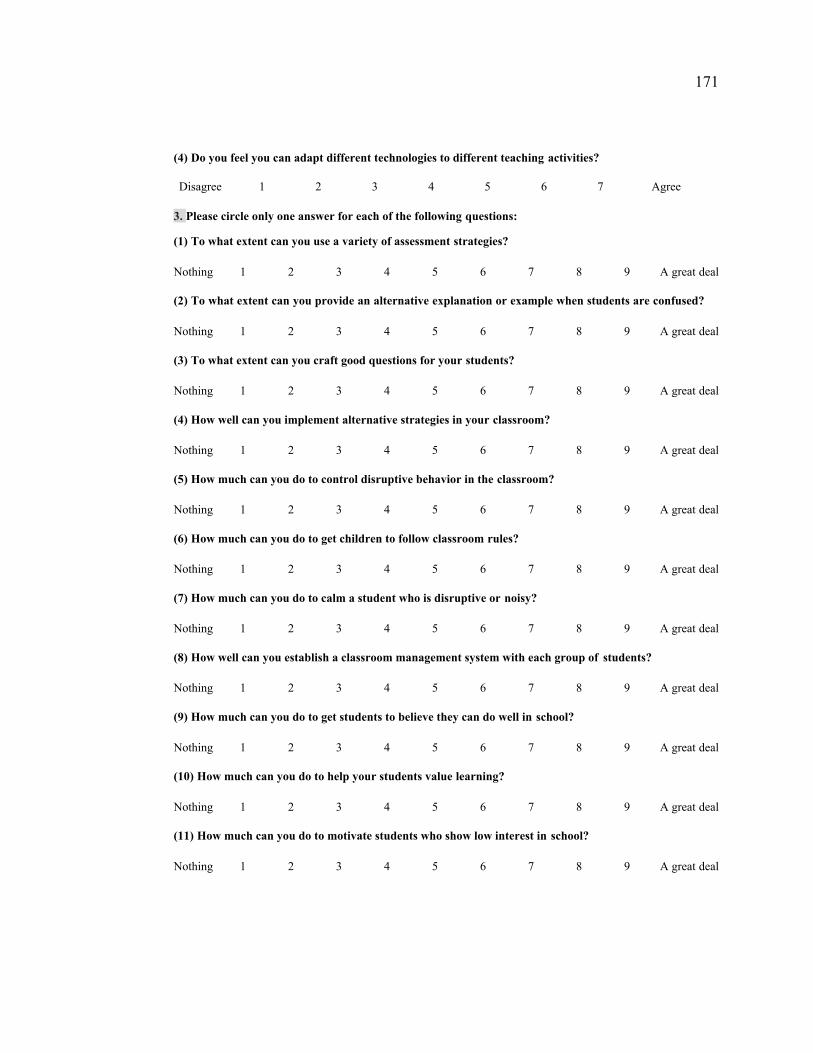
171
(4) Do you feel you can adapt different technologies to different teaching activities?
Disagree 1 2 3 4 5 6 7 Agree
3. Please circle only one answer for each of the following questions:
(1) To what extent can you use a variety of assessment strategies?
Nothing 1 2 3 4 5 6 7 8 9 A great deal
(2) To what extent can you provide an alternative explanation or example when students are confused?
Nothing 1 2 3 4 5 6 7 8 9 A great deal
(3) To what extent can you craft good questions for your students?
Nothing 1 2 3 4 5 6 7 8 9 A great deal
(4) How well can you implement alternative strategies in your classroom?
Nothing 1 2 3 4 5 6 7 8 9 A great deal
(5) How much can you do to control disruptive behavior in the classroom?
Nothing 1 2 3 4 5 6 7 8 9 A great deal
(6) How much can you do to get children to follow classroom rules?
Nothing 1 2 3 4 5 6 7 8 9 A great deal
(7) How much can you do to calm a student who is disruptive or noisy?
Nothing 1 2 3 4 5 6 7 8 9 A great deal
(8) How well can you establish a classroom management system with each group of students?
Nothing 1 2 3 4 5 6 7 8 9 A great deal
(9) How much can you do to get students to believe they can do well in school?
Nothing 1 2 3 4 5 6 7 8 9 A great deal
(10) How much can you do to help your students value learning?
Nothing 1 2 3 4 5 6 7 8 9 A great deal
(11) How much can you do to motivate students who show low interest in school?
Nothing 1 2 3 4 5 6 7 8 9 A great deal

172
(12) How much can you assist families in helping their children do well in school?
Nothing 1 2 3 4 5 6 7 8 9 A great deal
4. Please circle only one answer for each of the following questions:
(1) When I make plans I follow through with them
Disagree 1 2 3 4 5 6 7 Agree
(2) I usually manage one way or another
Disagree 1 2 3 4 5 6 7 Agree
(3) I am able to depend on myself more than anyone else
Disagree 1 2 3 4 5 6 7 Agree
(4) Keeping interested in things is important to me
Disagree 1 2 3 4 5 6 7 Agree
(5) I can be on my own if I have to
Disagree 1 2 3 4 5 6 7 Agree
(6) I feel proud that I have accomplished things in my life
Disagree 1 2 3 4 5 6 7 Agree
(7) I usually take things in stride
Disagree 1 2 3 4 5 6 7 Agree
(8) I am friends with myself
Disagree 1 2 3 4 5 6 7 Agree
(9) I feel that I can handle many things at a time
Disagree 1 2 3 4 5 6 7 Agree
(10) I am determined
Disagree 1 2 3 4 5 6 7 Agree

173
(11) I seldom wonder what the point of it all is
Disagree 1 2 3 4 5 6 7 Agree
(12) I take things one day at a time
Disagree 1 2 3 4 5 6 7 Agree
(13) I can get through difficult times because I’ve experienced difficulty before
Disagree 1 2 3 4 5 6 7 Agree
(14) I have self-discipline
Disagree 1 2 3 4 5 6 7 Agree
(15) I keep interest in things
Disagree 1 2 3 4 5 6 7 Agree
(16) I can usually find something to laugh about
Disagree 1 2 3 4 5 6 7 Agree
(17) My belief in myself gets me through hard times
Disagree 1 2 3 4 5 6 7 Agree
(18) In an emergency, I am someone people generally can rely on
Disagree 1 2 3 4 5 6 7 Agree
(19) I can generally look at a situation in a number of ways
Disagree 1 2 3 4 5 6 7 Agree
(20) Sometimes I make myself do things whether I want to or not
Disagree 1 2 3 4 5 6 7 Agree
(21) My life has meaning
Disagree 1 2 3 4 5 6 7 Agree
(22) I do not dwell on things that I can’t do anything about
Disagree 1 2 3 4 5 6 7 Agree

174
(23) When I am in a difficult situation, I can usually find my way out of it
Disagree 1 2 3 4 5 6 7 Agree
(24) I have enough energy to do what I have to do
Disagree 1 2 3 4 5 6 7 Agree
(25) It’s okay if there are people who don’t like me
Disagree 1 2 3 4 5 6 7 Agree
End of this survey, thank you!
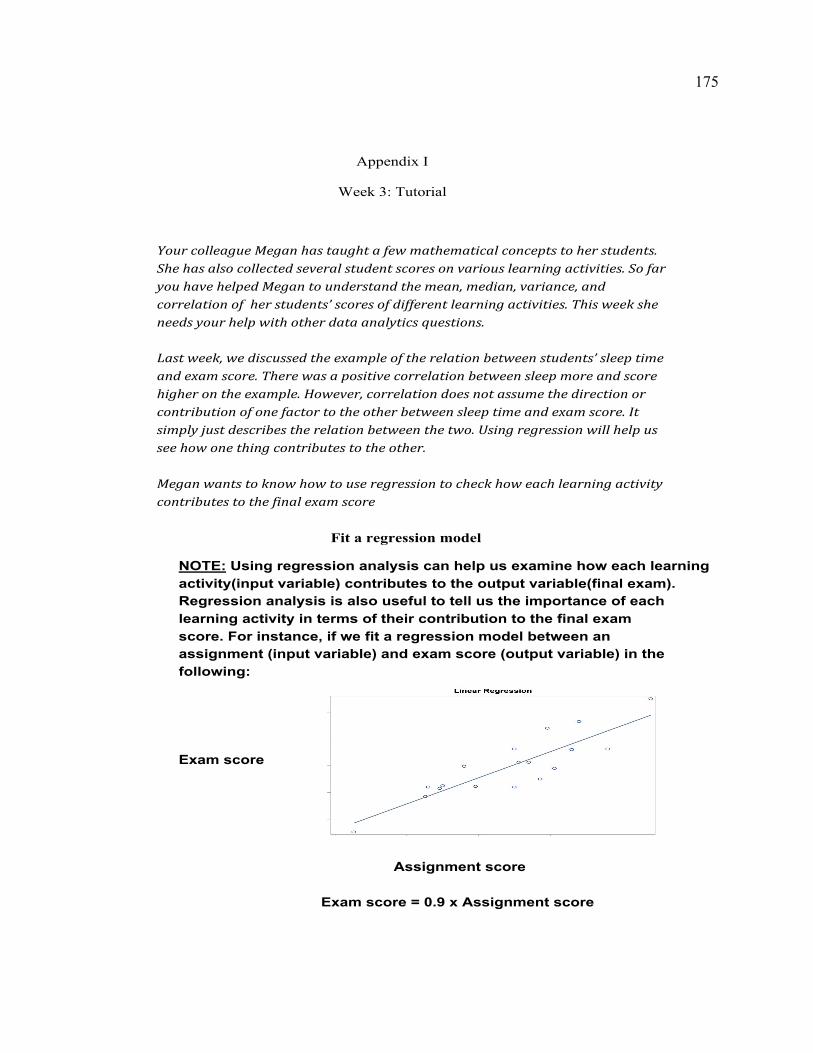
175
Appendix I
Week 3: Tutorial
YourcolleagueMeganhastaughtafewmathematicalconceptstoherstudents.Shehasalsocollectedseveralstudentscoresonvariouslearningactivities.SofaryouhavehelpedMegantounderstandthemean,median,variance,andcorrelationofherstudents’scoresofdifferentlearningactivities.Thisweeksheneedsyourhelpwithotherdataanalyticsquestions.
Lastweek,wediscussedtheexampleoftherelationbetweenstudents’sleeptimeandexamscore.Therewasapositivecorrelationbetweensleepmoreandscorehigherontheexample.However,correlationdoesnotassumethedirectionorcontributionofonefactortotheotherbetweensleeptimeandexamscore.Itsimplyjustdescribestherelationbetweenthetwo.Usingregressionwillhelpusseehowonethingcontributestotheother.
Meganwantstoknowhowtouseregressiontocheckhoweachlearningactivitycontributestothefinalexamscore
Fit a regression model
NOTE: Using regression analysis can help us examine how each learning activity(input variable) contributes to the output variable(final exam). Regression analysis is also useful to tell us the importance of each learning activity in terms of their contribution to the final exam score. For instance, if we fit a regression model between an assignment (input variable) and exam score (output variable) in the following:
Exam score
Assignment score
Exam score = 0.9 x Assignment score
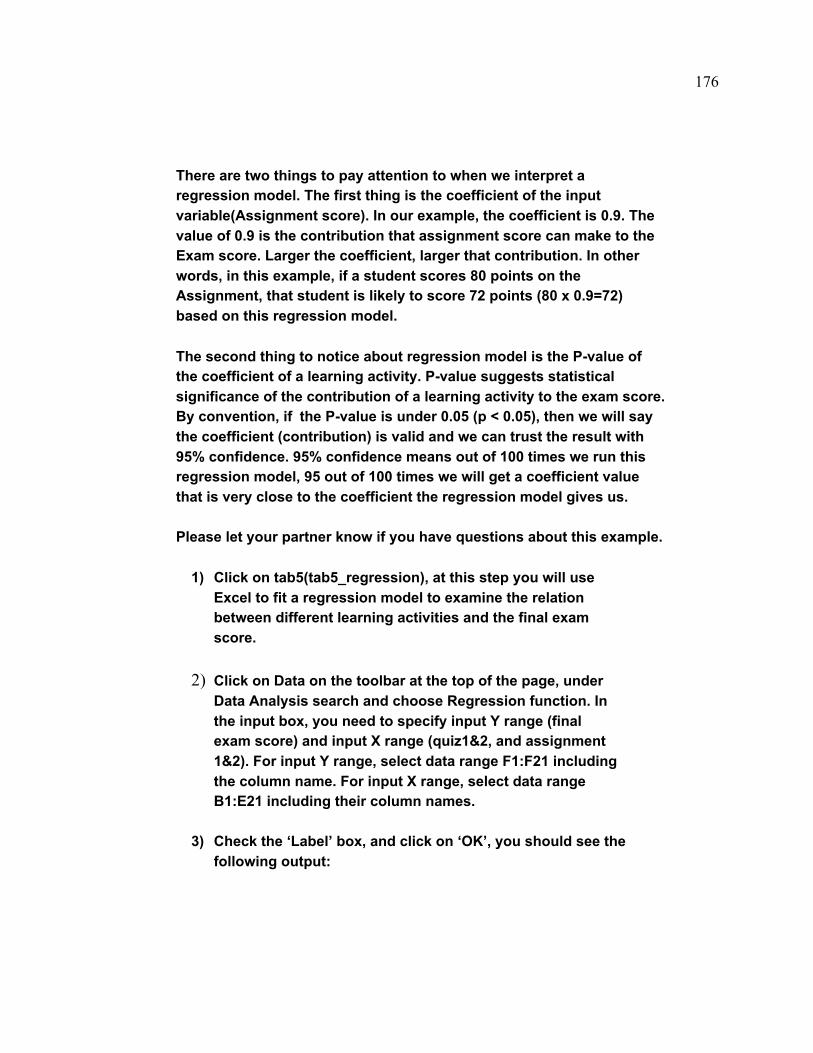
176
There are two things to pay attention to when we interpret a regression model. The first thing is the coefficient of the input variable(Assignment score). In our example, the coefficient is 0.9. The value of 0.9 is the contribution that assignment score can make to the Exam score. Larger the coefficient, larger that contribution. In other words, in this example, if a student scores 80 points on the Assignment, that student is likely to score 72 points (80 x 0.9=72) based on this regression model.
The second thing to notice about regression model is the P-value of the coefficient of a learning activity. P-value suggests statistical significance of the contribution of a learning activity to the exam score. By convention, if the P-value is under 0.05 (p < 0.05), then we will say the coefficient (contribution) is valid and we can trust the result with 95% confidence. 95% confidence means out of 100 times we run this regression model, 95 out of 100 times we will get a coefficient value that is very close to the coefficient the regression model gives us.
Please let your partner know if you have questions about this example.
1) Click on tab5(tab5_regression), at this step you will use
Excel to fit a regression model to examine the relation between different learning activities and the final exam score.
2) Click on Data on the toolbar at the top of the page, under Data Analysis search and choose Regression function. In the input box, you need to specify input Y range (final exam score) and input X range (quiz1&2, and assignment 1&2). For input Y range, select data range F1:F21 including the column name. For input X range, select data range B1:E21 including their column names.
3) Check the ‘Label’ box, and click on ‘OK’, you should see the
following output:

177
Meganwantstoknowhowtointerprettheresults.Shehasfoundthatintheresultsquiz1,quiz2,assignment1,andassignment2havedifferentcoefficientsandP-value.
NOTE: The way to explain coefficients is to examine their direction, slope, and p-value. For example, quiz 1’s coefficient is 0.16 while quiz 2 is -0.01. This means their contribution on the exam score is different regarding both the direction and strength. Also, if you check the P-value for both coefficients, you will find for quiz 1 is 0.01 while for quiz 2 is 0.79. By convention, P-value has to be lower than 0.05 (p < 0.05) for a coefficient to be called significant. So in this case, we will say the coefficient for quiz 2 is NOT significant so we can’t trust its contribution to the exam score.
Meganhaswrittendowntheregressionmodelyouhavehelpedherbuildinthefollowing:examscore=(0.16*quiz1)+(-0.01*quiz2)+(0.26*assignment1)+(0.58*assignment2)
a. Take a look at the results in the Excel sheet and the
NOTE about coefficients above, how would you explain to Megan the effect of each learning activity regarding their contribution to the exam score?
b. In the end, Megan has decided to remove quiz 2
from this regression model, why do you think she did that?
c. What would you suggest Megan do based on this
regression model and results?
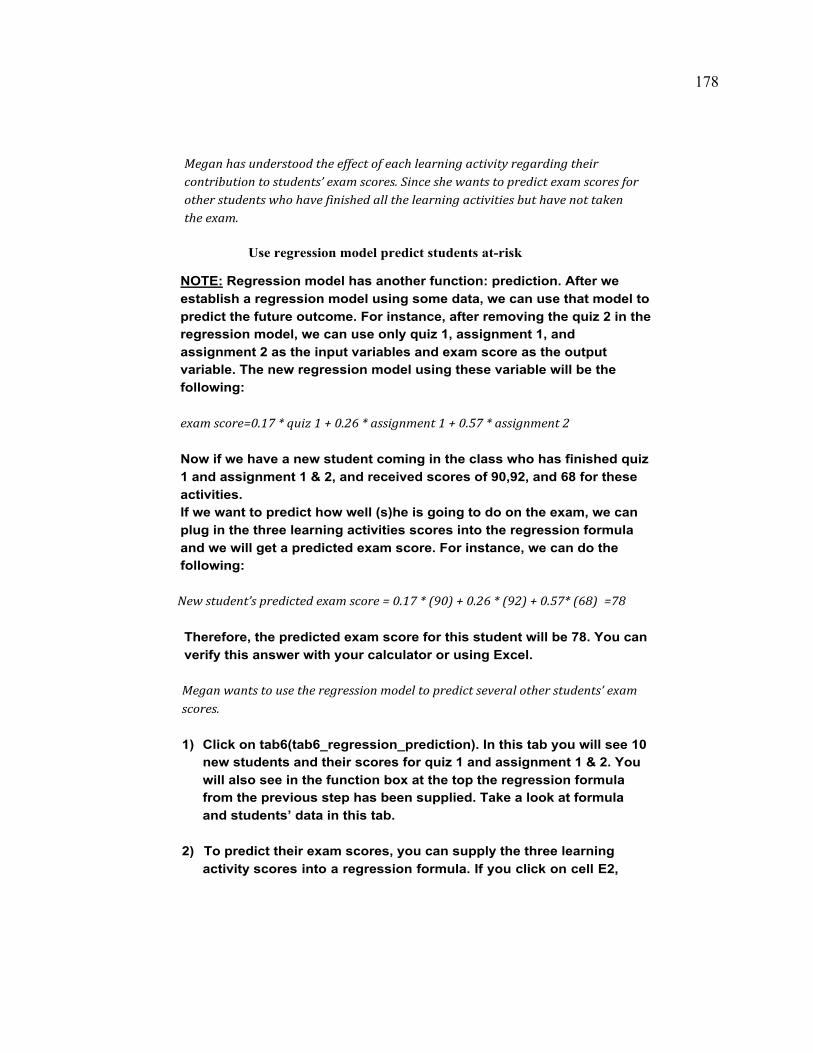
178
Meganhasunderstoodtheeffectofeachlearningactivityregardingtheircontributiontostudents’examscores.Sinceshewantstopredictexamscoresforotherstudentswhohavefinishedallthelearningactivitiesbuthavenottakentheexam.
Use regression model predict students at-risk
NOTE: Regression model has another function: prediction. After we establish a regression model using some data, we can use that model to predict the future outcome. For instance, after removing the quiz 2 in the regression model, we can use only quiz 1, assignment 1, and assignment 2 as the input variables and exam score as the output variable. The new regression model using these variable will be the following:
examscore=0.17*quiz1+0.26*assignment1+0.57*assignment2
Now if we have a new student coming in the class who has finished quiz 1 and assignment 1 & 2, and received scores of 90,92, and 68 for these activities. If we want to predict how well (s)he is going to do on the exam, we can plug in the three learning activities scores into the regression formula and we will get a predicted exam score. For instance, we can do the following:
Newstudent’spredictedexamscore=0.17*(90)+0.26*(92)+0.57*(68) =78
Therefore, the predicted exam score for this student will be 78. You can verify this answer with your calculator or using Excel.
Meganwantstousetheregressionmodeltopredictseveralotherstudents’examscores.
1) Click on tab6(tab6_regression_prediction). In this tab you will see 10
new students and their scores for quiz 1 and assignment 1 & 2. You will also see in the function box at the top the regression formula from the previous step has been supplied. Take a look at formula and students’ data in this tab.
2) To predict their exam scores, you can supply the three learning
activity scores into a regression formula. If you click on cell E2,
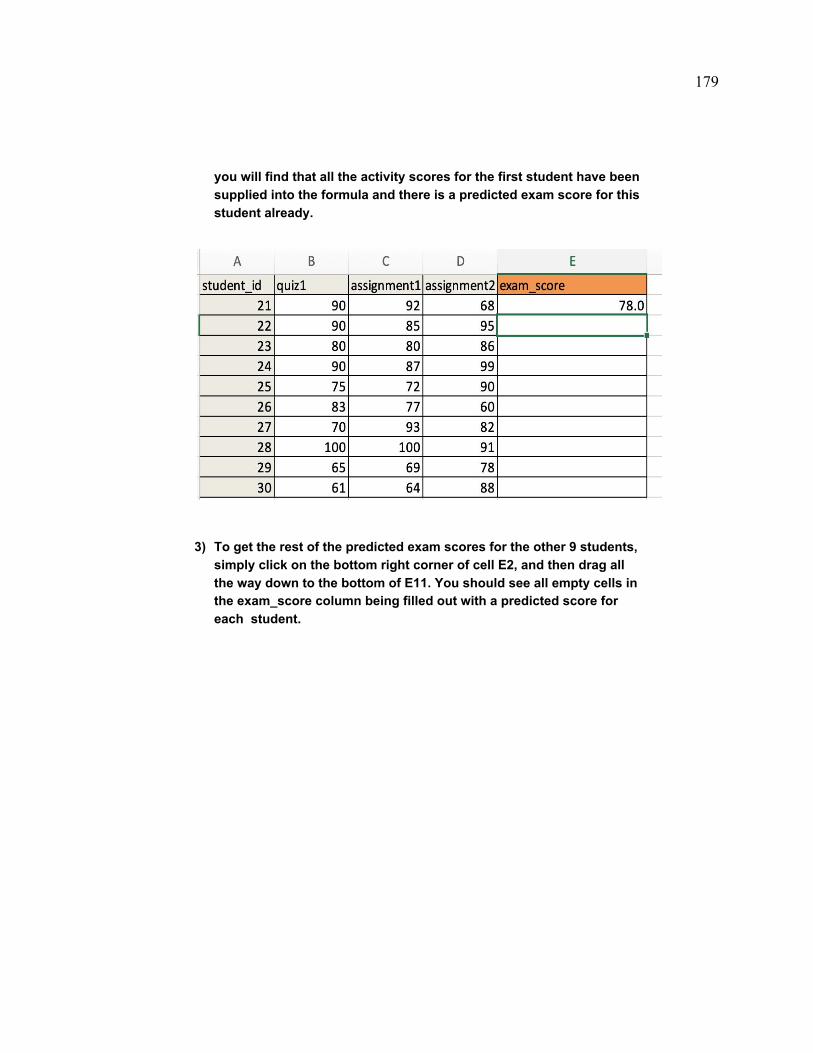
179
you will find that all the activity scores for the first student have been supplied into the formula and there is a predicted exam score for this student already.
3) To get the rest of the predicted exam scores for the other 9 students, simply click on the bottom right corner of cell E2, and then drag all the way down to the bottom of E11. You should see all empty cells in the exam_score column being filled out with a predicted score for each student.

180
4) After you are done, take a moment to observe the predicted exam scores. Megan wants to know If the passing grade is 80, which students are likely to fail the exam based on the prediction this regression model makes?
5) If you take a look at the contribution of each learning activity to the
exam score, what would you suggest Megan do?
Endofweek3 tutorial

181
Appendix J
Week 3: Posttest Survey
Your name (for data analysis purpose only):
Data Analytics Knowledge Questions
1.1 To get a sense of students' average performance, you can calculate median. Given two student groups' scores below, please write down your calculation process and the median for each group below:
Group 1 scores: (70, 50, 97, 83) Group 2 scores: (100, 40, 55, 80)
Group 1 median: Group 2 median:
1.2 To get a sense of students' average performance, you can also calculate mean. Given the same student scores as in the previous question, please write down the mean for each group below:
Group 1 scores: (70, 50, 97, 83) Group 2 scores: (100, 40, 55, 80)
Group 1 mean: Group 2 mean:
Please put your calculation process here:
Please put your calculation process here:

182
1.3 If there you remove the smallest number from each of the two group scores, what is the new
mean for each group?
Group 1 scores: (60, 77, 55, 97, 81) Group 2 scores: (88, 42, 30, 95, 100)
Group 1 mean: Group 2 mean:
1.4 If there is a new score 88 to be added into each of the two group scores, what is the new
median for each group?
Group 1 scores: (60, 77, 55, 97, 81) Group 2 scores: (88, 42, 30, 95, 100)
Group 1 median: Group 2 median:
Please put your calculation process here:
Please put your calculation process here:

183
1.5 Which of the following data graph can accurately compare 6 different students’ performance between 3 different class assignments? (select one answer but provide reasons for all the options)
Bar chart Why do you choose/not choose bar chart:
Line chart Why do you choose/not choose line chart:
1.6 Suppose you have four student scores on a math quiz as shown below, will you choose mean or median to better represent the center of these student scores? (select one answer) Students' math quiz scores: (10, 15, 20, 90)
1. Mean
2. Median
3. I am not sure
Please explain your answer:

184
2.1 Variance can be generally defined as the average distance of students' scores from their group mean. Given two groups of students' scores below, please write down your calculation process and the variance for group 1 & 2 separately:
Group 1 scores: (60, 82, 78, 70) Group 2 scores: (42, 68, 58, 82)
Group 1 variance: Group 2 variance:
2.2 For the same two sets of student scores in the previous question, if there is a new score 100 to be added into each group, which of the following is true? (select all that apply)
☐ 1. The variance will decrease in both group 1 & group 2 ☐ 2. The variance will increase in both group 1 & group 2 ☐ 3. The variance will not change in both group 1 & group 2 ☐ 4. The variance will increase more in group 2 than in group 1 ☐ 5. The variance will increase more in group 1 than in group 2
2.3 If you have two new student groups, and the variance for group 1 is 78 while the variance for group 2 is 60, how will you interpret students' performance in group 1 and 2 regarding the student performance? (select all that apply)
☐ 1. Students' performance in group 1 is more similar to each other than that in group 2 ☐ 2. Students' performance in group 1 is less similar to each other than that in group 2 ☐ 3. Students’ mean score in group 1 is higher than that in group 2 ☐ 4. Students’ mean score in group 1 is lower than that in group 2
Please put your calculation process here:

185
2.4 Which of the following data graph can accurately represent the variance for three different tests at a class level? (select one answer but provide reasons for all options)
Line chart Why do you choose/not choose line chart:
Bar chart Why do you choose/not choose bar chart:
2.5 Suppose you have the mean and variance of students’ three class quizzes below, how would you compare Class A & B’s performance in terms of their mean and variance for each quiz?
1st quiz 2nd quiz 3rd quiz
Class A mean: 85 variance: 80
mean: 60 variance: 180
mean: 90 variance: 35
Class B mean: 70 variance: 50
mean: 65 variance: 220
mean: 94 variance: 110

186
3.1 A correlation coefficient (Pearson's r) is a numerical measure of a statistical relationship between two variables ranging from −1 to +1. If you have identified that r = 0.8 between students' quiz 1 & 2 score, and r = 0.2 between quiz 1 & 3, and r= -0.3 between quiz 2 & 3, which of the following is true? (select all that apply) * assuming all correlation coefficients are statistically significant
☐ 1. There is a strong negative negative relation between quiz 2 & 3 score ☐ 2. There is a strong positive relation between quiz 1 & 2 score ☐ 3. There is a moderate positive relation between quiz 1, 2, & 3 ☐ 4. There is a weak positive relation between quiz 1 & 3 score
3.2 Please pair each of the following correlation coefficients (Pearson's r) with their
corresponding data visualization which best describes the relationship between X and Y
r = +1 : r = -1 : r = +0.7: r = - 0.7: r = 0:
A. B. C. D. E.
Please explain your answer:

187
3.3 Given correlation coefficients between scores of 5 different learning activities below, how will you interpret this result? (select all that apply)
Quiz 1 Quiz 2 Assignment 1 Assignment 2 Practice
Exam Final Exam
Quiz 1 1.0 0.1 0.7 0.2 0.3 ?
Quiz 2 0.1 1.0 0.1 0.8 0.85 ?
Assignment 1 0.7 0.1 1.0 0.01 0.04 ?
Assignment 2 0.2 0.8 0.01 1.0 0.9 ?
Practice Exam 0.3 0.85 0.4 0.9 1.0 ?
☐ 1. Students who do well on quiz 1 are likely to do well on quiz 2 ☐ 2. Student who do well on assignment 1 are likely to do well on assignment 2 ☐ 3. Students who do well on assignment 2 are likely to get high score on the exam ☐ 4. Students who do well on quiz 1 are likely to do assignment 1 well ☐ 5. None of above
3.4 Which of the following graph can inform how students' exam scores correlate with their GPA? (select one answer but provide reasons for all the options)
Parallel bar chart
Why do you choose/not choose parallel bar chart:
Please explain your answer:

188
Scatterplot Why do you choose/not choose scatterplot:
3.5 Given the same correlation table as in the previous question, what will be some appropriate pedagogical suggestion(s) to make based on the correlation coefficients ? (select all that apply)? (select all that apply)
Quiz 1 Quiz 2 Assignment 1 Assignment 2 Practice Exam
Final Exam
Quiz 1 1.0 0.1 0.7 0.2 0.3 ?
Quiz 2 0.1 1.0 0.1 0.8 0.85 ?
Assignment 1 0.7 0.1 1.0 0.01 0.04 ?
Assignment 2 0.2 0.8 0.01 1.0 0.9 ?
Practice Exam 0.3 0.85 0.4 0.9 1.0 ?
☐ 1. The practice exam involves most content knowledge from Quiz 2 and Assignment 2 ☐ 2. The practice exam involves most content knowledge from Quiz 1 and Assignment 1
☐ 3. The practice exam involves most content knowledge from Quiz 1 and Quiz 2 ☐ 4. The practice exam involves most content knowledge from Assignment 1 and Assignment 2
3.6 If the final exam is going to cover will involve 30% of the content from the two quizzes, and
70% of the content from the two assignments, which learning activities should the teacher focus on to best help the students prepare for the final exam? (circle True or False for each of the questions below)
(1) The teacher should focus on assignment 1 & quiz 1: True False (2) The teacher should focus on assignment 2 & quiz 2: True False (3) The teacher should focus on quiz 1 & quiz 2: True False (4) The teacher should focus on assignment 1 & assignment 2: True False

189
4.1 Which of the following is the purpose of using regression analysis? (select all that apply)
☐ 1. Predicting outcome of output variable based on contribution of input variable(s) ☐ 2. Understand the amount of contribution of an input variable to an output variable ☐ 3. Identify if the difference between two sets of values is statistically significant ☐ 4. Identify the change in output variable given the change in input variable
4.2 Please link each of the following questions with the type function in regression analysis in the following:
1. Does the number of class attendance affect student mid-term exam score?
2. What is the relationship between students’ quiz score and their test score?
3. Is there a significant difference of average math test score between two school classes?
4. Give a regression formula: test score = 15 + 0.85 x homework score , what is the test score that a student is likely to get if she gets 90 for her homework?
● ● Contribution of one thing to another
● ● Predicting student’s score based on an input variable
● ● Understand the correlation relation between two variables
● ● Inferential statistical t-test
4.3 If your goal is to know how each learning activity is likely to contribute to students’ final exam score, what is the correct order of steps to take? (choose the correct answers & put the step numbers next to those checked boxes)
☐ Run a regression analysis by using learning activities scores to predict the final exam scores ☐ Run a correction analysis and observe the relation between different activities scores ☐ Check statistical significance, direction, and strength of each coefficient in the regression model ☐ Check statistical significance, direction, and strength of each each correlation coefficient ☐ Summarize the results

190
4.4 Please link each of the following statistical terminologies with appropriate explanation below:
1. Variance ● ● The probability of obtaining test results at least as extreme as the results actually observed during the test, assuming that the null hypothesis is correct.
2. Mean ● ● A statistical association that refers to the degree to which a pair of variables are linearly related
3. Correlation ● ● The value separating the higher half from the lower half of a data sample. It can be considered as the middle value
4. P-value ● ● The rejection of a true null hypothesis
5. Median ● ● A measure of how far a set of numbers are spread out from their average value
6. Regression ● ● The central value of a discrete set of numbers. The sum of the values divided by the number of values
7. Type 1 error ● ● A statistical processes for estimating the relationships between a dependent variable and one or more independent variables

191
5. Please circle only one answer for each of the following questions:
(1) I can assess student performances in the classroom
Disagree 1 2 3 4 5 6 7 Agree
(2) I can adapt my teaching based upon what students currently understand or do not understand
Disagree 1 2 3 4 5 6 7 Agree
(3) I can adapt my teaching style to different learners
Disagree 1 2 3 4 5 6 7 Agree
(4) I can assess student learning in multiple ways
Disagree 1 2 3 4 5 6 7 Agree
(5) I can use a wide range of teaching approaches in a classroom setting
Disagree 1 2 3 4 5 6 7 Agree
(6) I am familiar with common student understandings and misconceptions
Disagree 1 2 3 4 5 6 7 Agree
6. Please circle only one answer for each of the following questions:
(1) Do you feel you can choose technologies that enhance your teaching approaches for a lesson?
Disagree 1 2 3 4 5 6 7 Agree
(2) Do you feel you can choose technologies to enhance students’ learning for a lesson?
Disagree 1 2 3 4 5 6 7 Agree
(3) Do you feel you can think critically about how to use technology in your future classroom?
Disagree 1 2 3 4 5 6 7 Agree
(4) Do you feel you can adapt different technologies to different teaching activities?
Disagree 1 2 3 4 5 6 7 Agree

192
7. Please circle only one answer for each of the following questions:
(1) To what extent can you use a variety of assessment strategies?
Nothing 1 2 3 4 5 6 7 8 9 A great deal
(2) To what extent can you provide an alternative explanation or example when students are confused?
Nothing 1 2 3 4 5 6 7 8 9 A great deal
(3) To what extent can you craft good questions for your students?
Nothing 1 2 3 4 5 6 7 8 9 A great deal
(4) How well can you implement alternative strategies in your classroom?
Nothing 1 2 3 4 5 6 7 8 9 A great deal
(5) How much can you do to control disruptive behavior in the classroom?
Nothing 1 2 3 4 5 6 7 8 9 A great deal
(6) How much can you do to get children to follow classroom rules?
Nothing 1 2 3 4 5 6 7 8 9 A great deal
(7) How much can you do to calm a student who is disruptive or noisy?
Nothing 1 2 3 4 5 6 7 8 9 A great deal
(8) How well can you establish a classroom management system with each group of students?
Nothing 1 2 3 4 5 6 7 8 9 A great deal
(9) How much can you do to get students to believe they can do well in school?
Nothing 1 2 3 4 5 6 7 8 9 A great deal
(10) How much can you do to help your students value learning?
Nothing 1 2 3 4 5 6 7 8 9 A great deal
(11) How much can you do to motivate students who show low interest in school?
Nothing 1 2 3 4 5 6 7 8 9 A great deal (12) How much can you assist families in helping their children do well in school?
Nothing 1 2 3 4 5 6 7 8 9 A great deal

193
8. Please circle only one answer for each of the following questions:
(1) When I make plans I follow through with them
Disagree 1 2 3 4 5 6 7 Agree
(2) I usually manage one way or another
Disagree 1 2 3 4 5 6 7 Agree
(3) I am able to depend on myself more than anyone else
Disagree 1 2 3 4 5 6 7 Agree
(4) Keeping interested in things is important to me
Disagree 1 2 3 4 5 6 7 Agree
(5) I can be on my own if I have to
Disagree 1 2 3 4 5 6 7 Agree
(6) I feel proud that I have accomplished things in my life
Disagree 1 2 3 4 5 6 7 Agree
(7) I usually take things in stride
Disagree 1 2 3 4 5 6 7 Agree
(8) I am friends with myself
Disagree 1 2 3 4 5 6 7 Agree
(9) I feel that I can handle many things at a time
Disagree 1 2 3 4 5 6 7 Agree
(10) I am determined
Disagree 1 2 3 4 5 6 7 Agree
(11) I seldom wonder what the point of it all is
Disagree 1 2 3 4 5 6 7 Agree
(12) I take things one day at a time
Disagree 1 2 3 4 5 6 7 Agree
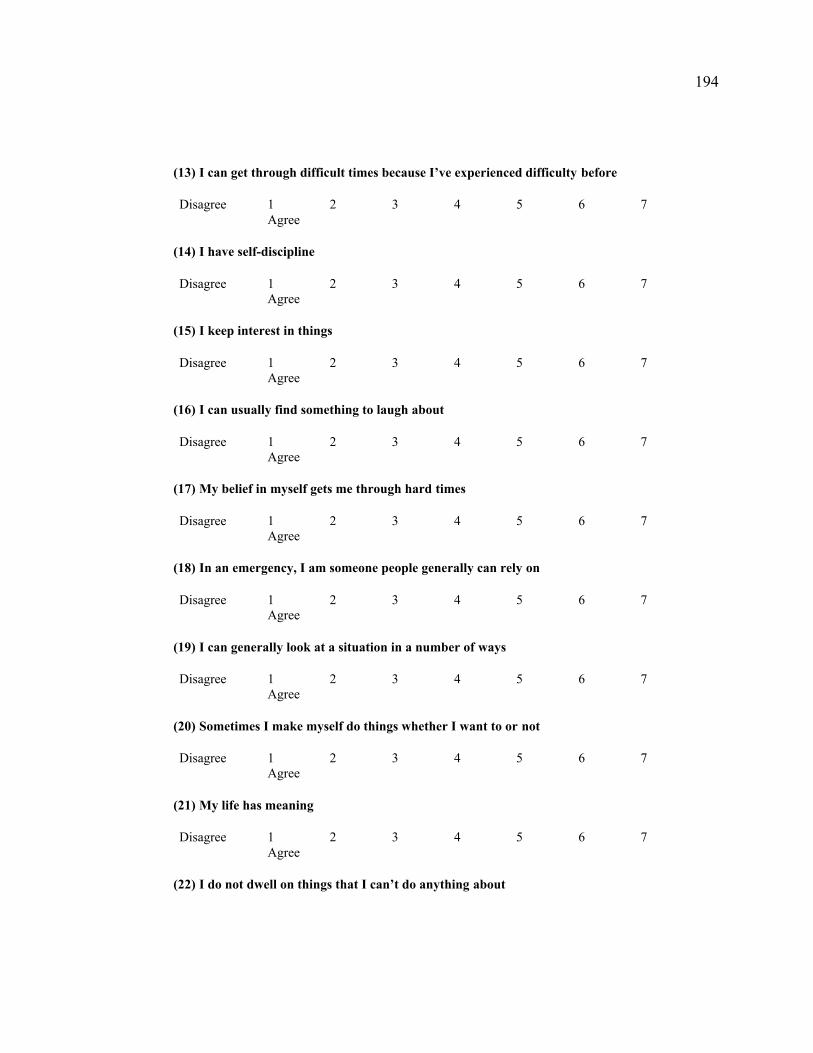
194
(13) I can get through difficult times because I’ve experienced difficulty before
Disagree 1 2 3 4 5 6 7 Agree
(14) I have self-discipline
Disagree 1 2 3 4 5 6 7 Agree
(15) I keep interest in things
Disagree 1 2 3 4 5 6 7 Agree
(16) I can usually find something to laugh about
Disagree 1 2 3 4 5 6 7 Agree
(17) My belief in myself gets me through hard times
Disagree 1 2 3 4 5 6 7 Agree
(18) In an emergency, I am someone people generally can rely on
Disagree 1 2 3 4 5 6 7 Agree
(19) I can generally look at a situation in a number of ways
Disagree 1 2 3 4 5 6 7 Agree
(20) Sometimes I make myself do things whether I want to or not
Disagree 1 2 3 4 5 6 7 Agree
(21) My life has meaning
Disagree 1 2 3 4 5 6 7 Agree
(22) I do not dwell on things that I can’t do anything about

195
Disagree 1 2 3 4 5 6 7 Agree
(23) When I am in a difficult situation, I can usually find my way out of it
Disagree 1 2 3 4 5 6 7 Agree
(24) I have enough energy to do what I have to do
Disagree 1 2 3 4 5 6 7 Agree
(25) It’s okay if there are people who don’t like me
Disagree 1 2 3 4 5 6 7 Agree
End of the Survey—Thank you!