investigation and characterisation of voltage...
TRANSCRIPT
INVESTIGATION AND CHARACTERISATION OF VOLTAGE
QUALITY ON NETWORK INTEGRATED WITH PHOTOVOLTAIC
SYSTEMS
By
TANG JUN HUAT
A dissertation submitted to the Department of Electrical and Electronic
Engineering,
Faculty of Engineering and Science,
Universiti Tunku Abdul Rahman,
in partial fulfilment of the requirements for the degree of
Master of Engineering Science
November 2013

ii
ABSTRACT
INVESTIGATION AND CHARACTERISATION OF VOLTAGE
QUALITY ON NETWORK INTEGRATED WITH
PHOTOVOLTAIC SYSTEMS
Tang Jun Huat
The Malaysian government has launched various renewable energy programs
to encourage the use of green technology such as Feed-in Tariff (FiT).
Photovoltaic (PV) is likely to become one of the most dominant type of
renewable energy source in Malaysia due to its abundant solar irradiation.
However, it is extremely rare for Malaysia to have a completely clear sky due
to the passing cloud. The incident solar irradiation is highly scattered and
fluctuating, hence making the power output of the PV systems to be very
intermittent. The intermittent power output of the PV systems causes the
voltage magnitude to be fluctuating sharply and frequently.
This dissertation proposes a direct load control (DLC) for mitigating
the voltage fluctuation and flicker caused by the PV systems. In this study, the
power system simulation tool, namely DIgSILENT POWER FACTORY, is
used to study the technical impacts of the distributed generation on low
voltage (LV) distribution networks. A load control algorithm is developed
using LABVIEWTM
as a programming platform in a computer. The proposed
DLC makes use of real power to change the network voltage, as the voltage

iii
magnitude responds predominantly to the change of real power flow in the LV
distribution networks where the resistance is higher than the reactance.
Several experiments have been carried out to test the effectiveness of
DLC in reducing voltage fluctuation and flicker caused by the PV power
output fluctuation. However, there are a few potential problems associated
with the application of DLC. One of the main problems is the social aspect of
finding sufficient number of controlled loads. To investigate whether or not
this problem could be a key barrier to the application of DLC, a site survey is
conducted among the Malaysian community to identify their acceptance level
on DLC and energy efficiency.
The experimental results show that the DLC can effectively reduce the
voltage fluctuation and flicker issues caused by the PV generation system.
This work proposed a solution to mitigate the voltage quality issues caused by
the PV systems. This work is valuable because PV generation system has the
potential to be the dominant type of RE generation in Malaysia and the
proposed DLC can solve one of the most severe power quality issues caused
by the penetration of PV systems in Malaysia. The potential beneficiary of the
presented work is power utility and RE developer in reducing the negative
impact of high penetration level of in distribution networks.
iv
ACKNOWLEDGEMENTS
In preparing this dissertation, I would like to express my foremost gratefulness
to God for His Blessing, Grace and Guidance. He gave me strength and
wisdom in my study and research work as well as lead me through every
failure, challenges and difficulties.
I would like to express my sincere thanks to my supervisor, Ir. Dr. Lim Yun
Seng, for all his excellent support, invaluable advice, guidance and
encouragement throughout the period of this project at UTAR.
I am grateful to my co-supervisor, Dr. Stella Morris for her support,
encouragement and insightful comments throughout the period of my study.
My special thanks to the Ministry of Energy, Green Technology and Water
who sponsored this research project under Akaun Amanah Industri Bekalan
Elektrik (AAIBE). I would like to express my gratitude to Ms. Wong Jianhui
and Mr. Chua Kein Huat, Dr. Ezra Morris for their assistance, discussion and
support all the time.
Last but not least, thanks to my beloved family for their understanding and
moral support, to all my friends for their support and endless encouragement.

v
FACULTY OF ENGINEERING AND SCIENCE
UNIVERSITI TUNKU ABDUL RAHMAN
Date: 22 November 2013
SUBMISSION OF DISSERTATION
It is hereby certifies that TANG JUN HUAT (ID No: 1201UEM190) has
completed this dissertation entitled “INVESTIGATION AND
CHARACTERISATION OF VOLTAGE QUALITY ON NETWORK
INTEGRATED WITH PHOTOVOLTAIC SYSTEMS” under supervision
of Ir. Dr. LIM YUN SENG (Supervisor) from the Department of Electrical
and Electronic Engineering, Faculty of Engineering and Science, and Dr.
Stella Morris (Co-Supervisor) from the Department of Electrical and
Electronic Engineering, Faculty of Engineering and Science.
I understand that the University will upload softcopy of my dissertation in pdf
format into UTAR Institutional Repository, which may be made accessible to
UTAR community and public.
Yours truly,
(TANG JUN HUAT)
vi
APPROVAL SHEET
This dissertation entitled ―INVESTIGATION AND
CHARACTERISATION OF VOLTAGE QUALITY ON NETWORK
INTEGRATED WITH PHOTOVOLTAIC SYSTEMS” was prepared by
TANG JUN HUAT and submitted as partial fulfilment of the requirements for
the degree of Master of Engineering Science at Universiti Tunku Abdul
Rahman.
Approved by:
__________________________
( Ir. Dr. LIM YUN SENG)
Date:…………………..
Supervisor
Department of Electrical and Electronic Engineering
Faculty of Engineering and Science
Universiti Tunku Abdul Rahman
__________________________
(Dr. STELLA MORRIS)
Date:…………………..
Co-supervisor
Department of Electrical and Electronic Engineering
Faculty of Engineering and Science
Universiti Tunku Abdul Rahman
vii
DECLARATION
I hereby declare that the dissertation is based on my original work except for
quotations and citations which have been duly acknowledged. I also declare
that it has not been previously or concurrently submitted for any other degree
at UTAR or other institutions.
(TANG JUN HUAT)
Date: 22 November 2013

viii
LIST OF TABLES
Table
1.1
Feed-in tariff in Malaysia
Page
2
2.1 Average amount of cloud and frequency of
complete clear sky occurrence in several regions
23
3.1 The parameters of LV equipment
41
3.2 Summary of the simulation results 60
5.1 Voltage fluctuation and flicker before and after the
use of DLC
102
5.2 Voltage fluctuation and flicker index for grid
connected PV system
109
5.3 Voltage quality in off-grid system integrated with
PV
113
6.1 Respondents detail
119
6.2 Percentage of Malaysians‘ awareness on their
monthly electricity bill
121
6.3 The environmental consciousness from the
respondents in Malaysia
122
6.4 Malaysian behavior on conservation of energy
124
6.5 Mean value of Malaysian acceptance level of DLC
126

ix
LIST OF FIGURES
Figures
2.1
Peninsular Malaysia energy mix in 2011
Page
9
2.2 T-T earthing system configuration
13
2.3 Single-phase PV system configuration
15
2.4 Block diagram of wind turbine power generation
16
2.5 Hydroelectric generation configuration
18
2.6 Malaysia map
19
2.7 World map showing the average cloud amount (%)
24
2.8 World map showing the frequency of complete
clear sky (%)
24
2.9 Flicker assessment model
25
3.1 The layout of Aman Jaya commercial LV
distribution networks
40
3.2 DIgSILENT model of Aman Jaya commercial LV
distribution network
41
3.3 The layout of Aman Jaya residential LV
distribution networks
42
3.4 DIgSILENT model of Aman Jaya residential LV
distribution networks
43
3.5 Voltage magnitude at feeder C6 with the increase
in PV capacity in the commercial networks under
non-centrally planned scenario
46
3.6 Voltage magnitude with the increase in PV
capacity in commercial networks under centrally
and non-centrally planned scenario
47
3.7 VUF at commercial networks in non-centrally
planned scenario
48
3.8 Comparison of the VUF between centrally and
non-centrally planned PV distributions in
commercial networks
49
x
3.9 Total network power losses in the commercial
networks
50
3.10 VUF with the increase in feeder cable length in the
commercial networks
51
3.11 VUF with different power factor at point of
connection in the commercial network under non-
centrally planned distribution of PV
52
3.12 Voltage magnitude at feeder C16 with the increase
in PV capacity in the residential networks under
non-centrally planned scenario
54
3.13 Voltage magnitude with the increase in PV
capacity in residential
54
3.14 VUF at residential networks under non-centrally
planned scenario
56
3.15 Comparison of the VUF for centrally and non-
centrally planned PV distribution in residential
networks
56
3.16 Total network power losses in the residential
networks
57
3.17 VUF with respect to different cable lengths in the
residential networks
58
3.18 VUF with respect to various power factors at
point of connection in the residential network
58
4.1 Network emulator
63
4.2 PV system
64
4.3 Energy storage system
65
4.4 Controllable load bank
66
4.5 NI 9403 37-pin assignments
67
4.6 Solid State Relay D2425
67
4.7 Custom made 200W power resistor at 288 Ω
68
4.8 Data acquisition system flow chart
69
xi
4.9 Flexible LV panel
70
4.10 The block diagram of the DLC controller
74
4.11 Flow chart of the control algorithm
76
4.12 LabVIEW programming coding for DLC
76
4.13 Front panel for power quality monitoring in
LabVIEW
77
4.14 LabVIEW model for Voltage measurement
77
4.15 LabVIEW model of frequency measurement
78
4.16 LabVIEW model for current measurement
78
4.17 Dead band between 238 to 245V
78
4.18 Load bank control
79
4.19 Experimental setup
80
4.20 Correlation between ΔP and ΔV
82
4.21 Unity flicker curve at PST0 = 1
85
5.1 Fluctuation in PV output and voltage magnitude
89
5.2 Variation in voltage magnitude caused by the
fluctuation in the power output of the 1.84 kW
photovoltaic system
90
5.3 A number of short-time flickers being calculated
from the collected of voltage magnitude
91
5.4 A 9 months solar density chart in Malaysia
92
5.5 Malaysia‘s Solar Density Chart under Sunny
condition
93
5.6 Solar Density Chart for cloudy day in Malaysia
94
5.7 Solar Density Chart for Rainy day in Malaysia
95
5.8 International‘s Solar Density Chart
96
5.9 Off-grid system configuration
97

xii
5.10 Network voltage magnitude due to the connection
of PV on phase A (a) before and (b) after the
implementation of the DLC
99
5.11 Frequency regulation before (a) and after (b) the
implementation of DLC in the LV network with a
PV system
100
5.12 Value of short time flickers produced by 1.84 kW
PV system on the laboratory network
101
5.13 Block diagram of grid connected PV system
103
5.14 Experimental on-grid network configuration
104
5.15 Short-time and long-time flicker indices on Phase
A with respect to various capacities of PV
106
5.16 Short-time and long-time flicker indices on Phase
B with respect to various capacities of PV
106
5.17 Short-time and long-time flicker indices on Phase
C with respect to various capacities of PV
107
5.18 Values of short-time flickers produced by the 1.84
kW PV system connected to the utility grid
108
5.19 Off-grid system integrated with battery storage
110
5.20 PV inverter tripped off after batteries are fully
charged and (without DLC)
111
5.21 PV power output and inverter‘s status with the
DLC
113
6.1 Age range of the respondents
119
6.2 Malaysian youngsters‘ intention to go for energy
efficiency
119
6.3 Malaysians‘ awareness on electricity consumption
and the amount to be paid
121
6.4 Respondents‘ willingness to purchase EE products
with respect to environment consciousness
123
6.5 Energy conservation behaviour with respect to
environmental consciousness
124
6.6 Acceptance level of DLC in Malaysia 126
xiii
6.7 Acceptance level of DLC with incentive
127
6.8 Acceptance level of DLC with and without
incentive
127
6.9 Malaysians‘ response to DLC implementation by
giving a reduced electricity tariff
128
6.10 DLC implementation with normal and reduced
electricity tariff
129

xiv
LIST OF SYMBOLS / ABBREVIATIONS
CHP Combined heat and power
CO2 Carbon dioxide
DG Distributed generation
DSM Demand side management
EE Energy efficiency
EHV Extra high voltage
EM Electromagnetic
FACTS Flexible AC transmission system
FiT Feed-in tariff
GBI Green building index
GLC Government linked company
GTFS Green technology financing scheme
GVR Global voltage regulation
HAWT Horizontal-axis wind turbine
HV High Voltage
IEC International electro-technical commission
IGBT Insulated-gate bipolar transistor
LV Low voltage
MBIPV Malaysian building integrated photovoltaic
O&M Operation and maintenance
PV Photovoltaic
RE Renewable energy
xv
RMS Root mean square
SEDA Sustainable energy development authority
SOC State of charge
SREP Small renewable energy program
SSR Solid state relay
STATCOM Static synchronous compensator
SVR Static VAr compensator
TNB Tenaga Nasional Berhad
UPS Uninterruptible power supply
VAWT Vertical axis wind turbine
VFI Voltage fluctuation index
VR Voltage regulation
VSD Variable speed drive
VUF Voltage unbalance factor

xvi
TABLE OF CONTENTS
ABSTRACT ...................................................................................................... ii
ACKNOWLEDGMENTS ............................................................................. iv
SUBMISSION OF DISSERTATION ............................................................ v
APPROVAL SHEET ...................................................................................... vi
DECLARATION............................................................................................ vii
LIST OF TABLES ....................................................................................... viii
LIST OF FIGURES ........................................................................................ ix
LIST OF SYMBOLS / ABBREVIATIONS ................................................ xiv
CHAPTERS ...................................................................................................... 1
1.0 INTRODUCTION........................................................................................
1.1 Research Background ..................................................................... 1
1.2 Research Objectives ........................................................................ 5
1.3 Research Methodology ................................................................... 5
1.4 Scope of Dissertation ...................................................................... 7
2.0 LITERATURE REVIEW
2.1 Introduction ..................................................................................... 9
2.2 Distributed Generation (DG) Technology .................................... 14
2.2.1 Photovoltaic System ...................................................................... 15
2.2.2 Wind Turbine ................................................................................ 16
2.2.3 Small Hydro .................................................................................. 17
2.2.4 Other Technologies ....................................................................... 18
2.3 Development of Photovoltaic Systems in Malaysia ..................... 19
2.4 Power Quality in Photovoltaic Systems ........................................ 22
2.4.1 Voltage fluctuation and flicker ..................................................... 23
2.4.2 Voltage Rise and Voltage Regulation ........................................... 26
2.4.3 Voltage Imbalance ........................................................................ 28
2.4.4 Reverse Power Flow ..................................................................... 29
2.5 Existing Method for Voltage Quality Improvement ..................... 29
2.5.1 Super-Capacitor ............................................................................ 30
2.5.2 STATCOM.................................................................................... 32

xvii
2.5.3 Static VAr Compensator ............................................................... 33
2.5.4 Distributed Energy Storage ........................................................... 33
2.5.5 Demand Side Management ........................................................... 34
2.6 Integration of DSM and DG in the future distribution networks .. 35
2.6.1 Benefits of DSM ........................................................................... 36
2.6.2 Challenges of DSM ....................................................................... 36
2.7 Conclusion .................................................................................... 37
3.0 SIMULATION STUDY ON LV DISTRIBUTION NETWORKS
INTEGRATED WITH PV SYSTEMS
3.1 Introduction ................................................................................... 38
3.2 Modelling of Commercial LV Distribution Networks .................. 39
3.3 Modelling of Residential LV Distribution Networks ................... 41
3.4 Description of Methodology ......................................................... 43
3.5 Simulation Results for Commercial LV Distribution Networks ... 44
3.6 Simulation Results for Residential LV Distribution Networks .... 53
3.7 Conclusion .................................................................................... 59
4.0 DESIGN AND DEVELOPMENT OF LV DISTRIBUTION
NETWORKS EMULATOR WITH DIRECT LOAD CONTROLLER
4.1 Introduction ................................................................................... 61
4.2 Design of Experimental LV Network Emulator ........................... 62
4.2.1 Network Emulator ......................................................................... 63
4.2.2 PV system ..................................................................................... 64
4.2.3 Energy Storage System ................................................................. 65
4.2.4 Load Bank ..................................................................................... 65
4.2.5 Data Acquisition System ............................................................... 68
4.3 Design of DLC Algorithm ............................................................ 70
4.4 Set up of the experimental low voltage distribution network ....... 79
4.5 Quantification of Voltage Fluctuation and Flicker ....................... 81
4.5.1 Voltage Sensitivity Gradient ......................................................... 81
4.5.2 Voltage Fluctuation Index ............................................................. 82
4.5.3 Global Voltage Regulation............................................................ 83
4.5.4 Short Time Flicker ........................................................................ 83
4.5.5 Long Time Flicker ........................................................................ 85
4.6 Conclusion .................................................................................... 86
xviii
5.0 VOLTAGE FLUCTUATION AND FLICKER IN LV
DISTRIBUTION NETWORKS WITH PV SYSTEMS AND THE
CORRECTIVE METHOD OF LOAD CONTROLLER
5.1 Introduction ................................................................................... 87
5.2 Characterization of the PV Power Output..................................... 87
5.3 Voltage Fluctuation and Flicker Caused by PV system ................ 89
5.4 Solar Density Chart ....................................................................... 91
5.4.1 Nine Month Average ..................................................................... 92
5.4.2 Sunny ............................................................................................ 93
5.4.3 Cloudy ........................................................................................... 94
5.4.4 Rainy ............................................................................................. 95
5.4.5 International .................................................................................. 95
5.5 Case Study 1: Off-grid System with a 15 kVA generator ............. 97
5.5.1 Description .................................................................................... 97
5.5.2 Experiment Results ....................................................................... 98
5.6 Case Study 2: On-grid System .................................................... 102
5.6.1 Description .................................................................................. 102
5.6.2 Experimental Results .................................................................. 104
5.7 Case Study 3: Off-grid System with Battery Storage ................. 109
5.7.1 Description .................................................................................. 109
5.7.2 Experimental Results .................................................................. 111
5.8 Conclusion .................................................................................. 113
6.0 EVALUATION OF THE SURVEY RESULT: MALAYSIAN
ENERGY EFFICIENCY INITIATIVE AND VIABILITY OF DLC
IMPLEMENTATION
6.1 Introduction ................................................................................. 116
6.2 Survey Design ............................................................................. 117
6.3 Malaysian Energy Efficiency Initiative ...................................... 120
6.3.1 Awareness on Monthly Energy Bill ............................................ 120
6.3.2 Environmental Consciousness .................................................... 121
6.3.3 Energy Conservation Behavior ................................................... 123
6.4 DLC Acceptance Level ............................................................... 124
6.4.1 DLC without Incentive................................................................ 125
6.4.2 DLC with Incentive ..................................................................... 126
6.4.3 DLC with lower electricity tariff ................................................ 128

xix
6.5 Conclusion .................................................................................. 129
7.0 DISCUSSION AND CONCLUSIONS
7.1 Discussion ................................................................................... 131
7.2 Key findings ................................................................................ 134
7.3 Publication .................................................................................. 136
7.4 Future work ................................................................................. 137
REFERENCES 135
APPENDICES 149
CHAPTER 1
INTRODUCTION
1.1 Research Background
The consumption of fossil fuels like coal and natural gas for power
generation causes adverse environmental effects. In addition, the recent trends
of declining fossil fuel resources combined with the reluctance to go nuclear,
forces Malaysia to actively conduct research into solar photovoltaic (PV),
biomass, biogas and hydro-generation.
The Malaysian government has launched various renewable energy
programs to encourage the use of green technology. The Renewable Energy
Act 2011 is an Act to provide the establishment and implementation of Feed-
in Tariff (FiT) to catalyse the generation of renewable energy (RE) in
Malaysia under the FiT program. The utility company purchases the power
generated by domestic and commercial users at competitive rates, encouraging
investment in the renewable energy sector as shown in Table 1.1.
The PV systems are the most promising RE sources in the tropical
countries due to the large amount of sunlight available in the regions
throughout the year. As a result, the amount of PV system is expected to grow
very rapidly over the next few decades. However, with a large amount of

2
passing clouds over Malaysia, the incident solar irradiance is highly scattered
and fluctuating, which makes the power output of the PV systems to be very
intermittent. The highly intermittent power output of the PV systems causes
the voltage at the point of connection to change frequently throughout the day.
The voltage fluctuation generates a large amount of flickers onto the low
voltage (LV) distribution networks.
Table 1.1: Feed-in tariff in Malaysia
Renewable Energy Generation FiT Rates ( RM per kWh) at 2013
Biogas1
0.3184
Biomass2
0.3085
Small Hydro2
0.2400
Solar PV1
1.1316
1. Up to and including 4.0 kW.
2. Up to and including 10.0 MW.
The impacts of voltage fluctuation and flicker include the nuisance due
to the variation of light flux. A person who is affected by light flickering can
suffer from headache, migraine, and eye discomfort. Inconsistent voltage
supply can cause the motors to change their starting toque, run at varying
speeds with vibration and hence reduce the operational efficiency. In addition,
unstable voltage supply can cause electronic equipment to malfunction,
unwanted triggering of uninterruptible power supplies (UPS) and reduction in
operational efficiency. Besides, the design of the existing distribution
networks does not take into account of the anticipated distributed generation
(DG). Several research papers have discussed the technical issues caused by
DG, including voltage imbalance, voltage rise, reverse power losses as well as
3
cable and transformer thermal limits (Loo, 2005; Pádraig, 2009; Wong et al.,
2011). However, there are limited studies on the flicker emissions and the
research is not common. The flicker emissions caused by the PV power output
may be unacceptable from the standpoint of power quality. Most of the
previous studies are based on simulation. Additional experimental research
work is required.
There are several approaches to reduce the technical impacts caused by
the PV systems such as energy storage, demand side management (DSM),
super-capacitor, STATCOM and Static VAr Compensator. The simulation and
experimental results of the reported energy storage system have proven that it
is effective to mitigate the voltage unbalance factor and power losses in LV
distribution networks integrated with a large amount of PV systems (Wong,
2011). DSM is also reported to be one of the solutions to solve voltage rise
issues caused by the integration of large amount of DG (Lim & Philip, 2007).
The major blackout in India in July 2012, which affected more than half of
India‘s population, is believed to be the biggest ever power failure in the world
(Wikipedia, n.d.). Even before the blackout incident, DSM had been suggested
as a viable approach for the power shortage issues in India (Sinha et al., 2011).
In addition, Wei et al., (2007) discussed the use of super-capacitors to buffer
the fluctuations caused by the PV systems due to a large amount of moving
clouds. The simulation results in this paper show that a super-capacitor is
capable to buffer the voltage fluctuations due to the scattered clouds and high
number of irradiance fluctuations. Furthermore, STATCOM is also reported to
control the injection of reactive power that is required to stabilize the voltage

4
level (Elnady & Salama, 2007). However, STATCOM is commonly used on
the transmission networks instead of LV distribution networks. Meanwhile, D-
STATCOM is a fast compensating reactive power system to reduce flicker on
distribution system. However, it is a very expensive device.
In this work, the impact of PV systems connected onto the existing LV
distribution networks is investigated through simulation and experiments. A
novel direct load control (DLC) algorithm is proposed in this work to mitigate
the voltage fluctuation and flicker caused by the PV power fluctuation. The
DLC makes use of real power flow to change the network voltage because the
voltage magnitude responds predominantly to the change of real power in the
LV distribution networks, where the resistance is much higher than reactance.
The DLC is proposed because of low initial cost compared to that of
STATCOM or super-capacitor. In addition, the super-capacitor has a low cell
voltage. To achieve a higher voltage level, the capacitor is connected in series;
which causes an internal leakage current and a higher risk of overvoltage (Wei
et al., 2007). Experimental results are presented to identify the effectiveness of
the proposed DLC. Finally, this dissertation reports a survey result of 990
Malaysians on energy efficiency (EE) and DLC implementation in Malaysia.
It contributes to the literature by providing a better understanding of the
perceptions and behaviors of Malaysians about the possible deployment of
DLC. This study, to our knowledge, is the first public survey carried out in
Malaysia which focuses on the DLC.

5
1.2 Research Objectives
The main objectives of this research are:-
i To use DIgSILENT PowerFactory to model commercial and
residential LV distribution networks.
ii To investigate the technical impacts of PV systems connected onto the
LV distribution networks.
iii To design and develop an experimental LV network emulator
integrated with renewable sources in order to study the intermittent PV
power output.
iv To mitigate the voltage fluctuation and flicker caused by PV systems.
v To conduct surveys in order to study the public acceptance level of
direct load control.
1.3 Research Methodology
The research objectives are achieved using three approaches.
Approach I (Simulation): At the initial stage, a simulation model is developed
to study the technical impacts of connecting PV systems onto the existing LV
distribution networks.
STEP 1: A literature review is carried out to study the design and
characterization of the LV distribution network emulator, the technical

6
impacts of connecting PV systems onto existing LV distribution
networks, and existing methods to mitigate the voltage quality issues.
STEP 2: DIgSILENTPowerFactory is used to model the commercial
and residential LV networks from Aman Jaya, Selangor, Malaysia.
STEP 3: These models are used to investigate the impacts of high
penetration of PV power injected into the LV distribution networks.
Approach II (Experiment): The second stage of the research uses an
experimental approach to investigate the effectiveness of the proposed
solution to mitigate the voltage fluctuation and flicker emission caused by PV
systems.
STEP 1: An experimental LV network emulator is setup to investigate
the power quality issues caused by PV systems.
STEP 2: To develop the direct load control (DLC) algorithm in
LabVIEW to mitigate the voltage fluctuation and flicker caused by PV
power fluctuation.
STEP 3: To setup the experiments to identify the effectiveness of using
DLC in mitigating the voltage fluctuation and flickers caused by the
variable power output from PV systems. The DLC is tested in the off-
7
grid systems with and without the battery storage and also on-grid
systems.
Approach III (Survey): In order to identify the social and psychological
aspects of controlling customer‘s appliances such as water heaters, site
surveys are conducted to investigate the public acceptance level of DLC. A
survey is conducted with the Malaysian electricity users in the final stage of
the work. This is to investigate the acceptance level of the proposed solution to
be integrated to the existing network.
1.4 Scope of Dissertation
The structure of this dissertation is outlined in the following manner:-
The second chapter summarizes the findings from the literature review on the
characteristics and design model of the Malaysian LV distribution networks,
the possible technical impacts caused by PV systems, the existing methods
used to mitigate power quality issues and demand side management.
Chapter Three presents the details of the modelling approach for commercial
and residential LV distribution networks in DIgSILENT PowerFactory. This
chapter also discusses the technical impacts of an anticipated amount of
centrally planned and non-centrally planned PV systems connected onto the
LV distribution network.

8
Chapter Four describes the design and experimental setup of the UTAR LV
distribution network emulator integrated with renewable energy. This chapter
also includes the details of the proposed DLC to mitigate the voltage
fluctuation and flicker caused by the PV systems. The voltage supply quality
is accessible through the voltage fluctuation index, the global voltage
regulation, short-term flicker and long-term flicker.
Chapter Five presents the severity of the PV power output fluctuation in
Malaysia. In addition, the effectiveness of DLC in reducing the voltage
fluctuation and flicker caused by the intermittent power output of the PV
systems is evaluated. The test results of the proposed DLC in the off-grid
system with and without the battery storage and on-grid system are also
presented in this chapter.
Chapter Six presents the survey questionnaire and the results from 990
respondents. The survey has accessed the behavioral aspects of Malaysians on
energy efficiency (EE) initiative and DLC acceptance level.
Finally, the key findings of the research are presented in Chapter Seven. In
this chapter, the research conclusion, publications and future works are also
presented.

9
CHAPTER 2
LITERATURE REVIEW
2.1 Introduction
Malaysia is well endowed with primary energy resources such as oil
and gas as well as RE sources like solar energy, biomass from oil palm, biogas,
and hydroelectric. However, coal is one of the major fuels for power
generation in Malaysia next to natural gas. In Peninsular Malaysia, fossil fuel
dominates (94%) the total energy mix in 2011 (Koh et al., 2011; Che Khalib,
2012). Figure 2.1 shows the electric generation mix in year 2011. Malaysia
imports coal from Indonesia, Australia and South Africa. Reliance on fuel that
must be imported for power generation makes Malaysia exposed to potential
energy security issues.
Figure 2.1: Peninsular Malaysia energy mix in 2011

10
Recently, the Malaysian Government has launched various renewable
energy programs to encourage the use of green technology in order to
minimize the dependence on fossil fuels (Wong, 2011). In addition, the
government has committed to the reduction of the greenhouse gas (GHG)
emissions by 40% in 2020 at the Copenhagen meeting on climate change in
2009. This has led to a high investment in the RE by the government,
government linked companies (GLC) and private sectors. To promote the
growth of green technology activities, the Malaysian Government has
allocated more than RM1.5 billion as a soft loan to consumers and
manufacturers, through the Green Technology Financing Scheme (GTFS) in
the announcement of Budget 2010 (Nazariah, 2011). In addition, building
owners who get the Green Building Index (GBI) certification during the
period between 24th
October 2009 and 2014 will be granted the income tax
exemption, which is equalled to the additional capital expenditure incurred to
obtain the certificate.
PV systems are the most promising renewable energy sources in
tropical countries due to the large amount of solar irradiation availability
throughout the year. Hence, PV power generation will be the major RE
generation on the LV distribution networks in the near future. As mentioned
earlier, PV systems when connected to the existing LV distribution networks
will impose several technical issues such as voltage fluctuation and flicker,
because of the high frequency of passing clouds. Besides, the high penetration
of PV output power on the LV distribution network also causes voltage rise,
voltage imbalance and power losses because the existing LV network is

11
designed for uni-directional power flow and does not cater to the anticipated
amount of the PV systems.
This chapter presents the literature reviews of some related research
works done by other researchers. Initially, the design of the conventional LV
distribution networks and existing distributed generation (DG) technology are
studied. This is followed by an investigation of the existing PV development
in Malaysia, together with the pros and cons of the connecting PV systems on
an existing LV network. The power quality issues arise because of the DG
penetrations which are briefly reviewed. The existing methods to mitigate
voltage quality issues are also described in this chapter. This includes the
implementation of super-capacitors, injection or absorption of reactive power
STATOM and DSM. Furthermore, the benefits and challenges of integrating
DSM and DG in the future LV distribution networks are studied.
2.1.1 Conventional Power System in Malaysia
The Malaysian electricity utility company namely Tenaga Nasional
Berhad (TNB), supplies electricity to the Peninsular Malaysia, while the
Sarawak Electricity Supply Corporation (SESCO) and Sabah Electricity Sdn.
Bhd. (SESB) take care of the electric supplies for Sarawak and Sabah.
The voltage levels of Malaysia‘s main transmission networks are
500kV, 275kV, and 132kV whilst that of the distribution networks with
voltage rating of 33kV, 11kV and 415/240 volts. In certain parts of Johor and

12
Perak, the distribution voltage levels are 22kV and 6.6KV. The supply
frequency is 50Hz ± 1%. The high voltage (HV) and extra high voltage (EHV)
systems use the 3 phase configuration where the system is solidly grounded or
grounded through an impedance. The EHV and HV systems use underground
and overhead lines for electricity transmission. The LV systems are of 3-phase
4-wire configurations. The neutral point is solidly earthed at the secondary
side of transformers.
At present, there are 46 major power stations distributed nationwide,
mostly sized between 100MW to 2 GW; feed three-phase AC power into the
national grid of HV transmission lines which interconnect generators to
distribution lines, substations and customers. The national grid is designed in
such a way that it provides reliability and redundancy of service, so that if any
of the overhead lines, underground cables, transformer or generators fails,
power can be delivered from other sources via a different route through the
electrical grid. This has resulted in a huge vertically integrated power system.
For example, Malaysia‘s national transmission grid handles approximately
104 TWh of energy per year, through more than 11,000 km of transmission
infrastructure (Energy Commission, 2010).
Electricity on the transmission networks is then transmitted to the
distribution networks through step down transformers in the substations. The
distribution networks in Malaysia are typically interconnected or spot network.
The interconnected networks allow the licensee to operate flexible
configurations. When a fault occurs, a small area of the networks can be

13
isolated while the healthy part of the network operates to minimize the power
outage.
In the distribution substation, voltages are stepped down to 415/240
volts via Delta-Wye transformers. This configuration enables the T-T earthing
system on LV side, where both transformer neutral and the frame are earthed
(Tenaga Nasional Berhad, 2011). The system configuration is shown in Figure
2.2. Distribution feeder delivers the electricity from distribution substations to
consumers through overhead line, underground cables or aerial cable.
Normally, substations are located nearby the load centre to minimize the
development cost and power losses. These LV networks have a radial
topology and low X/R ratio, where its impedances are primarily resistive
(Wong et al., 2011).
Figure 2.2: T-T earthing system configuration (Sallam & Malik, 2011)
In a nutshell, the conventional power system in Malaysia is designed in
such a way that it allows electricity to be transmitted from generators through
transmission and distribution systems to the load centre. To cope with an
increase in maximum demand, a drop of reserve margin, the generation
14
capacity has to be increased (Energy Commission, 2010). Increasing the
generation capacity while minimizing environmental pollution, renewable
energy base power generation will be a viable option (Koh & Lim, 2010).
2.2 Distributed Generation (DG) Technology
Generally, DG refers to any electric power generation technology that
is integrated within the distribution systems which are close to the points of
load demand. DG is normally connected to the medium voltage or LV
networks. Normally, they are not centrally planned and have a smaller
capacity, less than 30MW (Arthur, 1999). The concept of DG is different from
the conventional centralized power generation, where small or micro
generators are connected near to the load centre along the distribution
networks. The DG systems have drawn a strong interest because of its
potential to offer environmental friendly, efficient, flexible and reliable on-site
power generation alternative. DG systems complement central power
generation by providing a relatively low capital cost response to increasing
power demand, strengthening energy security and avoiding transmission and
distribution congestion (Konstantinos, 2004).
The DG systems encompass a wide range of technologies including
solar power, wind turbine, fuel cell, combined heat and power (CHP), micro
turbine, battery storage system, and reciprocating engine (Ipinnimo et al.,
2012). Diesel and gasoline fuelled reciprocating engines are the most common

15
DG technologies in use today in Malaysia, especially for standby power and
rural area applications (Abdul Muhaimin, 2010). However, as these
technologies are non-renewable, they create pollutants. Solar energy, wind
turbine, fuel cell and CHP are the common renewable DG systems installed
around the world (Pádraig, 2009).
2.2.1 Photovoltaic System
PV systems use solar modules to convert Sun‘s light energy into
electricity. Power electronic based inverters is required to convert the direct
current (DC) generated from the solar modules to alternating current (AC)
before exporting the power to the national grid. Figure 2.3 shows the single
phase PV configuration. PV systems are expensive options, at present, about
RM10.00 per watt (Choong, 2012). However, PV systems have the advantages
of zero fuel cost and minimum operating and maintenance (O&M) costs. In
addition, PV systems have a service life of 20 years and do not produce any
GHG. Nevertheless, the PV power generation relies upon the variable and
unpredictable solar irradiation. Currently, PV systems are the most promising
renewable energy sources in Malaysia due to the large amount of solar
irradiation availability throughout the year.
Figure 2.3: Single-phase PV system configuration
16
Most of the solar module technologies are currently using silicon PV
cells. There are typically two categories of PV cells, mono-crystalline and
poly-crystalline. The third generation solar cells are thin film cells. Mono-
crystalline silicon PV cells are made from silicon wafers that are cut from
cylindrical single crystal silicon ingots. These solar cells show predictable and
uniform behavior, but it is expensive. Poly- crystalline cells are made from
cast square ingots and are less expensive and less efficient. Thin film PV cells
are constructed by depositing a thin layer of photovoltaic semiconductor
material onto a backing material such as glass. The thin film material that is
commercially used is amorphous silicon (Energypedia, 2012).
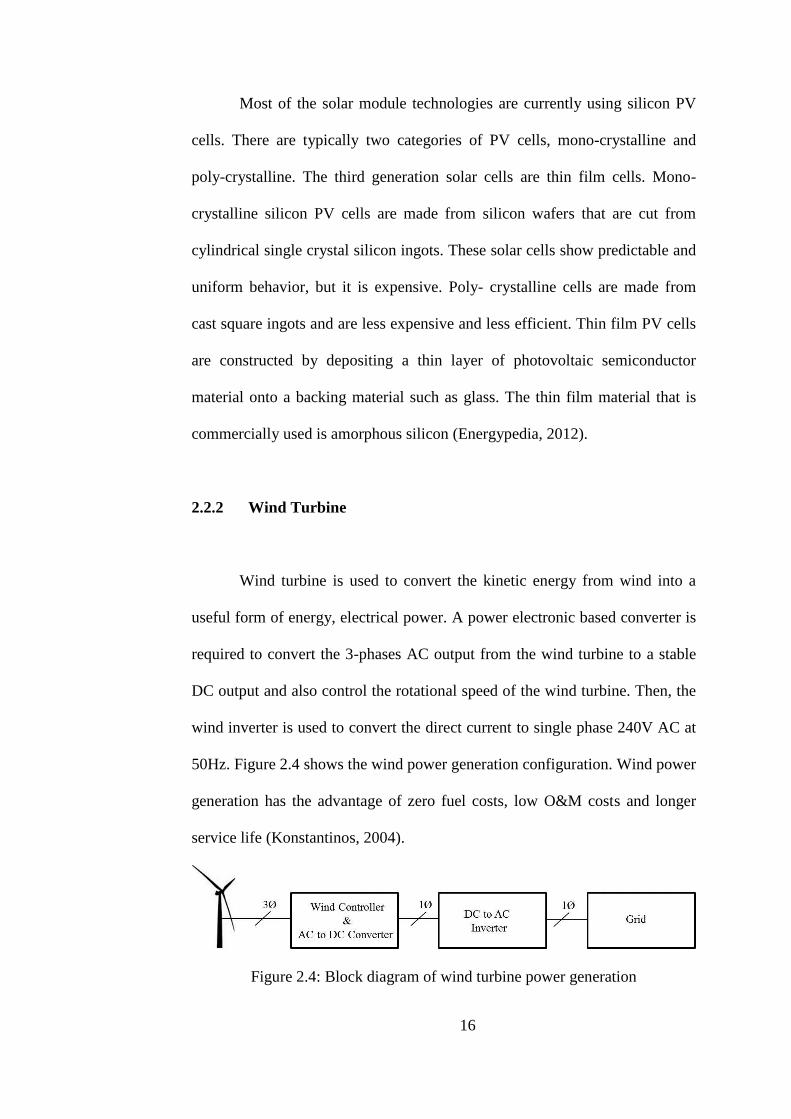
2.2.2 Wind Turbine
Wind turbine is used to convert the kinetic energy from wind into a
useful form of energy, electrical power. A power electronic based converter is
required to convert the 3-phases AC output from the wind turbine to a stable
DC output and also control the rotational speed of the wind turbine. Then, the
wind inverter is used to convert the direct current to single phase 240V AC at
50Hz. Figure 2.4 shows the wind power generation configuration. Wind power
generation has the advantage of zero fuel costs, low O&M costs and longer
service life (Konstantinos, 2004).
Figure 2.4: Block diagram of wind turbine power generation

17
There are different types of wind turbines and they can be divided into
two major technologies, the horizontal and vertical axis wind turbines (Sandra
et al., 2008). The rotational axis of horizontal axis wind turbines (HAWT)
must be oriented parallel to the wind direction in order to produce power.
Whilst, the rotational axis of vertical axis wind turbine (VAWT) is
perpendicular to the wind direction (Castillo, 2011). Although HAWT are
considered more efficient in operation than VAWT and are commonly used in
large wind farms, the VAWT has the advantages of better safety and minimum
wind speed requirement from any direction, and being noiseless (Hannes,
2003). Furthermore, the wind turbine generation relies on the wind speed, and
wind volume that are variable and unpredictable. Availability of wind energy
in Malaysia is still under study due to the low wind speed throughout the year,
which is less than 3 m/s. The highest mean daily wind speed recorded at
Mersing, Johor is 3.8 m/s (Malaysia Meteorological Department, 2010).
2.2.3 Small Hydro
Hydroelectric generation is the generation of electric power from the
flow of water. Normally, a small hydro project is defined as hydro projects
with a generation capacity of up to 10MW. Typically, the stored river water is
fed from a reservoir through a channel into the turbine. The flow of water on
the turbine blades causes the shaft to rotate. The rotating shaft is connected to
an electric generator which converts the mechanical energy into electrical
energy. Figure 2.5 shows the hydroelectric power generation configuration.
Hydroelectric can provide continuous power through the day with zero

18
emission and low operation cost. However, the argument against hydroelectric
arises because of the environmental degradation caused by the reservoir dam.
Malaysia has a large number of rivers that are suitable for building large or
small hydro dams for electricity generation, especially in the state of Sarawak
and Sabah. Total hydropower generation capacity in Malaysia is about 29 GW
with 70% in Sarawak. Small hydro power generation is one of the most
feasible rural electrification methods in Malaysia (Benjamin & Scott, 2011)
because Malaysia is the tenth highest rainfall receiving country in the world,
with a volume of about 289 cubic centimetre of water per square centimetre of
land area (Sasi Group, 2006).
Figure 2.5: Hydroelectric generation configuration
2.2.4 Other Technologies
Combined Heat and Power (CHP) also called Cogeneration is the use
of the small heat engine which provides the power for building, heating, and
ventilation. CHP utilizes the waste heat produced as a by-product and hence
increase the energy efficiency. However, the CHP implementation in Malaysia
is not common, because Malaysia is a warm country and cooling is preferred
than heating. Fuel cells generate electricity by combining hydrogen and

19
oxygen electrochemically like a battery. The basic fuel cells have two
electrodes, cathode and anode, separated by an electrolyte. The by-product of
the electrochemical reaction is water and heat with low emission level (Fuel
Cells 2000's, 2013). The advantages of fuel cells are low to zero emissions,
high efficiency, and are noiseless. Currently, fuel cells are still a new
technology for Malaysia, therefore it is not a popular DG options at this
moment.
2.3 Development of Photovoltaic Systems in Malaysia
Malaysia is one of the tropical countries in Southeast Asia that receives
abundant sunshine and thus solar radiation. Malaysia is a maritime country
near equator, surrounded by the South China Sea and Malacca Straits as
shown in Figure 2.6 (Koh & Lim, 2010). The constant evaporation of the sea
water results in an enormous amount of clouds passing through the country.
Figure 2.6: Malaysia map

20
As mentioned in the previous section, solar PV will be the major RE
source on the distribution networks in the near future. Hence, this research is
focused only on PV systems as the main distributed generators connected to
the LV distribution networks. Therefore, a brief introduction of the
development of solar PV in Malaysia, and the power quality issues that arise
in PV systems will be discussed in this section.
The Malaysian government announced the Five Fuel Diversification
Policy in the year 2000 making renewable energies such as solar PV, biomass,
and mini hydro, as the fifth source of energy (Lim et al., 2008). This policy is
introduced to replace the Four Fuel Diversification Policy of 1981 that is
dependent on conventional sources of energy such as oil, natural gas,
hydroelectric, and coal. This new policy induces a wide range of the
installation of renewable power generators, especially solar PVs.
Another RE initiative program was launched in 2001, namely Small
Renewable Energy Power Program (SREP). The launch of this program is one
of the steps being taken by the Malaysian Government to encourage the use of
RE power generation. Under this SREP program, the owners of renewable
power plants can apply for a license to sell their electricity to the utility
company for a period of 21 years, which will be effective from the date of
commissioning of the plant (Ministry of Energy, Green Technology and Water,
2009).

21
The Malaysia Building Integrated Photovoltaic (MBIPV) program is
introduced in the year 2005 under the 9th Malaysia plan (Hussin et al., 2011).
The objective of this program is to reduce the GHG emission by introducing
grid connected PV systems and to enhance the development of the PV industry
in the country. This project is administered by the Ministry of Energy, Green
Technology and Water Malaysia and is partially funded by the United Nations
Development Program and Global Environment Facility. The total capacity of
the grid tied PV systems installed and commissioned under MBIPV project is
approximately 1.5 MWp by the end of 2010.
Another project introduced by the Malaysian Government, namely
‗SURIA 1000‘ was officially launched on June 2007. This program provides
direct opportunities for residential and commercial customers to be involved in
renewable energy initiatives and greener environment. SURIA 1000 targets to
install a total of 1000 roof top and grid connected PV systems with a capacity
of 790 KWp (Wong, 2011).
The Malaysia Feed in Tariff (FiT) system launched in December 2011
results in a new era in Malaysia moving towards to achieve green environment
and pollution free power generation. The FiT system obliges the utility
company such as TNB and SESC to buy from Feed-in Approval Holders the
electricity produced by RE and sets the FiT rate shown in Table 1.1. By
guaranteeing access to the grid and setting a favorable price per unit of RE
electricity, the FiT mechanism would ensure that RE becomes a viable and
long term investment for individuals and the industrial sector. The RE sources

22
included in the program is solar PV, small hydro, biomass, and biogas. The
solar PV and small hydro renewable electricity generated could be sold to the
utility company and paid with the FiT rate for 21 years, whilst it is 16 years
for biomass and biogas resources (SEDA Malaysia, 2013).
2.4 Power Quality in with Photovoltaic Systems
With all the fiscal incentives and programs introduced by the
Malaysian Government and other parties to promote renewable energy,
especially PV, it is projected that the amount of PVs connected to the existing
LV networks will be increased. Hence, it is important to mitigate the technical
issues caused by the PV systems in order to maintain the stability, reliability
and security of future LV networks.
The general technical issues caused by the distributed generation have
been studied (Farid et al., 2006; Basso, 2008; M.J. Ortega, 2013). Technical
issues that might arise by the high penetration of PV systems are voltage
fluctuation, flicker, voltage rise and regulation, and voltage imbalance. The
major issues caused by the PV systems are the voltage quality and current
harmonic. Guidelines and recommendations for connecting various DGs in the
Malaysian distribution networks are discussed (Loo & Abdul Aziz, 2007). In
addition, technical issues such as capacity adequacy, network losses, voltage
regulation and control, fault level and protection are also discussed.

23
2.4.1 Voltage fluctuation and flicker
Table 2.1 shows the average amount of cloud and frequency of
completely clear sky occurrence in several regions. As tabulated in Table 2.1,
the average amount of clouds in Malaysia is about 77% which is one of the
highest in the world. Figure 2.7 and Figure 2.8 show the total cloud cover and
frequency of completely clear sky occurrences at various regions around the
world, respectively (Stephen & Carole, 2010).
Table 2.1: Average amount of cloud and frequency of completely clear sky
occurrence in several regions
Regions Europe US South
Africa
near
equator
South
America
near
equator
Malaysia
Average Amount
of Cloud (%)
53.29 56.44 60.44 62.81 76.86
Frequency of
Clear Sky
Occurrence (%)
22.95 16.87 11.37 13.10 0.71

24
Figure 2.7: World map showing the average cloud amount (%)
Figure 2.8: World map showing the frequency of complete clear sky
occurrence (%)
With a large amount of clouds passing over Malaysia, the incident
solar irradiance is highly scattered and fluctuating, hence making the power
output of the PV systems to be very intermittent. The highly intermittent
power output of PV systems causes the voltage at the point of connection to be
25
fluctuating sharply and frequently; hence generating a large amount of voltage
fluctuation and flickers to the low voltage distribution networks (Albarracín &
Hortensia, n.d.; McDermott, 2010; Guinane et al., 2012; Ammar, 2012). These
papers have presented that the flicker caused by the wind and solar can result
in the capacitor and tap changer switches continually hunting as they attempt
to improve the power quality, which increase the number of switching surges.
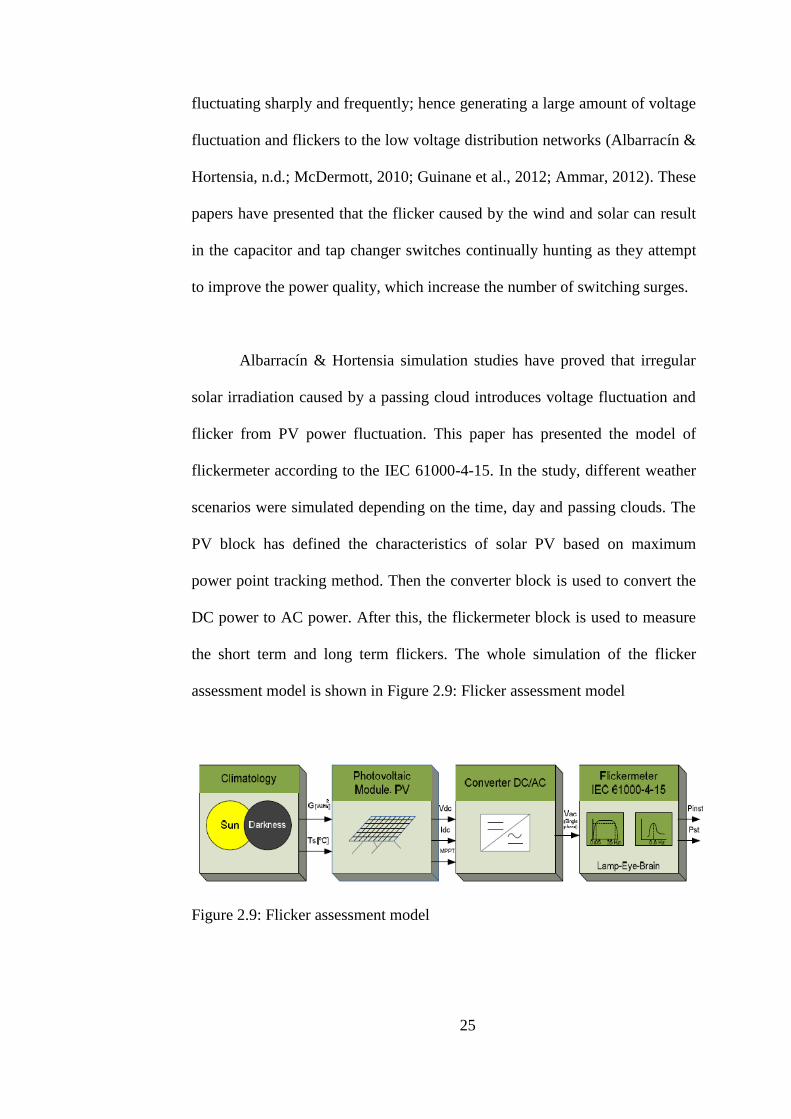
Albarracín & Hortensia simulation studies have proved that irregular
solar irradiation caused by a passing cloud introduces voltage fluctuation and
flicker from PV power fluctuation. This paper has presented the model of
flickermeter according to the IEC 61000-4-15. In the study, different weather
scenarios were simulated depending on the time, day and passing clouds. The
PV block has defined the characteristics of solar PV based on maximum
power point tracking method. Then the converter block is used to convert the
DC power to AC power. After this, the flickermeter block is used to measure
the short term and long term flickers. The whole simulation of the flicker
assessment model is shown in Figure 2.9: Flicker assessment model
Figure 2.9: Flicker assessment model
26
McDermott (2010) has identified the voltage control and voltage
fluctuations in distributed resource interconnection. This paper has revealed
that a large penetration level of wind and solar could lead to light flicker,
temporary over-voltages and other power quality impacts. Both wind and PV
energy sources produce variable power output, and hence complicate the
voltage control on the distribution feeder. Mitigation methods such as
changing the regulator setting and dispatching the reactive power are proposed
in this paper. However, these mitigation options may be expensive. The
conventional tap changer is not suitable to control the voltage fluctuation and
flicker caused by the intermittent PV power. This is because changing the tap
position too frequently is unacceptable and may also degrade the power
quality due to the switching voltage transients.
At present, little attention is placed on the flicker emissions by the PV
systems because the majority of the countries have clear sky most of the time.
Flickers introduced by wind turbine have been studied (Hu et al., 2009;
Nambiar et al., 2010; Ammar, 2012). These papers provide a review of the
technical issues related to voltage flickers introduced by the continuous
operation of distributed wind generators.
2.4.2 Voltage Rise and Voltage Regulation
In the past research, substantial studies have been carried out to
investigate the impact of integrating PV systems on the distribution network
voltage. The problem of voltage rise in the grid is caused by the high

27
penetration of grid-connected PV systems are discussed (Masters, 2002; Singh
& Goswami, 2010; Wong et al., 2011; Chidi et al., 2012). These papers have
concluded that the voltage rise caused by the DG is because of the active
power injection. Singh & Goswami (2010) also described the suitable location
for DG to minimize the power losses. The paper also stated that the traditional
passive networks distributed the power from higher voltage down to lower
voltage level and generally not designed for the connection of DG. Therefore,
there are many technical issues that must be considered when connecting a DG
to the distribution network so that the power quality, network reliability and
safety can be maintained.
Pádraig (2009) and Wong (2011) have identified voltage rise to be one
of the issues when there is an anticipated amount of DGs connected to the
existing LV distribution networks. They have presented an implementation of
distributed energy storage control to mitigate the voltage rise and improve
voltage regulation. The load controls and demand side management are also
effective means for reducing the voltage rise problem caused by the DGs (Lim
& Philip, 2007). A technique based on STATCOM or reactive power control
of the DG to investigate the voltage rise issues is discussed (Carvalho et al.,
2008; Sulligoi & Chiandone, 2012). This technique is capable of controlling
the flow of reactive power at the point of connection and reducing the voltage
rise. According to (Loo, 2005), there is only 645.8MW of on-grid DG systems
in Malaysia, which contributes to less than 6% of the total maximum demand.

28
2.4.3 Voltage Imbalance
Theoretically, a three phase power system is designed to operate in a
balanced condition. However, the LV distribution networks normally operate
in an unbalance condition due to the inconsistent loading and single phase
DGs connected to the LV distribution networks. Voltage imbalance is defined
as the ratio of the negative sequence voltage component to the positive
sequence voltage component based on the IEC standard (Von Jouanne &
Banerjee, 2001).
Wong et al. (2011) and Chua et al. (2011) have investigated the voltage
unbalance in Malaysian LV networks with a high penetration of small scale
embedded generations. Wong et al. (2011) have discussed the allowable PV
volume on the existing LV distribution networks without violating the voltage
unbalance factor of 1%. The majority of the PV systems are single phase;
therefore the voltage imbalance on the distribution networks is likely to
happen in the future. The simulation results using PSCAD have proven the
effectiveness of energy storage systems in reducing the voltage imbalance
caused by the DGs. Experimental studies on the voltage imbalance cause by
the DGs in UK LV networks had been carried out (Pádraig, 2009). The author
believes that the voltage imbalance would be a serious problem when
anticipated amount of small scale distributed generators are connected to the
LV distribution networks.

29
2.4.4 Reverse Power Flow
The existing LV distribution networks are designed in such a way to
allow unidirectional power flow. With the anticipated amount of DGs
integrated into the LV distribution networks, power tends to flow reversely
whenever the generation exceeds the demand. (Cipcigan & Taylor, 2007; Qian
et al., 2011; Maurizio et al., 2013). These papers investigate the ability of the
existing power transformers, cable and protection equipments to cater to the
reverse power flow, resulting from the DGs. The active load controller
operating within the energy zone is proposed to control the DG power output,
and also balance out the generation and consumption in order to minimize the
reverse power flow.
2.5 Existing Methods for Voltage Quality Improvement
The power generation from RE sources is proven to be financially
attractive ensuring better fuel security with minimum GHG emission in
Malaysia (Koh & Lim, 2010). However, conventional radial LV distribution
networks operate with single sources feeding the downstream load without any
other DG. Consequently, the LV distribution networks with a high penetration
of DG may cause numerous technical issues affecting the stability of the
power system. Currently, there are a few methods to improve the power
quality in the distribution networks integrated with DGs. It can be categorized
as follows:-
30
- Super-capacitor
o Buffers the voltage fluctuation with very high cycle
frequency.
- STATCOM
o Voltage source converter used of shunt capacitor to change
the reactive power capacity to compensate the voltage drop
and flickers.
- Static VAr Compensators
o Generate a constant reactive power to regulate the voltage
fluctuation and flickers and establishing the system.
- Distributed Energy Storage
o Charges or discharges the stored power to the distribution
networks based on the network condition.
- Demand side management
o Load management on the customer side to maintain the
demand and supply balanced.
2.5.1 Super-Capacitor
Super - capacitors can be used for power quality improvement in
electrical distribution networks (Degobert et al., 2006; Palizban et al., 2011).
These papers have proposed the use of capacitor banks in parallel with DG
sources in order to reduce the bus voltage variation. During normal operations,
the capacitor bank is used to improve the networks and power factor by
supplying reactive power to the inductive load. On the occurrence of voltage

31
drop, the capacitor discharges to support the network voltage. A novel control
scheme is proposed with a series connected super-capacitor in the PV
generation systems (Li et al., 2008). The proposed charging controls the duty
cycle of the IGBT in the Boost-Buck converter to shorten the charging time
and improve the usage of the intermittent power output from the PV systems.
The power output fluctuations introduced by the PV systems are
undesirable. The voltage controllers are needed to react to these fluctuations
and buffer the voltage ripple. A double layer capacitor or so-called super-
capacitor is proposed (Woyte et al., 2003). The authors have described that the
super-capacitor is a complement to the batteries and fuel cells because of its
rapid response or high cycle frequency. In addition, the voltage quality
improvement could contribute to the increase in the lifetime of battery storage
systems. This paper also determines the size of the applied super-capacitor by
means of localized spectral analysis in order to mitigate the power fluctuations
from PV systems.
A control algorithm based on super-capacitor for a hybrid energy
system with PV systems and fuel cell is introduced. (Payman et al., 2008;
Thounthong et al., 2011). The super-capacitor can respond faster to
compensate the PV power output fluctuation. The super-capacitor functions by
supplying energy to regulate the voltage. In the proposed hybrid systems, fuel
cells are used to supply energy to the super - capacitor in order to keep it
charged. The simulation and experimental verification results prove that

32
adding a super-capacitor to the distributed power system improves power
quality such as voltage rise and efficiency.
The main drawback of using super-capacitor is that the capacitor has
low cell voltage. Multiple capacitors are required to achieve a higher voltage
level. Due to the capacitance difference, there will be a leakage current
between different capacitors and may have the risk of overvoltage (Wei et al.,
2007).
2.5.2 STATCOM
The Static Synchronous Compensator (STATCOM) is a shunt device
which control the real and reactive power flows by injecting the current with a
controllable angle (Wong, 2011). The use of STATCOM technology based on
voltage source converters to reduce the voltage flicker is discussed in
Joorabian et al., (2009). It is proved that 12-pulse STATCOM together with an
RLC filter can be used to mitigate the voltage flickers. The STATCOM is a
power electronic based voltage source inverter with variable voltage amplitude.
In an over-excited mode, the voltage amplitude is higher than the grid voltage;
reactive power will be injected to the grid. During an under-excited mode, it
absorbs reactive power from the grid. Even though, STATCOM can
effectively reduce voltage flicker and fluctuation, it is normally used in the
transmission systems rather than LV networks. In addition, using STATCOM
is always an expensive option for reactive power control (Aziz et al., 2013).

33
2.5.3 Static VAr Compensator
Static VAr Compensator (SVC) is typically used to supply the reactive
power to compensate the voltage deviations. In addition, SVC can control the
supply of unbalanced reactive power to reduce the voltage fluctuation and
flickers to keep the voltage within the permissible limits (Prinz et al., 2005).
SVC used the capacitor bank to inject or absorb reactive power to stabilize the
network voltage. SVC has economical solutions, higher capacity and is faster
compared to STATCOM (Padiyar, 1999). However, SVC is applied to the
transmission system only.
2.5.4 Distributed Energy Storage
There are numerous types of storage technologies such as Lead-acid/
Nickel-cadmium/Lithium-ion batteries, flywheel, Hydrogen fuel cell and
Superconducting Magnetic Energy. However, a Lead-Acid battery is the most
appropriate storage option because of its low cost and efficiency (Baxter, 2005;
Pádraig, 2009). The distributed energy storage systems are proven to be one of
the solutions to mitigate power quality issues on LV networks with PV
systems (Chua et al., 2012). This paper proposes to use energy storage in an
intelligent active management system for mitigating voltage unbalance and
improving the efficiency. The PSCAD simulation results show that the voltage
unbalance and network losses on LV networks integrated with PV systems
could be effectively reduced.
34
Mohod et al. (2011) has proposed to use energy storage to control the
flow of real and reactive power in the grid and to maintain the power quality.
This paper has also presented the MATLAB simulation results. The inverters
control the injection or the absorption of reactive power and hence enable the
real power to flow to the load. Wang et al. (2012) has presented the simulation
and laboratory results to demonstrate that energy storage can be used to
mitigate voltage rise problems. These two papers have revealed that the
inverter integrated with energy storage system is capable of providing rapid
response to support the grid power quality.
2.5.5 Demand Side Management
The demand side management (DSM) or demand response refers to
changing the electricity consumption patterns of the end user to improve
energy efficiency and power quality (Han & Piette, 2008; Strbac, 2008; Sinha
et al., 2011). The voltage rise issues in the distribution networks integrated
with a large amount of DGs are discussed (Lim & Philip, 2007). This paper
has proposed a load control method to mitigate the voltage rise issue. The
results show that the proposed method can reduce the voltage rise effectively.
Tande (2000) showed that the load management is an effective method to
balance the supply from wind power generation and demand.

35
2.6 Integration of DSM and DG in the future distribution networks
The trend in the electrical sector is transforming from passive to active
networks. In the future, both renewable and non-renewable DGs at the LV
networks would enable consumers to contribute electricity to the system. The
electrical sector would no longer be centralized but distributed. DSM will play
a major role in the future smart grid to ensure the security, reliability and
efficiency of the power systems (Javed et al., 2012). Currently, major DSM
techniques that have been put into practice (W.Gellings, 2009; Zhong et al.,
2010; Sinha et al., 2011) are briefly reviewed as follows:-
- Direct load control
o Apply to the appliances that can be turned off or switch on
such as water heater, thermal storage, water pumps and so
on.
- Time of use pricing
o Electricity tariff is higher during peak periods and lower
during off peak periods.
- Night time cooling/ heating with load switching
o Reduce the operation of peak load power plant during
daytime. More balanced use of electricity generated from
base load power plants throughout the day.
- Load limiters
o Limit the power that can be taken by individual consumers.
36
2.6.1 Benefits of DSM
DSM is an effective way to improve the power quality issues caused
by the DG. In addition, DSM helps to reduce the generation margin and
reduce the reserve margin (Hamidi, 2007; Nair et al., 2008). Currently,
without DSM, the total installed generation capacity is much larger than the
maximum demand to ensure the security of supply. DSM is able to improve
the transmission and distribution networks operation efficiency (Strbac, 2008).
This approach could be used for deferring the new network investment,
relieving congestion in a power substation, increasing the amount of DG and
achieving carbon reduction.
2.6.2 Challenges of DSM
Lack of understanding of the benefits of DSM will be the major
challenge of DSM implementation. One of the main problems associated with
the DSM is the difficulty of finding sufficient load to control. This involves
the cooperation between the licensee and consumer (Lim & Philip, 2007). The
author has recommended a site survey needed to be carried out in order to
identify the social and psychological aspects of the implementation of DSM.
The lack of incentives to encourage and promote DSM technology is also a
key barrier for integrating DSM in the future LV distribution networks.
Gajjar& Tajularas (1998) have studied the feasibility of residential level DSM
in Malaysia. This paper indicates the need for customer education and
incentives for the acceptance of DSM.

37
2.7 Conclusion
The PV systems will be the major RE sources on the LV distribution
networks in the near future resulting from the various renewable energy
programs and fiscal incentives. However, technical issues caused by the PV
systems need to ensure the security of the power system. Most of the existing
methods to mitigate the voltage quality issues are provided by the simulation
studies. Simulations are run under ideal conditions. However, the real world is
not perfect and ideal. Experimental results from the actual system are more
accurate and practical. The existing method on mitigating voltage fluctuation
and flicker might not be economically attractive for the RE developer as the
super-capacitor, STATCOM and SVC are too expensive. STATCOM and
SVC are commonly used in transmission system rather than LV distribution
networks. DLC is economically viable and suitable for LV distribution
network application. Nevertheless, DSM and DLC seem to give a positive
result for the mitigation of power quality issues in LV distribution networks,
including voltage fluctuation and flicker, voltage rise, reduced peak demand
and reduction in power losses. Besides that, DLC would be one of the
important functions in the future smart grids, which is more active rather than
a passive operation.

38
CHAPTER 3
SIMULATION STUDY ON LV DISTRIBUTION NETWORKS
INTEGRATED WITH PV SYSTEMS
3.1 Introduction
This chapter presents the simulation study results on the impact of DG
on the existing LV distribution networks.
The growth of the PV systems connected to the existing LV
distribution networks has the potential to cause several technical issues that
will reduce the power quality and operational efficiency. Simulations are
required to investigate the potential technical issues that may arise when a
large number of PV systems is connected to the LV distribution networks. The
assessment is based on the commercial and residential LV distribution
network in Aman Jaya, an urban area of Selangor, Malaysia. The network
configurations, system design and parameter data are obtained from the local
utility company, Tenaga Nasional Berhad.
DIgSILENTPowerFactory, a power system analysis tool is used to
model commercial and residential LV distribution networks. This tool is used
because it can analyse the unbalanced condition of the 3-phase networks.
PSCAD can only model small networks due to the limited capacity of the

39
subscription. Besides, DIgSILENT can model big network and run 3-phase
load flow. This simulation tool caters for all standard power system analysis
including distributed generation. The modelling of LV networks, methodology
and simulation results are discussed in this chapter.
3.2 Modelling of Commercial LV Distribution Networks
The network is integrated with a PV system connected to the grid, with
an increment of 1.0 kW/step up to 10.0 kW. The commercial network is radial
in nature, and connected to a 1 MVA, 11/0.415 kW 3-phase transformer
equipped with off load tap changer on the high voltage side. With Delta-
Grounded Wye connection, the transformer adeptly handles single-phase loads
in any of the three phases. TT type earthing arrangement is used where the
potential earth (PE) of the customer is separated from the electricity supplier at
the transformer side. The length of LV feeder that connects the substation to
the customer varies from 35m to 80m. All the customers are connected at the
remote end of the LV feeder. Figure 3.1 and Figure 3.2 show the single line
diagram and DIgSILENT model of the commercial network respectively.
The commercial LV networks consist of 3 double circuit feeders using
300sqmm 4C XLPE AL cables laid from the local substation transformer to
the distribution feeder pillar. The commercial customer‘s service entrances are
connected to the distribution feeder pillar using 70sqmm 4C XLPE AL
underground cable. The parameters of underground cable and transformer are
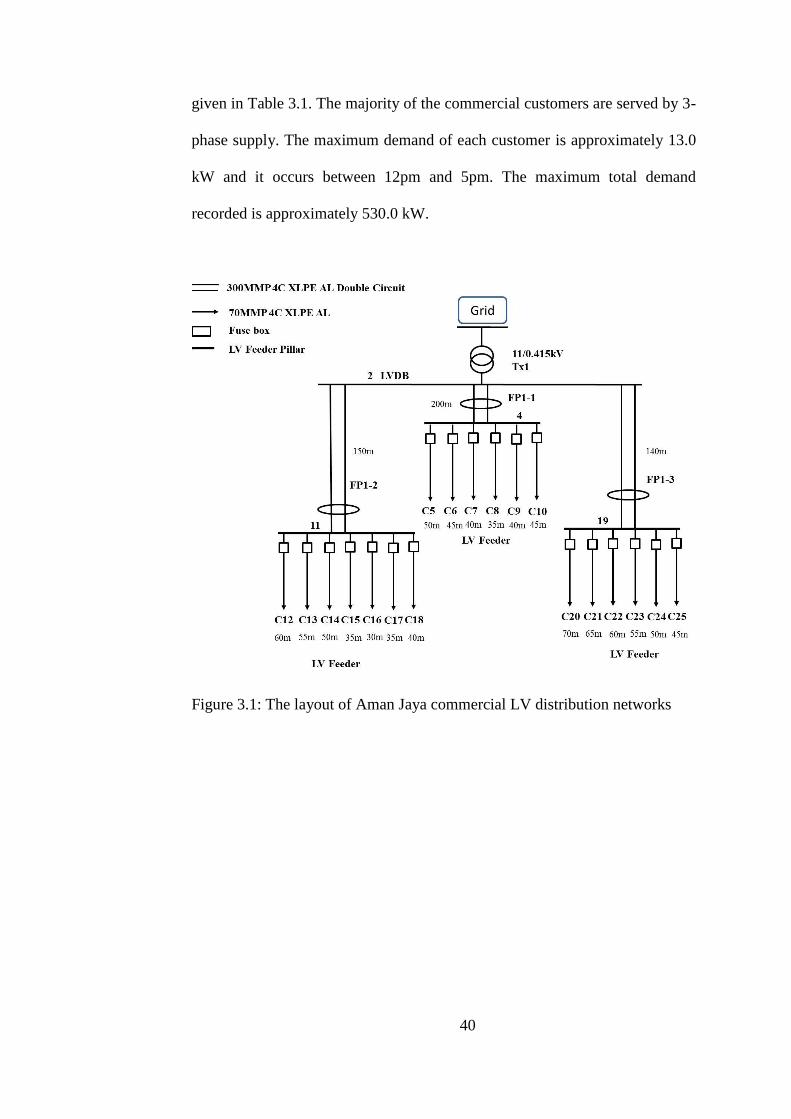
40
given in Table 3.1. The majority of the commercial customers are served by 3-
phase supply. The maximum demand of each customer is approximately 13.0
kW and it occurs between 12pm and 5pm. The maximum total demand
recorded is approximately 530.0 kW.
Figure 3.1: The layout of Aman Jaya commercial LV distribution networks

41
Figure 3.2: DIgSILENT model of Aman Jaya commercial LV distribution
network
Table 3.1: The parameters of LV equipment
Equipment Resistance (at 50Hz at 20 º C ) Reactance
300 sqmm 4C XLPE AL 0.13 ohms/km 0.072 ohms/km
70 sqmm 4C XLPE AL 0.568 ohms/km 0.075 ohms/km
1MVA Transformer 0.00385 ohms 0.00807 ohms
3.3 Modelling of Residential LV Distribution Networks
The residential network is integrated with a PV system connected to
the grid with an increment of 1.0 kW per step up to 10.0 kW. The residential
network is radial where a single source feeds the downstream loads that are
connected to the remote end of each feeder. The length of LV feeders that
connect the substation to the customer varies from 40m to 110m. Figure 3.3
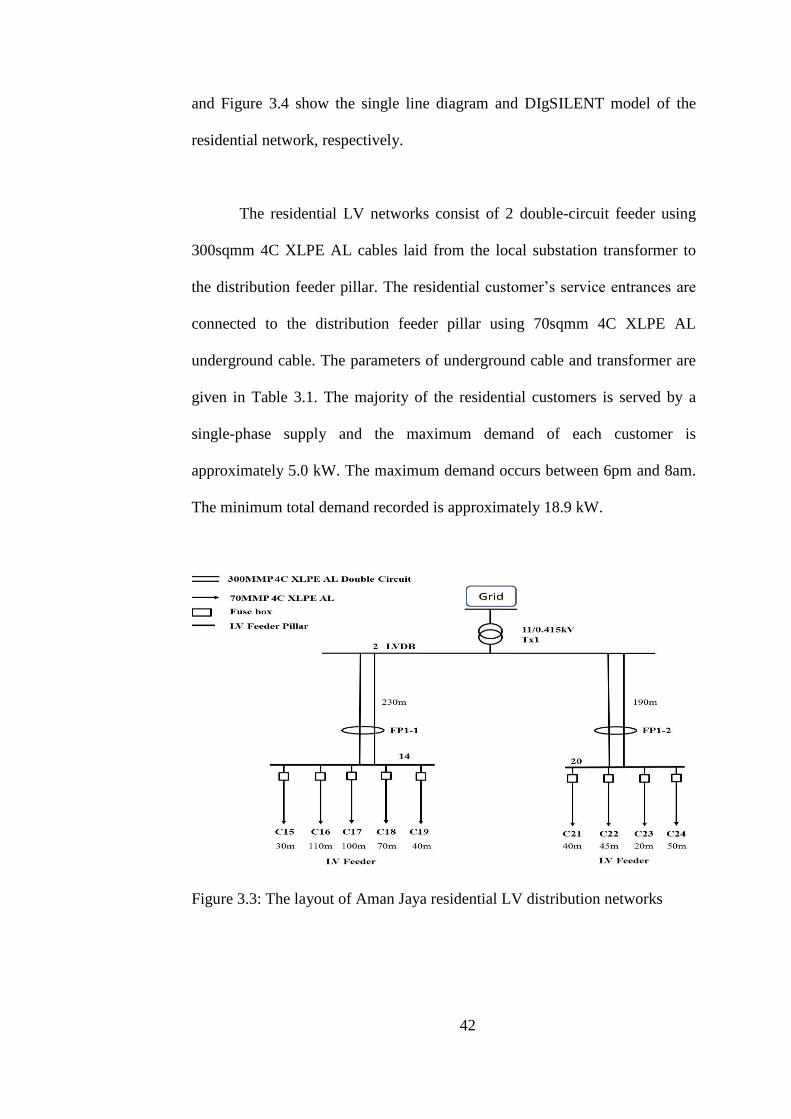
42
and Figure 3.4 show the single line diagram and DIgSILENT model of the
residential network, respectively.
The residential LV networks consist of 2 double-circuit feeder using
300sqmm 4C XLPE AL cables laid from the local substation transformer to
the distribution feeder pillar. The residential customer‘s service entrances are
connected to the distribution feeder pillar using 70sqmm 4C XLPE AL
underground cable. The parameters of underground cable and transformer are
given in Table 3.1. The majority of the residential customers is served by a
single-phase supply and the maximum demand of each customer is
approximately 5.0 kW. The maximum demand occurs between 6pm and 8am.
The minimum total demand recorded is approximately 18.9 kW.
Figure 3.3: The layout of Aman Jaya residential LV distribution networks
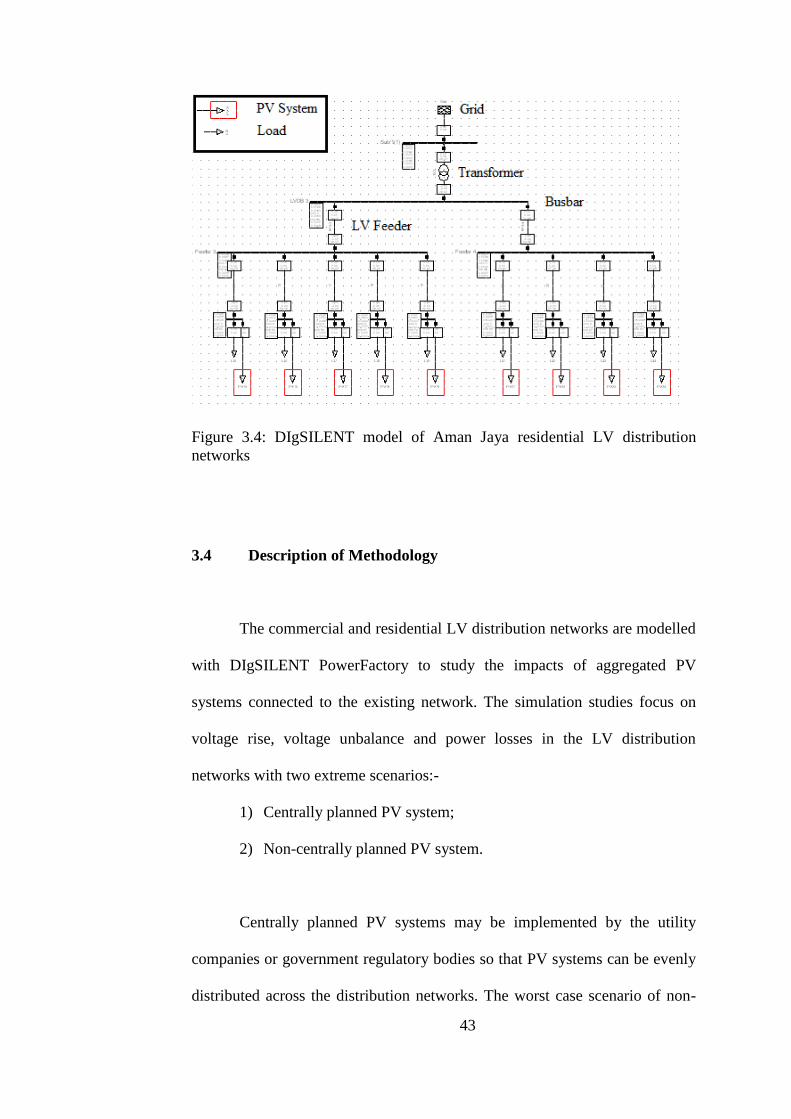
43
Figure 3.4: DIgSILENT model of Aman Jaya residential LV distribution
networks
3.4 Description of Methodology
The commercial and residential LV distribution networks are modelled
with DIgSILENT PowerFactory to study the impacts of aggregated PV
systems connected to the existing network. The simulation studies focus on
voltage rise, voltage unbalance and power losses in the LV distribution
networks with two extreme scenarios:-
1) Centrally planned PV system;
2) Non-centrally planned PV system.
Centrally planned PV systems may be implemented by the utility
companies or government regulatory bodies so that PV systems can be evenly
distributed across the distribution networks. The worst case scenario of non-

44
centrally planned PV systems is used in this simulation where all the PV
systems are connected at the same phase, which is phase B. Besides that, the
simulation work is extended to investigate the impacts of different feeder
cable lengths and power factor at the point of connection where PV systems
are connected. Negative loads are used to represent the PV power generation
that injects power into the LV distribution network.
At present, most customers have installed single phase PV systems.
The two extreme scenarios i) centrally planned PV systems and ii) non-
centrally planned PV system of PV distribution may not happen in the real
world situation. However, it is necessary to study these two scenarios in order
to foresee the possible problems caused by the PV systems. This simulation
study simulates the operation of the LV networks during peak power output of
the PV systems, from 12pm to 2pm. During this period, commercial networks
consume the highest power whilst residential customers consume the lowest
power. Therefore, a maximum demand is used in the simulation of
commercial networks and a minimum demand for the residential networks.
3.5 Simulation Results for Commercial LV Distribution Networks
For each network, the simulation study is based on two scenarios of
PV distribution; i) centrally planned where PV systems are evenly distributed
across the three phase networks and ii) Non centrally planned where PV
systems are installed only on Phase B of the networks. The voltage rise,

45
voltage unbalance factor (VUF) and network power losses are studied. The
power factor (PF) and cable length which affect the VUF and losses are also
considered.
According to the Malaysian standards of LV distribution networks, the
allowable voltage tolerance is +10% and -6% of the rated nominal voltage of
230V (Tenaga Nasional Berhad, 2011). Figure 3.5 illustrates the inconsistent
voltage variations observed across the three phases. It can be seen from the
figure that the large quantity of PV generation on Phase B of the LV network
results in violations of the voltage statutory limits. The voltage magnitude at
Phase A slightly increases while the voltage drops at Phase C. This is because
of the neutral voltage displacement and the changes in the voltages at the
terminals of the secondary distribution transformer during unbalanced
conditions (Pádraig, 2009). Additionally, the behavior of the generator is
complicated by mutual impedances between the windings (Jones, 1967).
Voltages are induced in the Phase A and Phase C windings of the synchronous
machine due to the current flow in Phase B. At the PV capacity of 3.0 kW, the
voltage magnitude at Phase B rises up to 252V which is the upper voltage
limits of the tolerance. As a result, the PV developer is not recommended to
install PV systems more than 3.0 kW per customer under non-centrally
planned PV distribution. However, the Malaysian standard has implied that the
maximum allowable DG injected onto the LV distribution networks is 10.0
kW. Therefore, the simulation of the PV capacity is increased up to 10.0 kW
(SEDA, 2011).
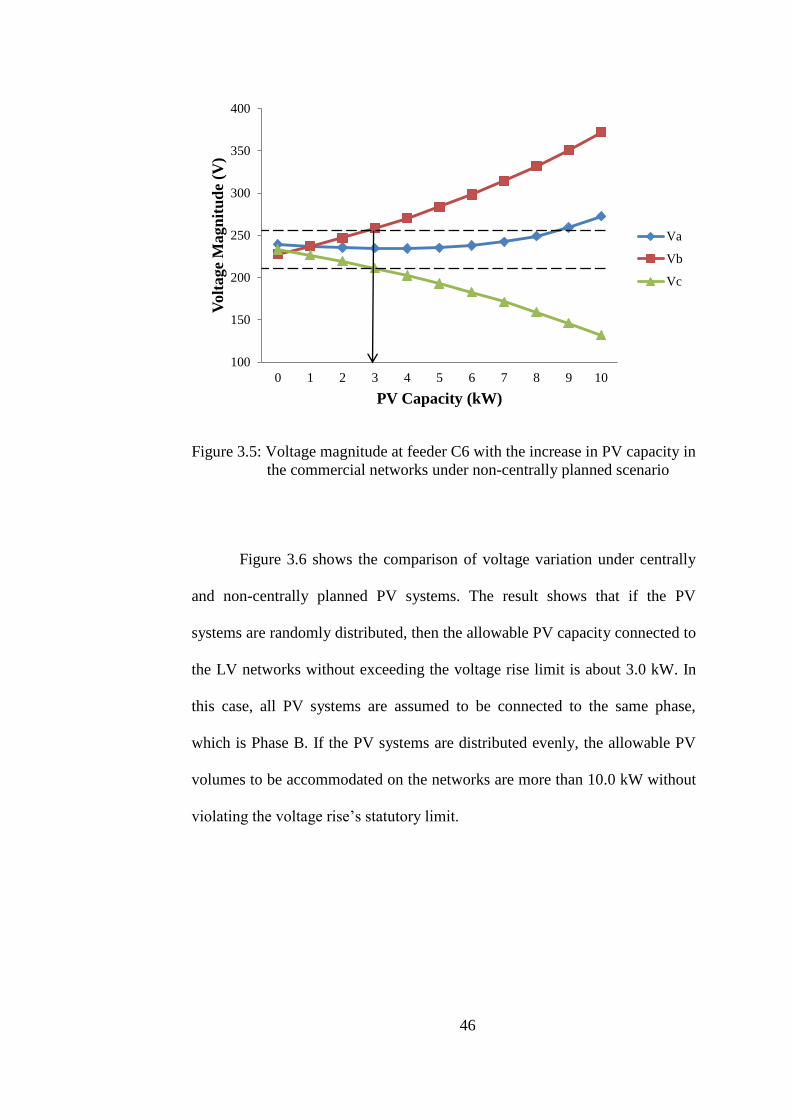
46
Figure 3.5: Voltage magnitude at feeder C6 with the increase in PV capacity in
the commercial networks under non-centrally planned scenario
Figure 3.6 shows the comparison of voltage variation under centrally
and non-centrally planned PV systems. The result shows that if the PV
systems are randomly distributed, then the allowable PV capacity connected to
the LV networks without exceeding the voltage rise limit is about 3.0 kW. In
this case, all PV systems are assumed to be connected to the same phase,
which is Phase B. If the PV systems are distributed evenly, the allowable PV
volumes to be accommodated on the networks are more than 10.0 kW without
violating the voltage rise‘s statutory limit.
100
150
200
250
300
350
400
0 1 2 3 4 5 6 7 8 9 10
Volt
age
Magn
itu
de
(V)
PV Capacity (kW)
Va
Vb
Vc
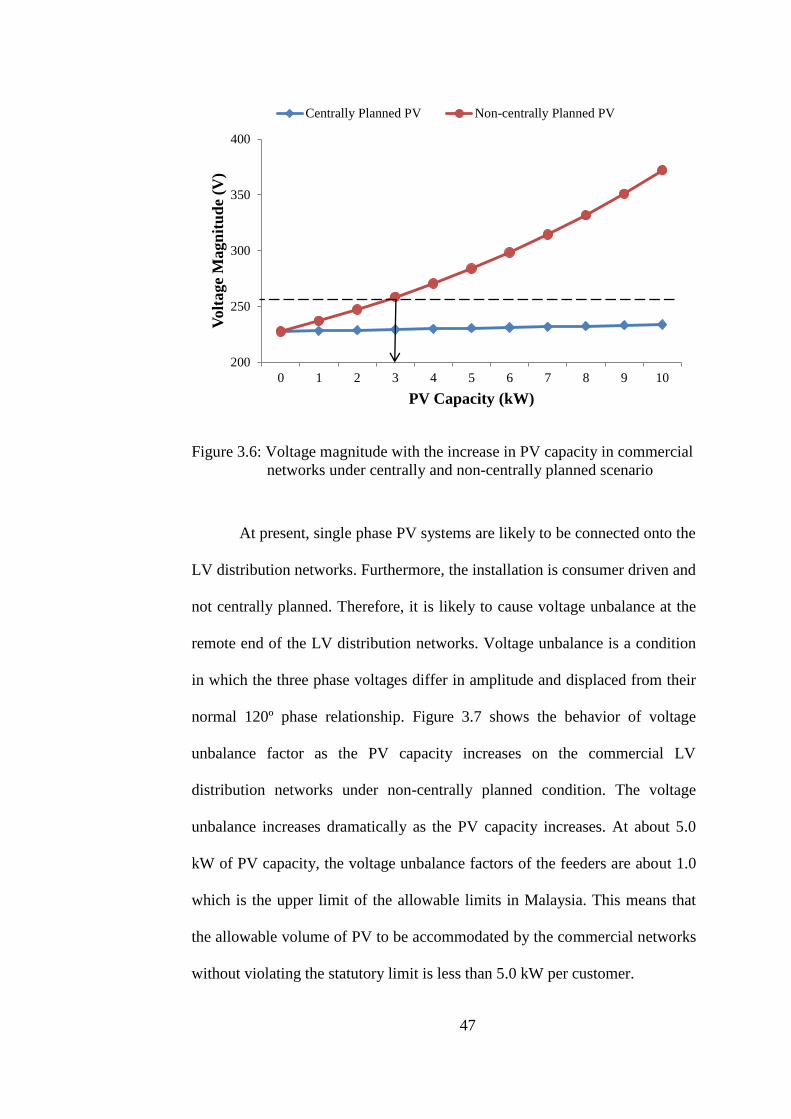
47
Figure 3.6: Voltage magnitude with the increase in PV capacity in commercial
networks under centrally and non-centrally planned scenario
At present, single phase PV systems are likely to be connected onto the
LV distribution networks. Furthermore, the installation is consumer driven and
not centrally planned. Therefore, it is likely to cause voltage unbalance at the
remote end of the LV distribution networks. Voltage unbalance is a condition
in which the three phase voltages differ in amplitude and displaced from their
normal 120º phase relationship. Figure 3.7 shows the behavior of voltage
unbalance factor as the PV capacity increases on the commercial LV
distribution networks under non-centrally planned condition. The voltage
unbalance increases dramatically as the PV capacity increases. At about 5.0
kW of PV capacity, the voltage unbalance factors of the feeders are about 1.0
which is the upper limit of the allowable limits in Malaysia. This means that
the allowable volume of PV to be accommodated by the commercial networks
without violating the statutory limit is less than 5.0 kW per customer.
200
250
300
350
400
0 1 2 3 4 5 6 7 8 9 10
Volt
age
Magn
itu
de
(V)
PV Capacity (kW)
Centrally Planned PV Non-centrally Planned PV

48
Figure 3.7: VUF at commercial networks in non-centrally planned scenario
Figure 3.8 shows the comparison of voltage unbalance factor under
centrally and non-centrally planned PV distributions. It is shown that non-
centrally planned PV creates greater voltage imbalance as compared to that of
the centrally planned PV systems. Centrally planned distribution of PV
systems allows for a higher capacity without violating the statutory limit of
voltage unbalance factor. The capacity of 5.5 kW of PV penetration can cause
the voltage unbalanced factor to be 1.0%, which is the limit.
0.00
0.50
1.00
1.50
2.00
2.50
0 1 2 3 4 5 6 7 8 9 10
Volt
age
Un
bala
nce
d F
act
or
(%)
PV Capacity (kW)
C5
C13
C22
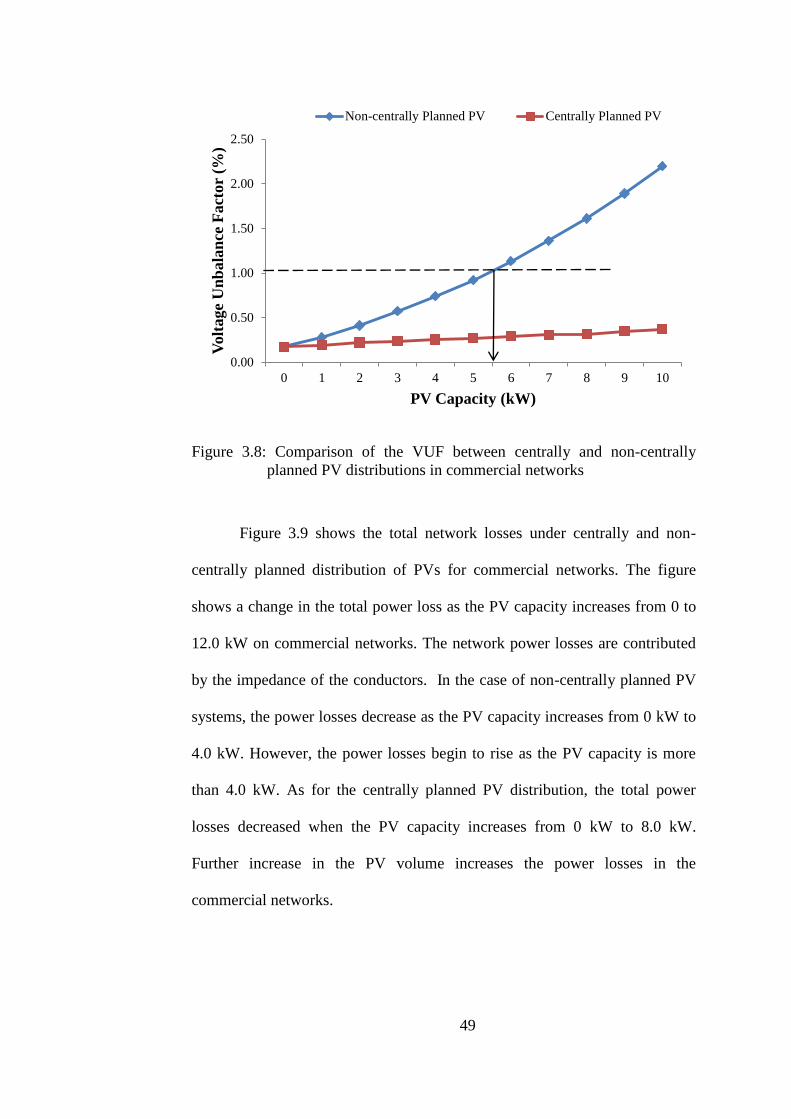
49
Figure 3.8: Comparison of the VUF between centrally and non-centrally
planned PV distributions in commercial networks
Figure 3.9 shows the total network losses under centrally and non-
centrally planned distribution of PVs for commercial networks. The figure
shows a change in the total power loss as the PV capacity increases from 0 to
12.0 kW on commercial networks. The network power losses are contributed
by the impedance of the conductors. In the case of non-centrally planned PV
systems, the power losses decrease as the PV capacity increases from 0 kW to
4.0 kW. However, the power losses begin to rise as the PV capacity is more
than 4.0 kW. As for the centrally planned PV distribution, the total power
losses decreased when the PV capacity increases from 0 kW to 8.0 kW.
Further increase in the PV volume increases the power losses in the
commercial networks.
0.00
0.50
1.00
1.50
2.00
2.50
0 1 2 3 4 5 6 7 8 9 10
Volt
age
Un
bala
nce
Fact
or
(%)
PV Capacity (kW)
Non-centrally Planned PV Centrally Planned PV

50
The simulation results show that both the PV distribution scenarios
have the same trend. If the generated power of PV is less than the demand, the
network power losses have a decreasing trend, whereby the customers are
supplied by the PV power instead of being supplied by the utility. Therefore
the network power loss is minimized. But, when the PV generation is more
than the demand, the network power losses increase dramatically due to the
reverse power losses. Furthermore, it can be seen that the commercial network
is capable to cater more PVs with the minimum power losses under centrally
planned PV systems. The centrally planned PV system in the distribution
networks is able to cater for 8.0 kW of PV with minimum losses while non-
centrally planned PV system is able to cater only for 4.0 kW PV with
minimum losses.
Figure 3.9: Total network power losses in the commercial networks
1.90
2.40
2.90
3.40
3.90
4.40
0 1 2 3 4 5 6 7 8 9 10 11 12
Act
ive
Pow
er L
oss
(k
W)
PVCapacity (kW)
Non-centrally Planned PV Centrally Planned PV

51
Figure 3.10 shows the variation of voltage unbalance factor with
respect to the cable length in the commercial LV distribution networks. It is
seen from the figure that the voltage unbalance increases as the cable length
increases in the distribution networks under both the PV distribution scenarios.
This is because of the interrelation between the cable impedance and network
power losses. The network power losses increase as the cable length increases,
likewise the voltage drops. The voltage drop in the phase where the PV system
is connected is more significant due to an excess current flow from the PV and
contributes to the voltage imbalance. It is noticed that the non-centrally
planned distribution of PVs across the commercial network has a higher
voltage unbalance factor compared with that of the centrally planned PV
distribution.
Figure 3.10: VUF with the increase in feeder cable length in the commercial
networks
0.00
0.50
1.00
1.50
2.00
2.50
3.00
3.50
4.00
4.50
100 200 300 400 500 600 700 800 900 1000
Volt
age
Un
bala
nce
d F
act
or
(%)
Cable Length (m)
Non-centrally Planned PV Centrally Planned PV

52
A unity power factor is always desired by the utility company to
minimize the power loss as well as energy wastage. Figure 3.11 shows the
variation of the voltage unbalance factor with respect to the power factor in
the commercial network under the non-centrally planned distribution of PV
systems. It is noticed that the voltage imbalance is minimum when the power
factor is unity or slightly capacitive. This is because the networks with unity
power factor have no reactive power that affect the network voltage magnitude
and hence voltage unbalance. In addition, a low power factor increases the
current and I2R losses which is turn, induces the voltage drop.
Figure 3.11: VUF with different power factor at point of connection in the
commercial network under non-centrally planned distribution of
PV
1.20
1.30
1.40
1.50
1.60
1.70
1.80
1.90
2.00
2.10
Volt
age
Un
bala
nce
d F
act
or
(%)
Power Factor
C5
C13
C22
53
3.6 Simulation Results for Residential LV Distribution Networks
The introduction of FiT creates an opportunity and economically
viability for residential customers to install PV systems on their rooftop. The
technical impacts caused by the PVs on residential networks are determined.
The characteristic differences between commercial and residential LV
distribution networks have been discussed in the previous Chapter 2.
Figure 3.12 shows an increase in the voltage magnitude at a residential
network when the capacity of PV is increased. It was observed that the voltage
rise occurs in phase B, where the PV system is connected. A high penetration
of PV generation during low power demand causes the voltage rise issues at
residential area of LV distribution networks.
Figure 3.13 shows that the non-centrally planned PV systems have a
higher voltage rise as compared to the centrally planned PV systems
distribution. It can be seen from the figure that the allowable PV capacity
connected to LV networks under the non-centrally planned PV distribution is
only 1.0 kW. Whilst for centrally planned PV systems, the allowable PV
capacity without violating the limits increased to 7.0 kW.

54
Figure 3.12: Voltage magnitude at feeder C16 with the increase in PV capacity
in the residential networks under non-centrally planned scenario
Figure 3.13: Voltage magnitude with the increase in PV capacity in residential
networks
150
200
250
300
350
0 1 2 3 4 5 6 7 8 9 10
Volt
age
Magn
itid
e (V
)
PV Capacity (KW)
Va
Vb
Vc
220
240
260
280
300
320
340
360
0 1 2 3 4 5 6 7 8 9 10
Volt
age
Magn
itu
de
(V)
PV Capacity (kW)
Centrally Planned PV Non-centrally Planned PV
55
Figure 3.14 shows the voltage unbalance factor of the residential LV
distribution networks under non-centrally planned PV distribution. The
allowable PV capacity that can be distributed randomly before violating the
statutory limit of 1% is about 6.0 kW. As the PV capacity increases,
the %VUF tends to increase. This is because the injection of real power into
the network causes the voltage magnitude to increase, hence increasing the
voltage variation between the three phases.
Figure 3.15 shows the VUF between centrally and non-centrally
planned of the residential network, it is observed that the allowable PV
capacity under centrally planned distribution is higher than that of the non-
centrally planned distribution. The coordination of PV installation is important
to minimize the voltage variation range, so to reduce the voltage imbalance on
the distribution networks. High VUF contributes to the network power losses
as additional current flows in the neutral line.

56
Figure 3.14: VUF at residential networks under non-centrally planned scenario
Figure 3.15: Comparison of the VUF for centrally and non-centrally planned
PV distributions in residential networks
0.0
0.2
0.4
0.6
0.8
1.0
1.2
1.4
1.6
1.8
0 1 2 3 4 5 6 7 8 9 10
Volt
age
Un
bala
nce
d F
act
or
(%)
PV Capacity (KW)
C15
C16
C17
C18
C19
C21
C22
C23
C24
0.00
0.20
0.40
0.60
0.80
1.00
1.20
1.40
1.60
1.80
0 1 2 3 4 5 6 7 8 9 10
Volt
age
Un
bala
nce
d F
act
or
(%)
PV Capacity (kW)
Centrally Planned PV Non-centrally Planned PV
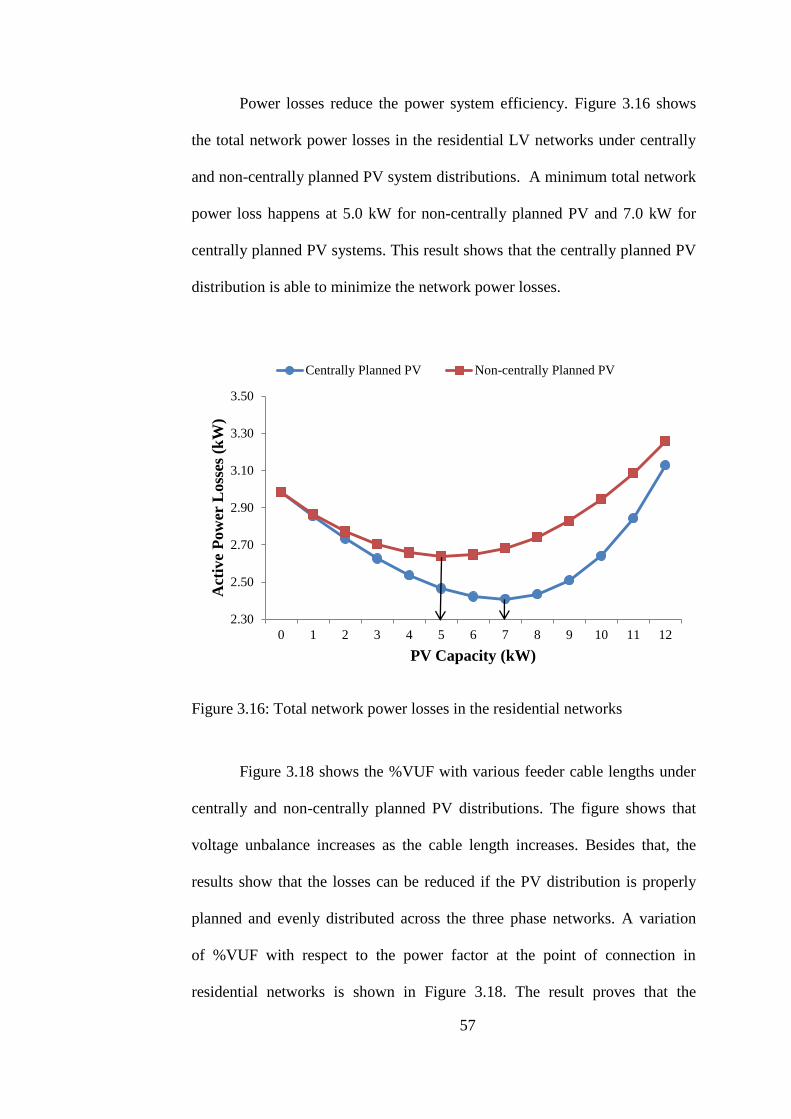
57
Power losses reduce the power system efficiency. Figure 3.16 shows
the total network power losses in the residential LV networks under centrally
and non-centrally planned PV system distributions. A minimum total network
power loss happens at 5.0 kW for non-centrally planned PV and 7.0 kW for
centrally planned PV systems. This result shows that the centrally planned PV
distribution is able to minimize the network power losses.
Figure 3.16: Total network power losses in the residential networks
Figure 3.18 shows the %VUF with various feeder cable lengths under
centrally and non-centrally planned PV distributions. The figure shows that
voltage unbalance increases as the cable length increases. Besides that, the
results show that the losses can be reduced if the PV distribution is properly
planned and evenly distributed across the three phase networks. A variation
of %VUF with respect to the power factor at the point of connection in
residential networks is shown in Figure 3.18. The result proves that the
2.30
2.50
2.70
2.90
3.10
3.30
3.50
0 1 2 3 4 5 6 7 8 9 10 11 12
Act
ive
Pow
er L
oss
es (
kW
)
PV Capacity (kW)
Centrally Planned PV Non-centrally Planned PV

58
minimum VUF occurs when the PV systems are connected to the bus with
unity power factor.
Figure 3.17: VUF with respect to different cable lengths in the residential
networks
Figure 3.18: VUF with respect to various power factors at point of connection
in the residential network
0
0.5
1
1.5
2
2.5
3
3.5
4
4.5
100 200 300 400 500 600 700 800 900 1000
Volt
age
Un
bala
nce
Fact
or
(%)
Cable Length (m)
Centrally Planned DG Non-centrally Planned DG
0.70
0.80
0.90
1.00
1.10
1.20
1.30
1.40
1.50
1.60
1.70
Volt
age
Un
bala
nce
d F
act
or
(%)
Power Factor
C15
C16
C17
C18
C19
C21
C22
C23
C24
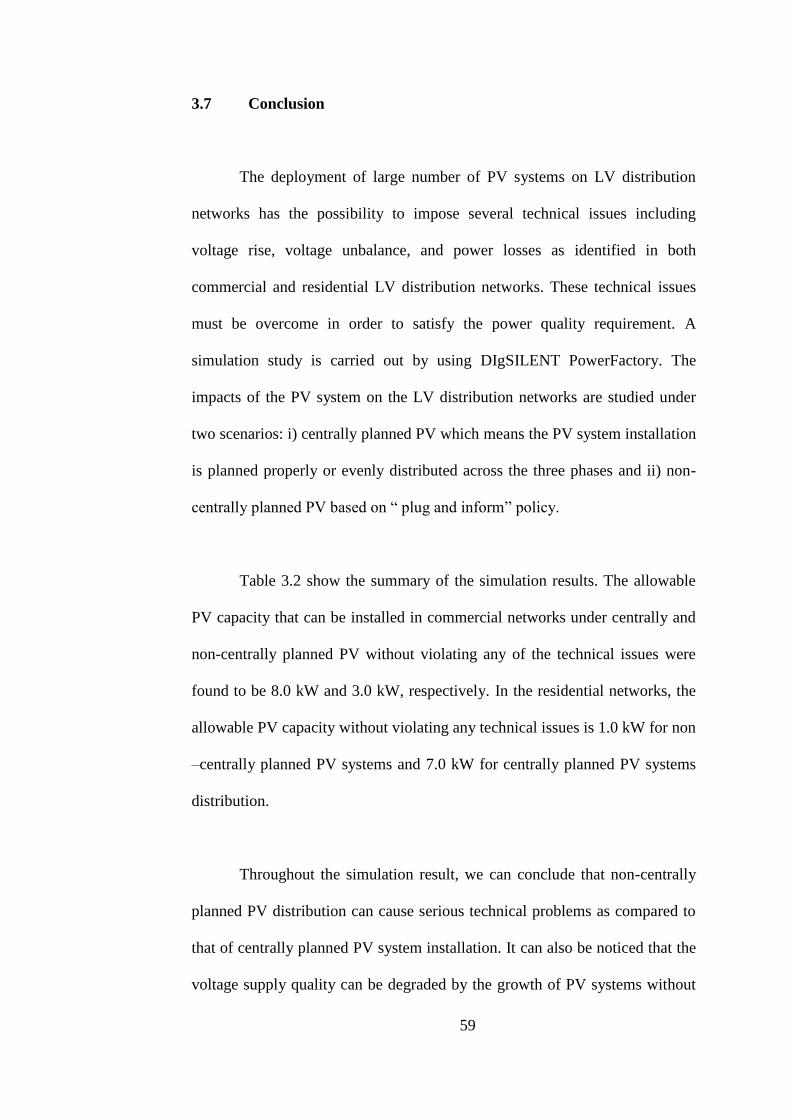
59
3.7 Conclusion
The deployment of large number of PV systems on LV distribution
networks has the possibility to impose several technical issues including
voltage rise, voltage unbalance, and power losses as identified in both
commercial and residential LV distribution networks. These technical issues
must be overcome in order to satisfy the power quality requirement. A
simulation study is carried out by using DIgSILENT PowerFactory. The
impacts of the PV system on the LV distribution networks are studied under
two scenarios: i) centrally planned PV which means the PV system installation
is planned properly or evenly distributed across the three phases and ii) non-
centrally planned PV based on ― plug and inform‖ policy.
Table 3.2 show the summary of the simulation results. The allowable
PV capacity that can be installed in commercial networks under centrally and
non-centrally planned PV without violating any of the technical issues were
found to be 8.0 kW and 3.0 kW, respectively. In the residential networks, the
allowable PV capacity without violating any technical issues is 1.0 kW for non
–centrally planned PV systems and 7.0 kW for centrally planned PV systems
distribution.
Throughout the simulation result, we can conclude that non-centrally
planned PV distribution can cause serious technical problems as compared to
that of centrally planned PV system installation. It can also be noticed that the
voltage supply quality can be degraded by the growth of PV systems without
60
proper coordination before installation. To allow for more grid connected PV
systems, pre-installation study should be performed and planned.
Table 3.2: Summary of the simulation results
Commercial Networks Residential Networks
Centrally
Planned PV
Non-
Centrally
Planned PV
Centrally
Planned PV
Non-
Centrally
Planned PV
PV Capacity
before
voltage rise
limit
>10 kW 3.0 kW >10 kW 1.0 kW
PV capacity
before VUF
violation
>10 kW 5.5 kW >10 kW 6.0 kW
PV capacity
before power
loss increase
8.0 kW 4.0 kW 7.0 kW 5.0 kW
61
CHAPTER 4
DESIGN AND DEVELOPMENT OF LV DISTRIBUTION NETWORKS
EMULATOR WITH DIRECT LOAD CONTROLLER
4.1 Introduction
As discussed in Chapter 2, Malaysia might be one of the cloudiest
countries in the world. The voltage fluctuation and flickers caused by the
intermittent power output of the PV systems have been identified as the major
challenges to the PV systems‘ installation. In addition, the degradation of
voltage supply quality has been identified in the simulation study, as discussed
in Chapter 3. The newly launched FiT, by the government, has encouraged the
installation of grid connected DGs, especially PV systems. In the near future,
small scale PV systems are likely to be found scattered across the LV
distribution networks. With this scenario, the voltage quality issue is likely to
increase as the PV generation is greater than the load consumption. From the
study it is understood that, it is always the best solution to maintain the voltage
level at the point of common connection for PV systems in order to avoid
unsatisfactory voltage level at the LV distribution network.
Furthermore, in order to allow a higher capacity of the PV systems to
be connected to the existing LV distribution grid with minimum power quality
issues, a direct load controller (DLC) method is proposed. The DLC is

62
installed at the appropriate point of the LV distribution network in order to
manage the supply and demand balance depending on the networks and
weather conditions.
In this chapter, an experimental LV network emulator integrated with
DLC is discussed. The experimental network is used to study the interaction
between the DLC and PV systems. This chapter also provides a preview of the
distributed generation, load bank design and data acquisition system. This is
followed by the description of the DLC control algorithm developed by using
LABVIEW. Eventually, a method to quantify the voltage fluctuation and
flicker is discussed.
4.2 Design of Experimental LV Network Emulator
The experimental LV distribution network is designed to investigate
the impacts of high penetration of PV systems. The proposed DLC method is
integrated into the experimental LV distribution network in order to evaluate
the performance and effectiveness to mitigate the voltage quality issues. The
experimental setup includes a 15 kVA network emulator, 1.8 kWp PV system,
3.0 kW load bank, 480 Ah energy storage system and a data acquisition
system. The energy storage is used to study the stand-alone power systems
supported by the energy storage instead of the grid or generator.

63
4.2.1 Network Emulator
The network emulator consists of a 15 kVA synchronous machine
coupled with an induction motor driven by a variable frequency drive as
shown in Figure 4.1. This is designed in such a way to isolate the experimental
network emulator from the utility grid. With this design, it is possible to
prevent the fault during the testing and experiment stages from spreading to
the grid and affecting the utility grid‘s operation. The variable frequency drive
typically drives the induction motor at 1500rpm, so as to regulate the network
frequency at 50Hz at all time.
Figure 4.1: Network emulator
The proposed experimental LV network has a tapered, radial topology
and its impedances are primarily resistive, in accordance with LV networks as
described in Chapter 2, where X/R ratios are low. This network emulator is of
three-phase four-wire topology with a T-T earthing system which is common
in Malaysian LV distribution networks.

64
4.2.2 PV system
The PV system is built with 32 panels of poly-crystalline PV modules
manufactured by Panasonic. Each of the modules contributes a maximum
power of 230W. These panels are divided to 4 strings with 8 panels in a string.
Each string has the capacity of 1.84 kWp and is detachable from the solar
inverter such that the capacity of the PV system can be fixed at 1.84, 3.68,
5.52 and 7.36 kWp. The total capacity of the PV system is 7.36 kWp. Figure
4.2 shows the single line diagram of 2 string PV module connected to a 3.0
kWp PV inverter namely Zigor Sunzet SP3. This PV system is integrated with
the proposed experimental LV network emulator.
The PV module is oriented to face north, with a 5º tilt angle from the
horizontal plane. This enables the PV systems to receive sunlight throughout
the day and the dust on the PV module could be cleaned by the rain water.
Figure 4.2: PV system

65
4.2.3 Energy Storage System
The energy storage system consists of a SMA Sunny Island 5048 bi-
directional inverter integrated with 4 x 120 Ah lead acid batteries as illustrated
in Figure 4.3. The proposed energy storage system is used as one of the supply
sources or DGs in the experiment.
Figure 4.3: Energy storage system
The Sunny Island interfaces with a computer to enable the control to
inject or absorb the power from the battery bank. The Sunny Island is capable
of forming a grid, keeping the voltage and frequency of the grid at a constant
level. The nominal voltage of the lead acid battery is 12V which results in an
energy capacity of 5.76 kWh. The lead acid battery is reported to have a
higher operational efficiency, a longer lifetime and cost efficiency.
4.2.4 Load Bank
The load bank is designed to emulate the operation of the real load.
This load bank enables a flexible, organized and fully controllable load as
compared to the real load on the power system. The proposed three-phase load

66
bank consists of 15 units of the power resistors, with a rating of 200W/each.
Each resistor is controllable via LabVIEW control system by triggering the
solid state relay connected to the power resistor. The three-phase controllable
load bank is capable to vary its rating from 200 W, up to 1000 W, with a 200
W increment in each step. The limitation of the proposed controllable load
bank is that it is purely resistive. Therefore, the load bank is only suitable to
emulate the unity power factor load. Figure 4.4 shows the configuration of the
proposed controllable load bank.
Figure 4.4: Controllable load bank
The digital input or output module, NI 9403 is used as an interface
between the supervisory computer and the controllable load. The NI 9403 has
a 37 pin connector that provides connections for the 32 digital input or output
channels shown in Figure 4.5. The 32 channels are internally referred to the
common, COM so any of the four COM lines can be used as a reference for
the external signal. Each channel has a 5 V digital output pin which is used to
connect to the solid state relay (SSR) as shown in Figure 4.6. The SSR used is
silicon controlled rectifier output suitable for heavy industrial loads. It has the
feature of zero crossing for resistive loads. The D2425 SSR that has the
control voltage in between 3-32V and rated at 25A is used in the controllable

67
load bank. Fifteen units of pure resistive, 200 W, power resistors shown in
Figure 4.7 are used as dump load to consume the energy.
Figure 4.5: NI 9403 37-pin assignments
Figure 4.6: Solid State Relay D2425

68
Figure 4.7: Custom made 200W power resistor at 288 Ω
4.2.5 Data Acquisition System
A data acquisition and control is required to measure the impacts of
voltage fluctuation and flicker caused by PV systems on the LV networks. It
determines whether the measured voltage is within its acceptable tolerance, so
as to activate the controller to send command to the solid state relay. The
three-phase voltage and current at the point of connection around the LV
distribution networks are monitored by using national instrument‘s (NI)
voltage and current modules. The data acquisition device consists of a c-DAQ
9174 Data Acquisition Chassis, NI 9225 voltage module and NI 9227 current
module. The chassis is connected to a supervisory PC in order to monitor the
RMS voltage and RMS current with LabVIEW. These measurements are used
as a feedback to activate the direct load controller. The output command is
sent to the solid state relays that control the power resistor via NI- 9403
Digital I/O module. Figure 4.8 shows the flow chart for the data acquisition
process.
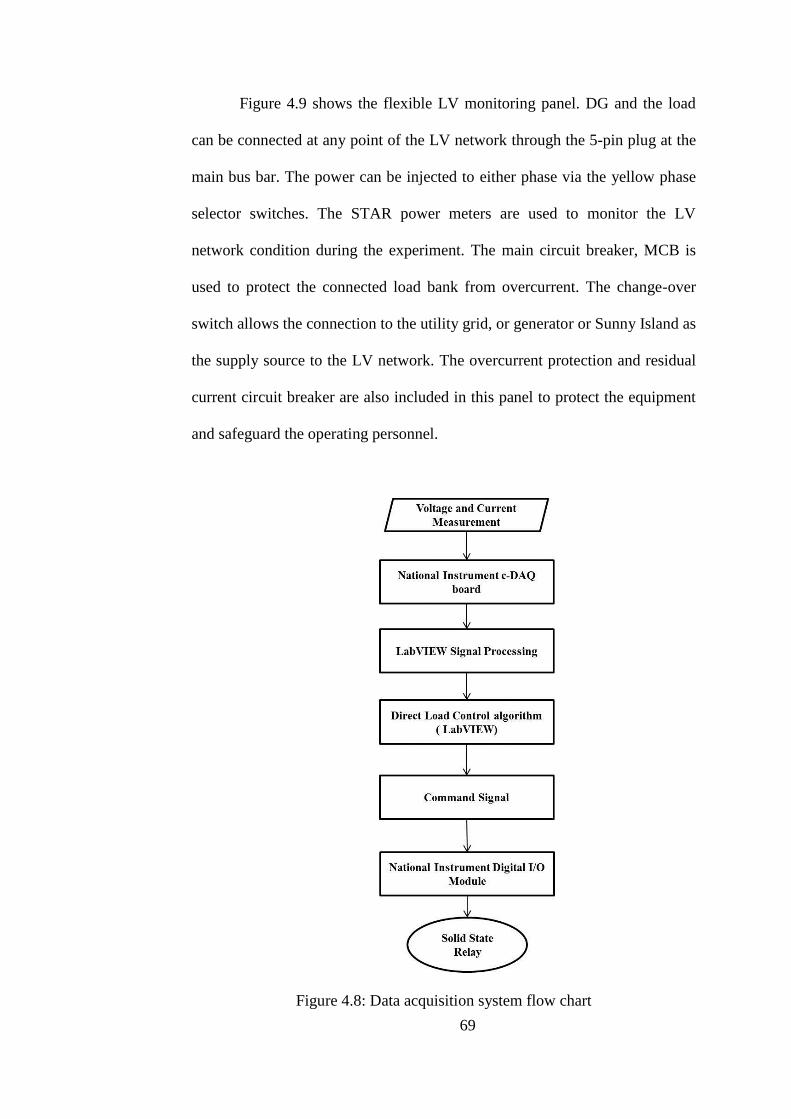
69
Figure 4.9 shows the flexible LV monitoring panel. DG and the load
can be connected at any point of the LV network through the 5-pin plug at the
main bus bar. The power can be injected to either phase via the yellow phase
selector switches. The STAR power meters are used to monitor the LV
network condition during the experiment. The main circuit breaker, MCB is
used to protect the connected load bank from overcurrent. The change-over
switch allows the connection to the utility grid, or generator or Sunny Island as
the supply source to the LV network. The overcurrent protection and residual
current circuit breaker are also included in this panel to protect the equipment
and safeguard the operating personnel.
Figure 4.8: Data acquisition system flow chart

70
Figure 4.9: Flexible LV panel
4.3 Design of DLC Algorithm
The direct load control is one of the DSM methods. DLC is usually
used to control the level of power consumption on the electrical grid. This
method is used to reduce the peak demand to avoid any large power
interruption on the national grid and to maintain the frequency of the stand-
alone power systems due to the limited capacity of the power generation.
The proposed load control algorithm is used to control the load bank,
where the load controller makes use of the real power to change the network
voltage. This is because the resistance is greater than the reactance in the low
voltage distribution networks, and hence the voltage magnitude responds
71
predominantly to the real power changes. A previous study by Hingorani,
(1991) showed that the Flexible AC Transmission System devices and VAR
compensator are already widely used for the voltage correction, by reactive
power compensation, in a transmission network. However, these devices have
limited effect on LV distribution networks where the X/R ratio is low. Wong,
(2011) has proved the concept of energy storage unit integrated with four
quadrant converter capable of controlling the flow of real and reactive power
to correct the network voltage magnitude. Nevertheless, the energy storage
device and the converter will be the expensive devices that would increase the
total investment cost for a RE developer. A super capacitor is also proposed as
a viable solution to reduce the voltage quality issues (Degobert et al., 2006;
Palizban et al., 2011). However, the capacitor has low cell voltage. In order to
use in high voltage application, several capacitors have to connect in series.
This will introduce the current leakage. In addition, the super capacitor is also
more expansive than the proposed DLC which uses resistor.
A voltage change in the LV distribution networks with DG can be
described below.

72
V
XQQRPPV LGLG (1)
Where
PG, QG = Real and reactive power of generator, respectively
PL, QL = Real and reactive power of load, respectively
R, X = Cable resistance and reactance, respectively
ΔV = Voltage change
V = Line voltage
Since the X/R ratio is low in the LV distribution networks, the resistance, R is
much higher than reactance, X. This means that the reactive power has less
influence on the distribution network voltage compared to that of the real
power. Hence, we propose to use the real power to correct the voltage
fluctuation and flicker.
To understand exactly how ΔP is related to ΔV, the correlation between
ΔP and ΔV has to be determined. It is known that the change in voltage
magnitude (ΔV) and current (ΔI) is related as follows:-
IZV (2)
Where Z is the impedance of the line where the PV system is connected to.
The change in PV power output (ΔP) is related to ΔI by the following equation.
I)VV(P (3)
Then ΔI is related to ΔV by the following equation.
Z
VI
(4)

73
By substituting Equation (3) into Equation (2) gives the following
Z
V)VV(P
(5)
V is the nominal voltage and is much greater than ΔV. Therefore,
PV
ZV
(6)
From the derived equation, it can be seen that the change in the voltage
magnitude depends on two factors. It depends on the change of the PV power
output and the impedance, Z of the cable where the PV system is connected to.
The load controller is proposed to mitigate voltage fluctuation and
flicker because its components are cheap. Also, it is an effective means for
reducing flicker by switching the resistors on and off very rapidly in order to
compensate for the impacts of the sudden increase and decrease in the PV
power output. The power dissipated in the load controller can be used to heat
up water for multipurpose applications.
Figure 4.10 shows the block diagram of the proposed DLC. It consists
of a load bank with 5 units of 200 W power resistors per phase that adjust the
real power consumption in the LV distribution networks. A measurement unit
measures the voltage magnitude at the point of connection and sends signal to
the controller that decides whether to turn on or off the power resistor. Real
time voltage magnitude will be compared to the pre-set reference to determine
the number of power resistor needed to turn on/off. The controller responds

74
immediately when it detects the voltage rise or voltage drop to compensate for
the voltage fluctuation and flicker.
Figure 4.10: The block diagram of the DLC controller
Figure 4.11 shows the flow chart of the control algorithm. It consists of
a load bank with 5 units of 200W power resistors with solid state relays to
switch on and off the power resistors. A simple control algorithm is developed
using LabVIEW as a programming platform shown in Figure 4.12. The front
panel of the power quality monitoring is shown in Figure 4.13. From the front
panel, network operators can easily monitor the real time power quality of the
LV distribution networks.
The system begins with measuring the voltage magnitude at the point
of connection. It is then followed by comparing the Vinst to the Vsp. The
controller will not activate until the Vinst is out of the tolerance limit or dead
band shows in Figure 4.17. A dead band is an area of a signal range where no
action is taken by the controller. The dead band prevents repeated activation
and deactivation of the DLC controller. The controller will activate one 200W
75
resistor once at a time until the Vinst exceeds the dead band. Similarly, if the
Vinst is lower than the Vsp, the controller will deactivate one of the 200W
resistors one at a time in order to mitigate the voltage back to its acceptable
limit. The load bank control is shown in Figure 4.18. The proposed control
algorithm is simple; therefore it can effectively activate and deactivate the
resistor dynamically with minimum delay.
Figure 4.14 shows the LabVIEW coding for voltage measurement.
Instantaneous voltage is converted to RMS voltage. Then the dynamic data are
converted to array data type. In addition to voltage, the frequency is also
measured as shown in Figure 4.15. The current measurement is shown in
Figure 4.16. Due to the NI 9227 the maximum current module allowable
current is 5 A. Ring type current transformers are used to step down the
measured current. The Class 3 current transformer used has a ratio of 250/5A.
Hence, the measured current value has to be multiplied by fifty to get the
actual current value in the LabVIEW program.

76
Figure 4.11: Flow chart of the control algorithm
Figure 4.12: LabVIEW programming coding for DLC

77
Figure 4.13: Front panel for power quality monitoring in LabVIEW
Figure 4.14: LabVIEW model for Voltage measurement

78
Figure 4.15: LabVIEW model of frequency measurement
Figure 4.16: LabVIEW model for current measurement
Figure 4.17: Dead band between 238 to 245V
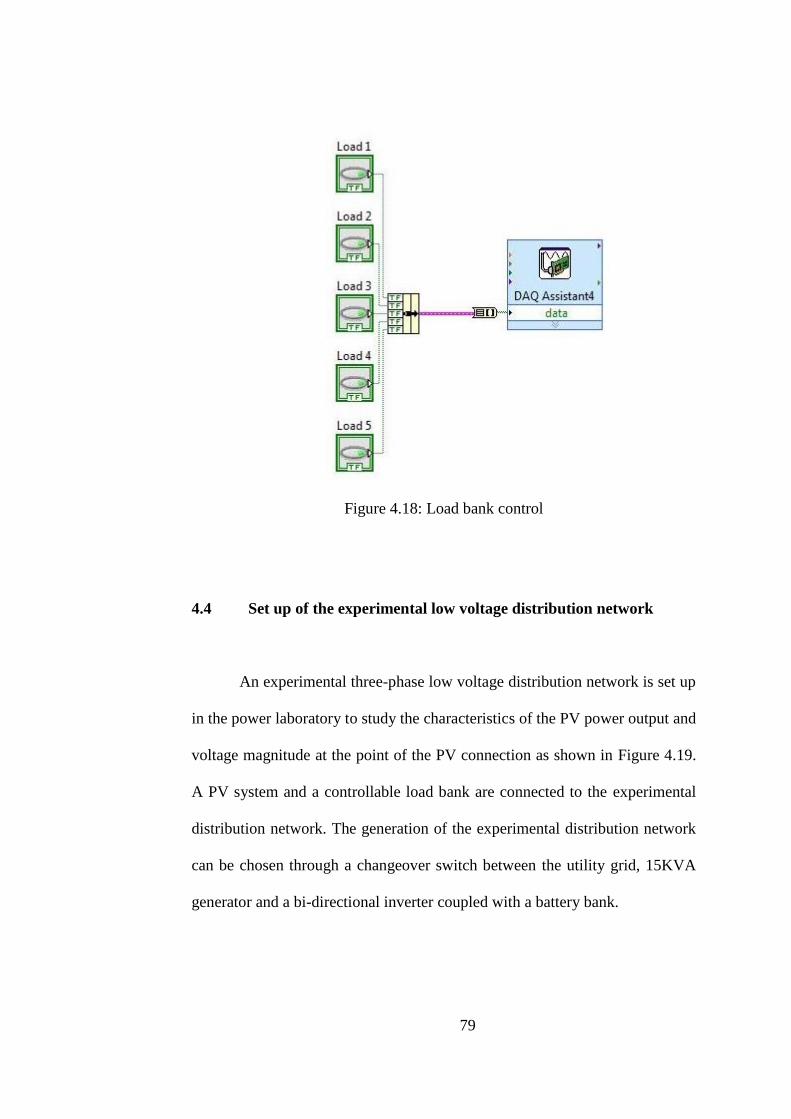
79
Figure 4.18: Load bank control
4.4 Set up of the experimental low voltage distribution network
An experimental three-phase low voltage distribution network is set up
in the power laboratory to study the characteristics of the PV power output and
voltage magnitude at the point of the PV connection as shown in Figure 4.19.
A PV system and a controllable load bank are connected to the experimental
distribution network. The generation of the experimental distribution network
can be chosen through a changeover switch between the utility grid, 15KVA
generator and a bi-directional inverter coupled with a battery bank.

80
Three scenarios are studied based on the experimental LV distribution
network, as follows:
Case Study 1: The 15KVA generator is used to study the voltage
fluctuation purely generated by the PV system in the conventional off-
grid system.
Case Study 2: The utility grid is used to study the impact of PV
systems connected to the existing LV distribution networks.
Case Study 3: The bi-directional inverter coupled with the battery
bank is used to study the modern off-grid system which includes the
distributed generation, both renewable and non-renewable.
Figure 4.19: Experimental setup
81
4.5 Quantification of Voltage Fluctuation and Flicker
To quantify the voltage fluctuation and flickers produced by the
photovoltaic system, a number of standard formulae are adopted (Deokar &
Waghmare, 2010; Nambiar et al., 2010; Ortega et al., 2013). In this section,
the voltage sensitivity, the voltage fluctuation index, the global voltage
regulation, and the flicker will be discussed briefly.
4.5.1 Voltage Sensitivity Gradient
The voltage sensitivity curve is used to determine the sensitivity of the
change in the PV power output with respect to the change of network voltage
magnitude. A two axis graph is plotted with the Y-axis representing the
change in the PV power output and the X-axis representing the change in the
voltage as shown in Figure 4.20. It is assumed that the change of the PV
power is linearly proportional to the change of the voltage. The gradient is
then calculated.

82
Figure 4.20: Correlation between ΔP and ΔV
4.5.2 Voltage Fluctuation Index
The voltage fluctuation can be quantified by the voltage fluctuation
index (VFI). VFI quantifies the average change in the RMS voltage magnitude
during each excursion over the entire period considered. In this work, the
period of time is defined from 9am to 5pm, which is 8 hours, when the
sunlight is available. The formula for calculating VFI is given as follows:-
1
2
1
N
VV
V
N
i
ii
FI (7)
Where V is the voltage magnitude; i refers to the instant time and N is the
number of samples.

83
4.5.3 Global Voltage Regulation
The Global Voltage Regulation (GVR) is used to quantify the voltage
fluctuations in the network with DG. To calculate the global voltage regulation,
the difference between the maximum and minimum RMS voltage magnitudes
in the same time interval is measured. The time interval of this calculation is
set to 10mins. The GVR equation is defined as:-
N
ViVi
GVR
N
i
MINMAX
1
2)(
(8)
Where ViMAX is maximum voltage; ViMIN is the minimum voltage; N is the
number of samples.
4.5.4 Short Time Flicker
The standard IEC 61000-3-3 provides and explains the voltage flicker
emission limits of the equipment connected to the LV distribution networks.
The IEC 61000-4-15 presents the flicker measurement and assessment. A
simplified short time flicker (PST) assessment method is proposed in this work.
It is also known as the unity flicker severity curve approach. This method
makes use of the fact that the flicker severity is a linear parameter to the
magnitude of the voltage changes that caused it. This method is chosen and
incorporated into the control algorithm of the DLC because it is a quick and
simple assessment approach which creates a very little delay in the execution
of the DLC. This method is listed as follows:

84
i) Determine the magnitude of every voltage changes over the
specific minute using the following equation.
%100minmax
nomV
VVd (9)
Where Vmax is the maximum voltage, Vmin refer to minimum voltage
and Vnom is the nominal voltage, which is 230V in Malaysia.
ii) Determine the number of voltage changes within the
specified minute, r.
iii) Calculate the average value, d of the all the voltage change
ΔV happening within the specified minute.
iv) Substituting, r, expressed as the number of voltage changes
per minute, into the severity curve as shown in Figure 4.21
to find the corresponding relative voltage change, d0, that
produces PST0 = 1.0.
v) The short time flicker can therefore be calculated using the
following correlation:-
d
dPP STST
0
0 (10)

85
Figure 4.21: Unity flicker curve at PST0 = 1
4.5.5 Long Time Flicker
Short-time flicker is used to evaluate the long-time flicker (PLT) for a
longer period. In this work, the period is defined as 2 hours by using the cubic
law as follows:
3
1
3
N
P
P
N
i
STi
LT
(11)

86
4.6 Conclusion
This chapter described the details of the experimental LV distribution
network. It is designed in such a way to comply with the Malaysian LV
distribution network topology. The proposed experimental LV distribution
network is a three-phase four-wire network with radial design. The LV
network is earthed in a T-T configuration where the customer is responsible to
ground the exposed metallic path to earth. This experimental LV distribution
network is designed to study the effectiveness of the DLC in an on-grid and
off-grid set-ups. The generation source of the experimental network can be
chosen between the utility grid, generator or battery storage. The proposed
DLC algorithm is developed using LabVIEW which operates by using a
supervisory PC. The control flow and the three scenarios are described in this
chapter. These scenarios are designed to study the effectiveness of the
proposed DLC in mitigating voltage fluctuation, and voltage flickers.
87
CHAPTER 5
VOLTAGE FLUCTUATION AND FLICKER IN LV DISTRIBUTION
NETWORKS WITH PV SYSTEMS AND THE CORRECTIVE
METHOD OF LOAD CONTROLLER
5.1 Introduction
The previous chapter described the design and development of the
experimental LV distribution network integrated with DLC algorithm. In this
chapter, the characterization of the PV power fluctuation is discussed. This is
followed by a study of the voltage fluctuation and flicker issues that may arise
due to the intermittent PV power output. Three case studies are presented to
show the effectiveness of DLC in mitigating the voltage fluctuation and flicker
on the LV distribution networks.
5.2 Characterization of the PV Power Output
A case study is carried out to characterize the power output of a 3.0
kW PV system in the experimental network. The PV is connected to Phase A
of the experimental LV distribution network. National Instrument (NI) data
acquisition devices are used to log the terminal voltage and the current output
of the PV system. The data acquisition system consists of a data acquisition
88
chassis, NI-cDAQ and two measurement modules, NI 9225 voltage card and
NI 9227 current card. LabVIEW is used as a programming platform to
monitor and log the data into excel file format. The PV system is monitored
over a period of 9 months. Figure 5.1 shows the relationship between the
voltage magnitude and PV power output on 29th December 2013. The PV
power output fluctuates very rapidly, causing the voltage magnitude to change
frequently throughout the day. Three unique characteristics of the PV power
outputs can be observed from the result as listed below:-
1. Few high PV power outputs happen within a short duration.
2. Some of the high PV power outputs drop down suddenly instead of
gradually. For example, the high PV power output of 2.7 kW that
happens between 12.00 and 12.22 pm drops immediately to 1.2 kW
after 12.22 pm.
3. The magnitude of reduction in the PV power output is significant,
about 63 % of reduction in the PV power output.
A high PV power output happens within a short durations because of
the high frequency of the passing clouds over the PV panel. The sudden
reduction in the PV power outputs are caused by the thick clouds that reduce
the total solar irradiation arriving at the solar panels. Some of the thick clouds
can reduce the solar irradiation substantially, hence making a significant
reduction in the PV power output.

89
Figure 5.1: Fluctuation in PV output and voltage magnitude
5.3 Voltage Fluctuation and Flicker Caused by PV system
A preliminary case study is carried out to investigate the severity of
voltage fluctuation and flickers introduced by PV systems. A 1.84 kW PV
system is connected to phase A of the experimental LV distribution network.
A 15 KVA synchronous generator is used to be the supply source to the
network because it does not generate any severe voltage fluctuation and
flickers to the network. As a result, any flickers experienced at the point of
connection are generated from the PV system.
The voltage magnitude at the point of the common coupling is
measured and recorded on a regular basis. Figure 5.2 shows the variation in
voltage magnitude caused by the fluctuation in the power output of the 1.84

90
kW PV system. These voltage are used to calculate the voltage fluctuation
index (VFI ), the short-time flickers ( PST) and the long-time flickers ( PLT).
There are 47 short-time flicker indices that can be calculated by equation (10)
from the measured data as shown in Figure 5.3. The short-time flicker is then
used to calculate the long-time flicker for a period of 2 hours. It is noticed that
the maximum value of short time flicker exceeds the statutory limit. This
result shows that the flickers produced by the PV systems can exceed the
allowed limits.
Figure 5.2: Variation in voltage magnitude caused by the fluctuation in the
power output of the 1.84 kW photovoltaic system

91
Figure 5.3: A number of short-time flickers being calculated from the
collected voltage magnitude
5.4 Solar Density Chart
The solar density chart is introduced to study the PV system
performance in Malaysia. The solar density chart is useful to give a
quantitative impression of the PV system‘s performance. The chart shows the
frequency of various PV power outputs within a certain range and the
corresponding duration. The solar density chart will be categorized into sunny,
cloudy, and rainy days in Malaysia. In addition, the average data from
Thailand, Hong Kong, China, and UK are also presented in this section. In the
chart, all the PV output magnitude ranges are of equal size. However, the
duration is in different size because there are more PV power with short
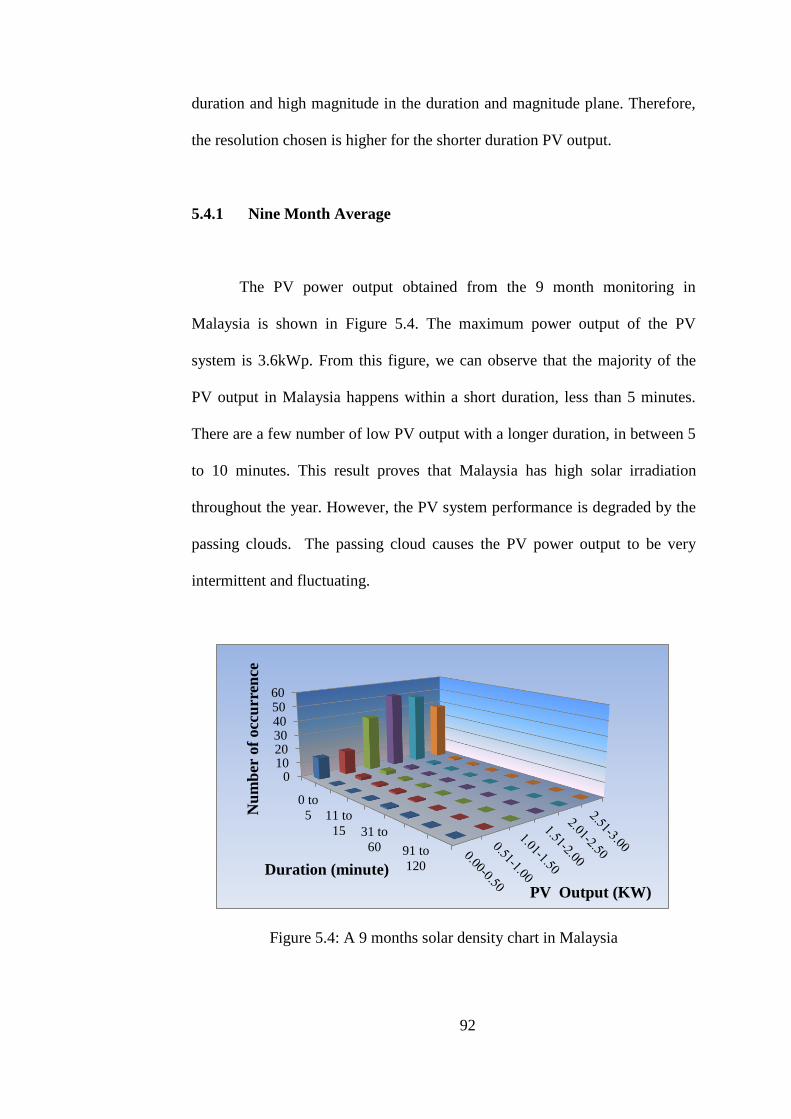
92
duration and high magnitude in the duration and magnitude plane. Therefore,
the resolution chosen is higher for the shorter duration PV output.
5.4.1 Nine Month Average
The PV power output obtained from the 9 month monitoring in
Malaysia is shown in Figure 5.4. The maximum power output of the PV
system is 3.6kWp. From this figure, we can observe that the majority of the
PV output in Malaysia happens within a short duration, less than 5 minutes.
There are a few number of low PV output with a longer duration, in between 5
to 10 minutes. This result proves that Malaysia has high solar irradiation
throughout the year. However, the PV system performance is degraded by the
passing clouds. The passing cloud causes the PV power output to be very
intermittent and fluctuating.
Figure 5.4: A 9 months solar density chart in Malaysia
0102030405060
0 to
5 11 to
15 31 to
60 91 to
120
PV Output (KW)
Nu
mb
er o
f occ
urr
ence
Duration (minute)

93
5.4.2 Sunny
Sunny day is defined as a day with sunlight from 8 am to 6 pm and PV
panels are exposed to the direct rays of the sun. Figure 5.5 shows the PV
power output on 10/9/2012. The majority of the PV output has a magnitude
range greater than 1.0 kW but less than 2.5 kW. There is also a significant
number of high PV power output, ranging from 2.5 kW to 3.0 kW, happening
within 30 minutes or less. The solar density chart as shown in Figure 5.5 has a
similar trend to the Malaysian solar density chart as shown in Figure 5.4.
Therefore, the solar density chart shows that Malaysia has a sunny day most of
the time.
Figure 5.5: Malaysia‘s Solar Density Chart under Sunny condition

94
5.4.3 Cloudy
Throughout the monitoring period, 14/9/2012 was a cloudy day. Figure
5.6 shows the PV power output on that particular day. The chart shows a
highly fluctuating PV power output. Cloudy day is defined as a day with soft
and diluted sunlight throughout the day. The majority of the PV output has a
magnitude between 1.0 kW to 1.5 kW with a duration less than 5 minutes.
There are many low PV power outputs, less than 1.5 kW, happening for a
longer period. Some of the PVs with a magnitude less than 0.5 kW can last for
an hour. The occurrence of high PV output is very rare. This is because the
sky is covered with the big white cloud, reducing the total solar irradiation
substantially, hence making the PV power output to be very intermittent.
Figure 5.6: Solar Density Chart for cloudy day in Malaysia
0
5
10
15
0 to 511 to
15 31 to
60 91 to
120
PV output (KW)
Nu
mb
er o
f occ
urr
ence
Duration (minute)

95
5.4.4 Rainy
Figure 5.7 shows the solar density chart during a rainy day. The solar
density chart shows that the majority of the PV output has a magnitude less
than 1.5 kW with a duration of 30 minutes. There are a significant number of
low PV outputs, less than 0.5 kW, happening for more than 2 hours. During
rainy days, none of the recorded power output falls between the ranges from
1.5 kW to 3 kW. The solar density chart shows the characteristic of low PV
power output for a longer period during rainy days.
Figure 5.7: Solar Density Chart for Rainy day in Malaysia
5.4.5 International
To compare the PV output characteristics of other countries, a
comprehensive PV monitoring data from Thailand, China, Hong Kong and the
UK are collected from the sources of Li et al., (2005); Chokmaviroj et al.,
(2006); Zou et al., (2012); Scott, (2012). Figure 5.8 shows the characteristics
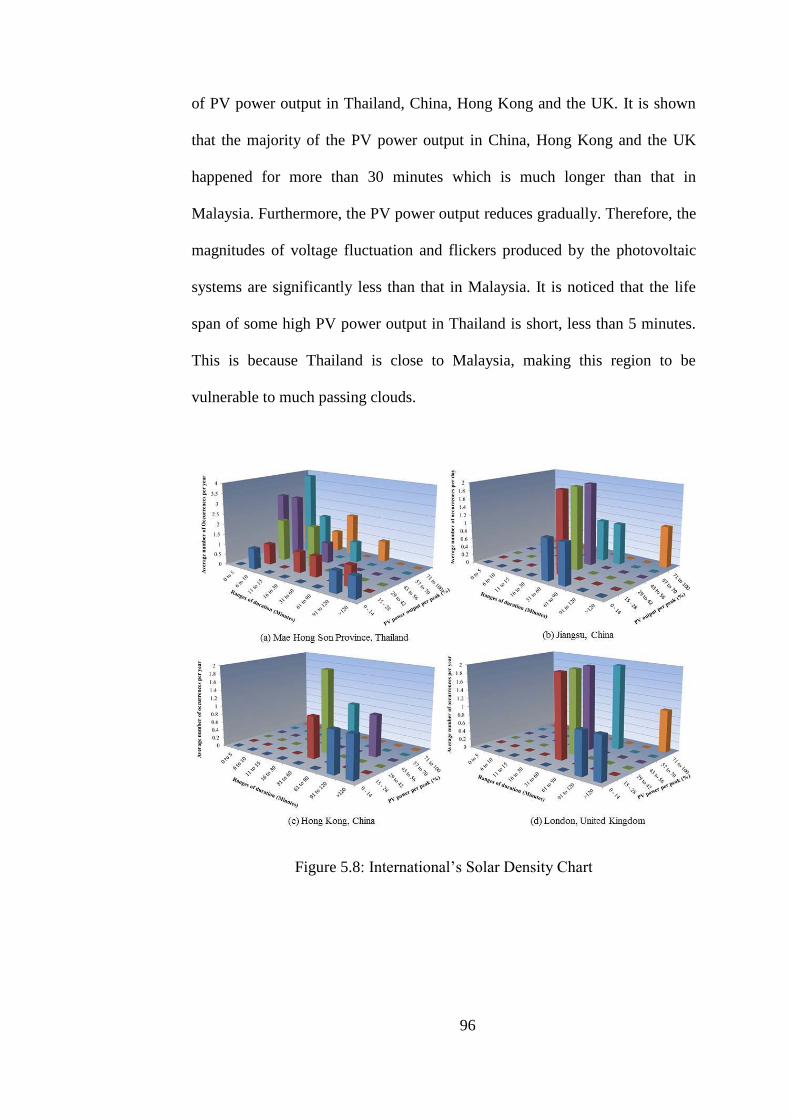
96
of PV power output in Thailand, China, Hong Kong and the UK. It is shown
that the majority of the PV power output in China, Hong Kong and the UK
happened for more than 30 minutes which is much longer than that in
Malaysia. Furthermore, the PV power output reduces gradually. Therefore, the
magnitudes of voltage fluctuation and flickers produced by the photovoltaic
systems are significantly less than that in Malaysia. It is noticed that the life
span of some high PV power output in Thailand is short, less than 5 minutes.
This is because Thailand is close to Malaysia, making this region to be
vulnerable to much passing clouds.
Figure 5.8: International‘s Solar Density Chart
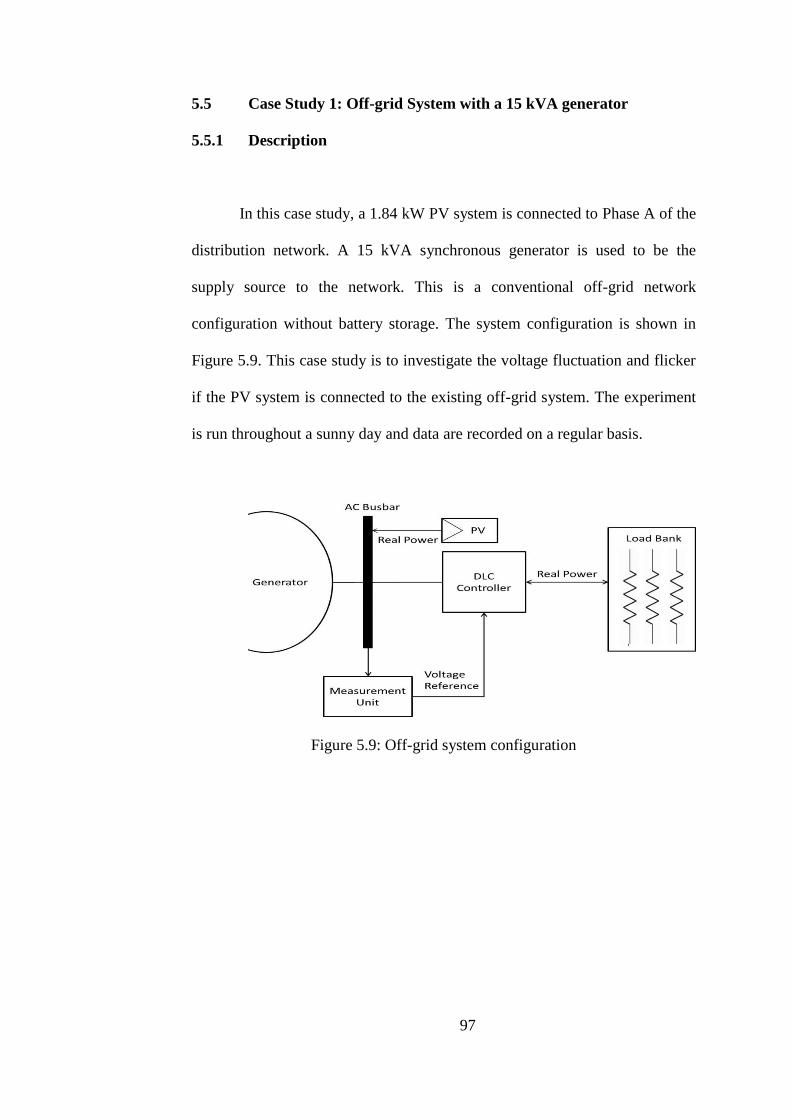
97
5.5 Case Study 1: Off-grid System with a 15 kVA generator
5.5.1 Description
In this case study, a 1.84 kW PV system is connected to Phase A of the
distribution network. A 15 kVA synchronous generator is used to be the
supply source to the network. This is a conventional off-grid network
configuration without battery storage. The system configuration is shown in
Figure 5.9. This case study is to investigate the voltage fluctuation and flicker
if the PV system is connected to the existing off-grid system. The experiment
is run throughout a sunny day and data are recorded on a regular basis.
Figure 5.9: Off-grid system configuration
98
5.5.2 Experiment Results
The experimental results show the effectiveness of the proposed DLC
to reduce the voltage rise of the distribution networks with a high penetration
of PV system. Figure 5.10 shows the voltage at Phase A before and after the
implementation of DLC. The statutory tolerance for voltage excursion on the
LV distribution networks is +5% to -10% with reference to the nominal
voltage of 240V. Before implementing the DLC, the voltage rises up to 252V
which is equivalent to 5.1% above its nominal voltage. The implementation of
DLC manages to reduce the voltage level from 252V to 246 V. The DLC
manages to reduce the voltage rise by 2.5%.

99
(a)
(b)
Figure 5.10: Network voltage magnitude due to the connection of PV on phase
A (a) before and (b) after the implementation of the DLC
The network frequency in the LV network with a high penetration of
PV systems is shown in Figure 5.11. This figure shows that the surplus energy
in the distribution networks can cause the network frequency to rise above
51.7 Hz without any control. The Malaysian standard network frequency
should be maintained at 50Hz ±1%. In this case, the PV system‘s owner can
opt to curtail the excess renewable energies or increase the network
consumption in order to reduce the network frequency back to 50Hz. It is

100
recommended to fully utilize the available renewable energy rather than curtail
it. The proposed DLC is capable of increasing the load consumption
automatically when there is a surplus renewable energy in the networks. After
the DLC, the network frequency level has been reduced. The maximum
frequency after DLC is 50.05Hz.
(a)
(b)
Figure 5.11: Frequency regulation before (a) and after (b) the implementation
of DLC in the LV network with a PV system

101
Figure 5.12 shows the short-tern flicker indices with and without the
DLC. It is shown that all the short-time flicker indices are reduced when the
load controller is implemented. The maximum flicker index is reduced to a
lower value which fulfils the statutory limit. From the case study, the proposed
DLC has proven its effectiveness to mitigate the voltage fluctuation and
flickers.
Figure 5.12: Value of short time flickers produced by 1.84 kW PV system on
the laboratory network
The voltage fluctuation index is further quantified by using the
standard equations (7) as discussed in the previous chapter. Table 5.1 shows
the voltage fluctuation and flicker index of the LV distribution networks
integrated with PV systems before and after the implementation of the
proposed DLC. It is shown that the voltage sensitivity gradient reduces
significantly from 5.75 to 2.66 when the DLC is used to mitigate the voltage
fluctuation of the affected phase caused by the PV system. It is seen that the
voltage fluctuation index reduces from 0.25 V to 0.15 V and the global voltage

102
regulation decreases from 2.35 V to 1.50 V with the DLC. A short-time flicker
of 1.56 calculated without DLC has been reduced to 0.84 with the DLC.
Similarly, a long-time flicker of 0.72 without DLC is further reduced to 0.34
with the DLC. Theses experimental results identify the proposed DLC as an
effective means for reducing both voltage fluctuation and flicker in the utility
grid integrated with PV systems.
Table 5.1: Voltage fluctuation and flicker before and after the use of DLC
Standard Test Statutory Limit Without DLC With DLC
Voltage sensitivity curve NA 5.75 2.66
Voltage fluctuation index NA 0.25 0.15
Global voltage regulation NA 2.35 1.50
Short-time flicker 1.00 1.56 0.84
Long-time flicker 0.65 0.72 0.34
5.6 Case Study 2: On-grid System
5.6.1 Description
This case study is carried out to quantify the voltage fluctuation and
flicker with respect to different capacity of the PV system. For each PV
capacity, the voltage magnitudes on Phase A, B and C at the point of
connection where it is measured and recorded on a regular basis over a period
of several weeks. The collection of data is used to calculate all the voltage
fluctuation, short-time and long-time flicker indices.

103
Among all the short-time flicker indices, the maximum value is chosen
because it represents the worst case scenario at the point of connection. The
PV arrays are connected together through the array adjunction box. Then, the
DC power from the PV panel is injected to the PV inverter in which the DC
power is converted to the AC power output with 240 V at 50 Hz.
The generated AC power is transmitted to the distribution board with
an overcurrent and earth leakage protection before feeding into the energy
meter and utility grid or TNB grid. The block diagram of the Malaysian grid
connected PV system is shown in Figure 5.13. The objective of this case study
is to study the voltage fluctuation, the flicker index caused by the PV systems
and also the background flicker caused by the changing loads. The
experimental network is shown in Figure 5.14.
Figure 5.13: Block diagram of grid connected PV system
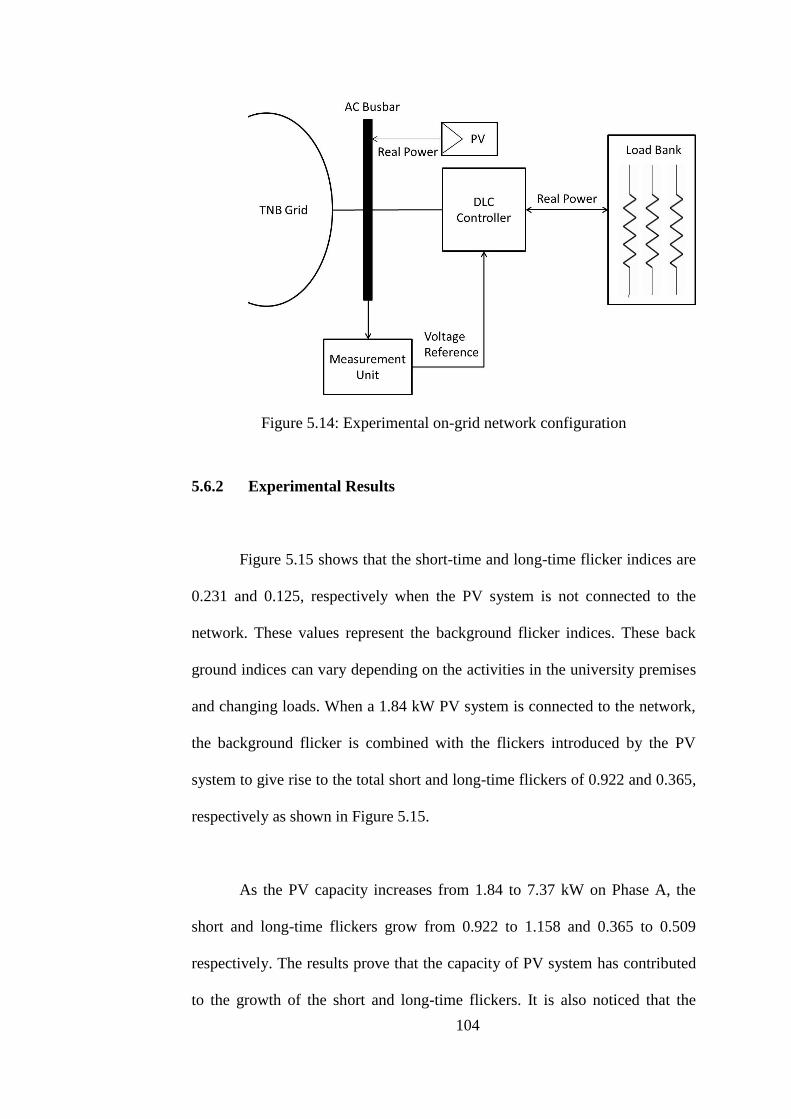
104
Figure 5.14: Experimental on-grid network configuration
5.6.2 Experimental Results
Figure 5.15 shows that the short-time and long-time flicker indices are
0.231 and 0.125, respectively when the PV system is not connected to the
network. These values represent the background flicker indices. These back
ground indices can vary depending on the activities in the university premises
and changing loads. When a 1.84 kW PV system is connected to the network,
the background flicker is combined with the flickers introduced by the PV
system to give rise to the total short and long-time flickers of 0.922 and 0.365,
respectively as shown in Figure 5.15.
As the PV capacity increases from 1.84 to 7.37 kW on Phase A, the
short and long-time flickers grow from 0.922 to 1.158 and 0.365 to 0.509
respectively. The results prove that the capacity of PV system has contributed
to the growth of the short and long-time flickers. It is also noticed that the
105
short-time flicker becomes greater than the statutory limit of 1.0 when the PV
capacity is 7.37 kW. The index is projected to be much higher if the PV
capacity is higher than 7.37 kW.
Figure 5.16 and Figure 5.17 show a significant increase in the short
and long-time flicker indices on Phase B and C even though the PV system is
connected to Phase A. The flickers on Phase A have caused the flicker indices
on Phase B and C to increase. This is because there is mutual coupling or
capacitive linkages between the three phases. Any high magnitude of flickers
and harmonic currents on one phase can propagate to the other phases through
the mutual coupling.
Mutual coupling can occur in any high frequency of the AC power
system when they are exposed to each other. The current on the cable or line
creates electromagnetic (EM) field and this EM field induces current flow on
the other cable exposed to the field. There is EM energy transfer from the first
cable to the second cable whereas, the EM energy on the second cable is
transferred to the third and the first cables. These experimental results show
that the impacts caused by the intermittency of the PV power output can be
widely spread across the distribution network. Therefore, it is very important
to mitigate the flickers caused by the fluctuation of the PV power output.

106
Figure 5.15: Short-time and long-time flicker indices on Phase A with respect
to various capacities of PV
Figure 5.16: Short-time and long-time flicker indices on Phase B with respect
to various capacities of PV

107
Figure 5.17: Short-time and long-time flicker indices on Phase C with respect
to various capacities of PV
Figure 5.18 shows the short-time flicker index with and without DLC.
It is shown that the short time flicker indices are reduced when the DLC is
implemented. In this case, the flicker does not exceed the statutory limit of 1.0
because the utility grid is strong enough to cater with the small amount of PV
power. However, with the increased number and capacity of PVs connected to
the utility grid under the FiT scheme, the negative impacts will become more
significant. This experiment shows that DLC is an effective measure for
reducing the flicker in the LV distribution networks.
The voltage fluctuation and flicker indices are shown in Table 5.2.
These values are quantified to evaluate the effectiveness of the proposed DLC.
The voltage sensitivity gradient of 0.76 and the voltage fluctuation of 0.289V

108
are reduced to 0.51 and 0.130V, respectively after implementing the DLC in
the LV distribution network with PV systems. The global voltage regulation
dropping from 1.397 to 1.229 shows the effectiveness of the DLC in reducing
the voltage fluctuations caused by the intermittent PV power output. The
maximum short-time flicker and long-time flicker are reduced to 0.329 and
0.17, respectively. Even though both the short and long-time flickers are well
within the limit without DLC, the flicker indices are projected to increase as
the PV penetration increased shown in Figure 5.16. These indices prove that
the proposed DLC managed to maintain the voltage fluctuation and flicker
index within the acceptable tolerance.
Figure 5.18: Values of short-time flickers produced by the 1.84 kW PV system
connected to the utility grid

109
Table 5.2: Voltage fluctuation and flicker index for grid connected PV system
Standard Test Statutory Limit Without DLC With DLC
Voltage sensitivity curve NA 0.76 0.51
Voltage fluctuation index NA 0.29 0.13
Global voltage regulation NA 1.40 1.23
Short-time flicker 1.00 0.92 0.33
Long-time flicker 0.65 0.37 0.17
5.7 Case Study 3: Off-grid System with Battery Storage
5.7.1 Description
This case study is carried out to study the severity of voltage
fluctuation and flickers induced by the PVs in an off-grid system when the
battery in the off-grid system is fully charged. The proposed DLC is
implemented to the off-grid system in order to mitigate and reduce the voltage
fluctuation and flicker. In this case, the experimental network is configured as
an off-grid system where the bi-directional inverter, SMA Sunny Island 5048,
coupled with the battery bank is introduced as the supply source. The SMA
Sunny Island 5048 is equipped with the grid forming capability. It is able to
form the grid with 240V AC and 50Hz. A 1.84 kW PV system is connected to
the experimental off grid system. The voltage magnitude is collected
throughout the experiment. The experiment network setup is shown in Figure
5.19. This experiment is performed during a sunny day so that the severity of
the voltage fluctuation and flicker can be analyzed.

110
The set point for the battery state of charge is set to be 80% in order to
protect the battery from overcharge. The SMA Sunny Island will reduce the
charging rate when the SOC is close to 80%. In the case of the battery SOC
hitting 80%, SMA Sunny Island will adjust the network frequency to be higher
resulting to the PV inverter to trip off. This is because the off-grid network
frequency is out of the allowable range for the PV inverter to synchronize. The
Zigor PV inverter‘s working range is from 49.5 Hz to 50.5 Hz which comply
with the Malaysian frequency regulation. Sunny Island has the capability to
instruct the PV inverter to curtail the PV power output when it detects excess
power in the off-grid system. However, this feature is only available if Sunny
Boy is used as the PV inverter together with Sunny Island. In this work, this
feature is not possible due to different branding strategies between the bi-
directional inverter and the PV inverter. Therefore, the PV inverter is
disconnected when Sunny Island raises the off-grid system frequency.
Figure 5.19: Off-grid system integrated with battery storage
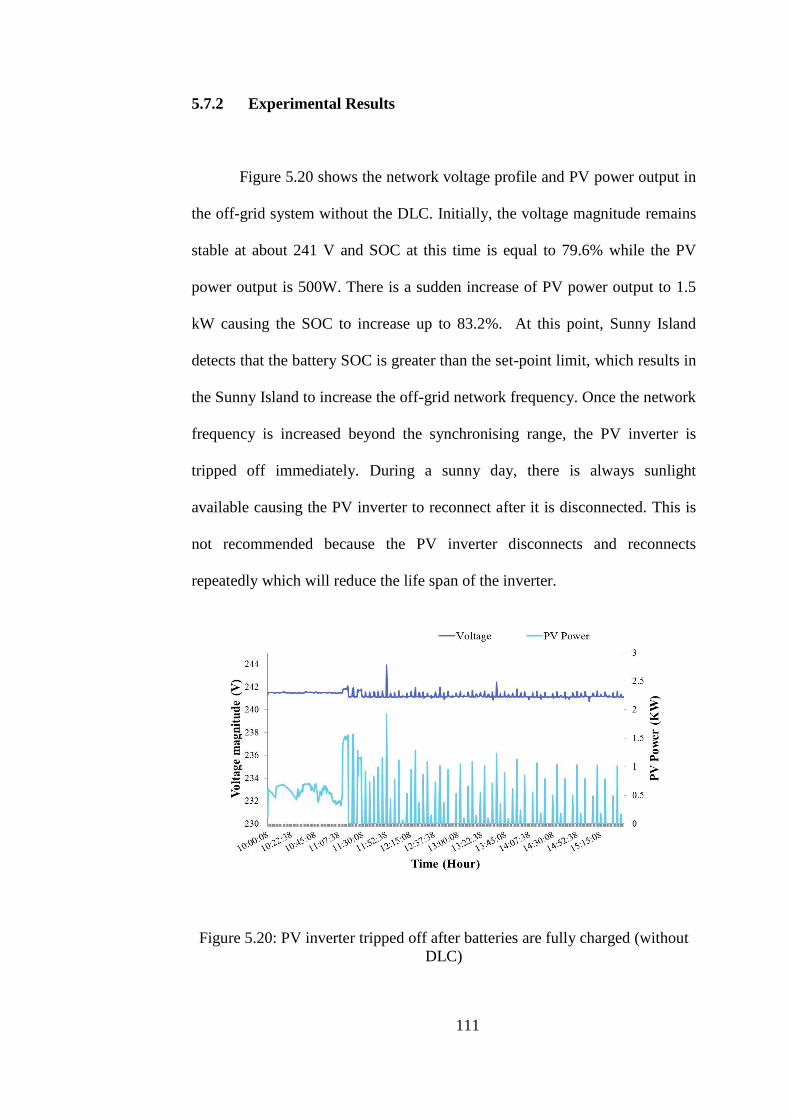
111
5.7.2 Experimental Results
Figure 5.20 shows the network voltage profile and PV power output in
the off-grid system without the DLC. Initially, the voltage magnitude remains
stable at about 241 V and SOC at this time is equal to 79.6% while the PV
power output is 500W. There is a sudden increase of PV power output to 1.5
kW causing the SOC to increase up to 83.2%. At this point, Sunny Island
detects that the battery SOC is greater than the set-point limit, which results in
the Sunny Island to increase the off-grid network frequency. Once the network
frequency is increased beyond the synchronising range, the PV inverter is
tripped off immediately. During a sunny day, there is always sunlight
available causing the PV inverter to reconnect after it is disconnected. This is
not recommended because the PV inverter disconnects and reconnects
repeatedly which will reduce the life span of the inverter.
Figure 5.20: PV inverter tripped off after batteries are fully charged (without
DLC)
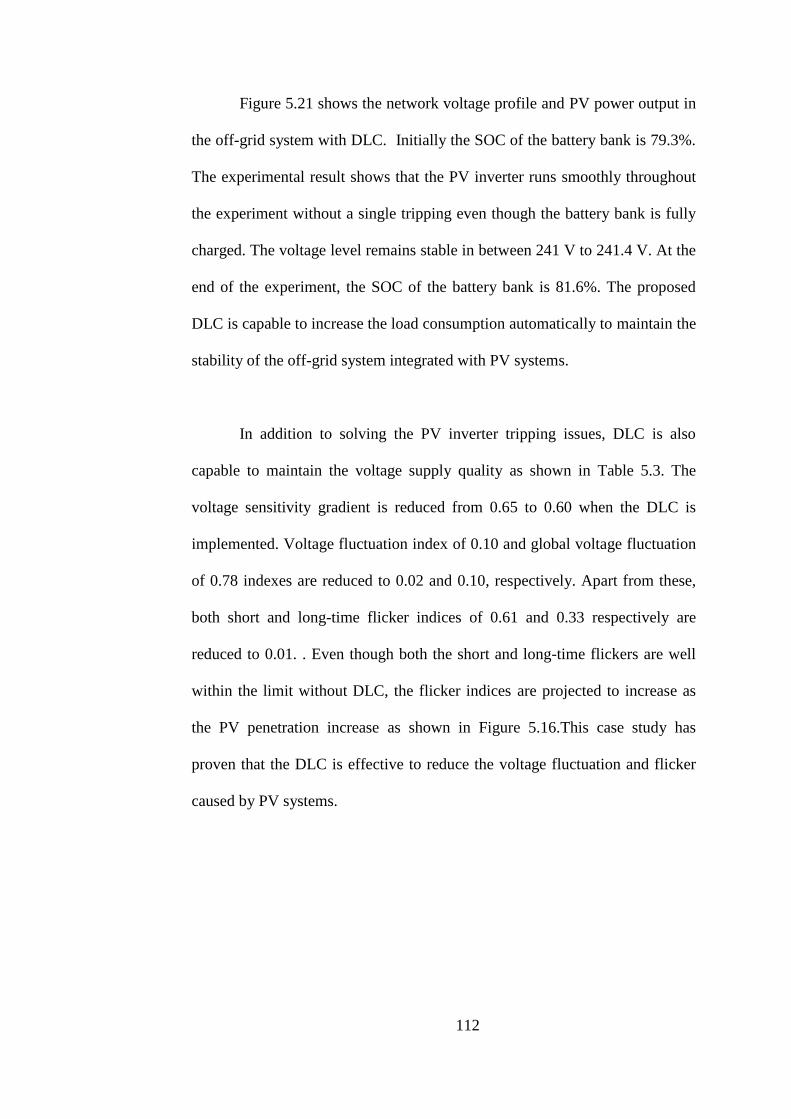
112
Figure 5.21 shows the network voltage profile and PV power output in
the off-grid system with DLC. Initially the SOC of the battery bank is 79.3%.
The experimental result shows that the PV inverter runs smoothly throughout
the experiment without a single tripping even though the battery bank is fully
charged. The voltage level remains stable in between 241 V to 241.4 V. At the
end of the experiment, the SOC of the battery bank is 81.6%. The proposed
DLC is capable to increase the load consumption automatically to maintain the
stability of the off-grid system integrated with PV systems.
In addition to solving the PV inverter tripping issues, DLC is also
capable to maintain the voltage supply quality as shown in Table 5.3. The
voltage sensitivity gradient is reduced from 0.65 to 0.60 when the DLC is
implemented. Voltage fluctuation index of 0.10 and global voltage fluctuation
of 0.78 indexes are reduced to 0.02 and 0.10, respectively. Apart from these,
both short and long-time flicker indices of 0.61 and 0.33 respectively are
reduced to 0.01. . Even though both the short and long-time flickers are well
within the limit without DLC, the flicker indices are projected to increase as
the PV penetration increase as shown in Figure 5.16.This case study has
proven that the DLC is effective to reduce the voltage fluctuation and flicker
caused by PV systems.

113
Figure 5.21: PV power output and inverter‘s status with the DLC
Table 5.3: Voltage quality in off-grid system integrated with PV
Standard Test Statutory Limit Without DLC With DLC
Voltage sensitivity curve NA 0.65 0.60
Voltage fluctuation index NA 0.10 0.02
Global voltage regulation NA 0.78 0.10
Short-time flicker 1.00 0.61 0.01
Long-time flicker 0.65 0.33 0.01
5.8 Conclusion
Malaysia is a tropical country with abundant sunlight. However,
climatological data shows that Malaysia is one of the cloudiest countries in the
world. This causes the solar irradiation to be highly scattered and fluctuating,
hence making the PV power output to be very intermittent. A solar density
chart is useful to give a quantitative impression of the PV system‘s
performance. Each element in the solar density chart gives the number of

114
occurrences with magnitude and duration. The Solar density charts for sunny,
cloudy and rainy days in Malaysia are identified. Sunny day will have higher
PV power output with short duration. The majority of PV power output in a
cloudy day is intermediate with longer duration. Whilst, rainy day has a very
low PV power output with long duration.
Variable PV power output causes the voltage fluctuation and flicker in
the LV distribution network. The most severe voltage fluctuation occurs when
the system is configured as off grid without battery storage. This is followed
by the grid connected PV system and off-grid system integrated with battery
storage. During off-grid configuration, the PV inverter is tripped off when the
battery integrated with the off-grid system is fully charged. Short-time and
long-time flickers are the highest in an off-grid system. It is seen that the
collected data in an off-grid system has violated the acceptable tolerance listed
in IEC 61000 3-3 as compared to the other network configurations. The
proposed DLC is an effective means to mitigate the voltage fluctuation and
flicker in the LV distribution networks, both on-grid and off-grid.
DLC is an effective means of reducing voltage fluctuation and flicker
by switching on or off the power resistor very rapidly to compensate the
sudden increase or decrease in the PV power output. The DLC activates the
power resistor or load when there is an excess power in the network and vice
versa. DLC works well in both on-grid and off-grid systems. Without DLC,
short-time flicker index in off-grid system with PV is 1.56 whilst, long-time
flicker is 0.71. These values deviate from the allowable limit set by IEC

115
61000-3-3 standard. The voltage fluctuation and flicker index are reduced
below the statutory limit with the use of DLC.

116
CHAPTER 6
EVALUATION OF THE SURVEY RESULT: MALAYSIAN ENERGY
EFFICIENCY INITIATIVE AND VIABILITY OF DLC
IMPLEMENTATION
6.1 Introduction
The conventional direct load control is part of the demand side
management by the utility company to control the peak demand on the
national grid and to prevent a major blackout. A novel DLC method is
proposed to mitigate the voltage fluctuation and flicker problems as described
in Chapter 5. DLC involves the participation of both the utility and consumers.
However, consumers play a major role in the DLC program. EE and DLC are
widely recognized as an effective means of improving the power system
quality and security. However, the implementation of DLC is relatively low in
Malaysia. Therefore, beyond studies on the technical aspects of the DLC, it
requires a transition of the electricity consumers‘ behavior and also the
awareness of EE and DLC among them. Hence, surveys are conducted to
study the social and psychological impacts of DLC. Specifically, this survey is
conducted to improve the understanding on how consumers perceive, and
respond to the EE and DLC implementation in Malaysia. This chapter
illustrates the survey design, the Malaysian EE behavioral aspects and also
DLC acceptance level. It contributes to the literature by providing a better

117
understanding on the perceptions and behavior of the electricity consumers
about the possible deployment of DLC. This is the first public survey that is
carried out in Malaysia focusing on EE and DLC.
6.2 Survey Design
The designed questionnaire is distributed among the residents in
Malaysia. The surveys are conducted through an online tool, namely
KwikSurvey. Initially, a sample size calculator from the Creative Research
Systems is utilized to determine the sample size of the survey. The sample size
reflects the numbers of survey that needs to be conducted. To calculate the
sample size of the survey, the Malaysian population, confidence level and
error margin are the input data to the calculator. The confidence level indicates
the percentage of the certainty in this survey. Therefore, a confidence level
and error margin is set to be 95% and 3%, respectively. To achieve 95% of
the confidence level with a 3% error margin, approximately 1000 survey are
required, out of 28 million residents in Malaysia. A total of 1000 surveys are
distributed. Unfortunately, 10 of the 1000 residents did not finish the survey
questions. Hence the total sample collected is 990.
The questionnaire consists of two sections. The first section assessed
the awareness of Malaysians on monthly electricity consumption,
environmental pollution due to electricity generation and energy conservation
habits. Close ended questions are listed in this part in which the respondents

118
have a choice of yes/no to express their awareness. The second section has the
questionnaire on the acceptance level of the respondents on DLC with and
without incentives. The respondent is required to express his/her willingness
based on a scale of one to five points. FIVE represents that they are willing to
do so and totally agree with it while ONE represents that they do not agree to
do so and not likely to be involved. Each question is also measured as the
mean response. The mean value below three indicates a negative response
while more than three indicates a positive response from the respondents.
Overall, we have 55% of female respondents and 45% male
respondents in this survey. This survey analysis is based on the respondents‘
current location, whether they are from Peninsular Malaysia, Sabah or
Sarawak. An analysis on the difference between the residents of the Western
region (Peninsular Malaysia) and the Eastern region (Sabah and Sarawak) is
conducted. The survey targeted youngsters as the author foresees DSM and EE
as the future trends of an active management system of distribution networks.
Therefore, 69% of the young respondents are between 20 to 30 years old as
shown in Figure 6.1. Table 6.1 shows the respondents‘ details based on their
current location, gender and age level. Figure 6.2 shows that 41% and 24% of
the respondents are likely and very likely to participate in the energy
efficiency related activities, respectively. This result shows the positive
response from Malaysian youngsters to go for energy efficiency. A sample of
the survey is shown in Appendix A.
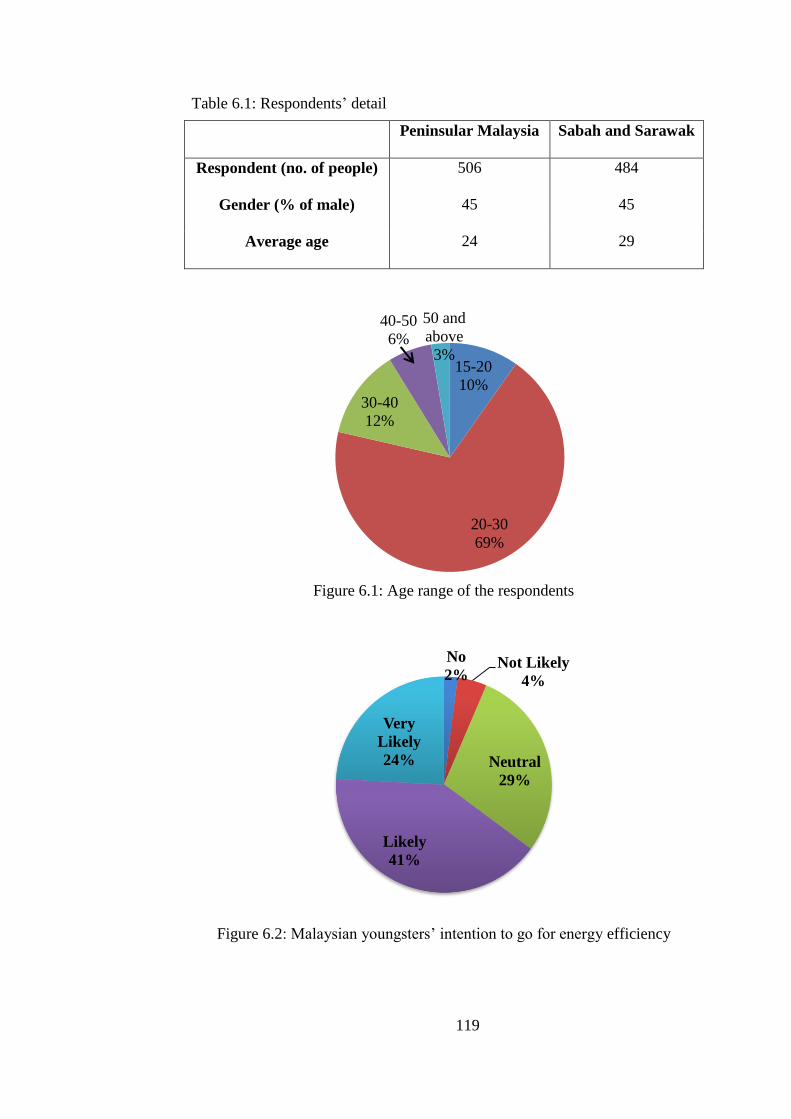
119
Table 6.1: Respondents‘ detail
Peninsular Malaysia Sabah and Sarawak
Respondent (no. of people) 506 484
Gender (% of male) 45 45
Average age 24 29
Figure 6.1: Age range of the respondents
Figure 6.2: Malaysian youngsters‘ intention to go for energy efficiency
15-20
10%
20-30
69%
30-40
12%
40-50
6%
50 and
above
3%
No
2% Not Likely
4%
Neutral
29%
Likely
41%
Very
Likely
24%

120
6.3 Malaysian Energy Efficiency Initiative
6.3.1 Awareness on Monthly Energy Bill
As a consumer, it is important to have awareness on the electricity
consumption. Unnecessary usage can be reduced through the awareness. In
Malaysia, the utility company has a fee structure that reflects the consumption
amount in kWh and the total amount of the electricity bill. It is encouraged to
be aware of our own electricity consumption, and by knowing the
consumption breakdown enables consumers to reduce the electricity
consumption. Table 6.2 shows the awareness of Malaysians on their
electricity consumption and amount paid. The survey results show that 76% of
the total respondents are aware of their electricity bill while 63% of the
respondents are aware of their monthly electricity consumption. This result
shows that Malaysians are more concerned about the amount to pay for
electricity bill rather than the amount of energy consumed. Residents in Sabah
and Sarawak are more concerned about their electricity bill as compared to
Peninsula Malaysia. Figure 6.3 shows that 58% of the Malaysians are aware of
the monthly electricity consumption in kilowatt-hour and money paid to the
utility company. About 19% of the respondents neither know their electricity
consumption nor the total amount they pay. A majority of those who know
their electricity bill are aware of the energy consumption in kWh.
Consequently, Malaysians have a very high awareness on the electricity
consumptions and their electricity bill.
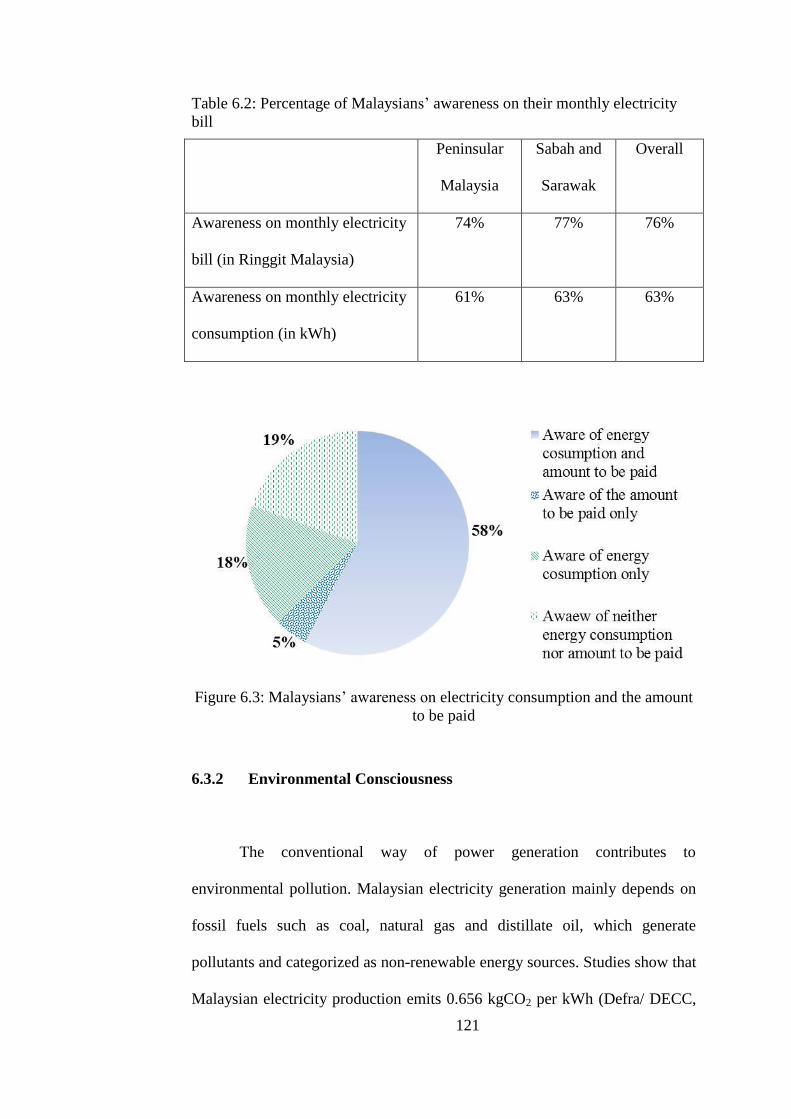
121
Table 6.2: Percentage of Malaysians‘ awareness on their monthly electricity
bill
Peninsular
Malaysia
Sabah and
Sarawak
Overall
Awareness on monthly electricity
bill (in Ringgit Malaysia)
74% 77% 76%
Awareness on monthly electricity
consumption (in kWh)
61% 63% 63%
Figure 6.3: Malaysians‘ awareness on electricity consumption and the amount
to be paid
6.3.2 Environmental Consciousness
The conventional way of power generation contributes to
environmental pollution. Malaysian electricity generation mainly depends on
fossil fuels such as coal, natural gas and distillate oil, which generate
pollutants and categorized as non-renewable energy sources. Studies show that
Malaysian electricity production emits 0.656 kgCO2 per kWh (Defra/ DECC,

122
2012). According to the previous research by Steg, (2008), people often do not
acknowledge the relationship between energy use and environmental pollution.
So they fail to see the necessity of energy saving. The consciousness of
Malaysians on the pollution caused by the power generation was assessed in
this survey. Table 6.3 shows that 77% of the total respondents know that
electric power production cause GHG emission and pollute the environment. It
is noticed that people in Peninsular Malaysia have a slightly higher
environmental consciousness compared to that of Sabah and Sarawak. Figure
6.4 shows that only 44% of the 77% respondents who know that electric
generation produce pollutant are willing to spend additional money to
purchase energy efficiency products. These results show that most of the
Malaysians recognize the relationship between environmental pollution and
the use of electricity but lack of initiative to purchase EE products. This might
be because of the higher price of EE products compared to the conventional
appliances.
Table 6.3: The environmental consciousness from the respondents in Malaysia
Peninsular
Malaysia
Sabah and
Sarawak
Overall
Knowledge that electricity
generation causes pollution
78% 76% 77%

123
Figure 6.4: Respondents‘ willingness to purchase EE products with respect to
environment consciousness
6.3.3 Energy Conservation Behaviour
Switch-off an appliance when it is not in use. This should be the first
step for energy management. Energy conservation refers to the habit of
reducing energy consumption by using less energy. Table 6.4 shows the
survey results of the respondents on conservation behavior in Malaysia. The
result indicates that a relatively high percentage of the respondents tend to turn
off home appliances that are not in use. The percentage of energy conservation
behavior is the same in the Western and Eastern regions of Malaysia which is
89%. Figure 6.5 shows a majority of the people (72% out of the 77%) who
know that electricity generation causes environmental pollution have the
initiative to switch off the appliances that are not in use.

124
Table 6.4: Malaysian behaviour on conservation of energy
Peninsular
Malaysia
Sabah and
Sarawak
Overall
Turn off home appliances
when it is not in use
89% 89% 89%
Figure 6.5: Energy conservation behaviour with respect to environmental
consciousness
6.4 DLC Acceptance Level
From a utility company perspective, a DLC could help to reduce peak
demand, reduce energy generation cost and hence increases organization
revenue. However, the implementation of DLC depends on the willingness of
electricity consumers to accept them. DLC control might have a negative
impact on the consumer‘s comfort and convenience. A research by Zhang et
al., (2011) showed that the consumer is willing to accept DLC if the effect on
the consumer is insignificant, for example short interruption time. DLC refers
to mechanisms to manage the customer‘s power demand based on the electric
power grid conditions. There has been a recent upsurge in the interest and

125
activity of smart grid, primarily due to the increasing penetration level of
renewable energy resources such as solar and wind energies. The DLC
enhances the connectivity between utility and customer and hence, enabling a
more flexible power system.
6.4.1 DLC without Incentive
In this survey, the DLC programs refer to the programs in which utility
can remotely shut down or control a customer‘s electrical equipment
especially water heater or thermal storage to address voltage fluctuation and
flicker caused by the variable power output from the PV systems. To explore
the acceptability of DLC in Malaysia, a survey is conducted and the result is
shown in Figure 6.6. The mean value of the point given by the respondents is
calculated as follow:-
respondentofNumber
srespondentfromPoMean
int (12)
Table 6.5 shows the mean value of the Malaysian acceptance level of
DLC. The survey shows that the acceptance level of DLC among the
respondents in Malaysia is 2.51. This mean the value indicates that Malaysians
give a negative response and are not ready for the DLC deployment. However,
the survey results show that the respondents from the Peninsular Malaysia are
more willing to accept the implementation of DLC as compared to that of
Sabah and Sarawak.

126
Table 6.5: Mean value of Malaysian acceptance level of DLC
Peninsular
Malaysia
Sabah and
Sarawak
Overall
Mean value of
acceptance level of DLC
2.57 2.45 2.51
Figure 6.6: Acceptance level of DLC in Malaysia
6.4.2 DLC with Incentive
An incentive based DLC provides motivation for participating
customers to allow a third party to control their home appliances, for example,
water heater and thermal storage. Past research shows that fostering demand
response through incentive based programs will help to improve efficiency,
reliability and sustainability (William, 2009). Further questions sought to
determine the user response on DLC implementation with incentive. Figure
6.7 shows that Malaysians have a positive response on the DLC
implementation with incentive. A mode value of 4 indicates that consumers
231
265
298
146
50
0
50
100
150
200
250
300
350
Strongly
Disagree
Disagree Neutral Agree Strongly
Agree
# o
f R
esp
on
den
ts
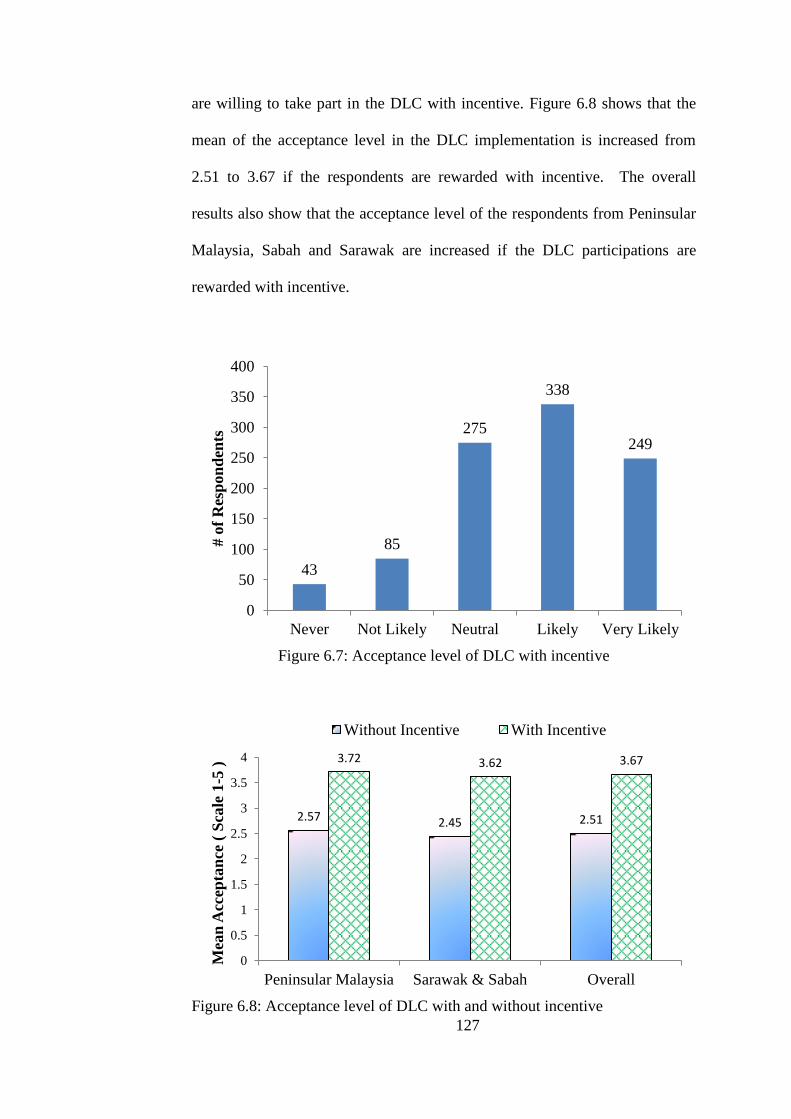
127
are willing to take part in the DLC with incentive. Figure 6.8 shows that the
mean of the acceptance level in the DLC implementation is increased from
2.51 to 3.67 if the respondents are rewarded with incentive. The overall
results also show that the acceptance level of the respondents from Peninsular
Malaysia, Sabah and Sarawak are increased if the DLC participations are
rewarded with incentive.
Figure 6.7: Acceptance level of DLC with incentive
Figure 6.8: Acceptance level of DLC with and without incentive
43
85
275
338
249
0
50
100
150
200
250
300
350
400
Never Not Likely Neutral Likely Very Likely
# o
f R
esp
on
den
ts
2.57 2.45 2.51
3.72 3.62 3.67
0
0.5
1
1.5
2
2.5
3
3.5
4
Peninsular Malaysia Sarawak & Sabah Overall
Mea
n A
ccep
tan
ce (
Sca
le 1
-5 )
Without Incentive With Incentive

128
6.4.3 DLC with lower electricity tariff
In addition to the given incentive for DLC participation, utility can opt
to lower the electricity tariff for those who take part in the DLC program. This
survey further studies the response to the DLC program if the electricity tariff
is reduced as a reward for the DLC participation. Figure 6.9 shows that there is
a positive response from the respondents on this option. Overall, the survey
results show that Malaysians are willing to join the DLC program if they are
rewarded with a reduced electricity tariff. Figure 6.10 shows the comparison
between the acceptance level of the respondents on the DLC participation with
a normal electricity tariff and a reduced tariff.
Figure 6.9: Malaysians‘ response to DLC implementation by giving a reduced
electricity tariff
54 89
295
347
205
0
50
100
150
200
250
300
350
400
Never Not Likely Neutral Likely Very Likely
# o
f R
esp
on
den
ts

129
Figure 6.10: DLC implementation with normal and reduced electricity tariff
6.5 Conclusion
A survey questionnaire is designed to study the social response on
Malaysians‘ EE consciousness and DLC acceptance level. A total of 990
samples are collected with a confidence level of 95% and an error margin of
3%. Majority of the respondents are youngsters aged between 20-30 years.
The level of electricity consumption awareness is nearly the same in the
western and eastern regions of Malaysia. Only 5% of the respondents are not
aware of their own electricity consumption and the total amount of their
electricity bill. In the context of environmental consciousness, 77% of the
Malaysians are aware of the relationship between energy use and
environmental pollution. 89% of the respondents have the energy conservation
habit such as switch off the appliances when not in use. Overall, Malaysians
have a high EE initiative, environment consciousness and energy conservation
habit.
2.57 2.45 2.51
3.57 3.56 3.57
0
0.5
1
1.5
2
2.5
3
3.5
4
Peninsular Malaysia Sarawak & Sabah Overall
Me
an A
cce
pta
nce
( S
cale
1-5
)
Normal Tariff Lower Tariff
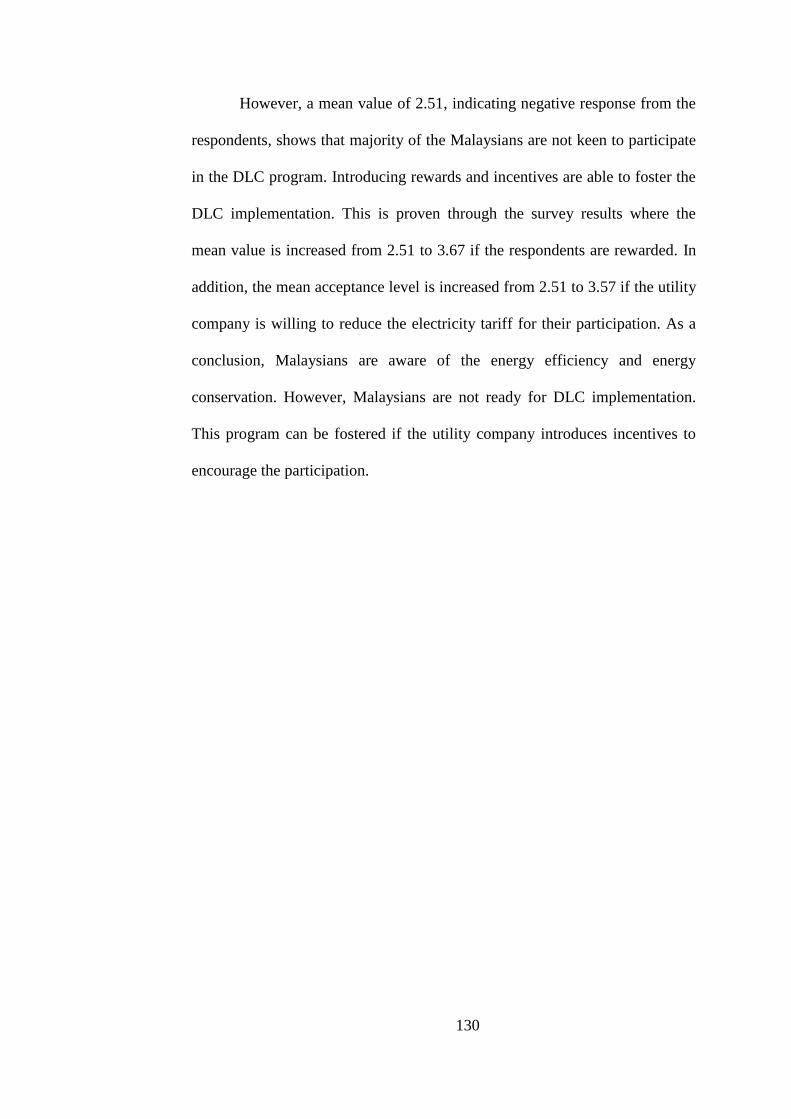
130
However, a mean value of 2.51, indicating negative response from the
respondents, shows that majority of the Malaysians are not keen to participate
in the DLC program. Introducing rewards and incentives are able to foster the
DLC implementation. This is proven through the survey results where the
mean value is increased from 2.51 to 3.67 if the respondents are rewarded. In
addition, the mean acceptance level is increased from 2.51 to 3.57 if the utility
company is willing to reduce the electricity tariff for their participation. As a
conclusion, Malaysians are aware of the energy efficiency and energy
conservation. However, Malaysians are not ready for DLC implementation.
This program can be fostered if the utility company introduces incentives to
encourage the participation.
131
CHAPTER 7
DISCUSSION AND CONCLUSIONS
7.1 Discussion
Photovoltaic systems are recognized as a potential renewable energy
source in many countries especially in the tropical regions because of the large
amount of solar irradiation available throughout the year. However, some of
the tropical countries are surrounded by the sea. Therefore, an enormous
amount of clouds are generated by the warm air and then carried to the main
land by the seasonal winds. The passing clouds can shade the photovoltaic
systems, causing the PV power output to fluctuate frequently throughout the
day. The substantial fluctuation of the PV power output can cause the voltage
magnitude to vary, and hence resulting in flickers to the customers. These
flickers can be an issue of great concern.
The simulation result shows that non-centrally planned PV distribution
can cause serious technical problems as compared to that of centrally planned
PV system installation. It can also be noticed that the voltage supply quality
can be degraded by the growth of PV systems without proper coordination
before installation. To allow for more grid connected PV systems, a pre-
installation study should be performed and planned. The allowable PV
capacity that can be installed in commercial networks under centrally and non-

132
centrally planned PV without violating any of the technical issues were found
to be 8.0 kW and 3.0 kW, respectively. In the residential networks, the
allowable PV capacity without violating any technical issues is 1.0 kW for non
–centrally planned PV systems and 7.0 kW for centrally planned PV systems
distribution.
The voltage fluctuation and flicker emission have been identified as the
major concerns in the Malaysian LV distribution networks integrated with PV
systems. This is because of the intermittent PV power output in Malaysia due
to the passing clouds. This dissertation has proposed a method to mitigate the
voltage fluctuation and flicker caused by the fluctuating PV power output.
In this research, the PV power output and the voltage magnitude are
measured and recorded on a regular basis over a period of time. The collected
data shows the characteristics of the PV power output in Malaysia. It is shown
that majority of the peak PV power output are within short durations. The PV
power output changes very frequently and rapidly. This is caused by the large
number of clouds passing over the PV panel that reduces the solar irradiation
substantially.
The short and long-time flickers with respect to various PV capacities
and voltage fluctuations are calculated based on the collected data. The
experimental results show that the severities of the flickers grow as the PV
capacity is increased. Some of the short-time flickers even exceed the statutory
limits. In addition, the presence of the mutual coupling establishes an

133
electrical connection between phases. As a result, any severe flicker that
occurs on one phase can propagate to the other two phases through the mutual
coupling between them. Therefore, the effects of the flickers can be widely
spread out across the LV distribution networks.
A novel direct load controller is proposed to mitigate the voltage
fluctuations, and hence the short and long time flickers. The proposed DLC is
simple, cheap and effective. It consists of several resistors and solid state
relays. The DLC is designed in such a way that it provides a dynamic response
to the rapid voltage change. The DLC activates and deactivates the resistors
very rapidly in order to compensate the voltage fluctuation and flickers. The
load controller makes use of the real power to change the network voltage
because real power always has a higher influence as compared to that of the
reactive power, due to the higher resistive characteristics of the network.
Therefore, the reactive load does not give a big impact when comes to low
voltage distribution networks.
The proposed DLC is used to mitigate the voltage fluctuation and
flicker on LV distribution networks. However, the implementation needs the
participation from electricity consumers. A survey is designed to investigate
the response from Malaysian customers to implement such DLC to control
their home appliances. This survey is important to identify whether the
Malaysian market is ready for demand side management. Through the survey
results, we can conclude that it is possible to implement DLC if the electricity
consumers are rewarded for their participation.
134
7.2 Key findings
The key findings of this research study are listed as follows:-
- The technical issues caused by the non-centrally planned PV
system include voltage rise, voltage unbalance and reverse
power flow. However, the PV system improves the voltage
profile and reduces the total network power losses if the total
PV capacity does not exceed the power demand.
- Malaysia is one of the cloudiest countries in the world; many
high PV power outputs occur within a short duration, less than
5 minutes. High PV power outputs drop down suddenly instead
of gradually.
- The intermittent power output from PV system generates a
large amount of voltage fluctuation and flicker. The voltage
fluctuation and flicker are proportional to the capacity of PV
system. As the capacity of PV increases, the voltage fluctuation
and flicker also increase.
The voltage fluctuation and flicker reduce the power supply quality.
Hence, it is important to mitigate the voltage fluctuation and flicker for on-
grid and off-grid PV systems. The experimental results show that the voltage
fluctuation and flicker can be effectively reduced by the proposed DLC. Short
and long –time flickers are reduced within the statutory limit of 1.0 and 0.65

135
respectively. A DLC is proposed in this dissertation mainly because, its
component is cheap, and also it is an effective means for reducing the voltage
fluctuation and flicker by switching the power resistor on and off very rapidly
to compensate the sudden increase or decrease in the PV power output.
Beside the technical aspect, the DLC program involves social and
psychological aspects on the customer side. Hence a survey questionnaire is
distributed. The survey result shows that Malaysians are aware of their
electricity bill, practice energy conservation and have environmental
consciousness. The DLC program is viable in Malaysia only if customers are
rewarded with incentives or with a reduced electricity tariff for the
participation in DLC program. 58% of the respondents are willing to
participate in the DLC program if they are monetary rewarded.

136
7.3 Publication
The findings from this research have been published/submitted to the
following journals by this author:
No Title Journal Status
1. Impacts of centrally and non-
centrally planned distributed
generation on low voltage
distribution networks.
International Journal
of Smart Grid and
Clean Energy, vol. 1,
no. 1, September 2012,
pp. 60-66.
ISSN 2315-4462
Published
2. Grid-connected photovoltaic
system in Malaysia: A review
on voltage issues.
Renewable and
Sustainable Energy
Reviews, vol. 29,
January 2013, pp. 535-
545.
Published
3. Experimental study on flicker
emissions by photovoltaic
systems on highly cloudy
region: A case study in
Malaysia.
Renewable Energy Accepted

137
7.4 Future work
The current work focuses only on voltage fluctuation and flicker
caused by the intermittent power output from the PV system. In addition to the
PV system, future study can include the wind energy which is also a
renewable energy source with intermittent characteristics. Apart from this, the
harmonics from the PV inverter can be studied.
This study uses a controllable load bank to evaluate the effectiveness
of the DLC to mitigate voltage fluctuation and flicker. In future, a controllable
real domestic load that is suitable for this application is to be identified.
Besides that, the current experiment is carried out in the lab scale LV
distribution network. The proposed DLC can be tested and validated directly
at utility LV distribution networks, where it matters.

138
REFERENCES:
Abdul Muhaimin, M. (2010). Evaluation of the solar hybrid systems for rural
schools in Sabah, Malaysia. Master Thesis. Oldenburg, Germany: Carl von
Ossietzky University.
Albarracín, R. & Hortensia, A., (n.d). Power quality in distribution power
networks with photovoltaic energy source. In International Conference on
Environment and Electrical Engineering.
Ammar, M., (2012). Flicker Emission of distributed wind power: A review of
impacts, modeling, grid codes and mitigation techniques. In Power and
Energy Society General Meeting., 2012. IEEE.
Arthur, D.L., (1999). Distributed generation: Policy framework for regulators.
White paper.
Aziz, T., Hossain, M.J., Saha, T.K. & Mithulananthan, N.., (2013). VAR
Planning With Tuning of STATCOM in a DG Integrated Industrial System. In
IEEE Transactions on Power Delivery., 2013. IEEE.
Basso, T.S., (2008). High penetration, grid-connected photovoltaic technology
codes and standards. In 33rd IEEE Photovoltaic Specialists Conference., 2008.
IEEE.

139
Baxter, R., (2005). Energy Storage: A Nontechnical Guide. PennWell
Corporation.
Benjamin, K.S. & Scott, V.V., (2011). Bending bamboo: Restructuring rural
electrification in Sarawak, Malaysia. Energy for Sustainable Development,
15(3), pp.240-53.
Carvalho, P.M.S., Correia, P.F. & Ferreira, L.A.F., (2008). Distributed
Reactive Power Generation Control for Voltage Rise Mitigation in
Distribution Networks. IEEE Transactions on Power Systems, 23(2), pp.766-
72.
Castillo, J., (2011). Small scale vertical axis wind turbine design. Bachelor's
thesis. Tampere University of Applied Sciences.
Che Khalib, M.N., (2012). Institute of Diplomacy and Foreign Relations
Malaysia. [Online] Available at:
http://www.idfr.gov.my/nuclear/overviewenergy.pdf [Accessed 26 February
2013].
Chidi, M., Ipinnimo, O., Chowdhury, S. & Chowdhury, S.P., (2012).
Investigation of impact of integrating on-grid home based solar power systems
on voltage rise in the utility network. In Power and Energy Society General
Meeting., 2012. IEEE.

140
Choong, M.Y., (2012). Harnessing rooftops to generate solar power. The Star,
16 October.
Chua, K.H. et al., (2012). Energy Storage System for Mitigating Voltage
Unbalance on Low-Voltage Networks With Photovoltaic Systems. IEEE
Transactions on Power Delivery, 27(4), pp.1783-90.
Cipcigan, L.M. & Taylor, P.C., (2007). Investigation of the reverse power
flow requirements of high penetrations of small-scale embedded generation.
IET Renewable Power Generation, 1(3), pp.160-66.
D.Little, A., (1999). Distributed generation: Policy framework for regulators.
White paper.
Defra/ DECC, (2012). Guidelines to Defra/DECC's GHG Conversion Factors
for Company Reporting. [Online] (1.0) Available at:
http://www.defra.gov.uk/publications/files/pb13773-ghg-conversion-factors-
2012.pdf [Accessed 2013 March 26].
Degobert, P., Kreuawan, S. & Guillaud, X., (2006). Use of super capacitors to
reduce the fast fluctuations of power of a hybrid system composed of
photovoltaic and micro turbine. In International Symposium on Power
Electronics, Electrical Drives, Automation and Motion., 2006. IEEE.

141
Deokar, S.A. & Waghmare, D.L.M., (2010). Induction motor voltage flicker
analysis and its mitigation measures using custom power devices: A case
study. International Journal of Engineering Science and Technology, 2(12),
pp.7626-40.
Elnady, A. & Salama, M.M.A., (2007). Mitigation of the voltage fluctuations
using an efficient disturbance extraction technique. Electric Power System
Research, (77), pp.266-75.
Energy Commission, (2010). Electricity supply industry in Malaysia.
Performance and Statistical Information. Putrajaya: Energy Commission.
Energypedia, (2012). Solar cells and modules. [Online] Available at:
https://energypedia.info/wiki/Solar_Cells_and_Modules [Accessed 28
February 2013].
Farid, K., Konrad, M. & Lisa, D.-B., (2006). Integration of Photovoltaic
Power Systems in High Penetration Clusters for Distribution Networks and
Mini-Grids. International Journal of Distributed Energy Resources, 3(3),
pp.207-23.
Fuel Cells 2000's, (2013). Fuel cells & Hydrogen. [Online] Available at:
http://www.fuelcells.org/fuel-cells-and-hydrogen/ [Accessed 28 February
2013].

142
Guinane, A., Shafiullah, G.M., Oo, A.M.T. & Harvey, B.E., (2012). Voltage
fluctuations in PV penetration on SWER networks — A case study for
regional Australia. In IEEE Power and Energy Society General Meeting.,
2012. IEEE.
Hamidi, V., (2007). New control methods in demand side management to
improve the security of supply in the UK‘s electricity network. In 42nd
International Universities Power Engineering Conference., 2007. IEEE.
Hannes, R., (2003). HAWT versus VAWT: Small VAWTs find a clear niche.
Refocus, July. pp.44-46.
Han, J. & Piette, M.A., (2008). Solutions for summer electric power shortages:
demand response and its applications in air conditioning and refrigerating
systems. Regrigeration, Air Conditioning, & electric Power Machinery, 29(1),
pp.1-4.
Hingorani, N.G., (1991). FACTS-flexible AC transmission system. In
International conference on AC and DC power transmission., 1991. IEEE.
Hu, W., Chen, Z., Wang, Y. & Wang, Z., (2009). Flicker Mitigation by Active
Power Control of Variable-Speed Wind Turbines With Full-Scale Back-to-
Back Power Converters. IEEE Transactions on Energy Conversion, 24(3),
pp.640-49.

143
Hussin, M.Z. et al., (2011). Status of a grid-connected MBIPV project in
Malaysia. In 3rd International Symposium & Exhibition Sustainable Energy &
Environment., 2011. IEEE.
Ipinnimo, O., Chowdhury, S. & Chowdhury, S.P., (2012). Effects of
renewable distributed generation (RDG) on voltage dip mitigation in
microgrids. In 11th International Conference on Developments in Power
Systems Protection., 2012. IEEE.
Javed, F. et al., (2012). Forecasting for demand response in smart grids: An
analysis on use of anthropologic and structural data and short term multiple
loads forecasting. Applied Energy, 96, pp.150-60.
Jones, C.V., (1967). The unified theory of electrical machines. Butterworths.
Joorabian, M., Mirabbasi, D. & Sina, A., 2009. Voltage flicker compensation
using STATCOM. In 4th IEEE Conference on Industrial Electronics and
Applications., 2009. IEEE.
Koh, S.L. & Lim, Y.S., (2010). Meeting energy demand in a developing
economy without damaging the environment—A case study in Sabah,
Malaysia, from technical, environmental and economic perspectives. Energy
Policy, 38(8), pp.4719-28.

144
Koh, S.L., Lim, Y.S. & Morris, S., (2011). Cost Effective Options for
Greenhouse Gas (GHG) Emission Reduction in the Power Sector for
Developing Economies — A Case Study in Sabah, Malaysia. Energies, 4(5),
pp.780-803.
Konstantinos, A., (2004). Integration of distributed generation in low voltage
networks: Power quality and economics. Master Thesis. Glasgow: University
of Strathclyde.
Lim, Y.S., Lalchand, G. & Gladys Mak, S.L., (2008). Economical,
environmental and technical analysis of building integrated photovoltaic
systems in Malaysia. Energy Policy, 36(6), pp.2130-42.
Lim, Y.S. & Philip, T., (2007). Innovative application of demand side
management to power systems. In First International Conference on
Industrial and Information Systems. Sri Lanka, 2007. IEEE.
Li, N., Zhang, J. & Yun Zhong, (2008). A novel charging control scheme for
super capacitor energy storage in photovoltaic generation system. In Third
International Conference on Electric Utility Deregulation and Restructuring
and Power Technologies., 2008. IEEE.
Loo, C.K., (2005). Interconnection of Embedded Generation: The Malaysian
Experience. In 18th International Conference on Electricity Distribution.
Turin, 2005. IEEE.

145
Loo, C.K., (2005). Interconnection of embedded generation: the Malaysian
experience. In 18th International Conference on Electricity Distribution. Turin,
2005. CRIED.
Loo, C.K. & Abdul Aziz, A.M., (2007). Technical issues on distributed
generation (DG) connection and guildelines. In 19th International conference
on electricity distribution. Vienna, 2007.
M.J. Ortega, J.C.H.O.G.G., (2013). Measurement and assessment of power
quality characteristics for photovoltaic systems: Harmonics, flicker, unbalance,
and slow voltage variations. In Electric Power Systems Research., 2013.
Science Direct.
Mahlia, T.M.I., (2002). Emissions from electricity generation in Malaysia.
Renewable Energy, 27(2), pp.293-300.
Malaysia Meteorological Department, (2010). Geberal Climate Information.
[Online] Available at:
http://www.met.gov.my/index.php?option=com_content&task=view&id=30&
Itemid=1090&lang=english [Accessed 28 February 2013].
Masters, C.L., (2002). Voltage rise: the big issue when connecting embedded
generation to long 11 kV overhead lines. Power Engineering Journal, 16(1),
pp.5-12.

146
Maurizio, D., Davide, F. & Marco, M., (2013). Dispersed generation impact
on distribution network losses. Electric Power Systems Research, 97, pp.10-18.
McDermott, T.E., (2010). Voltage control and voltage fluctuations in
distributed resource interconnection projects. In IEEE PES Transmission and
Distribution Conference and Exposition., 2010. IEEE.
Ministry of Energy, Green Technology and Water, (2009). Small Renewable
Energy Power Programme. [Online] Available at:
http://www.kettha.gov.my/en/content/small-renewable-energy-power-
programme-srep [Accessed 1 March 2013].
Mohamed, A.R. & Lee, K.T., (2006). Energy for sustainable development in
Malaysia: Energy policy and alternative energy. Energy Policy, 34(15),
pp.2388-97.
Nair, N.-K.K.C., Nayagam, R. & Francis, R., (2008). New Zealand utility
experiences with demand side management. In Power and Energy Society
General Meeting - Conversion and Delivery of Electrical Energy in the 21st
Century., 2008. IEEE.
Nambiar, A.J., Kiprakis, A.E. & Wallace, A.R., (2010). Quantification of
voltage fluctuations caused by a wave farm connected to weak, rural
electricity networks. In 14th International Conference on Harmonics and
Quality of Power., 2010. IEEE.

147
Nazariah, I., (2011). TENAGALINK. [Online] Available at:
http://www.tnb.com.my/tnb/application/uploads/tenagalink/4c3df0479019f5a8
90c08e3f1e065bb0.pdf [Accessed 26 February 2013].
Ortega, M.J., Hernández, J.C. & García, O.G., (2013). Measurement and
assessment of power quality characteristics for photovoltaic systems:
Harmonics, flicker, unbalance, and slow voltage variations. Electric Power
Systems Research, 96, pp.23-35.
Padiyar, K.R., (1999). Analysis of subsynchronous resonance in power
systems. Kluwer Academic.
Pádraig, L., (2009). Experimental Investigation and Evaluation of Future
Active Distribution Networks. Durham: School of Engineering, Durham
University.
Palizban, O., Rezaei, M.A. & Mekhilef, S., (2011). Active and reactive power
control for a hybrid system with photovoltaic panel, wind turbine, fuel cells,
electrolyzer and super capacitor in off-grid mode. In International Conference
on Control System, Computing and Engineering., 2011. IEEE.
Payman, A., Pierfederici, S. & Meibody-Tabar, F., (2008). Energy control of
supercapacitor/fuel cell hybrid power source. Energy Conversion and
Management, 49(6), pp.1637-44.

148
Prinz, S., Pietzsch, H. & Stade, D., (2005). Optimal control of static VAr
compensators in power supply systems with electrical arc furnaces. In
European Conference on Power Electronics and Applications., 2005. IEEE.
Qian, K., Zhou, C., Allan, M. & Yuan, Y., (2011). Effect of load models on
assessment of energy losses in distributed generation planning. International
Journal of Electrical Power & Energy Systems, 33(6), pp.1243-50.
Sallam, A.A. & Malik, O.P., (2011). Electric Distribution Systems. John
Wiley & Sons.
Sandra, E., Hans, B. & Mats, L., (2008). Evaluation of different turbine
concepts for wind power. Renewable and Sustainable Energy Reviews, 12(5),
pp.1419-34.
Sasi Group, (2006). Rainfall volume. [Online] Available at:
www.worldmapper.org/posters/worldmapper_map101_ver5.pdf [Accessed 28
February 2013].
SEDA Malaysia, (2013). Overview of the FiT system in Malaysia. [Online]
Available at: http://seda.gov.my/go-
home.php?omaneg=0001010000000101010100010000100000000000000000
0000&s=6 [Accessed 1 March 2013].

149
SEDA, (2011). Renewable Energy (Technical and Operational Requirements)
Rules. Federal Government Gazatte, Malaysia. Attorney General's Chambers.
Singh, R.K. & Goswami, S.K., (2010). Optimum allocation of distributed
generations based on nodal pricing for profit, loss reduction, and voltage
improvement including voltage rise issue. International Journal of Electrical
Power & Energy Systems, 32(6), pp.637-44.
Sinha, A. et al., (2011). Role of Demand Side Management for power
distribution utility in India. In IEEE Power and Energy Society General
Meeting., 2011. IEEE.
Sinha, A. et al., (2011). Role of Demand Side Management for power
distribution utility in India. In Power and Energy Society General Meeting.,
2011. IEEE.
Steg, L., (2008). Promoting household energy conservation. Energy Policy,
36(12), pp.4449-53.
Stephen, G.W. & Carole, J.H., (2010). Climatic Atlas of Clouds Over Land
and Ocean. [Online] Available at:
http://www.atmos.washington.edu/CloudMap/ [Accessed 1 March 2013].
Strbac, G., (2008). Demand side management: benefits and challenges. Energy
Policy, 36, pp.4419-26.

150
Sulligoi, G. & Chiandone, M., (2012). Voltage rise mitigation in distribution
networks using generators automatic reactive power controls. In IEEE Power
and Energy Society General Meeting., 2012. IEEE.
Tenaga Nasional Berhad, (2011). Electricity Supply Application Handbook.
Distribution Division, TNB.
Thounthong, P. et al., (2011). Energy management of fuel cell/solar
cell/supercapacitor hybrid power source. Power Sources, 196(1), pp.313-24.
Von Jouanne, A. & Banerjee, B., (2001). Assessment of voltage unbalance.
IEEE Transactions on Power Delivery, 16(4), pp.782-90.
W.Gellings, C., (2009). The smart grid: enabling energy efficiency and
demand response. The Fairmont Press, Inc.
Wei, T., Wang, S. & Qi, Z., (2007). Design of supercapacitor based ride
through system for wind turbine pitch systems. In International Conference on
Electrical Machines and Systems. Seoul, 2007. IEEE.
Wei, T., Wang, S. & Qi, Z., (2007). Design of supercapacitor based ride
through system for wind turbine pitch systems. In International Conference on
Electrical Machines and Systems., 2007. IEEE.

151
Wikipedia, (n.d). List of major power outages. [Online] Available at:
http://en.wikipedia.org/wiki/List_of_major_power_outages#2010.E2.80.93201
3 [Accessed 26 April 2013].
William, W.H., (2009). Providing incentives for efficient demand response.
Cambridge: Harvard University.
Wong, J., (2011). Power Quality Improvement Using Energy Storge For
Distribution Networks With Renewables. Thesis. Universiti Tunku Abdul
Rahman.
Wong, J., Lim, Y.S., Phil, T. & Stella, M., (2011). Optimal utilisation of
small-scale embedded generators in developing country - A case study in
Malaysia. Renewable Energy 36, pp.2562-72.
Woyte, A., Bodach, M., Belmans, R. & Nijs, J., (2003). Power fluctuation in
micro-grids introduced by photovoltaics: analysis and solutions. In
Proceedings of 2nd European PV-Hybrid and Mini-Grid Conference. Kassel,
Germany, 2003.
Zhong, J., Kang, C. & Liu, K., (2010). Demand side management in China. In
Power and Energy Society General Meeting., 2010. IEEE.
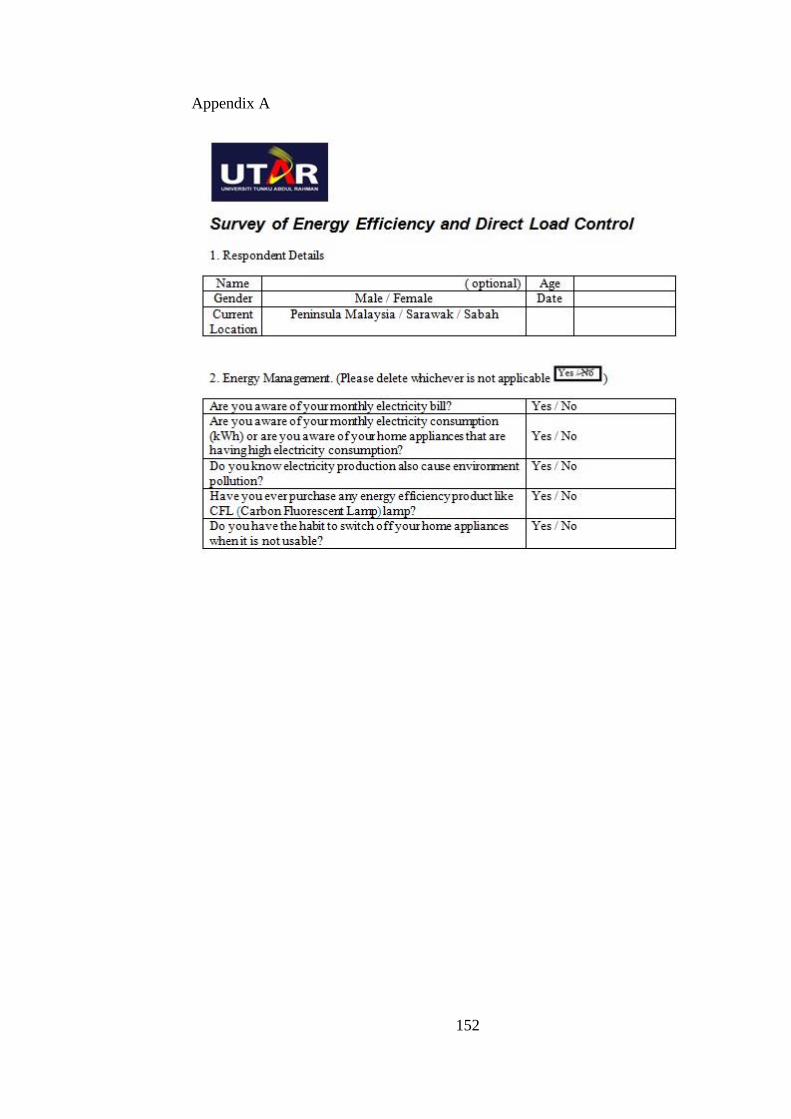
152
Appendix A
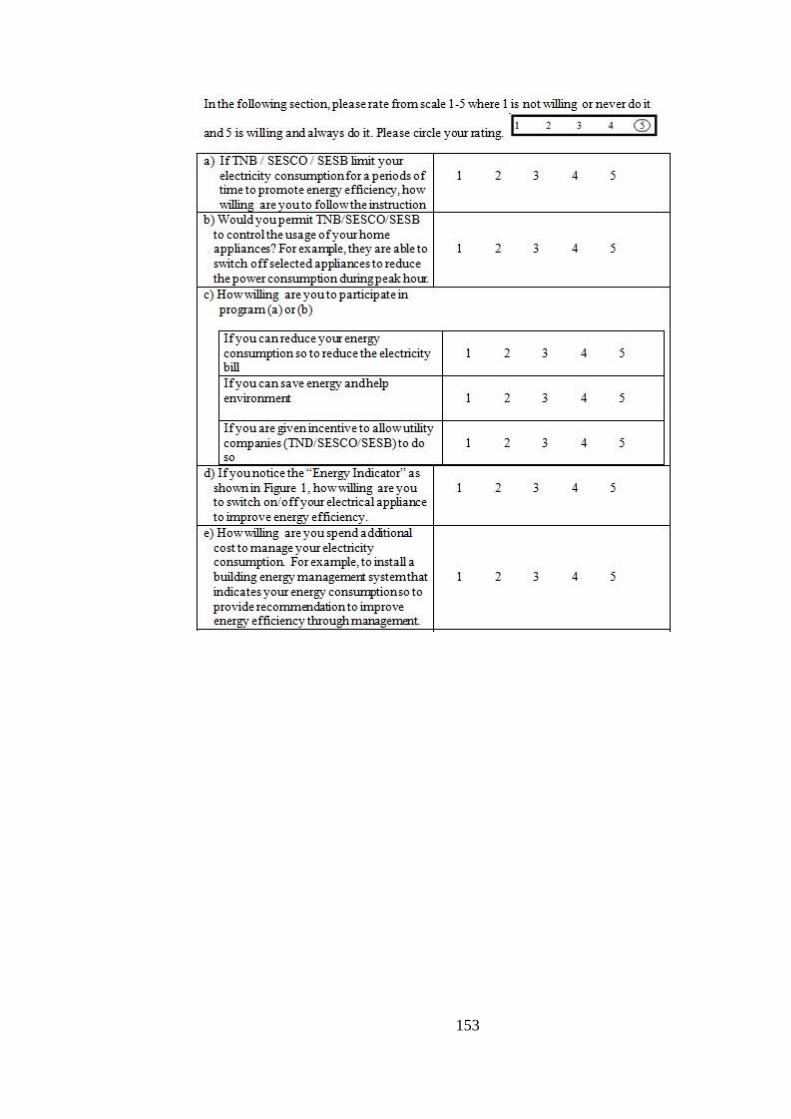
153