investigation of active flow control on an extremely thick
TRANSCRIPT

Investigation of Active Flow Control on an Extremely Thick Wind Turbine Airfoil
By
Kanin Homsrivaranon
Submitted to the graduate program in Aerospace Engineering and the Graduate
Faculty of the University of Kansas in partial fulfillment of the requirements for
the degree of Master of Science.
________________________________
Committee Chair: Dr. Saeed Farokhi
________________________________
Committee Member: Dr. Ray Taghavi
________________________________
Committee Member: Dr. Shawn Keshmiri
Date Defended: 05/12/2016

Aerospace Engineering Department ii
The Thesis Committee for Kanin Homsrivaranon certifies that this is the approved
version of the following thesis:
Investigation of Active Flow Control on an Extremely Thick Wind Turbine Airfoil
________________________________
Committee Chair: Dr. Saeed Farokhi
Date Approved: 05/12/2016

Aerospace Engineering Department iii
Abstract
Today, modern wind turbine size has become larger than ever. The conventional airfoil near
rotor hub cannot provide the structure integrity for the rotor blades. Large diameter wind turbine
required for extremely thick airfoil, such as the FX77-W-343 34.4% wind turbine dedicated
airfoil. The exceptionally thick airfoil has an unfavorable characteristic, such as sharp stalling
and stalling at low angle of attack. To prevent undesired behavior, the FX77-W-343 airfoil with
co-flow jet active flow control is simulated in 2-D CFD using STAR-CCM+ to investigate the
enhancement in performance. The simulation is done at low Reynolds number of 1,000,000 with
injection and suction momentum coefficient of 0.05. The simulation presents promising
performance increase of maximum lift coefficient by 190% and improves lift-to-drag ratio by
94%. While sharp stalling behavior cannot be solved with co-flow jet flow control, the operating
margin of the extremely thick airfoil is increased by 130% by delaying the stall angle of attack of
8deg.

Aerospace Engineering Department iv
Table of Contents
Page #
Abstract ....................................................................................................................................... iii
Table of Contents ........................................................................................................................ iv
List of Figures ...............................................................................................................................v
List of Table ............................................................................................................................... vii
List of Symbols ......................................................................................................................... viii
1 Introduction ........................................................................................................................1
1.1 General Wind Turbine ...................................................................................................... 1
1.2 Literature Review ............................................................................................................. 3
1.3 Scope of Thesis ................................................................................................................ 6
2 Theoretical Consideration ..................................................................................................7
2.1 Sectional Lift and Drag Coefficients ................................................................................ 7
2.2 Injection and Suction Momentum Coefficient ................................................................. 7
2.3 Reynolds Number ............................................................................................................. 7
2.4 Vorticity ........................................................................................................................... 8
3 Computational Modeling and Validation...........................................................................9
3.1 Geometry .......................................................................................................................... 9
3.2 Mesh Generation ............................................................................................................ 10
3.3 Physics Model ................................................................................................................ 11
3.4 Validation Case .............................................................................................................. 12
4 Results and Discussion ....................................................................................................17
4.1 Baseline FX77-W-343.................................................................................................... 17
4.2 Co-Flow Jet Modified FX77-W-343 .............................................................................. 23
5 Conclusion and Recommendation ...................................................................................36
6 Reference .........................................................................................................................37

Aerospace Engineering Department v
List of Figures
Page #
Figure 1: (Left) Dutch Windmill (Right) American Farm Windmill [6] ........................................ 1
Figure 2: Size Comparison between Siemens D7 and Airbus A380 [4] ......................................... 2
Figure 3: Lift and Drag Coefficient with Boundary Layer Leading Edge Suction by Hansen [11] 3
Figure 4: The Effect of Coanda Jet Location on Lift-to-Drag Ratio by Djojodihardjo and Hamid
[7] .................................................................................................................................................... 4
Figure 5: Experimental and Numerical Comparison of Lift Coefficient versus AoA [6] .............. 5
Figure 6: NACA0025 with Modified CFJ Airfoil [17] ................................................................... 6
Figure 7: 3 Dimensional Parallel Pipe Flow with Subtracted FX77-W-343 Airfoil ...................... 9
Figure 8: Generated Mesh on NREL S825 Airfoil for Validation Case ....................................... 13
Figure 9: Smooth Transition between Prism Layer and Polyhedral Mesh on S825 Upper Wall . 13
Figure 10: Sectional Lift and Drag Coefficient on NREL S825 Airfoil (Validation Case) ......... 14
Figure 11: Velocity Flow Field on NREL 825 at 0deg (left) and 14deg (right) AoA .................. 15
Figure 12: Wall 𝒚 + Value ........................................................................................................... 15
Figure 13: Static Pressure Contour on NREL S825 Airfoil at 0deg (left) and 14deg (right) AoA
....................................................................................................................................................... 16
Figure 14: Vorticity Field on NREL S825 Airfoil at 0deg and 14deg AoA ................................. 16
Figure 15: Mesh Sensitivity on Sectional Force Coefficient ........................................................ 17
Figure 16: Mesh on FX77-W-343 Airfoil at 0deg AoA (Baseline Case) ..................................... 18
Figure 17: Sectional Force Coefficients of FX77-W-343 Airfoil (Baseline Case) ...................... 19
Figure 18: Lift-to-Drag Ratio of FX77-W-343 Airfoil (Baseline Case)....................................... 19
Figure 19: Velocity Flow Field over FX77-W-343 Airfoil from -4deg to 12deg (baseline Case) 21
Figure 20: Static Pressure Contour on FX77-W-343 Airfoil at 0deg (right) and 10deg (right)
AoA ............................................................................................................................................... 22
Figure 21: Vorticity Field on FX77-W-343 Airfoil at 0deg and 6deg AoA ................................. 23
Figure 22: Co-Flow Jet Modified FX77-W-343 Airfoil Geometry (Left) and Mesh (right) ........ 24
Figure 23: Injection and Suction Jet Momentum Coefficient versus Sectional Force Coefficient
....................................................................................................................................................... 25

Aerospace Engineering Department vi
Figure 24: Injection and Suction Jet Momentum Coefficient versus Lift-to-Drag Ratio ............. 25
Figure 25: Sectional Force Coefficients Comparison between Baseline and Co-Flow Jet (𝑪𝝁
=0.05) ............................................................................................................................................ 27
Figure 26: Lift-to-Drag Ratio Comparison between Baseline and Co-Flow Jet (𝑪𝝁 =0.05) ....... 27
Figure 27: Co-Flow Jet Active Flow Control on FX77-W-343 Airfoil (𝑪𝝁 = 𝟎. 𝟎𝟓) ................. 29
Figure 28: Static Pressure Contour on Modified FX77-W-343 airfoil at 0deg (left) and 16deg
(right) AoA.................................................................................................................................... 30
Figure 29: Velocity Flow Field near Leading Edge (left) and Trailing Edge (right) of Co-Flow
Jet Flow Control FX77-W-343 Airfoil at 6deg AoA .................................................................... 30
Figure 30: Vorticity Field near Leading Edge (top) and Trailing Edge (bottom) of Co-Flow Jet
Flow Control FX77-W-343 Airfoil at 6deg AoA ......................................................................... 31
Figure 31: Vorticity Field on Co-Flow Jet Flow Control FX77-W-343 Airfoil at 0deg (Top) and
16deg (bottom) AoA ..................................................................................................................... 32
Figure 32: Comparison of the Wake Structure with Various Injection and Suction Momentum
Coefficient on Co-Flow Jet Flow FX77-W-343 airfoil at 6deg AoA ........................................... 33
Figure 33: Comparison of the Wake Structure with Various Injection and Suction Momentum
Coefficient on Co-Flow Jet Flow FX77-W-343 airfoil at 6deg AoA (continue) ......................... 34
Figure 34: Comparison between Velocity Field on Baseline (left) and Modified Co-Flow Jet
(right) FX77-W-343 Airfoil at 6deg AoA .................................................................................... 35
Figure 35: Comparison between Static Pressure Contour on Baseline (left) and Modified Co-
Flow Jet (right) FX77-W-343 Airfoil at 6deg AoA ...................................................................... 35

Aerospace Engineering Department vii
List of Table
Page #
Table 1: Mesh Setting in STAR-CCM+ ....................................................................................... 11
Table 2: Physics Model in STAR-CCM+ ..................................................................................... 11

Aerospace Engineering Department viii
List of Symbols
Symbol Description Units
A ........................................................... Area ..................................................................... m
2
𝐶𝑙𝛼 .............................................. Lift Curve Slope ........................................................ rad
-1
𝐶𝑑 ....................................... Sectional Drag Coefficient ..................................................... ~
𝐶𝑙 ......................................... Sectional Lift Coefficient ...................................................... ~
𝐶𝜇 .............................. Equivalent Jet Momentum Coefficient ............................................ ~
𝐶𝑝 ............................................ Pressure Coefficient .......................................................... ~
c .................................................... Chord Length .............................................................. m
D ..................................................... Drag Force ................................................................. N
L ......................................................... Length .................................................................... m
L ...................................................... Lift Force .................................................................. N
�̇� .................................................Mass Flow Rate.......................................................... kg/s
Re .............................................. Reynolds Number ............................................................ ~
t ..................................................... Jet Thickness ............................................................... m
V ........................................................ velocity ................................................................. m/s
𝑦+ ...................................................... Wall 𝑦+ .................................................................... ~
𝛼 .................................................. Angle of Attack ........................................................... deg
𝜇 ................................................ Dynamic viscosity ........................................................ Pa-s
𝜔....................................................... Vorticity ................................................................... /s
𝜌 ........................................................ Density ............................................................. kg/m3
Subscripts Description
∞ ...................................................... Freestream
d............................................................Drag
l .............................................................Lift
max .................................................. Maximum
ref .................................................... Reference

Aerospace Engineering Department ix
Acronym Description
AoA ............................................. Angle of Attack
CFD ................................. Computational Fluid Dynamic
CFJ ................................................. Co-Flow Jet
NACA ................ National Advisory Committee for Aeronautics
NREL ....................... National Renewable Energy Laboratory
RANS ........................... Reynolds-Average Navier-Strokes
SST ........................................ Shear Stress Transport
VG ............................................. Vortex Generator

Aerospace Engineering Department 1
1 Introduction
1.1 General Wind Turbine
The wind turbine technology has been used for a very long period of time. Persians used the
first wind turbine, known as the “Persian windmill” or “Panemone”, for grain grinding through
aerodynamic drag force. In the 16th
century, the Europeans extracted wind energy through the
Dutch windmill for grinding wheat. The farms in America used steel-bladed wind turbines to
pump water and grind wheat in the 18th
century. Today, the primary use of the wind turbine is to
extract wind energy to generate electricity.
Figure 1: (Left) Dutch Windmill (Right) American Farm Windmill [6]
Over the years, the wind turbine designs have been studied to increase its performance.
There are many factors contributing to wind turbine performance and efficiency. One of the very
important aspects of wind turbine design is the airfoil shape of the rotor blades. The wind turbine
blade design was first borrowed from the airfoil shape of the airplane, such as the NACA airfoil
series, for its lift characteristic, though it was later realized that the two systems operate in
different conditions. Airplanes typically operate at high altitudes in which the wing surface stays
clean, while the wind turbine operates closer to the ground and experiences dirt, insects, and

Aerospace Engineering Department 2
other environmental debris. The environmental factors introduce the surface roughness to the
shape of the airfoil and therefore reduce the aerodynamic efficiency. Many organizations have
studied and designed wind turbine specific aerodynamic shapes that are less sensitive to the
surface roughness while maintaining high lift-to-drag ratio. Delft University, National
Renewable Energy Laboratory (NREL), and FFA and RISO are some of the institutes that came
up with the airfoil series specifically tailored for extracting wind energy into electricity.
Aside from the efficiency standpoint, the design of modern wind turbine also has
tremendously increased in size. For instance, the Siemens 7MW D7 platform direct-drive and
AMSC SeaTitan 10 MW wind turbines have the rotor diameter of 154m and 190m, respectively.
Figure 2 shows size comparison between the Siemens D7 rotor size to Airbus A380. This
modern design of a wind turbine rotor has become so large that the typical dedicated wind
turbine airfoil, 15% to 25% thickness to chord ratio, cannot provide the structural integrity for
such large configurations. Thus, the rotor hub airfoil required extremely thick airfoil, in the order
of 35% to 45% thickness to chord ratio. Some of the examples of the wind turbine specific thick
airfoils are Delft DU00-W2-xxx and Wortmann FX77-W-xxx series.
Figure 2: Size Comparison between Siemens D7 and Airbus A380 [4]

Aerospace Engineering Department 3
The extremely thick foils typically have undesirable aerodynamic characteristics such as
sharp stalling behavior or stalling at low angle of attack (AoA). Many methods of controlling the
flow over an airfoil, including passive and active control, have been developed over the years to
enhance the performance of the aerodynamic body. An example of passive flow control is vortex
generator (VG) and riblets. Similarly, jet flow injection and suction are normally used to actively
control the flow field over the airfoil.
1.2 Literature Review
Based on the previous studies on active flow control, not much has been contributed to the
extremely thick airfoil, though various types and configurations have been employed for
conventional airfoil, as well as the wind turbine dedicated airfoil.
In 2010, Martin O.L. Hansen [11] conducted active flow control research on boundary
layer suction for wind turbine airfoil using numerical method, Computational Fluid Dynamic
(CFD). Hansen modeled NACA4415 in ANSYS CFX 12.1 with various suction slot
configurations and simulated at different angles of attack to compute lift and drag coefficient.
His research attempted to improve the aerodynamic performance of the airfoil at high AoA. It
was concluded that the suction location is the most effective at the leading edge and a maximum
lift coefficient increase of 20% can be expected over the clean baseline airfoil.
Figure 3: Lift and Drag Coefficient with Boundary Layer Leading Edge Suction by Hansen [11]

Aerospace Engineering Department 4
Djojodihardjo and Hamid [7] from the University Putra Malaysia investigated Coanda
effect lift enhancement on wind turbine specific airfoil, particularly NREL S809 airfoil. The
research is done in 2-D using CFD. The computation is conducted using Reynolds-Average
Navier-Strokes (RANS) equations through commercially available software, COMSOL 4.2. To
check the model validity in COMSOL, they ran the base model S809 airfoil against the
experimental data and found it to be consistent. The authors modified the airfoil trailing edge to
have various curvatures, ranging from 10mm to 50mm. The location of the Coanda jet outlet,
from 90% to 95% of chord length, has also been studied in this paper. After the simulation of the
S809 at 0deg angle of attack, it is confirmed that the Coanda circulation control airfoil does, in
fact, enhance airfoil lift characteristics. The lift-to-drag ratio is found to be maximum when the
trailing edge radius is 30mm, then decreases as the curvature enlarges from 30mm to 50mm.
Lastly, the lift-over-drag ratio increases as it approaches the trailing edge zone.
Figure 4: The Effect of Coanda Jet Location on Lift-to-Drag Ratio by Djojodihardjo and Hamid [7]
A group of engineers at the University of Miami and University of Florida conducted
research on high performance airfoil using their own active flow control design, called “Co-Flow
Jet (CFJ)” [16,17]. Their CFJ airfoil configuration consists of an air injection slot near the airfoil
leading edge and a suction slot close to the trailing edge. Engineers implemented the co-flow jet

Aerospace Engineering Department 5
by modifying the upper surface of NACA0025 airfoil in both CFD and on a real wing to test in
the wind tunnel. Experimental and numerical results both have shown to tremendously increase
performance of the NACA0025 airfoil at high AoA. The engineers reported that the wind tunnel
data shows an increase in lift coefficient ranging from 113% to 220%, an increase in operating
range (stall margin) ranging from 100% to 153%, and a reduction in drag coefficient by at least
30%. The authors also claimed that the negative drag (or thrust) can be produced at high
momentum coefficients of the injection and suction jet.
Figure 5: Experimental and Numerical Comparison of Lift Coefficient versus AoA [6]

Aerospace Engineering Department 6
Figure 6: NACA0025 with Modified CFJ Airfoil [17]
1.3 Scope of Thesis
This Master’s thesis investigates the active flow control over an extremely thick wind
turbine specific airfoil using STAR-CCM+. The airfoil selected is the Wortmann FX77-W-343,
with a 34.4% thickness ratio, due to the availability of its airfoil coordinates. Following the
literature review of the active flow control methodology, co-flow jet is selected to be suitable for
enhancing the performance of an extremely thick airfoil primarily due to its capability to enhance
lift-to-drag ratio and allowing the airfoil to stall at a much higher AoA. The airfoil will be
simulated in 2-dimensions at a Reynolds number of 1,000,000 within STAR-CCM+, and this
model will be validated with the wind tunnel experimental data. The mesh sensitivities will also
be studied to refine mesh size and the number of elements inside the flow domain. Then, the
active co-flow jet will be implemented on the top surface of FX77-W-343 series airfoil to be
simulated and results will be compared to the baseline data.

Aerospace Engineering Department 7
2 Theoretical Consideration
2.1 Sectional Lift and Drag Coefficients
Lift coefficient (𝐶𝑙) and drag coefficient (𝐶𝑑) are non-dimensional parameters that
represent the aerodynamic characteristic of airfoils, or any aerodynamic body. The 2-D sectional
lift and drag coefficients are defined by the following.
𝐶𝑙 =𝐿
(1
2)𝜌𝑉∞
2 𝑐 (1)
𝐶𝑑 =𝐷
(1
2)𝜌𝑉∞
2 𝑐 (2)
𝐿 and 𝐷 represents lift and drag forces in the above equations.
2.2 Injection and Suction Momentum Coefficient
In order to quantify the quantity of the air being injected or extracted from the incoming
flow, the dimensionless parameters are used and called “equivalent jet momentum coefficients
(𝐶𝜇)”. The parameters characterize the jet momentum by relating the incoming flow velocity and
density to the injection and suction flow properties. In the 2-D case, the chord length (𝑐) and jet
thickness (𝑡) are implemented instead of reference area (𝐴𝑟𝑒𝑓) of the injection and suction slot in
3D case. The injection and suction equivalent jet momentum are described by the following
equations.
𝐶𝜇𝑖𝑛𝑗𝑒𝑐𝑡𝑖𝑜𝑛=
�̇�𝑉𝑖𝑛𝑗𝑒𝑐𝑡𝑖𝑜𝑛
(1
2)𝜌∞𝑉∞𝐴𝑟𝑒𝑓
=𝜌𝑖𝑛𝑗𝑒𝑐𝑡𝑖𝑜𝑛𝑉𝑖𝑛𝑗𝑒𝑐𝑡𝑖𝑜𝑛
2 𝑡𝑖𝑛𝑗𝑒𝑐𝑡𝑖𝑜𝑛
(1
2)𝜌∞𝑉∞
2 𝐶𝑎𝑖𝑟𝑓𝑜𝑖𝑙
(3)
𝐶𝜇𝑠𝑢𝑐𝑡𝑖𝑜𝑛=
�̇�𝑉𝑠𝑢𝑐𝑡𝑖𝑜𝑛
(1
2)𝜌∞𝑉∞𝐴𝑟𝑒𝑓
=𝜌𝑠𝑢𝑐𝑡𝑖𝑜𝑛𝑉𝑠𝑢𝑐𝑡𝑖𝑜𝑛
2 𝑡𝑠𝑢𝑐𝑡𝑖𝑜𝑛
(1
2)𝜌∞𝑉∞
2 𝐶𝑎𝑖𝑟𝑓𝑜𝑖𝑙
(4)
2.3 Reynolds Number
Reynolds number is another dimensionless parameter and is the ratio of inertial force to
viscous force. The Reynolds is defined by the following equation.
𝑅𝑒 =𝜌𝑉∞𝐿
𝜇 (5)
By the above equations, L represents length scale and 𝜇 is dynamic viscosity.

Aerospace Engineering Department 8
2.4 Vorticity
Vorticity is a parameter that described the rotational motion of the fluid flow. According to
Shapiro [14], the vorticity is a curl of velocity vector that can be expressed by the following
formula.
𝜔 = ∇ 𝑥 �̅� (6)

Aerospace Engineering Department 9
3 Computational Modeling and Validation
3.1 Geometry
The FX77-W-343 airfoil coordinates are taken from University of Illinois Urbana-
Champaign (UIUC) Applied Aerodynamics Group [1] airfoil database. These coordinates are
imported into NX 8.5 and connected by spline curves, upper and lower curves. The airfoil has
chord length of 1m and was extruded to give a thickness of 0.2m. This sectional 3-D airfoil is
exported as a Parasolid part file. The reason the airfoil sketch has to be extruded is due to the fact
that STAR-CCM+ operates in 3-D space. The method to simulate this airfoil in 2-D will later be
explained. The creation of the co-flow jet airfoil modified version of FX77-W-343 is also done
exactly the same way as explained above with the revised top surface for injection and suction
slots.
In STAR-CCM+, the Parasolid file of the airfoil can be imported to create the flow domain.
The flow field, air-box liked shaped, can be created by drawing connected straight line then
extrude with 0.2m thickness. The flow domain has dimensions of 20m x 25m. The inlet is 10m
ahead of the leading edge of the airfoil and outlet is located 14m behind the trailing edge, as can
be seen in Figure 7. Then, the flow domain is completed by Boolean subtracting the airfoil from
air-box construction.
Figure 7: 3 Dimensional Parallel Pipe Flow with Subtracted FX77-W-343 Airfoil

Aerospace Engineering Department 10
3.2 Mesh Generation
To generate 2-D mesh, the 3-D parallel air-box flow is executed with 2-D badge operation.
This process allowed for the creation of 2-D mesh with one element thickness. Each surface in
the flow domain is then assigned into different boundary types. Inlet and outlet are designated as
velocity inlet and pressure outlet, respectively. Top and bottom walls are selected to be
symmetrical walls. The airfoil itself is chosen to be a solid wall. In the case of co-flow jet
modified airfoil, the injection and suction surface are assigned to be inlet and outlet with
quantified velocity normal to surface plane to control the flow jet that is being injected or
extracted from the flow field.
Now, the flow field is ready for the mesh operation. The mesh type is selected to be
polyhedral with prism layer mesher. The polyhedral mesh has significant advantages over
tetrahedral, as it allowed for fewer cells and much smoother growth away from the body. Less
element inside the flow field means faster computing time. Also suggested by Penny [10],
polyhedral mesh is typically preferred in aerodynamic study when force coefficient is the key
important parameter. The prism layer mesh is used at near wall region to capture the boundary
layer flow field. It is important that the boundary layer thickness is a tall enough height to cover
the boundary layer. Smooth transition between the two types of mesher is another key to
achieving good force coefficient results. The following table represented the selected mesh types,
values and custom controls applied in STAR-CCM+.

Aerospace Engineering Department 11
Table 1: Mesh Setting in STAR-CCM+
Mesher
Mesh Type Polygonal Mesher
Prism Layer Mesher
Mesh Values
Target Surface Size (m) 0.006
Minimum Surface Size (m) 0.0001
Surface Growth Rate 1.1
Number of Prism Layers 40-60
Prism Layer Stretching 1.2
Prism Layer Total Thickness (m) 0.02
Surface Control on Leading and Trailing Edge
Target Surface Size (m) 0.004
Wake Refinement Control on Airfoil
Relative Size (m) 0.02
Wake Refinement Distant (m) 8
Custom Control on Inlet, Outlet and Symmetry Walls
Target Surface Size (m) 0.75m
3.3 Physics Model
Table 2 shows the selected physics model that will be used throughout the 2-D airfoil
simulation cases in this report.
Table 2: Physics Model in STAR-CCM+
Physics Model
Space 2 Dimensional
Time Steady
Flow Segregated Flow
Material Gas
Equation of State Constant Density
Viscous Regime Turbulent
Turbulence Model Reynolds-Average Navier-Strokes (RANS)
Reynolds-Average Turbulence K-Omega Turbulence
K-Omega Turbulence Models Shear Stress Transport (SST) K-Omega
K-Omega Wall Treatment Low 𝑦+ Wall Treatment (Y+ Wall < 1)
Transition Turbulence Suppression
Optional Model Cell Quality Remediation
The simulation is in steady-state with constant density gases. The constant air property is
chosen to have the constant density of 1.1842kg/m3 and dynamic viscosity of 1.8551E-5 Pa-s.

Aerospace Engineering Department 12
Time-averaged incompressible RANS equations are chosen to govern the motion of the fluid
flow. The govern RANS can be expressed by the following equation [9].
𝜌�̅�𝑖 (𝜕𝑢𝑖
𝜕𝑥𝑗) = 𝜌𝑓�̅� +
𝜕
𝜕𝑥[−�̅�𝛿𝑖𝑗 + 𝜇 (
𝜕𝑢𝑖
𝜕𝑥𝑗+
𝜕𝑢𝑗
𝜕𝑥𝑖) − 𝜌𝑢𝑖
′𝑢𝑗′̅̅ ̅̅ ̅̅ ] (7)
The SST 𝑘-𝜔 turbulence model is a robust two-equation eddy-viscosity model that is
suitable for low Reynolds number study and can be used to solve the model through sublayer
down to the wall. The SST 𝑘-𝜔 is widely used in the aerospace industry as it is performing well
for swirling flows and adverse pressure gradients, or flow separation region [3].
The wall treatment is an assumption of near-wall modeling. Wall treatment is selected to
be a low wall 𝑦+ due to that fact that simulation of airfoil will be conducted at low Reynolds
number. This low 𝑦+ model is valid throughout the boundary and viscous sublayer. The
requirement for this wall treatment is that prism layer mesh must be sufficiently fine, with value
of less than 1 [5].
3.4 Validation Case
Due to the lack of experimental data on extremely thick airfoil (Wortmann FX77-W-343), a
validation case will be simulated with a different wind turbine airfoil, NREL S825. The airfoil
coordinates are found from NREL website [2]. S825 is a 17% thick airfoil and was tested by
NASA Langley in 1999. The experimental wind tunnel data can be obtained in “Design and
Experimental Results for the S825 Airfoil” by D.M. Somers, Airfoils, Inc. [15].
The validation case using NREL S825 wind turbine airfoil is conducted with mesh and
physics model setting as described in previous sections of this document. The generated mesh of
the S825 is shown in Figure 8. The flow domain consists of 57,235 elements with finer mesh size
near the leading and trailing edge section. The mesh is much finer around the airfoil and
smoothly grows larger to 0.75m at the boundary of the flow domain, as seen in Figure 9: Smooth
Transition between Prism Layer and Polyhedral Mesh on S825 Upper Wall. The wake
refinement of 8m can also be seen immediately behind the airfoil.

Aerospace Engineering Department 13
Figure 8: Generated Mesh on NREL S825 Airfoil for Validation Case
Figure 9: Smooth Transition between Prism Layer and Polyhedral Mesh on S825 Upper Wall
The NREL S825 is simulated in the constant density flow of 15.66m/s or Reynolds number
of 1,000,000 from -2deg to 18deg AoA. Sectional lift and drag coefficients are collected and
compared to the wind tunnel results. The STAR-CCM+ lift coefficients matched with the
experimental data within 5% from -2 to 10deg AoA. Drag coefficients in 2-D case are more
difficult to match than lift coefficient but are within 20% errors. Although the accuracy of drag is
not as good, the STAR-CCM+ simulation still captured the drag behaviors of the S825 wind
turbine airfoil. The force coefficients accuracy drop as the airfoil approaches the stall and post
stall region but again still predicted 𝐶𝑙𝑚𝑎𝑥 at precisely 12deg AoA. The comparison between

Aerospace Engineering Department 14
wind tunnel experimental results and STAR-CCM+ data can be seen in Figure 10. The flow
vector flow field around the airfoil at the AoA of 0deg and 14deg can be found in Figure 11. As
expected, the flow velocity is higher on the upper contour of the airfoil that leads to lower
pressure and resulting in upward force, or lift force. At AoA of 14deg the velocity field
demonstrates flow separation at near trailing edge region.
Figure 10: Sectional Lift and Drag Coefficient on NREL S825 Airfoil (Validation Case)
-0.5
0
0.5
1
1.5
2
2.5
-10 -5 0 5 10 15 20
Sect
ion
al L
ift
Co
eff
icie
nt,
Cl
Angle of Attack, α (deg)
Experimental
STAR-CCM+
0
0.05
0.1
0.15
0.2
0.25
-10 -5 0 5 10 15 20
Sect
ion
al D
rag
Co
eff
icie
nt,
Cd
Angle of Attack, α (deg)
Experimental
STAR-CCM+

Aerospace Engineering Department 15
Figure 11: Velocity Flow Field on NREL 825 at 0deg (left) and 14deg (right) AoA
Following practices to achieving good CFD results, as described in previous section, the
wall 𝑦+ value on the wall is below 1 and can be seen in Figure 12.
Figure 12: Wall 𝒚+ Value
Figure 13 displays the static pressure contour on NREL S825 wind turbine dedicated
airfoil at two different AoA. The two AoA cases show the static pressure on the upper region is
higher than the lower region, but the difference between at 14deg is much larger than at 0deg
AoA. This larger difference in pressure suggests that at 14deg AoA, the lift force must be higher.
It can be confirmed by Figure 10 that lift coefficient of the S825 airfoil is higher at 16deg.

Aerospace Engineering Department 16
Figure 13: Static Pressure Contour on NREL S825 Airfoil at 0deg (left) and 14deg (right) AoA
Although the lift coefficient is higher at 14deg, the drag coefficient is lower at 0deg AoA.
The wake behind an airfoil contributes to drag coefficient. As seen in the velocity field at 14deg
AoA, flow separation appeared at the airfoil trailing edge. This separation of flow creates wake
structure immediate aft of the airfoil body. The wake trail can be seen as a vorticity field, or
rotation of the flow field. Figure 14 presents the vorticity field on S825 airfoil at 0deg and 14deg
AoA. The thicker and stronger wake trail behind 16deg AoA leads to higher sectional coefficient
of drag than 0deg AoA.
Figure 14: Vorticity Field on NREL S825 Airfoil at 0deg and 14deg AoA

Aerospace Engineering Department 17
4 Results and Discussion
This section of the Master’s thesis document presents the result and discussion of the
baseline and modified FX77-W-343 extremely thick wind turbine airfoil.
4.1 Baseline FX77-W-343
The airfoil coordinates are obtained from UIUC airfoil data website and the airfoil model is
created in STAR-CCM+ software following practices defined in chapter 3. Similar to the
validation case, the baseline FX77-W-343 extremely thick wind turbine airfoil is simulated at
Reynolds number of 1,000,000 from -4deg to 12deg AoA. Mesh sensitivity study is also
implemented on the wind turbine dedicated FX airfoil at 0deg AoA and can be seen in Figure 15.
The lift and drag coefficients value converges within 1% precision when the element counts in
the flow domain reaches 50,000. Although the exact number of the element inside the flow
domain cannot be controlled due to limitation in mesh setting, Figure 15 ensured that the force
coefficients results will not deviate more than 1% when element is above 50,000.
Figure 15: Mesh Sensitivity on Sectional Force Coefficient
0.3600
0.3650
0.3700
0.3750
0.3800
0.3850
0.3900
0 20000 40000 60000 80000
Sect
ion
al L
ift
Co
eff
icie
nt,
Cl
Number of Element
0.0150
0.0155
0.0160
0.0165
0.0170
0.0175
0.0180
0.0185
0.0190
0 20000 40000 60000 80000
Sect
ion
Dra
g C
oe
ffic
ien
t, C
d
Number of Element

Aerospace Engineering Department 18
Figure 16: Mesh on FX77-W-343 Airfoil at 0deg AoA (Baseline Case)
Following the mesh sensitivity study, all of the simulation for baseline FX77-W-343
airfoil is setup to have mesh element of at least 50,000. The aerodynamic performance of the
extremely thick wind turbine airfoil is studied at the Reynolds number of 1,000,000 and can be
viewed in Figure 17. Based on the results from STAR-CCM+, the 34.4% thick airfoil stalls at
6deg AoA with 𝑐𝑙𝑚𝑎𝑥 of 0.82. The linear range of the lift curve slope (𝐶𝑙𝛼
), from -2deg to 4deg
AoA, is determined to be 6.176rad-1
. On the other hand, drag coefficient begins to rise
tremendously after 4deg AoA. Lift-to-drag ratio is another important efficiency parameter to the
performance of the lifting aerodynamic surface. The baseline thick airfoil is capable of producing
maximum lift-to-drag ratio of 30 at 2deg AoA.

Aerospace Engineering Department 19
Figure 17: Sectional Force Coefficients of FX77-W-343 Airfoil (Baseline Case)
Figure 18: Lift-to-Drag Ratio of FX77-W-343 Airfoil (Baseline Case)
-0.2000
0.0000
0.2000
0.4000
0.6000
0.8000
1.0000
-4 -2 0 2 4 6 8 10 12 14
Sect
ion
al L
ift
Co
eff
icie
nt,
Cl
Angle of Attack, AoA (deg)
0.0000
0.0200
0.0400
0.0600
0.0800
0.1000
0.1200
0.1400
-4 -2 0 2 4 6 8 10 12 14
Sect
ion
al D
rag
Co
eff
icie
nt,
Cd
Angle of Attack, AoA (deg)
-10-505
101520253035
-4 -2 0 2 4 6 8 10 12 14
Lift
-to
-Dra
g R
atio
, L/D
Angle of Attack, AoA (deg)

Aerospace Engineering Department 20
The above aerodynamic performance plots are consistent with the simulation flow field
around the airfoil. These flow velocity field of -4deg to 12deg can be seen in Figure 19. As seen
in the velocity field in all AoA, the flow velocity is highest near the maximum cambered region.
Due the shape of the blunt airfoil trailing edge, vortexes can be found immediately aft of the
airfoil. According to Grasso [8], the blunt or flat back trailing edge is a design philosophy used
for exceptionally thick airfoil in attempt to improve the aerodynamic performance in terms of
lift. At 4deg and 6deg AoA, the top surface of the airfoil showed sign of small separation near
the trailing edge region. From AoA of 6deg to 12deg, large flow separation exists and lessens the
aerodynamic performance of the thick airfoil.

Aerospace Engineering Department 21
Figure 19: Velocity Flow Field over FX77-W-343 Airfoil from -4deg to 12deg (baseline Case)
𝛼 = −4𝑑𝑒𝑔
𝛼 = −2𝑑𝑒𝑔
𝛼 = 0𝑑𝑒𝑔
𝛼 = 6𝑑𝑒𝑔
𝛼 = 2𝑑𝑒𝑔
𝛼 = 4𝑑𝑒𝑔
𝛼 = 8𝑑𝑒𝑔
𝛼 = 10𝑑𝑒𝑔
𝛼 = 12𝑑𝑒𝑔

Aerospace Engineering Department 22
Figure 20 presents static pressure contour on the baseline FX77-W-343 airfoil case at
0deg and 10deg AoA. As suggested by Figure 19, the higher flow velocity on the upper surface
yields lower static pressure.
Figure 20: Static Pressure Contour on FX77-W-343 Airfoil at 0deg (right) and 10deg (right) AoA
Figure 21 presents the wake trail of extremely thick airfoil at 0deg and 6deg AoA.
Similar to the wake generated by NREL S825 airfoil, the vorticity trail at 0deg is much weaker
than 6deg AoA. At 6deg, the airfoil stalls and leaves behind massive wakes that contribute to
high Sectional Drag Coefficient.

Aerospace Engineering Department 23
Figure 21: Vorticity Field on FX77-W-343 Airfoil at 0deg and 6deg AoA
4.2 Co-Flow Jet Modified FX77-W-343
The geometry of the exceptionally thick FX77-W-343 airfoil is modified to incorporate the
air injection and suction slots. This is done by offsetting the top curve of the airfoil by 4mm or
0.4% thickness to chord ratio and excess section is removed. This means the injection and
suction slot has the channel height of 4mm. Referring back to equation 3 and 4, the momentum
jet coefficient can be calculated with this established slots height. Following the wind tunnel
experiment of the co-flow jet airfoil conducted by University of Miami [17], the location of
injection and suction provide the best performance at 8% and 85% chord, respectively. The
location of the two slots on the upper surface of FX77-W-343 was created following the
experimental results to achieve the best performance out of active flow control, co-flow jet.
Figure 22 shows the modified geometry of the airfoil.

Aerospace Engineering Department 24
Figure 22: Co-Flow Jet Modified FX77-W-343 Airfoil Geometry (Left) and Mesh (right)
Based on the previous baseline simulation of the airfoil, the jet injection and suction air
quantity study is conducted at 0deg and 6deg (AoA at maximum lift coefficient). The jet quantity
or momentum jet coefficient ranging from 0.01 to 0.2 is studied for both AoA cases. For the
investigation of co-flow jet in this document, the suction and injection momentum coefficients
are established to be equal to each other for all cases. Figure 23 and Figure 24 demonstrates the
effect of jet momentum coefficient to the aerodynamic performance parameters at 2 different
AoA. The dashed line for the plots below represents the baseline value from previous section and
therefore no injection or suction jet is applied.

Aerospace Engineering Department 25
Figure 23: Injection and Suction Jet Momentum Coefficient versus Sectional Force Coefficient
Figure 24: Injection and Suction Jet Momentum Coefficient versus Lift-to-Drag Ratio
0.0000
0.4000
0.8000
1.2000
1.6000
2.0000
0 0.05 0.1 0.15 0.2
Sect
ion
al L
ift
Co
eff
icie
nt,
Cl
Injection and Suction Jet Momentum Coefficients, Cμ
0deg
6deg
Baselline (0deg)
Baseline (6deg)
0.00000
0.02000
0.04000
0.06000
0.08000
0.10000
0.12000
0 0.05 0.1 0.15 0.2
Sect
ion
al D
rag
Co
eff
icie
nt,
Cd
Injection and Suction Jet Momentum Coefficients, Cμ
0deg
6deg
Baseline (0deg)
Baseline (6deg)
0.00
10.00
20.00
30.00
40.00
50.00
60.00
0 0.05 0.1 0.15 0.2
Lift
-to
-Dra
g R
atio
, L/D
Injection and Suction Jet Momentum Coefficients, Cμ
0deg
6deg
Baseline (0deg)
Baseline (6deg)

Aerospace Engineering Department 26
The study in the above graphs shows 0deg AoA lift coefficient can be improved for even
low jet momentum coefficient value. At the AoA of 6deg, small jet momentum of 0.01 does not
prevent the flow from separating on the upper surface of the thick airfoil. The simulation result
shows that a very low injection and suction quantity could in fact enhance the stall behavior,
which results in lower lift and higher drag. From the force coefficient graph, it can be said that
the lift and drag coefficient are improved as the jet momentum quantities increase, but this is not
the reality according to wind tunnel data. According to the experimental results by the University
of Miami [17], there is a limit to jet momentum coefficient to maintain the stability of the flow.
At extremely high jet momentum value, the flow field around the airfoil breaks down, causing
large separation and diminished aerodynamic performance of the airfoil.
The lift-to-drag ratio at 0deg case appears to increase as a function of jet momentum
coefficient. At 6deg AoA, the lift-to-drag ratio seems to maximize when the co-flow jet
momentum is 0.05, and slowly decreases as the jet quantity becomes larger. Based on the
simulation of an airfoil at 0deg and 6deg, the jet momentum coefficient of 0.05 is selected
because it enhanced the overall performance characteristic of an airfoil and contributed to
maximum lift-to-drag ratio at 6deg AoA.

Aerospace Engineering Department 27
Figure 25: Sectional Force Coefficients Comparison between Baseline and Co-Flow Jet (𝑪𝝁 =0.05)
Figure 26: Lift-to-Drag Ratio Comparison between Baseline and Co-Flow Jet (𝑪𝝁 =0.05)
-0.5000
0.0000
0.5000
1.0000
1.5000
2.0000
2.5000
3.0000
-5 0 5 10 15 20
Sect
ion
al L
ift
Co
eff
icie
nt,
Cl
Angle of Attack, α (deg)
Baseline
Co-Flow Jet
0.0000
0.0200
0.0400
0.0600
0.0800
0.1000
0.1200
0.1400
-5 0 5 10 15 20
Sect
ion
al D
rag
Co
eff
icie
nt
Angle of Attack, α (deg)
Baseline
Co-Flow Jet
-10.0
0.0
10.0
20.0
30.0
40.0
50.0
60.0
70.0
-5 0 5 10 15 20
Lift
-to
-Dra
g R
atio
, L/D
Angle of Attack, α (deg)
Baseline
Co-Flow Jet

Aerospace Engineering Department 28
From the above figures, the lift coefficient is improved from baseline for all AoA and
stall is delayed from 6deg to 14deg. Although the stall AoA is delayed by 8deg, the unfavorable
sharp stall behavior still exists. The maximum lift increases from 0.83 to 2.23, or about 190%.
The active flow control, particularly co-flow jet, also enhanced the lift curve slope of the extreme
thick airfoil by 22%, from 6.18rad-1
to 7.53rad-1. At low angle of attack, the drag coefficient for
co-flow jet case is higher but only by a small margin. The drag becomes smaller than the
baseline case when flow on the upper surface starts to separate at AoA of 4deg. Even though the
drag is higher for co-flow jet airfoil, the overall performance lift-to-drag ratio is still improved
from the baseline case for all AoA. The lift-to-drag ratio is increased from 30.0 at 2deg to 58.5 at
10deg AoA, as seen in Figure 26. The significant improvement in both characteristic and
performance values are consistent with the previous research conducted by engineers at the
University of Miami. Figure 27 presents the velocity flow field around co-flow jet modified
FX77-W-343 airfoil from -4deg to 18deg AoA.

Aerospace Engineering Department 29
Figure 27: Co-Flow Jet Active Flow Control on FX77-W-343 Airfoil (𝑪𝝁 = 𝟎. 𝟎𝟓)
𝛼 = −4𝑑𝑒𝑔
𝛼 = −2𝑑𝑒𝑔
𝛼 = 0𝑑𝑒𝑔
𝛼 = 2𝑑𝑒𝑔
𝛼 = 4𝑑𝑒𝑔
𝛼 = 6𝑑𝑒𝑔
𝛼 = 8𝑑𝑒𝑔
𝛼 = 10𝑑𝑒𝑔
𝛼 = 12𝑑𝑒𝑔
𝛼 = 14𝑑𝑒𝑔
𝛼 = 18𝑑𝑒𝑔
𝛼 = 16𝑑𝑒𝑔

Aerospace Engineering Department 30
Figure 28 presents the static pressure contour on the co-flow jet flow control (𝐶𝜇 = 0.05)
airfoil at 0deg and 16deg AoA. At the two AoA cases, the static pressure is lower on the upper
than the lower region.
Figure 28: Static Pressure Contour on Modified FX77-W-343 airfoil at 0deg (left) and 16deg (right) AoA
Figure 29 show the enlarged flow fields near the injection and suction jet of 𝐶𝜇 = 0.05 on
the airfoil upper surface. The distinct differences between freestream and the injection flow
velocity can be seen near the injection slot. The two flow streams velocity is mixed and
enhanced the overall velocity close to the maximum cambered region. On the other side, the
suction slot keeps the flow attached near the trailing edge. Low velocity flow can be found
immediately aft of the suction location caused by the interaction between suction slot and the
wall. It is suggested by the author that this interaction could be reduced by lowering the suction
momentum coefficient.
Figure 29: Velocity Flow Field near Leading Edge (left) and Trailing Edge (right) of Co-Flow Jet Flow
Control FX77-W-343 Airfoil at 6deg AoA

Aerospace Engineering Department 31
The interaction between the injection and suction flow to incoming freestream can also
be seen in the vorticity contour plot, Figure 30. The shear layer between freestream and the
injection generated high intensity vorticity flow, which helps the flow stay attached to the
aerodynamic body. Notice, the blunt trailing edge created vortex shedding behind the airfoil.
Figure 30: Vorticity Field near Leading Edge (top) and Trailing Edge (bottom) of Co-Flow Jet Flow Control
FX77-W-343 Airfoil at 6deg AoA
Figure 31 examined the wake generated by co-flow jet active flow control FX77-W-343
Airfoil at 0deg and 16deg AoA. Consistent with the baseline case, the 0deg AoA airfoil
generated thinner and weaker strength vorticity when compared to the stalled airfoil at 16deg
AoA.

Aerospace Engineering Department 32
Figure 31: Vorticity Field on Co-Flow Jet Flow Control FX77-W-343 Airfoil at 0deg (Top) and 16deg
(bottom) AoA
Figure 32 and Figure 33 present the vorticity field downstream of the 6deg AoA airfoil
with various injections and suction momentum coefficient quantities at 6deg AoA. At the lowest
setting of injection and suction momentum (𝐶𝜇 = 0.01), the flow separation appeared and
generate a large and high-intensity wake trail. Momentum coefficient above 0.012 prevents the
thick airfoil from stalling at 6deg AoA. As demonstrated in Figure 32 and Figure 33, the level of
vorticity intensifies in the wake as the injection and suction jet momentum coefficient increases,
which is consistent with the data provided in Figure 23 and Figure 24. At 6deg AoA with
injection and suction momentum of 0.05, the extremely thick FX77-W-343 airfoil has the
thinnest and lowest intensity wake structure, yielding the performance with lowest sectional drag
coefficient and highest lift-to-drag ratio.

Aerospace Engineering Department 33
Figure 32: Comparison of the Wake Structure with Various Injection and Suction Momentum Coefficient on
Co-Flow Jet Flow FX77-W-343 airfoil at 6deg AoA
𝐶𝜇 = 0.01
𝐶𝜇 = 0.025
𝐶𝜇 = 0.05
𝐶𝜇 = 0.10

Aerospace Engineering Department 34
Figure 33: Comparison of the Wake Structure with Various Injection and Suction Momentum Coefficient on
Co-Flow Jet Flow FX77-W-343 airfoil at 6deg AoA (continue)
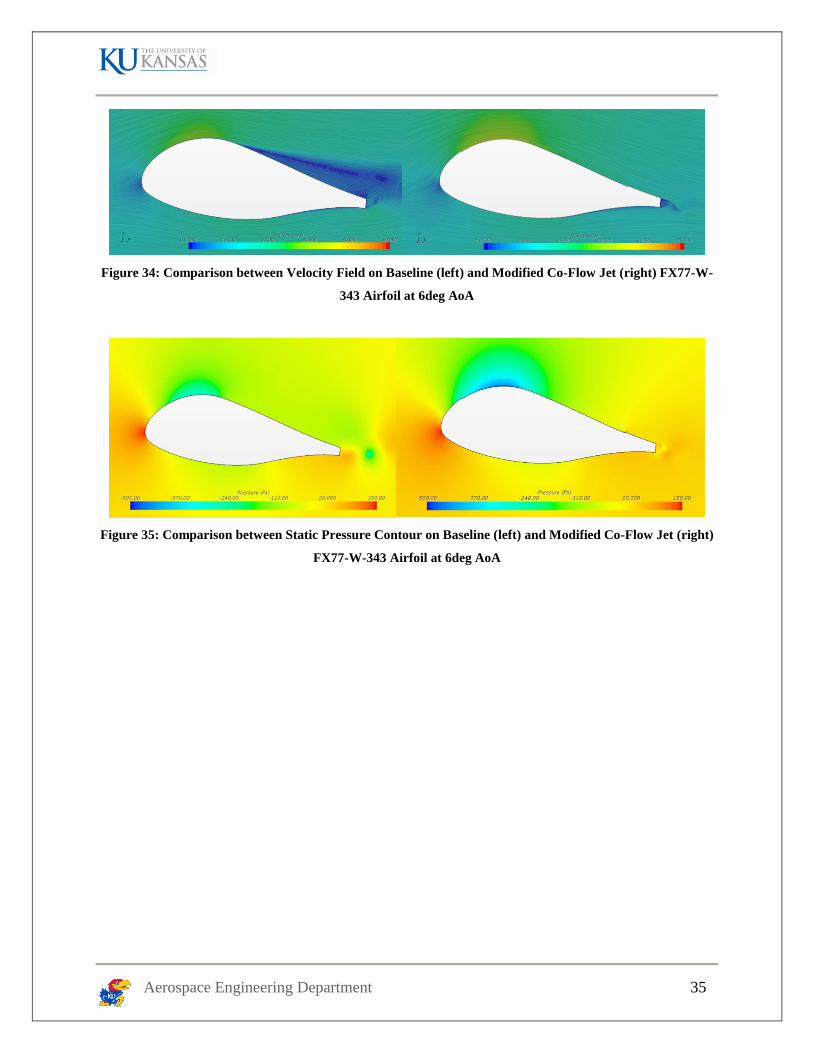
Figure 34 demonstrates side-by-side comparison between flow field velocity of clean and
modified FX77-W-343 airfoil. In the baseline case, flow separation occurred immediately aft of
the maximum cambered. The co-flow jet with injection and suction slots keep the flow attached
on the airfoil upper surface. The maximum flow velocity of the active flow airfoil is also higher,
which suggests lower minimum static pressure. Figure 35 compares static pressure on baseline
and co-flow jet airfoil at 6deg AoA. As suggested by the velocity field, the momentum and
overall static pressure of the flow control airfoil is lower than the baseline case. The difference is
pressure between upper and lower surface of the airfoil results in lift force. The comparison in
Figure 34 and Figure 35 confirms the increase in performance of the co-flow jet active flow
control.
𝐶𝜇 = 0.12
𝐶𝜇 = 0.15
𝐶𝜇 = 0.20
Aerospace Engineering Department 35
Figure 34: Comparison between Velocity Field on Baseline (left) and Modified Co-Flow Jet (right) FX77-W-
343 Airfoil at 6deg AoA
Figure 35: Comparison between Static Pressure Contour on Baseline (left) and Modified Co-Flow Jet (right)
FX77-W-343 Airfoil at 6deg AoA

Aerospace Engineering Department 36
5 Conclusion and Recommendation
This Master Thesis documents the investigation of co-flow jet active flow control on
34.4% thick FX77-W-343 airfoil using STAR-CCM+. The geometry of the airfoil is created by
connecting the top and bottom coordinate points using the spline curve feature in NX 8.5. The
geometry is imported into STAR-CCM+ to create the flow domain. The field flow domain is
meshed in 2-D with a polyhedral and prism layer mesher. The mesh sensitivity is performed for
this airfoil case and is concluded that the domain must have at least 50,000 elements. For the
physics model, RANS is selected to be the governing equations with constant density gas flow.
The SST K-Omega turbulence model is chosen mainly because it performs well in adverse
pressure gradients, or stall regions. The low wall 𝑦+ treatment is applied in order to achieve
accurate force coefficient results in low Reynolds simulations.
The validation simulation case is conducted at Reynolds number of 1,000,000 on NREL
S825 airfoil instead of FX77-W-343 due to the availability of the experimental wind tunnel data.
NREL S825 simulation result follows the behavior of the airfoil in the wind tunnel with
acceptable sectional force coefficient values.
The simulation of FX77-W-343 airfoil is executed with the exact same mesh and physics
settings as the validation case on NREL S825. The co-flow jet modified airfoil is chosen to have
two slots with a height of 4mm at 8% and 85% chord. The injection and suction jet momentum
coefficient is selected to be 0.05 and simulated in the 15.66m/s flow, or 1,000,000 Reynolds
number. The co-flow jet active flow control made a significant improvement in terms of
aerodynamic performance and behavior. The simulation showed that the maximum lift
coefficient is increased by 190%, lift curve slope amplified by 22%, and maximum lift-to-drag
ratio improved by 94%. Although the undesirable sharp stall behavior still persists, the operating
margin has increased because stall AoA is delayed from 6deg to 14deg.
For future improvement in the study of co-flow jet active flow control related to wind
turbine application, the study should be done to understand the relationship between the cost of
injection and suction jet flow, and the return in terms of power being generated. The wind
turbine equipped with co-flow jet flow control also should be modeled in 3-D CFD to see the
effect of 3-D flow with the active flow control modification.

Aerospace Engineering Department 37
6 Reference
1. Anon. “UIUC Airfoil Coordinates Database,” UIUC Applied Aerodynamics Group,
University of Illinois Urbana-Champaign, Department of Aerospace Engineering, [Online],
http://m-selig.ae.illinois.edu/ads/coord_database.html, [retrieved 26 April 2016].
2. Anon., “NREL’s S825 Airfoil Graphic and Coordinates,” National Renewable Energy
Laboratory, October 2014, [Online], http://wind.nrel.gov/airfoils/shapes/S825_Shape.html,
[retrieved 26 April 2016].
3. Anon., “Spotlight on Turbulence,” The Steve Portal, February 2016, [Online],
https://steve.cd-adapco.com/articles/en_US/FAQ/Spotlight-on-Turbulence [retrieved 26
April 2016].
4. Anon., “The Siemens D7 Platform,” Siemens, [online],
http://www.energy.siemens.com/us/en/renewable-energy/wind-power/platforms/d7-
platform/, [retrieved 26 April 2016].
5. Anon., “User Guide,” STAR-CCM+, CD-Adapco, [Online], http://stevedocs.cd-
adapco.com/ViewDocs/authdocs/starccmplus_latest_en/index.html?param=8pGTb&authLoc
=https%3A%2F%2Fsteve.cd-adapco.com%2FAuthoriseRedirect, [retrieved 26 April 2016].
6. Anon., “Wind Power’s Beginnings (1000 B.C. – 1300 A.D.),” Illustrated History of Wind
Power Development, [online], http://telosnet.com/wind/early.html [retrieved 26 April 2016].
7. Djojodihardjo, H., Abdulhamid, M. F., Basri, S., Romli, F. I., and Abdul Majid, D. L. A., “
Numerical Simulation and Analysis of Coanda Effect Circulation Control For Wind-Turbine
Application Considerations,” IIUM Engineering Journal, Special Issue University of Pultra
Malaysia (UPM), Department of Aerospace Engineering, 2011.
8. Grasso, F., “Development of Thick Airfoils for Wind Turbines,” Energy Research Centre of
the Netherlands, January 2012.
9. Nguyen, C., “Incompressible Case,” Turbulence Modeling, [online],
http://www.mit.edu/~cuongng/Site/Publication_files/TurbulenceModeling_04NOV05.pdf,
[retrieved 26 April 2016].

Aerospace Engineering Department 38
10. Penny, C., “Subsonic Wing Simulation Tutorial and Best Practices,” The Steve Portal, CD-
Adapco, May 2014, [Online Video], https://steve.cd-adapco.com/articles/en_US/Video/
Subsonic-Wing-Simulation-Tutorial-and-Best-Practices [retrieved 26 April 2016].
11. Piperas, A. T., “Investigation of Boundary Layer Suction on a Wind Turbine Airfoil using
CFD,” DTU Mechanical Engineering, Department of Mechanical Engineering, Denmark,
August 2010.
12. Raina, A. A., Lee, K. T., Wetzel, K. K., “Optimization and Design of a 105m Blade for a
10MW Hurricane-Resilient Wind Turbine,” 33rd
Wind Energy Symposium, Kissimmee,
Florida, 2015.
13. Raina, A. A., Wetzel, K. K., Farokhi, S., “Modeling and Simulation of a 3MW Wind Turbine
Blade for Determination and Analysis of flow characteristics,” 33rd
Wind Energy
Symposium,Kissmee, Florida, 2015.
14. Shapiro, A. H., “Film Notes for Vorticity,” National Committee for Fluid Mechanics Films,
Massachusetts Institute of Technology, Cambridge, Massachusetts, 1969.
15. Somers, D. M., “Design and Experimental Results for the S825 Airfoil,” National Renewable
Engery Laboratory, Golden, Colorado, 1999, [Online], http://www.nrel.gov/docs/fy05osti/
36346.pdf, [retrieved 26 April 2016].
16. Zha, G. Gao, W., and Paxton, C., “Numerical Simulation of Co-Flow Jet Airfoil Flow,” AIAA
Aerospace Sciences Meeting and Exhibit 2006, University of Miami, Department of
Mechanical and Aerospace Engineering, 2006.
17. Zha, G., Carroll, B. F., “High Performace Airfoil Using Co-Flow Jet Flow Control,” AIAA
2005, University of Miami, Department of Mechanical and Aerospace Engineering, 2005.