investigation of diagnostic and prognostic testing …
TRANSCRIPT

INVESTIGATION OF DIAGNOSTIC AND PROGNOSTIC TESTING FOR PERI-
IMPLANTITIS USING QUANTITATIVE METABOLOMICS
A THESIS
SUBMITTED TO THE FACULTY OF THE
UNIVERSITY OF MINNESOTA
BY
JANELLE HAMILTON, DMD
IN PARTIAL FULFILLMENT OF THE REQUIREMENTS
FOR THE DEGREE OF
MASTER OF SCIENCE
MASSIMO CONSTALONGA, DMD, PhD
OCTOBER 2020

© Janelle Hamilton 2020
i
Acknowledgements
I thank and acknowledge the following individuals who have assisted me throughout this
project and write-up:
Dr. Massimo Costalonga, for his help and guidance. His knowledge, expertise and
dedication to the field of periodontics is unparalleled.
Mr. Todd Rappe, at the Minnesota Nuclear Magnetic Resonance (NMR) Center, for
carrying out the analysis and identifying metabolites within our PISF samples.
Erich Kummerfeld and Dyah Adila, for their help in the biostatistical analysis of our data.
My co-residents and the Graduate Periodontology Clinic assistants, who helped me with
subject recruitment and sample collection.
Finally, I thank the patients from the University of Minnesota School of Dentistry who
volunteered to participate in this study.

ii
Dedications
I dedicate this thesis to the professors of the University of Minnesota School of Dentistry
who instructed me during my residency program from 2015-2018. They instilled in me a
quest for learning and a desire to investigate the clinical unknown. Hopefully, this will
be a lifelong endeavour.

iii
Abstract
Background: Research has primarily focused on finding diagnostic and prognostic tests
that can distinguish between peri-implant health and disease. Current diagnostic
modalities for peri-implant disease include radiographic and clinical measures that
measure damage from previous episodes of peri-implant breakdown and are unable to
predict susceptibility to future peri-implant disease. To date, biomarkers found in peri-
implant sulcular fluid (PISF) have demonstrated low accuracy and predictability at
diagnosing peri-implantitis. Recent advances in metabolomics have been of interest in
the field of periodontics owing to its potential ability of providing more in-depth
information on disease processes.
Aim: Determine the spectra of metabolites found in PISF that can discriminate between
peri-implant health and disease, and be used to accurately diagnose peri-implantitis.
Methods: In a cross-sectional study, the PISF from 33 peri-implantitis and 26 healthy
control subjects was collected around healthy (probing depth ≤3mm and radiographic
bone loss <2mm) and diseased implants (probing depth ≥6mm and radiographic bone
loss ≥3mm). PISF samples were analyzed using proton nuclear magnetic resonance (H-
NMR) spectroscopy, to obtain 2D proton spectra profiles with water suppression pulse.
Regions of interest (ROIs) were defined based on Total Correlation Spectroscopy
(TOCSY) data from two public databases (MMCD and HMDB). Signal intensities for
each ROI in PISF spectra were generated using rNMR software. A total of 35 PISF
metabolites were assigned. The correlation of each individual metabolite with health or
disease status was calculated with Spearman’s coefficient. The predictive ability of a

iv
metabolite and a combination of metabolites to diagnose peri-implantitis was determined
via receiver operating curves.
Results: Cadaverine/lysine, propionate, alanine/lysine, putrescine/lysine, valine,
tyramine and threonine were significantly correlated with disease, whereas a-
ketoglutarate, isoleucine, proline and uracil were significantly correlated with a healthy
state. AUROC values for individual metabolites correlated with disease were statistically
significant (p<0.05) and ranged between 0.606 and 0.617. The combination of 2 to 4
metabolites slightly increased the AUROC values and ranged between 0.624 and 0.653
(p-value <0.05).
Conclusions: Diseased peri-implant sites demonstrate a spectrum of metabolites that are
statistically different than those from healthy peri-implant sites. Certain metabolites are
positively and negatively correlated with disease. However, individual metabolites and
the combination of 2 to 4 metabolites showed a low discriminatory ability (low
sensitivity and specificity) to differentiate between peri-implant health and disease.

v
Table of Contents
Introduction/Background ............................................................................................ 1
Peri-implant Health and Disease Classifications ................................................................ 2
Etiology and Pathogenesis of Peri-implant Diseases .......................................................... 5
Prevalence of Peri-implant Mucositis and Peri-implantitis ................................................ 7
Current Methods and Advances in Diagnostic and Prognostic Testing for Peri-implant Health and Disease ............................................................................................................. 8
Biologic markers ................................................................................................................................... 9 i. Bacterial Pathogen Biomarkers via Plaque Biofilm Sampling .............................................. 10 ii. Saliva and Gingival Crevicular Fluid/Peri-implant Sulcular Fluid for the Detection of Biomarkers ...................................................................................................................................... 12 iii. Pro-inflammatory and Anti-inflammatory Cytokine Biomarkers .......................................... 13 iv. Enzyme Biomarkers .............................................................................................................. 14 v. Bone-specific Biomarkers ..................................................................................................... 15
Limitations of Studies ....................................................................................................... 18
The Field of ‘Omics .......................................................................................................... 20 i. Nuclear Magnetic Resonance (NMR) Spectroscopy vs. Mass Spectrometry (MS) ..................... 23 ii. Metabolites as Predictors for Periodontitis ............................................................................... 26
a. Metabolites in GCF ............................................................................................................... 26 b. Metabolites in Saliva ............................................................................................................. 27
iii. Metabolites as Predictors for Peri-implantitis ........................................................................... 30 a. Metabolites in GCF and Saliva ............................................................................................. 30
Statement of the Problem .......................................................................................... 30
Null Hypothesis ......................................................................................................... 31
Alternate Hypothesis ................................................................................................. 31
Aim ........................................................................................................................... 31
Methods .................................................................................................................... 32
Sample Size Determination .............................................................................................. 32
Subject Recruitment and Inclusion/Exclusion Criteria ................................................... 32
Intra-/Inter-examiner Reliability ..................................................................................... 33
Baseline Examination ....................................................................................................... 35
Six-month Recall Examinations ....................................................................................... 38
Sample Collection ............................................................................................................. 38
Sample Preparation/Processing for Proton-Nuclear Magnetic Resonance (1H-NMR) measurements ................................................................................................................... 40
Analysis of Proton Nuclear Magnetic Resonance Output Data ....................................... 41

vi
Statistical Analysis ........................................................................................................... 42
Results ...................................................................................................................... 44
Demographic Characteristics ........................................................................................... 44
Clinical Parameters .......................................................................................................... 50
Multivariate Analysis Using Principal Component Analysis (PCA) and Partial Least Squares Discriminant Analysis (PLS-DA) 2D Score Plots ............................................... 58
Spearman’s Rank Correlation Coefficient ....................................................................... 70
Receiver Operating Characteristics (ROC) analyses for diagnostic value ....................... 75
Discussion ............................................................................................................... 100
Strengths and Limitations .............................................................................................. 102
Future Research ............................................................................................................. 104
Conclusions ............................................................................................................. 107
Bibliography ........................................................................................................... 108

vii
List of Tables Table 1. Number of healthy, other or diseased implants in each diagnosis group. .......... 47 Table 2. Number of anterior and posterior implants in each diagnosis group. ................ 47 Table 3. Demographic characteristics: Frequency distributions of variables. ................. 49 Table 4. Overall clinical parameters for each diagnosis group. ....................................... 51 Table 5. Site-specific peri-implant mean probing depths and bone loss of sampled sites for each diagnosis group. .................................................................................................. 53 Table 6. Number and proportion of sampled implant sites based on various probing depth and bone loss categorical ranges for each diagnosis group. ............................................. 55 Table 7. Number and proportion of sampled implant sites with and without bleeding on probing for healthy, other or peri-implantitis groups. ....................................................... 57 Table 8. Spearman’s rank correlations (rho) between individual metabolites and site-specific peri-implant status (healthy implant vs other implant vs diseased implant). ...... 71 Table 9. Area under the curve (AUC) for individual metabolites. ................................... 76 Table 10. Area under the curve (AUC) for the combination of metabolites significantly correlated with health and disease. ................................................................................... 89

viii
List of Figures
Figure 1. Schematic comparison of peri-implant health (lack of gingival inflammation and bone loss) and peri-implantitis (presence of gingival inflammation and bone loss). ... 4 Figure 2. The interplay of the different compartments studied by ‘omics technologies (Grant 2012). ..................................................................................................................... 22 Figure 3. Example of standardized/true radiographic bone level measurement .............. 37 Figure 4. CONSORT Flow Diagram ............................................................................... 45 Figure 5. Example of Healthy Site TOCSY 2D NMR Spectra. ....................................... 59 Figure 6. Example of Diseased Site TOCSY 2D NMR Spectra. ..................................... 60 Figure 7. Example of diseased site overlayed over healthy site TOCSY 2D NMR Spectra. .............................................................................................................................. 61 Figure 8. Example of defining regions of interest (ROIs). .............................................. 63 Figure 9. Principal component analysis (PCA) 2D score plot demonstrating the distribution patterns of ROIs in buffer membrane (light blue), diseased implant (red), healthy implant (green) and saliva (royal blue) samples. ................................................. 65 Figure 10. Partial least squares discriminant analysis (PLS-DA) 2D score plot demonstrating the distribution patterns of ROIs in buffer membrane (light blue), diseased implant (red), healthy implant (green) and saliva (royal blue) samples. .......................... 66 Figure 11. Principal component analysis (PCA) 2D score plot demonstrating the distribution patterns of ROIs in diseased implant (red) and healthy implant (green) samples. ............................................................................................................................. 68 Figure 12. Partial least squares discriminant analysis (PLS-DA) 2D score plot demonstrating the distribution patterns of ROIs in diseased implant (red) and healthy implant (green) samples. ................................................................................................... 69 Figure 13. Spearman’s rank correlation coefficient graph for individual metabolites. ... 74 Figure 14. Receiver operating characteristic (ROC) graph and box plot for cadaverine.lysine.1 ............................................................................................................ 79 Figure 15. Receiver operating characteristic (ROC) graph and box plot for cadaverine.lysine.2 ............................................................................................................ 80 Figure 16. Receiver operating characteristic (ROC) graph and box plot for propionate. 81 Figure 17. Receiver operating characteristic (ROC) graph and box plot for alanine.lysine.2. ................................................................................................................ 82 Figure 18. Receiver operating characteristic (ROC) graph and box plot for alpha.ketoglutarate.2 ......................................................................................................... 84 Figure 19. Receiver operating characteristic (ROC) graph and box plot for isoleucine.285 Figure 20. Receiver operating characteristic (ROC) graph and box plot for proline.2 .... 86 Figure 21. Receiver operating characteristic (ROC) graph and box plot for uracil.1 ...... 87 Figure 22. Receiver operating characteristic (ROC) graph for the combination of cadaverine.lysine.2 and cadaverine.lysine.1 ..................................................................... 91 Figure 23. Receiver operating characteristic (ROC) graph for the combination of cadaverine.lysine.1 and propionate ................................................................................... 91 Figure 24. Receiver operating characteristic (ROC) graph for the combination of cadaverine.lysine.1 and alanine.lysine.2 ........................................................................... 92 Figure 25. Receiver operating characteristic (ROC) graph for the combination of cadaverine.lysine.2 and propionate ................................................................................... 92

ix
Figure 26. Receiver operating characteristic (ROC) graph for the combination of cadaverine.lysine.2 and alanine.lysine.2 ........................................................................... 93 Figure 27. Receiver operating characteristic (ROC) graph for the combination of cadaverine.lysine.2, cadaverine.lysine.1 and propionate .................................................. 93 Figure 28. Receiver operating characteristic (ROC) graph for the combination of cadaverine.lysine.2, cadaverine.lysine.1, propionate and alanine.lysine.2 ....................... 94 Figure 29. Receiver operating characteristic (ROC) graph for the combination of alpha.ketoglutarate.2 and proline.2 ................................................................................... 96 Figure 30. Receiver operating characteristic (ROC) graph for the combination of alpha.ketoglutarate.2 and uracil.1 ..................................................................................... 96 Figure 31. Receiver operating characteristic (ROC) graph for the combination of isoleucine.2 and alpha.ketoglutarate.2 .............................................................................. 97 Figure 32. Receiver operating characteristic (ROC) graph for the combination of isoleucine.2 and proline.2 ................................................................................................. 97 Figure 33. Receiver operating characteristic (ROC) graph for the combination of isoleucine.2 and uracil.1 ................................................................................................... 98 Figure 34. Receiver operating characteristic (ROC) graph for the combination of proline.2 and uracil.1 ........................................................................................................ 98 Figure 35. Receiver operating characteristic (ROC) graph for the combination of isoleucine.2, alpha.ketoglutarate.2 and proline.2 .............................................................. 99 Figure 36. Receiver operating characteristic (ROC) graph for the combination of isoleucine.2, alpha.ketoglutarate.2, proline.2 and uracil.1 ................................................ 99

x
Key Abbreviations
BOP: Bleeding on probing
CAL: Clinical attachment level
ELISA: Enzyme-linked immunosorbent
assay
GCF: Gingival crevicular fluid
GC-MS: Gas chromatography-mass
spectrometry
HMDB: Human Metabolome Database
ICTP : Pyridinoline cross-linked
carboxyterminal telopeptide of type I
collagen
IL-#: Interleukin-#
LC-MS: Liquid chromatography-mass
spectrometry
MMP-#: Matrix metalloproteinase-#
NMR : Nuclear magnetic resonance
OPG : Osteoprotegerin
PD: Probing depths
PDL: Periodontal ligament
PISF: Peri-implant sulcular fluid
RANK: Receptor activator of nuclear
factor kappa B
RANKL: Receptor activator of nuclear
factor kappa B ligand
ROS: Reactive oxygen species
TNF-a: Tumor necrosis factor-a

1
Introduction/Background
The use of dental implants has been increasing since their introduction by
Brånemark in the early 1980s 1, 2. Patients and practitioners have now widely accepted
dental implants for the replacement of missing teeth due to their improved comfort,
esthetics and function. Most patients express greater satisfaction with dental implants
compared to conventional fixed or removable dentures 3. National Health and Nutrition
Examination Surveys, conducted between 1999 and 2016, demonstrated a 0.7%
prevalence of dental implants in the United States in the year 2000. This prevalence
increased to 1.9% in 2010 and to 5.7% in 2016 4. If the trend continues, it is estimated
that the prevalence of dental implants will reach approximately 17% by 2026 4.
Additionally, dental implants have excellent survival rates. Implants supporting single
crowns demonstrate survival rates of 97.2% at 5 years and 95.2% at 10 years 5 and
implants supporting fixed partial dentures demonstrate survival rates of 94.5% at 5 years
6.
However, scrutiny has been given to the term “implant survival” and its use in
research, because it only pertains to a dichotomous outcome: the implant is present intra-
orally or it is lost (i.e., “implant failure”). The term “implant survival” does not fully
describe “implant success”, which includes, among its aspects, consideration of
biological and mechanical complications associated with the implant itself. Pain,
mobility, peri-implant soft tissue inflammation, crestal bone loss and prosthetic
complications (e.g., abutment screw loosening and porcelain fracture) are clinical
measures that better describe success than does survival 7. Including implant success

2
criteria in research is important as these affect patient acceptance of dental implants and
perceived effectiveness in improving the overall quality of their chewing function. Of
recent interest, one of the most severe complications associated with dental implants is
the development of peri-implant diseases in the form of gingival inflammation and crestal
bone loss, termed peri-implant mucositis and peri-implantitis, respectively 8. These are
discussed next to provide a common foundation underpinning this investigation.
Peri-implant Health and Disease Classifications
The original description of peri-implant disease was first introduced in 1993 at the
First European Workshop on Periodontology 9 and was subsequently refined at the 2017
World Workshop of the American Academy of Periodontology and European Federation
of Periodontology. The case definitions and diagnostic criteria for peri-implant health
and disease were agreed to, so that standardized classification systems could be used in
clinical practice, and in reporting epidemiologic studies. Guidelines confirm that
thorough clinical and radiographic exams are necessary for proper diagnoses 10. An
implant is deemed healthy when there is absence of peri-implant signs of inflammation
(i.e., pink, firm and stippled gingiva in the absence of swelling) without bleeding on
probing (BOP) or suppuration. Additionally, probing depths of less than 5 mm are
generally viewed as healthy, with less than 2 mm of crestal bone loss as evidenced
radiographically. However, it is important to recognize that probing depths often vary
based on initial height of soft tissue and depth of implant placement. Generally, it is
accepted that an increase in probing depth from baseline is not associated with health 10-

3
13. It is also well understood that during the first year after implant placement and
loading, there is 0.5 to 2 mm of crestal bone loss that occurs due to healing of the peri-
implant tissues and non-pathologic bone remodeling at the implant abutment interface
(IAI) 14, 15.
From a pathologic standpoint, peri-implant disease comprises peri-implant
mucositis and peri-implantitis. The diagnosis of peri-implant mucositis is established
when there are visible signs of mucosal inflammation (i.e., erythema, swelling, edema)
and presence of bleeding on probing and/or suppuration. Probing depths may or may not
be deepened but radiographically, there are no signs of additional crestal bone loss past
initial bone remodeling 10, 12, 13, 16. Peri-implantitis has similar clinical findings to peri-
implant mucositis with signs of gingival inflammation being present, however
radiographically, there is the presence of additional crestal bone loss ofgreater than 2 mm
after one-year of functional loading. Probing depths may also be increased compared to
baseline values, however, in the occurrence of gingival recession, they may be similar or
less than baseline measures. In the absence of baseline radiographs, the diagnosis of peri-
implantitis can be formulated if the following are present: crestal bone level ≥3 mm from
implant abutment interface, presence of bleeding on probing and probing depths ≥6 mm
10, 12, 13, 17. A schematic description of peri-implant health and peri-implantitis is depicted
in Figure 1.

4
Figure 1. Schematic comparison of peri-implant health (lack of gingival inflammation and bone loss) and peri-implantitis (presence of gingival inflammation and bone loss).

5
Etiology and Pathogenesis of Peri-implant Diseases
Like gingivitis and periodontitis, the primary etiology of peri-implant mucositis
and peri-implantitis is the accumulation of supra- and sub-gingival bacterial biofilms 16,
18-20. Two longitudinal randomized controlled trials by Pontoriero et al. and Salvi et al.
confirmed this cause-and-effect relationship between peri-implant disease and bacterial
biofilm accumulation by demonstrating that when oral hygiene care was discontinued for
three weeks in patients with implants, there was development of visible signs of peri-
implant soft tissue inflammation 19, 21. However, when oral hygiene care was reinstated,
peri-implant gingiva returned to a state of health within three weeks, indicating the
reversibility of peri-implant mucositis 21. Unlike peri-implant mucositis, peri-implantitis
can be stabilized with treatment but is irreversible. Even with improved oral hygiene and
reduced signs of gingival inflammation, peri-implant bone loss, occurring as a result of
the disease, does not return to its original location along the implant surface 17. Not all
patients with peri-implant mucositis will develop peri-implantitis but, like gingivitis and
periodontitis, the transition from peri-implant mucositis to peri-implantitis is
multifactorial and includes a bacterial challenge and the presence of environmental and
genetic factors that increase the host susceptibility to disease 17, 22. Additionally, the
pattern of bone loss in peri-implantitis varies between patients but usually follows a non-
linear and accelerating pattern 23, 24. It has also been suggested that the onset of peri-
implantitis occurs early, usually within two to three years post-loading 23.

6
In comparison to teeth, there is a greater inflammatory response to bacteria at
implant sites 21, 25 due to the microgap between the implant and the abutment 26, 27, and
the destruction in peri-implantitis is faster and more extensive than in periodontitis 11, 28,
29. This characteristic may be due to anatomical differences between teeth and implants
11. In contrast to teeth, dental implants lack cementum, periodontal ligament (PDL) and
alveolar bone proper. Due to the lack of cementum, collagen connective tissue fibers run
parallel to the implant surface, rather than inserting perpendicularly as when teeth are
present 30. Additionally, due to the lack of periodontal ligament fibers, implants are
intimately connected to bone (i.e., osseointegration). It is thought that because there are
no inserting gingival fibers nor PDL, there is a reduced physical barrier to bacterial
aggression and thus a greater susceptibility to the spread of infection and bone loss. Due
to the lack of PDL, there is also a reduced amount of blood supply. Finally, implants
only obtain their blood supply from the supraperiosteal vessels, rather than also from
PDL vessels. Thus, it is speculated that due to the restricted blood supply, there are
reduced immune cells readily available to offset bacterial-induced inflammation 25, 31.
The exponential progression of bone loss around implants, in comparison to teeth,
may also be related to the implant surface topography. It has been suggested that implant
surface roughness may have an influence on changes in peri-implant bone levels and may
affect the incidence of peri-implantitis. In a ligature-induced peri-implantitis and
periodontitis experiment in dogs, it was demonstrated that a greater amount of bone loss
was noted around implants with a modified surface than around teeth or implants with a
smooth surface 32. In comparison to teeth, the histological analysis also revealed a
greater inflammatory response in peri-implantitis, with cell infiltrates containing greater

7
proportions of neutrophil granulocytes and osteoclasts and extending closer to the
alveolar bone crest 32. The uniform and circumferential susceptibility to biofilm
colonization around the exposed roughened implant surface may also increase the risk for
peri-implantitis progression 33, 34. In another ligature-induced peri-implantitis experiment
in dogs, histological findings suggested more conspicuous formation of biofilm a greater
apical extension of this biofilm around roughened implants in comparison to turned
implants 35.
Prevalence of Peri-implant Mucositis and Peri-implantitis
Although epidemiologic data are relatively scarce thus far, peri-implant disease
prevalence seems to be increasing. One systematic review published in 2008 reported
peri-implant mucositis occurred in greater than 80% of patients and 50% of implant sites,
and peri-implantitis occurred in 28-56% of patients and 12-40% of implant sites 36.
Another systematic review in 2015 by Derks et al. reported 43% of patients had peri-
implant mucositis and 22% had peri-implantitis 37. A more recent systematic review in
2017 by Lee et al. found a prevalence of peri-implant mucositis in 29.5% of implant sites
and 46.8% of individuals, whereas peri-implantitis was found in 9.3% of implant sites
and 19.8% of individuals 38. Additionally, a systematic review in 2018 demonstrated that
patients with implants undergoing regular maintenance care tended to have a lower
prevalence of peri-implantitis (9%), compared to those not complying with a regular
maintenance schedule (18%) 39. Unfortunately, once peri-implantitis develops, its
treatment is unpredictable and often costly to remedy 40-42. This highlights the need for

8
proper diagnosis and prevention of peri-implant diseases and ideally, discovering
sensitive and specific techniques to predict future peri-implant bone loss.
Current Methods and Advances in Diagnostic and Prognostic Testing for
Peri-implant Health and Disease
As with periodontal disease 43-46, research has primarily focused on finding
diagnostic and prognostic tests that can distinguish between peri-implant health and
disease. Studies that investigate disease severity, disease activity, disease susceptibility
and treatment outcomes are common. Current diagnostic modalities for peri-implant
disease include clinical assessments such as probing depth, bleeding on probing,
suppuration, mobility and radiographic assessments quantifying the amount of alveolar
bone loss that has already occurred 25, 47. These conventional diagnostic methods are in
use in clinical practice today, because they are cost-effective and relatively non-invasive.
Unfortunately, these diagnostic modalities only measure damage from previous episodes
of peri-implant breakdown (i.e., disease history) and do not determine disease activity or
susceptibility to future peri-implant bone loss. In two prospective studies by Weber et al.
and Giannopoulou et al., there was low correlation between bone-level changes around
implants and probing depth, bleeding on probing, suppuration, plaque index or mobility
48, 49. Thus, the authors concluded that clinical measures have limited value in predicting
future peri-implant bone loss. Additionally, the absence of peri-implant bleeding on
probing has been shown to have a high negative predictive value but a poor positive
predictive value for disease progression 50. Thus, in the absence of bleeding on probing,

9
there is a reduced risk of disease progression but in the presence of bleeding on probing,
it is unknown whether disease progression will occur. Another problem with using these
conventional diagnostic methods is the over-diagnosis of peri-implant pathology and the
inability to determine disease activity, resulting in the possibility of unnecessary
subsequent treatment 25. It is critical to detect the presence of peri-implant disease in its
early stages, because implant morbidity and potential failure pose a significant financial
burden to clinician and patient 51. Thus, there exists a need for objective diagnostic and
prognostic tests that can detect the presence of peri-implantitis, differentiate between
active and inactive disease sites, and determine patient susceptibility to future
breakdown. Ideally, such tests will allow tailoring of patient-specific treatment plans,
rather than treating all active and inactive disease sites like they have identical
susceptibility to disease initiation and progression.
Biologic markers
Biologic markers (i.e., biomarkers) were defined in 1998 by the National Institutes of
Health as “a characteristic that is objectively measured and evaluated as an indicator of
normal biological processes, pathogenic processes, or pharmacologic responses to a
therapeutic intervention” 52. The World Health Organization subsequently added to this
definition by stating that a biomarker is “any substance, structure, or process that can be
measured in the body or its products and influence or predict the incidence or outcome of
disease” 53. Ideal biomarkers used for diagnostic or prognostic tests should be able to
indicate the presence of disease before considerable clinical damage has occurred 46. As
10
such, biomarkers should have high sensitivity and specificity for disease detection, with
values approaching 100%. Ideally, a chair-side test should be able to accurately detect
useful biomarkers that can help diagnose (i.e., health vs. gingivitis/peri-implant mucositis
vs. periodontitis/peri-implantitis) and classify disease (i.e., chronic periodontitis vs.
aggressive periodontitis), allow for proper treatment planning (i.e., non-surgical vs
surgical therapy) and monitor treatment outcomes during maintenance therapy 46. Much
research has been conducted to determine whether objective and quantifiable biomarkers
can be used as surrogate endpoints to accurately diagnose or predict specific clinical
endpoints 54. Research in periodontics and implant dentistry has demonstrated that
biomarkers show promise to objectively, accurately and predictably measure the presence
of periodontal/peri-implant disease and risk for disease progression.
i. Bacterial Pathogen Biomarkers via Plaque Biofilm Sampling
To date, pathogen-based diagnostic tests, using plaque biofilm sampling, have been
used as adjuncts to traditional methods of detecting disease (i.e., clinical and radiograph
assessment). The goal of their use is to determine current disease activity and possible
risk of disease development and progression. Studies have shown that the composition of
the peri-implantitis microflora is a complex polymicrobial anaerobic infection,
resembling that of periodontitis. The microorganisms most often associated with peri-
implantitis are: T. forsythia, P. gingivalis, T. denticola, P. nigrescens, P. intermedia and
F. nucleatum 55-57. However, the composition of the biofilm in peri-implantitis differs
only slightly from that of periodontitis in that it also harbors S. aureus, C. albicans, P.

11
aeruginosa and Enerobacteriaceae 58, 59. Due to the multifactorial nature of peri-
implantitis, it is evident that the mere presence or quantity of these microbes cannot
necessarily predict the presence of peri-implant diseases. A cross-sectional study by
Wang et al. demonstrated that only the presence of T. denticola was significantly
associated with peri-implantitis (OR=4.6, p=0.01) 60. In another study by Salcetti et al.,
only the detection of P. nigrescens, P. micros and F. nucleatum was significantly
associated with failing implants 61. Additionally, the detection of specific peri-implant
pathogens in subgingival biofilms has shown equivocal results for the progression of
peri-implant disease. De Leitão et al. conducted a cross-sectional study on healthy
implants and determined the qualitative presence of A. actinomycetemcomitans, P.
gingivalis and P. intermedia, in the subgingival microflora of healthy implant sites, as a
possible risk for development of peri-implantitis 62. In a two-year longitudinal study by
Mencio et al. comparing screw-retained and cement-retained implants, the “red complex”
bacteria (T. denticola, P. gingivalis, P. intermedia) were significantly associated with the
risk of developing peri-implantitis in both groups 63. Although promising, pathogen-
based diagnostic tests have a low positive predictive value in diagnosing peri-implant
disease and determining future disease activity. There exists little sensitivity and
specificity of predicting disease status and progression by qualitatively or quantitatively
identifying subgingival microorganisms via plaque biofilm sampling 64. This may be
because, like in periodontitis, some microbial bacteria are uncultivable and cannot be
detected via current modalities but may be necessary for the initiation and progression of
peri-implantitis 45. Additionally, because peri-implantitis is a multifactorial disease, the
presence of a specific bacterial biofilm may be insufficient to lead to the development of

12
peri-implantitis. One must also consider that the host response and individual
susceptibility also play a major role in the development of the disease. To overcome
these problems, newer strategies using host response, inflammatory mediators and
specific bone markers in peri-implant sulcular fluid have recently been employed.
ii. Saliva and Gingival Crevicular Fluid/Peri-implant Sulcular Fluid for the
Detection of Biomarkers
Significant advances in diagnostics have been made using oral fluids, such as gingival
crevicular fluid and saliva, for the detection of oral and systemic diseases. Gingival
crevicular fluid (GCF) was first described in 1899 in the periodontal sulcus of teeth 65. It
is an inflammatory exudate derived from blood plasma 66 that crosses the permeable
dento-gingival junction to enter the gingival sulcus or pocket 67. GCF is present in a state
of health 68. However, in the presence of gingival and periodontal disease, the volume of
GCF increases and is directly associated with the severity of the inflammation, the
microvascular gingival permeability and the ulceration of the gingival sulcus 69, 70. Peri-
implant sulcular fluid (PISF) is the implant counterpart to GCF around teeth 71, and its
volume and flow is similar to that of GCF in health and disease 51. Additionally, as it
travels from the periodontal tissues into the gingival or peri-implant sulcus, it
accumulates local biomarkers such as host response and inflammatory mediators and
bone and connective tissue destruction mediators 43, 72. One of the main advantages of
saliva and GCF/PISF is that they are easily collected, cost-effective to do so, and
relatively non-invasive. Saliva gives a global view of the oral cavity because it contains

13
constituents from many sources such as blood, mucosal and salivary gland exudates,
bacterial and host molecules, and GCF/PISF 45. Sampling of GCF/PISF over saliva has
been of recent interest to researchers because it gives a more accurate “periodontal/peri-
implant specific” depiction of the host or bacterial biofilm molecules present in that
specific site in health or in disease 45, 73, 74. Thus, the use of oral biofluids may allow for
the development of patient-specific, and more importantly, site-specific diagnostic and
prognostic tests for peri-implant disease.
iii. Pro-inflammatory and Anti-inflammatory Cytokine Biomarkers
The host response inflammatory mediators play an important role in inflammatory
diseases, such as peri-implant disease, and either directly or indirectly cause tissue
destruction by activating host immune cells. Considering these immuno-inflammatory
events can occur around peri-implant soft and hard tissue in response to a bacterial
challenge, several studies have focused on detecting cytokines in PISF, as a non-invasive
way of diagnosing peri-implant disease. To date, investigations have generally studied
the two most important cytokines in osteoclast stimulation and bone resorption, IL-1β
and TNF-α, with few investigations looking at other pro-inflammatory cytokines that
may impact periodontal inflammation. Systematic reviews by Duarte et al. and Dursun et
al. compared inflammatory mediators present in PISF between healthy implants and
implants with peri-implantitis 75, 76. Contrasting results were noted, however, findings
generally suggest that levels of pro-inflammatory cytokines (IL-1β, IL-6, IL-17 and TNF-
α) were significantly increased in the PISF from implants with peri-implantitis compared

14
to healthy implants. Additionally, no or minor differences in anti-inflammatory
cytokines (IL-4, IL-8, IL-10 and IL-12) between PISF of healthy and diseased implants
were reported 75, 76. Similarly, a systematic review by Faot et al. demonstrated that pro-
inflammatory cytokines (IL-1β) were significantly increased in PISF of implant sites with
peri-implantitis compared to health 77. However, they also demonstrated that the levels
of pro-inflammatory cytokines did not differ between peri-implant mucositis and peri-
implantitis. This suggests that the presence of certain pro-inflammatory cytokines,
especially IL-1β and TNF-α, are promising for the differentiation between health and
disease, but there is still insufficient sensitivity and specificity of these cytokines at
predicting disease progression. Thus, the ability of these cytokines to predictably
determine the onset or progression of peri-implant mucositis to peri-implantitis with good
positive predictive value is, as of yet, too limited.
iv. Enzyme Biomarkers
Other host response factors, such as matrix metalloproteinases (MMPs) have also
been studied. These proteinases degrade collagen and extracellular matrix proteins and
have been shown to be significantly increased in the presence of periodontitis and peri-
implant disease 76, 78. The use of rapid chairside tests for the detection of MMP-8 in GCF
for the detection and monitoring of periodontitis has been demonstrated. Two
longitudinal studies by Kinane et al. and Mantyla et al. established a positive correlation
between the presence of GCF MMP-8 and periodontal disease diagnosis. The presence
of MMP-8 in GCF yielded a sensitivity of 83% and a specificity of 96% for the diagnosis
15
of periodontitis. Although these biomarkers have shown promise for the detection of
periodontitis, fewer studies have been conducted around implants. A cross-sectional
study by Kivelä-Rajamäki et al. showed MMP-7 and MMP-8 levels were significantly
increased in the PISF of untreated peri-implant mucositis and peri-implantitis sites
compared to healthy implant sites 79. Similarly, an eighteen-month prospective study by
Basegmez et al. and a ten-year retrospective study Ramseier et al. demonstrated that
MMP-8 was a valuable biomarker in characterizing peri-implant inflammation but not
peri-implant disease progression 80, 81. Conversely, a cross-sectional study by Wang et al.
was unable to reveal a difference between MMP-8 levels in PISF of healthy or diseased
implants 60. Finally, a recent systematic review found that studies generally accepted that
MMP-8 in PISF can be used as a diagnostic tool with high sensitivity (90%) and
specificity (70-85%) 82.
v. Bone-specific Biomarkers
The host inflammatory response can vary tremendously amongst individuals and the
mere presence of inflammatory mediators in GCF may not be able to differentiate
between a mild inflammatory state to a more severe inflammatory state with bone loss
(i.e., gingivitis/peri-implant mucositis vs. periodontitis/peri-implantitis) 45. Hence, bone-
specific biomarkers have also been investigated because they measure bone
destruction/homeostasis. Many investigations have assessed the presence of bone loss
biomarkers, such as receptor activator of nuclear factor kappa B (RANK), receptor
activator of nuclear factor kappa B ligand (RANKL), osteoprotegerin (OPG) and
16
pyridinoline cross-linked carboxyterminal telopeptide of type I collagen (ICTP), in PISF
because they may characterize onset and progression of peri-implant diseases. It is
important to recognize that bone homeostasis is regulated by the RANKL/RANK/OPG
pathway. When osteoblasts secrete RANKL, it binds to RANK present on osteoclasts or
their precursors. This triggers bone resorption via differentiation and maturation of
osteoclasts. However, when osteoblasts secrete OPG, it binds to RANKL and inhibits the
binding of RANKL to RANK. This inhibits osteoclast differentiation and protects
against excessive bone resorption 83. The presence of OPG and RANKL in PISF has
shown to be of significance in diagnosing peri-implant disease. A systematic review by
Duarte et al. demonstrated that there was an increased concentration of RANKL in
patients with peri-implantitis compared to those with healthy implants 75. Another study
by Duarte et al. demonstrated that a lower OPG level in PISF was detected in peri-
implant mucositis compared to peri-implantitis 84. A cross-sectional study by Rakic et al.
demonstrated that concentrations of RANKL in PISF were 3 times higher in peri-
implantitis compared to healthy implants, and 1.3 times higher in peri-implantitis
compared to peri-implant mucositis 85. Additionally, RANKL and OPG levels were
significantly higher in peri-implantitis compared to peri-implant mucositis and health.
Another bone biomarker investigated is the carboxy-terminal telopeptide of type-I
collagen (ICTP), a bone-specific type I collagen degradation product resulting from bone
resorption. Once in circulation, they cannot be re-used for collagen synthesis and thus,
are considered specific biomarkers for bone breakdown 45. Given the specificity for
bone, ICTP is a potentially valuable diagnostic aid in periodontics because biochemical
markers specific for bone degradation may be useful in differentiation between the
17
presence of gingival inflammation and active periodontitis or peri-implant bone
destruction 86. A 6-month longitudinal investigation, utilizing a ligature-induced
periodontitis model in beagle dogs, demonstrated that ICTP levels in GCF were
significantly increased in periodontitis as compared to health. This increase occurred as
early as 2 weeks following initiation of disease and preceded radiographic evidence of
alveolar bone loss by 4 weeks87. In humans, significant increases in ICTP levels in GCF
have also been noted, with increasing levels occurring on a continuum from health, to
gingivitis to periodontitis 88. Additionally, the treatment of periodontitis leads to a
reduction in GCF ICTP levels, similar to levels found in health 89. Although studies have
investigated the ability of pyridinoline cross-links to detect the presence of bone
resorption in periodontitis 87-89, with fewer studies being available for peri-implantitis. A
study by Oringer et al. suggested a positive correlation between increased levels of ICTP
in PISF of implant sites that also harbored microbial organisms associated with disease
progression (i.e., P. intermedia, F. nucleatum and S. gordinii) 90. Thus, these findings
suggest that bone loss biomarkers may have the potential to differentiate between peri-
implant health and disease and disease progression. However, the sensitivity and
specificity of these molecules in predicting disease status and progression has not yet
been demonstrated by investigators.
Although it may be possible to use biomarkers in PISF to distinguish between peri-
implant health and disease, they may not be able to distinguish between peri-implant
mucositis and peri-implantitis. Additionally, PISF components may be unable to
distinguish between progressing and non-progressing sites 70. For a biomarker to be a
good predictor of the development of peri-implant disease, it must be present in PISF

18
prior to clinical disease onset. This necessitates the design of observational longitudinal
studies, that would allow for the detection of sites transitioning from health to disease 91.
Finally, identifying a single biomarker for peri-implant disease would be of great
significance for the diagnostic world 60. However, due to the multifactorial cause of
disease, it is unlikely that a single or a few biomarkers in PISF will prove to be accurate
predictors for diagnosing peri-implant health and disease or for predicting future peri-
implant breakdown. It is more possible that a multi-biomarker model approach, using the
combination of host- and site-specific biomarkers, to accurately assess the peri-implant
disease status, will be of better future clinical predictability 92.
Limitations of Studies
Much heterogeneity exists amongst the investigations previously referenced,
accounting for possible discrepancies and contrasting results. Experimental designs vary
greatly from one investigation to another. A wide range of definitions of what constitutes
health, peri-implant mucositis and peri-implantitis were utilized in the investigations.
Stringent subject inclusion and exclusion criteria and standardized definitions of peri-
implant health and disease will improve comparison of studies. Methods of PISF
sampling and handling also vary greatly amongst the studies. Not all studies reported
whether supragingival plaque removal was performed prior to sampling, as plaque
biofilm may impact the constituents of PISF. The number of sampled sites per subject,
the type of sampling devices (i.e., paper points, strips or discs), depth of insertion of

19
sampling devices, and the duration of sampling is not similar across investigations.
Generally, the studies reviewed had small sample sizes, limiting their statistical power.
Proteins (i.e., biomarkers) found in GCF/PISF are commonly analyzed via enzyme-linked
immunosorbent assay (ELISA). One of the limitations of ELISA is the limited number of
proteins that can be identified at one time. Hence, the majority of studies have only
investigated a small number of biomarkers contemporaneously. This limits the
diagnostic value of their findings, especially since a multitude of biomarkers are likely
responsible for the immunopathologic process of disease. Future studies should include
the investigation of a wider range of biomarkers and use highly sensitive immunoassays
for their detection. Additionally, due to the differing volume of PISF in peri-implant
health versus disease, the total quantity of biomarkers in collected PISF of diseased sites
is likely greater than in health. As such, the concentration, rather than the quantity, of
biomarkers in PISF could also be taken into consideration for the normalization of
results. An electronic device (Periotron) can be used chairside to measure the volume of
collected GCF/PISF/saliva on the absorbent paper strip/membrane in the range of 0.1-
1.05𝜇𝐿 93. Once the sample volume has accurately been identified, then the total amount
of the biomarker can be divided by the volume of PISF to obtain a biomarker
concentration. This consideration, that may be useful in controlling for increased volume
of PISF in diseased sites vs healthy sites, was not employed in many of the described
studies.
Risk factors for peri-implantitis include a history of smoking, diabetes mellitus,
increased plaque score, and a history or presence of periodontitis 12, 39. These risk factors
are confounding factors that may also influence biomarker findings in PISF. For

20
example, it has been demonstrated that cigarette smokers have a significantly higher
amount of TNF-𝛼, IL-6 and IL-1𝛽 compared to non-smokers 94. Hence, if smoking is not
taken into consideration in the analyses, outcomes may be influenced by these
confounding factors. To our knowledge, most studies have not matched study groups or
controlled via multivariate analyses for these variables.
Much of the evidence to date on the diagnostic ability of biomarkers in PISF is
from cross-sectional studies. One-point PISF collection allows for the differentiation
between peri-implant health and disease. However, prospective investigations are
required to assess changes in PISF constituents over time and whether certain biomarkers
are linked to disease activity or progression. This complicates research design.
A major limitation in the current literature is the lack of reported data to
adequately calculate the sensitivity, specificity, and predictive values of biomarkers.
When forecasting whether biomarkers can predictably differentiate between health and
disease, it is imperative that reports include these parameters to allow consideration for
their validity as diagnostic and prognostic tools.
Future investigations should consider such limitations so studies can be more
easily compared. This may increase the probability that biomarkers in PISF could more
reliably distinguish between peri-implant health and disease.
The Field of ‘Omics
More recently, research in the field of ‘omics, has become increasingly popular due to
an ability to provide more in-depth information on disease processes and to address the

21
complexity of periodontal disease. The identification of biomarkers using ‘omics
technologies, such as genomics, transcriptomics, proteomics and metabolomics, could
eventually deliver objective, reproducible, sensitive and specific diagnostic and
prognostic tests for periodontitis and peri-implantitis. This novel approach to discovering
biomarkers shows good potential to inform fundamental shifts in the understanding of
periodontal and peri-implant diseases 95. Genomics refers to the study of entire genomes
using DNA, whereas transcriptomics, proteomics and metabolomics study the temporal
expression of these genes using RNA, proteins and metabolic end-products of reactions,
respectively. Thus, where genomics takes into account genetics, transcriptomics,
proteomics and metabolomics take into account environmental influence 95. It should be
noted that each of these descriptors can be influenced by one another through feedback
loops and regulatory mechanisms (Figure 2).
Metabolomics is the study of small (<1,500Da) chemical intermediate and end-
products of metabolism, called metabolites 96. Globally, metabolomics assesses the
“presence of metabolites in a biological system to evaluate the progress of the disease,
select potential biomarkers, and provide insights into the underlying pathophysiology” 97.
The metabolome refers to the complete set of metabolites found in a human biological
sample, such as plasma, saliva, gingival crevicular fluid and gingival tissues and includes
lipids, amino acids, nucleotides, antioxidants, vitamins, organic acids, polyols, alcohol,
and hormones. These metabolites can be of endogenous source, directly produced by the
host, or be of exogenous sources (i.e., xenobiotics), derived from microorganisms, diet,
environmental contaminants, carcinogens, drugs, and toxins 98, 99.

22
Figure 2. The interplay of the different compartments studied by ‘omics technologies (Grant 2012).

23
Over 114,100 metabolites having been identified in the human and are included in the
Human Metabolome Database (HMDB), a public metabolomics spectral reference library
used by researchers today for metabolic profiling 100.
Metabolites are reflective of the phenotype of an individual at one time. Analyzing
the differences between various metabolomic pathways and their end-points can help to
explain underlying disease pathology, diagnosis and prognosis. Metabolomics is a
powerful tool in discovering new biomarkers and biochemical pathways, that may help
improve early diagnosis, disease activity, and limit disease progression. Analysis of
metabolic profiles prior to the development of clinical signs or symptoms is ideal, since
this may allow earlier attention towards disease prevention 97. Thus, metabolomic studies
may be useful in identifying diagnostic and prognostic biomarkers that could aid in early
detection of the disease, reduce unnecessary treatment to patients, and contribute to
improved implant success.
i. Nuclear Magnetic Resonance (NMR) Spectroscopy vs. Mass Spectrometry (MS)
The main analytical techniques for metabolic profiling of biologic samples include
nuclear magnetic resonance (NMR) spectroscopy, gas chromatography-mass
spectrometry (GC-MS) and liquid chromatography-mass spectrometry (LC-MS) 101.
Mass spectrometry (MS) functions by ionizing a portion of the studied sample into ions
and sorting and identifying them based on their mass-to-charge ratio via an electric or
magnetic field. This produces a mass spectrum that gives information on the chemical
composition of the sample 102. An enhancement technique to MS is to use additional

24
separation techniques, such as gas and liquid chromatography (GC-MS/LC-MS), to
further separate the compounds chromatographically before their introduction to the ion
source and mass spectrometer. This allows for further identification of compounds in a
given sample 103. In contrast, NMR spectroscopy is based on the principle that all nuclei
have magnetic spin and possess an electrical charge. When a sample is placed in a
magnetic field, nuclei become excitable by a radio frequency pulse. After this excitation,
the nuclei emit the energy that was absorbed as radio frequencies. The signal emitted is
measured and processed to yield an NMR spectrum for that specific nucleus (e.g., 1H,
13C, 15N, 31P). Quantitative metabolomics or metabolic profiling is then used to analyze
the data provided by NMR. This technique identifies and quantifies the metabolites
present in each sample by comparing regions of interest of NMR spectra to a reference
library (i.e., HMDB) 96, 104, 105.
Metabolomics analyses can be either targeted or untargeted. Untargeted analyses
pertain to the metabolic profiling of all metabolites present in a given sample with NMR
spectroscopy usually being the most utilized for this approach103. Targeted analyses
focus primarily on quantifying and identifying specific metabolites involved in a
particular metabolic pathway and with the metabolites under investigation already being
known. The ideal method for targeted analyses is a MS-based metabolomics approach
103.
Both NMR spectroscopy and MS are suitable for metabolomic analysis but have
differing strengths and weaknesses. Although MS may be more sensitive, it is limited in
that it cannot detect all compounds. Incomplete MS data are usually deleted or replaced
with missing values or fixed constants and deleting these incomplete observations leads

25
to bias in results. As such, MS is considered a biased technique 106. In contrast, NMR
spectroscopy is considered to be an untargeted and non-biased technique because, unlike
MS, it does not target specific compounds and can give a near complete chemical
composition of the investigated sample. However, the limit of detection of NMR ranges
between approximately 20 to 60 metabolites per sample, which is far less than the actual
number of metabolites present in a given biological system 107. Conversely, one of the
main advantages of MS is that it is much more sensitive and can measure metabolites at a
much lower concentration 108. Additionally, MS has better resolution and dynamic range
than NMR 107, 108. However, MS only detects metabolites that are readily ionized and
consequently, greater than 40% of chemical libraries are not discernable via MS 109.
NMR-based metabolomics is a high-throughput method (i.e., can detect a wide range of
metabolites in a short period of time within a single sample) and can precisely analyze
almost all classes of compounds in a given sample103. As such, the main advantages of
NMR spectroscopy in the field of metabolomics is that it is: reproducible and
quantitative; permits the identification of more abundant and novel/unknown metabolites;
analyzes intact biofluids/tissues with little to no sample preparation; is non-destructive
and allows for re-analysis of the sample; can trace metabolic pathways using isotope
labeled substrates; and is a high-throughput and non-biased technique 96, 104, 107. Of
importance, no single metabolomics analytics platform is able to completely quantify or
identify metabolites within a given sample. The combined use of MS and NMR will
allow for further identification of metabolites and understanding of metabolic pathways
103.

26
ii. Metabolites as Predictors for Periodontitis
It is only within the last several years that research in the field of metabolomics has
focused on the predictability of metabolites as biomarkers for periodontal disease.
Interestingly, both salivary and GCF biofluids have shown promising results for the early
detection of periodontal disease.
a. Metabolites in GCF
One of the first groups to study metabolomics and periodontal disease is Barnes et
al. 110-113. Their investigations demonstrated that GCF samples from healthy and
periodontitis sites are both rich in metabolites and that metabolites associated with
inflammation, oxidative stress, tissue degradation and bacterial metabolism are
significantly increased in periodontal disease 112, 113. In 2009, they conducted a cross-
sectional study comparing metabolites in GCF samples from healthy, gingivitis and
periodontitis sites of 22 chronic periodontitis patients 112. Using GC-MS and LC-MS
analytical techniques, they determined that metabolic changes were on a continuum with
metabolite levels being significantly higher in periodontitis sites compared to health, and
levels in gingivitis being between those of health and periodontitis. They confirmed that
in periodontal disease (i.e., gingivitis and periodontitis), an increase in metabolites
inosine, hypoxanthine, xanthine, guanosine and guanine were indicative of an
upregulation of the purine degradation pathway leading to an increase in reactive oxygen
species (ROS). Additionally, cellular anti-oxidants, such as oxidized glutathione, uric

27
acid and ascorbic acid, were reduced in diseased sites. The authors concluded that the
overproduction of ROS and the reduced levels of anti-oxidants led to tissue degradation
and may indicate the early development of periodontal disease.
Metabolic profiling may also be of use in predicting periodontal disease
progression. Ozeki et al. collected GCF samples from healthy and periodontally diseased
sites with moderate and deep pockets. Analyses via GC-MS indicated that putrescine,
lysine, ribose, taurine, 5-aminovaleric acid, galactose and phenylalanine were
significantly increased in deep pockets compared to moderate pockets and healthy sites.
Additionally, an intermediate metabolic profile was observed at moderate pockets
between healthy sites and deep pockets in diseased sites, suggestive of a metabolic
continuum from health to gingivitis to periodontitis 117. However, the sensitivity and
specificity of the metabolic profiles in determining disease progression were not reported
in this study.
b. Metabolites in Saliva
In 2011, rather than sampling GCF, they conducted a similar study assessing whole
saliva in healthy and periodontitis patients 111. It was surmised that metabolites
associated with the degradation of macromolecules, such as dipeptide leucylisoleucine,
glucose, long chain fatty acids arachidonate and adrenate, and inflammatory fatty acids
oleate and margarate, among others, were associated with disease. In 2014, Barnes et al.
investigated metabolites found in salivary samples of diabetics and non-diabetics with
healthy, gingivitis and periodontitis sites 110. Comparison of the saliva samples in non-

28
diabetics, revealed an increase of markers of oxidative stress, purine degradation
(guanosine and inosine), glutathione metabolism (oxidative glutathione and cysteine-
glutathione disulfide), protein degradation (amino acids) and omega-3 and omega-6 fatty
acids in diseased sites. The findings by the Barnes group suggest that specific
metabolites in GCF or saliva may act as biomarkers for diagnosis of an inflammatory
state and periodontal disease detection. However, the sensitivity and specificity of GCF
or saliva for these Barnes’ studies were not reported.
Since these latest findings by the Barnes group, further cross-sectional investigations
have been attempted to confirm the periodontal diagnostic value of such metabolites.
Kuboniwa et al. assessed metabolites associated with periodontal inflammation in whole
saliva of periodontitis patients before and after supra- and sub-gingival plaque and
calculus removal 114. Using GC-MS, 63 metabolites were identified in salivary metabolic
profiles, of which 8 (ornithine, 5-oxoproline, valine, proline, spermidine,
hydrocinnamate, histidine, and cadaverine) were considered potential indicators of
periodontal inflammation. Cadaverine, 5-oxoproline and histidine yielded higher
accuracy for the prediction of periodontitis (AUC = 0.845, AUC = 0.762 and AUC =
0.726, respectively), whereas the other metabolites alone had a lower diagnostic accuracy
for periodontitis (AUC <0.6). Interestingly, the combination of cadaverine, 5-oxoproline
and histidine yielded the greatest accuracy for the diagnosis of moderate to severe
periodontitis (AUC = 0.881). Thus, the combination of cadaverine, 5-oxoproline and
histidine yielded a greater true positive rate and a lower false positive rate than other
metabolites in the diagnosis of periodontitis. The authors identified potential biomarkers
able to reflect the severity of inflammation and disease activity in periodontitis patients.

29
Using NMR-based analytic techniques, two other investigations compared
metabolites within salivary samples of generalized chronic periodontitis and generalized
aggressive periodontitis and healthy controls. Romano et al. revealed that metabolite
spectra in saliva can predictably discriminate between health and disease with 81%
predictive accuracy. Among the discriminating metabolites were a significant increase in
tyrosine, proline, phenylalanine, formate, isoleucine and valine and a significant decrease
in pyruvate, N-acetyl groups, sarcosine and lactate in periodontitis. However,
multivariate analysis of NMR spectra were not as effective at discriminating between
generalized chronic periodontitis and generalized aggressive periodontitis (60%
predictive accuracy) 115. Rzeznik et al. had similar findings in that salivary concentration
of metabolites could predictably discriminate between healthy patients and periodontitis
patients with a 91% predictive accuracy but that they could not accurately discriminate
between chronic periodontitis and generalized aggressive periodontitis. An increase in
concentration of butyrate and a decrease in concentration of fucose, lactate, acetate, N-
acetyl, gamma-aminobutyrate (GABA), 3-D-hydroxybutyrate, pyruvate, methanol and
ethanol were significantly associated with disease when compared to healthy controls.
The combination of GABA, butyrate and lactate had a positive predictive value of 77% in
determining disease, with a sensitivity of 89% and a specificity of 72% 116.
Unfortunately, the results obtained by these investigations are limited and not
generalizable due to small sample sizes of approximately 20-30 participants each.
Amongst the metabolomics studies described, various metabolites were found to
be associated with disease. Nevertheless, the findings remain to be inconsistent, whether
saliva or GCF was analyzed. Results from the above studies suggest that specific

30
metabolites present in saliva and GCF may be predictive of periodontal health and
disease around teeth, and may be useful as biomarkers for future diagnostic and
prognostic testing. However, further studies are required.
iii. Metabolites as Predictors for Peri-implantitis
a. Metabolites in GCF and Saliva
To our knowledge, no investigations have been conducted to determine whether
metabolic profiles found in PISF or saliva could predict either peri-implant disease
diagnosis or progression.
Statement of the Problem
Although metabolites in GCF and saliva have shown good promise for the early
detection and screening of periodontal disease, no metabolite signatures have been
identified in the literature as potential biomarkers to aid in the development of a
diagnostic tool for peri-implantitis. Consensus is that well-conducted cross-sectional and
longitudinal studies, with larger sample sizes, are needed to determine the validity of
metabolomics studies in detecting biomarkers that are predictive of implant health and
disease (i.e., diagnostic) and disease initiation and/or progression (i.e., prognostic). This
would be advantageous to both patients and practitioners. This thesis represents a novel
study to investigate the relationship of metabolomics in peri-implant disease.

31
Null Hypothesis
The null hypothesis of this investigation is that there will be no difference
between the spectra of metabolites identified in PISF around healthy compared to
diseased dental implants.
Alternate Hypothesis
The alternate hypothesis is that there will be different spectra of metabolites
identified in PISF between those implants that are classified as healthy compared to
diseased.
Aim
The aim of this cross-sectional investigation is to determine whether NMR-based
metabolomics can differentiate between metabolic profiles of PISF in patients with
healthy and diseased implants.

32
Methods
Sample Size Determination
The effect size (d), estimated variance or standard deviation (s) of the population
and the probability of type I (a) and type II (b) errors are essential determinants for the
calculation of a sample size (𝑛 = ("!#"")#×&#
'#) prior to the start of an investigation 118. In
this case, the sample size determination was not calculated because the variance was
unknown, due to lack of previous studies for comparison. However, the power of the
study will be reported once results have been obtained. The power (1-b) denotes the
probability of detecting a difference between two groups when it truly exists. As a
general rule, larger sample sizes are required for smaller differences to be detected. The
conventionally acceptable value for power is ≥80%. For convenience, given time and
resource constraints for recruitment, an a priori sample size of 80 participants was
selected.
Subject Recruitment and Inclusion/Exclusion Criteria
The protocol was approved by the Institutional Review Board of the University of
Minnesota (#1511M79922), according to the guidelines for the protection of human
subjects. Signed informed consent was obtained from all participants prior to their
enrollment. Inclusion and exclusion criteria are explained below. Subjects were

33
recruited from the University of Minnesota School of Dentistry and consented to
participation in this study.
For all groups, subject inclusion criteria included: (i) having consented to this
study, (ii) being in good general health with controlled systemic diseases, and (iii) having
met criteria for peri-implant health or disease at time of baseline examination. Exclusion
criteria included: (i) uncontrolled systemic disease, such as diabetes, (ii) systemic
antibiotic use within the past 3 months, (iii) no consent, or (iv) history of invasive
periodontal treatment or local antibiotic use in the past 12 months.
The inclusion criteria for patients with peri-implantitis included a diagnosis of
severe peri-implantitis in at least one implant. The diagnosis of severe peri-implantitis
was made when at least one site around the affected implant had a probing depth (PD) of
≥6mm and radiographic evidence of ≥3mm of crestal bone loss, as measured from the
implant-abutment interface (IAI) to the alveolar bone crest (ABC) (Diseased implant) 10.
The inclusion criteria for healthy controls included PD ≤3mm and radiographic evidence
of <2mm distance between ABC and IAI (Healthy implant). Subjects were assigned to a
third “other” group when they did not meet the inclusion criteria for diseased or healthy
subjects. The inclusion criteria for this group was PD of 4-5mm and radiographic
evidence of ≥2mm and <3mm of crestal bone loss (Other implant).
Intra-/Inter-examiner Reliability
A calibration trial was conducted to determine intra- and inter-examiner reliability
for the measurement of probing pocket depths (PD) and clinical attachment levels (CAL).

34
Six individuals with ranging periodontal health/disease status were recruited from the
UMN Graduate Periodontal Clinic to participate in the calibration trial. Repeated
measurements were conducted on these patients to determine the level of agreement
amongst examiners. Instruction was provided to all examiners and clinical measurements
(PD and CAL) were carried out at six sites per tooth (mesio-buccal, buccal, disto-buccal,
mesio-lingual, lingual and disto-lingual) using a Michigan-O periodontal probe with
Williams markings. One examiner (MC) served as the “gold standard” to which all
measurements were compared. Each examiner measured one quadrant per patient twice,
and were blinded to the baseline measurements obtained.
Intra-examiner reproducibility was expressed as a percentage of the exact
agreement and agreement within ±1 mm for PD and within ±2 mm for CAL between
repeated measurements. Inter-examiner reproducibility was also expressed as a
percentage of the exact agreement and agreement within ±1 mm for PD and within ±2
mm for CAL compared to measurements obtained by the gold standard examiner.
The intra-examiner reliability for investigators JH and HA was 77.8% and 83.3%
for perfect agreement in PD, 69.8% and 60.7% for perfect agreement in CAL, 99.2% and
99.4% for agreement within ±1 mm PD, and 100.0% and 100.0% agreement with ±2 mm
for CAL, respectively. The inter-examiner reliability for investigators JH and HA was
46.0% and 57.7% for perfect agreement in PD, 48.4% and 24.4% for perfect agreement
in CAL, 92.1% and 99.4% for agreement within ±1 mm PD, and 92.9% and 94.6%
agreement with ±2 mm for CAL, respectively.
35
Baseline Examination
Subjects seen for initial examination were assessed with comprehensive oral
examinations where clinical periodontal and peri-implant measurements were recorded.
Patient demographics for all participants, such as mean patient age, gender, periodontitis
history, smoking history, systemic disease were also recorded. Clinical periodontal
measurements were made at 6 sites per implant, plus full mouth probing depth (PD),
clinical attachment level (CAL) measurements, full mouth bleeding scores (FMBS) and
full mouth plaque scores (FMPS). Baseline examinations were performed by calibrated
periodontal residents (EK, JH, HA) or faculty (MC) at the Graduate Periodontal Clinical
at the University of Minnesota.
A Michigan-O periodontal probe with Williams markings (Hu Friedy) was placed
with light to moderate pressure (0.25N) into the sulcus of both teeth and implants to
measure PD (from free gingival margin to base of pocket). Around teeth, CAL
measurements were taken from the cemento-enamel junction (CEJ) or from the
restorative margin of teeth to the base of the pocket. All PD and CAL measurements
were rounded up to the nearest mm. To calculate FMBS, Bleeding on Probing (BOP)
was assessed 30 seconds after probing and was noted at 6 sites per tooth or implant as: 1)
absent, 2) pinpoint bleeding, or 3) profuse bleeding. FMPS was calculated when dental
plaque was identified as present or absent at 6 sites by sliding the periodontal probe
supragingivally along each tooth or implant. For analysis, only the parameters pertaining
to dental implants were included in this study.

36
Alveolar bone levels around dental implants were assessed radiographically with
the aid of a vertical bitewing or periapical radiograph. It has been demonstrated that
radiographs usually underestimate the quantity of alveolar bone loss 119, 120 with
bitewings and periapical radiographs underestimating bone loss by 11-23% and 9-20%,
respectively 121. In order to standardize our bone level measurements and account for
possible radiographic distortion, we recorded the radiographic deepest point of bone loss
on the mesial or distal of each implant by measuring the distance in millimeters from the
implant abutment interface (IAI), or most coronal portion of the roughened implant
surface if a polished collar was present, to the alveolar bone crest (ABC) in contact with
the surface of the dental implant. Standardized/true radiographic peri-implant bone level
was calculated from the ratio of radiographic bone level to radiographic implant length
and multiplied by the true implant length. An example of standardized/true radiographic
bone level measurement is depicted in Figure 3.
In the presence of peri-implant mucositis or peri-implantitis, patients were
informed of their diagnosis, given oral hygiene instructions and options for treatment.
Treatment options included maintenance recalls, subgingival debridement, open flap
debridement, apically positioned flap with or without osseous resection and/or guided
tissue regeneration.
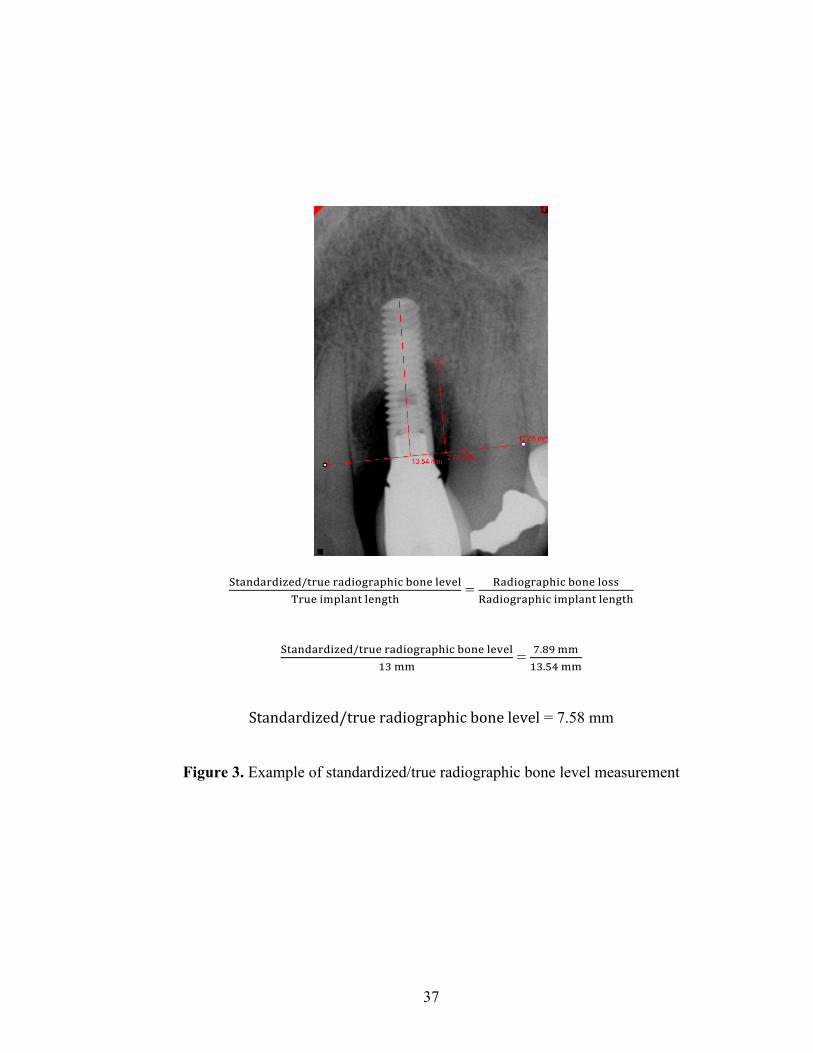
37
()*+,*-,./0,/)-20-*,.45-*67.894+0:0;0:<-20.=6:*+):0+5)7
= >*,.45-*67.894+0:4??>*,.45-*67.8.=6:*+):0+5)7
()*+,*-,./0,/)-20-*,.45-*67.894+0:0;0:
@A== = B.DE==
@A.FG==
Standardized/trueradiographicbonelevel = 7.58 mm
Figure 3. Example of standardized/true radiographic bone level measurement

38
Six-month Recall Examinations
All subjects were followed for 24 months for the longitudinal component of this
study. They returned at 6-month intervals for salivary and PISF sampling and
radiographic assessment. Clinical measurements such as PD, presence of plaque and
presence of BOP, which included profuse and pinpoint bleeding, at the sampled implant
sites were also recorded. The history of disease, new disease or extent of disease
progression was measured as probing depth change and change in bone levels. Periapical
or bitewing radiographs were taken of each implant by use of a Rinn Holder. For
consistency, if a periapical radiograph was taken at baseline, a periapical was also taken
at the recall examinations and if a bitewing radiograph was taken at baseline, a bitewing
was taken at the recall examinations. Findings from the recall examination were
discussed with the patient and if needed, options for treatment were again discussed.
Sample Collection
All patients were seen for sampling at least 2 weeks, but no later than 8 weeks,
after initial examination, and subsequently at 6-month recall examinations for 2 years.
Saliva was collected from the tongue and PISF samples were collected around dental
implants. Following PISF sampling, peri-implant clinical (PD, BOP, plaque) and
radiographic (alveolar bone level) measures were taken at the respective implant sites.
Each individual classified as having a diseased implant at baseline examination was
sampled at the deepest site (PD≥6mm) of each implant affected by peri-implantitis to a

39
maximum of 2 implants per patient. Individuals with one diseased implant who also
possessed healthy implants were sampled at 1 shallow site (PD≤3mm) per implant, to a
maximum of 4 healthy implants. Each individual classified as having a healthy implant
at baseline examination was sampled at 1 shallow site (PD≤3mm) per implant, to a
maximum of 4 healthy implants. If healthy or peri-implantitis subjects possessed
implants that did not meet the criteria for a “healthy” or “diseased” implant, the implant
was labeled as being “other”. This classification of implants prevented overlapping of
samples at the definition boundary of healthy and diseased and provided assurance that
the diseased sites were truly diseased and that the healthy sites were truly healthy.
To avoid salivary contamination of PISF samples, all sites were isolated with a
cotton roll or gauze and dried using a light stream of air from an air-water syringe
directed away from the sulcus towards the crown of the implant. Supragingival plaque
was removed carefully with a curette, so as not to touch the free gingival margin and
induce bleeding or push plaque subgingivally. Using cotton pliers, a thin (50 𝜇m),
porous (5𝜇m pores), and 3.96mm in diameter silver membrane disc (Sterlitech
[cat#AG5048]) was inserted into the sulcus or pocket at each test and control site until
resistance was met. Each membrane was left in place for 30 seconds and subsequently
removed. Membranes with signs of contamination with saliva, blood or supragingival
plaque were noted and removed from analysis. Salivary samples were also collected
from the dorsum of the tongue, with patients being asked to swallow excess saliva before
placing the membrane on the tongue for 30 seconds. Tongue salivary samples were used
as controls to mimic the oral environment.

40
Following salivary and PISF sample procurement, all membranes were placed in
separate pre-chilled Eppendorf tubes containing 50𝜇𝐿 of a standardized NMR buffer
solution containing 0.3mM 2,2-dimethyl-2-silapentane-5-sulfonate sodium salt (DSS) in
phosphate buffer of pH 7.4 with 20% tritiated water (D2O), and 3mM sodium azide as
previously described 105. Membranes were completely immersed in the buffer solution to
allow for elution of saliva and PISF sample. PISF sample volumes ranged from 0.1 to
1.5𝜇𝐿 when measured with absorbent paper-strips and Periotron device in a separate pilot
experiment. Two negative control samples were collected at each patient visit, one
containing 50𝜇𝐿 of buffer alone and the other containing the silver membrane disc plus
50𝜇𝐿 of NMR buffer. These controls ensured the identification of potential contaminants
present in the NMR buffer across different batches of buffer or on the silver membrane
disc across different lot numbers.
Sample Preparation/Processing for Proton-Nuclear Magnetic Resonance (1H-
NMR) measurements
The sample-containing and control tubes were placed on ice for a maximum of 8
hours after collection. All tubes were vortexed for 10 seconds to elute the PISF and
centrifuged at 13,200 rpm for 30 seconds to displace the silver disc and possible
microorganisms or particulate matter. The supernatant was transferred to a new
Eppendorf tube, then frozen and stored at -80℃ until ready for NMR analysis. Before
NMR analysis, samples in Eppendorf tubes were thawed, placed on ice, transferred to
individual 1.7 x 103.5mm borosilicate tubes (SampleJet [cat#Z106462] – Bruker –

41
Germany) via the aid of long gel-loading pipet tips (Sorenson [cat#13810]) and
refrigerated at ~5°C until NMR analyses were performed at the University of Minnesota
NMR Center.
Analysis of Proton Nuclear Magnetic Resonance Output Data
All collected samples for the cross-sectional portion of this study were analyzed
in 2 batches of ~250 samples each. Immediately prior to acquisition, each sample was
heated to 25°C. A 700 MHz Bruker Advance III NMR spectrometer with a 1.7mm TCI
cryoprobe was used to obtain NMR spectra profiles in PISF, saliva and negative control
samples. A gradient-enhanced two-dimensional total correlation spectroscopy (2D 1H-
1H TOCSY) pulse sequence with “water suppression” by excitation sculpting
(mlevesgpph) using 32 transients and 128 increments and a 7,000 Hz spectral width in
each dimension was utilized.
Regions of interest (ROIs) were defined based on Total Correlation Spectroscopy
(TOCSY) data from public databases, Madison-Qingdao Metabolomics Consortium
Database (MMCD) and Human Metabolome Database (HMDB), corresponding to 77
potential metabolites that had been identified in previous literature as being present in
GCF/PISF and saliva samples74, 110-115, 117, 122-130. Only ROIs that were calculated based
on assumptions of non-overlapping resonances with other compounds or glycerol
contaminants and not impacted by artifacts from poor water suppression were used for
further analysis. Signal intensities for each ROI in PISF spectra were generated using
rNMR software 131. The assignment of the ROIs to a specific metabolite was based on

42
the 2D resonance of two protons belonging to the same metabolite, with these two
protons having the designation “[metabolite].1” and “[metabolite].2”, respectively. The
dose-dependent coherence of the two resonances was verified by looking at 20 samples
for each possible metabolite. A total of 35 metabolites were assigned in this analysis.
Statistical Analysis
Descriptive statistics were used to determine the results for mean and standard
deviation for age, and peri-implant clinical parameters such as probing depths and bone
loss, while counts and percentages/proportions were used for categorical variables such
as gender, smoking history, presence of plaque and presence of bleeding on probing.
Age, gender, smoking history, mean PD, mean bone loss, mean presence of BOP and
mean presence of plaque were compared between the groups (healthy, other or peri-
implantitis) using Kruskal-Wallis one-way analysis of variance (ANOVA). Post hoc
analyses were performed when required. All data analyses were performed using Python
and its open source statistical packages, SciPy and NumPy. Spearman’s correlation
coefficient and the associated p-values for each metabolite were computed using SciPy.
P-values were then adjusted for multiple comparisons using Python’s stats model library
based on the False Discovery Rate (FDR). P-values less than 0.05 were considered
statistically significant. Using logistic regression modeling, values for the Area Under
Receiver Operating Characteristic Curve (AUROC) were computed to assess whether
each individual metabolite had the ability to diagnose peri-implant health vs disease.
Model building and evaluation were done using Python’s sklearn library. To evaluate the

43
predictive ability of a combination of metabolites, metabolites that yielded top
performing models (i.e., models with the highest AUROC values, corresponding to
metabolites with p-values <0.05) were selected and combined. Using the combination of
metabolites, a multivariate logistic regression model was used to evaluate the predictive
ability of the combined metabolites. Principal component analysis (PCA) and Partial
least squares discriminant analysis (PLS-DA) were used to find metabolic pattern
differences between the collected samples (healthy implants, diseased implants, saliva
and buffer/membrane control). To complete principal component analysis (PCA), ROIs
for all samples were interquartile range (IQR) filtered, normalized to the median, and
auto-scaled using MetaboAnalyst 4.0.
44
Results
Demographic Characteristics
A CONSORT flow diagram (Figure 4) shows the number of recruited individuals
per group, as well as the number of PISF samples collected per group. A total of 70
subjects were recruited and assigned to three categories: 35 peri-implantitis, 9 “other
category” and 26 healthy subjects. One peri-implantitis participant was excluded due to
having had peri-implant treatment within the last 8 months and one peri-implantitis
participant was excluded due to having had systemic antibiotics within the last 3 months.
A total of 68 subjects, 33 peri-implantitis, 9 “other category” and 26 healthy participants,
were retained. A total of 157 implants were sampled with 85 in the peri-implantitis
group, 15 in the “other” group and 57 in the healthy group. A total of 157 PISF samples
were collected with 85 PISF samples in the peri-implantitis group, 15 PISF samples in
the “other” group and 57 PISF samples in the healthy group. PISF samples that were
contaminated by pus, saliva or blood (n=19) and those missing NMR data (n=10) were
excluded from analyses. A total of 128 PISF samples were analyzed.

45
Figure 4. CONSORT Flow Diagram

46
The total number of healthy, “other” or diseased implants per group are
summarized in Table 1 and the total number of anterior and posterior implants per group
are presented in Table 2.

47
Table 1. Number of healthy, other or diseased implants in each diagnosis group.
Diagnosis Group Implants
Healthy Other Diseased Total
Healthy 41 8 0 49
Other 0 11 0 11
Peri-implantitis 12 24 32 68
Total population 53 43 32 128
Table 2. Number of anterior and posterior implants in each diagnosis group.
Diagnosis
Group
Site-Specific Peri-implant
Status
(Diseased/Other/Healthy)
Number of implants
Anterior Posterior Total
Healthy Healthy Implants 11 30 41
Other Implants 2 6 8
Other Other Implants 1 10 11
Peri-
implantitis
Healthy Implants 4 8 12
Other Implants 8 16 24
Diseased Implants 6 26 32
Total Implants 32 96 128

48
Demographic characteristics of peri-implantitis, “other” and healthy subjects are
summarized in Table 3. The total population of the study consisted of 68 subjects with a
mean age of 64.8 ± 9.8 years. The healthy group (n=26) had a mean age of 67.5 ± 10.9
years, the “other” group (n=9) had a mean age of 64.4 ± 7.0 years and the peri-
implantitis group (n=33) had a mean age of 62.7 ± 9.2 years. A total of 32 (47%) males
and 36 (53%) females participated in this study with an even distribution of females and
males within each group. The smoking status was recorded as never-, previous- or
current-smokers. The majority of the participants were never-smokers (n=29, 43%) or
previous-smokers (n=31, 46%), with a smaller proportion of individuals being never-
smokers (n=8, 12%). No statistically significant difference was detected between groups
for age (p=0.067), gender (p=0.102) or smoking status (p=0.275).

49
Table 3. Demographic characteristics: Frequency distributions of variables.
Characteristics
Healthy
Subjects
(n=27)
Other
Subjects
(n=8)
Peri-
implantitis
Subjects
(n=33)
Total
Population
(n=68)
p-
value†*
Age
Mean (SD)
67.5
(10.9)
64.4
(7.0)
62.7
(9.2)
64.8
(9.8)
0.067
Gender
Males (%)
Females (%)
13 (46)
14 (54)
4 (50)
4 (50)
15 (45)
18 (55)
32 (47)
36 (53)
0.102
Smoking Status
Never (%)
Previous (%)
Current (%)
15 (55)
8 (30)
4 (15)
3 (38)
5 (63)
0 (0)
11 (33)
18 (55)
4 (12)
29 (43)
31 (46)
8 (12)
0.275
*Statistical significance between study groups with p-value <0.05.
† Kruskal-Wallis H-test (one-way ANOVA) was used to compare the mean age, gender
and smoking status between the study groups. Post hoc comparisons between groups
were not required due to p-values >0.05.
Abbreviations:
Gen = generalized
Loc = localized

50
Clinical Parameters
Peri-implant clinical parameters for the total population and individual study
groups (healthy, “other” and peri-implantitis) are presented in Table 4. A significant
difference was noted among groups for mean PD (p=2.54x10⁻⁸), mean bone loss
(p=1.57x10⁻¹¹) and number/proportion of sites with BOP (p=1.77x10⁻⁶). More
specifically, the “other” and peri-implantitis subjects exhibited significantly higher mean
PD (6.09±2.43mm and 5.88±2.78mm, respectively) than the healthy subjects
(3.04±0.71mm); significantly higher mean bone loss (2.38±2.00mm and 3.96±2.78mm,
respectively) than the healthy subjects (0.76±0.87mm); and a significantly greater
proportion of sites with presence of BOP (50% and 61.5%, respectively) than healthy
subjects (12.2%). There was no significant difference between groups for the proportion
of sites with presence of plaque (p=0.077).
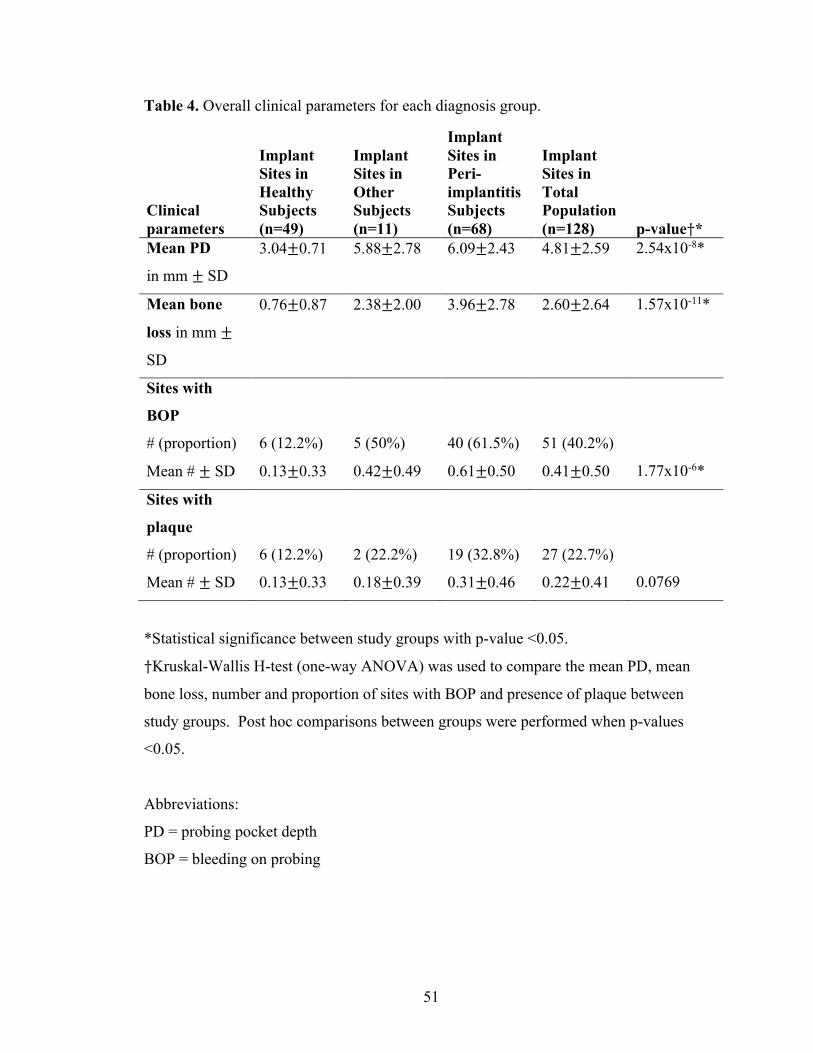
51
Table 4. Overall clinical parameters for each diagnosis group.
Clinical parameters
Implant Sites in Healthy Subjects (n=49)
Implant Sites in Other Subjects (n=11)
Implant Sites in Peri-implantitis Subjects (n=68)
Implant Sites in Total Population (n=128) p-value†*
Mean PD
in mm ± SD
3.04±0.71 5.88±2.78 6.09±2.43 4.81±2.59 2.54x10⁻⁸*
Mean bone
loss in mm ±
SD
0.76±0.87 2.38±2.00 3.96±2.78 2.60±2.64 1.57x10⁻¹¹*
Sites with
BOP
# (proportion)
Mean # ± SD
6 (12.2%)
0.13±0.33
5 (50%)
0.42±0.49
40 (61.5%)
0.61±0.50
51 (40.2%)
0.41±0.50
1.77x10⁻⁶*
Sites with
plaque
# (proportion)
Mean # ± SD
6 (12.2%)
0.13±0.33
2 (22.2%)
0.18±0.39
19 (32.8%)
0.31±0.46
27 (22.7%)
0.22±0.41
0.0769
*Statistical significance between study groups with p-value <0.05.
†Kruskal-Wallis H-test (one-way ANOVA) was used to compare the mean PD, mean
bone loss, number and proportion of sites with BOP and presence of plaque between
study groups. Post hoc comparisons between groups were performed when p-values
<0.05.
Abbreviations:
PD = probing pocket depth
BOP = bleeding on probing

52
The mean PD and bone loss from site-specific peri-implant statuses (healthy,
“other” or diseased) for each group are presented in Table 5. The healthy group included
healthy and “other” implants; the peri-implantitis group included healthy, “other” and
diseased implants; and the “other” group included “other” implants only. Diseased peri-
implant sites were associated with greater mean PD and bone loss than the healthy peri-
implant sites in both peri-implantitis and healthy groups.

53
Table 5. Site-specific peri-implant mean probing depths and bone loss of sampled sites for each diagnosis group.
Clinical
Parameters
Diagnosis
Group
Site-Specific Peri-implant
Status
(Diseased/Other/Healthy) N
Mean
± SD
(mm)
Min
(mm)
Max
(mm)
PD Healthy
Healthy Implants 41 2.85±0.42 1 3
Other Implants 8 4.00±1.07 3 6
Other Other Implants 11 6.09±2.43 3 11
Peri-
implantitis
Healthy Implants 12 2.83±0.39 2 3
Other Implants 24 4.29±1.71 2 8
Diseased Implants 32 8.22±1.81 6 14
Bone loss Healthy
Healthy Implant 41 0.65±0.68 0 1.89
Other Implant 8 1.30±1.46 0 3.6
Other Other Implant 11 2.38±2.00 0 5.76
Peri-
implantitis
Healthy Implants 12 0.72±0.69 0 1.98
Other Implants 24 2.97±1.51 0 5.32
Diseased Implants 32 5.93±2.45 3.25 13.28
Abbreviations:
PD = probing pocket depth

54
The number and proportion of sampled implant sites for each group based on
various ranges of probing depths and bone loss are presented in Table 6. A greater
proportion of healthy implants in the healthy group (87.8%) and of healthy implants in
the peri-implantitis group (83.3%) had PD of 3mm. Similarly, healthy implants in the
healthy group and peri-implantitis group had a greater proportion of sites with bone loss
ranging between 0.0-1.0mm (65.9% and 66.7%, respectively). Diseased implants within
the peri-implantitis group had a greater proportion of sites with PD ranging between 6 to
8mm (65.6%) and of bone loss ranging between 3.0-6.0mm (75%).

55
Table 6. Number and proportion of sampled implant sites based on various probing depth and bone loss categorical ranges for each diagnosis group.
Diagnosis Group
Site-Specific Peri-implant Status (Diseased /Other/Healthy)
PD and BL Categorical Range
# and Proportion (%) of Sampled Implants
Healthy Healthy implants (n=41)
PD = 1mm PD = 2mm PD = 3mm
1 (2.4%) 4 (9.8%) 36 (87.8%)
BL = 0.0-1.0mm BL = 1.1-2.0mm
27 (65.9%) 14 (34.1%)
Other implants (n=8) PD ≤3mm PD 4-5mm PD ≥6mm
3 (37.5%) 4 (50%) 1 (12.5%)
BL = 0.0-1.0mm BL = 1.1-2.0mm BL = 2.1-6.0mm
5 (62.5%) 0 (0%) 3 (37.5%)
Other Other Implants (n=11)
PD ≤3mm PD 4-5mm PD ≥6mm
2 (18.2%) 2 (18.2%) 7 (63.6%)
BL = 0.0-1.0mm BL = 1.1-2.0mm BL = 2.1-6.0mm
4 (36.4%) 0 (0%) 7 (63.6%)
Peri-implantitis Healthy Implants (n=12)
PD = 1mm PD = 2mm PD = 3mm
0 (0%) 2 (16.7%) 10 (83.3%)
BL = 0.0-1.0mm BL = 1.1-2.0mm
8 (66.7%) 4 (33.3%)
Other Implants (n=24)
PD ≤3mm PD 4-5mm PD ≥6mm
9 (37.5%) 10 (41.7%) 5 (20.8%)
BL = 0.0-1.0mm BL = 1.1-2.0mm BL = 2.1-6.0mm
3 (12.5%) 3 (12.5%) 18 (75%)
Diseased Implants (n=32)
PD 6-8mm PD 9-10mm PD ≥11mm
21 (65.6%) 8 (25%) 3 (9.4%)
BL = 3.0-6.0mm BL = 6.1-9.0mm BL = 9.1-14mm
24 (75%) 4 (12.5%) 4 (12.5%)
Abbreviations: PD = probing pocket depth BL = bone loss

56
Table 7 demonstrates that healthy implants within the healthy group and peri-
implantitis group had a lower proportion of sites with presence of BOP (7.8% and 25%
respectively), whereas the diseased implants within the peri-implantitis group had a
higher frequency of sites with presence of BOP (38.7%). These results corroborate the
expectation of having deeper PD, greater bone loss and higher frequency of sites with
BOP in diseased implants.
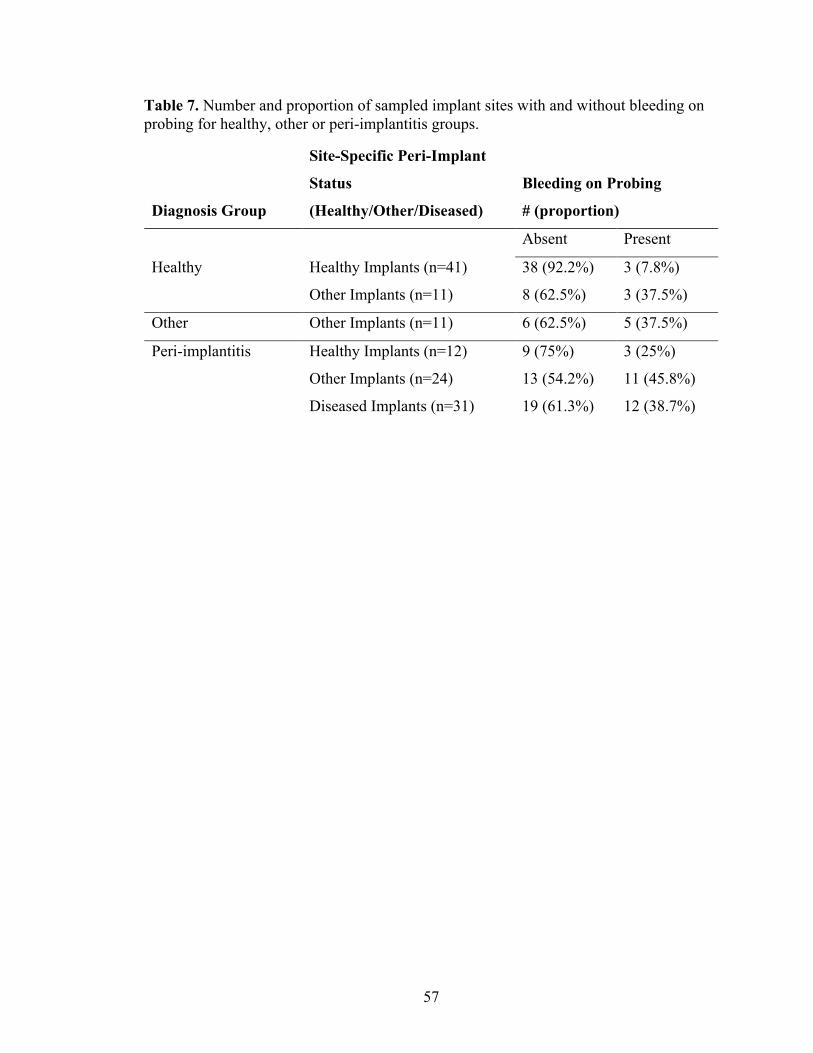
57
Table 7. Number and proportion of sampled implant sites with and without bleeding on probing for healthy, other or peri-implantitis groups.
Diagnosis Group
Site-Specific Peri-Implant
Status
(Healthy/Other/Diseased)
Bleeding on Probing
# (proportion)
Absent Present
Healthy Healthy Implants (n=41) 38 (92.2%) 3 (7.8%)
Other Implants (n=11) 8 (62.5%) 3 (37.5%)
Other Other Implants (n=11) 6 (62.5%) 5 (37.5%)
Peri-implantitis Healthy Implants (n=12) 9 (75%) 3 (25%)
Other Implants (n=24) 13 (54.2%) 11 (45.8%)
Diseased Implants (n=31) 19 (61.3%) 12 (38.7%)
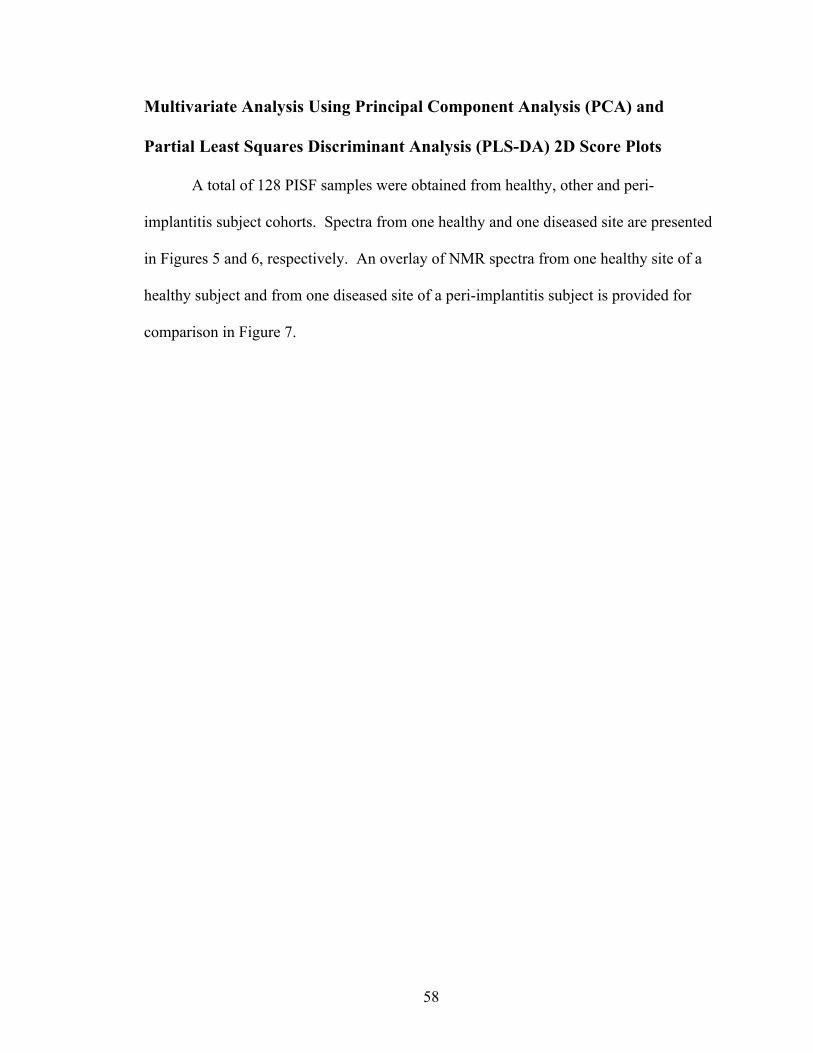
58
Multivariate Analysis Using Principal Component Analysis (PCA) and
Partial Least Squares Discriminant Analysis (PLS-DA) 2D Score Plots
A total of 128 PISF samples were obtained from healthy, other and peri-
implantitis subject cohorts. Spectra from one healthy and one diseased site are presented
in Figures 5 and 6, respectively. An overlay of NMR spectra from one healthy site of a
healthy subject and from one diseased site of a peri-implantitis subject is provided for
comparison in Figure 7.
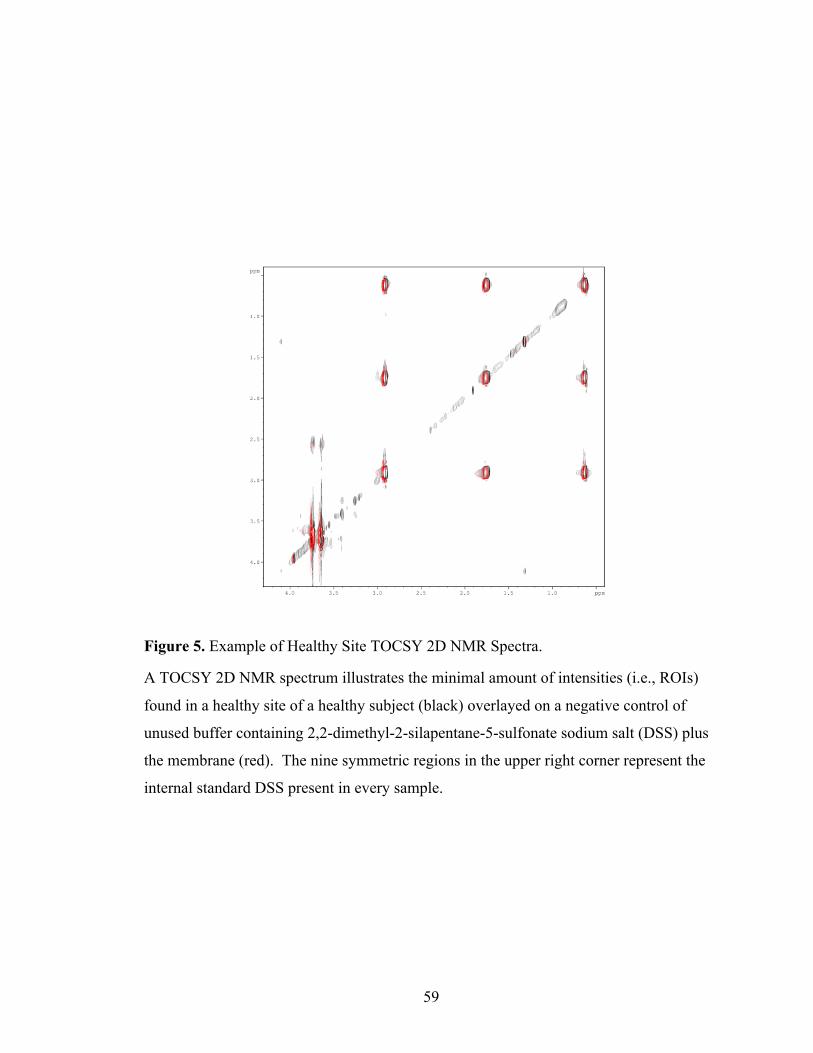
59
Figure 5. Example of Healthy Site TOCSY 2D NMR Spectra.
A TOCSY 2D NMR spectrum illustrates the minimal amount of intensities (i.e., ROIs)
found in a healthy site of a healthy subject (black) overlayed on a negative control of
unused buffer containing 2,2-dimethyl-2-silapentane-5-sulfonate sodium salt (DSS) plus
the membrane (red). The nine symmetric regions in the upper right corner represent the
internal standard DSS present in every sample.
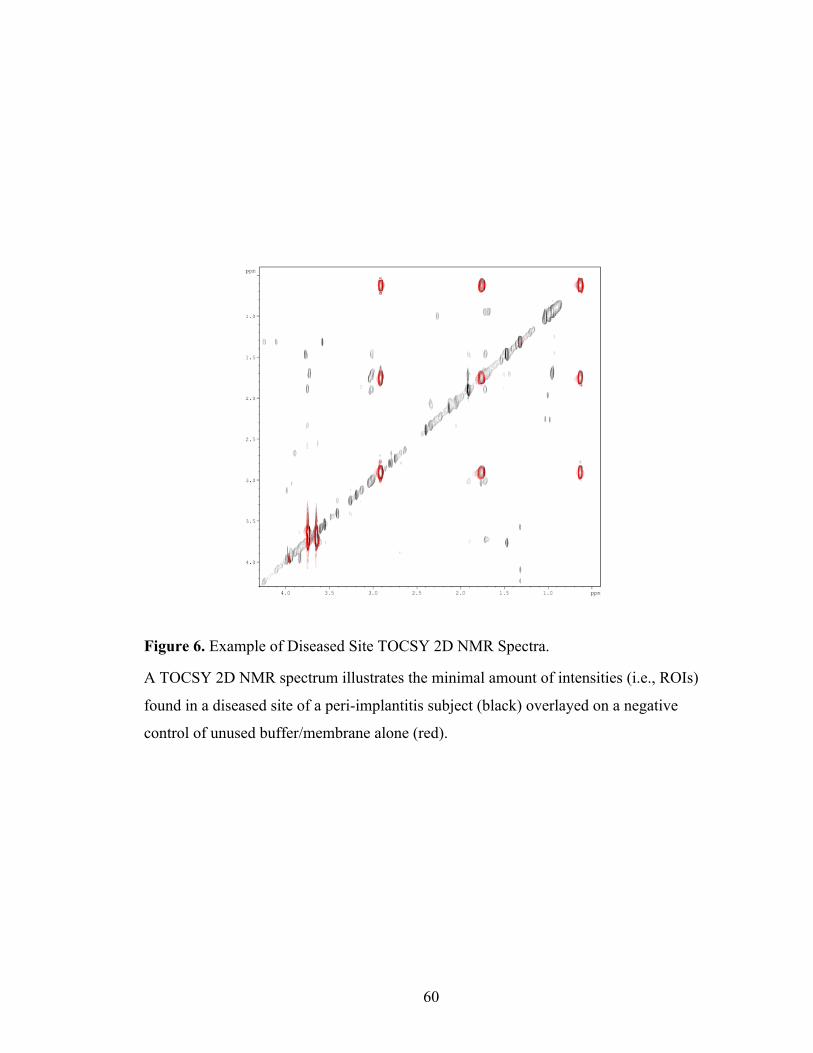
60
Figure 6. Example of Diseased Site TOCSY 2D NMR Spectra.
A TOCSY 2D NMR spectrum illustrates the minimal amount of intensities (i.e., ROIs)
found in a diseased site of a peri-implantitis subject (black) overlayed on a negative
control of unused buffer/membrane alone (red).
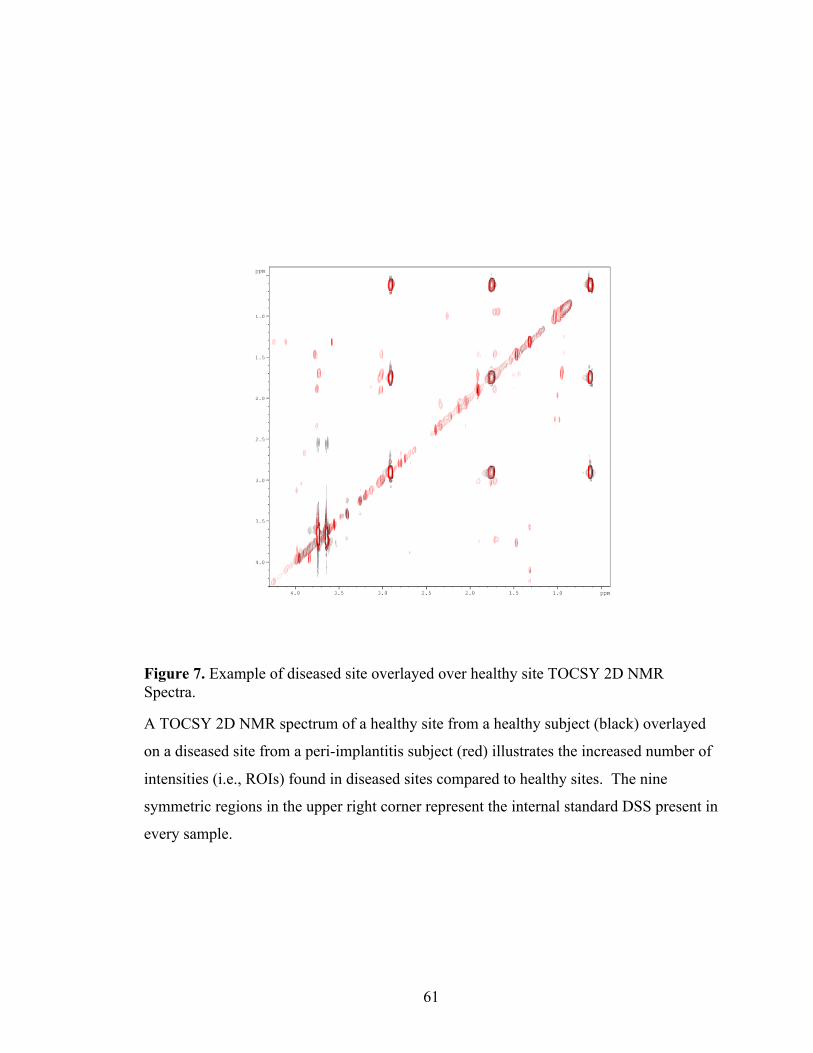
61
Figure 7. Example of diseased site overlayed over healthy site TOCSY 2D NMR Spectra.
A TOCSY 2D NMR spectrum of a healthy site from a healthy subject (black) overlayed
on a diseased site from a peri-implantitis subject (red) illustrates the increased number of
intensities (i.e., ROIs) found in diseased sites compared to healthy sites. The nine
symmetric regions in the upper right corner represent the internal standard DSS present in
every sample.

62
The TOCSY 2D NMR spectra allowed for the identification of 62 ROIs for a total
of 35 metabolites. One example of identifying the ROI of interest is shown in Figure 8.

63
Figure 8. Example of defining regions of interest (ROIs).
Using rNMR software, TOCSY spectra were overlayed and ROIs were manually drawn
over areas that contained cross peaks from negative control samples and samples from
healthy and diseased sites. A table of raw signal intensity from each ROI (box) was
generated for all samples to be used as bins for statistical analysis. TOCSY spectra
allowed for the identification of a total of 62 ROIs.

64
The distribution of the different ROIs (i.e., metabolites) comparing the PISF of
healthy implants and diseased implants, saliva and buffer/membrane control were plotted
using PCA and PLS-DA (Figures 9-10). One of the main advantages of using PCA is
that the largest differences between the collected samples are highlighted and outliers are
better detected. Conversely, PLS-DA is better used to detect differences between the
groups (healthy, diseased, saliva, buffer membrane), rather than the difference between
samples themselves. The ROIs (i.e., metabolites) in the PISF of healthy implant and
diseased implant sites, saliva and buffer membrane control exhibited different clustering
patterns (Figure 9). The variance between the different samples was 19.7% (PC1 Figure
9) and between groups was 9.5% (PC1 Figure 10). Healthy samples that are outliers and
resembling the metabolic state of diseased samples (ex: healthy samples 082i, 414i, 153i,
290i, 142i in Figure 9) may be an indication that these healthy sites are susceptible to
future peri-implant breakdown. The longitudinal component of this study will allow us to
corroborate this hypothesis.

65
Figure 9. Principal component analysis (PCA) 2D score plot demonstrating the distribution patterns of ROIs in buffer membrane (light blue), diseased implant (red), healthy implant (green) and saliva (royal blue) samples.

66
Figure 10. Partial least squares discriminant analysis (PLS-DA) 2D score plot demonstrating the distribution patterns of ROIs in buffer membrane (light blue), diseased implant (red), healthy implant (green) and saliva (royal blue) samples.

67
The distribution of the different ROIs (i.e., metabolites) comparing the PISF of
healthy and diseased implants were plotted using PCA and PLS-DA (Figures 11-12).
The ROIs (i.e., metabolites) in the PISF of diseased implants and healthy implants
exhibited statistically different clustering patterns. The variance between the different
samples was 22% (PC1 Figure 11) and between groups was 20.9% (PC1 Figure 12).
These analyses are unable to determine the exact metabolites associated with health and
disease, but they are able to allow us to better understand that metabolic differences do
exist between healthy and diseased peri-implant states.

68
Figure 11. Principal component analysis (PCA) 2D score plot demonstrating the distribution patterns of ROIs in diseased implant (red) and healthy implant (green) samples.

69
Figure 12. Partial least squares discriminant analysis (PLS-DA) 2D score plot demonstrating the distribution patterns of ROIs in diseased implant (red) and healthy implant (green) samples.

70
Spearman’s Rank Correlation Coefficient
Spearman’s correlation coefficient was used to measure the strength and direction
of association between metabolites and disease status. The Spearman’s rank correlation
between individual metabolites and site-specific peri-implant disease status are shown in
Table 8, where a positive correlation is associated with a diseased state and a negative
correlation is associated with a healthy state.

71
Table 8. Spearman’s rank correlations (rho) between individual metabolites and site-specific peri-implant status (healthy implant vs other implant vs diseased implant).
Metabolite
Spearman’s correlation coefficient
Spearman’s p-value
FDR corrected p-value
Cadaverine.Lysine.2 0.314 0.0003* 0.0188* Cadaverine.Lysine.1 0.280 0.0014* 0.0302* Propionate 0.271 0.0020* 0.0302* Alanine.Lysine.2 0.261 0.0030* 0.0302* Putrescine.Lysine 0.263 0.0027* 0.0302* Alpha.ketoglutarate.2 -0.254 0.0038* 0.0302* Valine.2 0.253 0.0039* 0.0302* Isoleucine.2 -0.253 0.0040* 0.0302* Proline.2 -0.250 0.0044* 0.0302* Uracil.1 -0.243 0.0057* 0.0346* Tyramine.1 0.241 0.0061* 0.0346* Threonine.1 0.230 0.0091* 0.0470* Tyramine.2 0.219 0.0131* 0.0599 Alanine.Lysine.1 0.216 0.0143* 0.0599 Taurine.2 0.216 0.0145* 0.0599 Methionine.2 -0.212 0.0161* 0.0624 Taurine.1 0.206 0.0199* 0.0724 Trehalose.2 -0.192 0.0300* 0.1034 Glutamine.1 -0.185 0.0367* 0.1196 Tryptophan.1 -0.171 0.0541 0.1678 Arginine.2 0.164 0.0636 0.1877 Trehalose.1 -0.159 0.07332 0.2066 Biotin.1 0.155 0.0803 0.2165 Betaine.1 -0.136 0.1250 0.3228 Fucose.2 0.131 0.1415 0.3509 Glucose.2 0.124 0.1616 0.3841 Tryptophan.2 -0.123 0.1680 0.3841 GABA.Lysine.1 0.120 0.1756 0.3841 Aspartate.1 -0.119 0.1811 0.3841 Uracil.2 -0.118 0.1859 0.3841 Tyrosine.1 -0.114 0.2015 0.4030 X5.Aminovalerate.2 0.108 0.2228 0.4317 Biotin.2 0.104 0.2415 0.4536 Glucose.1 0.100 0.2632 0.4800 Isoleucine.1 0.096 0.2810 0.4874 Proline.1 -0.094 0.2901 0.4874 Uridine.1 -0.094 0.2909 0.4874 Glutamine.2 -0.092 0.3023 0.4933

72
Sucrose.1 -0.088 0.3207 0.5099 Uridine.2 -0.080 0.3688 0.5716 Creatine 0.075 0.4016 0.6053 Betaine.2 0.073 0.4115 0.6053 Lactate 0.069 0.4379 0.6053 X1.3.Diaminopropane.1 -0.068 0.4446 0.6053 Leucine.1 -0.068 0.4484 0.6053 Alpha.ketoglutarate.1 -0.067 0.4491 0.6053 GABA.Lysine.2 0.065 0.4645 0.6127 Aspartate.2 -0.051 0.5676 0.7018 N.Acetylneuraminate.2 0.051 0.5711 0.7018 Tyrosine.2 0.050 0.5743 0.7018 Choline -0.050 0.5773 0.7018 X1.3.Diaminopropane.2 -0.047 0.5959 0.7104 N.Acetylneuraminate.1 -0.041 0.6470 0.7569 Valine.1 0.037 0.6759 0.7689 Fucose.1 0.037 0.6821 0.7689 X5.Aminovalerate.1 -0.032 0.7165 0.7933 Arginine.1 0.030 0.7408 0.8058 Formate 0.025 0.7760 0.8295 Glutamate 0.018 0.8949 0.9404 Methionine.1 0.009 0.9167 0.9473 Threonine.2 0.005 0.9533 0.9690 Leucine.2 -0.003 0.9698 0.9698
*Statistical significance with p-value <0.05.
Positive Spearman’s correlation coefficient means more metabolite corresponds to
increased disease presence.
Negative Spearman’s correlation coefficient means more metabolite corresponds to
decreased disease presence.
Green means the metabolite is significantly associated with health.
Red means the metabolite is significantly associated with disease.

73
Similarly, a Spearman’s correlation graph of individual metabolites associated
with health and disease are depicted in Figure 13. A significant positive correlation was
found for cadaverine.lysine.2 (r=0.314, p=0.0188), cadaverine.lysine.1 (r=0.280,
p=0.0302), propionate (r=0.271, p=0.0302), alanine.lysine.2 (r=0.261, p=0.0302),
putrescine.lysine (r=0.263, p=0.0302), valine.2 (r=0.253, p=0.0302), tyramine.1 (r=0.241,
p=0.0346) and threonine.1 (r=0.230, p=0.0470), whereas a significant negative
correlation was found for alpha.ketoglutarate.2 (r=-0.254, p=0.0302), isoleucine.2 (r=-
0.253, p=0.0302), proline.2 (r=-0.254, p=0.0302) and uracil.1 (r=-0.243, p=0.0346).

74
Figure 13. Spearman’s rank correlation coefficient graph for individual metabolites.

75
Receiver Operating Characteristics (ROC) analyses for diagnostic value
The receiver operating curve (ROC) was utilized to measure the diagnostic ability
of a metabolite at predicting disease when measured in terms of extent of bone level loss
around the dental implant. The higher the area under the curve (AUC), the greater the
metabolite is at predicting a truly diseased state. Ideally, an AUC value of 0.80 or greater
is considered to have a high diagnostic ability of differentiating between health and
disease. ROC analyses of the individual metabolites were performed to determine their
diagnostic value for health and peri-implantitis. The area under the ROC curve for all
individual metabolites are shown in Table 9. The AUC values represented in Table 9
were assessed on a continuum and included bone level measurements between healthy
sites, “other” sites and diseased sites. The AUC for cadaverine.lysine.1 was 0.617 (95%
CI: 0.540-0.688, p-value = 0.00142), for cadaverine.lysine.2 was 0.606 (95% CI: 0.533-
0.676, p-value = 0.000304), for propionate was 0.612 (95% CI: 0.544-0.681, p-value =
0.001995) and for alanine.lysine.2 was 0.606 (95% CI: 0.532-0.672, p-value = 0.00292).
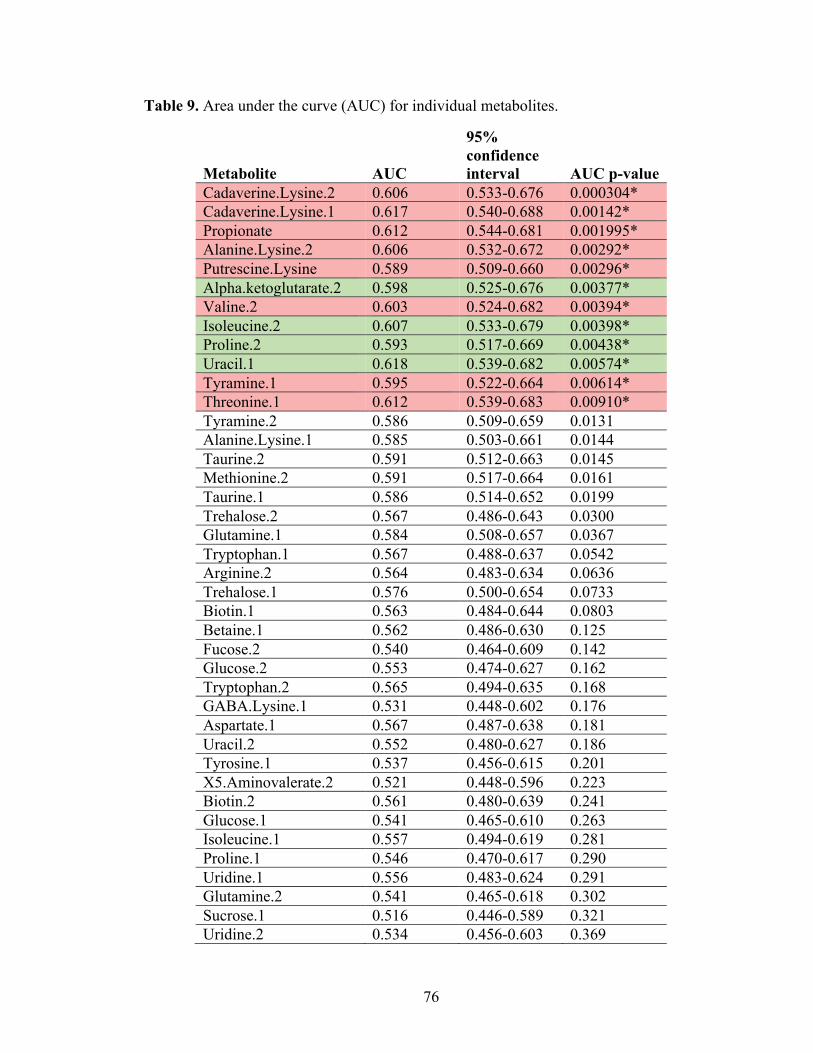
76
Table 9. Area under the curve (AUC) for individual metabolites.
Metabolite AUC
95% confidence interval AUC p-value
Cadaverine.Lysine.2 0.606 0.533-0.676 0.000304* Cadaverine.Lysine.1 0.617 0.540-0.688 0.00142* Propionate 0.612 0.544-0.681 0.001995* Alanine.Lysine.2 0.606 0.532-0.672 0.00292* Putrescine.Lysine 0.589 0.509-0.660 0.00296* Alpha.ketoglutarate.2 0.598 0.525-0.676 0.00377* Valine.2 0.603 0.524-0.682 0.00394* Isoleucine.2 0.607 0.533-0.679 0.00398* Proline.2 0.593 0.517-0.669 0.00438* Uracil.1 0.618 0.539-0.682 0.00574* Tyramine.1 0.595 0.522-0.664 0.00614* Threonine.1 0.612 0.539-0.683 0.00910* Tyramine.2 0.586 0.509-0.659 0.0131 Alanine.Lysine.1 0.585 0.503-0.661 0.0144 Taurine.2 0.591 0.512-0.663 0.0145 Methionine.2 0.591 0.517-0.664 0.0161 Taurine.1 0.586 0.514-0.652 0.0199 Trehalose.2 0.567 0.486-0.643 0.0300 Glutamine.1 0.584 0.508-0.657 0.0367 Tryptophan.1 0.567 0.488-0.637 0.0542 Arginine.2 0.564 0.483-0.634 0.0636 Trehalose.1 0.576 0.500-0.654 0.0733 Biotin.1 0.563 0.484-0.644 0.0803 Betaine.1 0.562 0.486-0.630 0.125 Fucose.2 0.540 0.464-0.609 0.142 Glucose.2 0.553 0.474-0.627 0.162 Tryptophan.2 0.565 0.494-0.635 0.168 GABA.Lysine.1 0.531 0.448-0.602 0.176 Aspartate.1 0.567 0.487-0.638 0.181 Uracil.2 0.552 0.480-0.627 0.186 Tyrosine.1 0.537 0.456-0.615 0.201 X5.Aminovalerate.2 0.521 0.448-0.596 0.223 Biotin.2 0.561 0.480-0.639 0.241 Glucose.1 0.541 0.465-0.610 0.263 Isoleucine.1 0.557 0.494-0.619 0.281 Proline.1 0.546 0.470-0.617 0.290 Uridine.1 0.556 0.483-0.624 0.291 Glutamine.2 0.541 0.465-0.618 0.302 Sucrose.1 0.516 0.446-0.589 0.321 Uridine.2 0.534 0.456-0.603 0.369

77
Creatine 0.538 0.461-0.603 0.402 Betaine.2 0.556 0.480-0.625 0.412 Lactate 0.555 0.473-0.627 0.438 X1.3.Diaminopropane.1 0.532 0.451-0.604 0.445 Leucine.1 0.539 0.457-0.613 0.448 Alpha.ketoglutarate.1 0.531 0.457-0.607 0.449 GABA.Lysine.2 0.538 0.459-0.617 0.464 Aspartate.2 0.523 0.445-0.599 0.568 N.Acetylneuraminate.2 0.549 0.478-0.621 0.571 Tyrosine.2 0.570 0.500-0.650 0.574 Choline 0.514 0.438-0.586 0.577 X1.3.Diaminopropane.2 0.536 0.456-0.605 0.596 N.Acetylneuraminate.1 0.543 0.469-0.614 0.647 Valine.1 0.530 0.458-0.601 0.676 Fucose.1 0.561 0.494-0.624 0.682 X5.Aminovalerate.1 0.506 0.437-0.577 0.716 Arginine.1 0.528 0.457-0.593 0.741 Formate 0.524 0.444-0.605 0.776 Glutamate 0.500 0.423-0.574 0.895 Methionine.1 0.544 0.468-0.612 0.917 Threonine.2 0.481 0.396-0.561 0.953 Leucine.2 0.504 0.431-0.578 0.970
*Statistical significance with p-value <0.05.

78
The ROC graphs for the 4 individual metabolites most significantly correlated
with bone level loss are found in Figures 14-17. These graphs were computed by using
dichotomized definitions of healthy and diseased states and by not including data from
the “other” implant sites. Hence, when excluding the “other” implant site data, the AUC
slightly increased for all individual metabolites. The AUC for cadaverine.lysine.1 was
0.64 (p-value <0.05), for cadaverine.lysine.2 was 0.71 (p-value <0.05), for propionate
was 0.64 (p-value <0.05) and for alanine.lysine.2 was 0.64 (p-value <0.05).

79
Figure 14. Receiver operating characteristic (ROC) graph and box plot for cadaverine.lysine.1
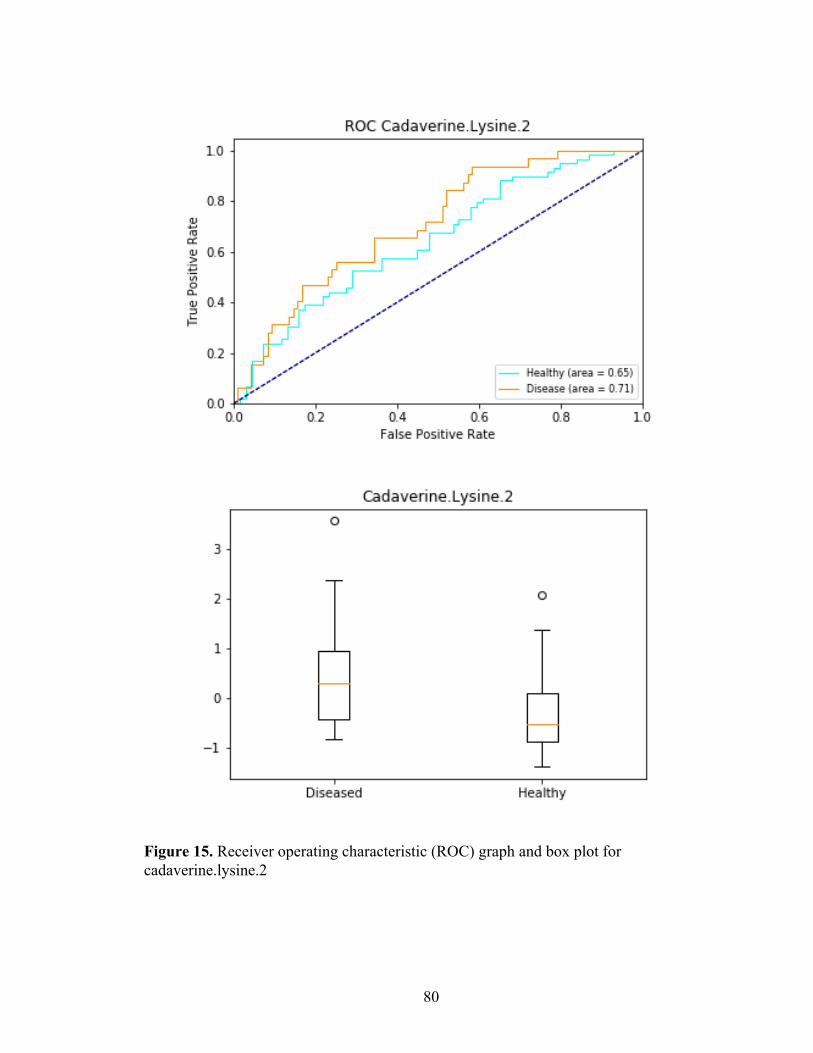
80
Figure 15. Receiver operating characteristic (ROC) graph and box plot for cadaverine.lysine.2

81
Figure 16. Receiver operating characteristic (ROC) graph and box plot for propionate.
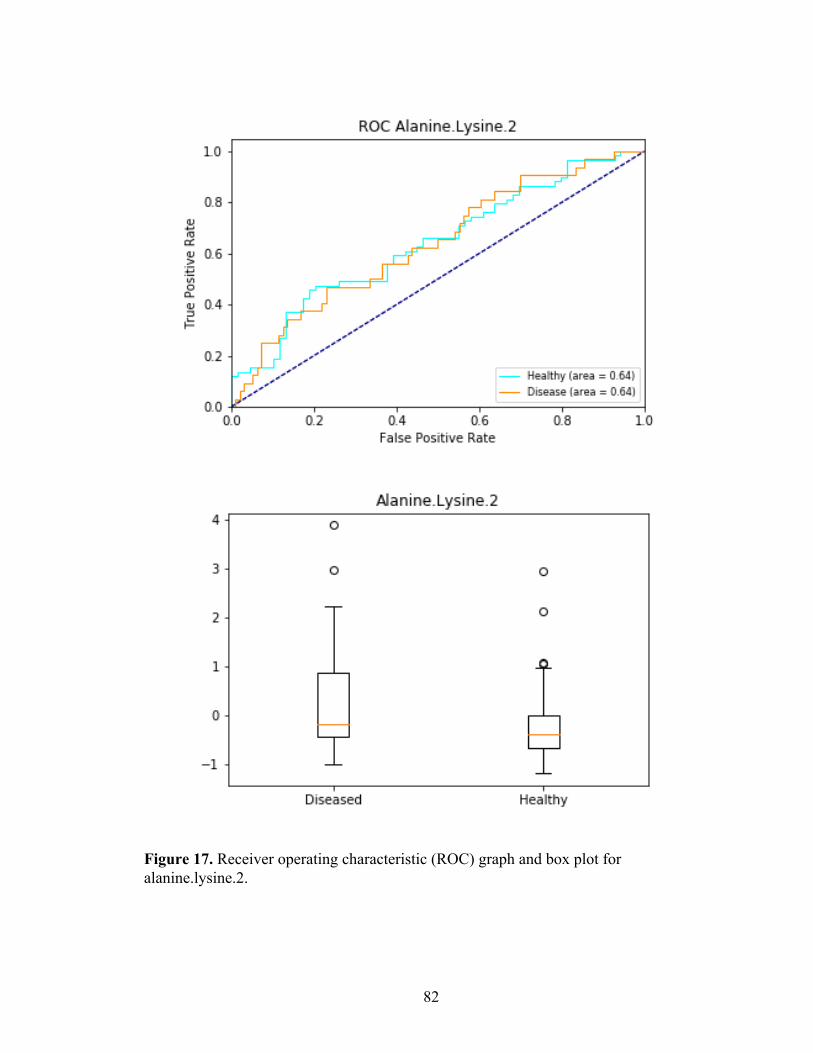
82
Figure 17. Receiver operating characteristic (ROC) graph and box plot for alanine.lysine.2.

83
The ROC graphs for individual metabolites most significantly correlated with
health (or lack of bone level loss) are found in Figures 18-21. The AUC for
alpha.ketoglutarate.2 was 0.598 (95% CI: 0.525-0.676, p-value = 0.00377), for
isoleucine.2 was 0.607 (95% CI: 0.533-0.679, p-value = 0.00398), for proline.2 was
0.593 (95% CI: 0.517-0.669, p-value = 0.00438) and for uracil.1 was 0.618 (95% CI:
0.539-0.682, p-value = 0.00574). Because none of our AUC values were greater than
0.618, individual metabolites showed a low discriminatory ability to differentiate
between peri-implant health and disease.

84
Figure 18. Receiver operating characteristic (ROC) graph and box plot for alpha.ketoglutarate.2

85
Figure 19. Receiver operating characteristic (ROC) graph and box plot for isoleucine.2

86
Figure 20. Receiver operating characteristic (ROC) graph and box plot for proline.2

87
Figure 21. Receiver operating characteristic (ROC) graph and box plot for uracil.1

88
The individual metabolites most significantly correlated with disease and health
were then combined in pairs of 2 to 4 to see whether their combination would increase
the diagnostic value of the test (Table 10) . The combination of metabolites significantly
correlated with disease had an AUC ranging between 0.624 and 0.653 with a p-value
<0.001. As was performed with the individual metabolites, the AUC values represented
in Table 10 were assessed on a continuum and included bone level measurements
between healthy sites, “other” sites and diseased sites.

89
Table 10. Area under the curve (AUC) for the combination of metabolites significantly correlated with health and disease.
Combination of Metabolites significantly associated with disease AUC
95% confidence interval p-value
Cadaverine.Lysine.2 + Cadaverine.Lysine.1 0.627 0.560-0.696 0.0000645* Cadaverine.Lysine.2 + Propionate 0.631 0.567-0.698 0.0000555* Cadaverine.Lysine.2 + Alanine.Lysine.2 0.615 0.543-0.68 0.000172* Cadaverine.Lysine.1 + Propionate 0.638 0.564-0.704 0.0000995* Cadaverine.Lysine.1 + Alanine.Lysine.2 0.624 0.543-0.689 0.000586* Propionate + Alanine.Lysine.2 0.642 0.573-0.709 0.0000991* Cadaverine.Lysine.2 + Cadaverine.Lysine.1 + Propionate
0.649 0.584-0.717 0.0000068*
Cadaverine.Lysine.2 + Cadaverine.Lysine.1 + Propionate + Alanine.Lysine.2
0.653 0.582-0.718 0.00000536*
Combination of metabolites significantly associated with health AUC
95% confidence interval p-value
Isoleucine.2 + Alpha.ketoglutarate.2 0.628 0.554-0.702 0.0004158* Isoleucine.2 + Proline.2 0.642 0.565-0.715 0.000133* Isoleucine.2 + Uracil.1 0.666 0.589-0.731 0.0000586* Alpha.ketoglutarate.2 + Proline.2 0.633 0.554-0.711 0.000418* Alpha.ketoglutarate.2 + Uracil.1 0.615 0.543-0.688 0.000120* Proline.2 + Uracil.1 0.597 0.521-0.670 0.00208* Isoleucine.2 + Alpha.ketoglutarate.2 + Proline.2
0.656 0.585-0.728 0.0000395*
Isoleucine.2 + Alpha.ketoglutarate.2 + Proline.2 + Uracil.1
0.683 0.602-0.753 0.0000045*
*Statistical significance with p-value <0.05.

90
However, when using dichotomized definitions of healthy and diseased states and
by excluding data from the “other” implant sites, the AUC slightly increased for all
individual metabolites (Figures 22-28). The combination of metabolites significantly
correlated with disease had an AUC ranging between 0.65 and 0.72 with a p-value <0.05.

91
Figure 22. Receiver operating characteristic (ROC) graph for the combination of cadaverine.lysine.2 and cadaverine.lysine.1
Figure 23. Receiver operating characteristic (ROC) graph for the combination of cadaverine.lysine.1 and propionate

92
Figure 24. Receiver operating characteristic (ROC) graph for the combination of cadaverine.lysine.1 and alanine.lysine.2
Figure 25. Receiver operating characteristic (ROC) graph for the combination of cadaverine.lysine.2 and propionate

93
Figure 26. Receiver operating characteristic (ROC) graph for the combination of cadaverine.lysine.2 and alanine.lysine.2
Figure 27. Receiver operating characteristic (ROC) graph for the combination of cadaverine.lysine.2, cadaverine.lysine.1 and propionate

94
Figure 28. Receiver operating characteristic (ROC) graph for the combination of cadaverine.lysine.2, cadaverine.lysine.1, propionate and alanine.lysine.2

95
Similarly, the combination of metabolites significantly correlated with health had
an AUC ranging between 0.597 and 0.683 with a p-value <0.001 in Table 10 and between
0.63 and 0.70 with a p-value <0.05 in Figures 29-36. Although using dichotomized
values increased the AUC slightly, the overall combination of metabolites did not
increase the diagnostic value of the test and their predictive ability to discriminate
between health and disease was low.
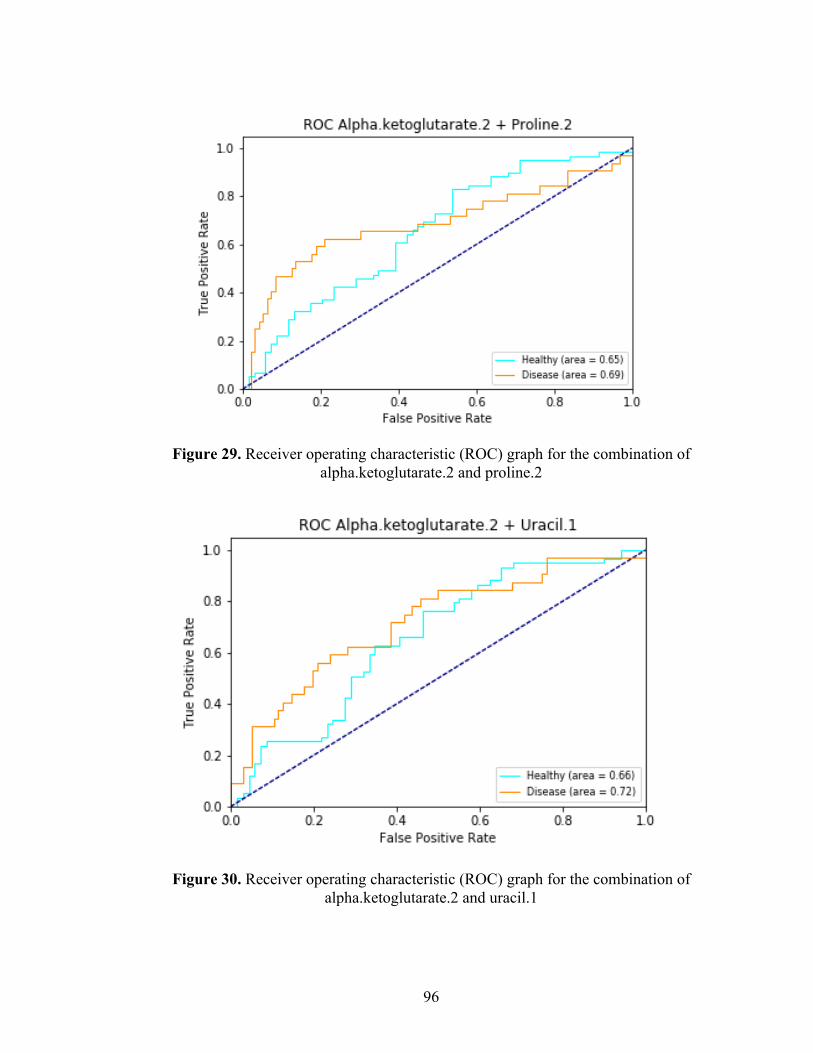
96
Figure 29. Receiver operating characteristic (ROC) graph for the combination of alpha.ketoglutarate.2 and proline.2
Figure 30. Receiver operating characteristic (ROC) graph for the combination of alpha.ketoglutarate.2 and uracil.1

97
Figure 31. Receiver operating characteristic (ROC) graph for the combination of isoleucine.2 and alpha.ketoglutarate.2
Figure 32. Receiver operating characteristic (ROC) graph for the combination of isoleucine.2 and proline.2

98
Figure 33. Receiver operating characteristic (ROC) graph for the combination of isoleucine.2 and uracil.1
Figure 34. Receiver operating characteristic (ROC) graph for the combination of proline.2 and uracil.1

99
Figure 35. Receiver operating characteristic (ROC) graph for the combination of isoleucine.2, alpha.ketoglutarate.2 and proline.2
Figure 36. Receiver operating characteristic (ROC) graph for the combination of isoleucine.2, alpha.ketoglutarate.2, proline.2 and uracil.1

100
Discussion
The current gold standard for the diagnosis of peri-implantitis includes clinical
and radiographic measurements such as increased probing pocket depth, bleeding on
probing, suppuration, mobility and peri-implant bone loss25, 47. However, these
diagnostic modalities are only able to provide clinicians with information based on the
current status of the implant, once peri-implant disease activity has already occurred.
Conventional diagnostic techniques are unable to differentiate between quiescent sites
and sites that are more susceptible to future peri-implant bone breakdown44. Therefore,
the prediction of disease progression is essentially not possible. The sampling and
surveying of PISF samples may give a more sensitive, accurate and reproducible
technique for the detection of peri-implant disease and the prediction of disease
progression. Recently in periodontics, research has been conducted with the hopes of
discovering a diagnostic and prognostic test for peri-implantitis via the collection of PISF
samples and analysis of their proteomic, enzymatic and metabolomic components.
Cross-sectional studies are required to determine the diagnostic value of specific
biomarkers in PISF. Thereafter, longitudinal investigations can be subsequently
conducted to determine whether biomarkers associated with disease are predictive of
peri-implant disease progression. The present study aimed to assess cross-sectionally
whether the involvement and presence of certain metabolite biomarkers found in PISF
were diagnostic of peri-implantitis.
In the present investigation, cadaverine/lysine, propionate, alanine/lysine,
putrescine/lysine, valine, tyramine and threonine were significantly correlated with a

101
diseased peri-implant state. Conversely, a-ketoglutarate, isoleucine, proline and uracil
were significantly correlated with a healthy peri-implant state. Although specific
metabolites were significantly correlated with disease and health, they failed to accurately
and predictably discriminate between peri-implant health and disease with sufficient
sensitivity and specificity. Hence, results of our investigation demonstrated that the study
of individual and combined metabolites in PISF shows promise at determining which
metabolites are correlated with healthy and diseased states. However, their use was not a
predictable and valid diagnostic test for peri-implantitis.
To the author’s knowledge, no other studies have been conducted cross-
sectionally or longitudinally to assess whether metabolites found in PISF around implants
or in whole saliva have been predictive in diagnosing peri-implant health and disease or
in determining whether disease will develop or progress. Hence, direct comparisons to
findings from previous reports cannot be performed. However, previous studies have
been conducted assessing metabolic components of GCF and whole saliva to determine
whether they are predictive of periodontal health or disease around teeth. As previously
discussed, studies have shown promise in finding metabolites significantly correlated
with periodontal health and disease 110-117. However, their findings remain to be
inconsistent, whether saliva or GCF and NMR or MS were used. Over and above these
inconsistencies, one must be cautious in making similar inferences in the case of peri-
implantitis. Although the etiology and pathogenesis of periodontitis and peri-implantitis
remain to be similar there are obvious macro- and micro-anatomical differences. The
greater inflammation and circumferential pattern of bone loss around implants, in contrast
to the site-specific bone loss around teeth, are indications of significant difference in the

102
pathophysiology of the two diseases. Hence, direct comparison of our findings with
those from periodontitis studies is not possible. Further investigations with assignment of
a greater number of metabolites using NMR combined with MS may yield algorithms
with increased sensitivity and specificity to diagnose and predict the risk of progression
of peri-implant disease.
Strengths and Limitations
As with any investigation, our study has inherent strengths and limitations.
Previous studies assessing biomarkers associated with periodontitis/peri-implantitis have
used diverse biological sampling, collection, storage and analysis methods. Hence,
finding biomarkers associated with periodontal or peri-implant disease remains elusive.
One of the strengths of our investigation is that we sampled PISF instead of whole saliva
to determine metabolic profiles associated with health and disease. It is preferred to use
PISF over saliva as it only includes constituents derived from blood, host and bacterial
biofilm. The PISF gives a more accurate depiction of a site-specific state of health or
disease surrounding an implant, rather than the overall state of the oral cavity as seen
with saliva.
In previous studies, the collection of PISF has typically been performed via the
use of paper strips, points or membranes. From a manufacturing standpoint, these could
have batch to batch variations. Hence, variations in metabolites found on the clean
membranes/strips occurs and can lead to greater background noise during NMR analysis.
To account for this, we used inert silver membrane discs that show lower levels of

103
background noise when analyzed via NMR and all silver discs were from the same lot
number and manufacturer.
It is well documented in the literature that the volume of produced PISF in
diseased sites is greater than in healthy sites 51. Due to this increase in volume, the total
amount of metabolites would be much higher in diseased sites than in healthy sites.
Thus, we accounted for the difference in volumes and corrected inherent metabolic
concentration differences of each sample by performing median normalization across all
metabolites in each sample prior to data analysis. We also ensured that a 30 second
standardized collection time was observed for each collected sample to avoid
contamination of the sample with saliva. Another strength is that we removed
supragingival peri-implant plaque and all implant sites were dried with air prior to PISF
sampling. This may have improved the detection of metabolites derived from the
subgingival area only, which would minimize supragingival bacterial biofilm and saliva
contaminants and may reflect a more accurate pathophysiology of peri-implantitis.
One of the main limitations of this study is the relatively small sample size.
Increasing the sample size will subsequently increase the power of our study and allow
for a more accurate acceptance or rejection of the null hypothesis. Ideally, each study
group should include an equal number of subjects. However, in our investigation, the
peri-implantitis group had more participants than the healthy and other groups.
Another limitation of our study is that we used an aggregate of performance for
all three site-specific outcomes (healthy implants vs other implants vs diseased implants)
in our data analysis. When analysing the data via multivariate logistic regression models,
the metabolites in diseased implants are compared against the combination of metabolites

104
found in healthy and other implants, and metabolites in healthy implants are compared
against the combination of metabolites found in other and diseased implants. However, it
may be of more interest to dichotomize the data and only look at metabolites found in
healthy implants alone vs those found in diseased implants. We can hypothesize that
metabolites found in other implants are possibly a metabolic continuum from healthy to
disease. Combining these findings may reduce the predictive ability of a metabolite, or a
combination of metabolites, to predict peri-implant health or disease specifically. Future
analyses by our group should consider only the comparison between metabolites found in
healthy implants and diseased implants.
Future Research
The investigation of metabolic biomarkers found in PISF is considered a novel,
yet promising, approach at determining whether a chairside diagnostic and prognostic test
can be developed as a non-invasive and accurate method of determining the presence and
progression of peri-implant disease. Ongoing subject recruitment to increase our study
power and stringent 6-month follow-ups of the study participants are currently being
conducted in the Graduate Periodontal Clinical at the University of Minnesota. This
progression will confirm or refute the diagnostic validity of our findings and to elucidate
whether metabolites found in PISF may be of prognostic value in predicting future peri-
implant bone loss. Further cross-sectional and longitudinal studies conducted in other
institutional centers worldwide are required to assess the plausibility and reliability of our
findings. This will determine whether specific metabolites, irrespective of genetic and

105
environmental influences are truly predictive of the health or disease status of a dental
implant.
As previously discussed, some of the biggest advantages of NMR for
metabolomics is that it is a quantitative, non-biased, high-throughput, non-destructive and
reproducible technique used for the identification of unknown metabolites 103, 107, 108.
However, some disadvantages is that it is less sensitive than MS and can only detect the
most abundant metabolites in a given sample. The study of metabolomics using NMR or
MS alone will never allow for a perfect biological picture or identification of an entire
metabolome. Nevertheless, studies to date have used single analytical techniques for the
acquisition of metabolite data sets. Owing to their fundamental complementarity, the
combination of NMR and MS would allow for a more comprehensive coverage of a
metabolome 102, 108, 132. Accordingly, future studies involving PISF samples should
combine the use of NMR and MS to boost metabolic biomarker discovery and help
improve our understanding of the pathogenesis of peri-implantitis.
Future studies should also investigate metabolic pathways associated with
identified metabolites, which may allow for a better understanding of the mechanisms
behind peri-implant disease. One of the biggest challenges in the field of metabolomic
research is relating the identified metabolomic biomarkers to their role in the
pathogenesis of disease 99. To evaluate the biological role of one or several metabolites,
we must understand their interrelationship and their specific function in metabolic
pathways 99, 133. Although significant advances have been made recently, mapping of
metabolic pathways remains to be a challenge as databases pertaining to these pathways
are still incomplete. Once metabolic pathway databases are better identified, metabolites

106
can then be placed into context with upstream genes and proteins to better understand
mechanisms involved in disease development and progression 99.
To date, the ‘omic technologies have not yet yielded valid biomarkers for the
diagnosis of peri-implantitis. However, findings from this investigation will help
facilitate future research on whether metabolites found in PISF can be utilized to
diagnose peri-implant disease and whether they are predictive of disease progression.
The early detection of peri-implantitis is critical in the long-term success of implants and
metabolites show promise for the early diagnosis of disease. Due to the multifactorial
cause of peri-implantitis, it is unlikely that one specific biomarker, but rather a
multiplicity of biomarkers fitting into a predictive algorithm, will be able to differentiate
between health and disease 95 and predict future peri-implant disease progression. Once
highly sensitive and specific metabolomic biomarkers found in PISF are discovered,
accurate, simple and non-invasive chair side diagnostic and prognostic tests for peri-
implantitis may be generated in clinical practice 97. Ideally, these tests will be able to
determine whether a site is healthy or diseased and whether the site is at risk of
deterioration for improved, personalized and cost-effective treatment interventions.
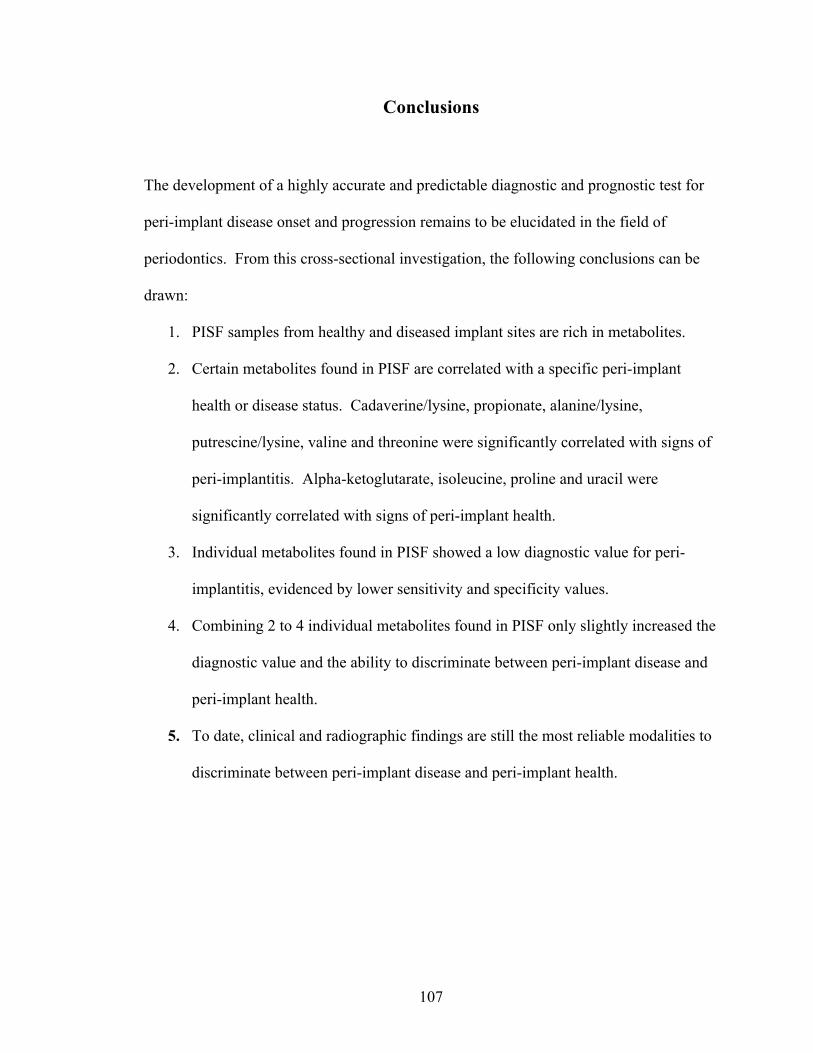
107
Conclusions
The development of a highly accurate and predictable diagnostic and prognostic test for
peri-implant disease onset and progression remains to be elucidated in the field of
periodontics. From this cross-sectional investigation, the following conclusions can be
drawn:
1. PISF samples from healthy and diseased implant sites are rich in metabolites.
2. Certain metabolites found in PISF are correlated with a specific peri-implant
health or disease status. Cadaverine/lysine, propionate, alanine/lysine,
putrescine/lysine, valine and threonine were significantly correlated with signs of
peri-implantitis. Alpha-ketoglutarate, isoleucine, proline and uracil were
significantly correlated with signs of peri-implant health.
3. Individual metabolites found in PISF showed a low diagnostic value for peri-
implantitis, evidenced by lower sensitivity and specificity values.
4. Combining 2 to 4 individual metabolites found in PISF only slightly increased the
diagnostic value and the ability to discriminate between peri-implant disease and
peri-implant health.
5. To date, clinical and radiographic findings are still the most reliable modalities to
discriminate between peri-implant disease and peri-implant health.

108
Bibliography
1. Brånemark PI, Hansson BO, Adell R, et al. Osseointegrated implants in the treatment of the edentulous jaw. Experience from a 10-year period. Scand J Plast Reconstr Surg Suppl. 1977;16:1-132.
2. Adell R, Lekholm U, Rockler B, Brånemark PI. A 15-year study of osseointegrated implants in the treatment of the edentulous jaw. Int J Oral Surg. Dec 1981;10(6):387-416. doi:10.1016/s0300-9785(81)80077-4
3. Pommer B, Zechner W, Watzak G, Ulm C, Watzek G, Tepper G. Progress and trends in patients' mindset on dental implants. II: implant acceptance, patient-perceived costs and patient satisfaction. Clin Oral Implants Res. Jan 2011;22(1):106-12. doi:10.1111/j.1600-0501.2010.01969.x
4. Elani HW, Starr JR, Da Silva JD, Gallucci GO. Trends in Dental Implant Use in the U.S., 1999-2016, and Projections to 2026. J Dent Res. 12 2018;97(13):1424-1430. doi:10.1177/0022034518792567
5. Jung RE, Zembic A, Pjetursson BE, Zwahlen M, Thoma DS. Systematic review of the survival rate and the incidence of biological, technical, and aesthetic complications of single crowns on implants reported in longitudinal studies with a mean follow-up of 5 years. Clin Oral Implants Res. Oct 2012;23 Suppl 6:2-21. doi:10.1111/j.1600-0501.2012.02547.x
6. Muddugangadhar BC, Amarnath GS, Sonika R, Chheda PS, Garg A. Meta-analysis of Failure and Survival Rate of Implant-supported Single Crowns, Fixed Partial Denture, and Implant Tooth-supported Prostheses. J Int Oral Health. Sep 2015;7(9):11-7.
7. Misch CE, Perel ML, Wang HL, et al. Implant success, survival, and failure: the International Congress of Oral Implantologists (ICOI) Pisa Consensus Conference. Implant Dent. Mar 2008;17(1):5-15. doi:10.1097/ID.0b013e3181676059
8. Hamada Y, Shin D, John V. Peri-Implant Disease--A Significant Complication of Dental Implant Supported Restorative Treatment. J Indiana Dent Assoc. 2016;95(1):31-8.
9. Albrektsson T, Isidor F. Consensus report of session IV. London: Quintessence; 1994. p. 365-369.
10. Renvert S, Persson GR, Pirih FQ, Camargo PM. Peri-implant health, peri-implant mucositis, and peri-implantitis: Case definitions and diagnostic considerations. J Periodontol. Jun 2018;89 Suppl 1:S304-S312. doi:10.1002/JPER.17-0588
109
11. Araujo MG, Lindhe J. Peri-implant health. J Periodontol. Jun 2018;89 Suppl 1:S249-S256. doi:10.1002/JPER.16-0424
12. Berglundh T, Armitage G, Araujo MG, et al. Peri-implant diseases and conditions: Consensus report of workgroup 4 of the 2017 World Workshop on the Classification of Periodontal and Peri-Implant Diseases and Conditions. J Periodontol. Jun 2018;89 Suppl 1:S313-S318. doi:10.1002/JPER.17-0739
13. G Caton J, Armitage G, Berglundh T, et al. A new classification scheme for periodontal and peri-implant diseases and conditions - Introduction and key changes from the 1999 classification. J Periodontol. Jun 2018;89 Suppl 1:S1-S8. doi:10.1002/JPER.18-0157
14. Lindquist LW, Carlsson GE, Jemt T. A prospective 15-year follow-up study of mandibular fixed prostheses supported by osseointegrated implants. Clinical results and marginal bone loss. Clin Oral Implants Res. Dec 1996;7(4):329-36.
15. Cochran DL, Nummikoski PV, Schoolfield JD, Jones AA, Oates TW. A prospective multicenter 5-year radiographic evaluation of crestal bone levels over time in 596 dental implants placed in 192 patients. J Periodontol. May 2009;80(5):725-33. doi:10.1902/jop.2009.080401
16. Heitz-Mayfield LJA, Salvi GE. Peri-implant mucositis. J Periodontol. Jun 2018;89 Suppl 1:S257-S266. doi:10.1002/JPER.16-0488
17. Schwarz F, Derks J, Monje A, Wang HL. Peri-implantitis. J Periodontol. Jun 2018;89 Suppl 1:S267-S290. doi:10.1002/JPER.16-0350
18. Loe H, Theilade E, Jensen SB. EXPERIMENTAL GINGIVITIS IN MAN. J Periodontol. 1965 May-Jun 1965;36:177-87. doi:10.1902/jop.1965.36.3.177
19. Pontoriero R, Tonelli MP, Carnevale G, Mombelli A, Nyman SR, Lang NP. Experimentally induced peri-implant mucositis. A clinical study in humans. Clin Oral Implants Res. Dec 1994;5(4):254-9.
20. Zitzmann NU, Berglundh T, Marinello CP, Lindhe J. Experimental peri-implant mucositis in man. J Clin Periodontol. Jun 2001;28(6):517-23.
21. Salvi GE, Aglietta M, Eick S, Sculean A, Lang NP, Ramseier CA. Reversibility of experimental peri-implant mucositis compared with experimental gingivitis in humans. Clin Oral Implants Res. Feb 2012;23(2):182-190. doi:10.1111/j.1600-0501.2011.02220.x
22. Kornman KS. Mapping the pathogenesis of periodontitis: a new look. J Periodontol. Aug 2008;79(8 Suppl):1560-8. doi:10.1902/jop.2008.080213

110
23. Derks J, Schaller D, Håkansson J, Wennström JL, Tomasi C, Berglundh T. Peri-implantitis - onset and pattern of progression. J Clin Periodontol. Apr 2016;43(4):383-8. doi:10.1111/jcpe.12535
24. Fransson C, Tomasi C, Pikner SS, et al. Severity and pattern of peri-implantitis-associated bone loss. J Clin Periodontol. May 2010;37(5):442-8. doi:10.1111/j.1600-051X.2010.01537.x
25. Coli P, Christiaens V, Sennerby L, Bruyn H. Reliability of periodontal diagnostic tools for monitoring peri-implant health and disease. Periodontol 2000. 02 2017;73(1):203-217. doi:10.1111/prd.12162
26. Broggini N, McManus LM, Hermann JS, et al. Persistent acute inflammation at the implant-abutment interface. J Dent Res. Mar 2003;82(3):232-7. doi:10.1177/154405910308200316
27. Broggini N, McManus LM, Hermann JS, et al. Peri-implant inflammation defined by the implant-abutment interface. J Dent Res. May 2006;85(5):473-8. doi:10.1177/154405910608500515
28. Löe H, Anerud A, Boysen H, Smith M. The natural history of periodontal disease in man. The rate of periodontal destruction before 40 years of age. J Periodontol. Dec 1978;49(12):607-20. doi:10.1902/jop.1978.49.12.607
29. Schätzle M, Löe H, Lang NP, et al. Clinical course of chronic periodontitis. III. Patterns, variations and risks of attachment loss. J Clin Periodontol. Oct 2003;30(10):909-18.
30. Cochran DL, Hermann JS, Schenk RK, Higginbottom FL, Buser D. Biologic width around titanium implants. A histometric analysis of the implanto-gingival junction around unloaded and loaded nonsubmerged implants in the canine mandible. J Periodontol. Feb 1997;68(2):186-98. doi:10.1902/jop.1997.68.2.186
31. Belibasakis GN. Microbiological and immuno-pathological aspects of peri-implant diseases. Arch Oral Biol. Jan 2014;59(1):66-72. doi:10.1016/j.archoralbio.2013.09.013
32. Carcuac O, Abrahamsson I, Albouy JP, Linder E, Larsson L, Berglundh T. Experimental periodontitis and peri-implantitis in dogs. Clin Oral Implants Res. Apr 2013;24(4):363-71. doi:10.1111/clr.12067
33. Doornewaard R, Christiaens V, De Bruyn H, et al. Long-Term Effect of Surface Roughness and Patients' Factors on Crestal Bone Loss at Dental Implants. A Systematic Review and Meta-Analysis. Clin Implant Dent Relat Res. Apr 2017;19(2):372-399. doi:10.1111/cid.12457

111
34. De Bruyn H, Christiaens V, Doornewaard R, et al. Implant surface roughness and patient factors on long-term peri-implant bone loss. Periodontol 2000. 02 2017;73(1):218-227. doi:10.1111/prd.12177
35. Albouy JP, Abrahamsson I, Berglundh T. Spontaneous progression of experimental peri-implantitis at implants with different surface characteristics: an experimental study in dogs. J Clin Periodontol. Feb 2012;39(2):182-7. doi:10.1111/j.1600-051X.2011.01820.x
36. Lindhe J, Meyle J, Periodontology GDoEWo. Peri-implant diseases: Consensus Report of the Sixth European Workshop on Periodontology. J Clin Periodontol. Sep 2008;35(8 Suppl):282-5. doi:10.1111/j.1600-051X.2008.01283.x
37. Derks J, Tomasi C. Peri-implant health and disease. A systematic review of current epidemiology. J Clin Periodontol. Apr 2015;42 Suppl 16:S158-71. doi:10.1111/jcpe.12334
38. Lee CT, Huang YW, Zhu L, Weltman R. Prevalences of peri-implantitis and peri-implant mucositis: systematic review and meta-analysis. J Dent. Jul 2017;62:1-12. doi:10.1016/j.jdent.2017.04.011
39. Dreyer H, Grischke J, Tiede C, et al. Epidemiology and risk factors of peri-implantitis: A systematic review. J Periodontal Res. Jun 2018;doi:10.1111/jre.12562
40. Claffey N, Clarke E, Polyzois I, Renvert S. Surgical treatment of peri-implantitis. J Clin Periodontol. Sep 2008;35(8 Suppl):316-32. doi:10.1111/j.1600-051X.2008.01277.x
41. Renvert S, Polyzois I, Maguire R. Re-osseointegration on previously contaminated surfaces: a systematic review. Clin Oral Implants Res. Sep 2009;20 Suppl 4:216-27. doi:10.1111/j.1600-0501.2009.01786.x
42. Fu JH, Wang HL. Can Periimplantitis Be Treated? Dent Clin North Am. Oct 2015;59(4):951-80. doi:10.1016/j.cden.2015.06.004
43. Kinney JS, Ramseier CA, Giannobile WV. Oral fluid-based biomarkers of alveolar bone loss in periodontitis. Ann N Y Acad Sci. Mar 2007;1098:230-51. doi:10.1196/annals.1384.028
44. Buduneli N, Kinane DF. Host-derived diagnostic markers related to soft tissue destruction and bone degradation in periodontitis. J Clin Periodontol. Mar 2011;38 Suppl 11:85-105. doi:10.1111/j.1600-051X.2010.01670.x
45. Taba M, Kinney J, Kim AS, Giannobile WV. Diagnostic biomarkers for oral and periodontal diseases. Dent Clin North Am. Jul 2005;49(3):551-71, vi. doi:10.1016/j.cden.2005.03.009

112
46. Loos BG, Tjoa S. Host-derived diagnostic markers for periodontitis: do they exist in gingival crevice fluid? Periodontol 2000. 2005;39:53-72. doi:10.1111/j.1600-0757.2005.00129.x
47. Heitz-Mayfield LJ. Peri-implant diseases: diagnosis and risk indicators. J Clin Periodontol. Sep 2008;35(8 Suppl):292-304. doi:10.1111/j.1600-051X.2008.01275.x
48. Weber HP, Crohin CC, Fiorellini JP. A 5-year prospective clinical and radiographic study of non-submerged dental implants. Clin Oral Implants Res. Apr 2000;11(2):144-53.
49. Giannopoulou C, Bernard JP, Buser D, Carrel A, Belser UC. Effect of intracrevicular restoration margins on peri-implant health: clinical, biochemical, and microbiologic findings around esthetic implants up to 9 years. Int J Oral Maxillofac Implants. 2003 Mar-Apr 2003;18(2):173-81.
50. Jepsen S, Rühling A, Jepsen K, Ohlenbusch B, Albers HK. Progressive peri-implantitis. Incidence and prediction of peri-implant attachment loss. Clin Oral Implants Res. Jun 1996;7(2):133-42.
51. Bhardwaj S, Prabhuji ML. Comparative volumetric and clinical evaluation of peri-implant sulcular fluid and gingival crevicular fluid. J Periodontal Implant Sci. Oct 2013;43(5):233-42. doi:10.5051/jpis.2013.43.5.233
52. Group. BDW. Biomarkers and surrogate endpoints: preferred definitions and conceptual framework. Clin Pharmacol Ther. Mar 2001;69(3):89-95. doi:10.1067/mcp.2001.113989
53. Safety WHOIPoC. Biomarkers in risk assessment: validity and validation. http://www.inchem.org/documents/ehc/ehc/ehc222.html
54. Strimbu K, Tavel JA. What are biomarkers? Curr Opin HIV AIDS. Nov 2010;5(6):463-6. doi:10.1097/COH.0b013e32833ed177
55. Koyanagi T, Sakamoto M, Takeuchi Y, Maruyama N, Ohkuma M, Izumi Y. Comprehensive microbiological findings in peri-implantitis and periodontitis. J Clin Periodontol. Mar 2013;40(3):218-26. doi:10.1111/jcpe.12047
56. Koyanagi T, Sakamoto M, Takeuchi Y, Ohkuma M, Izumi Y. Analysis of microbiota associated with peri-implantitis using 16S rRNA gene clone library. J Oral Microbiol. May 2010;2doi:10.3402/jom.v2i0.5104
57. Mombelli A, Décaillet F. The characteristics of biofilms in peri-implant disease. J Clin Periodontol. Mar 2011;38 Suppl 11:203-13. doi:10.1111/j.1600-051X.2010.01666.x

113
58. Alcoforado GA, Rams TE, Feik D, Slots J. Microbial aspects of failing osseointegrated dental implants in humans. J Parodontol. Feb 1991;10(1):11-8.
59. Leonhardt A, Renvert S, Dahlén G. Microbial findings at failing implants. Clin Oral Implants Res. Oct 1999;10(5):339-45.
60. Wang HL, Garaicoa-Pazmino C, Collins A, Ong HS, Chudri R, Giannobile WV. Protein biomarkers and microbial profiles in peri-implantitis. Clin Oral Implants Res. Sep 2016;27(9):1129-36. doi:10.1111/clr.12708
61. Salcetti JM, Moriarty JD, Cooper LF, et al. The clinical, microbial, and host response characteristics of the failing implant. Int J Oral Maxillofac Implants. 1997 Jan-Feb 1997;12(1):32-42.
62. de Leitão JA, De Lorenzo JL, Avila-Campos MJ, Sendyk WR. Analysis of the presence of pathogens which predict the risk of disease at peri-implant sites through polymerase chain reaction (PCR). Braz Oral Res. 2005 Jan-Mar 2005;19(1):52-7.
63. Mencio F, De Angelis F, Papi P, Rosella D, Pompa G, Di Carlo S. A randomized clinical trial about presence of pathogenic microflora and risk of peri-implantitis: comparison of two different types of implant-abutment connections. Eur Rev Med Pharmacol Sci. 04 2017;21(7):1443-1451.
64. Lafaurie GI, Sabogal MA, Castillo DM, et al. Microbiome and Microbial Biofilm Profiles of Peri-Implantitis: A Systematic Review. J Periodontol. 10 2017;88(10):1066-1089. doi:10.1902/jop.2017.170123
65. Black G. The fibres and glands of the peridontal membrane. Dent Cosmos. 1899;41:101-122.
66. Pashley DH. A mechanistic analysis of gingival fluid production. J Periodontal Res. Apr 1976;11(2):121-34.
67. Egelberg J. Permeability of the dento-gingival blood vessels. 1. Application of the vascular labelling method and gingival fluid measurements. J Periodontal Res. 1966;1(3):180-91.
68. Egelberg J. Permeability of the dento-gingival blood vessels. II. Clinically healthy gingivae. J Periodontal Res. 1966;1(4):276-86.
69. Egelberg J. Permeability of the dento-gingival blood vessels. 3. Chronically inflamed gingivae. J Periodontal Res. 1966;1(4):287-96.
70. Armitage GC. Analysis of gingival crevice fluid and risk of progression of periodontitis. Periodontol 2000. 2004;34:109-19.

114
71. Apse P, Ellen RP, Overall CM, Zarb GA. Microbiota and crevicular fluid collagenase activity in the osseointegrated dental implant sulcus: a comparison of sites in edentulous and partially edentulous patients. J Periodontal Res. Mar 1989;24(2):96-105.
72. Ozmeric N. Advances in periodontal disease markers. Clin Chim Acta. May 2004;343(1-2):1-16. doi:10.1016/j.cccn.2004.01.022
73. Trindade F, Oppenheim FG, Helmerhorst EJ, Amado F, Gomes PS, Vitorino R. Uncovering the molecular networks in periodontitis. Proteomics Clin Appl. Oct 2014;8(9-10):748-61. doi:10.1002/prca.201400028
74. Gupta G. Gingival crevicular fluid as a periodontal diagnostic indicator--I: Host derived enzymes and tissue breakdown products. J Med Life. Dec 2012;5(4):390-7.
75. Duarte PM, Serrão CR, Miranda TS, et al. Could cytokine levels in the peri-implant crevicular fluid be used to distinguish between healthy implants and implants with peri-implantitis? A systematic review. J Periodontal Res. Dec 2016;51(6):689-698. doi:10.1111/jre.12354
76. Dursun E, Tözüm TF. Peri-Implant Crevicular Fluid Analysis, Enzymes and Biomarkers: a Systemetic Review. J Oral Maxillofac Res. 2016 Jul-Sep 2016;7(3):e9. doi:10.5037/jomr.2016.7309
77. Faot F, Nascimento GG, Bielemann AM, Campão TD, Leite FR, Quirynen M. Can peri-implant crevicular fluid assist in the diagnosis of peri-implantitis? A systematic review and meta-analysis. J Periodontol. May 2015;86(5):631-45. doi:10.1902/jop.2015.140603
78. Klinge B, Gustafsson A, Berglundh T. A systematic review of the effect of anti-infective therapy in the treatment of peri-implantitis. J Clin Periodontol. 2002;29 Suppl 3:213-25; discussion 232-3.
79. Kivelä-Rajamäki M, Maisi P, Srinivas R, et al. Levels and molecular forms of MMP-7 (matrilysin-1) and MMP-8 (collagenase-2) in diseased human peri-implant sulcular fluid. J Periodontal Res. Dec 2003;38(6):583-90.
80. Basegmez C, Yalcin S, Yalcin F, Ersanli S, Mijiritsky E. Evaluation of periimplant crevicular fluid prostaglandin E2 and matrix metalloproteinase-8 levels from health to periimplant disease status: a prospective study. Implant Dent. Aug 2012;21(4):306-10. doi:10.1097/ID.0b013e3182588408
81. Ramseier CA, Eick S, Brönnimann C, Buser D, Brägger U, Salvi GE. Host-derived biomarkers at teeth and implants in partially edentulous patients. A 10-year retrospective study. Clin Oral Implants Res. Feb 2016;27(2):211-7. doi:10.1111/clr.12566

115
82. Al-Majid A, Alassiri S, Rathnayake N, Tervahartiala T, Gieselmann DR, Sorsa T. Matrix Metalloproteinase-8 as an Inflammatory and Prevention Biomarker in Periodontal and Peri-Implant Diseases. Int J Dent. 2018;2018:7891323. doi:10.1155/2018/7891323
83. Boyce BF, Xing L. The RANKL/RANK/OPG pathway. Curr Osteoporos Rep. Sep 2007;5(3):98-104.
84. Duarte PM, de Mendonça AC, Máximo MB, Santos VR, Bastos MF, Nociti Júnior FH. Differential cytokine expressions affect the severity of peri-implant disease. Clin Oral Implants Res. May 2009;20(5):514-20. doi:10.1111/j.1600-0501.2008.01680.x
85. Rakic M, Struillou X, Petkovic-Curcin A, et al. Estimation of bone loss biomarkers as a diagnostic tool for peri-implantitis. J Periodontol. Nov 2014;85(11):1566-74. doi:10.1902/jop.2014.140069
86. Giannobile WV. Crevicular fluid biomarkers of oral bone loss. Curr Opin Periodontol. 1997;4:11-20.
87. Giannobile WV, Lynch SE, Denmark RG, Paquette DW, Fiorellini JP, Williams RC. Crevicular fluid osteocalcin and pyridinoline cross-linked carboxyterminal telopeptide of type I collagen (ICTP) as markers of rapid bone turnover in periodontitis. A pilot study in beagle dogs. J Clin Periodontol. Dec 1995;22(12):903-10.
88. Palys MD, Haffajee AD, Socransky SS, Giannobile WV. Relationship between C-telopeptide pyridinoline cross-links (ICTP) and putative periodontal pathogens in periodontitis. J Clin Periodontol. Nov 1998;25(11 Pt 1):865-71.
89. Talonpoika JT, Hämäläinen MM. Type I collagen carboxyterminal telopeptide in human gingival crevicular fluid in different clinical conditions and after periodontal treatment. J Clin Periodontol. May 1994;21(5):320-6.
90. Oringer RJ, Palys MD, Iranmanesh A, et al. C-telopeptide pyridinoline cross-links (ICTP) and periodontal pathogens associated with endosseous oral implants. Clin Oral Implants Res. Dec 1998;9(6):365-73.
91. Champagne CM, Buchanan W, Reddy MS, Preisser JS, Beck JD, Offenbacher S. Potential for gingival crevice fluid measures as predictors of risk for periodontal diseases. Periodontol 2000. 2003;31:167-80.
92. Zani SR, Moss K, Shibli JA, et al. Peri-implant crevicular fluid biomarkers as discriminants of peri-implant health and disease. J Clin Periodontol. Oct 2016;43(10):825-32. doi:10.1111/jcpe.12586

116
93. Griffiths GS. Formation, collection and significance of gingival crevice fluid. Periodontol 2000. 2003;31:32-42. doi:10.1034/j.1600-0757.2003.03103.x
94. AlQahtani MA, Alayad AS, Alshihri A, Correa FOB, Akram Z. Clinical peri-implant parameters and inflammatory cytokine profile among smokers of cigarette, e-cigarette, and waterpipe. Clin Implant Dent Relat Res. Dec 2018;20(6):1016-1021. doi:10.1111/cid.12664
95. Grant MM. What do 'omic technologies have to offer periodontal clinical practice in the future? J Periodontal Res. Feb 2012;47(1):2-14. doi:10.1111/j.1600-0765.2011.01387.x
96. Markley JL, Brüschweiler R, Edison AS, et al. The future of NMR-based metabolomics. Curr Opin Biotechnol. 02 2017;43:34-40. doi:10.1016/j.copbio.2016.08.001
97. Zhang A, Sun H, Yan G, Wang P, Wang X. Metabolomics for Biomarker Discovery: Moving to the Clinic. Biomed Res Int. 2015;2015:354671. doi:10.1155/2015/354671
98. Johnson CH, Patterson AD, Idle JR, Gonzalez FJ. Xenobiotic metabolomics: major impact on the metabolome. Annu Rev Pharmacol Toxicol. 2012;52:37-56. doi:10.1146/annurev-pharmtox-010611-134748
99. Johnson CH, Ivanisevic J, Siuzdak G. Metabolomics: beyond biomarkers and towards mechanisms. Nat Rev Mol Cell Biol. 07 2016;17(7):451-9. doi:10.1038/nrm.2016.25
100. Wishart DS, Feunang YD, Marcu A, et al. HMDB 4.0: the human metabolome database for 2018. Nucleic Acids Res. Jan 2018;46(D1):D608-D617. doi:10.1093/nar/gkx1089
101. Smolinska A, Blanchet L, Buydens LM, Wijmenga SS. NMR and pattern recognition methods in metabolomics: from data acquisition to biomarker discovery: a review. Anal Chim Acta. Oct 2012;750:82-97. doi:10.1016/j.aca.2012.05.049
102. Griffiths WJ, Wang Y. Mass spectrometry: from proteomics to metabolomics and lipidomics. Chem Soc Rev. Jul 2009;38(7):1882-96. doi:10.1039/b618553n
103. Emwas AH. The strengths and weaknesses of NMR spectroscopy and mass spectrometry with particular focus on metabolomics research. Methods Mol Biol. 2015;1277:161-93. doi:10.1007/978-1-4939-2377-9_13
104. Wishart D. Quantitative metabolomics using NMR. 2008. p. 228-237.

117
105. Beckonert O, Keun HC, Ebbels TM, et al. Metabolic profiling, metabolomic and metabonomic procedures for NMR spectroscopy of urine, plasma, serum and tissue extracts. Nat Protoc. 2007;2(11):2692-703. doi:10.1038/nprot.2007.376
106. Eckel-Passow JE, Oberg AL, Therneau TM, Bergen HR. An insight into high-resolution mass-spectrometry data. Biostatistics. Jul 2009;10(3):481-500. doi:10.1093/biostatistics/kxp006
107. Nagana Gowda GA, Raftery D. Can NMR solve some significant challenges in metabolomics? J Magn Reson. Nov 2015;260:144-60. doi:10.1016/j.jmr.2015.07.014
108. Marshall DD, Powers R. Beyond the paradigm: Combining mass spectrometry and nuclear magnetic resonance for metabolomics. Prog Nucl Magn Reson Spectrosc. 05 2017;100:1-16. doi:10.1016/j.pnmrs.2017.01.001
109. Copeland JC, Zehr LJ, Cerny RL, Powers R. The applicability of molecular descriptors for designing an electrospray ionization mass spectrometry compatible library for drug discovery. Comb Chem High Throughput Screen. Dec 2012;15(10):806-15. doi:10.2174/138620712803901180
110. Barnes VM, Kennedy AD, Panagakos F, et al. Global metabolomic analysis of human saliva and plasma from healthy and diabetic subjects, with and without periodontal disease. PLoS One. 2014;9(8):e105181. doi:10.1371/journal.pone.0105181
111. Barnes VM, Ciancio SG, Shibly O, et al. Metabolomics reveals elevated macromolecular degradation in periodontal disease. J Dent Res. Nov 2011;90(11):1293-7. doi:10.1177/0022034511416240
112. Barnes VM, Teles R, Trivedi HM, et al. Acceleration of purine degradation by periodontal diseases. J Dent Res. Sep 2009;88(9):851-5. doi:10.1177/0022034509341967
113. Barnes VM, Teles R, Trivedi HM, et al. Assessment of the effects of dentifrice on periodontal disease biomarkers in gingival crevicular fluid. J Periodontol. Sep 2010;81(9):1273-9. doi:10.1902/jop.2010.100070
114. Kuboniwa M, Sakanaka A, Hashino E, Bamba T, Fukusaki E, Amano A. Prediction of Periodontal Inflammation via Metabolic Profiling of Saliva. J Dent Res. Nov 2016;95(12):1381-1386. doi:10.1177/0022034516661142
115. Romano F, Meoni G, Manavella V, et al. Analysis of salivary phenotypes of generalized aggressive and chronic periodontitis through nuclear magnetic resonance-based metabolomics. J Periodontol. Jun 2018;doi:10.1002/JPER.18-0097
118
116. Rzeznik M, Triba MN, Levy P, et al. Identification of a discriminative metabolomic fingerprint of potential clinical relevance in saliva of patients with periodontitis using 1H nuclear magnetic resonance (NMR) spectroscopy. PLoS One. 2017;12(8):e0182767. doi:10.1371/journal.pone.0182767
117. Ozeki M, Nozaki T, Aoki J, et al. Metabolomic Analysis of Gingival Crevicular Fluid Using Gas Chromatography/Mass Spectrometry. Mass Spectrom (Tokyo). 2016;5(1):A0047. doi:10.5702/massspectrometry.A0047
118. Gogtay NJ. Principles of sample size calculation. Indian J Ophthalmol. 2010 Nov-Dec 2010;58(6):517-8. doi:10.4103/0301-4738.71692
119. Renvert S, Badersten A, Nilvéus R, Egelberg J. Healing after treatment of periodontal intraosseous defects. I. Comparative study of clinical methods. J Clin Periodontol. Oct 1981;8(5):387-99. doi:10.1111/j.1600-051x.1981.tb00888.x
120. Lang NP, Hill RW. Radiographs in periodontics. J Clin Periodontol. Feb 1977;4(1):16-28. doi:10.1111/j.1600-051x.1977.tb01879.x
121. Akesson L, Håkansson J, Rohlin M. Comparison of panoramic and intraoral radiography and pocket probing for the measurement of the marginal bone level. J Clin Periodontol. May 1992;19(5):326-32. doi:10.1111/j.1600-051x.1992.tb00654.x
122. Cekici A, Kantarci A, Hasturk H, Van Dyke TE. Inflammatory and immune pathways in the pathogenesis of periodontal disease. Periodontol 2000. Feb 2014;64(1):57-80. doi:10.1111/prd.12002
123. Sakanaka A, Kuboniwa M, Hashino E, Bamba T, Fukusaki E, Amano A. Distinct signatures of dental plaque metabolic byproducts dictated by periodontal inflammatory status. Sci Rep. 02 2017;7:42818. doi:10.1038/srep42818
124. Huang Y, Zhu M, Li Z, et al. Mass spectrometry-based metabolomic profiling identifies alterations in salivary redox status and fatty acid metabolism in response to inflammation and oxidative stress in periodontal disease. Free Radic Biol Med. May 2014;70:223-32. doi:10.1016/j.freeradbiomed.2014.02.024
125. Tóthová L, Kamodyová N, Červenka T, Celec P. Salivary markers of oxidative stress in oral diseases. Front Cell Infect Microbiol. 2015;5:73. doi:10.3389/fcimb.2015.00073
126. Sugimoto M, Wong DT, Hirayama A, Soga T, Tomita M. Capillary electrophoresis mass spectrometry-based saliva metabolomics identified oral, breast and pancreatic cancer-specific profiles. Metabolomics. Mar 2010;6(1):78-95. doi:10.1007/s11306-009-0178-y

119
127. Pradeep AR, Kumar MS, Ramachandraprasad MV, Shikha C. Gingival crevicular fluid levels of neopterin in healthy subjects and in patients with different periodontal diseases. J Periodontol. Oct 2007;78(10):1962-7. doi:10.1902/jop.2007.070096
128. Liu K, Meng H, Lu R, et al. Initial periodontal therapy reduced systemic and local 25-hydroxy vitamin D(3) and interleukin-1beta in patients with aggressive periodontitis. J Periodontol. Feb 2010;81(2):260-6. doi:10.1902/jop.2009.090355
129. Sommakia S, Baker OJ. Regulation of inflammation by lipid mediators in oral diseases. Oral Dis. Jul 2017;23(5):576-597. doi:10.1111/odi.12544
130. Romano F, Meoni G, Manavella V, et al. Effect of non-surgical periodontal therapy on salivary metabolic fingerprint of generalized chronic periodontitis using nuclear magnetic resonance spectroscopy. Arch Oral Biol. Jan 2019;97:208-214. doi:10.1016/j.archoralbio.2018.10.023
131. Lewis IA, Schommer SC, Markley JL. rNMR: open source software for identifying and quantifying metabolites in NMR spectra. Magn Reson Chem. Dec 2009;47 Suppl 1:S123-6. doi:10.1002/mrc.2526
132. Bhinderwala F, Wase N, DiRusso C, Powers R. Combining Mass Spectrometry and NMR Improves Metabolite Detection and Annotation. J Proteome Res. 11 2018;17(11):4017-4022. doi:10.1021/acs.jproteome.8b00567
133. Johnson CH, Ivanisevic J, Benton HP, Siuzdak G. Bioinformatics: the next frontier of metabolomics. Anal Chem. Jan 2015;87(1):147-56. doi:10.1021/ac5040693