investigation of factors affecting loss of control of ga
TRANSCRIPT

www.brunel.ac.uk/about/acad/sed/sedres/cem/bfs
School of Engineering and Design
InvestigationInvestigationof of
Factors AffectingFactors AffectingLoss of ControlLoss of Controlof GA Aircraftof GA Aircraft
Mike BromfieldMike Bromfield& Guy Gratton (M)& Guy Gratton (M)

www.brunel.ac.uk/about/acad/sed/sedres/cem/bfs
School of Engineering and Design
Contents
• Background• Programme Objectives• Key Design Factors• Flight Test Programme• Initial Findings• Lessons Learned• Next Steps

www.brunel.ac.uk/about/acad/sed/sedres/cem/bfs
School of Engineering and Design
Fixed Wing <5,700kg (non-microlight) fatal accident causal factors: 1980 to 2006 (UK)
25%
8%
16%12%
12%
6%
5%4%
4%3% 5%Loss of Control VFRLoss of Control IMCLow Flying/AerosCFITForced LandingMid-air CollisionCollision with Grnd ObjAirframe FailureLow ApproachMedical/SuicideUndetermined
Source: GASCo
??

www.brunel.ac.uk/about/acad/sed/sedres/cem/bfs
School of Engineering and Design
• UK, US, Canada & Australia, 300+ GA fatal accidents annually– Likely 100-200 LoC related
• Usually LoC at low level– Take-off, landing, go-around, forced
landings– “Low, slow and dirty”
GA fatal accident causal factorscont’d…

www.brunel.ac.uk/about/acad/sed/sedres/cem/bfs
School of Engineering and Design
Programme Objectives
•Why does LoC happen?
•Why certain types and not others?
•How can we improve operational safety?
•“LoC-proof” future GA designs.

www.brunel.ac.uk/about/acad/sed/sedres/cem/bfs
School of Engineering and Design
1984-2006: selected statisticsUK Fatalities per 100,000hrs
0.70 0.68
0.050.00
0.10
0.20
0.30
0.40
0.50
0.60
0.70
ALL SEP Cessna 150 Cessna 152
Source:
Ferris R., Data Request 281107, UK CAA Nov. 2007. based on 3,395,056 flying hours
www.brunel.ac.uk/about/acad/sed/sedres/cem/bfs
School of Engineering and Design
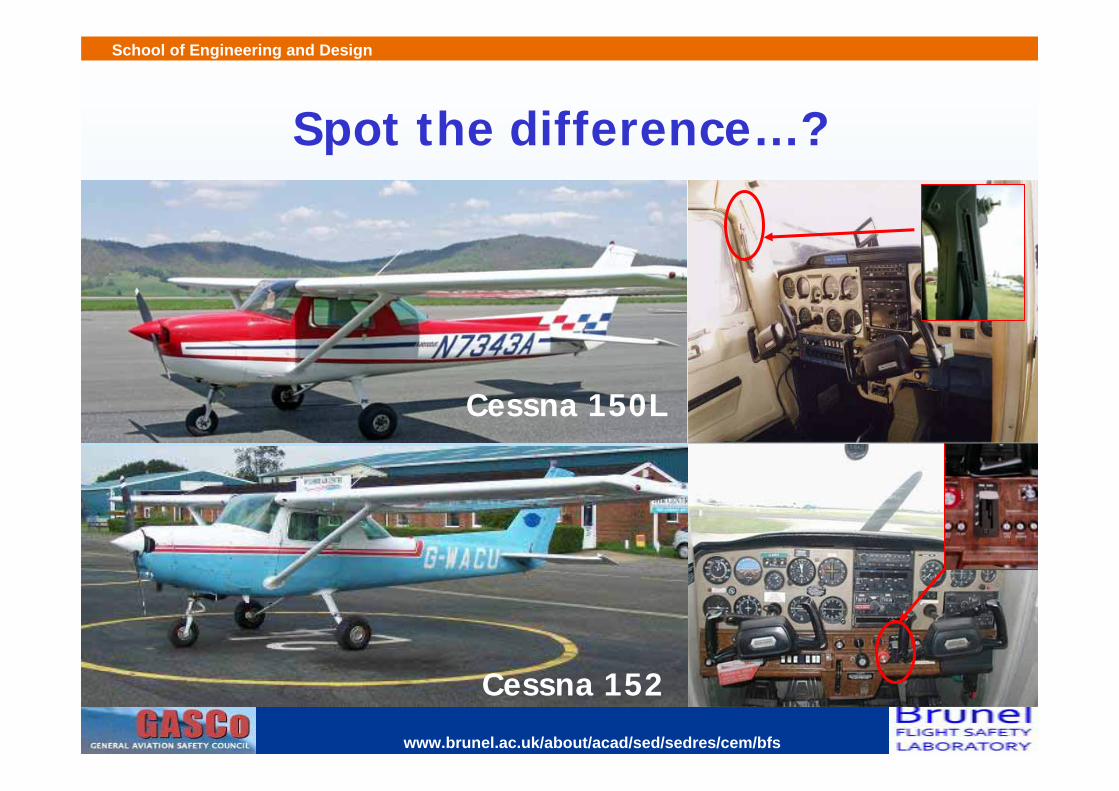
Spot the difference…?
Cessna 150L
Cessna 152

www.brunel.ac.uk/about/acad/sed/sedres/cem/bfs
School of Engineering and Design
What’s the difference?Cessna 150L (‘74)Cessna 150 M (‘75)
Cessna 152 (‘80)
Powerplant 100 hp Continental 110 hp LycomingWeight (lbs) 1600 1670
CG Range (in) 31.5~37.5( 19.9~30.1 %MAC)
31~36.5(19.1~28.4 %MAC)
Flap Range (deg) 0~40, no detents 0~30, detents @ 0/10/20/30
Flap Activation/Monitoring 2-way switch,LH Door post Indicator
Gated 4 position switch, adj. indicator
CR Speeds@60% Pwr/2000’/Std T(KTAS)
89 91
VS0 (KCAS) Pwr Off/Aft CG/MTOW: L(30)
L(40)4241
41N/A
Source: FAA Type Certificate Data Sheet 3A19, FAA, Revision 43, July 25, 2002Thompson, William D., “The C150/C-152 Story” , Cessna Wings for the World 2nd Ed., 1992
www.brunel.ac.uk/about/acad/sed/sedres/cem/bfs
School of Engineering and Design
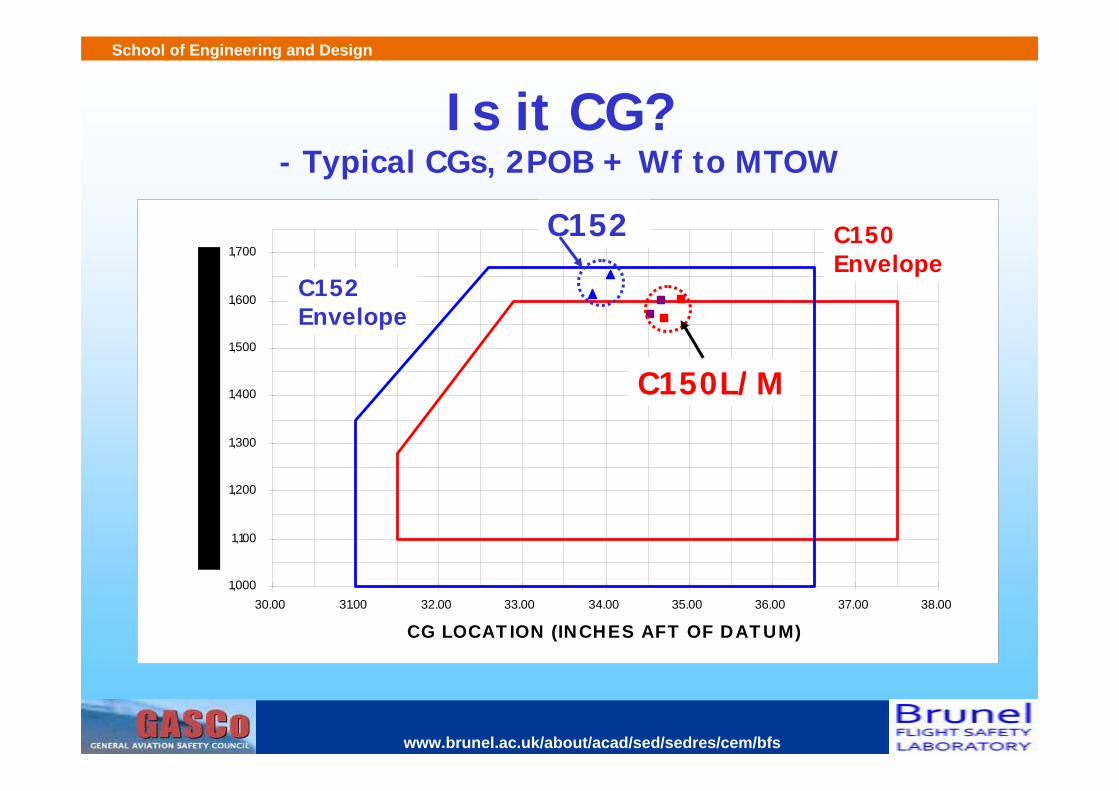
Is it CG?- Typical CGs, 2POB + Wf to MTOW
1,000
1,100
1,200
1,300
1,400
1,500
1,600
1,700
30.00 31.00 32.00 33.00 34.00 35.00 36.00 37.00 38.00
CG LOCAT ION (INCHES AFT OF DAT UM)
C152Envelope
C150 Envelope
C152
C150L/M

www.brunel.ac.uk/about/acad/sed/sedres/cem/bfs
School of Engineering and Design
Flight Test ProgrammePhase 1
A/c 2 A/c 3Baseline CG1 CG2 CG3 CG1 CG1
Mid Mid-Fwd Mid-Aft Mid Mid1 4 6 - -
53% 62%
2 - -52%
3 5 7 - -
57%F150M
A/c 1Phase 2*
F150L
C152

www.brunel.ac.uk/about/acad/sed/sedres/cem/bfs
School of Engineering and Design
Methods & Equipment
• TPS basics– Handheld force/displacement/timing– Portable CVR
• Headset mounted video for debrief
• Appareo FDR+Garmin 296 GPS supplement / positional
awareness

www.brunel.ac.uk/about/acad/sed/sedres/cem/bfs
School of Engineering and Design
Methods & EquipmentAppareo GAU 1000A FDR•16 Channels@ 4Hz•WAAS enabled GPS•3 x Gyroscopes•3 x Accelerometers•Barometric pressure sensor•Solid state compass•AS Flight Analysis software•US$ 2000
J31 Calibration Test Flt

www.brunel.ac.uk/about/acad/sed/sedres/cem/bfs
School of Engineering and Design
Methods & EquipmentFlight Analysis software•2d/3d playback•Google earth integration•Instrument panel•Own or external GPS•Data export
Normal Take-off
260
280
300
320
340
360
380
400
14:4
3:53
.250
14:4
3:55
.750
14:4
3:58
.250
14:4
4:00
.750
14:4
4:03
.250
14:4
4:05
.750
14:4
4:08
.250
14:4
4:10
.750
14:4
4:13
.250
14:4
4:15
.750
14:4
4:18
.250
14:4
4:20
.750
14:4
4:23
.250
14:4
4:25
.750
14:4
4:28
.250
14:4
4:30
.750
14:4
4:33
.250
14:4
4:35
.750
14:4
4:38
.250
14:4
4:40
.750
14:4
4:43
.250
Time (s) >>>
Geo
pote
ntai
l Hei
ght (
ft) >
-40
-30
-20
-10
0
10
20
30
40
50
60
70
Geopotential Alt. (Feet)
Gnd Speed (Knots)
Pitch Angle (Degrees)
Derived AOA (Degrees)Rotate
Unstick50 ft
Start Take-off Roll
A/C= Cessna 152 G-BOFLDate: 12/02/09Gross Wt.= 1650 lbsCG = 34" AoD
Flight Evaluator Software
FDR Parameters•Time•Lat/Long•True Gnd Speed•Pitch/Roll/Yaw Attitude•Pitch/Roll/Yaw Rate•Geo-potential Altitude•Normal, Lat., Long. Accelerations & Velocities

www.brunel.ac.uk/about/acad/sed/sedres/cem/bfs
School of Engineering and Design
BFSL safety model – the questions
Tracking point (optimal condition) Aircraft characteristics
Condition error Condition cues Actual condition Planned margin Safety margin Safety cues Boundary (Unsafe Condition)
Pilot capacity to respond
Pilot response
HQ assessment: Point tracking versus boundary avoidance
www.brunel.ac.uk/about/acad/sed/sedres/cem/bfs
School of Engineering and Design
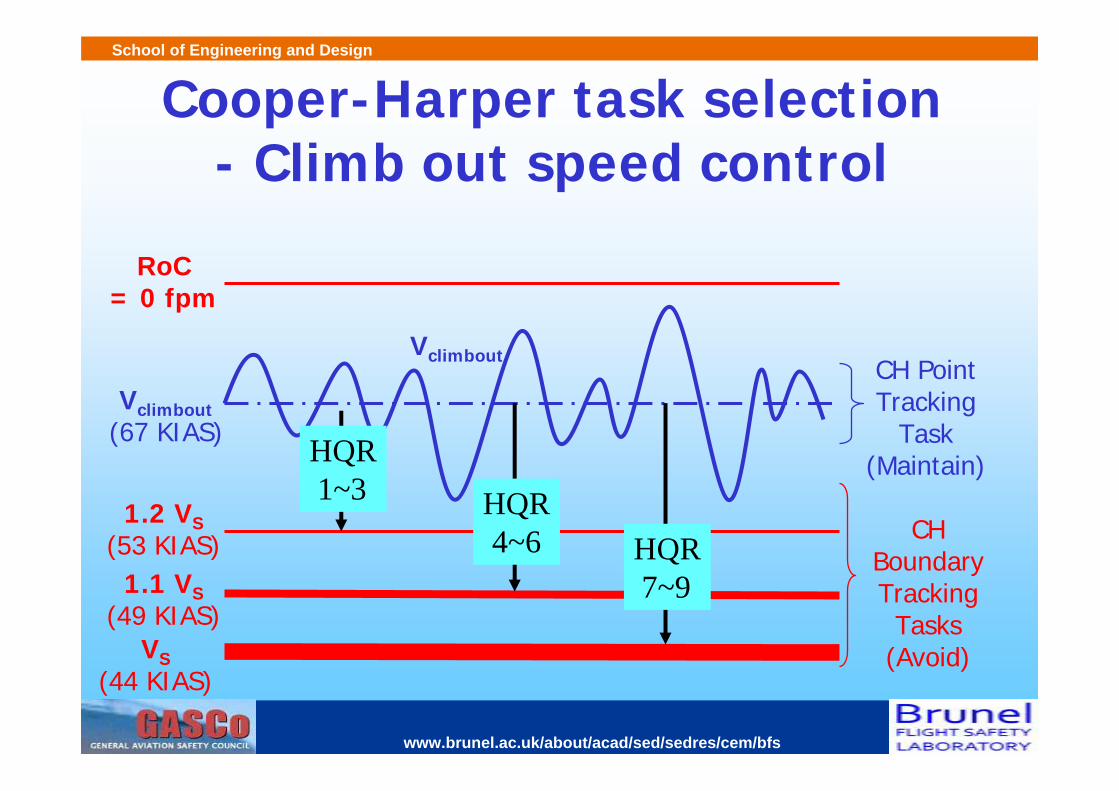
Cooper-Harper task selection- Climb out speed control
Vclimbout(67 KIAS)
1.2 VS(53 KIAS)
1.1 VS(49 KIAS)
RoC= 0 fpm
CH Point Tracking
Task(Maintain)
CH Boundary Tracking
Tasks(Avoid)
Vclimbout
VS(44 KIAS)
HQR1~3 HQR
4~6 HQR7~9

www.brunel.ac.uk/about/acad/sed/sedres/cem/bfs
School of Engineering and Design
Apparent LSS
-5.0
-4.0
-3.0
-2.0
-1.0
0.0
1.0
2.0
3.0
4.0
5.0
35 45 55 65 75 85 95 105 115 125
Speed KCAS >>>
Stic
k Fo
rce
Pull
(daN
) >Comparison of Apparent LSS (CR), 150M vs 152
C152F150MF150L

www.brunel.ac.uk/about/acad/sed/sedres/cem/bfs
School of Engineering and Design
Apparent LSS
-5.0
-4.0
-3.0
-2.0
-1.0
0.0
1.0
2.0
3.0
4.0
5.0
35 45 55 65 75 85 95 105 115 125
Speed KCAS >>>
Stic
k Fo
rce
Pull
(daN
) >Comparison of Apparent LSS (L30), 150M vs 152
C152F150MF150L

www.brunel.ac.uk/about/acad/sed/sedres/cem/bfs
School of Engineering and Design
Apparent LSS
-5.0
-4.0
-3.0
-2.0
-1.0
0.0
1.0
2.0
3.0
4.0
5.0
35 45 55 65 75 85 95 105 115 125
Speed KCAS >>>
Stic
k Fo
rce
Pull
(daN
) >Comparison of Apparent LSS
(CR), 150M vs 152/CG mid-aft
C152
F150MF150L
C152(mid-aft CG)

www.brunel.ac.uk/about/acad/sed/sedres/cem/bfs
School of Engineering and Design
Initial findings• Apparent LSS
– Low speed LSS much steeper in C152 than C150 models– C150 / LAND / PLF MCP, near-neutral– Indications of CG dependency– Possible cliff-edge change?
• Flaps– Large out of trim forces on retraction– C150 Flap indicator widens scan– Readability issues
• Stall– Power on / flapped stall: C150 only attitude warnings, spin
risk
• Visible pitch attitude changes constantly close to GND

www.brunel.ac.uk/about/acad/sed/sedres/cem/bfs
School of Engineering and Design
Mike’s lessons – academic FT
• Equipment portability• Limited budget – time is money• Use a ‘calibrated’ TP• Data reduction takes considerable time
– plan for this time between sorties– design test cards for data reduction
• Don’t rely on the technology• Reporting – brevity vs academic rigour• Be prepared for the unexpected!
www.brunel.ac.uk/about/acad/sed/sedres/cem/bfs
School of Engineering and Design
Guy’s lessons – test conduct
• “Safe” GA aircraft can still bite, and without inanition– Brief for all emergencies
• Flying club environment– Sub-optimal aircraft– At-least 1 in 3 W&CG schedules contain errors
• Consider re-weighing– Weather press-on-itis
• Check everything• Know and stick to no-go criteria
– Keep talking

www.brunel.ac.uk/about/acad/sed/sedres/cem/bfs
School of Engineering and Design
Next Steps…More aircraft
– Are we looking at the fleet?– Critical cases
Simulator work– Cycle pilots through critical cond.– Pilot workload measurement– Find the HQR 3-4, 6-7, 9-10
boundaries – Be willing to crash!
S. Camber

www.brunel.ac.uk/about/acad/sed/sedres/cem/bfs
School of Engineering and Design
FDR + CVR: F150L PLF Stall

www.brunel.ac.uk/about/acad/sed/sedres/cem/bfs
School of Engineering and Design
More Information:
[email protected]@brunel.ac.uk
Questions?

www.brunel.ac.uk/about/acad/sed/sedres/cem/bfs
School of Engineering and Design
Acknowledgements
• Dr Mark Young• Thomas Gerald Gray Charitable Trust• General Aviation Safety Council (GASCo)• CAA(UK) & FAA(US)• USAF Academy / Bill Gray