investigation of geometric shapes and mechanical ...yly1/pdfs2/paper6.pdf · laser forming process...
TRANSCRIPT

High Temp. Material Processes 4 (2000) 253-290 253
Dimensional characteristics and mechanical properties of
laser-formed parts
Wenchuan Li, Jiangcheng Bao, and Y. Lawrence Yao*
Department of Mechanical Engineering Columbia University New York, NY 10027
* Corresponding author.
Abstract
Recent developments in the study of the laser bending process are reviewed and
presented to obtain new perspectives along the lines of dimensional characteristics and
mechanical properties of the formed parts. Both numerical and experimental results are
described and compared. The dimensional characteristics examined include bending
angle variation and bending edge curving. The mechanical properties examined include
residual stress, hardness and microstructural change.
1. Introduction
Laser forming process has its roots in the traditional flame bending, where the sheet
metal is heated and deformed by an oxy-acetylene torch. Laser forming is a process in
which metal workpiece is heated along a certain path with a defocused laser beam, and
with or without cooling of a jet stream of gas or water emulsion, so that laser-induced
thermal expansion and contraction result in deformation of the metal, without a hard
forming tool or external forces. It is therefore a flexible forming technique suitable for
low-volume production and/or rapid prototyping of sheet metal, as well as for adjusting
HIGH TEMP. MATERIAL PROCESSES 254
and aligning sheet metal components (Magee, et al., 1998). It has potential applications
in aerospace, shipbuilding, microelectronics and automotive industries.
Understanding various aspects of the laser forming is a challenging problem of
considerable theoretical and practical interest. Experimental and theoretical
investigations have been reported to understand the mechanisms involved in the laser
forming. The proposed mechanisms are temperature gradient mechanism (TGM)
(Vollertsen, 1994a), buckling mechanism (BM) (Arnet and Vollertsen, 1995), and
upsetting mechanism depending on operation conditions, material properties and
workpiece thickness. A number of analytical models were derived to predict the bending
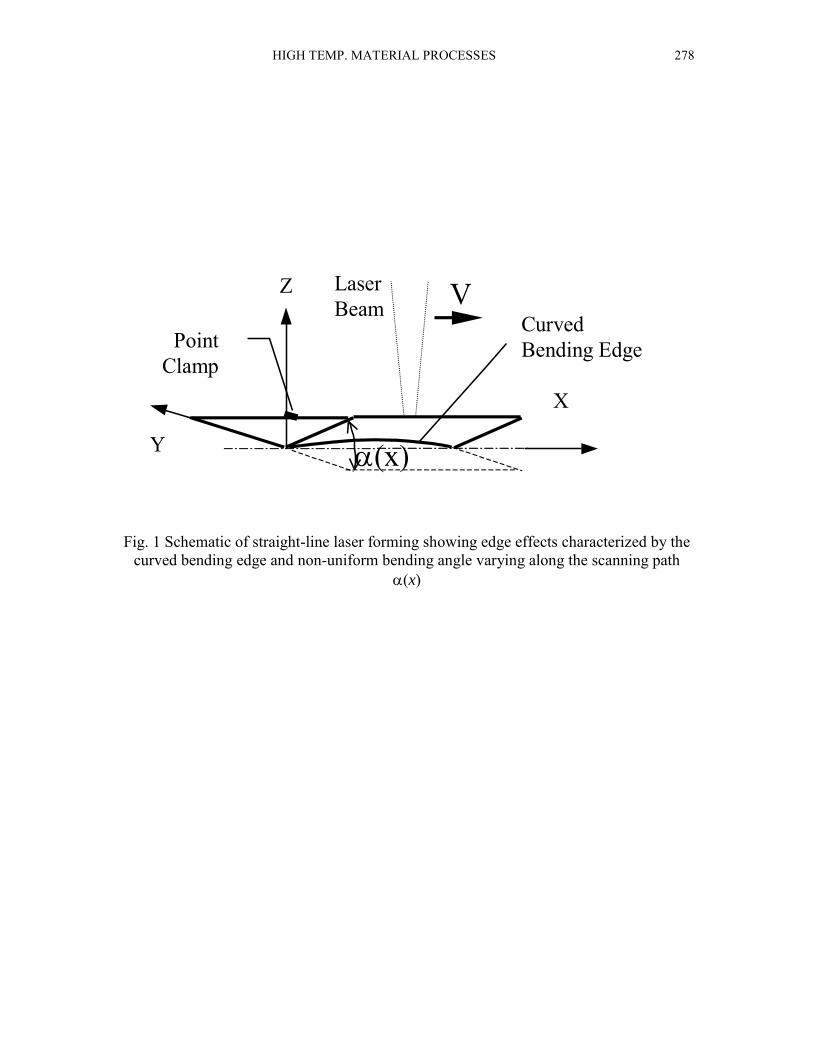
angle (Fig.1) in the straight-line laser bending (Vollertsen, 1994). Some of the models
are in reasonable agreement with experimental results. Numerical investigations were
conducted using the finite element method. Alberti, et al. (1994) carried out a numerical
simulation of the laser bending process by a coupled thermal mechanical analysis.
Temperature dependency of flow stress was taken into consideration. Hsiao, et al. (1997)
simulated the bending process by taking into account convection and radiation at
boundaries, and using extrapolation for mechanical properties at higher temperature.
Holzer, et al. (1994) modeled the bending process under the BM. As temperature often
rises fairly high in laser forming, taking into account temperature dependency of material
properties becomes important to the simulation accuracy. Large deformation is desired in
laser forming, and consequently, it is necessary to consider strain hardening, especially in
the case of multiple scan (Sprenger, et al., 1994).

HIGH TEMP. MATERIAL PROCESSES 255
Despite of the progress made to date, there still exist problems that need to be addressed
before laser forming becomes a practical processing technology. Among them are the
thorough understandings of the major effects that influence the dimensional
characteristics and mechanical properties of laser formed components. For instance, edge
effect that is characterized by variation of the bending angle along the bending edge and
curving of bending edge, as illustrated in Fig. 1, affects geometric accuracy directly.
Magee, et al., (1997a) showed that the extent of edge effects depends on the thermal
diffusion from the laser beam into the entire plate, and the geometrical constraint of the
workpiece as it varies with distance from the end point of the scanning path. The actual
profile of bending angle is dependent on the laser processing parameters employed, as
well as the material properties. Materials with very different thermal conductivity and
expansion exhibited different variation patterns of the bending angle. Attempts have
been made to reduce the edge effects by empirically varying the traveling velocity along
the scanning path. Results showed that the varying velocity profile could lead to a
sizable reduction of the edge effects. Theoretical analysis by Mucha, et al. (1997)
showed that thickness in the bending edge region increases due to thermal contraction
under the TGM, and the bending edge of the plate is visibly curved due to thermal
contraction in the scanning direction. Again, this analytical model does not describe the
transient stage, while understanding of the transient stage is useful in analyzing the
causes of the edge effects and realizing process control. Numerical and experimental
attempts have been made by Bao and Yao (1999) to study the edge effects in more detail.
The energy input and coupling in the laser forming play an important role. They directly
affect the deformation process, the resultant geometric shapes, and properties of formed
HIGH TEMP. MATERIAL PROCESSES 256
parts. An approach to describe the input energy is to use the term of “line energy”. The
line energy, LE, of laser scanning is defined as LE=P/v, where P is the laser power and v
is the scanning velocity. It is obvious that the line energy represents the energy input per
unit length along the scanning path. For processes with the same LE but different
power/velocity combinations, however, results could vary. Some results by Magee, et al.
(1997b) showed the dependence of bend angle on velocity for the - Ti alloy scanned
under the condition of constant line energy. The bend angle first increases with velocity
and then levels off. Li and Yao (1999b) studied the issue of LE numerically and
experimentally, including its effects on dimension, hardness and microstructure.
As known, the strain rate influences the material flow stress, especially at elevated
temperatures. The influence on the flow stress translates to that on the forming process
and properties of the formed parts, including dimension, residual stresses and hardness of
the formed parts. Strain rate effects in laser forming are studied under the condition of
"constant peak temperature," that is, the combinations of laser power and scanning
velocity are so determined that the peak temperature reached at the top surface of the
laser scanned workpiece remains constant (Li and Yao, 1999a). In this way, the constant
net energy input available for the forming purpose can be maintained under different
scanning velocity (strain rate).
This paper summarizes recent research in laser forming at Columbia University.
Materials are presented along the lines of dimensional characteristics and mechanical
properties of formed parts to obtain new perspectives. Numerical modeling is first
HIGH TEMP. MATERIAL PROCESSES 257
summarized. Extensive experiments including that under conditions of constant line
energy and constant peak temperature are explained. Simulation results are compared
with their experimental counterparts, accompanied by detailed discussions.
2. Numerical Simulation
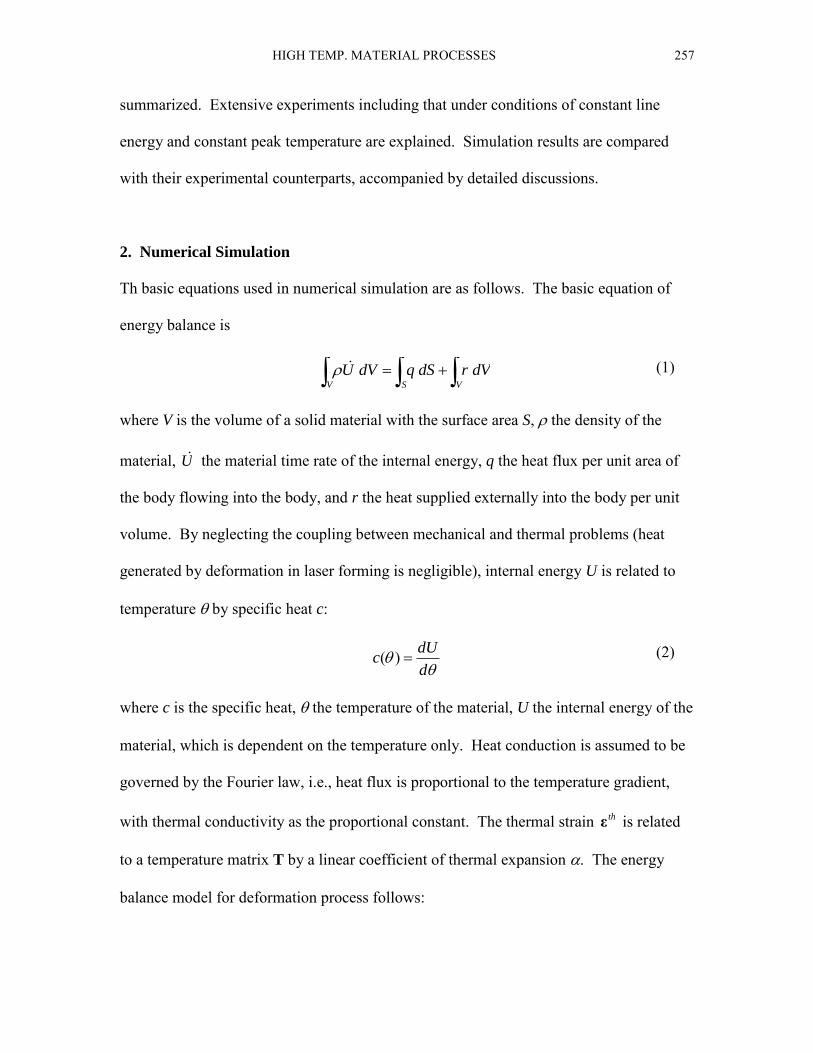
Th basic equations used in numerical simulation are as follows. The basic equation of
energy balance is
VSV
dVrdSqdVU
where V is the volume of a solid material with the surface area S, the density of the
material, U the material time rate of the internal energy, q the heat flux per unit area of
the body flowing into the body, and r the heat supplied externally into the body per unit
volume. By neglecting the coupling between mechanical and thermal problems (heat
generated by deformation in laser forming is negligible), internal energy U is related to
temperature by specific heat c:
d
dUc )(
where c is the specific heat, the temperature of the material, U the internal energy of the
material, which is dependent on the temperature only. Heat conduction is assumed to be
governed by the Fourier law, i.e., heat flux is proportional to the temperature gradient,
with thermal conductivity as the proportional constant. The thermal strain thε is related
to a temperature matrix T by a linear coefficient of thermal expansion . The energy
balance model for deformation process follows:
(1)
(2)
HIGH TEMP. MATERIAL PROCESSES 258
VSV
dVdSdVUdt
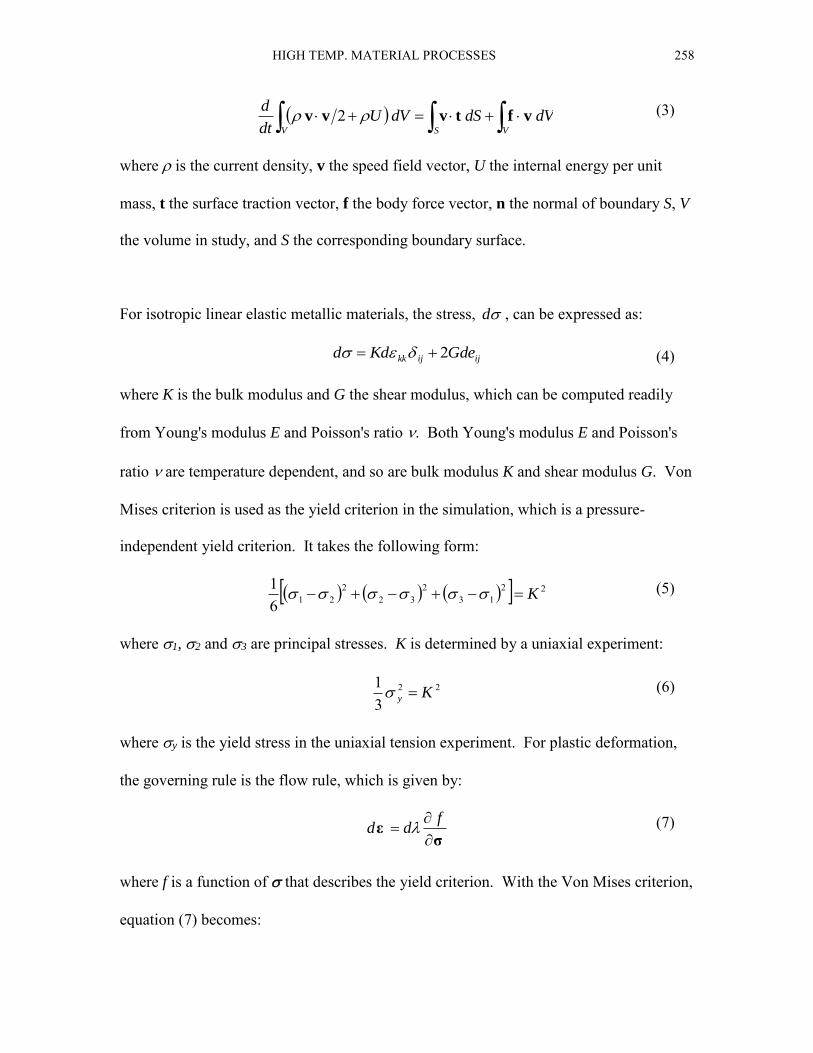
dvftvvv 2
where is the current density, v the speed field vector, U the internal energy per unit
mass, t the surface traction vector, f the body force vector, n the normal of boundary S, V
the volume in study, and S the corresponding boundary surface.
For isotropic linear elastic metallic materials, the stress, d , can be expressed as:
ijijkk GdeKdd 2
where K is the bulk modulus and G the shear modulus, which can be computed readily
from Young's modulus E and Poisson's ratio . Both Young's modulus E and Poisson's
ratio are temperature dependent, and so are bulk modulus K and shear modulus G. Von
Mises criterion is used as the yield criterion in the simulation, which is a pressure-
independent yield criterion. It takes the following form:
2213
232
2216
1K
where 1, 2 and 3 are principal stresses. K is determined by a uniaxial experiment:
22
31
Ky
where y is the yield stress in the uniaxial tension experiment. For plastic deformation,
the governing rule is the flow rule, which is given by:
σε
fdd
where f is a function of that describes the yield criterion. With the Von Mises criterion,
equation (7) becomes:
(5)
(6)
(7)
(4)
(3)

HIGH TEMP. MATERIAL PROCESSES 259
kkii
d
dd
21
23
where is equivalent strain, is equivalent stress. Strain hardening describes the
increasing of yield stress with the accumulation of plastic deformation. In laser forming
process, though every point of the workpiece experiences a thermal cycle, the mechanical
loading, however, as far as the plastic deformation is concerned, is essentially monotonic.
Thus, the isotropic hardening rule is adopted. With work hardening, the flow stress is
related to strain by:
nK
where n is the strain-hardening exponent, and can be found in literature, and K a constant.
Strain-rate dependency of material properties is also taken into consideration by
assuming that the flow stress is related with strain rate by the following equation:
mD
where m is the strain rate exponent determined empirically (Li and Yao, 1999a), and D a
constant. For convenience, a ratio of real yield stress to static yield stress, ε,R , as a
function of temperature and strain rate , is defined as:
0,
εR
where is yield stress after considering strain rate, and 0 the static yield stress.
By standard Galerkin approach, equation (1) can be discretized in space:
qS
N
V
N
V
N
V
N dSqNdVrNdVN
dVUNx
kx
(8)
(9)
(10)
(11)
(12)
HIGH TEMP. MATERIAL PROCESSES 260
where N is the nodal number. This set of equations is the "continuous time description"
of the geometric approximation. With the backward difference algorithm
t
UUU ttt
tt
,
equation (12) can be discretized in time domain:
01
qS
N
V
N
V
N
Vttt
N dSqNdVrNdVN
dVUUNt x
kx
This nonlinear system is then solved by a Modified Newton method.
The following assumptions are made for the numerical modeling. The power density
distribution of the laser beam follows a Gaussian function. The laser operates in CW
mode. No cooling gas or water jet is employed. Temperature dependency of material
properties is considered, including thermal conductivity, specific heat, Young's modulus,
Poisson ratio, and flow stress. Elastic strains are assumed much smaller than unity. The
rate of deformation is the total strain rate, i.e., the sum of the elastic strain rate and plastic
strain rate. Strain hardening of the material is considered through the strain-hardening
exponent, which is also temperature dependent. Dependency of flow stress on strain rate
is modeled by defining a stress ratio ε, R . Dissipation of energy due to plastic
deformation is negligible compared with the intensive laser energy involved. It is
assumed that no melting takes place in the forming process.
The boundary conditions are as follows. Laser beam is given as prescribed nonuniform
surface heat flux: q = q(x, y, t) on the top surface. On five of the six surfaces (except for
the symmetric plane), free convection with air is considered: q = h ( - 0), where h is the
(13)
(14)

HIGH TEMP. MATERIAL PROCESSES 261
heat transfer coefficient, and 0 = 0 (x, t) the surrounding temperature. Radiation is also
considered on these five surfaces: q = A (( - Z)4 - (0 - Z)4), where A is the radiation
constant, and Z the absolute zero on the temperature scale used. The symmetric plane is
assumed adiabatic. Two adjacent points in the middle and bottom of the symmetric plane
are fixed in order to remove the rigid body motion. All other points within the symmetric
plane are assumed to move only within the symmetric plane throughout the deformation
process.
The finite element numerical analysis was carried out using a commercial code
ABAQUS. For thermal and structural analysis, the same mesh model is used. In order to
simulate the shear process in the laser forming, a three-dimension element with twenty
nodes was used because this type of element has no shear locking and hourglass stiffness
and is also compatible with thermal stress analysis. A user-defined FORTRAN program
was used to model the heat source input from the Gaussian laser beam.
3. Experiment
Laser forming experiments were carried out with a PRC1500 CO2 laser system with the
maximum power of 1.5 kW. The distribution of the power density is Gaussian (TEM00).
The diameter of the laser beam is defined as the diameter at which the power density
becomes 1/e2 of the maximum power value. The samples were made of low carbon steel
AISI 1010. The samples were first cleaned using propanol and then coated with graphite
coating to obtain relatively known and increased coupling of laser power. The geometry
of the samples was measured before and after laser forming using a coordinate measuring
HIGH TEMP. MATERIAL PROCESSES 262
machine. The residual stress was measured using X-ray diffractometry. Samples
obtained from the formed sheet for microstructure observation were mounted, polished,
and etched using a etchant of 3% HNO3 for 20 seconds. The samples were observed
under a scanning electron microscope.
The experimental parameters to investigate the effects of process parameters on average
bend angle are listed in Table 1. Table 2 shows conditions of the experiment for edge
effect study. Under conditions 1 to 3, the bucking mechanism (BM) is likely to dominate
because of the larger beam diameter to sheet thickness ratio. Under condition 5, the
temperature gradient mechanism (TGM) is more likely to dominate because of the
smaller beam-diameter to thickness ratio.
As discussed early, in order to study the strain rate effects in an isolated manner, it is
desirable to create conditions under which strain rate may vary but net energy input
available for the forming purpose remains constant. To approximate the scenario, a
constant peak temperature method was devised. In determining the process parameters
for the condition of constant peak temperature, the scanning velocities are specified first
and the laser powers were iteratively determined using the numerical simulation to give
approximately the same peak temperature at the top surface of the workpiece. Listed in
Table 3 are values determined for a targeted peak temperature of 1,030oC.

HIGH TEMP. MATERIAL PROCESSES 263
Table 1 The experimental parameters for the investigation of
average bend angle
d
L.E. 2mm 3mm 4mm
5 J/mm V=10-290 mm/s
P=50-1450 W
V=10-270 mm/s
P=50-1350 W
V=10-280 mm/s
P=50-1400 W
7.5J/mm V=53.3-180 mm/s
P=400-1350 W
10 J/mm V=40-138 mm/s
P=400-1380 W
15 J/mm V=13.3-90 mm/s
P=200-1350 W
20 J/mm V=2.5-67.5 mm/s
P=50-1350 W
(L.E. = Line Energy, P = Power, V = Velocity, d = Beam Diameter
Sample dimension: 80400.89mm)
Table 2 Experimental conditions for edge effect investigations
No. L.E. (J/mm) P (W) V (mm/s) Size (mm3) d (mm)
Condition 1 20 200 – 1300 10 – 67.5 80 x 80 x 0.60 8
Condition 2 20 200 – 1300 10 – 67.5 80 x 80 x 0.89 8
Condition 3 30 200 – 1300 10 – 45 80 x 80 x 0.89 8
Condition 4 30 400 – 1000 13.3 – 33.3 80 x 76.3 x 1.5 8
Condition 5 20 800 – 1300 40 – 65 80 x 76.3 x 2.3 4
HIGH TEMP. MATERIAL PROCESSES 264
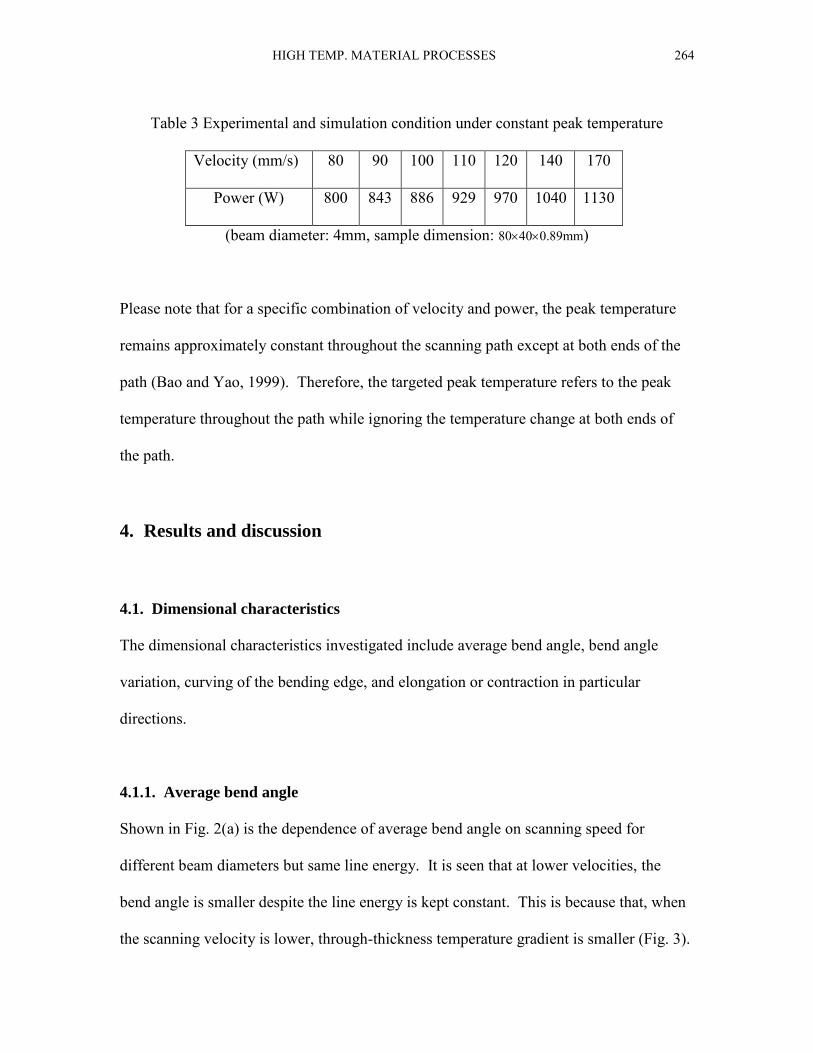
Table 3 Experimental and simulation condition under constant peak temperature
Velocity (mm/s) 80 90 100 110 120 140 170
Power (W) 800 843 886 929 970 1040 1130
(beam diameter: 4mm, sample dimension: 80400.89mm)
Please note that for a specific combination of velocity and power, the peak temperature
remains approximately constant throughout the scanning path except at both ends of the
path (Bao and Yao, 1999). Therefore, the targeted peak temperature refers to the peak
temperature throughout the path while ignoring the temperature change at both ends of
the path.
4. Results and discussion
4.1. Dimensional characteristics
The dimensional characteristics investigated include average bend angle, bend angle
variation, curving of the bending edge, and elongation or contraction in particular
directions.
4.1.1. Average bend angle
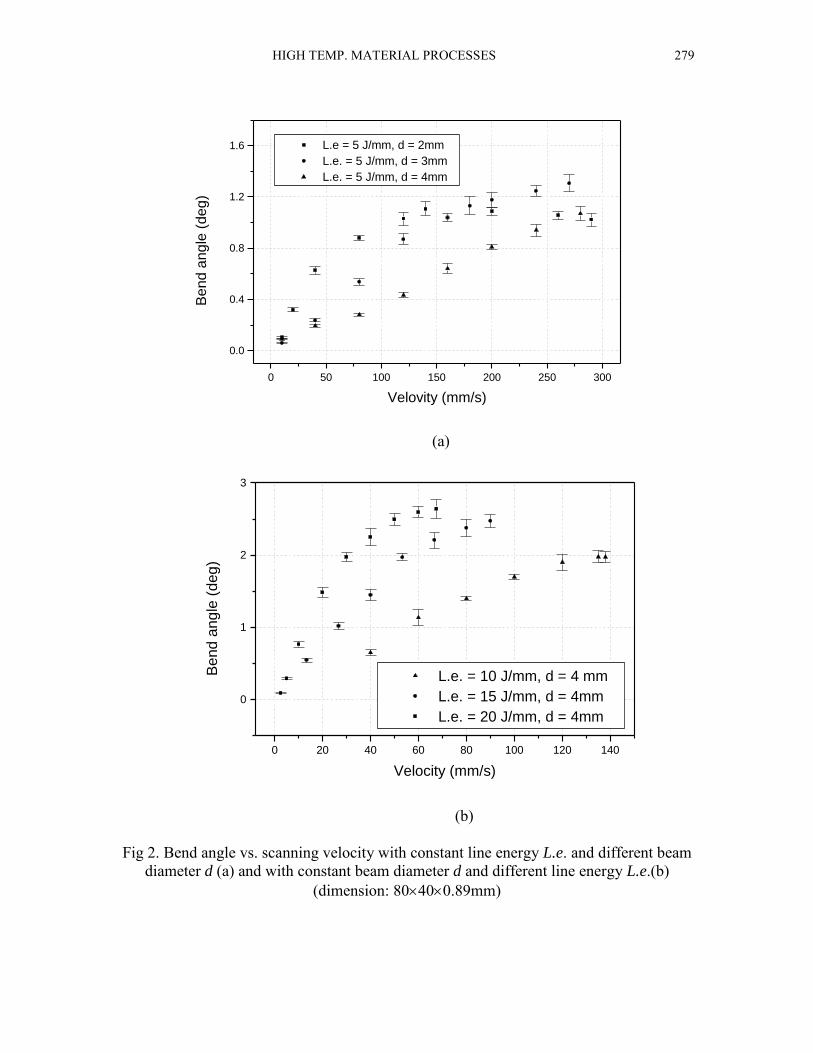
Shown in Fig. 2(a) is the dependence of average bend angle on scanning speed for
different beam diameters but same line energy. It is seen that at lower velocities, the
bend angle is smaller despite the line energy is kept constant. This is because that, when
the scanning velocity is lower, through-thickness temperature gradient is smaller (Fig. 3).
HIGH TEMP. MATERIAL PROCESSES 265
This, in turn, makes the difference between the thermally induced distortions at the top
and bottom surfaces smaller. More importantly, heat dissipation is more significant at
lower speeds and that makes the temperature and efficiency of the forming process lower.
It can also be seen from Fig. 2(a) that when diameter of the laser beam decreases, the
slope of a curve decreases at the higher velocity region, and that in the case of 2mm
diameter it even become negative. This is because the material flow stress increases due
to increased strain rate caused by higher scanning velocity, and the stress increment due
to strain rate variation is more significant at a higher temperature caused by the smaller
beam size and/or higher velocity (Li and Yao, 1999b).
Fig. 2(b) shows the relationship between bend angle and scanning speed for the samples
scanned at different line energy of 10, 15, and 20 mm/s but with the same beam diameter
of 4mm. Obviously, the higher the line energy, the larger the bend angle. When the line
energy is higher, the slope of a curve decrease a bit more because higher line energy
corresponds to higher temperature that enhances the influence of strain rate on material
flow stress.
Shown in Fig. 4 is the simulation and experimental results of the bend angle vs. velocity
for the constant-peak-temperature case whose temperature history is presented in Fig. 5.
As mentioned earlier, the constant-peak-temperature condition largely separates the
effects of strain rate on flow stress from that of temperature. As seen from Fig. 6(a), as
the scanning velocity increases, the compressive plastic deformation at top surface
becomes smaller. This is obviously due to the increase in strain rate associated with the

HIGH TEMP. MATERIAL PROCESSES 266
increased velocity (Fig. 6(b)). The increased strain rate in turn causes the increase in
flow stress, which makes bending difficult at the increased velocity. Please note that
under the constant-peak-temperature condition, the results in Fig. 6(a) primarily represent
the effect of strain rate on flow stress because the effect of temperature on flow stress can
be neglected. Comparing Figs. 4 and 6(b), it can be seen that the bend angle decreases
about 30% for the nearly doubled strain rate.
4.1.2 Bending angle variation and bending edge curving
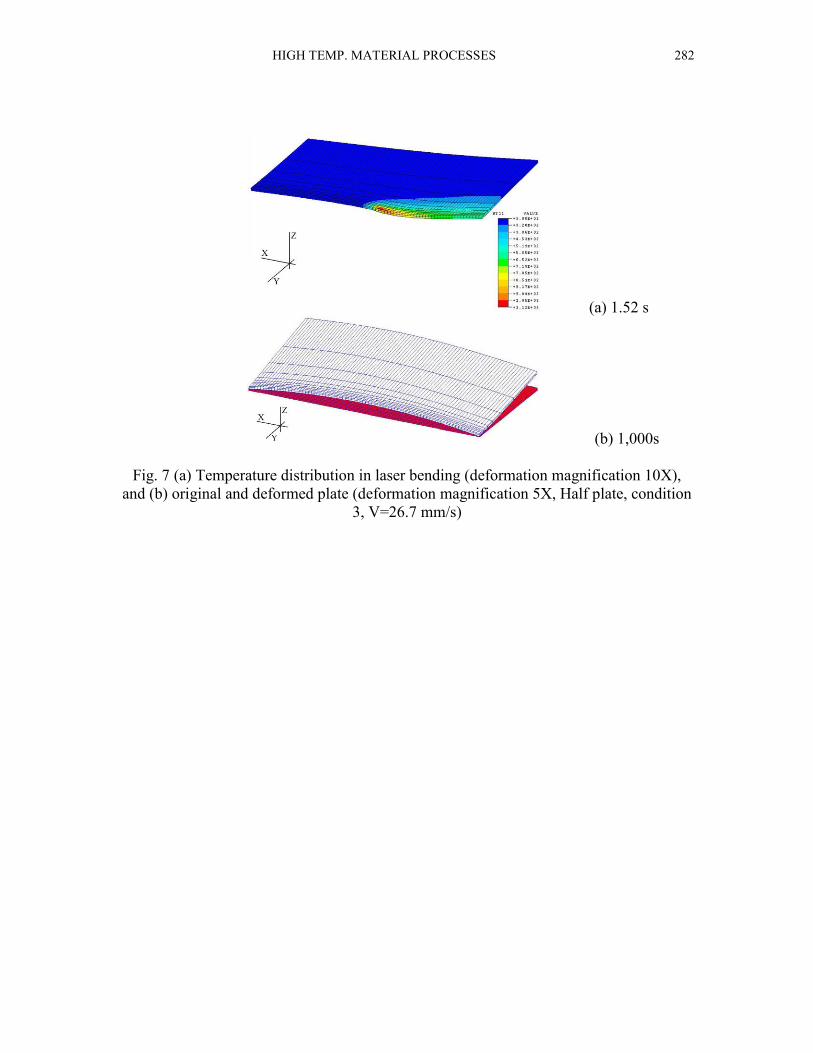
Fig. 7 shows a typical thermal-mechanical simulation result where temperature
distribution is superposed on deformation (magnified for easier visualization). Due to
symmetry only half plate is simulated. As seen, it takes about three seconds to scan the
80-mm path at the velocity used, while deformation does not complete till much later. A
curved bending edge is seen at 1,000 seconds. Fig. 8 (a) shows both experimental and
simulation results of the bending angle along the scanning path and they agree each other
quite well. It can be seen that, from the entering end of the scanning path (X = 0), the
bending angle either drops a little and then increases or directly increases towards the
exiting end, where the maximum value occurs. Shown in Fig. 8 (b) is the curvature of the
bending edge vs. velocity. Fig. 8 (c) and (d) show experimental and numerical results of
bending angle variation and relative bending angle variation, respectively. The bending
angle variation is defined as the difference between the maximal and minimal bending
angle along the bending edge for a given condition. The relative bending angle variation
is the ratio of the bending angle variation to the average bending angle.

HIGH TEMP. MATERIAL PROCESSES 267
As mentioned earlier, bending angle variation and bending edge curving (Fig. 8) are
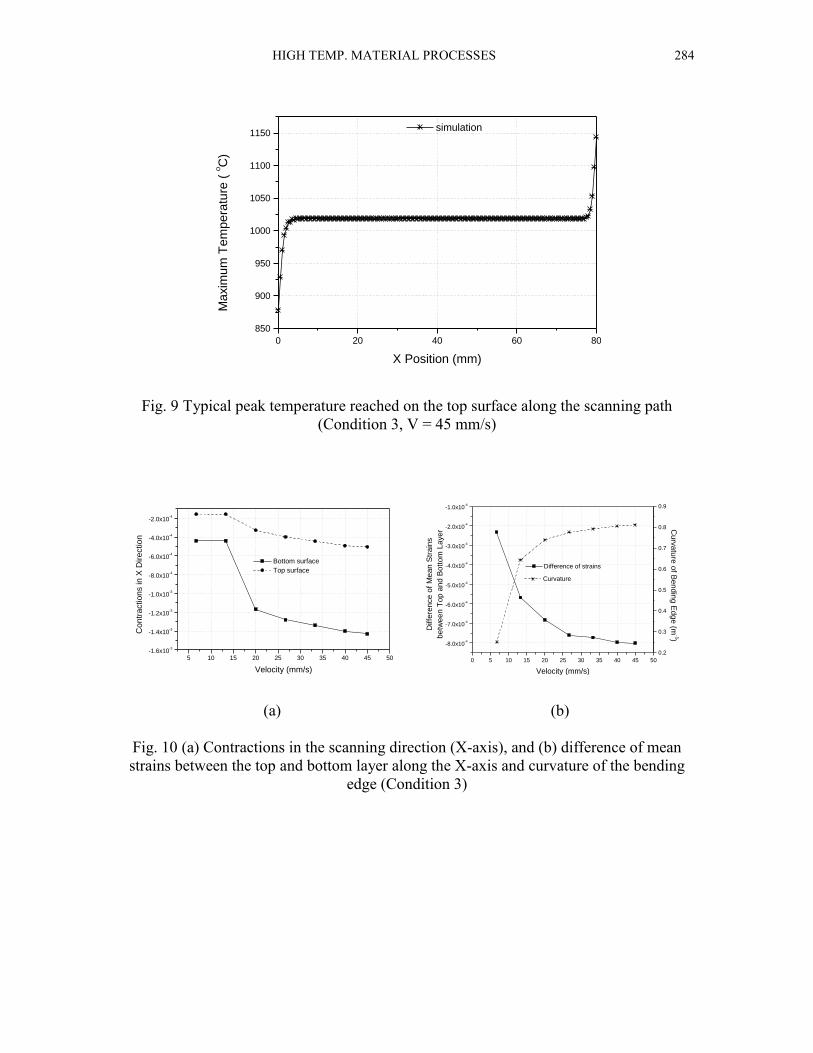
termed as edge effects. The causes of the edge effects are described as follows. The
peak temperature that points on the top surface along the scanning path experience is
shown in Fig. 9. Apparently, the much higher peak temperature at the exiting end is
attributed to the reduced heat dissipation near the exit boundary. The fact that the
temperature at the exit point is much higher than that at the entrance point (Fig. 9)
explains why the bending angle at the exit point differs from that at the entrance point
(Fig. 8(a)). This is one reason why the bending angle is not uniform along the scanning
direction. The other cause for the bending angle variation is the curved bending edge
(Fig. 8 (b)), which will be explained below.
The bending angle variation (Fig. 8 (c)) rises quickly first, peaks at about 20 mm/s, and
then levels off or slightly decreases with the increase of velocity. The curvature of the
bending edge also starts to decrease in slope significantly at around 20 mm/s (Fig. 8 (b)).
It therefore seems reasonable to conclude that the curved bending edge is another reason
for the bending angle variation to occur along the scanning direction.
The cause of the curved bending edge is in turn due to the difference in the X-axis
contraction between the top and bottom surfaces (Fig. 10). Fig. 10 (a) shows the
simulation result of contractions in the X direction on the top and bottom surfaces along
the scanning direction. Fig. 10 (b) shows the difference of the two contractions. The
simulation result of the bending edge curvature in Fig. 8 (b) is also superposed here for
the convenience of discussion. To further explain the X-axis contraction and the reason

HIGH TEMP. MATERIAL PROCESSES 268
for the difference, the time history of plastic strains at a typical location on the scanning
path (X = 20 mm) is examined in Fig. 11. Fig. 11 (a) shows the time history of the
plastic strain on the top surface of that location (in three perpendicular directions). Fig.
11 (b) shows the time history of the X-axis plastic strain on the top and bottom surfaces
at the same location. Near the top layer along the scanning path, compressive strain
occurs in the X and Y directions and tensile strain in Z direction (Fig. 11 (a)). Please
note the sum of these plastic strains is zero at any given time based on the constancy of
volume in plasticity (Mielnik, 1991):
0321 ddd
where 1, 2 and 3 are strains in three mutually perpendicular directions. During the
rapid heating stage (at around one second seen in Fig. 11), a significant Y-axis
compressive plastic strain occurs due to the great geometric constraint of the workpiece
in that direction while the tensile plastic strain in the Z direction occurs freely due to the
much less constraint in the thickness direction. Less well known is the compressive
plastic strain in the X direction, which is also caused by the geometric constraint of the
plate in that direction although the constraint is not as great as that in the Y direction.
The bottom surface along the scanning path undergoes a very similar plastic deformation
process as the top surface, except the magnitude is smaller. This is understandable
because under the given experimental condition (condition 3 in Table 2), the buckling
mechanism is dominant and thus the temperature difference between the top and bottom
surface is moderate. A comparison between the plastic strains at the top and bottom
surfaces is shown in Fig. 11 (b). Fig. 11(b) also shows that, during the cooling stage
(after about one-second seen in Fig. 11), the reverse of the X-axis compressive plastic
(15)

HIGH TEMP. MATERIAL PROCESSES 269
strain at the top surface is more than that at the bottom surface. This is because, during
the cooling stage, the top surface undergoes more Y-axis compressive plastic strain (Fig.
11 (a)) than that at the bottom surface. Based on the constancy of volume, the X-axis
compressive plastic strain at the top surface reverses more than that at the bottom surface
(Fig. 11 (b)). Therefore, the total X-axis contraction near the bottom layer is larger than
that near the top layer (Fig. 10). Consequently, the bending edge is curved away from the
laser beam (Figs. 1 and 7).
As seen in Fig. 10 (b), the greater is the difference between the contractions near the top
and bottom surfaces, the greater the curvature. The fact that the curvature increases with
velocity can be explained by the increase in average bending angle with velocity.
Obviously, when the average bending angle is larger, the above-mentioned difference
between the top and bottom surfaces will be more pronounced, and therefore the
curvature will be greater.
So far, our discussion has been focused on condition 3 in Table 2 where the buckling
mechanism (BM) of laser forming dominates. Under the condition, the edge effects are
characterized by a concave bending angle variation (Fig. 8(a)) and the scanning edge is
curved away from the laser. Similar results are obtained in experiments and simulation
under conditions 1 and 2. Under conditions 4 and 5, however, the BM may not dominate.
In fact, under condition 5, the temperature gradient mechanism (TGM) dominates due to
the reduced beam diameter and increased plate thickness. Condition 4 represents the
situation where the BM transits to the TGM or the BM and TGM co-exist. Therefore, the

HIGH TEMP. MATERIAL PROCESSES 270
edge effects exhibit patterns different from condition 3. As seen from Fig. 12 (a), the
bending angle variation measured along the scanning path is almost linear under
condition 4. Experimental and simulation results show the bending angle variation is
convex under condition 5 (Fig. 12 (b)). In addition, the scanning edge is curved towards
the laser under condition 5 as opposed to curving away from the laser under condition 3.
The time history of the X-axis contraction for conditions 3 and 5 is plotted in Fig. 13. As
seen from Fig. 13 (a), the top and bottom layers experience similar contraction during the
heating stage for the BM-dominated bending operation (condition 3) where temperature
difference between the top and bottom surfaces is moderate. But the bottom layer
contracts more than the top layer during the cooling stage because the Y-axis contraction
at the top surface is greater than that near the bottom surface. This leads to a bending
edge curved away from the laser. For the TGM-dominated bending operation where the
temperature difference between the top and bottom layers is much greater (condition 5),
the top layer contracts more than the bottom layer during the cooling stage (Fig. 13 (b))
simply because the temperature gradient in the thickness direction is so dominant that it
overwrites other effects.
4.2 Mechanical properties
4.2.1 Residual stresses
Fig. 14 shows the numerical simulation and experimental results for the Y-axis residual
stress on the top surface of the workpiece formed under the condition of constant peak
temperature (Table 3). The trends, namely, the bend angle decreasing and residual stress

HIGH TEMP. MATERIAL PROCESSES 271
increasing with the increase of scanning velocity (strain rate) are consistent with the
understanding of the forming mechanisms. Fig. 15 plots the time history of temperature,
Y-axis plastic strain, and Y-axis stress for low and high strain rate cases (V=80mm/s,
P=800W, and V=170mm/s, P=1130W). Please note that all quantities in Figs. 14 and 15
are for the top surface on the scanning path where more changes take place during
forming than at the bottom surface. As seen in Fig. 15, the temperature profiles are
expectedly very similar between the two cases because these cases are determined to
have the same peak temperature in the first place. But the strain rate and in turn the flow
stress are quite different between the two cases.
It can be seen from the time history of stress that, with the imminent arrival of the laser
beam, a small tensile stress first develops due to the expansion of the preceding area,
which is being heated by the laser. With the laser beam arrival and temperature rise,
material tends to expand but undergoes significant compressive stress due to mechanical
constraints of the surrounding material. When temperature rises further, the flow stress
decreases and plastic deformation accrues, which releases the compressive stress and the
absolute value of the compressive stress starts to reduce. After temperature reaches its
maximum value, the material contracts due to the reduced temperature and the stress
starts to change towards being tensile. At the same time, the tensile stress continues to
rise as the material immediately ahead is being heated up by the laser beam and expands.
Since the flow stress associated with the high velocity (strain rate) is higher, the tensile
stress due to the thermal expansion of the material immediately ahead also rises higher.
As a result, the residual stress corresponding to the high velocity remains higher than that
HIGH TEMP. MATERIAL PROCESSES 272
for the low velocity, although in both cases the stress falls slightly because of the
contraction of the material immediately ahead. The effect of strain rate on residual stress,
however, is relatively moderate. As seen from Figs. 14 and 6(b), when the strain rate is
nearly doubled between the lower and higher speed cases, the residual stress increases by
about 15%.
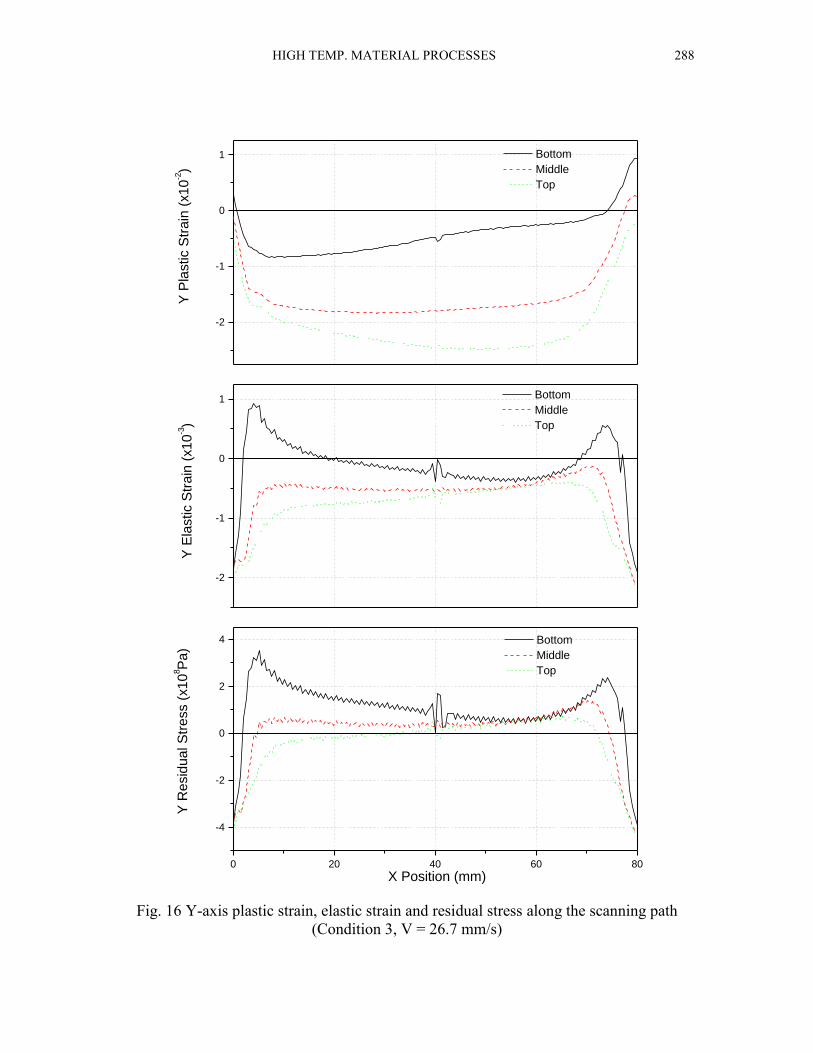
Shown in Fig. 16 is a typical Y-axis plastic strain, elastic strain and residual stress
distribution at the top, middle and bottom layers along the scanning path. As seen from
Fig. 16, the plastic strain near both ends of the scanning path is small because the reduced
geometric constraint of the plate in these regions, while along the rest of the scanning
path significant compressive plastic strain is seen. This clearly explains why the residual
stress is compressive at both ends and tensile along the rest of the scanning path.
As seen in Fig. 16, the profile of the residual stress distribution is understandably very
similar to that of the elastic strain distribution. The small shift along the vertical axis is
governed by the relationship for isotropic elasticity, that is,
113322221
TTTE
EY
where E22 is the elastic strain in the Y direction, T11, T22 and T33 are stress in the X, Y and
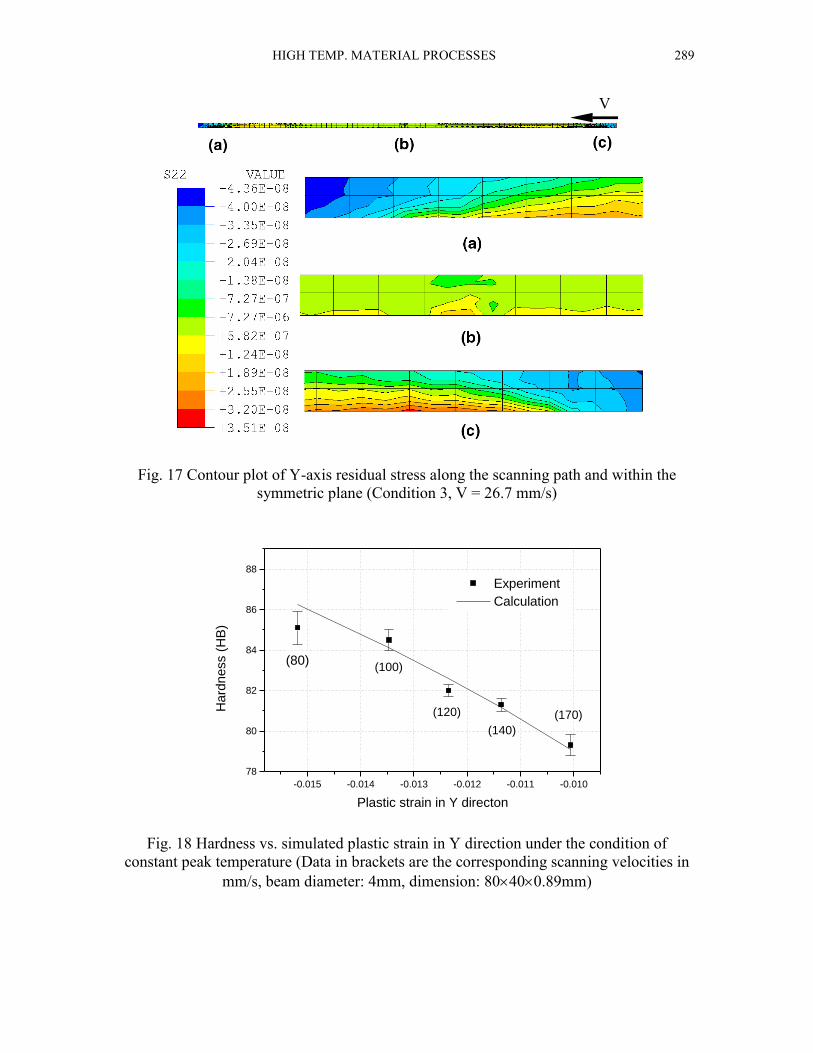
Z direction, respectively. In this case, 033 T . Shown in Fig. 17 is the contour plot of
the Y-axis residual stress along the scanning path and within the symmetric plane.
4.2.2 Hardness
(16)

HIGH TEMP. MATERIAL PROCESSES 273
The hardness of the deformed workpiece is measured at the top surface along the
scanning path (Fig. 18). The measurement is taken 6 days after the forming is done. As
seen, the hardness decreases with the increase of velocity (shown in brackets), because of
the effect of work hardening. At lower velocities, the strain rate and thus flow stress is
lower, resulting higher plastic strain. The higher plastic strain leads to more significant
work hardening. A simple calculated relationship between the hardness and plastic strain
is also superposed on Fig.18 that agrees with the measurement data. The calculation is
based on the well known empirical relationship between stress and hardness as well as
= K' n, where is the simulated plastic strain, n the work-hardening exponent for low
carbon steel, and K' constant. A reasonable agreement is seen.
4.3 Microstructure The microstructure of the deformed workpiece is examined using scanning electron
microscopy. Shown in Fig. 19 is a typical set of SEM micrograghs for the cross section
of the scanning path under the condition of V=138 mm/s and P=1380 W. The simulated
temperature at the top and bottom surfaces along this scanning path is about 1380 oC and
420 oC, respectively, as shown in Fig. 3. Shown in Fig. 19a is the microstructure of the
workpiece material, low carbon steel AISI 1010, as received. Large grains of dark ferrite
scattered with light-colored carbide particle are seen. Fig. 19b shows an area very close
to the top surface where grain recrystallization is evident after laser forming. As
mentioned earlier, the top surface undergoes significant plastic deformation at
temperature above the recrystallization temperature. Laser forming may impart some
beneficial properties to the workpiece top surface under the condition. Some dissolution

HIGH TEMP. MATERIAL PROCESSES 274
of carbides is also seen due to the high temperature. Fig.19c shows the microstructure
near the bottom surface. Little change is observed because the region near the bottom
surface undergoes much less plastic deformation (Fig. 6(a)) and the peak temperature
reached there is also much lower.
5. Conclusions
Numerical and experimental investigations of laser forming processes are carried out to
better understand the influence of process parameters on dimensional characteristics and
mechanical properties of the formed parts. The research on strain rate effects are also
conducted under that condition of constant peak temperature, which largely isolates the
effects of strain rate from that of temperature. With strain rate increase, the thermal-
induced distortion decreases and bend angle reduces. The bend angle decreases by about
30% for nearly doubled strain rate under the conditions used. Under the condition of the
constant line energy, the bend angle increases with scanning velocity and the degree of
increase reduces with the velocity. Edge effects are characterized by a concave pattern in
the bending angle variation along the scanning path and a bending edge curved away
from the laser under BM-dominated conditions. For the TGM-dominated process, the
pattern of edge effects is different, which is characterized by a convex bending angle
variation and the bending edge curved towards the laser. In the case of the BM-
dominated bending operation, the X-axis contraction near the bottom surface is more
significant than that near the top surface, resulting a bending edge curved away form the
laser, while the opposite is true in the case of the TGM-dominated bending process.
Whether to obtain a convex or concave pattern of the bending angle variation is closely
HIGH TEMP. MATERIAL PROCESSES 275
related with the direction of the curved bending edge. For the constant-peak-temperature
case, residual stress in the Y direction increases moderately with strain rate. For the
doubled strain rate, residual stress increases by about 15% under the conditions used.
With the strain rate increase, the hardness of the formed sample decreases due to the
reduced work hardening. Recrystallization and dissolution of hard particles occur near
the top surface of the workpiece material used where temperature is higher and plastic
deformation is more severe.
Acknowledgements
The authors gratefully acknowledge the financial support from Columbia University and
Mr. Jack Tsai and Ms. Dee Breger for their assistance in X-ray diffraction measurement
and SEM observation.
References
Alberti, N., Fratini, L., Micari, F., 1994, "Numerical simulation of the laser bending
process by a coupled thermal mechanical analysis," Laser Assisted Net shape
Engineering, Proceedings of the LANE'94, Vol. 1, Meisenbach Bamberg, pp. 327-336.
Arnet, H., and Vollertsen, F., 1995, “Extending laser bending for the generation of
convex shapes,” IMechE Part B: Journal of Engineering Manufacture, Vol. 209, pp. 433-
442.
Bao, J., Yao, Y. L., 1999, “Study of edge effects in laser bending,” to be presented at
1999 International Mechanical Engineering Congress and Exposition, Nashville, TN,
1999.

HIGH TEMP. MATERIAL PROCESSES 276
Holzer, S., Arnet, H., Geiger, M., 1994, "Physical and numerical modeling of the
buckling mechanism," Laser Assisted Net shape Engineering, Proceedings of the
LANE'94, Vol. 1, Meisenbach Bamberg, pp. 379-386.
Hsiao, Y.-C., Maher, W., et al., 1997, “Finite element modeling of laser forming,”
Proc. ICALEO'97, Section A, pp. 31-40.
Li, W., and Yao, Y. L., 1999a, "Numerical and experimental study of strain rate
effects in laser forming," submitted to ASME Trans., J. Manufacturing Science and
Engineering.
Li, W., and Yao, Y. L., 1999b, "Laser forming with constant line energy," in
preparation.
Magee, J., Watkins, K. G., Steen, W. M., Calder, N., Sidhu, J. and Kirby, J., 1997a,
"Edge effects in laser forming," Laser Assisted Net shape Engineering 2, Proceedings of
the LANE'97, Meisenbach Bamberg, pp. 399-408.
Magee, J., Watkins, K. G., Steen, W. M., 1997b, “Laser forming of aerospace alloys,”
ICALEO '97, Section E, pp. 156-165.
Magee, J., Watkins, K. G., Steen, W. M., 1998, “Advances in laser forming,” Journal
of Laser Application, Vol. 10, pp. 235-246.
Mielnik, E. M., 1991, Metalworking Science and Engineering, McGraw-Hill, Inc.
Mucha, Z., Hoffman, J., Kalita, W., Mucha, S., 1997, "Laser forming of Thick free
plate," Laser Assisted Net shape Engineering 2, Proceedings of the LANE'97,
Meisenbach Bamberg, pp. 383-392.

HIGH TEMP. MATERIAL PROCESSES 277
Sprenger, A., Vollertsen, F., Steen, W. M., Waltkins, K., 1994, "Influence of Strain
Hardening on Laser Bending," Laser Assisted Net shape Engineering, Proceedings of the
LANE'94, Vol. 1, Meisenbach Bamberg, pp. 361-370.
Vollertsen, F., 1994, “Mechanism and models for laser forming,” Laser Assisted Net Shape Engineering,
Proceedings of the LANE’94, Vol. 1, pp. 345-360.
HIGH TEMP. MATERIAL PROCESSES 278
CurvedBending Edge
LaserBeam V
(x)
PointClamp
Y
Z
X
Fig. 1 Schematic of straight-line laser forming showing edge effects characterized by the
curved bending edge and non-uniform bending angle varying along the scanning path (x)
HIGH TEMP. MATERIAL PROCESSES 279
0 50 100 150 200 250 300
0.0
0.4
0.8
1.2
1.6 L.e = 5 J/mm, d = 2mm
L.e. = 5 J/mm, d = 3mm
L.e. = 5 J/mm, d = 4mm
Bend a
ng
le (
deg
)
Velovity (mm/s)
(a)
0 20 40 60 80 100 120 140
0
1
2
3
L.e. = 10 J/mm, d = 4 mm
L.e. = 15 J/mm, d = 4mm
L.e. = 20 J/mm, d = 4mm
Be
nd
an
gle
(d
eg
)
Velocity (mm/s)
(b)
Fig 2. Bend angle vs. scanning velocity with constant line energy L.e. and different beam
diameter d (a) and with constant beam diameter d and different line energy L.e.(b) (dimension: 80400.89mm)

HIGH TEMP. MATERIAL PROCESSES 280
0.1 1 10
0
450
900
1350 v=138mm/s, top surface
v=138mm/s, bottom
v=80mm/s, top surface
v=80mm/s, bottom
v=40mm/s, top surface
v=40mm/s, bottom
Constant line energy: 10J/mm
Te
mp
era
ture
(oC
)
Time (s)
Fig.3 Simulated time histories of temperature under constant line energy (beam diameter:
4mm, dimension: 80400.89mm)
80 100 120 140 160 180
0.8
1.0
1.2
1.4
1.6
Simulation
Experiment
Bend a
ng
le (
deg
)
Velocity (mm/s)
Fig. 4 FEM and experimental results under the condition of constant peak temperature (beam diameter: 4mm, dimension: 80400.89mm)

HIGH TEMP. MATERIAL PROCESSES 281
0.1 1 10
0
200
400
600
800
1000
1200
V: 80 mm/s, P: 800W
V: 100 mm/s, P: 886W
V: 120 mm/s, P: 970 W
V: 140 mm/s, P: 1040W
V: 170 mm/s, P: 1130 W
Constant peak temperature:1,030oC
Te
mp
era
ture
at
top
su
rfa
ce
(oC
)
Time (s)
Fig. 5 Simulated time histories of temperature to find different combinations of velocity
and laser power that generate approximately the same peak temperature at the top surface (beam diameter: 4mm, dimension: 80400.89mm)
80 100 120 140 160 180
-0.016
-0.012
-0.008
-0.004
0.000
0.004
Bottom surface
Top surface
Pla
stic s
tra
in in Y
dire
ction
Velocity (mm/s)
(a) Plastic strain (b) Strain rate Fig.6 Plastic strain and strain rate in Y direction vs. velocity (constant peak temperature,
beam diameter: 4mm, dimension: 80400.89mm)
HIGH TEMP. MATERIAL PROCESSES 282
(a) 1.52 s
(b) 1,000s
Fig. 7 (a) Temperature distribution in laser bending (deformation magnification 10X), and (b) original and deformed plate (deformation magnification 5X, Half plate, condition
3, V=26.7 mm/s)

HIGH TEMP. MATERIAL PROCESSES 283
0 10 20 30 40 50 60 70 80
1
2
3
4
5
V(mm/s) Simulation Experiment
7
13
20
45
Be
nd
ing
An
gle
(x
) (d
eg
)
X Position (mm)
0 10 20 30 40 50
0.2
0.4
0.6
0.8
1.0
simulation
experiment
Cu
rva
ture
of
Be
nd
ing
Ed
ge
(m
-1)
Velocity (mm/s)
(a) (b)
5 10 15 20 25 30 35 40 45 50
0.6
0.7
0.8
0.9
1.0
1.1
1.2
1.3
1.4
1.5
simulation
experiment
Be
nd
ing
An
gle
Varia
tion
(d
eg
)
Velocity (mm/s) 0 10 20 30 40 50
0.2
0.3
0.4
0.5
0.6
0.7
0.8
simulation
experiment
Re
lative
Be
nd
ing
An
gle
Va
ria
tion
Velocity (mm/s)
(c) (d)
Fig. 8 Results of simulation and experiment under condition 3 showing edge effects (a) bending angle variation along the scanning path, (b) curvature of the bending edge, (c) bending angle variation (difference between the max and min), and (d) relative bending
angle variation (bending angle variation over average bending angle)
HIGH TEMP. MATERIAL PROCESSES 284
0 20 40 60 80
850
900
950
1000
1050
1100
1150 simulation
Ma
xim
um
Te
mp
era
ture
( o
C)
X Position (mm)
Fig. 9 Typical peak temperature reached on the top surface along the scanning path (Condition 3, V = 45 mm/s)
5 10 15 20 25 30 35 40 45 50-1.6x10
-3
-1.4x10⁻³
-1.2x10⁻³
-1.0x10⁻³
-8.0x10⁻⁴
-6.0x10⁻⁴
-4.0x10⁻⁴
-2.0x10⁻⁴
Bottom surface
Top surface
Contr
actions in X
Direction
Velocity (mm/s)
0 5 10 15 20 25 30 35 40 45 50
-8.0x10⁻⁴
-7.0x10⁻⁴
-6.0x10⁻⁴
-5.0x10⁻⁴
-4.0x10⁻⁴
-3.0x10⁻⁴
-2.0x10⁻⁴
-1.0x10⁻⁴
Difference of strains
Diffe
ren
ce
of
Me
an
Str
ain
s
betw
een
To
p a
nd
Bo
tto
m L
aye
r
Velocity (mm/s)
0.2
0.3
0.4
0.5
0.6
0.7
0.8
0.9
Curvature
Cu
rva
ture
of B
end
ing
Ed
ge
(m-1)
(a) (b)
Fig. 10 (a) Contractions in the scanning direction (X-axis), and (b) difference of mean strains between the top and bottom layer along the X-axis and curvature of the bending
edge (Condition 3)

HIGH TEMP. MATERIAL PROCESSES 285
1 10 100
-2.5
-2.0
-1.5
-1.0
-0.5
0.0
0.5
1.0
1.5
2.0
2.5
X direction
Y direction
Z direction
Pla
stic S
train
(x10
-2)
Time (s) 1 10 100
-9
-8
-7
-6
-5
-4
-3
-2
-1
0
1
Bottom
Top
X P
lastic S
train
(x10
-3)
Time (s) (a) (b)
Fig. 11 Time history of plastic strain for a typical point (X = 20 mm) (a) X-, Y-, and Z-
axis plastic strain on the top surface along the scanning path, and (b) X-axis plastic strain on the top and bottom surfaces along the scanning path (Condition 3, V = 26.7 mm/s)
0 10 20 30 40 50 60 70 80
0.6
0.8
1.0
1.2
1.4
1.6 V=13.3 V=20
V=26.7 V=33.3
Be
nd
ing
An
gle
(d
eg
)
X Position (mm)
0 10 20 30 40 50 60 70 80
0.35
0.40
0.45
0.50
0.55
0.60V (mm/s) Experiment Simulation
40
50
65
Bendin
g A
ng
le (
deg
)
X Position (mm)
(a) (b)
Fig. 12 (a) Measurement of bending angle (x) (Condition 4), and (b) simulation and
experimental results of bending angle (x) (Condition 5)

HIGH TEMP. MATERIAL PROCESSES 286
0.1 1 10 100 1000
-1.5
-1.0
-0.5
0.0
0.5
1.0
1.5
2.0
Bottom
Top
Co
ntr
actio
n in
X d
ire
ctio
n (
x1
0-3)
Time (s)
0.1 1 10 100 1000
-2.0
-1.0
0.0
1.0
2.0
3.0
4.0
5.0
Bottom
Top
Co
ntr
actio
n in
X d
ire
ctio
n (
x1
0-4)
Time (s) (a) (b)
Fig. 13 Time history of X-axis deformation (a) condition 3 (Buckling mechanism
dominated), and (b) condition 5 (Temperate gradient mechanism dominated)
Fig. 14 FEM and X-ray diffraction measurement of residual stress for the samples scanned under the condition of constant peak temperature (beam diameter: 4mm,
dimension: 80400.89mm)

HIGH TEMP. MATERIAL PROCESSES 287
0.1 1
0
200
400
600
800
1000
1200
Temperature
Te
mp
era
ture
(oC
)
Time (s)
-400
-300
-200
-100
0
100
200
300
400
Str
ess in
Y d
irectio
n (
MP
a)
Stress
-0.015
-0.012
-0.009
-0.006
-0.003
0.000
0.003
Plastic strain
Pla
stic s
tra
in in
Y d
ire
ctio
n
(a) V=170mm/s, P=1130W
0.1 1
0
200
400
600
800
1000
1200
Temperature
Te
mp
era
ture
(OC
)
Time (s)
-400
-300
-200
-100
0
100
200
300
400
Str
ess inY
direction
(M
Pa
) Stress
-0.015
-0.012
-0.009
-0.006
-0.003
0.000
0.003
Plastic strain
Pla
stic s
tra
in in
Y d
ire
ctio
n
(b) V=80mm/s, P=800W
Fig. 15 Comparison of effect of high and low strain rate on residual stress (beam
diameter: 4mm, dimension: 80400.89mm)
HIGH TEMP. MATERIAL PROCESSES 288
-2
-1
0
1 Bottom
Middle
TopY
Pla
stic S
train
(x10
-2)
-2
-1
0
1
Y E
lastic S
train
(x10
-3)
Bottom
Middle
Top
0 20 40 60 80
-4
-2
0
2
4
X Position (mm)
Y R
esid
ual S
tress (
x10
8P
a)
Bottom
Middle
Top
Fig. 16 Y-axis plastic strain, elastic strain and residual stress along the scanning path
(Condition 3, V = 26.7 mm/s)
HIGH TEMP. MATERIAL PROCESSES 289
V
Fig. 17 Contour plot of Y-axis residual stress along the scanning path and within the
symmetric plane (Condition 3, V = 26.7 mm/s)
-0.015 -0.014 -0.013 -0.012 -0.011 -0.010
78
80
82
84
86
88
(120) (170)
(140)
(100)(80)
Experiment
Calculation
Hard
ness (
HB
)
Plastic strain in Y directon
Fig. 18 Hardness vs. simulated plastic strain in Y direction under the condition of
constant peak temperature (Data in brackets are the corresponding scanning velocities in mm/s, beam diameter: 4mm, dimension: 80400.89mm)

HIGH TEMP. MATERIAL PROCESSES 290
(a) as received
(b) After laser forming (near top surface)
(c) After laser forming (near bottom surface) Fig. 19 Scanning electron micrograghs of the microstructure of the scanning path region (V:138mm/s, P:1380W, AISI1010, beam diameter: 4mm, dimension: 80400.89mm)