investigation of pcb pollution: method validation and …
TRANSCRIPT

INVESTIGATION OF PCB POLLUTION: METHOD VALIDATION AND CASE
STUDIES FROM ANKARA
A THESIS SUBMITTED TO
THE GRADUATE SCHOOL OF NATURAL AND APPLIED SCIENCES
OF
MIDDLE EAST TECHNICAL UNIVERSITY
BY
NAZAN AKDUMAN
IN PARTIAL FULFILLMENT OF THE REQUIREMENTS
FOR
THE DEGREE OF MASTER OF SCIENCE
IN
ENVIRONMENTAL ENGINEERING
DECEMBER 2009

ii
Approval of the thesis:
INVESTIGATION OF PCB POLLUTION: METHOD VALIDATION AND
CASE STUDIES FROM ANKARA
submitted by NAZAN AKDUMAN in partial fulfillment of the requirements for the
degree of Master of Science in Environmental Engineering Department, Middle
East Technical University by,
Prof. Dr. Canan Özgen _____________________
Dean, Graduate School of Natural and Applied Sciences
Prof. Dr. Göksel N. Demirer _____________________
Head of Department, Environmental Engineering
Assoc. Prof. Dr. Ġpek Ġmamoğlu _____________________
Supervisor, Environmental Engineering Dept., METU
Examining Committee Members:
Prof. Dr. Gürdal Tuncel _____________________
Environmental Engineering Dept.,METU
Assoc. Prof. Dr. Ġpek Ġmamoğlu _____________________
Environmental Engineering Dept.,METU
Assoc. Prof. Dr. AyĢegül Aksoy _____________________
Environmental Engineering Dept.,METU
Dr. Emre Alp _____________________
Environmental Engineering Dept.,METU
Assoc. Prof.Dr. Selim Sanin _____________________
Environmental Engineering Dept.,
Hacettepe University
Date: ______________

iii
I hereby declare that all information in this document has been obtained and
presented in accordance with academic rules and ethical conduct. I also declare
that, as required by these rules and conduct, I have fully cited and referenced
all material and results that are not original to this work.
Name, Last name: Nazan AKDUMAN
Signature:
iv
ABSTRACT
INVESTIGATION OF PCB POLLUTION: METHOD VALIDATION AND CASE
STUDIES FROM ANKARA
Akduman, Nazan
M.S., Department of Environmental Engineering
Supervisor: Assoc. Prof. Dr. Ġpek ĠMAMOĞLU
December 2009, 112 pages
Polychlorinated biphenyls (PCBs) are persistent organic pollutants which were not
produced in Turkey, however both national and international studies illustrate a
measurable amount of PCB pollution in receiving environments, aquatic fauna and
people. In this study, various information sources such as the national and
international scientific literature, official records and reports are investigated to
obtain information regarding PCB pollution in Turkey. Furthermore, various PCB
pollution analysis techniques for soil/sediment samples are investigated and the
selected methods are established in the laboratories of METU. Satisfactory
recoveries are obtained for methods for the extraction of PCBs, clean-up of extract
and gas chromatographic (GC/ECD) analysis of the sample. Finally, field studies are
performed in two locations in Ankara. The first one is a preliminary pollution
investigation study around Lake Eymir. Lake Eymir is suspected to be contaminated
with PCBs due to a nearby transformer repair facility. The second, more detailed
study is performed for a 25 km reach of Ankara Creek, passing through the Industrial
Zone, Sincan Dumpsite and Ankara Central Wastewater Treatment Plant. Total- PCB
concentrations are in the range of 0.2 and 777 ng/g with the median of 37.1 ng/g.
Toxic Equivalent Concentrations (TEQ) are assessed for dioxin-like congeners and
Aroclor 1016/1260 basis. A Chemical Mass Balance Model is used to identify and

v
apportion the sources of PCBs for Ankara Creek samples. Typically highly
chlorinated Clophen mixtures are identified in sediments as the pollution sources.
Keywords: Polychlorinated Biphenyls, Environmental Pollution, Sediment,
Analysis, Ankara Creek, Turkey

vi
ÖZ
PCB’LER KAYNAKLI KĠRLĠLĠĞĠN ARAġTIRILMASI: METOT
VALĠDASYONU VE ANKARA’DA SAHA ÇALIġMALARI
Akduman, Nazan
Yüksek Lisans, Çevre Mühendisliği Bölümü
Tez Yöneticisi: Doç. Dr. Ġpek ĠMAMOĞLU
Aralık 2009, 112 sayfa
Poliklorlu bifeniller (PCB’ler) Türkiye’de üretilmemiĢ, yüksek kararlılıkta
organik kirleticilerdir. Ancak bazı ulusal ve uluslararası çalıĢmalar Türkiye’de
çeĢitli alıcı ortamlarda, sucul fauna ve insanda ölçülebilir miktarda PCB’lerin
bulunduğunu göstermektedir. Bu çalıĢmada, ulusal ve uluslararası bilimsel
literatür ve Türkiye’de PCB’ler kaynaklı kirliliğe iliĢkin resmi kayıt ve raporlar
gibi çeĢitli kaynaklar araĢtırılmıĢtır. Ayrıca, toprak ve sediman numuneleri için
çeĢitli PCB kirliliği analiz teknikleri araĢtırılmıĢ ve seçilen metotlar ODTÜ
laboratuvarlarında yerleĢtirilmiĢtir. Numunelerin ekstraksiyonu, ekstrakt
temizleme ve gaz kromatografik analiz metotları için kabul edilebilir geri
kazanım verimleri elde edilmiĢtir. Son olarak, Ankara’da iki alanda saha
çalıĢmaları yapılmıĢtır. Bunlardan ilki Eymir Gölü için yapılan kirlilik ön izleme
çalıĢmasıdır. Burada çok yakında bulunan trafo bakım ve onarım tesisi nedeniyle
PCB kirliliğinin olması olasıdır. Ġkinci ve daha detaylı saha çalıĢması Ankara
Organize Sanayi Bölgesi, Sincan Çöplüğü ve Ankara Atıksu Arıtma Tesisi
yakınından geçen Ankara Çayı’nın 25 km’lik kısmında yapılmıĢtır. Numunelerde
Toplam-PCB konsantrasyonu 0.2 ve 777 ng/g değerleri arasındadır ve medyanı
37.1 ng/g olarak ölçülmüĢtür. PCB’lerin dioksin benzeri bileĢikleri için Aroclor
1016/1260 konsantrasyonları kullanılarak Toksik EĢdeğer Konsantrasyon (TEQ)
değerleri hesaplanmıĢtır. Ankara Çayı’da görülen PCB kirliliğinin kaynaklarının
ve kaynakların kirliliğe katkısının belirlenmesi için Kimyasal Kütle Dengesi

vii
Modeli kullanılmıĢtır. Genellikle yüksek klorlu Clophen karıĢımlarının
sedimanlarda kirliliğe sebep olduğu belirlenmiĢtir.
Anahtar Kelimeler: Poliklorlu bifeniller, Çevre Kirliliği, Sediman, Ankara
Çayı, Türkiye

viii
ACKNOWLEDGEMENT
I would like to express my sincere gratitude to my thesis supervisor Assoc. Prof. Dr.
Ġpek ĠMAMOĞLU for their support, valuable criticism, and endless and forever
patience throughout my study.
I would like to thank to my colleagues Kadir GEDĠK and Filiz DEMĠRCĠOĞLU for
their direct support to this study both technically and conceptually and again for their
unique friendship.
I would like to express my thanks to my friends for their direct support at laboratory
work and moral support throughout my study.
I would like to thank to my Head of Department of EIA Mr. Mustafa SATILMIġ, for
his sincere support and flexibility during my professional work in Ministry of
Environment and Forestry.
Finally, I would like to express my special thanks to my family for their endless love
and patience throughout my study.

ix
TABLE OF CONTENTS
ABSTRACT ................................................................................................................ iv
ÖZ ............................................................................................................................... vi
ACKNOWLEDGEMENT ........................................................................................ viii
LIST OF TABLES ...................................................................................................... xi
LIST OF FIGURES .................................................................................................. xiii
CHAPTERS
1. INTRODUCTION.................................................................................................... 1
2. LITERATURE REVIEW ........................................................................................ 4
2.1 GENERAL INFORMATION ABOUT PCBs ................................................... 4
2.2 USES OF PCBs .................................................................................................. 5
2.2.1 Closed Applications .................................................................................... 6
2.2.2 Partially Closed Applications ...................................................................... 7
2.2.3 Open Applications ....................................................................................... 8
2.3 DISTRIBUTION IN NATURE ......................................................................... 8
2.3.1 PCB Containing Waste Generation and Distribution.................................. 9
2.3.2 Fate and Transport of PCBs ........................................................................ 9
2.3.3 Human Health Considerations .................................................................. 11
2.4 REGULATIONS ON PCBS ............................................................................ 11
2.4.1 International Efforts on Regulation of PCBs ............................................ 11
2.4.1 Turkish Regulation on PCBs ..................................................................... 12
2.5 CURRENT STATE OF PCB POLLUTION IN TURKEY ............................. 16
2.5.1 Sites that have Potential of PCB Pollution ................................................ 17
2.5.2 Environmental Pollution and Toxicology Studies for Turkey .................. 18
2.5.3 This Study ................................................................................................. 23
3. MATERIALS AND METHOD ............................................................................. 24
3.1 PCB ANALYSIS METHODS ......................................................................... 24
3.1.1 PCB Extraction and Analysis .................................................................... 24
3.1.1 Quality Assurance/Quality Control (QA/QC) Protocols: ......................... 31
3.1.3 Cleaning of Glassware .............................................................................. 31
3.2 STUDY AREAS .............................................................................................. 32
x
3.2.1 Preliminary Investigation of PCB Pollution Around Lake Eymir ............ 32
3.2.2 Investigation of PCB Pollution In Ankara Creek ...................................... 34
3.2 CHEMICAL MASS BALANCE MODEL ...................................................... 36
4. RESULTS AND DISCUSSION ............................................................................ 39
4.1 VALIDATION OF PCB ANALYSIS METHODS ......................................... 39
4.1.1 Investigation of PCB Analysis Methods ................................................... 39
4.1.2 PCB Analysis Methods in Laboratory ...................................................... 40
4.2 PRELIMINARY INVESTIGATION OF PCB POLLUTION AROUND
LAKE EYMIR ....................................................................................................... 52
4.2.1 Sampling and Characteristics of Samples ................................................. 52
4.2.2 Status of PCB Pollution and Discussion ................................................... 53
4.2.3 Assessment of Effects on Human Health .................................................. 57
4.3 INVESTIGATION OF PCB POLLUTION IN ANKARA CREEK ............... 58
4.3.1 Sampling and Characteristics of Samples ................................................. 58
4.3.2 Status of PCB Pollution and Discussion ................................................... 59
4.3.3 Assessment of Effects on Human Health .................................................. 68
4.3.4 Chemical Mass Balance Model Results and Discussion .......................... 69
5. CONCLUSION ...................................................................................................... 85
5.1 CONCLUSIONS .............................................................................................. 85
5.2 RECOMMENDATIONS FOR FUTURE STUDY ......................................... 86
REFERENCES ........................................................................................................... 87
APPENDICES
A. TRADE NAMES OF PCBS ............................................................................ 100
B. PCB POLLUTION RESULTS FOR LAKE EYMIR ..................................... 102
C. PCB POLLUTION RESULTS FOR ANKARA CREEK ............................... 104
D. MAPS OF SAMPLING AREA ...................................................................... 109
xi
LIST OF TABLES
TABLES
Table 2.1: Percent by weight chlorine homolog distribution for Aroclors ................. 5
Table 2.2: Total PCB production as reported in the literature (in tonnes) .................. 6
Table 2.3: Physico-chemical properties of selected Aroclors .................................. 10
Table 2.4: Waste Oil Categories and Pollutant Limit Values .................................. 14
Table 2.5: Import Data of PCBs, PCTs and PBBs for 1996-2005 ............................ 16
Table 2.6: Sector-specific Capacities for Electricity Production and Distributions . 17
Table 2.7: Environmental Pollution Studies related with PCBs in Turkey .............. 19
Table 2.8: Environmental Toxicology Studies related with PCBs in Turkey .......... 20
Table 3.1: Characteristics of Samples of Lake Eymir .............................................. 34
Table 3.2: Moisture and Organic Content and Coordinates of Sampling Points ...... 35
Table 4.1: Freeze-dryer Performance Trials ............................................................. 42
Table 4.2: Soxhlet Extraction Working Temperature Trials ..................................... 42
Table 4.3: Kuderna-Danish Concentration Trials ..................................................... 43
Table 4.4: Silica Gel Clean-up Trials ........................................................................ 46
Table 4.5: Laboratory Control Sample Analyses Procedure ..................................... 47
Table 4.6: Recovery Results of PCB Analysis for Soil and Sediment Samples ....... 48
Table 4.7: Modifications applied in Laboratory Control Sample analysis ............... 49
Table 4.8: Standard Reference Material Recovery Results ..................................... 51
Table 4.9: Results of PCB Pollution of Sediment Samples of Lake Eymir .............. 53
Table 4.10: Results of PCB Pollution of Soil Samples taken from ......................... 53
Transformer Repair Center of TEDAġ
Table 4.11: Results of PCB Pollution of Soil Samples taken from the ..................... 53
vicinity of Eymir Lake
Table 4.12: Toxic Equivalency Factor (TEF) and Toxic Equivalent ........................ 58
Concentration (TEQ) Values of Lake Eymir
Table 4.13: Results of PCB Pollution of Ankara Creek ............................................ 59
Table 4.14: PCB Analysis Results of Similar River Sediments ................................ 61

xii
Table 4.15: Draft By-law of Soil Pollution Control – Generic Pollutant .................. 63
Limit Values
Table 4.16: Toxic Equivalency Factor (TEF) and Toxic Equivalent ........................ 68
Concentration (TEQ) Values of Ankara Creek
Table 4.17: Chemical Mass Balance Model Results and Statistics .......................... 70
Table 4.18: Summary of Characteristics of PCB dechlorination activities .............. 78
Table 4.19: Anaerobic Dechlorination Pathways reproduced for 7 congeners ......... 79
Table 4.20: Chemical Mass Balance Model Results and Statistics for ..................... 81
Samples with Unsatisfactory CMB Model Fits
Table A.1: Trade Names of PCBs .......................................................................... 100
Table B.1: PCB Pollution Results for Lake Eymir ................................................. 102
Table C.1: PCB Pollution Results for Ankara Creek .............................................. 104

xiii
LIST OF FIGURES
FIGURES
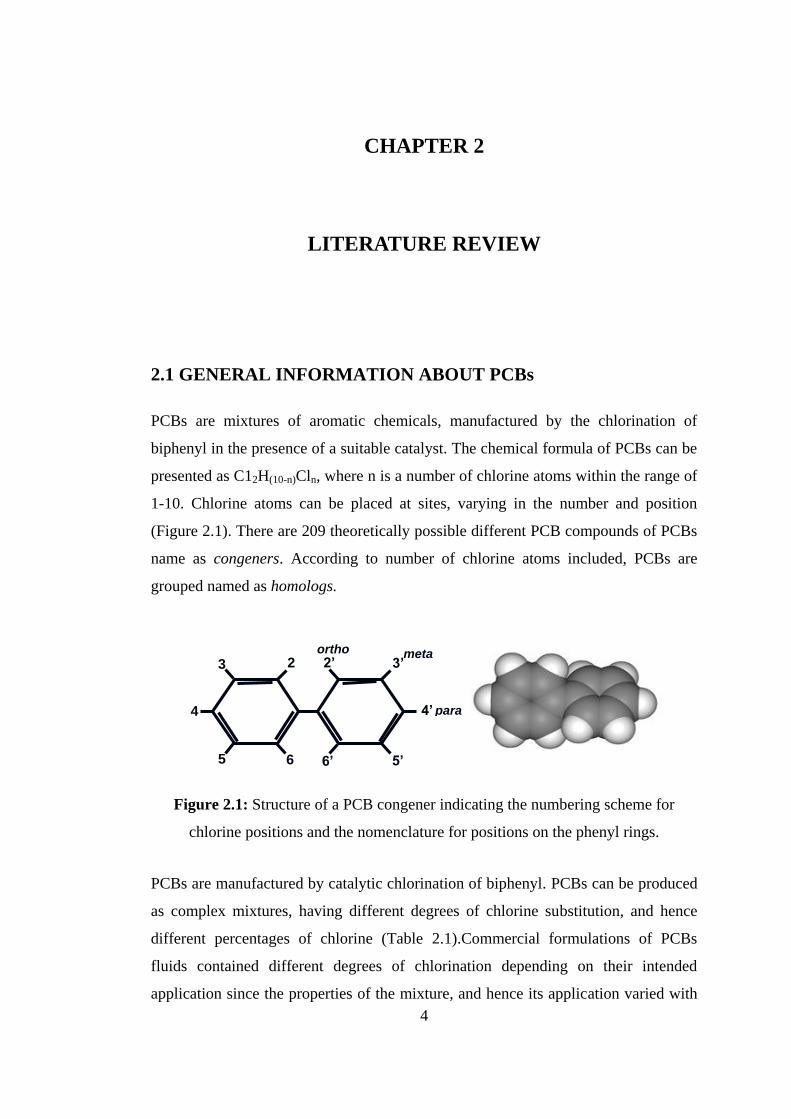
Figure 2.1: Structure of a PCB congener indicating the numbering scheme .............. 4
for chlorine positions and the nomenclature for positions
on the phenyl rings
Figure 3.1: Flow diagram of PCB analysis procedure for soil and sediment ........... 26
samples
Figure 3.2: Sampling Points of field study performed around Lake Eymir ............. 33
Figure 3.3: Sampling Points of field study performed around Ankara Creek .......... 35
Figure 4.1 Panel (I) a – b: Chromatographs of sample extracts (a) before ............. 45
(b) after sulfur clean-up
Panel (II) a – b: Chromatographs of sample extracts (a) before ........... 45
(b) after sulfuric acid clean-up
Figure 4.2: Recovery Results of PCB Analysis for Soil and Sediment Samples ..... 48
Figure 4.3 a-b: Chromatographs of Blanks before and after EPA SW-846 ............. 50
Cleaning Procedure
Figure 4.4: Photograph of Sampling Study Area around Lake Eymir ...................... 52
Figure 4.5: Chromotograph of Eymir Lake Sample EG-T7 and Example ............... 54
GC/ECD Chromatogram of 1 ppm Aroclor 1016/1260 mixture
Figure 4.6: Illustration of PCB Pollution in terms of potential sources .................... 60
along Ankara Creek
Figure 4.7: Average Congener Profiles of Ankara Creek Samples .......................... 64
Figure 4.8: Congener Profiles for 19 Samples of Ankara Creek .............................. 65
reproduced using 7 congeners
Figure 4.9: Aroclor Profiles reproduced using 7 congeners ..................................... 66
Figure 4.10: Clophen Profiles reproduced using 7 congeners .................................. 67
Figure 4.11 A: The measured and predicted congener profile of a sample .............. 73
B: The difference congener profile of predicted and ............................ 73
measured profiles

xiv
Figure 4.12: Measured vs. Predicted PCB Pollution for Ankara Creek Samples ..... 74
Model for Ankara Creek Sample
Figure 4.13: Measured vs. Predicted PCB Concentrations for Ankara Creek .......... 82
Samples with Unsatisfactory CMB Model Fits
Figure 4.14: Measured and Predicted Profiles for Ankara Creek Samples .............. 83
with Unsatisfactory CMB Model Fits
Figure 4.15: Measured Congener Profiles for Samples with Unsatisfactory ........... 84
CMB Model Fits
Figure D.1: Maps of Sampling Area ...................................................................... 109

1
CHAPTER 1
INTRODUCTION
Polychlorinated biphenyls (PCBs) are a class of organic compounds and persistent
environmental pollutants. They were widely used in industry since they are thermally
and chemically stable. These properties make PCBs accumulative in nature and
transport in global patterns. Due to their persistence in nature, they posses danger to
humans and environment and affect global ecosystems seriously. By considering
these serious effects, investigating sites that are contaminated with PCBs and
developing effective remediation strategies are important.
PCBs are regulated by several international efforts since they are one of the most
dangerous chemicals in the world. The Stockholm Convention on Persistent Organic
Pollutants that aims environmentally sound management of PCBs was adopted in
2001 and entered into force in 2004. In Turkey, PCBs were not produced however,
they were imported. The import of PCBs was banned in 1996 by the By-law of
Hazardous Chemicals. In addition, according to the Stockholm Convention, PCBs
have to be phased out and arranged for PCB-free replacements until 2025; and PCBs
must be disposed in an environmentally sound manner until 2028. Moreover, EU
accession process will delegate responsibilities regarding PCBs and PCB
contaminated sites. In this perspective, it is becoming increasingly important to
accurately quantify PCBs and conduct investigations on contaminated sites.
Consequently, this study aims to establish PCB analysis methods for soil samples in
METU laboratories and conduct investigation on two potentially PCB contaminated
regions in Ankara.

2
The specific objectives of the study are:
1. To investigate a variety of PCB analysis techniques for soil and sediment
samples and establish the selected PCB analysis methods in the laboratory,
2. To conduct a preliminary site investigation in the vicinity of Lake Eymir by
quantifying the pollution in terms of total PCBs and estimating the effects on
human health,
3. To conduct a detailed site investigation on Ankara Creek sediments;
i) By quantifying the pollution in terms of both total PCBs and seven
individual PCB congeners listed in ―Working Document on Sludge‖ that
complements the European Directive 86/278/CEE and estimating the
effect on human health
ii) By applying a chemical mass balance model to the congener specific PCB
data in order to identify possible PCB sources and their contributions to
each sample.
In Chapter II, general properties of PCBs, their uses and distribution in nature is
discussed. Uses of PCBs are given according to their presence in the systems of
applications. Secondly, information about PCB containing waste generation and
mechanisms that PCBs distribute in nature and cause pollution is summarized.
Additionally, Turkish regulations and international constitutions in relation with
Turkey that characterize PCB containing wastes and oils and any limitations are
presented. Finally, information specific to Turkey are presented which are; official
import records, national and international scientific studies on PCB pollution in
various media (soil, air, water, biota) in Turkey.
In Chapter III, PCB extraction and analysis methods are described in detail. Besides
sample drying, extraction, clean-up and analysis via GC/ECD, laboratory clean up
procedure is presented in steps including their purposes. The sampling study
performed in the vicinity of Lake Eymir and Ankara Creek and characteristics of
samples is given. Finally, the chemical mass balance model that is used in this study
is explained.

3
Chapter IV presents the results of method selection and validation, preliminary
investigation of polychlorinated biphenyl pollution around Lake Eymir and
investigation of polychlorinated biphenyl pollution in Ankara Creek studies and
related discussions. Firstly, related literature survey and comparison and selection of
analysis methods are described. Secondly, methodology applied for analysis of PCBs
for soil and sediment samples in the study is summarized. Method validation and
improvement studies and quality assurance and control studies are presented.
Secondly, results related to sampling and PCB pollution of Lake Eymir are described
and discussed in terms of pollution sources and similar studies. Furthermore,
pollution results of Ankara Creek is presented and results discussed by comparing
with similar studies and legislation and explaining the effects on human health
throughout the Toxic Equivalent Concentration concept. Finally, the results of CMB
model for Ankara creek sediment samples are discussed.
Finally, the conclusion of the study is presented in Chapter V. The method validation
study, preliminary pollution investigation study done for Lake Eymir and PCB
pollution investigation study done for Ankara Creek are summarized. The major
PCB pollution sources are emphasized according to the findings of CMB model and
recommendations for future studies are described.
4
CHAPTER 2
LITERATURE REVIEW
2.1 GENERAL INFORMATION ABOUT PCBs
PCBs are mixtures of aromatic chemicals, manufactured by the chlorination of
biphenyl in the presence of a suitable catalyst. The chemical formula of PCBs can be
presented as C12H(10-n)Cln, where n is a number of chlorine atoms within the range of
1-10. Chlorine atoms can be placed at sites, varying in the number and position
(Figure 2.1). There are 209 theoretically possible different PCB compounds of PCBs
name as congeners. According to number of chlorine atoms included, PCBs are
grouped named as homologs.
Figure 2.1: Structure of a PCB congener indicating the numbering scheme for
chlorine positions and the nomenclature for positions on the phenyl rings.
PCBs are manufactured by catalytic chlorination of biphenyl. PCBs can be produced
as complex mixtures, having different degrees of chlorine substitution, and hence
different percentages of chlorine (Table 2.1).Commercial formulations of PCBs
fluids contained different degrees of chlorination depending on their intended
application since the properties of the mixture, and hence its application varied with
2 2’ 3’ 3
4 4’
5 5’ 6 6’
ortho meta
para

5
the degree of chlorination. PCB mixtures have several trade names according to
manufacturer and countries that they are produced by. Some of these names are
given in Appendix A. One of the most commonly used trade names of PCBs is
―Aroclor‖. Aroclors are represented by 4 digit numbers. First 2 digits are generally
12 that represent 12 carbon atom included by biphenyl and second 2 digit represent
chlorine percentage of the mixture. Aroclor 1242 has 12 C atom and contains 42%
chlorine. Aroclor 1260 also has 12 C atom and contains 60% chlorine. As an
exception, Aroclor 1016 has 12 C atom but contains 42% chlorine.
Table 2.1: Percent by weight chlorine homolog distribution for Aroclors
Homolog A 1016 A 1242 A 1248 A 1254 A 1260
Mono-chlorobiphenyl
Di-chlorobiphenyl 21.2 14.7
Tri-chlorobiphenyl 51.5 46 20.9 1.8
Tetra-chlorobiphenyl 27.3 30.6 60.3 17.1
Penta-chlorobiphenyl 8.7 18.1 49.3 9.2
Hexa-chlorobiphenyl 0.8 27.8 46.9
Hepta-chlorobiphenyl 3.9 36.9
Octa-chlorobiphenyl 6.3
Nona-chlorobiphenyl 0.7
Source: Frame et al., 1996
2.2 USES OF PCBs
PCBs are resistant to chemical and biochemical degradation processes. They are
excellent dielectrics, stable to thermal, chemical and biological degradation and are
fire resistant. Their thermal stability, chemical stability e.g. general inertness to
oxidation and hydrolysis and dielectric properties have made these very useful in a
variety of industrial applications. These have been in use commercially as dielectric
and heat exchange fluids and in a variety of other applications (Parivesh, 2001). The
subsections below identify and discuss PCB use areas based on their presence in
closed, partially closed, and open systems (UNEP, 1999).
6
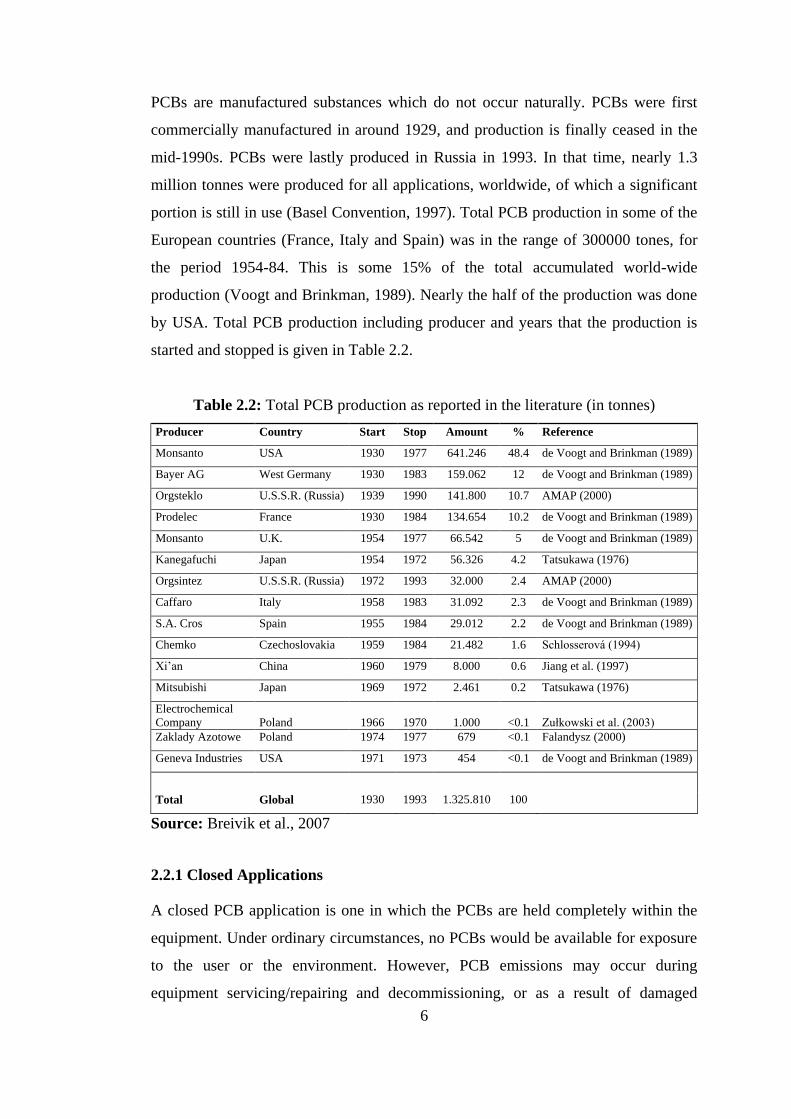
PCBs are manufactured substances which do not occur naturally. PCBs were first
commercially manufactured in around 1929, and production is finally ceased in the
mid-1990s. PCBs were lastly produced in Russia in 1993. In that time, nearly 1.3
million tonnes were produced for all applications, worldwide, of which a significant
portion is still in use (Basel Convention, 1997). Total PCB production in some of the
European countries (France, Italy and Spain) was in the range of 300000 tones, for
the period 1954-84. This is some 15% of the total accumulated world-wide
production (Voogt and Brinkman, 1989). Nearly the half of the production was done
by USA. Total PCB production including producer and years that the production is
started and stopped is given in Table 2.2.
Table 2.2: Total PCB production as reported in the literature (in tonnes)
Producer Country Start Stop Amount % Reference
Monsanto USA 1930 1977 641.246 48.4 de Voogt and Brinkman (1989)
Bayer AG West Germany 1930 1983 159.062 12 de Voogt and Brinkman (1989)
Orgsteklo U.S.S.R. (Russia) 1939 1990 141.800 10.7 AMAP (2000)
Prodelec France 1930 1984 134.654 10.2 de Voogt and Brinkman (1989)
Monsanto U.K. 1954 1977 66.542 5 de Voogt and Brinkman (1989)
Kanegafuchi Japan 1954 1972 56.326 4.2 Tatsukawa (1976)
Orgsintez U.S.S.R. (Russia) 1972 1993 32.000 2.4 AMAP (2000)
Caffaro Italy 1958 1983 31.092 2.3 de Voogt and Brinkman (1989)
S.A. Cros Spain 1955 1984 29.012 2.2 de Voogt and Brinkman (1989)
Chemko Czechoslovakia 1959 1984 21.482 1.6 Schlosserová (1994)
Xi’an China 1960 1979 8.000 0.6 Jiang et al. (1997)
Mitsubishi Japan 1969 1972 2.461 0.2 Tatsukawa (1976)
Electrochemical
Company Poland 1966 1970 1.000 <0.1 Zułkowski et al. (2003)
Zaklady Azotowe Poland 1974 1977 679 <0.1 Falandysz (2000)
Geneva Industries USA 1971 1973 454 <0.1 de Voogt and Brinkman (1989)
Total Global 1930 1993 1.325.810 100
Source: Breivik et al., 2007
2.2.1 Closed Applications
A closed PCB application is one in which the PCBs are held completely within the
equipment. Under ordinary circumstances, no PCBs would be available for exposure
to the user or the environment. However, PCB emissions may occur during
equipment servicing/repairing and decommissioning, or as a result of damaged

7
equipment. The two most significant examples of closed PCB-applications are
capacitors and transformers (UNEP, 1999).
Closed Applications of PCBs (Neumeier,1998; US EPA, 1994; ICF, 1989)
Electrical transformers
Electrical Capacitors: in electrical distribution systems, Lighting ballasts, in
refrigerators, heating systems, air conditioners, hair dryers, water well,
television sets and microwave ovens
Electrical motors: minor usage in some specialized fluid cooled motors
Electric magnets: minor usage in some fluid cooled separating magnets
2.2.2 Partially Closed Applications
Partially closed PCB applications are those in which the PCB oil is not directly
exposed to the environment, but may become so periodically during typical use.
These types of uses may also lead to PCB emissions, through air or water discharge.
Examples of partially closed systems include heat transfer and hydraulic systems,
and vacuum pumps.
Partially Closed Applications of PCBs (Goodwin, 1998; US EPA, 1994; Dobson
and van Esch, 1993)
Application Typical Location(s)
Heat transfer fluids: Inorganic chemical, organic chemical, plastics and
synthetics, and petroleum refining industries
Hydraulic fluids: Mining equipment; aluminum, copper, steel, and iron
forming industries
Vacuum Pumps: Electronic components manufacture; laboratory, instrument
and research applications; and waste water discharge sites
Switches and Voltage Regulatorsa : Electric utilities
Liquid Filled Electrical Cablesa: Electric utilities, and private generation
facilities (e.g. military installations)
Liquid Filled Circuit Breakersa: Electric utilities
a These applications were not generally designed to contain PCB materials but
may have become contaminated through regular maintenance and servicing.

8
2.2.3 Open Applications
Open systems are applications in which PCBs are in direct contact with their
surroundings and thereby may be easily transferred to the environment. Direct PCB
contact with the environment is of greater concern for open uses than it is for closed
applications.
Open Applications of PCBs (Neumeier, 1998; Fiedler, 1997; Jakobi, 1996;
Dobson and van Esch, 1993)
Lubricants: Immersion oils for microscopes (mounting media), Brake linings,
Cutting oils, Lubricating oils (Natural gas air compressors)
Casting Waxes: Pattern waxes for investment castings
Adhesives: Special adhesives, Adhesives for waterproof wall coatings
Surface Coatings: Paints (Paint on the undersides of ships), Surface treatment
for textiles, Carbonless copy paper (pressure sensitive), Flame retardants (On
ceiling tiles, On furniture and walls), Dust Control (Dust binders, Asphalt,
Natural gas pipelines)
Plasticizers: Gasket sealers, Filling material in joints of concrete, PVC
(polyvinyl chloride plastics), Rubber seals (Around vents, Around doors and
windows)
Inks: Dyes, Printing inks
Other Uses: Insulating materials, Pesticidesa
a Scrap transformer fluid has been used as an ingredient in pesticide formulas.
2.3 DISTRIBUTION IN NATURE
The manufacture, processing, distribution, and use of PCBs are widely prohibited. In
Stockholm Convention on Persistent Organic Pollutants (2004), PCBs are in the list
of POPs that production and environmental releases have to be eliminated since this
action is greatly benefit human health and the environment. In the convention, it is
also stated that, since they are no longer produced, hundreds of thousands of tons are
still in use in electrical transformers and other equipment. Moreover, there are
exemptions given to certain uses of PCBs, the incidental production of PCBs and

9
recycling operations. PCB containing wastes are produced and distributed through
several pathways (Stockholm Convention, 2004; UNEP, 1999)
2.3.1 PCB Containing Waste Generation and Distribution
PCBs in Used Oil: recycling of used oil containing PCB;
Navigational Dredging of PCB-Contaminated Waters and Sediments:
dredging of the bottom to allow ship navigation and use of PCB containing
hydraulic fluids in mining equipment;
Repair and Decommissioning of Equipment: the repair and maintenance of
PCB-containing equipment, leakages and disposal of PCB-containing
equipment;
Building Demolition: causing PCB contaminated wastes since PCBs are
commonly used in buildings (in concrete structures, flame-retardant,
fluorescent light ballasts, coatings on furnishings, surface treatments for
textiles, adhesives for waterproof wall coatings, paints, insulating materials,
sealant putties, and large and small capacitors (found in appliances and
electrical devices);
Volatilization and Leaching from Landfills: deposition of PCB containing
material and sewage sludge in landfills;
Recycling Operations: recycling PCB containing material and renewing and
reusing them;
Incinerators: emissions during the incineration of PCB containing wastes and
sewage sludge;
Inadvertent Production by Organic Chemical Manufacturing and Use
Industries: inadvertently production PCB-laden materials in the organic
pigment, pesticide, chemical, and aluminum refining industries (UNEP, 1999)
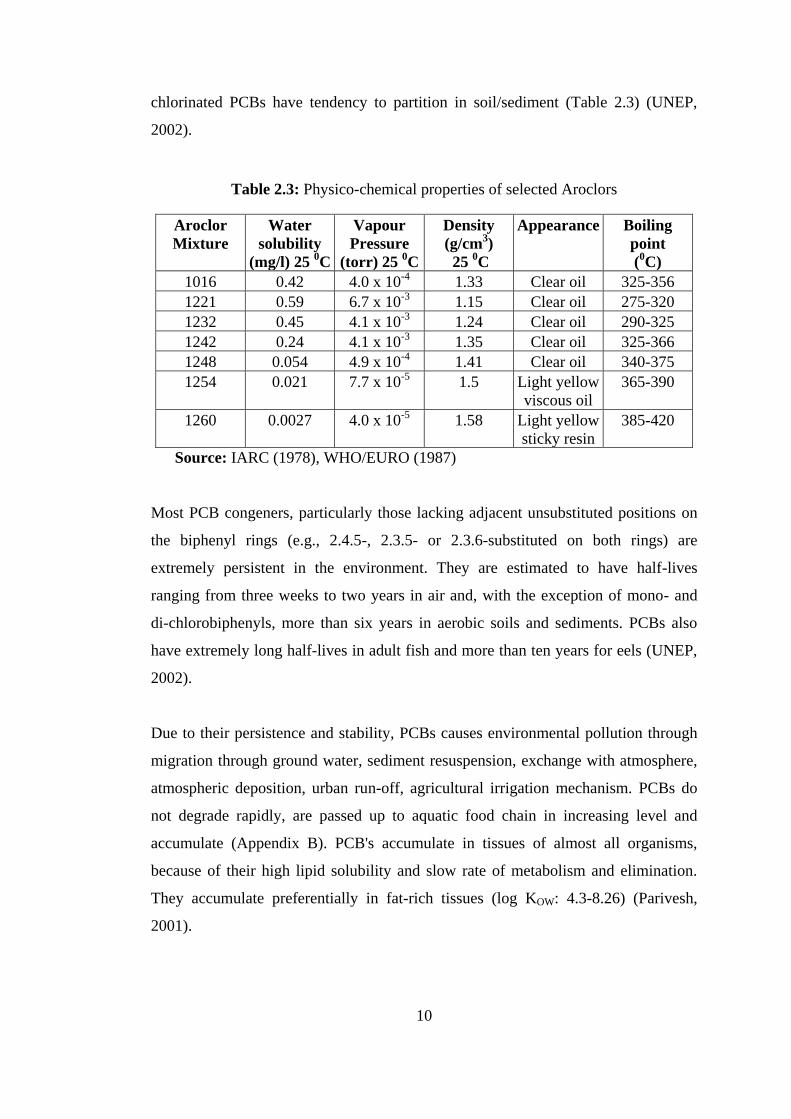
2.3.2 Fate and Transport of PCBs
PCBs are hydrophobic substances and their water solubility decreases with
increasing chlorination (0.01 to 0.0001 μg/L at 25°C). Congeners that have higher
chlorine, have lower vapor pressure and vapor pressure is in the range of 1.6-0.003 x
10-6 mm Hg at 20°C. Due to low water solubility and vapor pressure, higher
10
chlorinated PCBs have tendency to partition in soil/sediment (Table 2.3) (UNEP,
2002).
Table 2.3: Physico-chemical properties of selected Aroclors
Aroclor
Mixture
Water
solubility
(mg/l) 25 0C
Vapour
Pressure
(torr) 25 0C
Density
(g/cm3)
25 0C
Appearance Boiling
point
(0C)
1016 0.42 4.0 x 10⁻⁴
1.33 Clear oil 325-356
1221 0.59 6.7 x 10⁻³
1.15 Clear oil 275-320
1232 0.45 4.1 x 10⁻³
1.24 Clear oil 290-325
1242 0.24 4.1 x 10⁻³
1.35 Clear oil 325-366
1248 0.054 4.9 x 10⁻⁴
1.41 Clear oil 340-375
1254 0.021 7.7 x 10⁻⁵
1.5 Light yellow
viscous oil
365-390
1260 0.0027 4.0 x 10⁻⁵
1.58 Light yellow
sticky resin
385-420
Source: IARC (1978), WHO/EURO (1987)
Most PCB congeners, particularly those lacking adjacent unsubstituted positions on
the biphenyl rings (e.g., 2.4.5-, 2.3.5- or 2.3.6-substituted on both rings) are
extremely persistent in the environment. They are estimated to have half-lives
ranging from three weeks to two years in air and, with the exception of mono- and
di-chlorobiphenyls, more than six years in aerobic soils and sediments. PCBs also
have extremely long half-lives in adult fish and more than ten years for eels (UNEP,
2002).
Due to their persistence and stability, PCBs causes environmental pollution through
migration through ground water, sediment resuspension, exchange with atmosphere,
atmospheric deposition, urban run-off, agricultural irrigation mechanism. PCBs do
not degrade rapidly, are passed up to aquatic food chain in increasing level and
accumulate (Appendix B). PCB's accumulate in tissues of almost all organisms,
because of their high lipid solubility and slow rate of metabolism and elimination.
They accumulate preferentially in fat-rich tissues (log KOW: 4.3-8.26) (Parivesh,
2001).
11
2.3.3 Human Health Considerations
In more specifically human terms, the toxic effects elicited by PCBs have included
body weight loss, impaired immune function, teratogenicity and reproductive
problems, dermal effects, a role in modulating carcinogensis and carcinogenicity, and
effects on the liver. Non-carcinogenic effects of PCBs include chloracne, a reversible
dermatological problem, and effects on the central nervous system, causing
headaches, dizziness, depression, nervousness and fatigue. Also included, and
deriving from chronic exposure, are changes to the liver and related enzyme
activities (Basel Convention, 1997).
2.4 REGULATIONS ON PCBS
2.4.1 International Efforts on Regulation of PCBs
As awareness of the environmental problems associated with PCBs grew, so its use
was progressively restricted. The most influential force leading to these restrictions
has been a 1973 recommendation from the Organization for Economic Co-operation
and Development (OECD) (WHO, 1976; IARC, 1978; OECD, 1982). The first
regulation on PCBs applied by the EEC was in 1976 when their usage was restricted
to closed circuits; the second one, in 1985, when the use of PCB as a raw material or
chemical intermediate was banned. Finally, in 1987, the usage of PCBs was
completely banned in new closed circuits and a Directive issued in September 1996
(96/59) imposes the total elimination before December 2010. The UNEP Strategic
Action Program for the Mediterranean has also included the phasing out of PCBs in
2010 (UNEP/MAP, 1999) (UNEP, 2002). For Turkey, PCBs was restricted by
ratification of Stockholm Convention on Persistent Organic Pollutants.
Stockholm Convention on Persistent Organic Pollutants
The Stockholm Convention on Persistent Organic Pollutants is a global treaty to
protect human health and the environment from chemicals that remain intact in the
environment for long periods, become widely distributed geographically and
accumulate in the fatty tissue of humans and wildlife. The Stockholm Convention
was adopted in 2001 and entered into force 2004 by the Parties to take measures to

12
eliminate or reduce the release of POPs into the environment. The Convention is
administered by the United Nations Environment Programme and based in Geneva,
Switzerland (Stockholm Convention, 2004).
An initial target list of 12 POPs (aldrin, chlordane, DDT, dieldrin, endrin, heptachlor,
mirex, toxaphene, polychlorinated biphenols or PCBs, hexachlorobenzene, dioxins
and furans) is illustrated for elimination and replacement of chemicals and pesticides.
According to Convention, Governments have until 2025 to phase out the uses of
PCBs, which give them time to arrange for PCB-free replacements. Not later than
2028, governments must dispose of these PCBs in an environmentally sound manner
(Stockholm Convention, 2004).
For Turkey, convention is ratified in 2001 and in the scope of the Convention, a
National Implementation Plan (NIP) is prepared and reported at January 2008. An act
regarding ratification of the convention and being a party has been published in
Official Gazette (Dated: 14 April 2009, Numbered: 27200) and the act has been
accepted by the Council of Ministers at 30 July 2009 ((Official Gazette, Numbered:
27200). The full accession of Turkey to convention will come into being in January
2010 and this will increase the degree of responsibility for Turkey.
2.4.1 Turkish Regulation on PCBs
By-law of Hazardous Chemicals (Official Gazette: 11.07.1993 No: 21634)
The aim of this by-law is to control hazardous chemicals and regulate administrative
and technical procedures for eliminating affects on environment and human health.
Use of PCBs were firstly banned by this by-law beginning from 01.01.1996.
By-law of Waste Management (Official Gazette: 05.07.2008 No: 26927)
The aim of this by-law is to determine general principles of waste management
including their production to disposal by eliminating affects on environment and
human health. PCB is included in the Waste List (Annex-IV) of this by-law.
13
Waste List (Annex-IV)
13 01 01 Waste Hydrolic Oils including PCBs
13 03 01 Waste Isolation and Thermal Conduction Oils Including PCBs
16 01 09 End-of-life Vehicles and Waste caused by their servicing- PCBs including
parts
16 02 09 Wastes of Electrical and Electronic Equipment – Transformers and
Capacitors including PCBs
16 02 10 Wastes of Electrical and Electronic Equipment - Residual Equipment
including PCB or Contaminated with PCBs, except 16 02 09
17 09 02 Other Construction and destruction Wastes including PCBs
By-law of Control of Hazardous Wastes (Official Gazette: 14.03.2005 No: 25755)
The aim of this by-law is to;
a) Prevent discharge of hazardous wastes as it directly or indirectly effects
environment and human health,
b) Control production and transportation of hazardous wastes,
c) Interdict importation and control exportation of hazardous wastes,
d) Provide required technical and administrative standards on managing
hazardous wastes,
e) Minimize production,
f) Provide elimination at the nearest possible area in case production is
necessary,
g) Construct sufficient treatment plants and monitor them,
h) Provide environmentally sound management.
This by-law contains all PCBs and all equipments and liquids contaminated by PCBs
in the scope of hazardous waste.
By-law of Control of Waste Oils (Official Gazette: 30.07.2008 No: 26952)
The aim of this by-law is to;
a) Prevent discharge of hazardous wastes as it directly or indirectly effects
environment and human health,
14
b) Storage, transportation and elimination without affecting environment and
human health,
c) Develop required standards of management of waste oils
d) Construct storage and recycling plants and determine related principles,
policies and programs for environmentally sound management of them.
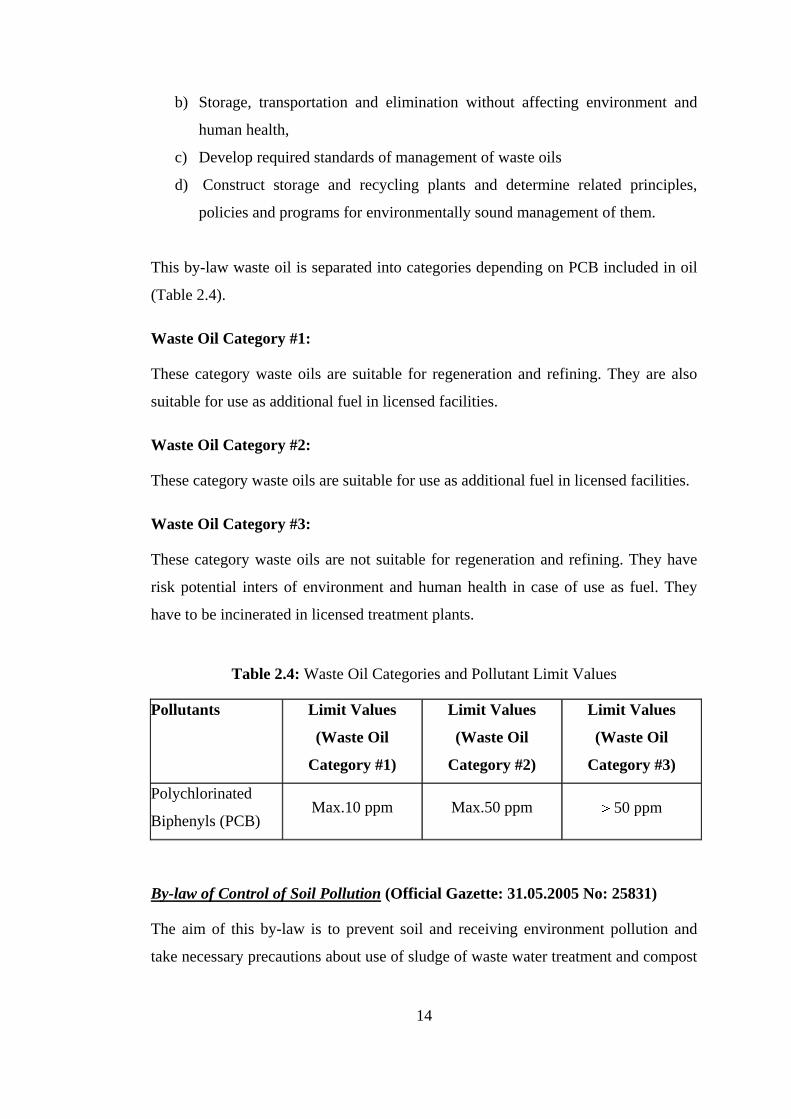
This by-law waste oil is separated into categories depending on PCB included in oil
(Table 2.4).
Waste Oil Category #1:
These category waste oils are suitable for regeneration and refining. They are also
suitable for use as additional fuel in licensed facilities.
Waste Oil Category #2:
These category waste oils are suitable for use as additional fuel in licensed facilities.
Waste Oil Category #3:
These category waste oils are not suitable for regeneration and refining. They have
risk potential inters of environment and human health in case of use as fuel. They
have to be incinerated in licensed treatment plants.
Table 2.4: Waste Oil Categories and Pollutant Limit Values
Pollutants Limit Values
(Waste Oil
Category #1)
Limit Values
(Waste Oil
Category #2)
Limit Values
(Waste Oil
Category #3)
Polychlorinated
Biphenyls (PCB) Max.10 ppm Max.50 ppm 50 ppm
By-law of Control of Soil Pollution (Official Gazette: 31.05.2005 No: 25831)
The aim of this by-law is to prevent soil and receiving environment pollution and
take necessary precautions about use of sludge of waste water treatment and compost

15
on soil. In the list of ―Soil Pollutants Limit Values‖ list of this by-law (Annex-I-A
(b)), limit value for PCBs after treatment for polluted soil is 0.5 mg/kg (dry soil).
By-law of Control of PCB and PCT (Official Gazette: 27.12.2007 No: 26739)
The aim of this by-law is to provide controlled elimination of PCBs and PCTs and
determining principles, policies and programs on cleaning and elimination of
equipments containing PCBs and PCTs and/or waste PCBs and PCTs.
In this by-law, equipments containing PCBs more than 5 lt or 500 ppm have to be
recorded in an inventory. If PCB content is less than 50 ppm, equipments can be
demounted and parts can be used but PCB contaminated parts eliminated separately.
If PCB content is more than 50 ppm, equipments have to be cleaned before
demounting and every metal part have to be cleaned after demounting. Non-metal
parts have to be collected separately.
By-law of Control of Production, Placing on the Market and Use of Some
Hazardous Substances, Concoctions and Commodities (Official Gazette:
26.12.2008 No: 27092)
The aim of this by-law is to protect human health and environment by controlling the
production, use and placing on the market of some hazardous substances. This by-
law includes arrangements for PCBs;
1) PCBs must not be produced, be used for any production and be placed on the
market for sale and use.
2) Products including PCBs must not be placed on the market.
3) Equipments and liquids that is still in use;
a. Closed system electrical equipments such as transformers, resistors and
inductors,
b. Capacitors that weighs 1 kg or more,
c. Small capacitors,
d. Closed system heat transfer liquids,
e. Hydraulic liquids that is used for mining equipments
can be used until the end of the machine time or disposal.

16
2.5 CURRENT STATE OF PCB POLLUTION IN TURKEY
PCBs were not produced in Turkey; however, they were imported into Turkey.
Although import of PCBs were restricted by the By-law of Hazardous Chemicals in
2001, import records show that they were imported after that date as well. The
amount of PCBs, PCTs and PBBs imported into Turkey between 1996 and 2005 are
given in Table 2.5. Official import records were not kept for PCBs individually. No
specific import record of PCB is present until 1996 because PCBs were grouped
under ―other type of concoctions used in the chemical industry‖. For the years 1996-
2003, import data is given in total amount of PCBs, PCTs and PBBs since they have
a common custom number. Although they are not individual records of PCBs, they
provide some idea as to the import of PCBs.
Table 2.5: Import Data of PCBs, PCTs and PBBs for 1996-2005
Year Country Import (kg)
1996 Germany 540
Belgium-Luxembourg 29190
France 1162
Ireland 2000
Italy 5950
Total 38842
1997 Germany 26612
Austria 543
Belgium-Luxembourg 113
England 18000
Italy 3783
Total 49051
1998 Spain 595
Total 595
1999 Germany 7756
Total 7756
2000-2005 & Germany 20
January 2006 Belgium-Luxembourg 100
Italy 490
Total 610
Total 96259
17
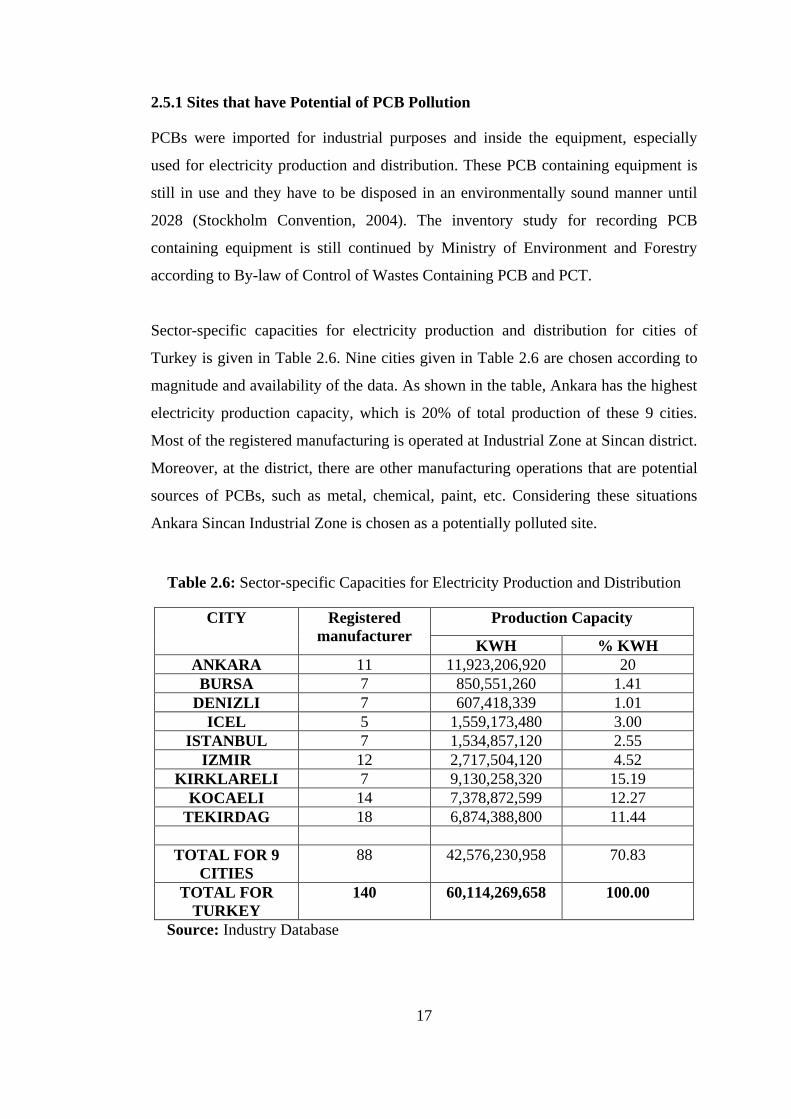
2.5.1 Sites that have Potential of PCB Pollution
PCBs were imported for industrial purposes and inside the equipment, especially
used for electricity production and distribution. These PCB containing equipment is
still in use and they have to be disposed in an environmentally sound manner until
2028 (Stockholm Convention, 2004). The inventory study for recording PCB
containing equipment is still continued by Ministry of Environment and Forestry
according to By-law of Control of Wastes Containing PCB and PCT.
Sector-specific capacities for electricity production and distribution for cities of
Turkey is given in Table 2.6. Nine cities given in Table 2.6 are chosen according to
magnitude and availability of the data. As shown in the table, Ankara has the highest
electricity production capacity, which is 20% of total production of these 9 cities.
Most of the registered manufacturing is operated at Industrial Zone at Sincan district.
Moreover, at the district, there are other manufacturing operations that are potential
sources of PCBs, such as metal, chemical, paint, etc. Considering these situations
Ankara Sincan Industrial Zone is chosen as a potentially polluted site.
Table 2.6: Sector-specific Capacities for Electricity Production and Distribution
CITY Registered
manufacturer
Production Capacity
KWH % KWH
ANKARA 11 11,923,206,920 20
BURSA 7 850,551,260 1.41
DENIZLI 7 607,418,339 1.01
ICEL 5 1,559,173,480 3.00
ISTANBUL 7 1,534,857,120 2.55
IZMIR 12 2,717,504,120 4.52
KIRKLARELI 7 9,130,258,320 15.19
KOCAELI 14 7,378,872,599 12.27
TEKIRDAG 18 6,874,388,800 11.44
TOTAL FOR 9
CITIES
88 42,576,230,958 70.83
TOTAL FOR
TURKEY
140 60,114,269,658 100.00
Source: Industry Database
18
One of the most common PCB pollution cause is spills and leakages during
maintenance of PCB containing equipment such as transformers. There is TEDAġ
central transformer repair and oil change station near Eymir Lake in Ankara.
Preliminary sediment and soil sample analysis illustrated pollution of PCBs. It was
measured 0.53-464.4 g/g Aroclor 1260 for soil and 2.7-196.2 ng/g Aroclor 1260 for
sediment samples (Yeniova, 1998). Therefore, Eymir Lake region, especially, the
natural canal between transformer repair and oil change station and the lake, is
chosen as a potential polluted site.
In the scope of the investigation study, a research was done on other potentially
contaminated sites. Polychlorinated organic compounds (PCBs) are found in solid
(waxy) and liquid (oily) forms in equipment and materials on ships being scrapped
(US EPA, 2000). The study done by Greenpeace in Izmir Aliaga ship breaking Yards
illustrates PCB pollution in the region (Greenpeace, 2002). There is also an
environmental pollution study done by Cetin et al. in 2007 for industrial and urban
ambient air samples that illustrates PCB pollution. Therefore, Izmir Bay is also
designated as a potential polluted site.
By considering, manufacturing operations that are potential sources of PCBs in the
Industrial zone and environmental pollution study performed by Telli-Karakoc et al.
in 2002, Ġzmit Bay is also designated as a potential polluted site.
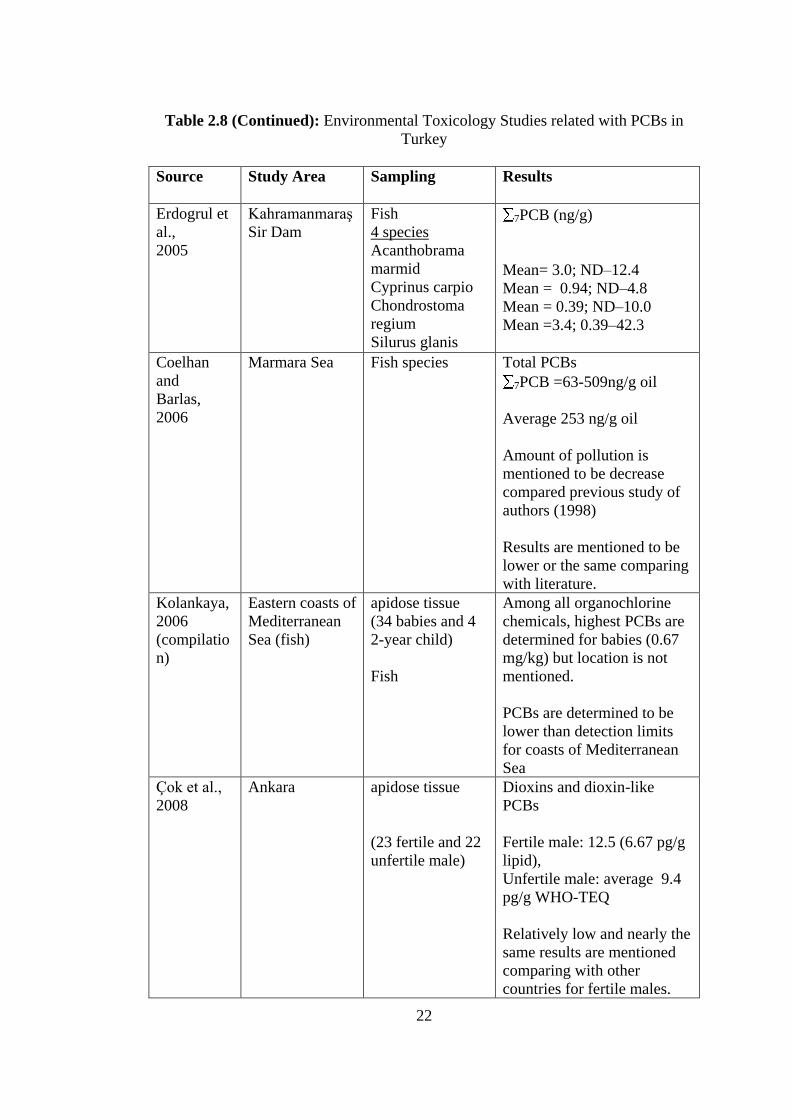
2.5.2 Environmental Pollution and Toxicology Studies for Turkey
PCB pollution determination studies are important that they designate polluted
regions. Environmental pollution and environmental toxicology studies were
performed for many regions of Turkey. A compilation of these studies, done for air,
soil, sediment, waste, fish species, human milk and apidose tissue, are given in Table
2.7 and Table 2.8

19
Table 2.7: Environmental Pollution Studies related with PCBs in Turkey
Source Study Area Sampling
Results
Bastürk et al.,
1980
Mediterranean
Sea
Mersin-
Tasucu
Sediment
Samples
8 stations
3-4 ng/g (dry weight) PCBs
around estaurine of Tarsus and
Seyhan rivers as Aroclor 1254
Yeniova,
1998
Ankara
Lake Eymir -
Around
laboratory of
TEDAġ
station, canal
between
Mogan and
Eymir Lakes
15 soil
samples
20
sediment
samples
0.53-464.4 g/g Aroclor 1260
2.7-196.2 ng/g Aroclor 1260
Pollution determined for 55% of
the samples.
Telli-
Karakoç
et al.,
2002
Marmara Sea:
Ġzmit Bay
Sea water
Mussels
9 stations
Total PCBs: 2-26.3 ng/l at 8
stations
Total PCBs: 4.6-28.1 ng/g at 7
stations
Fillmann
et al.,
2002
Blacksea:
Bosphorus
Surface
Sediment
10 stations
Aroclor 1254: 0.3-1 ng/g
Aroclor 1260: <0.06-1.55 ng/g
13PCB: <0.005-0.71 ng/g
Aydın et al.,
2003
Konya
Aslım
Dumpsite
Waste
Samples
Newly
wasted
Middle-
aged
Old wastes
6PCB
Average: 0.13-18.5 ng/g
Maximum: 0.11-35.95 ng/g
Average: 6.21-282.2 ng/g
Maximum: 4.03-563 ng/g
Average: 1.08-20.66 ng/g
Maximum: 1.86-41.31 ng/g
Kurt and
Özkoç,
2004
Blacksea
Sinop,
Samsun-
Yalıköy
Sea water
Mussels
6 stations
PCB pollution is not detected (as
Aroclor 1260 ve 1254) (Detection
limit: 24 pg/g, 0.2 ng/l).
Cindoruk et
al.,2007;
Cindoruk et
al.,2008;
Cindoruk and
Tasdemir,
2007a; b; 2008
Bursa
atmosphere
Industrial
and urban
ambient
air and
particulate
matter
Global transportation of PCBs,
dominant pollution of low
chlorinated PCB congeners and
relatively low concentrations
compared with urban atmospheric
data of other countries were
reported.

20
Table 2.7 (Continued): Environmental Pollution Studies related with PCBs in
Turkey
Source
Study Area
Sampling
Results
Cetin et
al.,
2007
Izmir
Industrial
ambient air
Urban
ambient air
Winter (6 samples): 36PCB: 1371
pg/m3
Summer (6 samples): 36PCB: 3137
pg/m3
Winter (6 samples): 36PCB: 847
pg/m3
Summer (6 samples): 36PCB: 314
pg/m3
(Particulate matter, PM10, gas
sampling)
Odabası
et al.,
2008
Izmir Bay
Güzelyalı
Harbour
Water and
air samples
Filtered water:
Winter : 29PCB: 132±31 pg/L,
Summer: 29PCB: 205± 88 pg/L,
Particulate Matter:
Winter :1118±33 pg/L,
Summer: 181± 63 pg/L,
Table 2.8: Environmental Toxicology Studies related with PCBs in Turkey
Source
Study Area
Sampling
Results
Bastürk et al.,
1980
Mediterranean
Sea
Mersin-
Tasucu
82 fish samples
67 shellfish
samples
Aquatic fauna: <2-39 ng/g oil
Sediment: <2-4ng/g dry
weight (as Aroclor 1254)
Results were seen to be lower
compared to North Atlantic
Ocean and other Mediterranean
countries.
Tanabe et al.,
1997
Black Sea:
Sinop
and Yakakent
Harbour
porpoises
Fish (7 species)
1600-39000 ng/g
130-3500 ng/g

21
Table 2.8 (Continued): Environmental Toxicology Studies related with PCBs in
Turkey
Source
Study Area
Sampling
Results
Yeniova,
1998
Ankara
Human milk
(50 samples)
Apidose tissue
(50 samples)
PCB pollution was not
determined in human milk
(as Aroclor 1260)
Apidose tissue: 780 ng/g
oil (as Aroclor 1260)
(Pollution determined for
the 55% of the samples)
Coelhan and
Barlas, 1998
Marmara Sea
(Istanbul),
Mediterranean
Sea
(Anamur)
Fish
(5 + 5 samples),
2 stations as
Istanbul and
Anamur
Marmara Sea:
6PCB: 169-652 ng/g oil,
Mediterranean Sea:
6PCB: 90-914 ng/g oil
PCB #101 is dominant for
Mediterranean Sea
PCB #138 and #153 are
dominant for
Marmara Sea
PCB pollution in
Mediterranean Sea
is higher than Marmara
sea.
Arınç
2000
Izmir Bay 3 fish species
8 stations and 1
reference station
Increase of EROD
activities of fish species
living inside the bay is
said to cause by increasing
PCBs and/or PAHs and
other pollutants.
Küçüksezgin
et al.,2001
Aegean Sea
coasts
Fish
(216 samples)
12 stations
PCB pollution is not
determined.
Çok et al.,
2003
Ankara Human milk 7PCB: 5.7-110 ng/g
Çok et al.,
2004
Ankara
Human apidose
tissue
7PCB 5.0-141.7 ng/g
PCBs= 383.3 ng/g
Erdogrul et
al.,
2004
KahramanmaraĢ
Human milk
8PCB= 0.03-0.34 ng/g
PCBs= 1.08 ng/g
22
Table 2.8 (Continued): Environmental Toxicology Studies related with PCBs in
Turkey
Source
Study Area
Sampling
Results
Erdogrul et
al.,
2005
KahramanmaraĢ
Sir Dam
Fish
4 species
Acanthobrama
marmid
Cyprinus carpio
Chondrostoma
regium
Silurus glanis
7PCB (ng/g)
Mean= 3.0; ND–12.4
Mean = 0.94; ND–4.8
Mean = 0.39; ND–10.0
Mean =3.4; 0.39–42.3
Coelhan
and
Barlas,
2006
Marmara Sea Fish species
Total PCBs
7PCB =63-509ng/g oil
Average 253 ng/g oil
Amount of pollution is
mentioned to be decrease
compared previous study of
authors (1998)
Results are mentioned to be
lower or the same comparing
with literature.
Kolankaya,
2006
(compilatio
n)
Eastern coasts of
Mediterranean
Sea (fish)
apidose tissue
(34 babies and 4
2-year child)
Fish
Among all organochlorine
chemicals, highest PCBs are
determined for babies (0.67
mg/kg) but location is not
mentioned.
PCBs are determined to be
lower than detection limits
for coasts of Mediterranean
Sea
Çok et al.,
2008
Ankara apidose tissue
(23 fertile and 22
unfertile male)
Dioxins and dioxin-like
PCBs
Fertile male: 12.5 (6.67 pg/g
lipid),
Unfertile male: average 9.4
pg/g WHO-TEQ
Relatively low and nearly the
same results are mentioned
comparing with other
countries for fertile males.
23
2.5.3 This Study
In the scope of this study, Eymir Lake and Ankara Sincan Industrial Zone is chosen
as potentially contaminated sites and investigation studies are performed for Ankara
Creek that passes through the industrial zone and in the vicinity of Lake Eymir.
A preliminary PCB pollution investigation around Lake Eymir is performed where a
TEDAġ central transformer repair and oil change station is suspected to pollute the
lake via a canal discharging into the lake. Furthermore, a pollution investigation
study is performed in Sincan Industrial Zone in Ankara. One of the arms of Sakarya
River, namely Ankara Creek, passes through the Industrial Zone. In addition to the
discharges from industries located in the Industrial Zone, Ankara Creek is also
expected to be polluted by the dump site located at the upstream of the Industrial
Zone and by the municipal waste water treatment plant at the downstream of the
zone (Maps of the area are given in Appendix D).
24
CHAPTER 3
MATERIALS AND METHOD
3.1 PCB ANALYSIS METHODS
For analysis of PCBs for soil and sediment samples, US Environmental Protection
Agency methods are decided to be used. Methods that are implemented for
extraction, clean-up and analysis of PCBs and their purpose of use are listed below.
1) EPA Method 3540C Soxhlet Extraction: Extraction of PCBs from
sediment/soil samples
2) EPA Method 3660B Sulfur Cleanup: Elimination of sulfur in the extract
3) EPA Method 3665A Sulfuric Acid-Permanganate Cleanup: Elimination of
most chlorinated organics (especially pesticides)
4) EPA Method 3630C Silica Gel Cleanup: Elimination of interfering
compounds
5) EPA Method 8082A PCBs by Gas Chromatography: Analysis of PCBs in the
extract using GC/Electron Capture Detector
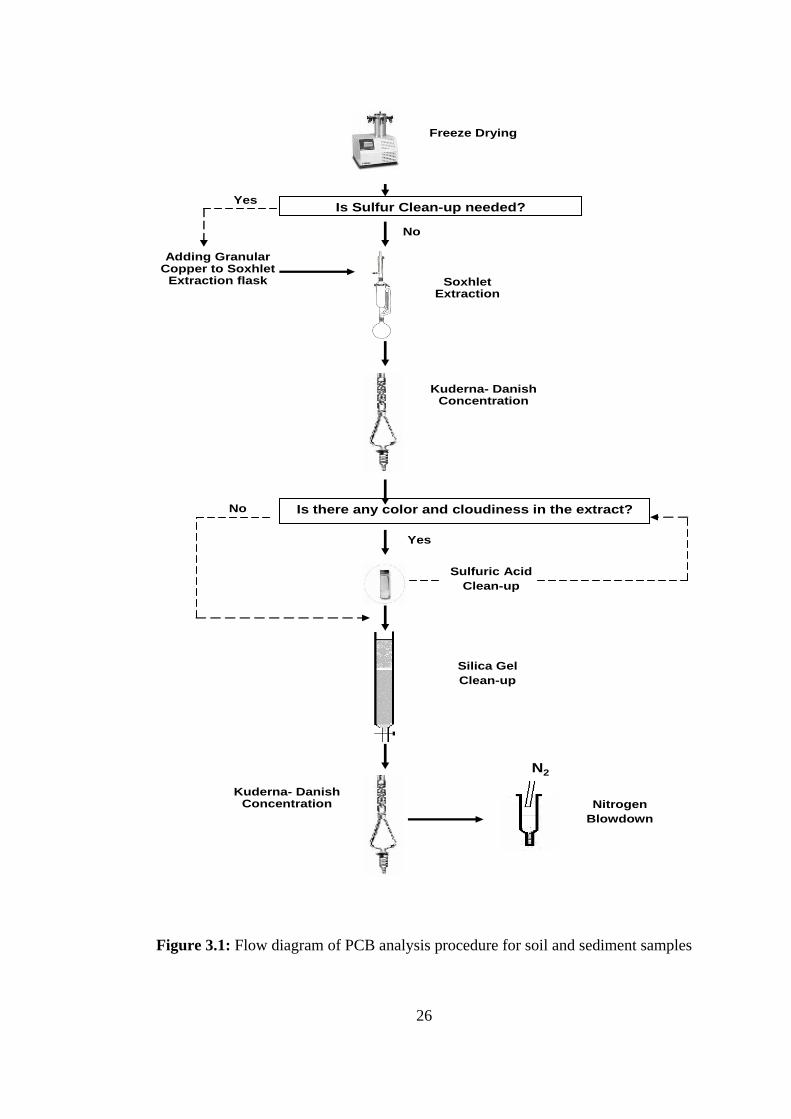
3.1.1 PCB Extraction and Analysis
In order to perform analyses on the basis of dry matter, samples are dried by freeze-
dryer. 20 gr of dried sample is with extraction solvent (Acetone/Hexane (1:1) (v/v))
in Soxhlet extractor for extract PCBs to solvent. Sulfur clean-up is applied by adding
cleaned granular copper to Soxhlet extraction flask. After extraction, extract is dried
by passing it through a drying column containing of anhydrous sodium sulfate.
Drying column is eluted with hexane to complete the quantitative transfer of PCBs.
The dried extract is collected in a K-D concentrator and concentrated to 10 mL by

25
Kuderna-Danish (KD) concentration. Sulfuric Acid Clean-up is applied by mixing
extract with Sulfuric Acid/water (1:1) (v:v) mixture and removing cleaned extract for
eliminating most chlorinated organic compounds. For elimination of interfering
compounds, extract is transferred to a chromatographic column of deactivated silica
gel, topped with dried sodium sulfate and eluted with hexane. Extract and elution
solvent is collected in a K-D concentrator and concentrated to 10 mL. Extraction
solvent is exchanged to hexane by adding 50 mL of hexane. After solvent exchange,
extract is concentrated to 10 mL and it is further concentrated to 2 mL by Nitrogen
blowdown technique if it is necessary. Extract is analyzed by GC/ECD. Flow
diagram that shows the analyses procedure is given in Figure 3.1
26
Figure 3.1: Flow diagram of PCB analysis procedure for soil and sediment samples
Freeze Drying
SoxhletExtraction
Kuderna- DanishConcentration
Sulfuric Acid
Clean-up
Silica Gel
Clean-up
Is Sulfur Clean-up needed?Yes
No
Adding GranularCopper to Soxhlet
Extraction flask
Is there any color and cloudiness in the extract?
Yes
No
Kuderna- DanishConcentration
N2
Nitrogen
Blowdown

27
Freeze-drying:
In order to perform analyses on the basis of dry matter, samples are dried by freeze-
dryer. Freeze drying is done by Christ Alpha 1–4 Freeze-dryer. Freeze dryer works
by freezing water included in sample. Inside pressure is decreased by vacuum and
moisture is removed by sublimation (Cameron, 1997).
Working Conditions:
Shelf Temperature: 11 C
Inlet Temperature: -40 C
Vacuum Pressure: 650-700 mm Hg
Soxhlet Extraction:
The aim of Soxhlet extraction is to provide complete transfer
of PCBs from soil/sediment to extraction solvent. 20 g of the
solid sample is place in a paper extraction thimble. The
extraction thimble must drain freely for the duration of the
extraction period. 1 mL of the surrogate standard spiking
solution (Tetrachloro-m-xylene) is added onto the sample.
300 mL of the extraction solvent (Acetone/Hexane (1:1)
(v/v)) is placed into a 500-mL round bottom flask containing
two clean boiling chips. The flask is attached to the extractor
and the sample is extracted 17 hours at nearly 5 cycles/hour.
The extract is allowed to cool after the extraction is complete
(EPA Method 3540C).

28
Sulfur Clean-up:
The aim of Sulfur clean-up is to eliminate sulfur in the extract and prevent sulfur
interference. Sulfur clean-up is applied by adding 2 spoons of cleaned granular
copper to Soxhlet extraction flask. Oxides of granular copper is removed by treating
with dilute sulfuric acid, rinsed with organic-free reagent water to remove all traces
of acid (pH of reagent water is checked) (EPA Method 3660B).
Sodium Sulfate Cleanup:
The extract is dried via sodium sulfate since water increases the concentration time in
KD concentration and cause loss of PCBs and water can cause damage in gas
chromatographic columns. Sodium sulfate (granular, anhydrous) is purified by
heating at 400 C for 4 hours in a shallow tray. Sample extract is dried by passing it
through a drying column containing about 10 cm of anhydrous sodium sulfate. The
extractor flask and sodium sulfate column is washed with 125 mL of hexane to
complete the quantitative transfer. Dried extract and elution solvent are collected in a
KD concentrator (EPA Method 3540C).
Kuderna Danish (KD) Concentration:
Extract is concentrated via KD concentration before applying clean-up procedures.
Two clean boiling chips to the flask of KD concentrator and a three-ball Snyder
column are attached. The Snyder column is prewetted by adding about 1 mL of
methylene chloride to the top of the column. The KD apparatus is placed on a hot
water bath (95 C) so that the concentrator tube is partially immersed in the hot water
and the entire lower rounded surface of the flask is bathed with hot vapor. The
vertical position of the apparatus is adjusted, flask is covered with towel. Suction
device is kept closed. At the proper rate of distillation the balls of the column will
actively chatter, but the chambers will not flood. When the apparent volume of liquid
reaches 10 mL, the KD apparatus is removed from the water bath and allowed to
drain and cool for at least 10 minutes (EPA Method 3540C).
Sulfuric Acid Clean-up:
For elimination of most chlorinated compounds, especially pesticides, sulfuric acid
clean-up is performed. Sulfuric Acid/water (1:1) (v:v) mixture by using 99% sulfuric

29
acid and distilled water. 5 mL of Sulfuric Acid/water (1:1) (v:v) solution is placed in
20 mL vial and 10 mL extract is transferred to the vial by 10 mL volumetric pipet.
They are mixed with vortex mixture for 1-2 minutes, waited for separation of phases
and 8 mL of extract is removed to a new 15 mL vial by the help of a syringe. If the
extract is still colored and cloudy, procedure is repeated. 8 mL extract is mixed with
5 mL of Sulfuric Acid/water (1:1) (v:v) solution and waited for phase separation. 6
mL of the extract is removed by a syringe. Losses caused by these applications are
considered in the calculation. GC results are divided by 80% for primary clean-up
and by 60% for secondary clean-up (EPA Method 3665A).
Silica Gel Clean-up:
In order to eliminate interfering compounds, extract is cleaned by passing through a
Silica Gel column. Silica Gel (100/200 mesh) is used. Before use, Silica gel is
activated for 16 hr. at 130 C in a shallow glass tray, loosely covered with foil. It is
deactivated to 4.5% with reagent water in a 500 mL glass jar. The contents are mixed
thoroughly and allowed to equilibrate for 6 hours. Deactivated silica gel is stored in a
sealed glass jar inside a desiccator. 13 mm ID glass chromatographic column is filled
with a small pad of Pyrex® glass wool to retain the adsorbent. The glass wool pad
and the column are precleaned with 50 mL of acetone followed by 100 mL of
hexane. Column and the funnel on the column are filled with hexane. A 3 g portion
of deactivated silica gel is transferred into the column and topped with 2 to 3 cm of
anhydrous sodium sulfate. Column is packed by tapping with o wooden bar. Hexane
is released and elution is stopped just prior to exposure of the sodium sulfate layer to
air. The sample extract (6 or 8 mL) is transferred (2 mL in hexane) onto the column.
The extract vial is rinsed twice with 1 to 2 mL of hexane and each rinse is added to
the column. The column is eluted with 125 mL of hexane (Fraction I) (EPA Method
3630C).
Kuderna Danish (KD) Concentration and Solvent Exchange:
Extract is concentrated via KD concentration before GC analysis. 125 mL extract is
concentrated by KD concentration. Three-ball Snyder column is prewetted by adding
about 1 mL of methylene chloride to the top of the column. The KD apparatus is
placed on a hot water bath (95 C). When the apparent volume of liquid reaches 10

30
mL, 50 mL of hexane is added through synder column in order to solvent to hexane
(EPA Method 3540C-Table 1). When extract is concentrated to 4-7 mL, the KD
apparatus is removed from the water bath and allowed to drain and cool for at least
10 minutes.
Nitrogen Blowdown:
Extract analyses are performed after KD concentration (4-7 mL extract). If Aroclor
1016/1260 concentration is below detection limit, extract is further concentrated by
Nitrogen blowdown technique. The solvent is evaporated to 2 mL by using a gentle
stream of clean, dry nitrogen in concentrator tube of KD. The internal wall of the
tube must be rinsed several times with the appropriate solvent during the operation.
(EPA Method 3540C)
Gas Chromotography/Electron Capture Detector (GC/ECD) Analyses:
GC/ECD Analyses are performed for quantification of total PCBs and PCB
congeners. In the analysis, a mixture of Aroclor 1016 and Aroclor 1260 is analysed
and reported as total PCBs since this mixture includes many of the peaks represented
in the other five target Aroclor mixtures of this study (Aroclor 1221, 1232, 1242,
1248 and 1254) (EPA Method 8082A). Total PCBs were analyzed by Varian CP3800
marked GC/ECD. WCOT fused silica (30m x 0.32mm ID, 0.25μm film thickness)
capillary column is used. Helium and nitrogen is used as carrier and make-up gas,
respectively. Initial temperature is 100ºC (hold 2 minutes). First, it is increased to
160ºC by 8ºC/minute, then to 250ºC by 3ºC/minute (hold 10 minutes). Finally,
temperature is increased to 290ºC by 20ºC/minute (hold 5 minutes). Injector and
detector temperatures are 250ºC and 350ºC, respectively (EPA Method 8082A).
Congener specific analyses were performed by Agilent Model 6.890 N with micro
ECD. HP-5 MS (Agilent) 5% Phenyl Methyl Siloxane (30m x 0.25mm ID, 0.25μm
film thickness) capillary column is used. Helium and nitrogen is used as carrier and
make-up gas, respectively. Initial temperature is 100ºC and it is increased to 160ºC
by 20ºC/minute (hold 2 minutes). Secondly, temperature is increased to 200ºC by
3ºC/minute, then to 240ºC by 8ºC/minute. Finally, temperature is increased to 290ºC
31
by 30ºC/minute (hold 5 minutes). Injector and detector temperatures are 250ºC and
350ºC, respectively (EPA Method 8082A).
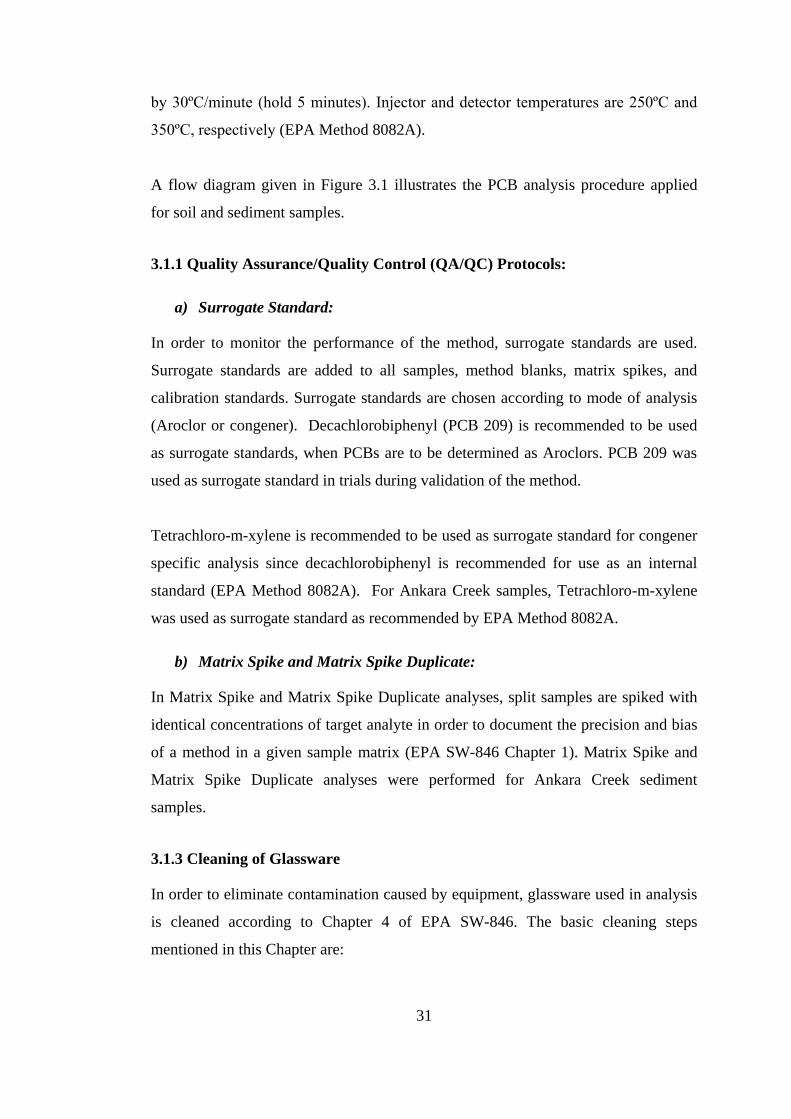
A flow diagram given in Figure 3.1 illustrates the PCB analysis procedure applied
for soil and sediment samples.
3.1.1 Quality Assurance/Quality Control (QA/QC) Protocols:
a) Surrogate Standard:
In order to monitor the performance of the method, surrogate standards are used.
Surrogate standards are added to all samples, method blanks, matrix spikes, and
calibration standards. Surrogate standards are chosen according to mode of analysis
(Aroclor or congener). Decachlorobiphenyl (PCB 209) is recommended to be used
as surrogate standards, when PCBs are to be determined as Aroclors. PCB 209 was
used as surrogate standard in trials during validation of the method.
Tetrachloro-m-xylene is recommended to be used as surrogate standard for congener
specific analysis since decachlorobiphenyl is recommended for use as an internal
standard (EPA Method 8082A). For Ankara Creek samples, Tetrachloro-m-xylene
was used as surrogate standard as recommended by EPA Method 8082A.
b) Matrix Spike and Matrix Spike Duplicate:
In Matrix Spike and Matrix Spike Duplicate analyses, split samples are spiked with
identical concentrations of target analyte in order to document the precision and bias
of a method in a given sample matrix (EPA SW-846 Chapter 1). Matrix Spike and
Matrix Spike Duplicate analyses were performed for Ankara Creek sediment
samples.
3.1.3 Cleaning of Glassware
In order to eliminate contamination caused by equipment, glassware used in analysis
is cleaned according to Chapter 4 of EPA SW-846. The basic cleaning steps
mentioned in this Chapter are:

32
1. Removal of surface residuals immediately after use;
2. Hot soak to loosen and float most particulate material;
3. Hot water rinse to flush away floated particulates;
4. Soak with an oxidizing agent to destroy traces of organic compounds;
5. Hot water rinse to flush away materials loosened by the deep penetrant soak;
6. Distilled water rinse to remove metallic deposits from the tap water;
7. Alcohol (methanol) rinse to flush off any final traces of organic materials and
remove the water; and
8. Flushing the item immediately before use with some of the same solvent that will
be used in the analysis.
In order to check whether glassware is cleaned, Method Blank analyses were
performed and results are given in Section 4.1.2.2.
Method Blank:
For the elimination of contamination risk through laboratory equipment and reagents,
method blank analyses were performed during Ankara Creek sediment sample
analyses. At first 9 samples, blank analyses were done for every sample analyses. At
the following 14 samples, these analyses were performed every 2 samples. As a
result, there is no contamination noted, caused by equipment, reagents or the
procedure.
3.2 STUDY AREAS
3.2.1 Preliminary Investigation of PCB Pollution Around Lake Eymir
Lake Eymir that is located 20 km south of Ankara and adjacent to GölbaĢı Town is
under the pressure of intense urban and industrial pollution. Due to ecological and
recreational significance of the area, the wetlands and moorlands in the close
surroundings of GölbaĢı Town are defined and declared to be ―GölbaĢı Special
Environmental Protection Area‖ with the Cabinet of Ministers’ Decree number
90/1117 on 22.10.1990, based on the Environmental Law article 9 (EPASA).

33
The most important natural components of GölbaĢı Special Environmental Protection
Area are The Mogan and Eymir Lakes’ basin. Lake Eymir is connected to Lake
Mogan via a natural channel. Due to the elevation difference, The Mogan Lakes
provides for the 98% of the water input for the Eymir Lake (EPASA).
Lake Eymir is polluted by PCB containing oils sourced from TEDAġ central
transformer repair and oil change station near the lake (Yeniova, 1998). A
preliminary investigation of the pollution study was conducted around Lake Eymir.
In the scope of this study, sampling was done from 5 different areas on 16 July 2007
(Figure 3.2).
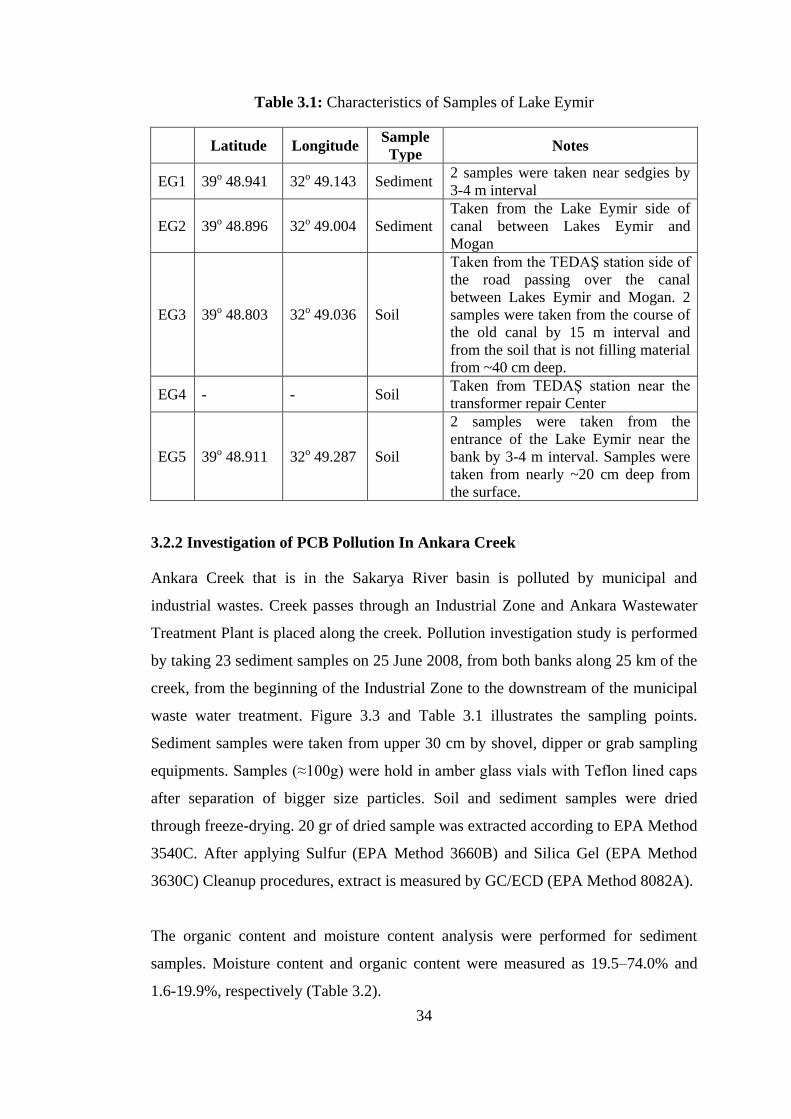
Totally 6 sediment samples were taken from 2 different regions and 14 soil samples
taken from 3 different regions. Sampling point locations and related notes are given
in Table 3.1. Sampling was done using dipper and auger as equipments to take
samples from the dry part of the canal.
Figure 3.2: Sampling Points of field study performed around Lake Eymir
34
Table 3.1: Characteristics of Samples of Lake Eymir
Latitude Longitude Sample
Type Notes
EG1 39o 48.941 32o 49.143 Sediment 2 samples were taken near sedgies by
3-4 m interval
EG2 39o 48.896 32o 49.004 Sediment
Taken from the Lake Eymir side of
canal between Lakes Eymir and
Mogan
EG3 39o 48.803 32o 49.036 Soil
Taken from the TEDAġ station side of
the road passing over the canal
between Lakes Eymir and Mogan. 2
samples were taken from the course of
the old canal by 15 m interval and
from the soil that is not filling material
from ~40 cm deep.
EG4 - - Soil Taken from TEDAġ station near the
transformer repair Center
EG5 39o 48.911 32o 49.287 Soil
2 samples were taken from the
entrance of the Lake Eymir near the
bank by 3-4 m interval. Samples were
taken from nearly ~20 cm deep from
the surface.
3.2.2 Investigation of PCB Pollution In Ankara Creek
Ankara Creek that is in the Sakarya River basin is polluted by municipal and
industrial wastes. Creek passes through an Industrial Zone and Ankara Wastewater
Treatment Plant is placed along the creek. Pollution investigation study is performed
by taking 23 sediment samples on 25 June 2008, from both banks along 25 km of the
creek, from the beginning of the Industrial Zone to the downstream of the municipal
waste water treatment. Figure 3.3 and Table 3.1 illustrates the sampling points.
Sediment samples were taken from upper 30 cm by shovel, dipper or grab sampling
equipments. Samples (≈100g) were hold in amber glass vials with Teflon lined caps
after separation of bigger size particles. Soil and sediment samples were dried
through freeze-drying. 20 gr of dried sample was extracted according to EPA Method
3540C. After applying Sulfur (EPA Method 3660B) and Silica Gel (EPA Method
3630C) Cleanup procedures, extract is measured by GC/ECD (EPA Method 8082A).
The organic content and moisture content analysis were performed for sediment
samples. Moisture content and organic content were measured as 19.5–74.0% and
1.6-19.9%, respectively (Table 3.2).

35
Figure 3.3: Sampling Points of field study performed around Ankara Creek
Table 3.2: Moisture and Organic Content and Coordinates of Sampling Points
Sample Moisture
Content (%)
Organic
content (%) Latitude Longitude
1 55.7 10.7 39° 58' 36.60"N 32° 34' 49.92"E
2 50.0 8.5 39° 58' 16.80"N 32° 33' 51.06"E
3 61.1 10.8 39° 58' 10.02"N 32° 33' 24.00"E
4 74.0 19.9 39° 57' 24.00"N 32° 32' 0.66"E
5 69.2 9.3 39° 57' 28.14"N 32° 31' 57.00"E
6 45.0 7.4 39° 57' 30.06"N 32° 31' 53.94"E
7 68.6 14.6 39° 57' 19.80"N 32° 31' 28.26"E
8 19.5 4.8 39° 57' 8.10"N 32° 30' 48.00"E
9 62.4 11.1 39° 56' 22.14"N 32° 29' 22.62"E
10 55.2 9.7 39° 53' 57.72"N 32° 28' 10.80"E
11 27.6 2.7 39° 58' 24.90"N 32° 34' 14.46"E
12 21.0 1.7 39° 57' 57.12"N 32° 33' 9.60"E
13 20.7 1.6 39° 57' 57.12"N 32° 33' 9.60"E
14 35.3 4.1 39° 57' 42.66"N 32° 32' 58.32"E
16 68.9 14.6 39° 57' 28.50"N 32° 31' 54.48"E
17 20.9 2.0 39° 57' 18.66"N 32° 31' 29.34"E
18 74.5 18.8 39° 57' 23.28"N 32° 32' 9.54"E
19 23.3 2.4 39° 57' 28.32"N 32° 32' 18.90"E
20 51.0 10.2 39° 57' 30.42"N 32° 32' 44.76"E
21 44.3 5.5 39° 53' 37.44"N 32° 28' 4.38"E
22 57.4 12.4 39° 53' 9.48"N 32° 27' 38.76"E
23 32.1 3.8 39° 52' 2.76"N 32° 26' 38.58"E
24 23.0 1.8 39° 50' 7.08"N 32° 24' 5.04"E
1
11
2
3
13
14
19
184
20
1
11
2
3
13
14
19
184
20

36
3.2 CHEMICAL MASS BALANCE MODEL
The Chemical Mass Balance (CMB) Model, originally formulated by Friedlander
(1973), was applied for source apportionment of PCBs in the environment
(Imamoglu, 2001). All information below regarding the description of CMB Model
is taken from Imamoglu (2001).
―The aim of the CMB model is to determine the sources contribution factor of
each source on a given measured profile. The efficiency of the model depends on
the source profiles being significantly different from each other. This way, their
contributions can be identified from the sample profiles collected from the
contaminated sites. Hence, the basic assumptions of the model were:
1. The concentration at the receptor site can be expressed as the linear
combination from the pollution sources,
2. No change occurs in source profile between source and receptor.
If the number of measured variables equals or exceeds the number of sources,
then the contribution from each source can be calculated by solving the equation
below for each sample:
xj = ji a i + e j (1 j m) [3.1]
where; xj = measured (observed) concentration of the jth
PCB congener at
the receptor site,
Φij = concentration of the jth
congener in the ith
source (source profile
from the literature)
ai = source contribution factor of the ith
source (calculated),
ej = error associated with the jth
congener,
n = number of sources,
m = number of congeners in the sample.

37
The relative contribution, Pi, from each source, then, was simply calculated from
the ratio of the contribution of that source to the total contribution from all
sources,
ai ji
Pi = [3.2]
a1 j1 + a2 j2 +……+ an jn
When the number of variables (m) is greater than the number of sources (n),
equation [3.1] becomes an over determined problem. The solution, then was
obtained by multiple linear regression using a least square method, where the
weighted error (equivalent to χ2) is minimized. The χ
2 was calculated as;
(xj – xj)
χ2 = [3.3]
(r.e.)2m xj
2 + (r.e.)i
2 (ai Φji)
2
where xj= calculated concentration of the jth PCB congener in the sample,
(r.e.) = relative error, which is explained below.
Equation [3.3] was derived from Eq. 11 of Henry et al. (1984) using the relative
errors of the measurement and the source profiles; (r.e.)m and (r.e.)i , respectively.
The relative error was assumed to be the same for all the PCB considered, and
they were expressed as;
(r.e.)m = [3.4]
(r.e.)i = [3.5]
where σ is a standard error.
^
^
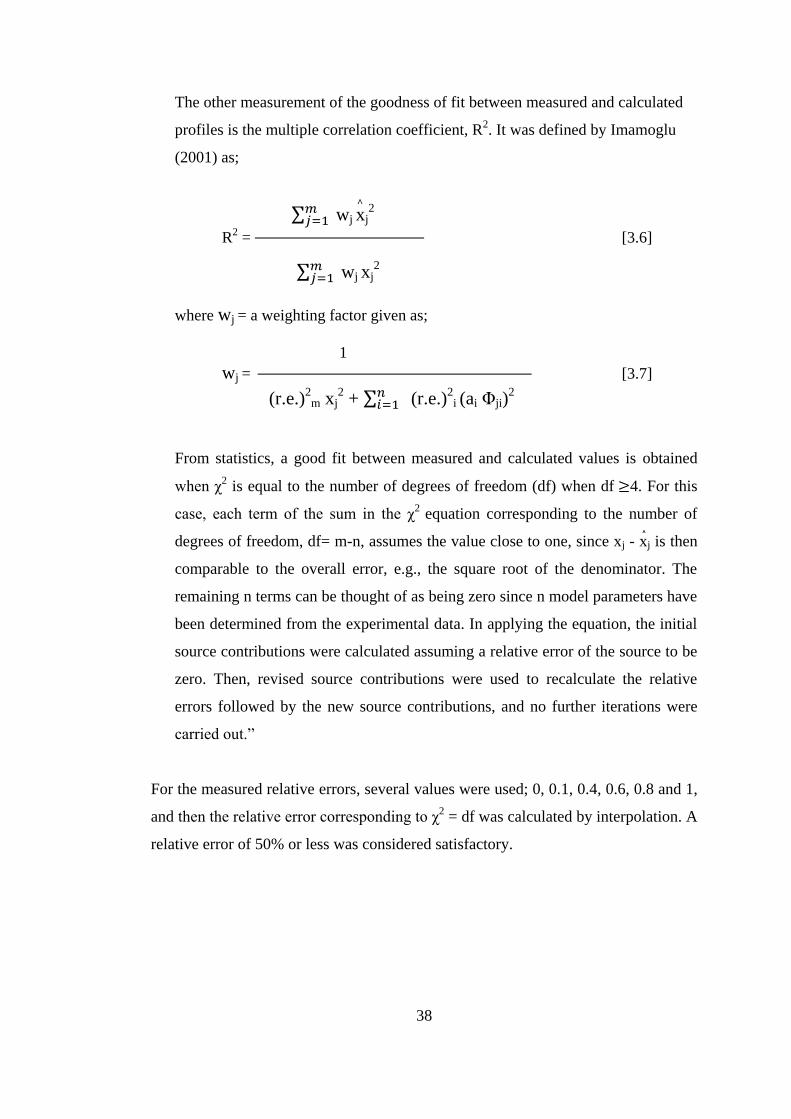
38
The other measurement of the goodness of fit between measured and calculated
profiles is the multiple correlation coefficient, R2. It was defined by Imamoglu
(2001) as;
wj xj2
R2 = [3.6]
wj xj2
where wj = a weighting factor given as;
1
wj = [3.7]
(r.e.)2m xj
2 + (r.e.)
2i (ai Φji)
2
From statistics, a good fit between measured and calculated values is obtained
when χ2 is equal to the number of degrees of freedom (df) when df 4. For this
case, each term of the sum in the χ2
equation corresponding to the number of
degrees of freedom, df= m-n, assumes the value close to one, since xj - xj is then
comparable to the overall error, e.g., the square root of the denominator. The
remaining n terms can be thought of as being zero since n model parameters have
been determined from the experimental data. In applying the equation, the initial
source contributions were calculated assuming a relative error of the source to be
zero. Then, revised source contributions were used to recalculate the relative
errors followed by the new source contributions, and no further iterations were
carried out.‖
For the measured relative errors, several values were used; 0, 0.1, 0.4, 0.6, 0.8 and 1,
and then the relative error corresponding to χ2 = df was calculated by interpolation. A
relative error of 50% or less was considered satisfactory.
^
^

39
CHAPTER 4
RESULTS AND DISCUSSION
4.1 VALIDATION OF PCB ANALYSIS METHODS
4.1.1 Investigation of PCB Analysis Methods
For analyses of PCBs in sediment and soil samples, ISO and US Environmental
Protection Agency (USEPA) methods were compared. ISO 10382 Method includes
extraction of PCBs and organochlorine pesticides, clean-up with silica gel
chromatography and analyses with GC/ECD. ISO 10382 Method was compared with
EPA Extraction Methods, EPA Method 3630C-Silica Gel clean-up and EPA Method
8082A- Analyses of PCBs by GC. ISO 6468 Method includes liquid-liquid
extraction of PCBS by Separatory Funnel, clean-up with silica gel chromatography
and analyses with GC. ISO 6468 Method was compared with EPA Method 3510-
Separatory Funnel Liquid-Liquid Extraction, EPA Method 3630C-Silica Gel clean-
up and EPA Method 8082A- Analyses of PCBs by GC.
Extraction of a solid sample is important before analyzing with GC/ECD. EPA
Method 3545- Pressurized Fluid Extraction, EPA Method 3540C- Soxhlet Extraction
and EPA Method 3546-Microwave Extraction were compared according to literature
and availability of the equipments. In comparison, extraction time, extraction
efficiency, ease of operation and solvent consumption measures were considered.
Soxhlet extraction requires more time and solvent. However, extraction efficiency is
higher than other methods (Bowadt, 1995). Furthermore, the accessibility of the
equipment is considered. For these reasons, Soxhlet extraction has been decided to
be used in analyses of sediment/soil samples.

40
The aim of clean-up of extract is to eliminate any interfering compounds, removing
uncertainties and positive and negative false of GC/ECD chromatographs and
prevent GC columns and ECD from deterioration and contamination (EPA Method
3600C). Before GC analyses, besides EPA Method 3630C Silica Gel Clean-up, EPA
Method 3665A Sulfuric Acid-Permanganate Clean-up and EPA Method 3660B
Sulfur Clean-up were decided to be applied due to highly polluted samples and
possibility of presence of other chlorinated organic pollutants (eg. the pesticides,
etc.). Interfering compounds of a different chemical polarity is separated from target
analyte by applying Silica Gel Clean-up. Sulfur and chlorinated materials that have
similar behavior with PCBs (eg. pesticides) and oil in samples is eliminated by
Sulfur Clean-up and Sulfuric Acid-Permanganate Clean-up, respectively.
4.1.1.1 Selected Methods
In the scope of the related by-law of Turkish Regulation on environment, ISO
Methods are suggested to be implemented. In ISO Method 10382, limits of detection
are mentioned to be 0.1–4 g/kg. In EPA Methods, a limit of detection value is not
specified. In ISO Method 10382, PCB pollution data is reported as the mass fraction
of individual PCB ( g/kg dry weight). EPA Methods include procedures about
determination of PCBs as Aroclor 1016/1260 mixture and reporting as Total PCBs.
In terms of the details provided regarding laboratory procedures, EPA Methods were
far superior to ISO Methods. Therefore, EPA Methods were decided to be
established in the laboratory.
4.1.2 PCB Analysis Methods in Laboratory
Methods given below are decided to be implemented in order to analyze PCBs in
environmental samples.
1) For extraction of PCBs in sediment/soil samples: EPA Method 3540C
Soxhlet Extraction (December 1996): Extraction of PCBs by Soxhlet
extractor before analyzing with GC
2) For elimination of interfering compounds: EPA Method 3630C Silica Gel
Cleanup (December 1996): Clean-up of extract before GC analyses
41
3) For analyses of PCBs: EPA Method 8082A PCBs by Gas Chromatography
(November 2000): Measuring extract with GC/Electron Capture Detector
4) For elimination of interfering compounds– no2: EPA Method 3665A Sulfuric
Acid-Permanganate Cleanup (December 1996): elimination of most
chlorinated organics (especially pesticides) by using sulfuric acid
5) For elimination of interfering compounds– no3: EPA Method 3660B Sulfur
Cleanup (December 1996): Especially for deeper soil and sediment samples ,
elimination of sulfur caused by anaerobic activities
4.1.2.1 Method Validation and Improvement Studies and Results
According to EPA Method 8000B, a laboratory should use recoveries of 70 - 130%
as guidance in evaluating performance of the results. Furthermore, the closeness of
the recoveries of parallel samples was used as an indication for the precision of the
method. Preliminary Laboratory Control Sample Analyses (Section 4.1.2.2) were
under or below these limits in terms of Aroclor 1016/1260 mixture and Surrogate
Standard PCB 209. Therefore, methods that were chosen for analysis are validated
and required alterations and improvements were done. These validation and
improvement studies are applied to freeze-drying, soxhlet extraction, Kuderna-
Danish concentration, sulfur clean-up, sulfuric acid clean-up, silica gel clean-up and
nitrogen blowdown operations.
a) Freeze-Drying:
Due to the fact that maximum 20 gr of sample can be placed in Soxhlet extraction
thimble, sample analyses is preferred to be performed on the basis of dry weight.
Analyses are performed by eliminating moisture of samples and by working
maximum amount of sample, highest possible concentrations are measured. Freeze
drying is done by Christ Alpha 1–4 Freeze-dryer. Freeze dryer works by freezing
water included in sample. Inside pressure is decreased by vacuum and moisture is
removed by sublimation. Freeze drying performance was determined by comparing
moisture content of freeze dried samples and samples dried with drying oven (Table
4.1). From the performance result, 17 hour drying is seen to be sufficient. Samples
are dried by closing the caps (one times roll of screw caps) of sample bottles.

42
Table 4.1: Freeze-dryer Performance Trials
Time (hour) Caps Performance (%)
Trial 1 17 Open 97.6
24 Open 94.2
Trial 2 17 Open 83.2
Trial 3 17 Closed 89.4
17 Open 103.01
1
2
(%) 100MC
Performance xMC
MC1: Moisture Content (%), drying with freeze-dryer
MC2: Moisture Content (%), drying with drying oven
b) Soxhlet Extraction:
In EPA 3540C Soxhlet Extraction Method, sample is said to be extracted for 16-24
hours at a rate of 4-6 cycles/hour. The temperature of water bath that was used for
extraction is adjusted according to the extraction solvent used (Acetone/Hexane (1:1)
(v/v)). Temperature adjustment trials were performed as extractor works at a rate of 5
cycles/hour (Table 4.2).
Table 4.2: Soxhlet Extraction Working Temperature Trials
Temperature ( C) Time (Hour) Cycles (1/hour)
75 19 3.15
82 16 3.75
84 14.5 4.15
86.5 12.5 5
88 6 10
1 Freeze-drying performance result is greater than 100% due to the fact that vacuum applied during
freeze-drying causes dusting for samples with open caps and loss of particulate matter.

43
c) Kuderna-Danish (KD) Concentration:
KD concentrators are used to concentrate materials dissolved in volatile solvents
without losing target material. KD concentration is done according to EPA Method
3540C, Soxhlet Extraction. K-D apparatus is placed on a 95 C water bath that is 15-
20 C above the boiling point of the solvent. However, not flooding of the chambers
of synder column, active chattering of the balls and 10-20 minutes of concentration
time conditions were not satisfied and recoveries of concentration trials were
measured very low. These conditions are thought to be caused by low solvent and
ambient temperature. In order to increase solvent and ambient temperature, trials
were performed by covering KD apparatus with a towel and closing the suction
device, after which recoveries were seen to be increased (Table 4.3). In the
concentration that is performed by closing the suction device, in order to prevent
solvent vapor to spread in the laboratory, protection glass of the suction device was
kept closed. When it is needed to be opened, suction device is opened for some time
for removal of the vapor. As a result, as seen from the results of 3rd
and 4th
trials,
concentration is performed with consistent and sufficient recoveries.
Table 4.3: Kuderna-Danish Concentration Trials
Parallel Concentration
Time (hour)
Aroclor
1016
Recovery
(%)
Aroclor
1260
Recovery
(%)
Aroclor
1016/1260
Recovery
(%)
PCB 209
Recovery
(%)
Trial 1 1 ~7 31.13 39.75 35.11 34.50
2 ~7,5 21.74 27.52 24.41 20.91
Trial 2 1 ~7 56.12 63.71 59.59 -- a
2 ~7,25 56.65 67.53 61.63 -- a
Trial 3 b
1 ~0,2 95.21 119.10 106.47 107.82
2 ~0,25 94.17 108.88 101.10 107.62
Trial 4b
1 ~0,2 91.18 107.18 98.72 108.20
2 ~0,2 112.42 128.56 120.03 113.64
a PCB 209 is not injected.
b Concentrated while KD flask is covered with towel and suction device is closed.

44
d) Sulfur Clean-up:
Sulfur is a pollutant especially for the sediment samples. Sulfur has similarities with
organochlorine pesticides in terms of solubility. Sulfur interferes in GC analyses and
causes humps in chromatographs leading to incorrect quantification (Figure 4.1-
Panel I). Sulfur is cleaned by adding 2 gr copper powders to extract, mixing with a
vortex mixer and removing extract with a syringe according to EPA Method 3660B.
This procedure had difficulties in application. Therefore, clean-up is done by adding
copper to Soxhlet extractor flask and providing copper to come into contact with the
extract for 17 hours. In the related method, copper powder is said to be pre-cleaned
with diluted nitric acid. However, during application, copper is dissolved in nitric
acid since it is strong oxidizing agent and small particles rise to the surface and get
lost while clarifying with water. Therefore, diluted sulfuric acid is used in copper
cleaning and granular copper is used instead of powder.
e) Sulfuric Acid Clean-up:
Sulfuric acid clean-up is used whenever elevated baselines or overly complex
chromatograms prevent accurate quantitation of PCBs. In this clean-up chlorinated
materials that have similar behavior with PCBs (eg. pesticides) and oil in samples is
eliminated and contamination of GC column is prevented. Figure 4.1-Panel II
illustrates the chromatographs of the same extract before and after sulfuric acid
clean-up. According to EPA Method 3665A, 5 mL Sulfuric Acid/water (1:1) (v:v)
mixture is added to 2 mL extract and mixed with vortex mixer. After separation of
phases, extract removed with a syringe. This step is repeated until color and
cloudiness is removed. In this application, sulfuric acid may remain in the removed
extract and can damage the GC column. Therefore, after cleaning with acid, extract
is washed with distilled water for 3 times. Thin layer of extract remain on the top of
sulfuric acid/water mixture and water caused significant loss of PCBs. Therefore,
clean-up is performed by 10 mL extract. In the first wash with sulfuric acid/water
mixture 8 mL extract is removed. If repetition is needed, 6 mL of 8 mL extract is
removed by syringe. Losses of 20% or 40% caused by these applications are taken
into account during calculations.

45
Figure 4.1 Panel (I) a – b: Chromatographs of sample extracts (a) before (b) after
sulfur clean-up
Panel (II) a – b: Chromatographs of sample extracts (a) before (b)
after sulfuric acid clean-up
f) Silica Gel Clean-up:
Silica gel is used in column chromatography for the separation of analytes from
interfering compounds of a different chemical polarity. According to EPA Method
3630C, 10mm ID chromatographic column is filled with 3 gr silica gel and topped
with 3 cm of anhydrous sodium sulfate. Sample extract is transferred to the columns
and eluted with hexane. According to EPA Method 3630C, silica gel has to be
activated for at least 16 hours at 130 C and deactivated to 3.3% with reagent water.
For the first fraction, that is sufficient for PCB analyses, elution solvent volume is
mentioned to be 80 mL. In order to determine the losses caused by silica gel clean-
up, recovery trials were performed and are summarized in Table 4.4. After 2 mL, 1
ppm Aroclor 1016/1260 (1:1) (v:v) is transferred to the column, column was eluted
with different volumes of solvent. Fractions were concentrated with KD
(a) (b)
(a) (b) (I)
(II)
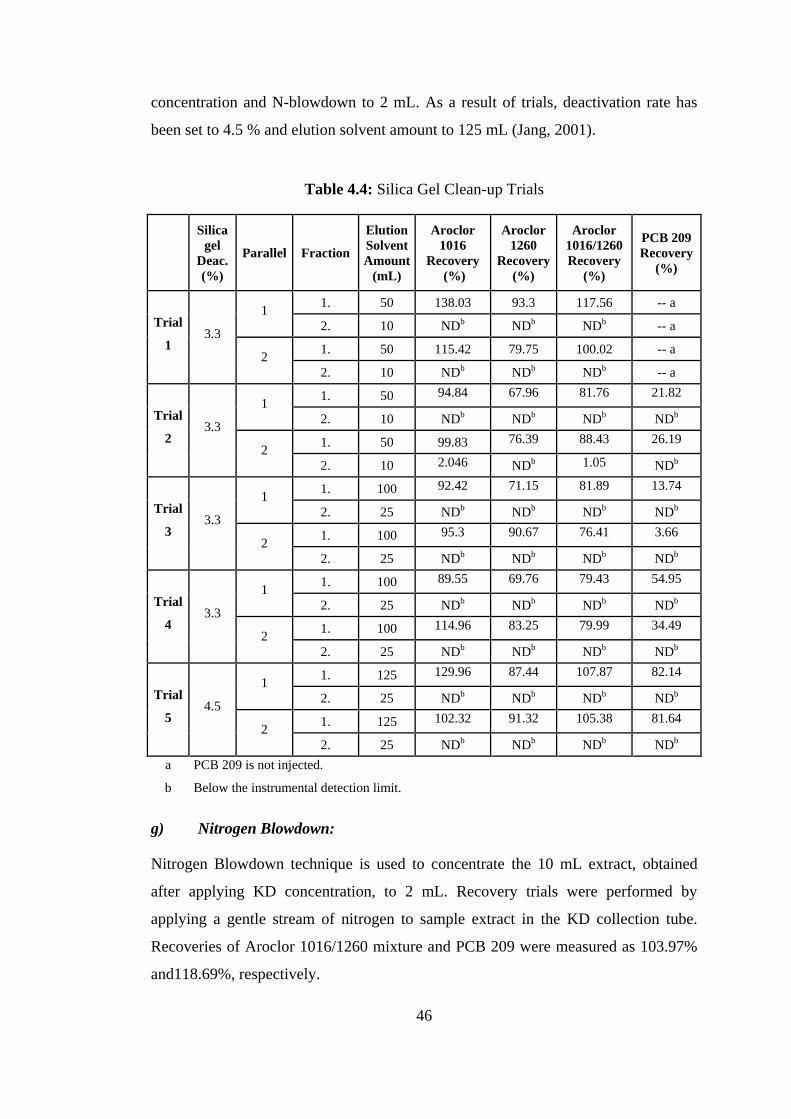
46
concentration and N-blowdown to 2 mL. As a result of trials, deactivation rate has
been set to 4.5 % and elution solvent amount to 125 mL (Jang, 2001).
Table 4.4: Silica Gel Clean-up Trials
Silica
gel
Deac.
(%)
Parallel Fraction
Elution
Solvent
Amount
(mL)
Aroclor
1016
Recovery
(%)
Aroclor
1260
Recovery
(%)
Aroclor
1016/1260
Recovery
(%)
PCB 209
Recovery
(%)
Trial
1 3.3
1 1. 50 138.03 93.3 117.56 -- a
2. 10 NDb NDb NDb -- a
2 1. 50 115.42 79.75 100.02 -- a
2. 10 NDb NDb NDb -- a
Trial
2 3.3
1 1. 50 94.84 67.96 81.76 21.82
2. 10 NDb NDb NDb NDb
2 1. 50 99.83 76.39 88.43 26.19
2. 10 2.046 NDb 1.05 NDb
Trial
3 3.3
1 1. 100 92.42 71.15 81.89 13.74
2. 25 NDb NDb NDb NDb
2 1. 100 95.3 90.67 76.41 3.66
2. 25 NDb NDb NDb NDb
Trial
4 3.3
1 1. 100 89.55 69.76 79.43 54.95
2. 25 NDb NDb NDb NDb
2 1. 100 114.96 83.25 79.99 34.49
2. 25 NDb NDb NDb NDb
Trial
5 4.5
1 1. 125 129.96 87.44 107.87 82.14
2. 25 NDb NDb NDb NDb
2 1. 125 102.32 91.32 105.38 81.64
2. 25 NDb NDb NDb NDb
a PCB 209 is not injected.
b Below the instrumental detection limit.
g) Nitrogen Blowdown:
Nitrogen Blowdown technique is used to concentrate the 10 mL extract, obtained
after applying KD concentration, to 2 mL. Recovery trials were performed by
applying a gentle stream of nitrogen to sample extract in the KD collection tube.
Recoveries of Aroclor 1016/1260 mixture and PCB 209 were measured as 103.97%
and118.69%, respectively.

47
4.1.2.2 Quality Assurance/Quality Control (QA/QC) Studies:
a) Laboratory Control Sample (LCS) Analyses:
In LCS analyses, a known matrix is spiked with compound representative of the
target analytes to document laboratory performance (EPA SW-846 Chapter 1, 1992).
A soil sample that had no potential of contamination and was cleaned with extraction
was spiked with Aroclor 1016/1260 mixture and PCB 209. The methodology
followed (Table 4.5) and recovery results (Table 4.6 and Figure 4.2) of 14 LCS
analyses are given below.
Table 4.5: Laboratory Control Sample Analysis Procedure
Recovery KD Concentration Silica Jel
Clean-up Sulfuric Acid Clean-up
Sulfur
Clean-
up
N
Blow
down
Work.
Temp.
(◦C)
Synder Column
and Working
Conditions
Deak.
Rate
(%)
Elution
Solvent
(mL)
Washing
with Acid
Washing
with Water
1 85 a 3.3 80 √ (1 time) √ √
2 95 a 3.3 80 √ (1 time) √ √ √
3 95 a 3.3 80 √ (1 time) √ (3 times) √ √
4 95 a 3.3 80 √ (1 time) √
5 95 a 3.3 80 √ (1 time) √ (3 times) √ √
6 95 a 3.3 80
7 95 a 3.3 80 √
8 95 a,d 3.3 80 √
9 95 a,d 4.5 125 √
10 95 a,d 4.5 125 √
11 95 a,d 4.5 125 √
12 95 b, d 4.5 125 √
13 95 c, d 4.5 125 √
14 95 c, d 4.5 125 √
a Old Synder Column
b Locally manufactured 3 ball column
c Imported Supelco brand, certificated 3 ball column
d Concentrated while KD flask is covered with towel and suction device is closed.

48
Table 4.6: Recovery Results of PCB Analysis for Soil and Sediment Samples
Aroclor 1016
(%)
Aroclor 1260
(%)
Surrogate Standard
PCB 209 (%) Total PCBs (%)
Rec
ov
ery
Pa
rall
el 1
Pa
rall
el 2
Pa
rall
el 1
Pa
rall
el 2
Pa
rall
el 1
Pa
rall
el 2
Aver
ag
e
Pa
rall
el 1
Pa
rall
el 2
Aver
ag
e
2 99.24 72.40 108.40 81.00 28.30 20.40 24.35 103.82 76.70 90.26
3 114.72 100.92 139.76 106.24 67.00 34.30 50.65 127.24 103.58 115.41
4 91.60 62.80 101.44 85.12 33.60 42.70 38.15 96.52 73.96 85.24
5 16.20 58.80 15.92 77.40 2.10 30.80 16.45 16.06 68.10 42.08
6 10.60 23.56 14.28 33.58 3.90 6.96 5.43 13.10 30.38 21.74
7 14.22 20.45 16.20 22.92 17.66 24.68 21.17 15.57 22.13 18.85
8 93.18 94.15 98.04 103.48 79.87 79.35 79.61 95.54 98.69 97.12
9 81.39 91.42 102.76 93.93 90.46 68.18 79.32 91.86 92.65 92.26
10 108.80 116.42 84.25 118.64 70.57 73.96 72.27 95.84 117.59 106.72
11 81.40 83.24 93.91 95.60 137.37 143.29 140.33 87.86 89.62 88.74
12 50.20 111.20 62.87 106.91 40.55 91.38 65.97 56.83 108.96 82.90
13 93.00 96.49 97.56 93.05 85.95 83.03 84.49 95.38 94.69 95.04
14 115.08 103.44 107.85 93.01 93.54 88.20 90.87 111.30 97.99 104.65
Figure 4.2: Recovery Results of PCB Analysis for Soil and Sediment Samples
0,00
20,00
40,00
60,00
80,00
100,00
120,00
140,00
2 3 4 5 6 7 8 9 10 11 12 13 14
Re
cove
ry (
%)
Analysis No
Recovery Results
Aroclor 1016 Aroclor 1260 Aroclor 1016/1260 PCB 209
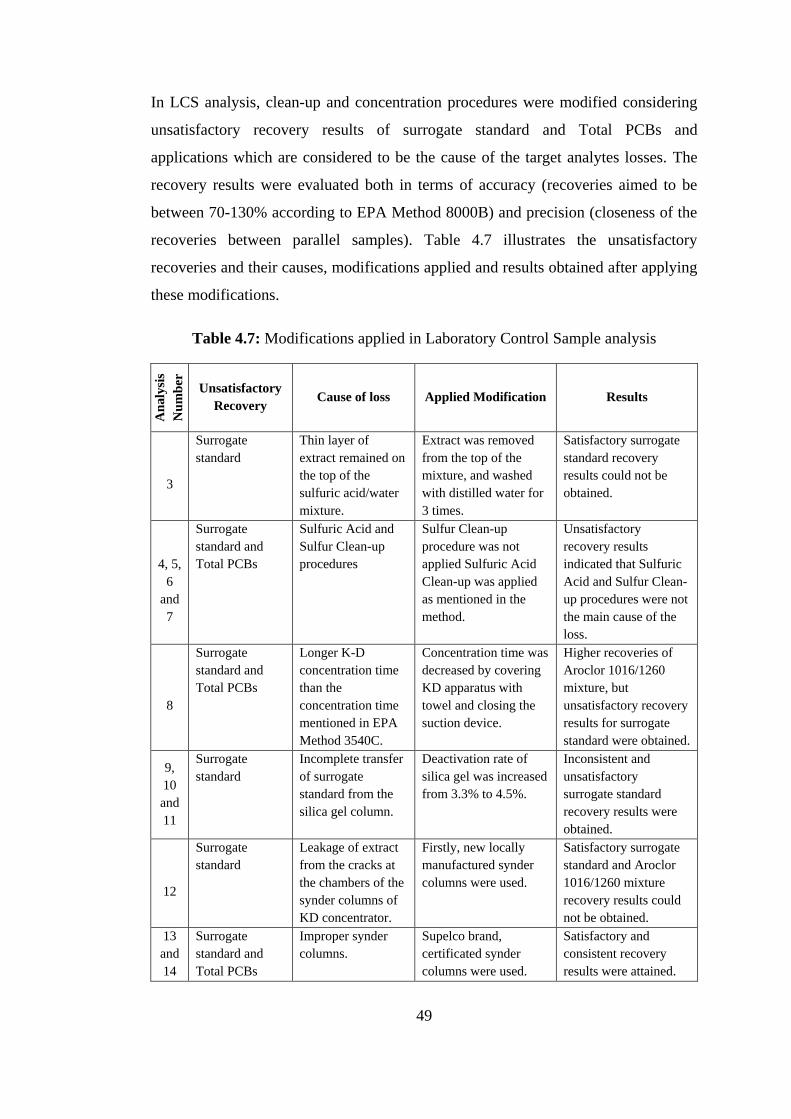
49
In LCS analysis, clean-up and concentration procedures were modified considering
unsatisfactory recovery results of surrogate standard and Total PCBs and
applications which are considered to be the cause of the target analytes losses. The
recovery results were evaluated both in terms of accuracy (recoveries aimed to be
between 70-130% according to EPA Method 8000B) and precision (closeness of the
recoveries between parallel samples). Table 4.7 illustrates the unsatisfactory
recoveries and their causes, modifications applied and results obtained after applying
these modifications.
Table 4.7: Modifications applied in Laboratory Control Sample analysis
An
aly
sis
Nu
mb
er
Unsatisfactory
Recovery Cause of loss Applied Modification Results
3
Surrogate
standard
Thin layer of
extract remained on
the top of the
sulfuric acid/water
mixture.
Extract was removed
from the top of the
mixture, and washed
with distilled water for
3 times.
Satisfactory surrogate
standard recovery
results could not be
obtained.
4, 5,
6
and
7
Surrogate
standard and
Total PCBs
Sulfuric Acid and
Sulfur Clean-up
procedures
Sulfur Clean-up
procedure was not
applied Sulfuric Acid
Clean-up was applied
as mentioned in the
method.
Unsatisfactory
recovery results
indicated that Sulfuric
Acid and Sulfur Clean-
up procedures were not
the main cause of the
loss.
8
Surrogate
standard and
Total PCBs
Longer K-D
concentration time
than the
concentration time
mentioned in EPA
Method 3540C.
Concentration time was
decreased by covering
KD apparatus with
towel and closing the
suction device.
Higher recoveries of
Aroclor 1016/1260
mixture, but
unsatisfactory recovery
results for surrogate
standard were obtained.
9,
10
and
11
Surrogate
standard
Incomplete transfer
of surrogate
standard from the
silica gel column.
Deactivation rate of
silica gel was increased
from 3.3% to 4.5%.
Inconsistent and
unsatisfactory
surrogate standard
recovery results were
obtained.
12
Surrogate
standard
Leakage of extract
from the cracks at
the chambers of the
synder columns of
KD concentrator.
Firstly, new locally
manufactured synder
columns were used.
Satisfactory surrogate
standard and Aroclor
1016/1260 mixture
recovery results could
not be obtained.
13
and
14
Surrogate
standard and
Total PCBs
Improper synder
columns.
Supelco brand,
certificated synder
columns were used.
Satisfactory and
consistent recovery
results were attained.
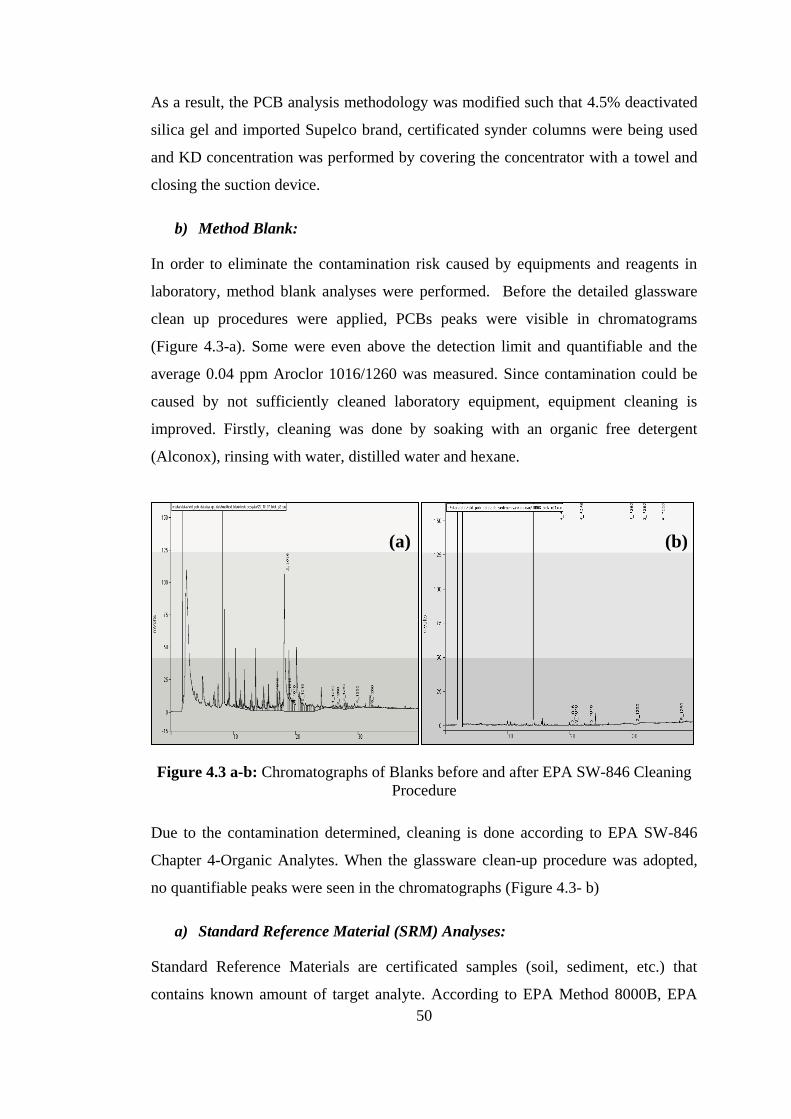
50
As a result, the PCB analysis methodology was modified such that 4.5% deactivated
silica gel and imported Supelco brand, certificated synder columns were being used
and KD concentration was performed by covering the concentrator with a towel and
closing the suction device.
b) Method Blank:
In order to eliminate the contamination risk caused by equipments and reagents in
laboratory, method blank analyses were performed. Before the detailed glassware
clean up procedures were applied, PCBs peaks were visible in chromatograms
(Figure 4.3-a). Some were even above the detection limit and quantifiable and the
average 0.04 ppm Aroclor 1016/1260 was measured. Since contamination could be
caused by not sufficiently cleaned laboratory equipment, equipment cleaning is
improved. Firstly, cleaning was done by soaking with an organic free detergent
(Alconox), rinsing with water, distilled water and hexane.
Figure 4.3 a-b: Chromatographs of Blanks before and after EPA SW-846 Cleaning
Procedure
Due to the contamination determined, cleaning is done according to EPA SW-846
Chapter 4-Organic Analytes. When the glassware clean-up procedure was adopted,
no quantifiable peaks were seen in the chromatographs (Figure 4.3- b)
a) Standard Reference Material (SRM) Analyses:
Standard Reference Materials are certificated samples (soil, sediment, etc.) that
contains known amount of target analyte. According to EPA Method 8000B, EPA
(a) (b)

51
SW846 certificated, RTC marked (RTC-CRM922) reference soil were analyzed and
recovery values were measured (Table 4.8). In analyses, 5 gr of SRM was extracted
and soil extract is cleaned-up, concentrated to 10 mL and analyzed by GC/ECD. If
100% recovery is considered, 4.15 ppm Aroclor 1016 has to be measured. As an
ultimate validation of establishment of PCB analysis methods in METU laboratories,
the methods are used on SRMs. For this purpose, RTC marked standard having 8.3
ppm Aroclor 1016 with 7.43-9.17 range (%95 confidence interval) was used.
According to confidence interval, Aroclor 1016 recoveries should be 89.52-110.48%.
The prediction interval and the acceptable standard deviation is 4.11-12.5 and 1.98
ppm, respectively. Considering reference value of 8.3 ppm, the prediction interval
and the acceptable standard deviation were calculated as 49.52-150.60% and 23.86,
respectively. 40% of results fall within the confidence interval and 100% of the
results are within the prediction interval.
Table 4.8: Standard Reference Material Recovery Results
Parallel Dilution
Rate
Expected
Value
(ppm)
Measured
(ppm)
Aroclor 1016
Recovery (%)
PCB 209 Recovery
(%)
Trial 1 1 1/25 0.166 0.183 110.36 134.77
2 1/25 0.166 0.174 104.82 117.92
Trial 2 1 1/10 0.415 0.471 113.45 133.30
Trial 3 1 1/10 0.415 0.527 127.06 112.40
2 1/10 0.415 0.469 113.01 110.70
Average 113.74 ± 8.20 121.818 ± 11.48
Furthermore, the standard deviation of the recovery results satisfies the value
mentioned at the certificate of SRM. Besides Aroclor 1016 Recovery, PCB 209
Recovery that is 121.818 ± 11.48 % is acceptable considering method performance.

52
4.2 PRELIMINARY INVESTIGATION OF PCB POLLUTION
AROUND LAKE EYMIR
4.2.1 Sampling and Characteristics of Samples
Lake Eymir is located 20 km south of Ankara. It has been declared as an
environmentally protected area in 1990. The lake area changes between 1.05-1.25
km2 depending on the depth of water. The lake area Lake Eymir, with its average
depth of about 3 m, is classified as a shallow lake (Tan and Beklioglu, 2005).
Eymir is hydrologically connected to Lake Mogan via a natural and a concrete lined
channel which is located in the southwest of Eymir. Lake Mogan, Kıslakcı Stream (a
perennial stream at the northern end), and groundwater sources feed the lake. The
excess water of the lake drains into Ġmrahor Creek at the north (Altınbilek et al.,
1995).
There are several pollution sources that impact the water quality in the lake. The
PCB pollution of the Lake was primarily due to TEDAġ central transformer repair
and oil change station. For preliminary investigation the pollution in the vicinity of
Lake Eymir, sampling study was performed and a photograph of sampling study area
is given in Figure 4.4.
Figure 4.4: Photograph of Sampling Study Area around Lake Eymir

53
4.2.2 Status of PCB Pollution and Discussion
A summary of the PCB analysis results for Eymir Lake is presented in Table 4.9,
4.10 and 4.11. Results for all samples are given in Appendix B.
Table 4.9: Results of PCB Pollution of Sediment Samples of Lake Eymir
Total PCBs Aroclor 1016 Aroclor 1260
(ng/g dry
weight)
(ng/g dry
weight)
(ng/g dry
weight)
EG-1
and
EG-2
Minimum-Maximum ND - 84.0 ND - 81.0 ND - 14.0
Mean ± standard
deviation 23.2± 33.3 25.6 ± 33.0 3.4 ± 4.8
Median 14.5 12.0 1,5
Geometric Mean - - -
Table 4.10: Results of PCB Pollution of Soil Samples taken from Transformer
Repair Center of TEDAġ
Total PCBs Aroclor 1016 Aroclor 1260
(ng/g dry
weight)
(ng/g dry
weight)
(ng/g dry
weight)
EG4
Minimum-Maximum 313.0 – 9997.0 ND - 1291.0 313.0 - 9481.0
Mean ± standard
deviation 2917.0 ±
4055.6 308.8 ± 521.9
2608.2 ±
3723.6
Median 536.5 23 513.5
Geometric Mean 1134.1 - 1061.9
Table 4.11: Results of PCB Pollution of Soil Samples taken from the vicinity of
Eymir Lake
Total PCBs Aroclor 1016 Aroclor 1260
(ng/g dry
weight)
(ng/g dry
weight)
(ng/g dry
weight)
EG- 3
and
EG-5
Minimum-Maximum ND – 69.0 ND – 69.0 -
Mean ± standard
deviation 46.5± 31.8 46.5± 31.8 ND
Median 46.5 46.5 ND
Geometric Mean 40.7 40.7 - ND: PCBs could not be detected or quantified.
PCBs could not be detected or quantified for samples of EG-3 site, therefore calculations include
PCB pollution data of site EG-5.

54
Results illustrated in Table 4.9 indicates measurable amount of PCB pollution around
Lake Eymir. Especially, all of the samples taken from EG4 site and analyzed have
high amount of PCB pollution. These samples are taken inside TEDAġ station near
transformer repair and oil change station. Soil samples taken over the concrete floor
used for transformer oil change and taken from the nearest point to this site have
significant amount of PCB pollution. Chromatographs of samples taken from
TEDAġ station show a similar pattern to the Aroclor 1260 in the example GC/ECD
chromatogram of 1 ppm Aroclor 1016/1260 mixture (Figure 4.5). High chlorinated
Aroclor 1260 mixture is seen to be dominant for this site. This is expected due to use
of high chlorinated PCB mixtures in transformers. Determining high amount of PCB
pollution for all of the samples taken from EG4 site is important for introducing
pollution sources of samples taken from the vicinity of the lake.
Measurable amount of PCB pollution seen in Table 4.10 is thought to be caused by
transformer oil change station. Determining pollution profiles resembling to Aroclor
profiles for this site is important since they form a baseline for upcoming modeling
studies.
Figure 4.5: Chromotograph of Eymir Lake Sample EG-T7 and Example GC/ECD
Chromatogram of 1 ppm Aroclor 1016/1260 mixture
The main route of entry of PCBs into the Lake Eymir is the canal connecting Mogan
to Lake Eymir. TEDAġ has discharge points into this canal which historically carried

55
PCB contamination into Lake Eymir. There is no evident discharge from these canals
currently, however they are thought to be the main points of entry of PCBs into the
canal and hence into the lake.
For lake sediments from EG1 site, especially for samples numbered EG-S-1 and EG-
S-2, significant amount of PCB pollution was determined. Even surface sediments
have 84 ppb and 45 ppb pollution. This result designates that PCBs were carried to
the lake in the near past. Use of PCBs in closed systems such as transformers is legal
until 2025. In that time, although it is forbidden, opening this equipment for oil
changing or another purpose without taking necessary precautions may cause
contamination.
In order to take samples from the old canal between TEDAġ and lake, sampling
study was performed for EG2 and EG3 sites. PCBs were not measured or small scale
pollution was determined. This preliminary analysis indicated the PCB
contamination for the site. At the subsequent stages of the study, the inactive
discharge points of TEDAġ into this canal which historically carried PCB
contamination were realized. According to these findings, more detailed
investigation was performed for the site and higher concentrations of PCB pollution
were detected (Demircioglu, 2009).
Further points from concrete canal construction site was chosen during sampling
study, however results are not instructive. An unexpected situation was seen for
sample EG-T-9. This sample was taken from the same point with sample EG-T-10.
Sample EG-T-9 and EG-T-10 were taken from the same point and from 30 and 40
cm deep, respectively. Samples were extracted and cleaned with same procedure,
however could not be injected to GC/ECD due to high amount of oil included in
extracts. Sampling point is in the area of old canal and having different pollution in
different layers are expected due to sedimentation.
Finally, soil samples of EG-T-13 and EG-T-14 were taken near the lake from almost
40 cm depth. PCB pollution from these samples shows unexpected results.
Significant amount of chlorinated compounds were seen by looking over the

56
chromatographs. Moreover, all indicator peeks were seen, however high chlorinated
Aroclor 1260 mixture was determined to be under detection limit. Relatively high
amount of pollution, 0.024 and 0.069 ppm was determined for low chlorinated
Aroclor 1016 mixture for EG-T-13 and EG-T-14, respectively. This result is
unexpected for two reasons: (1) This site is near to the TEDAġ canal connections
point; however there is no direct flow through the site and high degree of pollution is
not expected, (2) Aroclor 1016 is dominant to Aroclor 1260 and this illustrates a
degradation scheme. Modeling studies performed by Imamoğlu et al. (2002, 2004)
presents that high chlorinated mixtures such as Aroclor 1260 can have congener
profiles likely to low chlorinated mixtures such as Aroclor 1016 if they are in the
anaerobic situation for enough time.
PCB pollution results of Lake Eymir are compared with the similar PCB results from
national literature. In the scope of the study performed by Yeniova (1998) for Lake
Eymir, PCB pollution is observed for soil samples taken from the vicinity of TEDAġ
laboratory and for sediments of the canal between Mogan and Eymir Lakes.
The study performed by Yeniova (1998) illustrates 527-464,400 ppb (dry weight)
Aroclor 1260 pollution for 15 soil samples taken from the TEDAġ station. For the
samples taken from the same site (EG-4), 313-9481 ppb Aroclor 1260 and 313–9997
ppb (dry weight) Total PCBs pollution are determined. These results are expected
since, the area for which very high PCB pollution was detected was later excavated
and taken elsewhere (Yeniova, personal communication). Currently, the area is
covered with cement, hence possibly some contamination is still present below
ground.
In the scope of the same study, 2.9-196.2 ppb (dry weight) Aroclor 1260 pollution
was reported for 20 sediment samples of the canal between Mogan and Eymir Lakes.
For the samples taken from the same site (EG-2), 5 ppb (dry weight) Aroclor 1260
pollution was determined. Determining lower concentration than reported by
Yeniova in 1998 is expected considering passing 10 years.
57
Other studies conducted on PCB pollution in Turkey are summarized in Table 2.7
and 2.8. Total PCB pollution in the vicinity of Lake Eymir (including TEDAġ
station) is determined as 5-9997 ppb (dry weight). When PCB pollution results of
Lake Eymir are compared with the similar PCB results from international literature,
Lake Eymir have significant amount of pollution. In the studies performed for
―Superfund‖ region of USA, total PCBs were determined as 300 - 4500 ppb for
Ashtabula river, 46- 44,000 ppb for Fox river and 19 - 300 ppb for Green Bay in
Lake Michigan (Ġmamoğlu, 2001).
Consequently, considering the presence of indicators that Eymir Lake and the
vicinity is contaminated with PCBs, the region is designated as suspected site and
decided to be investigated in more details.
4.2.3 Assessment of Effects on Human Health
Toxic effects of dioxin-like congeners of PCBs on human health due to their
chemical and thermal stability are demonstrated by Toxic Equivalency Factor (TEF).
The TEF values of Aroclor 1016 and Aroclor 1260 mixtures has been calculated by
Rushneck (2004) by using TEF values of dioxin-like congeners included by these
mixtures and their ratio in the mixture. By multiplying Aroclor 1016 and Aroclor
1260 concentrations of the samples with TEF values of these mixtures, which are
0.09 and 3.5, Toxic Equivalent Concentrations (TEQ) are calculated (Table 4.12).
Tolerable daily intake for the whole group of dioxin-like compounds are 1–4 pg
TEQs/kg body weight/day (Van Leeuwen and Younes, 2000) (WHO/UNEP/ILO,
1980). For a person, 70 kg in weight, tolerable daily intake can be calculated as 70–
280*10-6
μg TEQ. Both sediment and soil samples of Eymir Lake and the vicinity
have higher TEQ values and can cause health problems for absorption by swallow of
soil and skin contact cases.
Furthermore, PCBs are virtually insoluble in water due to hydrophobic nature and
they are highly soluble in fat, hence they have tendency to bio-accumulate in aquatic
fauna. Therefore, consumption of fish from PCB contaminated Lake Eymir can have
potential toxic effects.

58
Table 4.12: Toxic Equivalency Factor (TEF) and Toxic Equivalent Concentration
(TEQ) Values of Lake Eymir
EG 1 and EG 2 TEF TEQ (ppb)
Mean Median Geometric Mean
Aroclor 1016 (ppb) 0.09 2.31±2.99 1.08 _
Aroclor 1260 (ppb) 3.5 11.81±115.37 5.25 _
Total PCBs (ppb) 14.12±118.36 6.33 _
EG 4 TEF TEQ (ppm)
Mean Median Geometric Mean
Aroclor 1016 (ppm) 0.09 27.80*10-3
±46.97*10-3
2.07*10-3
_
Aroclor 1260 (ppm) 3.5 9.12±13.03 1.80 3.72
Total PCBs (ppm) 9.16±13.08 1.80 3.72
EG 3 and EG 5 TEF TEQ (ppb)
Mean Median Geometric Mean
Aroclor 1016 (ppb) 0.09 4.5*10
-3±2.7*10
-3 4.5*10
-3 4.5*10
-3
Aroclor 1260 (ppb) 3.5 _ _ _
Total PCBs (ppb) 4.5*10
-3±2.7*10
-3 4.5*10
-3 4.5*10
-3
4.3 INVESTIGATION OF PCB POLLUTION IN ANKARA
CREEK
4.3.1 Sampling and Characteristics of Samples
Ankara Creek, a tributary of Sakarya River, passes through Ankara for 140 km. The
creek is polluted with municipal and industrial wastes. Twenty three sediment
samples were taken from Ankara Creek that passes through Sincan Dumpsite and
Industrial Zone. Samples were taken from both banks along 25 km of the creek.
Maps showing the sampling sites are given in Appendix D.
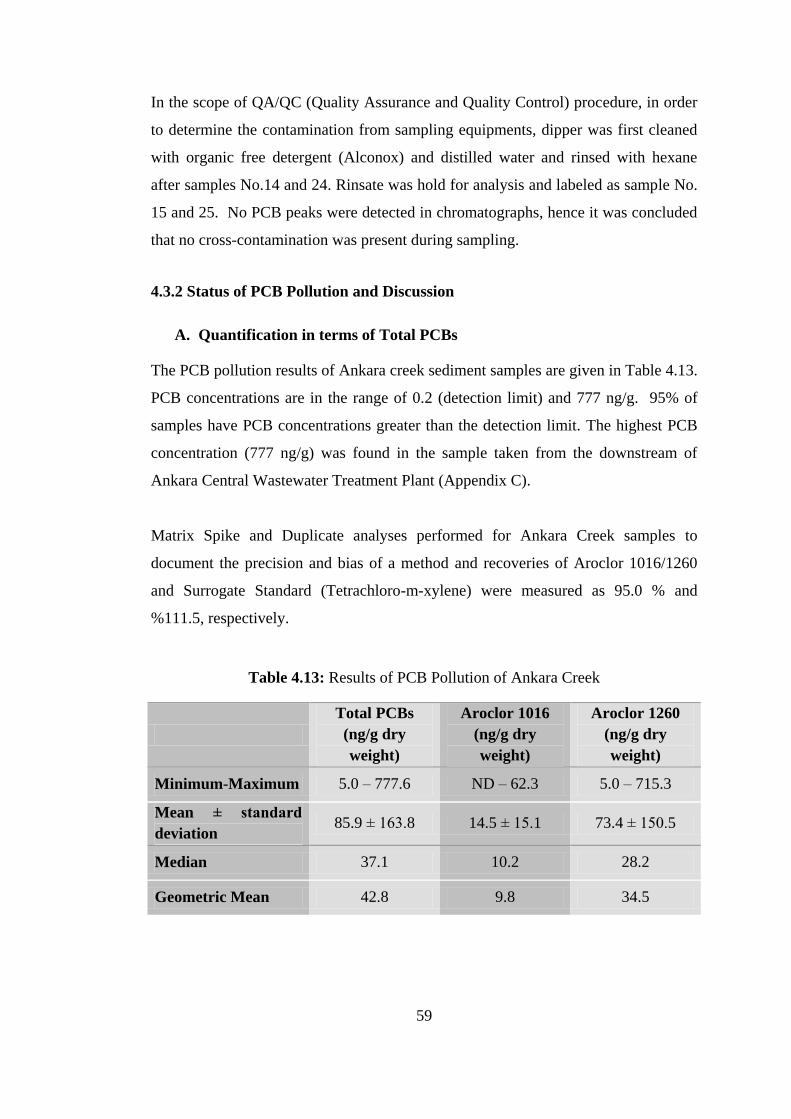
59
In the scope of QA/QC (Quality Assurance and Quality Control) procedure, in order
to determine the contamination from sampling equipments, dipper was first cleaned
with organic free detergent (Alconox) and distilled water and rinsed with hexane
after samples No.14 and 24. Rinsate was hold for analysis and labeled as sample No.
15 and 25. No PCB peaks were detected in chromatographs, hence it was concluded
that no cross-contamination was present during sampling.
4.3.2 Status of PCB Pollution and Discussion
A. Quantification in terms of Total PCBs
The PCB pollution results of Ankara creek sediment samples are given in Table 4.13.
PCB concentrations are in the range of 0.2 (detection limit) and 777 ng/g. 95% of
samples have PCB concentrations greater than the detection limit. The highest PCB
concentration (777 ng/g) was found in the sample taken from the downstream of
Ankara Central Wastewater Treatment Plant (Appendix C).
Matrix Spike and Duplicate analyses performed for Ankara Creek samples to
document the precision and bias of a method and recoveries of Aroclor 1016/1260
and Surrogate Standard (Tetrachloro-m-xylene) were measured as 95.0 % and
%111.5, respectively.
Table 4.13: Results of PCB Pollution of Ankara Creek
Total PCBs
(ng/g dry
weight)
Aroclor 1016
(ng/g dry
weight)
Aroclor 1260
(ng/g dry
weight)
Minimum-Maximum 5.0 – 777.6 ND – 62.3 5.0 – 715.3
Mean ± standard
deviation 85.9 ± 163.8 14.5 ± 15.1 73.4 ± 150.5
Median 37.1 10.2 28.2
Geometric Mean 42.8 9.8 34.5

60
When the results are reviewed, highly chlorinated PCBs (represented by Aroclor
1260) are dominant when compared to low chlorinated PCBs. Highly chlorinated
PCBs are expected to be originating from old equipments improperly disposed into
the dumping area, as well as from waste transformer oils.
The graph that is formed by alignment of PCB results in the line of flow of the creek
is construed by using land use and industrialization data of the region (Figure 4.6).
Accidents during deposition and transportation of PCBs in industries, leakage and
spills caused by natural disasters and direct discharge of PCBs formed
unintentionally during production can cause PCB pollution. There is a concentrated
PCB pollution at the downstream of wastewater treatment plant that treats municipal
wastewater and leakage of dump site. PCBs may be used as fume retardant in cement
industry, as cutting oil in metal industry, in transformer and capacitor oils and in
production of some chemicals and paints.
Figure 4.6: Illustration of PCB Pollution in terms of potential sources along Ankara
Creek

61
When the PCB concentrations from the different banks of the river are compared
with each other, a good correlation was observed. That is, both banks of the river
contain similar PCB concentrations, in terms of both Aroclor 1016 and 1260. An
exception, however is observed for the case of Sample No: 20, where a significantly
high concentration is analysed. Hence, similar sedimentation patterns are probably
affecting both banks of the river, resulting in such a correlation of pollutant
concentrations. No apparent correlation is observed between the amount of organic
carbon present in sediments and the PCB concentration associated with those
sediments.
When results of Ankara Creek are compared with the similar river sediment PCB
results from literature, Ankara Creek have comparatively lower values in terms of
PCB pollution (Table 4.14).
Table 4.14: PCB Analysis Results of Similar River Sediments
Receiving Environment Basis Amount
(μg/g dry
weight)
Reference
Hudson River A1016/A1260 0.07-41.6 The State of
New York, 1997
Shizuoka Tagonoura 0.084-79 Hosomi, 2005
Osaka Kizu River 4.4-15.9 Hosomi, 2005
Nagoya Ohe River ND-145 Hosomi, 2005
Ehime Iyo- Mishima Kawanoe 0.29-12.2 Hosomi, 2005
Boston, Neponset River A1016/A1260 ND-1.09 MassDEP, 2007
Arrone River, Italy 58PCBs 0.01-0.2 Bazzanti, 1997
Nil River 18PCBs 0.32-5.24 El-Kady, 2007
The Arkona Basin and Oder
River Eustrain System 23PCBs 0.13-16.26 Dannenberger,
1997
Niagara River 14PCBs 0.0018-0.124 Samara, 2005
Ebro River, Spain 13PCBs 1.77 Fernandez, 1999
Ankara Creek A1016/A1260 0.006-0.78 This study

62
Pollution monitoring study performed for Neponset River has similarities with
Ankara Creek study in terms of aim, sampling and results. This study is performed
by Department of Environmental Protection (MassDEP,2007) in the scope of
―Massachusetts Contingency Plan‖. In the study, it is stated that if PCB level at soil
is greater than or equal to 2 ppm, it could pose a potential health risk over a lifetime.
Moreover, if PCB level at soil is greater than or equal to 10 ppm, direct contact
should be prevented. The sampling results from Ankara Creek reveal no such need.
By determining areas of Ankara Industrial zone that include these industries,
potential pollution sources are proposed. For more detailed investigation of pollution
sources, congener specific analysis are presented in the next section together with
modeling of data using the Chemical Mass Balance Model
I. Comparison with Legislative Limits
There is currently no regulation on contaminated sites in Turkey. However, recently
a Draft By-law of Point Source Soil Pollution Control was prepared by Ministry of
Environment and Forestry considering the European Union Soil Framework
Directive. The aim of this regulation is to prevent soil from pollution and point
source pollution and introduce pollution prevention as compatible with sustainable
development objectives. In this draft by-law, limits for PCBs are mentioned (Table
4.15). Generic Pollutant Limit Values are concentrations that measured by
considering area as it will be residential area and considering affects on human
health. Moreover, people are assumed to be exposed to maximum amount for a
reasonable time period in the measurements of these values.
In the results of Ankara Creek, Aroclor 1016 concentrations are found to be 0–0.062
ppm, with a mean of 0.012 ppm. These values are lower than the limit values
mentioned in the draft by-law. Therefore, it is not mandatory to perform a pollution
prevention or remediation study for Aroclor 1016, considering the draft by-law.
Moreover, Aroclor 1260 concentrations are found to be 0.005–0.715 ppm, and 0.07
ppm as mean. %8.7 of these pollution concentration values are higher than the limit
value 0.2 mg/kg, for absorption via swallowing of soil and skin contact. All of the

63
pollution concentration for Aroclor 1260 is higher than limit value 0.003 mg/kg that
is for transmission of pollutants to ground water and drinking of ground water. If this
draft by-law comes into force, Pollution Indication Parameters would be measured
for surface soil, ground water and gaseous samples and the area would be examined
whether it is a ―Debatable Area‖ or not. After necessary auditing is performed,
grading evaluation that is specified for hazardous waste with known source by by-
law is performed. At the end of the evaluation, area is defined as ―Need to be
Observed‖, ―No Need to Be Observed‖ or ―Contaminated Site‖. For contaminated
sites, ―Remediation Plan and Evaluation Report‖ and ―Remediation Application and
Monitoring Report‖ would be prepared and remediation action would be started.
Table 4.15: Draft By-law of Soil Pollution Control - Generic Pollutant Limit Values
Absorption by
Swallow of
Soil and Skin
Contact
(mg/kg)
Outdoor
Inhalation of
Volatile
Chemicals
(mg/kg)
Outdoor
Inhalation
of Dust
(mg/kg)
Transmission of
Pollutants to Ground
Water and Drinking
of Ground Water
(mg/kg)
PCB 1 0.2
e -
i - 0.003
e,g
PCB 2 6
e -
f - 0.09
e,g
1 For all mixtures except Aroclor 1016.
2 Only for Aroclor 1016 mixture.
e cancer risk is taken as ―10-6‖ in the calculation of this value.
f There is no toxicologic value for this exposure type.
g HEL value is used for calculation of this value.
i Limit value could not be calculated for this exposure type since there are no Di and Dw values for
this pollutant.
Draft By-law of Soil Pollution Control has not come into force yet. The only other
regulation potentially relevant is the By-Law of Soil Pollution Control, which aims
to prevent soil pollution and take necessary precautions about use of sludge from
waste water treatment plants and compost on soil. The limit value for polluted soil
for PCBs is 0.5 mg/kg. Sample taken from the downstream of Ankara Central
Wastewater Treatment Plant has higher pollution than the value mentioned by this
by-law.

64
B. Congener Specific Quantification
I. Congener Specific Pollution Results
Ankara Creek sediment samples were analyzed in terms of seven individual PCB
congeners listed in the ―Working Document on Sludge‖ that complements the
European Directive 86/278/CEE. PCB congeners #28, #52, #101, #118, #153, #138
and #180 were analyzed by GC/ECD and congener profiles are shown in Figure 4.8.
The average congener distribution for all samples is given in Figure 4.7 with
standard deviation of the means. The average congener profile was figured out by
calculating the mean of samples except X20, X23 and X24. Because these samples
are 30-39 times more polluted than other samples and bias the arithmetic mean and
the subsequent standard deviations.
Figure 4.7: Average Congener Profiles of Ankara Creek Samples
(except Samples X20, X23 and X24)
-0,0005
0,0000
0,0005
0,0010
0,0015
0,0020
0,0025
0,0030
ng/
g
Congener IUPAC Numbers
#28 #52 #101 #118 #153 #138 #180

65
Fig
ure
4.8
: C
ongen
er P
rofi
les
for
19 S
ample
s of
Ankar
a C
reek
rep
roduce
d u
sing 7
congen
ers
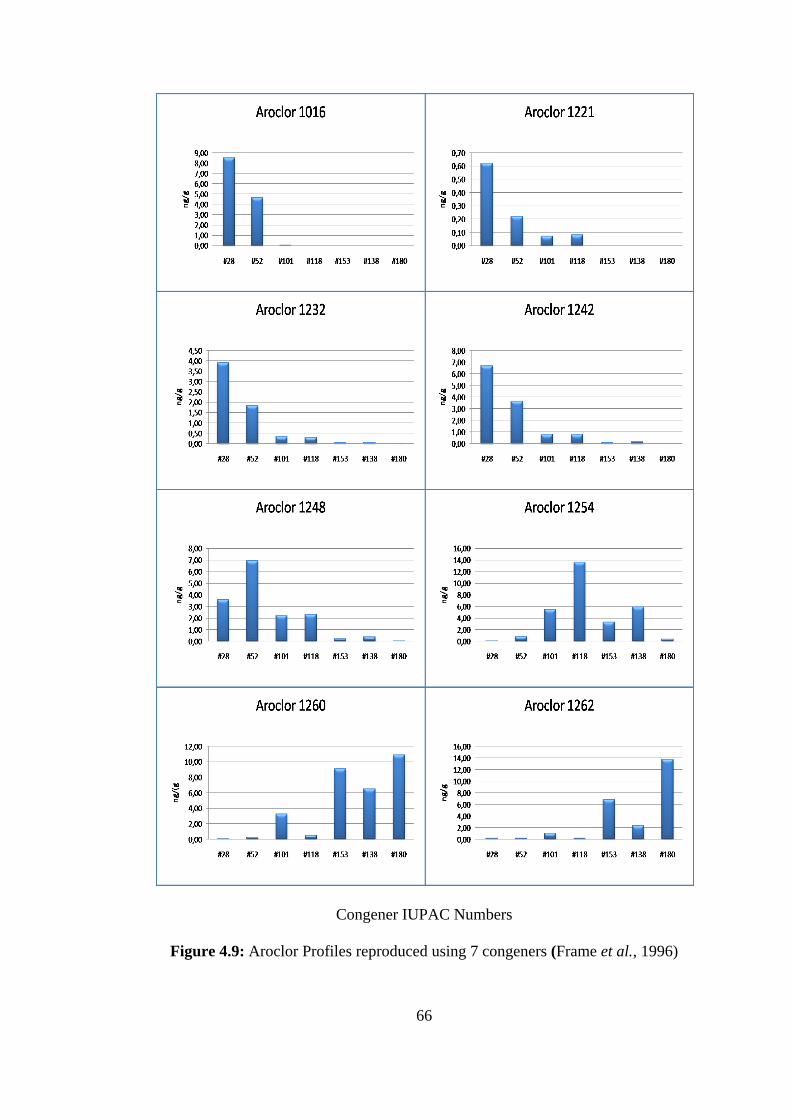
66
Congener IUPAC Numbers
Figure 4.9: Aroclor Profiles reproduced using 7 congeners (Frame et al., 1996)

67
Congener IUPAC Numbers
Figure 4.10: Clophen Profiles reproduced using 7 congeners (Ishikawa et al., 2007)
Since PCBs are always introduced as mixtures into the environment, Aroclor and
Clophen profiles are given in Figure 4.9 and 4.10 to make comparison with the
average congener profiles of Ankara Creek. As a result of the comparison, the
averages of congeners do not resemble any single Aroclor mixture. The average
profile, however, show some resemblance to the highly chlorinated Clophen
mixtures: A60 and T64.

68
4.3.3 Assessment of Effects on Human Health
A. Quantifying as Total PCBs
Table 4.16: Toxic Equivalency Factor (TEF) and Toxic Equivalent Concentration
(TEQ) Values of Ankara Creek
Sample TEF TEQ (ppm)
Mean Median Geometric Mean
Aroclor 1016 (ppm) 0.09 1.25±1.25*10-3
0.90*10-3
0.80*10-3
Aroclor 1260 (ppm) 3.5 0.26±0.49 0.10 0.12
Total PCBs (ppm) 0.26±0.49 0.10 0.12
Dioxin-like PCB congeners of have several toxic effects on human health due to their
chemical and thermal stability. Toxic Equivalency Factor (TEF) for dioxin-like PCB
congeners has been calculated in scope of the study of Rushneck (2004). By using
concentrations of dioxin-like congeners included in Aroclor 1016 and Aroclor 1260,
TEF values have been figured out as 0.09 and 3.5, respectively. By multiplying TEF
values with Aroclor 1016 and Aroclor 1260 concentrations of the samples, Toxic
Equivalent Concentrations (TEQ) are calculated (Table 4.16). World Health
Organization (WHO) has established a tolerable daily intake for the whole group of
dioxin-like compounds of 1–4 pg TEQs/kg body weight/day (Van Leeuwen and
Younes, 2000) (WHO/UNEP/ILO, 1980). For an average person, 70 kg in weight,
the tolerable daily intake is 70–280*10-6
μg TEQ. Considering absorption by
swallowing of soil and through dermal contact, average 0.258 μg TEQ/g dry weight
TEQ value of Ankara Creek samples can said to cause health problems.
B. Congener Specific Quantification
The study of Rushneck (2004) on dioxin-like PCB congeners was performed for nine
Aroclor mixtures (Aroclor 1221, 1232, 1016, 1242, 1248, 1254, 1260, 1262 and
1268). Among the congeners included by these mixtures, dioxin-like congeners was
mentioned by their concentrations in the mixture and their TEF values. These dioxin-
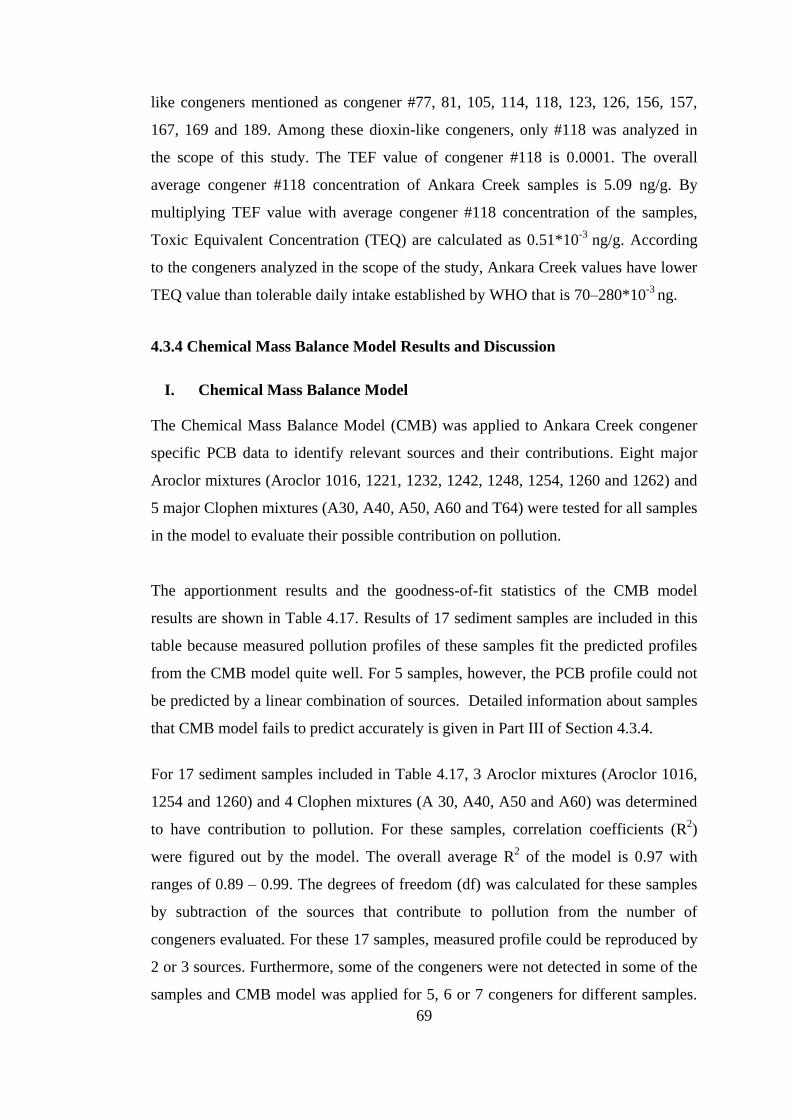
69
like congeners mentioned as congener #77, 81, 105, 114, 118, 123, 126, 156, 157,
167, 169 and 189. Among these dioxin-like congeners, only #118 was analyzed in
the scope of this study. The TEF value of congener #118 is 0.0001. The overall
average congener #118 concentration of Ankara Creek samples is 5.09 ng/g. By
multiplying TEF value with average congener #118 concentration of the samples,
Toxic Equivalent Concentration (TEQ) are calculated as 0.51*10-3
ng/g. According
to the congeners analyzed in the scope of the study, Ankara Creek values have lower
TEQ value than tolerable daily intake established by WHO that is 70–280*10-3
ng.
4.3.4 Chemical Mass Balance Model Results and Discussion
I. Chemical Mass Balance Model
The Chemical Mass Balance Model (CMB) was applied to Ankara Creek congener
specific PCB data to identify relevant sources and their contributions. Eight major
Aroclor mixtures (Aroclor 1016, 1221, 1232, 1242, 1248, 1254, 1260 and 1262) and
5 major Clophen mixtures (A30, A40, A50, A60 and T64) were tested for all samples
in the model to evaluate their possible contribution on pollution.
The apportionment results and the goodness-of-fit statistics of the CMB model
results are shown in Table 4.17. Results of 17 sediment samples are included in this
table because measured pollution profiles of these samples fit the predicted profiles
from the CMB model quite well. For 5 samples, however, the PCB profile could not
be predicted by a linear combination of sources. Detailed information about samples
that CMB model fails to predict accurately is given in Part III of Section 4.3.4.
For 17 sediment samples included in Table 4.17, 3 Aroclor mixtures (Aroclor 1016,
1254 and 1260) and 4 Clophen mixtures (A 30, A40, A50 and A60) was determined
to have contribution to pollution. For these samples, correlation coefficients (R2)
were figured out by the model. The overall average R2 of the model is 0.97 with
ranges of 0.89 – 0.99. The degrees of freedom (df) was calculated for these samples
by subtraction of the sources that contribute to pollution from the number of
congeners evaluated. For these 17 samples, measured profile could be reproduced by
2 or 3 sources. Furthermore, some of the congeners were not detected in some of the
samples and CMB model was applied for 5, 6 or 7 congeners for different samples.

70
Therefore, df was figured out for samples separately. The χ2 value for a good fit is
based on the df and the relative error is determined according to these values as
explained in Materials and Method chapter. The overall relative error is < 0.1 – 0.47.
According to these overall averages, measured profiles of 17 samples illustrate a
satisfactory fit to predicted profiles of the CMB model.
Typically, linear combinations of Clophen mixtures yield more satisfactory predicted
profiles. Mainly, highly chlorinated Clophen mixtures (Clophen A50 and A60) are
major contributors and minor contributions from low chlorinated Clophen mixtures
(Clophen A30 and A40). A similar pattern is seen for Aroclor mixtures.
Table 4.17: Chemical Mass Balance Model Results and Statistics*
Apportionment Results (%) Goodness of Fit Results
Sam
ple
Aro
clor
1016
Aro
clor
1254
Aro
clor
1260
Clo
ph
en
A30
Clo
ph
en
A40
Clo
ph
en
A50
Clo
ph
en
A60
R2 df χ
2 R.E.
a
x1 14.05 85.95 0.99 3 0.37 0.17
x2 8.03 22.43 69.54 0.89 4 4.91 0.47
x3 11.15 18.29 70.56 0.96 4 1.92 0.38
x4 6.97 21.77 71.25 0.97 4 1.11 0.34
x5 23.65 76.35 0.99 3 0.30 < 0.1
x6 3.70 14.11 82.19 0.96 4 1.66 0.37
x7 21.81 78.19 0.98 3 0.58 0.27
x8 14.29 85.71 0.98 3 0.50 0.23
x9 1.83 18.40 79.77 0.98 4 0.87 0.32
x10 21.78 78.22 0.99 3 0.34 0.14
x14 5.95 31.80 62.25 0.95 4 2.03 0.38
x18 7.49 25.08 67.43 0.99 4 0.45 0.22
x19 11.70 51.61 36.69 0.98 4 1.02 0.32
x20 6.05 23.07 70.89 0.99 4 0.28 0.13
x21 16.52 15.88 67.61 0.96 4 1.77 0.37
x22 3.74 17.89 78.38 0.98 3 0.59 0.31
x23 0.09 13.06 86.85 0.98 4 0.70 0.30
* Measurements that have relative errors of 0.4 are presented.
a relative error corresponding to χ
2=degrees of freedom (df)
R.E. ranges between < 0.1 to 0.5 (> 0.5 is unsatisfactory) (Section 3.2)

71
There are only two samples that seen to be better represented by combination of
Aroclors rather than Clophens. Trials are performed with the combinations of
Clophen mixtures for these two samples; however, the predicted profiles do not show
as good a fit as Aroclors. Congener # 118 is typically high proportioned in these
samples in comparison with rest of the samples. Aroclor 1254 is an important
contributor for these samples since elevated congener # 118 is characteristic for this
mixture. There is no Clophen mixture that is dominated by congener # 118.
Highly chlorinated Aroclors (A1254 and A1260) and Clophens (A50 and A60), that
are characteristic contributors for all Ankara Creek sediment samples, are mainly
used in electrical equipments due to their higher stability. Besides the illegal disposal
and accidental releases from these closed systems, past open/partially open and
uncontrolled uses, past disposal activities are the typical sources of PCBs in the
environment (Abramowicz, 1990).
Clophen mixtures were produced in Germany. The production of Clophen mixtures
between 1930 and 1983 corresponds to 12% of 1.3 million tones worldwide
production (Table 2.2). Import records (Section 2.5) indicate a significant amount of
import of chemicals from Germany under the category of ―PCBs, PCTs and PBBs‖.
The results obtained from CMB model are consistent with these official records.
Historically, many large companies manufactured PCB containing transformers,
capacitors, electric motors, hydraulic and heat transfer systems. AEG which is a
division in Germany was one the manufactures of PCB (Clophen) containing
transformers and capacitors (UNEP, 1999). A case study for Germany (Neumeier,
1998) indicates that about 90% of Clophens produced was used in closed systems,
mainly transformers and capacitors.
Clophens were produced by the Bayer AG between 1974 and 1983 and most of the
PCBs produced were used in closed systems (transformers, condensers, hydraulic
fluid). The production of PCB increased until 1980 with an increased proportion
going into export. In 1983, the last year of PCB production by the Bayer AG, 90% of
the PCB produced was exported (Fiedler, 1997).

72
Aroclor mixtures were produced in USA between 1930 and 1977. The production of
Aroclor mixtures is about half of the worldwide PCB production for years 1930 to
1993. About 5% of the transformers and 95% of the capacitors produced in the USA
were filled with PCBs between these years. The 68000 tonnes (about 10% of total
production) was exported to unspecified countries (ATSDR, 2000).
Aroclors and Clophens were no longer used in the production of capacitors and
transformers. Nevertheless, the life expectancy of transformers containing PCBs is
greater than 30 years, and the life expectancy of capacitors ranges from 10 to 20
years, depending on the electrical application (Fiedler, 1997; ATSDR, 2000).
There is no specific import record of PCB for Turkey until 1996; however, the
import records regarding ―other type of concoctions used in the chemical industry‖
for years 1989 to 1996 indicates serious amount of import from Germany and USA.
Ankara Sincan Industrial Zone went into production in 1990. Electrical systems
industry regarding electricity production and distribution, mechanical and
petrochemical industries was build in the industrial zone in mid-80’s. Besides using
imported equipments and machines, there are foreign investors and manufacturers
operate in the industrial zone (Industrial Database).
A typical example of a congener distribution calculated by the CMB model is given
in Figure 4.11, for sample X6. The predicted profiles fit the measured profiles quite
well. However, #101 is over estimated and #138 and #180 is under estimated, as is
the case for almost all of the samples.
The measured PCB pollution vs. predicted profile of CMB Model graphs for the
samples are illustrated in Figure 4.12. By comparing the trendlines of these scatter
graphs with the best-fit lines; the congeners that avoid best- fitting were determined
and marked on Figure 4.12.
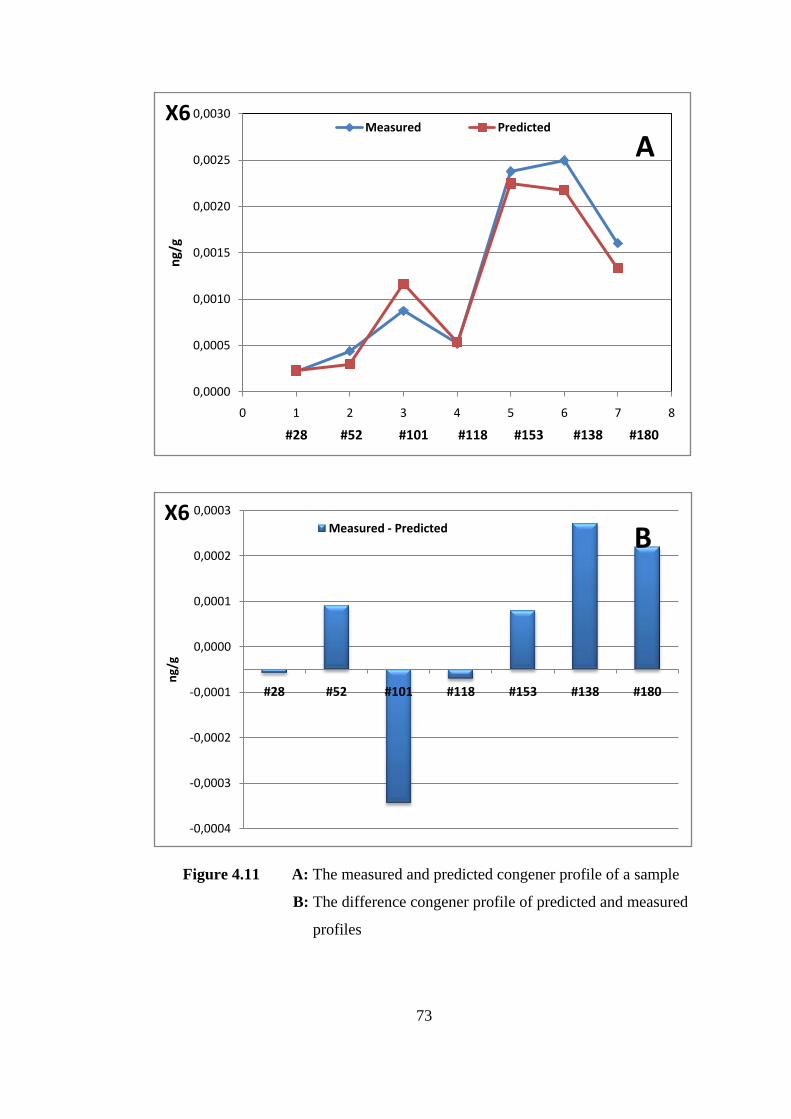
73
Figure 4.11 A: The measured and predicted congener profile of a sample
B: The difference congener profile of predicted and measured
profiles
0,0000
0,0005
0,0010
0,0015
0,0020
0,0025
0,0030
0 1 2 3 4 5 6 7 8
ng/
g
Measured Predicted
#28 #52 #101 #118 #153 #138 #180
AX6
-0,0004
-0,0003
-0,0002
-0,0001
0,0000
0,0001
0,0002
0,0003
#28 #52 #101 #118 #153 #138 #180
ng/
g
Measured - PredictedX6
B

74
Figure 4.12: Measured vs. Predicted PCB Pollution for Ankara Creek Samples
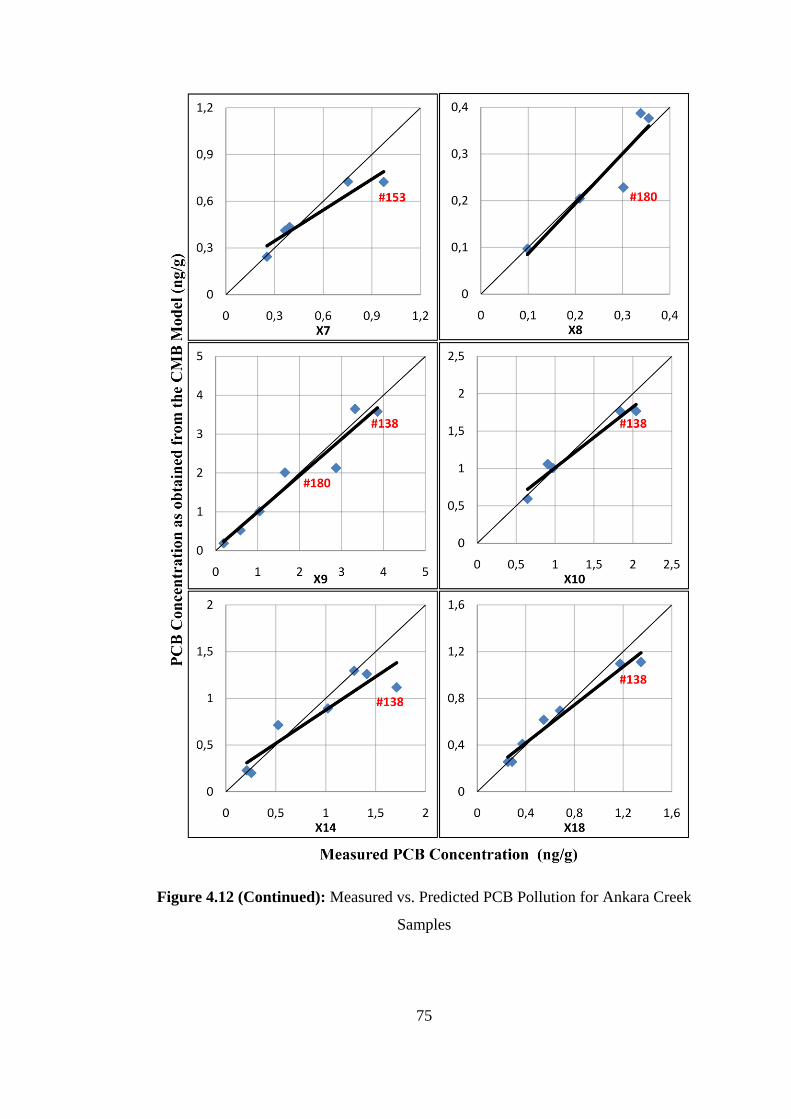
75
Figure 4.12 (Continued): Measured vs. Predicted PCB Pollution for Ankara Creek
Samples

76
Figure 4.12 (Continued): Measured vs. Predicted PCB Pollution for Ankara Creek
Samples
A typical trend for predicted PCB profiles is that congener # 101 is over estimated
for 67% of all samples and 77% of the samples that have R.E. < 0.5. However, some

77
samples cannot be identified due to the high # 101 concentrations. Understanding
this kind of inconsistencies between predicted and measured profiles require
analyzing more congeners and providing better identification of samples. By this
way, better identification and apportionment of sources can be determined by CMB
model.
For some samples, profile prediction was performed for 5 congeners since low
chlorinated congeners #28 and # 52 were not detected and quantified in GC/ECD
analysis. These congeners are included in the low chlorinated Aroclor and Clophen
mixtures. Main dechlorination mechanism of these mixtures is biological
degradation. Partitioning of biologically degraded mixtures in nature is different
from original mixtures. Water solubility of low chlorinated PBCs is higher than high
chlorinated PCBs. Some part of dissolved PCBs attach to particulate matter. Despite
volatilization of these low chlorinated mixtures are slow, an important part of total
loss may be caused by volatilization over time (FAO, 2000).
A general trend for predicted PCB profiles is that congeners # 138 and # 180 and
sometimes # 118 and # 153 are measured in high concentrations when compared to
the predicted profiles. There may be two possible reasons for accumulation of such
congeners;
(1) They may have been carried downstream from contamination sources located
upstream,
(2) Their concentration may be enhanced due to their production from higher
chlorinated congeners via the action of anaerobic microorganisms (anaerobic
dechlorination).
Regarding the first explanation, # 138, # 180 and # 118 are not regarded as easily
water soluble congeners; hence they are expected to be associated with sediments.
Their transport with sediments however would result in higher concentration of other
highly chlorinated congeners such as # 153. This may be the case for some samples
such as X2 and X14. Hence they cannot be identified by linear combinations of

78
Clophen mixtures. Moreover, they have higher concentrations than the linear
combinations of Aroclor mixtures that elevated concentrations of these congeners.
The second explanation may be further investigated via reviewing the relevant
literature on anaerobic dechlorination of PCB contamination in sediments. A
summary of which is presented in Table 4.18 and 4.19.
II. Anaerobic Dechlorination Processes of PCBs and Discussions
Anaerobic dechlorination of PCBs is one of the environmental processes that affect
their fate in the nature. Anaerobic dechlorination processes are determined by: (1)
typical PCB dechlorination products that are not found in the typical PCB mixtures,
(2) a consistent decrease in the congeners having the same chlorine configuration on
one ring, or consistent removal of chlorines from a certain position, (3) the
achievement of a reasonable mass balance between congeners that are diminished,
and the ones that are enriched. Six major dechlorination activities are illustrated in
Table 4.18. (Imamoglu, 2001)
Table 4.18: Summary of Characteristics of PCB dechlorination activities
(Imamoglu, 2001)
Dechlorination
Activity
Homolog Substrate
Range Susceptible Aroclors
M di-tetra CB1 1242, 1248, 1254
Q di-tetra CB 1242, 1248, 1254, 1260
H' tri-penta CB 1242, 1248, 1254, 1260
H' tetra-hepta CB 1242, 1248, 1254, 1260
P tetra-hepta CB 1242, 1248, 1254, 1260
N penta-nona CB 1254, 1260 1 CB – chlorobiphenyl
Processes M and Q act on relatively low congeners. Process H, P and N are effective
on highly chlorinated congeners. Table 4.19 summarizes the potential anaerobic
dechlorination pathways for congeners analyzed in Ankara Creek sediment samples.

79
Table 4.19: Anaerobic Dechlorination Pathways reproduced for 7 congeners
(Imamoglu, 2001)
CONGENERS PROCESS H
CONGENERS PROCESS H'
MOTHER DAUGHTER
MOTHER DAUGHTER
#26 #70, #118,
#67
#26
#70, #118,
#67
#28 #60, #74
#28/31 #60, #74
#52 #101, #153
#52 #101
#70 #118 #26
#70 #118 #26
#101 #153 #52
#101 #52
#118 #67, #26, #70
#118 #67, #26, #70
#138 #87, #99
#153 #101, #52
#180 #146, #141,
#92
CONGENERS PROCESS P
CONGENERS PROCESS N
MOTHER DAUGHTER
MOTHER DAUGHTER
#28/31 #74
#28/31 #118, #105
#52 #101, #153
#47
#85, #99,
#138, #153,
#128
#70 #118 #26
#52
#92 #180,
#146, #141
#66/95 #118, #156 #53
#101 #153 #52
#118 #156 #66, #64, #32
#118 #67, #26, #70
#138 #180, #17 #99, #85, #47
#138 #87, #97
#153 #180, #194 #199, #47
#153 #95
#180 #194 #153, #138,
#137,#85, #99
#180 #146, #141,
#92
CONGENERS PROCESS M
CONGENERS PROCESS Q
MOTHER DAUGHTER
MOTHER DAUGHTER
#18 #52, #44 #4
#8 #22, #28 #1
#28/31 #66, #70,
#60 #8
#28/31 #60, #74 #7, #8, #1, #9
#52 #18, #4
#66/95 #28, #52, #45,
#19

80
For samples that are satisfactorily predicted by linear combinations of Clophen
mixtures have typical over/ under estimated congeners. These might be described by
anaerobic dechlorination of sediments.
Sample X23 has the highest PCB concentration among all Ankara Creek samples.
For this sample, congener # 153 is over-estimated and congener # 52 is under-
estimated. This may occur due to the congener # 52 production from congener # 153
via anaerobic dechlorination process H. This pattern is also seen for X21. For sample
X19, formation of congener # 101 by anaerobic dechlorination of congener # 153 via
process H might be argued from high # 101 and relatively lower # 153 in measured
profile. Furthermore, for sample X4, congener # 101 is over-estimated while
congener # 52 is under-estimated that may indicate anaerobic dechlorination of
congener # 101 to congener # 52 via process H and/or P.
III. Discussion of Samples with Unsatisfactory Model Fits
For Samples X11, X12, X13, X17 and X24, major 8 Aroclor mixtures (Aroclor 1016,
1221, 1232, 1242, 1248, 1254, 1260 and 1262) and 5 major Clophen mixtures (A30,
A40, A50, A60 and T64) were tested for all samples in the model to identify the
sources of pollution and to evaluate their possible contributions. The apportionment
and goodness-of-fit results are given in Table 4.20. The goodness-of-fit statistics
indicates that CMB model fails to accurately predict the congener profiles associated
with these samples.
CMB Model Results and Statistics given in Table 4.20 is formed considering highest
R2 and R.E. values among trials performed with different combinations of Aroclor
and Clophen mixtures. Source combinations used in trials is chosen according to the
characteristics of Aroclor and Clophen mixtures and their correlations with elevated
congeners and patterns of measured congener profiles.

81
Table 4.20: Chemical Mass Balance Model Results and Statistics for Samples with
Unsatisfactory CMB Model Fits*
Apportionment Results (%) Goodness of Fit
Results
Sa
mp
le
Aro
clo
r 1
016
Aro
clo
r 1
248
Aro
clo
r 1
254
Aro
clo
r 1
260
Clo
ph
en A
30
Clo
ph
en A
50
Clo
ph
en A
60
Clo
ph
en T
64
R2 df χ
2 R.E.a
x11 -10.3 50.03 60.29 0.84 4 6.47 0.54
x12
(a) 0.81 28.04 71.15 0.46 4 3.90 0.40
x12
(b) 1.29 14.32 84.38 0.84 4 6.92 0.55
x13 6.60 23.97 69.44 0.82 4 7.92 0.58
x17 21.71 140.57 67.73 0.86 4 5.9 0.52 * Measurements that have relative errors of 0.4 are presented.
a relative error corresponding to χ
2=degrees of freedom (df)
b No Result
The measured vs. predicted congener concentrations for samples with unsatisfactory
CMB model fits are illustrated in Figure 4.13. The congeners avoiding best- fitting
are determined by comparing the best-fitting lines illustrated on figures with the
trendlines of these scatter graphs. The measured and predicted congener profiles are
also given in Figure 4.14.

82
Figure 4.13: Measured vs. Predicted PCB Concentrations for Ankara Creek Samples
with Unsatisfactory CMB Model Fits

83
Figure 4.14: Measured and Predicted Profiles for Ankara Creek Samples with
Unsatisfactory CMB Model Fits

84
For these samples, very high portions of congener #101 are typical. This congener is
present as 0.04-5.49% for Aroclor mixtures and 0.39-8.90% for Clophen mixtures
and not elevated in any of these mixtures. Having congener profiles that do not
resemble any of the Aroclor and Clophen mixtures indicates the presence of an
alteration mechanism. For samples X12, X13 and X17, congener # 153 is under-
estimated besides over-estimation of congener #101 in comparison with the typical
example of a congener distribution calculated by the CMB model (X6) (Figure 4.15).
This case may be described by anaerobic dechlorination of congener # 153 and
accumulation of congener # 101 via process H. For sample X11, having elevated
amount of congener # 52 may be caused by anaerobic dechlorination of congener #
101 that has lower amount than predicted profile.
Figure 4.15: Measured Congener Profiles for Samples with Unsatisfactory CMB
Model Fits
Congener profile of sample X16 could not be measured via GC/ECD analysis. Apart
from the above samples, none of the congeners were detected or quantified. For
sample X24, beside low chlorinated congeners # 28 and # 52, congener # 118 could
not be quantified; therefore this sample could not be satisfactorily identified by linear
combinations of PCB mixtures. Analyzing more congeners for samples with
unsatisfactory CMB model fits might be beneficial for better identification of
pollution sources and degradation mechanisms.
0
0,2
0,4
0,6
0,8
1
1,2
#28 #52 #101 #118 #153 #138 #180
Norm
ali
zed
Con
cen
tra
tio
ns
Congener IUPAC Numbers
X6
X12
X13
X17
↓↓↓
↓

85
CHAPTER 5
CONCLUSION
5.1 CONCLUSIONS
EPA Method 3540C Soxhlet Extraction, EPA Method 3630C Silica Gel Cleanup,
EPA Method 8082A PCBs by Gas Chromatography, EPA Method 3665A Sulfuric
Acid-Permanganate Cleanup and EPA Method 3660B Sulfur Cleanup are
satisfactorily established within the laboratories of METU. This is verified by
laboratory control samples, Standard Reference Material and method blank analysis
and satisfactory recoveries of surrogate standard in samples.
The results of preliminary investigation study done for Lake Eymir designates a
measurable amount of PCB pollution around lake. Determining significant amount of
pollution in the surface indicates that PCBs were carried to the lake in the near past
and contamination of lake may progress due to highly contaminated area around the
lake.
Investigation study done for Ankara Creek presents relatively high PCB pollution in
terms of national and international regulations. Furthermore, effects on humans are
evaluated via application of WHO-TEQ guidelines on PCB data (both as Total-PCBs
and on a congener specific basis).
A CMB Model used by Imamoglu (2001) was applied to Ankara Creek PCB data set.
Results show that a significant portion of pollution can be explained by linear
combinations of PCB mixtures manufactured in Germany (Clophen). Then findings
are consistent with input research indicating Germany as an important import

86
country. Discrepancies between measured PCB concentrations and predicted profiles
obtained from the CMB model are interpreted by taking into account important fate
processes acting on PCBs in the environment.
For both sites investigated as a part of this study, significantly high PCB
contamination requiring immediate remedial action was not observed. Both cases,
however, point to the presence of past unsuitable disposal practices. In the case of
Eymir Lake, a further detailed study is warranted. In the case of Ankara Creek,
according to the comparison made with generic pollutant limit values of Draft By-
law of Soil Pollution Control, any contact with the creek sediments should be
avoided.
5.2 RECOMMENDATIONS FOR FUTURE STUDY
The preliminary pollution investigation study done for Lake Eymir forms a baseline
for future studies. Preliminary results will be helpful in terms of investigating
contamination and degradation mechanisms. The resembling pattern of PCB
pollution to Aroclor mixture profiles will be useful for modeling studies for the lake.
The results obtained in the investigation of pollution in Ankara Creek are represented
the potential sources of pollution and discharge points. The potential sources of
pollution and source contributions are obtained from the CMB model. Regarding this
information, analysis including higher number of congeners can be performed and a
Factor Analysis Model might be applied. By identifying dechlorination mechanisms
in detail, dechlorination models and effective remediation strategies might be
developed for the sites investigated.

87
REFERENCES
Altinbilek D.(1995) GölbaĢi Mogan Eymir Gölleri Ġçin Su Kaynakları ve Çevre
Yönetimi Plan Projesi. Ankara Büyük Belediye BaĢkanlığı Ankara Su ve
Kanalizasyon Idaresi Genel Müdürlüğü.
AMAP (2000). ―PCB in the Russian Federation: inventory and proposals for priority
remedial actions.‖ Executive summary. AMAP report 200082-7971-008-6; 2000. 3,
27 pp.
Abramowicz DA.(1990). ―Aerobic and anaerobic biodegradation of PCBs: A
review.” Critical Reviews in Biotechnology, 10(3), 241-251.
Arinç, E., Sen, A., and Bozcaarmutlu, A. (2000). "Cytochrome P4501A and
associated mixed function oxidase induction in fish as a biomarker for toxic
carcinogenic pollutants in the aquatic environment." Pure and Applied Chemistry,
72(6), 985-994.
Aydın, M. E., Sarı, S., ve Özcan, S. (2003). "Konya Kati Atik Deponi Sahasindaki
Poliklorlu Bifenil Bilesiklerinin (PCB) Belirlenmesi." (In Turkish), V.Ulusal Çevre
Mühendisligi Kongresi, Ankara, 216-224.
Basel Convention (1997). ―Technical Guidelines on Wastes Comprising or
Containing PCBs, PCTs and PBBs (Y10).‖, February.
Basturk, O., Dogan, M., Salihoglu, I., and Balkas, T. (1980). "DDT, DDE, and PCB
residues in fish, crustaceans and sediments from the Eastern Mediterranean coast of
Turkey." Marine Pollution Bulletin, 11(7), 191-195.
88
Bazzanti M,, Chiavarini S., Cremisini C. and Soldati P. (1997). ―Distribution of PCB
Congeners In Aquatic Ecosystems: A Case Study.‖ Environment International, Vol.
23, No. 6, pp. 799-813.
Bowadt W., Johansson B., Wunderli S., and Zennegg M., Alencastro L.F. and
Grandjean D. (1995). ―Independent Comparison of Soxhlet and Supercritical Fluid
Extraction for the Determination of PCBs in an Industrial Soil,.‖ Analitical
Chemistry, Vol.65, p. 2424–2430.
Breivik K., Sweetman A., Pacyna J.M., Jones K.C. (2007). ―Towards a global
historical emission inventory for selected PCB congeners — A mass balance
approach, 3. An update.‖ Science of the Total Environment 377, 296–307.
Cameron P., Murgatroyd K. (1997). ―Good Pharmaceutical Freeze-Drying Practice.‖
Interpharm/CRC. Internet: books. google.com (Last Access: 05.12.2009)
Cetin, B, Yatkın, S. Bayram, A, ve Odabası, M. (2007). "Ambient concentrations and
source apportionment of PCBs and trace elements around an industrial area in Izmir,
Turkey." Chemosphere, 69(8), 1267-1277.
Cindoruk, S. S., Esen, F., and Tasdemir, Y. (2007). "Concentration and gas/particle
partitioning of polychlorinated biphenyls (PCBs) at an industrial site at Bursa,
Turkey." Atmos Res, 85(3-4), 338-350.
Cindoruk, S. S., Esen, F., Vardar, N., and Tasdemir, Y. (2008). "Measurement of
atmospheric deposition of polychlorinated biphenyls and their dry deposition
velocities in an urban/industrial site in Turkey." J Environ Sci Heal A, 43(11), 1252-
1260.
Cindoruk, S. S., and Tasdemir, Y. (2007a). "Characterization of gas/particle
concentrations and partitioning of polychlorinated biphenyls (PCBs) measured in an
urban site of Turkey." Environmental Pollution, 148(1), 325-333.

89
Cindoruk, S. S., and Tasdemir, Y. (2007b). "Deposition of atmospheric particulate
PCBs in suburban site of Turkey." Atmos Res, 85(3-4), 300-309.
Cindoruk, S. S., and Tasdemir, Y. (2008). "Atmospheric gas and particle phase
concentrations of polychlorinated biphenyls (PCBs) in a suburban site of Bursa,
Turkey." Environ Forensics, 9(2-3), 153- 165.
Coelhan, B., and Barlas, H. (1998). "Levels of some organochlorine contaminants in
fishes from Turkey." Fresenius Environmental Bulletin, 7, 388-395.
Coelhan, B., and Barlas, H. (2006). "Organochlorine levels in edible fish from the
Marmara Sea, Turkey." Environment International, 32, 775-780.
Çok, I., Görücü, E., Satıroglu, M. H., ve Demircigil, G. Ç. (2003). "Polychlorinated
biphenyl (PCB) levels in human milk samples from Turkish mothers." Bulletin of
Environmental Contamination and Toxicology, 70, 41-45.
Çok, I., and Satıroglu, M. H. (2004). "Polychlorinated biphenyl levels in adipose
tissue of primiparous women in Turkey." Environment International, 30, 7-10.
Çok, I., Dönmez, M. K., Satıroglu, M. H., Aydınuraz, B., Henkelmann, B., Shen, H.
Q., Kotalik, J., and Schramm, K. W. (2008). "Concentrations of polychlorinated
dibenzo-p-dioxins (PCDDs), polychlorinated dibenzofurans (PCDFs), and dioxin-
like PCBs in adipose tissue of infertile men." Archives of Environmental
Contamination and Toxicology, 55(1), 143-152.
Dannenberger D., Anderssont R. and Rappet C. (1997). ―Levels and Patterns of
Polychlorinated Dibenzo-p-dioxins, Dibenzofurans and Biphenyls in Surface
Sediments from the Western Baltic Sea (Arkona Basin) and the Oder River Estuarine
System.‖ Marine Pollution Bulletin, Vol. 34, No. 12, pp. 1016-1024.
90
Demircioglu F., Gedik K., Imamoglu I. (2009). ―Eymir Gölü ve Çevresinde
Poliklorlu Bifenil Kaynaklı Kirlilik Durumunun Ġncelenmesi‖, presented in
―Türkiye'de Çevre Kirlenmesi Öncelikleri Sempozyumu VI‖, 28-29 May 2009. (In
Turkish)
Dobson, S., van Esch, G.J. (1993). ― Environmental Health Criteria 140:
Polychlorinated Biphenyls and Terphenyls, 2. Ed.‖ World Health Organization,
International Programme on Chemical Safety (IPCS): Geneva, Switzerland.
Internet: http://www.inchem.org/documents/ehc/ehc/ehc140.htm
(Last Access: 05.12.2009)
El-Kady A.A., Abdel-Wahhab M.A., Henkelmann B., Belal M.H., Morsi M.K.S.,
Galal S.M., Schramm K. (2007). ―Polychlorinated biphenyl, polychlorinated
dibenzo-p-dioxin and polychlorinated dibenzofuran residues in sediments and fish of
the River Nile in the Cairo region.‖ Chemosphere 68, 1660–1668.
Erdogrul, O., Covaci, A., Kurtul, N., ve Schepens, P. (2004). "Levels of
organohalogenated persistent pollutants in human milk from Kahramanmaras region,
Turkey." Environment International, 30(5), 659- 666.
Erdogrul, O., Covaci, A., ve Schepens, P. (2005). "Levels of organochlorine
pesticides, polychlorinated biphenyls and polybrominated diphenyl ethers in fish
species from Kahramanmaras, Turkey." Environment International, 31(5), 703-711.
European Community Article 175, Working Document on Sludge, Third Draft,
Brussels, 27 April 2000.
Internet: http://ec.europa.eu/environment/waste/sludge/pdf/sludge_en.pdf
(Last Access: 05.12.2009)
Falandysz J. Manufacture, use, inventory and disposal of polychlorinated biphenyls
(PCBs) in Poland. Organohalog Compound 2000;46: 276–9.

91
Fernandez M.A., Alonso C., Gonzalez M.I. and Hernandez L.M. (1999).
―Occurrence Of Organochlorine Insecticides, PCBs And PCB Congeners in Waters
and Sediments Of The Ebro River (Spain).‖ Chemosphere, Vol. 38, No. 1, pp. 3343.
Fiedler, H. (1997). ―Polychlorinated Biphenyls (PCBs): Uses and Environmental
Releases. Presented at the Subregional Awareness Raising Workshop on Persistent
Organic Pollutants (POPs).‖ Bangkok, Thailand, 25-28 November 1997,
Internet: http://www.chem.unep.ch/pops/stpeter/stpete2c.html
http://www.chem.unep.ch/pops/POPs_Inc/proceedings/bangkok/FIEDLER1.html
(Last Access: 05.12.2009)
Fillmann, G., Readman, J. W., Tolosa, I., Bartocci, J., Villeneuve, J.-P., Cattini, C.,
ve Mee, L. D. (2002). "Persistent organochlorine residues in sediments from the
Black Sea." Marine Pollution Bulletin, 44, 122- 133.
Food and Agriculture Organization (FAO) (2000). ―Corporate Document Repository,
Assessing soil contamination: A reference manual, Appendix 4, Fact sheets on
chemical compounds, Polychlorinated Biphenyls (PCBs).‖
Internet: http://www.fao.org/DOCREP/003/X2570E/X2570E08.htm
(Last Access: 05.12.2009)
Frame G.M., Wagner R.E., Carnahan J.C., Brown J.F., May R.J., Smullen L.A. and
Bedard D.L. (1996). ―Comprehensive, quantitative, congener-specific analyses of
eight aroclors and complete PCB congener assignments on DB-1 capillary GC
columns.‖ Chemosphere 33 (4), 603-623.
Goodwin, S. (1998). ―Guidelines for PCBs.‖ (Lawrence Livermore National
Laboratory), Livermore, California, USA.
Greenpeace Report on Environmental, Health and Safety Conditions in Aliağa
Shipbreaking Yards, Izmir, Turkey, January 2002
92
Henry, R.C., Lewis, C.W., Hopke, P.K. and Williamson, H.J., 1984. Review of
receptor model fundamentals. Atmopheric Environment 18, pp. 1507–1515
Hosomi M., (2005).‖Removal Standards and Control Measure for Bottom Sediments
Contaminated by Toxic Substances in Japan, Tokyo University of Agriculture and
Technology‖ NATO/CCMS Pilot Study, Prevention and Remediation in Selected
Industrial Sectors: Sediments, Slovenia,
Internet: http://www.cluin.org/slovenia/download/Sediment_Remediation/Hosomi.pdf
(Last Access: 05.12.2009)
IARC (The International Agency for Research on Cancer) (1978). ―Polychlorinated
biphenyls and polybrominated biphenyls.‖ Lyon, International Agency for Research
on Cancer, pp. 43-103 (IARC Monographs on the Evaluation of the Carcinogenic
Risks of Chemicals to Humans, Volume 18).
ICF Kaiser International, Inc., (1989). ―Scrap Metal Shredding: Industry Profile and
Implications of PCB-contaminated Fluff.‖ Prepared for U.S. Environmental
Protection Agency, Washington, D.C., USA.
Imamoglu I. (2001). ―PCB Sources and Degradation in River Sediments Determined
by Receptor Modeling‖. Ph. D. Dissertation, The University of Wisconsin-
Milwaukee, USA
Imamoglu I., Li, K., ve Christensen, E. R. (2002). "Modeling polychlorinated
biphenyl congener patterns and dechlorination in dated sediments from the Ashtabula
River, Ohio, USA." Environmental Toxicology and Chemistry, 21(11), 2283-2291.
Imamoglu I., Li, K., Christensen, E. R., ve McMullin, J. K. (2004). "Sources and
dechlorination of polychlorinated biphenyl congeners in the sediments of Fox River,
Wisconsin." Environ. Sci. Technol., 38(9), 2574-2583.
93
Imamoğlu Ġ., Gedik K., Demircioğlu F., Akduman N. (2009). ―Türkiye’nin
Poliklorlu Bifeniller Kaynaklı Kirlilik Durumuyla Ġlgili ÇalıĢmalar‖, Çevre Bilim ve
Teknoloji, 3 (2), 15-38
Industry Database, Turkish Union of Chambers and Commodity Exchanges, Internet:
http://sanayi.tobb.org.tr/kitap_son2.php?kodu=410100 (Last Access: 05.12.2009)
Ishikawa Y., Noma Y., Mori Y., Sakai S. (2007). ―Congener profiles of PCB and a
proposed new set of indicator congeners‖, Chemosphere 67, 1838–1851
Jakobi, H.W. (1996). ―Produced Paper on German Practical Strategies for PCB
Disposal: Origin and Disposal of PCB contaminated Wastes.‖ Presented at the
Seminar on PCB Management, Tokyo, Japan, December 1996.
Jang J., Li A. (2001). ―Seperation of PCBs and PAHs in sediment samples using
silica gel fraction chromatography.‖ Chemosphere, Vol. 44, p. 1439–1445
Jiang K, Li L, Chen Y, Jin J. (1997). ―Determination of PCDD/Fs and dioxinlike
PCBs in Chinese commercial PCBs and emissions from a testing PCB incinerator.‖
Chemosphere, 34:941-50.
Kolankaya, D. (2006). "Organochlorine pesticide residues and their toxic effects on
the environment and organisms in Turkey." Int J Environ an Ch, 86(1-2), 147-160.
Kurt, P. B., and Özkoç, H. B. (2004). "A survey to determine levels of chlorinated
pesticides and PCBs in mussels and seawater from the Mid-Black Sea coast of
Turkey." Marine Pollution Bulletin, 48, 1076-1083.
Küçüksezgin, F., Altay, O., Uluturhan, E., and Kontas, A. (2001). "Trace metal and
organochlorine residue levels in red mullet (Mullus barbatus) from the eastern
Aegean, Turkey." Water Research, 35(9), 2327- 2332.

94
MassDEP (Department of Environmental Protection , Department of Conservation
and Recreation) (2007). ―Neponset River Dredge Spoils Assessment Result Report,
Boston and Milton, Executive Office of Energy and Environmental Affairs
(EOEEA).‖
Internet: http://www.mass.gov/dep/cleanup/sites/neppres.ppt#257,1, Neponset River
Dredge Spoils Assessment RESULTS Boston and Milton (Last Access: 05.12.2009)
Ministry of Environment and Forestry (MoEF), By-law of Waste Management
(Official Gazette: 05.07.2008 No: 26927), Turkey
Ministry of Environment and Forestry (MoEF), By-law of Control of Hazardous
Wastes (Official Gazette: 14.03.2005 No: 25755), Turkey
Ministry of Environment and Forestry (MoEF), By-law of Control of Waste Oils
(Official Gazette: 30.07.2008 No: 26952), Turkey
Ministry of Environment and Forestry (MoEF), By-law of Control of Soil Pollution
(Official Gazette: 31.05.2005 No: 25831), Turkey
Ministry of Environment and Forestry (MoEF), By-law of Control of Wastes
Containing PCB and PCT (Official Gazette: 27.12.2007 No: 26739), Turkey
Ministry of Environment and Forestry (MoEF), By-law of Hazardous Chemicals
(Official Gazette: 20.04.2001 No: 24379), Turkey
Ministry of Environment and Forestry (MoEF), Draft By-law of Point Source Soil
Pollution Control, Turkey
Ministry of Environment and Forestry (MoEF), By-law of Control of Production,
Placing on the Market and Use of Some Hazardous Substances, Concoctions and
Commodities (Official Gazette: 26.12.2008 No: 27092)
95
Ministry of Environment and Forestry (MoEF), Environmental Protection Agency
for Special Areas (EPASA)
Internet: http://www.ockkb.gov.tr/EN/Icerik.ASP?ID=132 (Last Access: 05.12.2009)
Neumeier G., The Technical Life-Cycle of PCB’s, Case Study for Germany,
Proceedings of the Subregional Awareness Raising Workshop on Persistent Organic
Pollutants (POPs) Kranjska Gora, Slovenia, 11-14 May 1998
Internet:http://www.chem.unep.ch/pops/POPs_Inc/proceedings/slovenia/neumeier2.h
tml (Last Access: 05.12.2009)
Odabası, M., Çetin, B., Demircioglu, E., and Sofuoglu, A. (2008). "Air-water
exchange of polychlorinated biphenyls (PCBs) and organochlorine pesticides (OCPs)
at a coastal site in Izmir Bay, Turkey." Mar Chem, 109(1-2), 115-129.
Organisation for Economic Co-operation and Development (OECD) Report on the
implementation by member countries of the decision by the Council on the
Protection of the Environment by control of polychlorinated biphenyls, Paris,
Organisation of Economic Co-operation and Development (ENV/CHEM/81.2), 1982
Parivesh – Polychlorinated Biphenyls (PCBs), Central Pollution Control Board of
Ministry of Environment and Forests, December 2001
Rushneck D. R., Beliveau A., Fowler B., Hamilton C., Hoover D., Kaye K., Berg M.,
Smith T., Telliard W.A., Roman H., Ruder E., Ryan L., Concentrations of dioxin-like
PCB congeners in unweathered Aroclors by HRGC/HRMS using EPA Method
1668A, Chemosphere 54, 79–87, 2004
Samara F., Tsai C.W., Aga D.S., Determination of potential sources of PCBs and
PBDEs in sediments of the Niagara River, Environmental Pollution 139, 489-497,
2006

96
Schlosserová J. Kontrolle ausgewählter Böden in der Tschechischen und
Slowakischen Republik auf ihre Kontamination mit chlorierten
Kohlenwassertstoffen. (In German) In: Heinisch E, Kettrup A, Wenzel-Klein S,
editors. Schadstoffatlas Osteuropa. Ecomed Verlagsgesellschaft AG & Co.
Germany3-609-69540-4; 1994. p. 54–9.
Stockholm Convention on Persistent Organic Pollutants, 17.05.2004,
Internet: http://www.un.org/News/Press/docs/2004/unep204.doc.htm
Home Page: http://chm.pops.int/Convention/tabid/54/language/en-US/Default.Aspx#
convtext (Last Access: 05.12.2009)
Tan C.O., Beklioglu, M., 2005, Catastrophic Like Shifts In Shallow Turkish Lakes:
A Modeling Approach, Ecological Modelling, 183 (4): 425-434.
Tanabe, S., Madhusree, B., Ozturk, A. A., Tatsukawa, R., Miyazaki, N., Ozdamar,
E., Aral, O., Samsun, O., ve Ozturk, B. (1997). "Persistent organochlorine residues in
harbour porpoise (Phocoena phocoena) from the Black Sea." Marine Pollution
Bulletin, 34(5), 338-347.
Tatsukawa, R. PCB pollution of the Japanese environment. In: Higuchi, K. (ed.) PCB
poisoning and pollution. Kodansha Ltd. Tokyo. Academic Press. ISBN 0-12-347850-
2. 1976, pp.147–179.
Telli-Karakoç, F., Tolun, L., Henkelmann, B., Klimm, C., Okay, O., ve Schramm,
K.-W. (2002). "Polycyclic aromatic hydrocarbons (PAHs) and polychlorinated
biphenyls (PCBs) distributions in the Bay of Marmara Sea: Izmit Bay."
Environmental Pollution, 119, 383-397.
The Agency for Toxic Substances and Disease Registry (ATSDR), (2000).
―Toxicological Profile for Polychlorinated Biphenyls (PCBs)‖.
Internet: http:// www.atsdr.cdc.gov/toxprofiles/tp17-c5.pdf (Last Access: 05.12.2009)

97
The State of New York (1997). ―Pre-assessment Screen Determination for the
Hudson River.‖ The National Oceanic and Atmospheric Administration, and the
United States Department of the Interior, in their capacity as Trustees of Natural
Resources, 1 October.
Internet: http://www.dec.ny.gov/lands/32758.html (Last Access: 05.12.2009)
UNEP (1999). ―Guidelines for the Identification of PCBs and Materials Containing
PCBs.‖, August.
UNEP/MAP, (1999), ―Strategic Action Programme to address pollution from land-
based sources.‖ Athens, Greece.
UNEP (2002). ―Chemicals, Regionally Based Assessment of Persistent Toxic
Substances, Mediterranean Regional Report.‖ December
U.S. Environmental Protection Agency (US EPA) (2000). ―A Guide for Ship
Scrappers- Tips for Regulatory Compliance Environmental Protection Agency.‖
U.S. Environmental Protection Agency (US EPA) (1994). ―PCB Q & A Manual.‖
U.S. Environmental Protection Agency (US EPA), SW-846, Test Methods for
Evaluating Solid Waste, Physical/Chemical Methods, Chapter 4-Organic Analytes,
December 1996
U.S. Environmental Protection Agency (US EPA), SW-846, Test Methods for
Evaluating Solid Waste, Physical/Chemical Methods, Chapter 1-Quality Control,
July 1992
U.S. Environmental Protection Agency (US EPA), SW-846, Test Methods for
Evaluating Solid Waste, Physical/Chemical Methods, Method 8000B- Determinative
Chromatographic Separations (December 1996)

98
U.S. Environmental Protection Agency (US EPA), SW-846, Test Methods for
Evaluating Solid Waste, Physical/Chemical Methods, Method 3535A Solid Phase
Extraction-SPE (January 1998)
U.S. Environmental Protection Agency (US EPA), SW-846, Test Methods for
Evaluating Solid Waste, Physical/Chemical Methods, Method 3540C Soxhlet
Extraction (December 1996)
U.S. Environmental Protection Agency (US EPA), SW-846, Test Methods for
Evaluating Solid Waste, Physical/Chemical Methods, Method 3630C Silica Gel
Cleanup (December 1996)
U.S. Environmental Protection Agency (US EPA), SW-846, Test Methods for
Evaluating Solid Waste, Physical/Chemical Methods, Method 8082A PCBs by Gas
Chromatography (November 2000)
U.S. Environmental Protection Agency (US EPA), SW-846, Test Methods for
Evaluating Solid Waste, Physical/Chemical Methods, Method 3660B Sulfur Cleanup
(December 1996)
U.S. Environmental Protection Agency (US EPA), SW-846, Test Methods for
Evaluating Solid Waste, Physical/Chemical Methods, Method 3600C Cleanup
(December 1996)
U.S. Environmental Protection Agency (US EPA), SW-846, Test Methods for
Evaluating Solid Waste, Physical/Chemical Methods, Method 3665A Sulfuric
Acid/Permanganate Cleanup (December 1996)
Van Leeuwen FXR and Younes M. (2000). ―Food Additives and Contaminants
17(4), Assessment of the health risk of dioxins: Re-evaluation of the Tolerable Daily
Intake (TDI).‖ Taylor & Francis, London.
99
Voogt, P. de and U.Th. Brinkmann. (1989). ―Production, properties and usage of
polychlorinated biphenyls. In: Halogenated biphenyls, terphenyls, naphthalenes,
bibenzodioxins and related products.‖ (Ed. by R.D. Kimbrough and A.A. Jensen), pp.
3–45. Elsevier Science, NL.
World Health Organization (WHO) (1976). ―Environmental Health Criteria 2:
Polychlorinated biphenyls and terphenyls.‖ Geneva, , 85 pp.
WHO/EURO (1987). ―PCBs, PCDDs and PCDFs: Prevention and control of
accidental and environmental exposures.‖ Copenhagen, World Health Organization,
Regional Office for Europe, Environmental Health Series 23.
WHO/UNEP/ILO (1980). ― International Programme on Chemical safety (IPCS)
Global Assessment of the State of the Science of Endocrine Distrupting Chemicals
(EDCs), Chapter 6: Potential EDC Exposure in Humans and Wildlife.‖
Internet: http://www.who.int/ipcs/publications/en/ch6.pdf (Last Access: 05.12.2009)
Yeniova, M. (1998). "Poliklorlubifenillerin Biyolojik ve Çevresel Izlenmesi," (In
Turkish), Thesis of Phd, Ankara University.
Zułkowski WS,Kania-Korwel I,Robertson LW. (2003). ―Polychlorinated biphenyls
production in Poland. Fresenius Environ. Bull.,12:152–7.

100
APPENDIX A
TRADE NAMES OF PCBS
Table A.1: Trade Names of PCBs
Aceclor (t) Cloresil Montar
Adkarel Clorphen (t) Nepolin
ALC Delor (Çek Cumhuriyeti) Niren
Apirolio (t,c) Diaclor (t,c) No-Famol
Aroclor (t,c) (ABD) Dialor (c) No-Flamol (t,c) (ABD)
Aroclor 1016 (t,c) Disconon (c) NoFlamol
Aroclor 1221 (t,c) Dk (t,c) Nonflammable liquid
Aroclor 1232 (t,c) Ducanol Pheneclor
Aroclor 1242 (t,c) Ducanol (c) Phenoclor (t,c) (France)
Aroclor 1254 (t,c) Dykanol (t,c) (ABD) Phenochlor
Aroclor 1260 (t,c) Dyknol Phenochlor DP6
Aroclor 1262 (t,c) EEC-18 Plastivar
Aroclor 1268 (t,c) Electrophenyl T-60 Pydraul (ABD)
Areclor (t) Elemex (t,c) Pyralene (t,c) (Fransa))
Abestol (t,c) Eucarel Pyranol (t,c) (ABD)
Arubren Fenclor (t,c) (Ġtalya) Pyrochlor
Asbestol (t,c) Hexol (Rusya Federasyonu) Pyroclor (t) (ABD)
ASK Hivar (c) Saf-T-Kuhl (t,c)
Askarel (t,c) (ABD) Hydrol (t,c) Saft-Kuhl
Bakola Hydrol Santotherm (Japonya)
Bakola 131 (t,c) Hyvol Santotherm FR
Biclor (c) Inclor Santoterm
Chlorextol (t) Inerteen (t, c) Santovac
Chlorinated
diphenyl
Kaneclor (KC) (t,c)
(Japonya) Santovac 1
Chlorinol (ABD) Kaneclor 400 Santovac 2
Chlorobiphenyl Kaneclor 500 Sinclonyl (c)
Clophen (t,c)
(Germany) Keneclor Solvol (t,c) (Rusya
Federasyonu) Clophen – A30 Kennechlor Sovol

101
Table A.1 (Continued): Trade Names of PCBs
Clophen – A50 Leromoll Sovtol (Rusya Federasyonu)
Clophen – A60 Magvar Therminol (ABD)
Clophen Apirorlio MCS 1489 Therminol FR
t: transformator
c: capacitor
Source: By-law of Control of Wastes Containing PCB and PCT, 2007
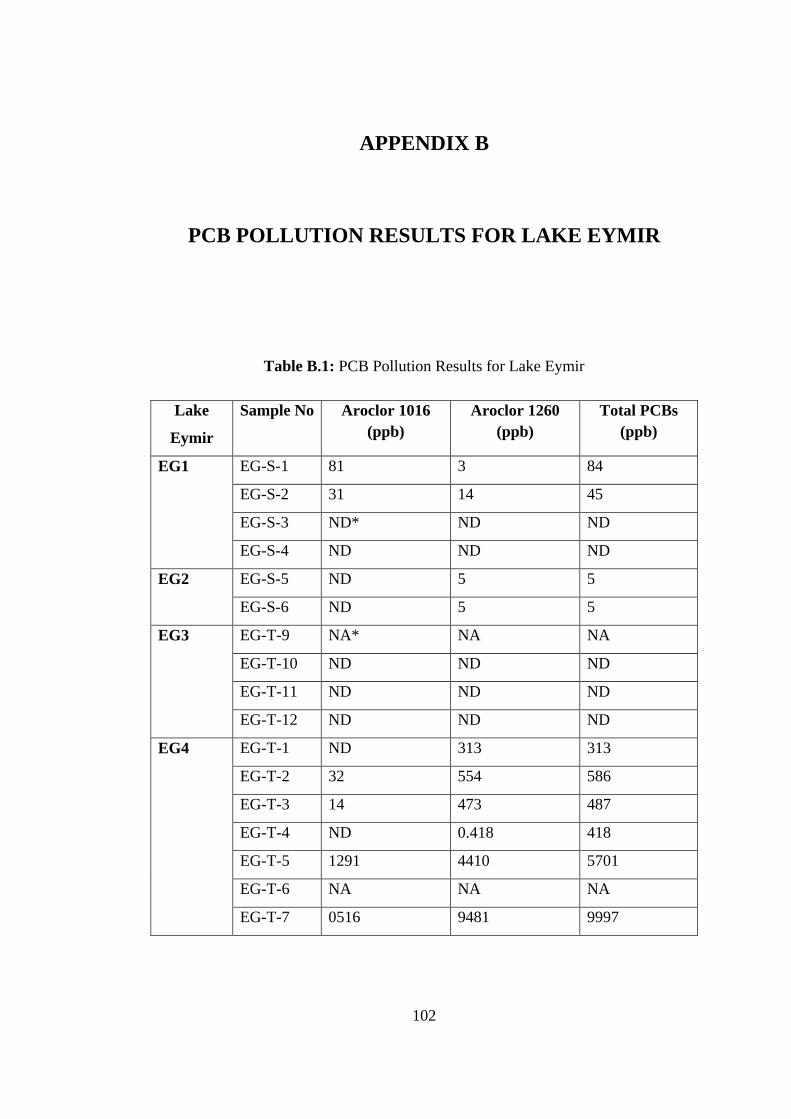
102
APPENDIX B
PCB POLLUTION RESULTS FOR LAKE EYMIR
Table B.1: PCB Pollution Results for Lake Eymir
Lake
Eymir
Sample No Aroclor 1016
(ppb)
Aroclor 1260
(ppb)
Total PCBs
(ppb)
EG1 EG-S-1 81 3 84
EG-S-2 31 14 45
EG-S-3 ND* ND ND
EG-S-4 ND ND ND
EG2 EG-S-5 ND 5 5
EG-S-6 ND 5 5
EG3 EG-T-9 NA* NA NA
EG-T-10 ND ND ND
EG-T-11 ND ND ND
EG-T-12 ND ND ND
EG4 EG-T-1 ND 313 313
EG-T-2 32 554 586
EG-T-3 14 473 487
EG-T-4 ND 0.418 418
EG-T-5 1291 4410 5701
EG-T-6 NA NA NA
EG-T-7 0516 9481 9997

103
Table B.1 (Continued): PCB Pollution Results for Lake Eymir
EG-T-8 NA NA NA
EG5 EG-T-13 24 ND 24
EG-T-14 69 ND 69
* All results are surrogate corrected.
ND (Not Detected): Injected to GC, however PCBs could not be measured.
NA (Not Applicable): Extracts were prepared, however not injected to GC since
extract was very oily.

104
APPENDIX C
PCB POLLUTION RESULTS FOR ANKARA CREEK
Table C.1 (Continued): PCB Pollution Results for Ankara Creek
Sample Congener Amount
(ppm)
Aroclor
1016 (ppb)
Aroclor
1260 (ppb)
Total PCBs
(ppb)
X1
PCB-28 -
6.50 25.75 32.25
PCB-52 -
PCB-101 0.70
PCB-118 0.40
PCB-153 1.44
PCB-138 1.82
PCB-180 0.92
X2
PCB-28 0.43
9.75 49.10 58.85
PCB-52 0.54
PCB-101 0.67
PCB-118 1.66
PCB-153 2.74
PCB-138 2.68
PCB-180 2.93
X3
PCB-28 0.36
1.40 27.73 39.13
PCB-52 0.33
PCB-101 0.29
PCB-118 0.28
PCB-153 0.66
PCB-138 0.75
PCB-180 0.48
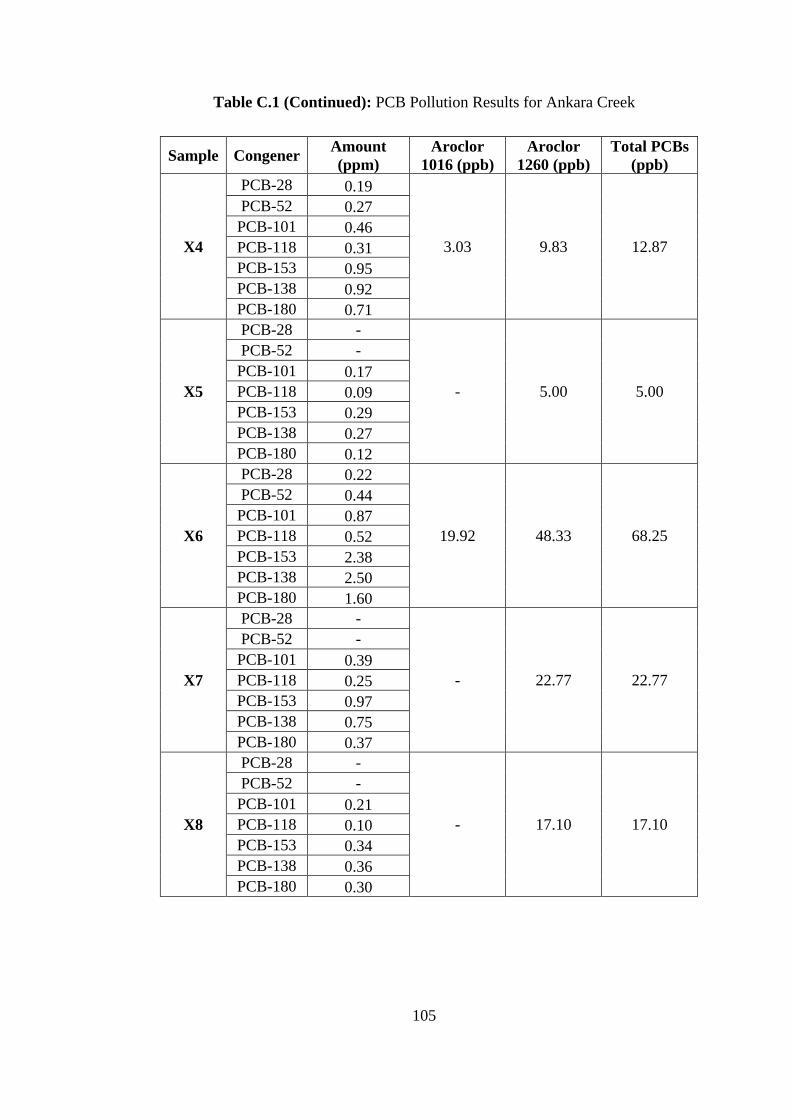
105
Table C.1 (Continued): PCB Pollution Results for Ankara Creek
Sample Congener Amount
(ppm)
Aroclor
1016 (ppb)
Aroclor
1260 (ppb)
Total PCBs
(ppb)
X4
PCB-28 0.19
3.03 9.83 12.87
PCB-52 0.27
PCB-101 0.46
PCB-118 0.31
PCB-153 0.95
PCB-138 0.92
PCB-180 0.71
X5
PCB-28 -
- 5.00 5.00
PCB-52 -
PCB-101 0.17
PCB-118 0.09
PCB-153 0.29
PCB-138 0.27
PCB-180 0.12
X6
PCB-28 0.22
19.92 48.33 68.25
PCB-52 0.44
PCB-101 0.87
PCB-118 0.52
PCB-153 2.38
PCB-138 2.50
PCB-180 1.60
X7
PCB-28 -
- 22.77 22.77
PCB-52 -
PCB-101 0.39
PCB-118 0.25
PCB-153 0.97
PCB-138 0.75
PCB-180 0.37
X8
PCB-28 -
- 17.10 17.10
PCB-52 -
PCB-101 0.21
PCB-118 0.10
PCB-153 0.34
PCB-138 0.36
PCB-180 0.30

106
Table C.1 (Continued): PCB Pollution Results for Ankara Creek
Sample Congener Amount
(ppm)
Aroclor
1016 (ppb)
Aroclor
1260 (ppb)
Total PCBs
(ppb)
X9
PCB-28 0.19
10.25 72.15 82.40
PCB-52 0.59
PCB-101 1.65
PCB-118 1.05
PCB-153 3.32
PCB-138 3.85
PCB-180 2.87
X10
PCB-28 -
14.85 43.80 58.65
PCB-52 -
PCB-101 0.91
PCB-118 0.65
PCB-153 1.84
PCB-138 2.04
PCB-180 0.97
X11
PCB-28 0.07
3.03 20.67 23.70
PCB-52 0.41
PCB-101 0.12
PCB-118 0.31
PCB-153 0.29
PCB-138 0.37
PCB-180 0.30
X12
PCB-28 0.02
- - -
PCB-52 0.08
PCB-101 0.83
PCB-118 0.13
PCB-153 0.38
PCB-138 0.45
PCB-180 0.49
X13
PCB-28 0.05
2.90 46.60 49.50
PCB-52 0.06
PCB-101 0.96
PCB-118 0.26
PCB-153 0.22
PCB-138 0.29
PCB-180 0.10

107
Table C.1 (Continued): PCB Pollution Results for Ankara Creek
Sample Congener Amount
(ppm)
Aroclor
1016 (ppb)
Aroclor
1260 (ppb)
Total PCBs
(ppb)
X14
PCB-28 0.21
11.30 28.70 40.00
PCB-52 0.25
PCB-101 0.52
PCB-118 1.02
PCB-153 1.41
PCB-138 1.71
PCB-180 1.28
X17
PCB-28 0.27
2.77 13.73 16.50
PCB-52 0.16
PCB-101 2.04
PCB-118 0.11
PCB-153 0.34
PCB-138 0.42
PCB-180 0.44
X18
PCB-28 0.25
9.15 25.90 35.05
PCB-52 0.29
PCB-101 0.68
PCB-118 0.37
PCB-153 1.18
PCB-138 1.35
PCB-180 0.55
X19
PCB-28 0.35
5.17 19.23 24.40
PCB-52 0.36
PCB-101 0.99
PCB-118 0.52
PCB-153 0.64
PCB-138 1.05
PCB-180 0.29
X20
PCB-28 2.26
38.17 214.71 252.88
PCB-52 2.71
PCB-101 7.63
PCB-118 4.26
PCB-153 11.92
PCB-138 11.26
PCB-180 8.55

108
Table C.1 (Continued): PCB Pollution Results for Ankara Creek
Sample Congener Amount
(ppm)
Aroclor
1016 (ppb)
Aroclor
1260 (ppb)
Total PCBs
(ppb)
X21
PCB-28 1.88
11.42 40.75 52.17
PCB-52 1.52
PCB-101 1.84
PCB-118 1.12
PCB-153 3.58
PCB-138 3.82
PCB-180 3.28
X22
PCB-28 0.17
2.45 31.40 33.85
PCB-52 0.28
PCB-101 -
PCB-118 0.62
PCB-153 1.66
PCB-138 1.57
PCB-180 1.34
X23
PCB-28 0.29
62.30 715.30 777.60
PCB-52 5.94
PCB-101 3.,29
PCB-118 16.53
PCB-153 54.14
PCB-138 63.67
PCB-180 43.15
X24
PCB-28 -
34.10 120.57 154.67
PCB-52 -
PCB-101 3.16
PCB-118 -
PCB-153 5.33
PCB-138 1.41
PCB-180 5.73

109
APPENDIX D
MAPS OF SAMPLING AREA
Fig
ure
D.1
: M
aps
of
Sam
pli
ng A
rea
109

110
1
11
2
3
13
14
19
18
4
20
1
11
2
3
13
14
19
18
4
20 F
igu
re D
.1 (
Con
tin
ued
): M
aps
of
Sam
pli
ng A
rea
110
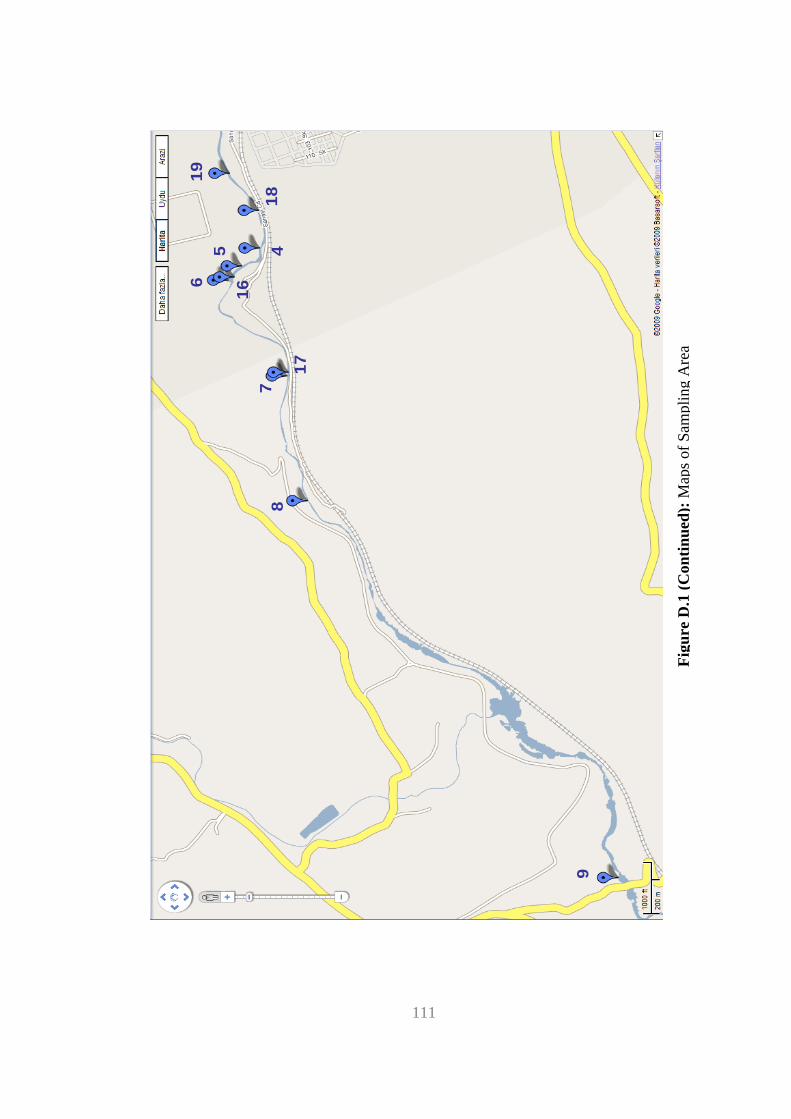
111
9
19
18
45
166
17
78
9
19
18
45
166
17
78
Fig
ure
D.1
(C
on
tin
ued
): M
aps
of
Sam
pli
ng A
rea
111

112
10
21
22
23
24
10
21
22
23
24
Fig
ure
D.1
(C
on
tin
ued
): M
aps
of
Sam
pli
ng A
rea
112

113