investigation of shaft and base resistance of … · investigation of shaft and base resistance of...
TRANSCRIPT

Journal of Engineering Sciences, Assiut University, Vol. 35, No. 4 pp.853-867, July 2007
853
INVESTIGATION OF SHAFT AND BASE RESISTANCE OF A SINGLE BORED PILE USING OSTERBERG CELL
Mohamed Hamed Hussein Associate professor, Civil Eng. Department, Faculty of Eng., Assiut University Assiut, Egypt.
Mostafa Abdou Abd El-Naiem, and Lecturer, Civil Eng.Department, Faculty of Eng., Assiut University, Assiut, Egypt
Ahmed Rushdy Towfeek Assistance Lecturer, Civil Eng. Department, Faculty of Eng., Al-Azhar Universit Kena, Egypt.
(Received April 21, 2007 Accepted June 10, 2007)
Evaluation of pile capacity in soil is an engineering problem of soil-structure
interaction. Soil-pile interaction plays an important role in the analysis and
design of pile foundations. Geotechnical engineers have recognized this role and
many studies have focused on several aspects of the topics related to
determination of pile resistance. There are different methods available to predict
the ultimate load of a single bored pile, such as theory of bearing capacity of the
soil foundation, based on pile load test, semi-empirical methods using in-situ test
results, and empirical formulae were suggested by different codes of practice.
Still the most reliable method to determine the bearing capacity of a pile is by
static load test.
This study investigates some of the important problems related to soil-pile
interaction. Specific problems examined here include: identify of skin friction
and end bearing resistance of pile separately, comparison between the measured
results obtained from experimental methods presented by Osterberg cell, (O-
cell), or conventional tests and these obtained from equations of Egyptian code
for soil mechanics and foundations to evaluate and verify the applicability of
different methods. The experimental results were used to study the effect of the
different parameters such as pile diameter, D, pile length to pile diameter ratio
(L/D), and relative density (Dr) on the pile shaft and pile base resistances of
bored piles. Also, in this research, the coefficients of lateral soil pressure (KH)
and bearing capacity factor (Nq) have been studied. From this study, It can be
found that both pile shaft and pile base resistances have affected by the
parameters D, L/D, and Dr.
KEYWORDS: BORED PILES, LOADS, SETTLEMENT, SKIN
FRICTION, END BEARING, SOIL-PILE INTERACTION.
1. INTRODUCTION
Pile foundations are used to support structural loads in situations where shallow
foundations cannot provide the required bearing capacity, or where the settlement is a
major concern; El-Naggar [1]. Soil-pile interaction plays an important role in the

Mohamed Hamed Hussein et al. 854
analysis and design of foundations and piles. Geotechnical engineers have recognized
this role. Osterberg presented many studies focused on several aspects of the topics
related to determination of shaft and base resistance of pile; Osterberg [2]- [6].
Geotechnical engineers face many challenges to provide more reliable and efficient
foundation solutions to support large, heavy and more complicated structures. Good
understanding of pile behavior is important for efficient design, analysis, construction
and inspection of different types of foundations. Different methods of construction
have been used, bored and driven piles. This study concerns with bored piles. The load
settlement relationship for single pile is very complex. Many procedures have been
developed over years for estimating the settlement behavior of a single pile as El Garhy
et al. [7], Baligh et al. [8] and Tomlinson [9]. The settlement is usually the limiting
design criterion; Russo et al. [10]. The analysis and design of the load bearing capacity
and settlement of an axially loaded pile are affected by several complex factors and,
therefore, are usually restored to some established assumptions and/or empirical
approaches. In particular, those with regards to soil-pile structure interaction and the
distribution of soil resistance (skin friction) with depth. The methods available to
predict the ultimate load of a single pile are: (i) theory of bearing capacity of the soil
foundations; (ii) the pile load test; (iii) empirical methods based on dynamic driving
formulae which have been superseded by a more refined and consistent method, known
as stress wave analysis; and (iv) semi-empirical methods using in-situ penetration test
results. Still the most reliable method to determine the bearing capacity of a pile is by
static load test; Baligh et al. [8]. Single pile is rarely used, but always used in a group,
therefore single pile load tests are carried out to obtain an idea of the load-settlement
behavior of group of piles when exposed to vertical load. Empirical formulae were
suggested by different codes of practice. Many of these formulae are based on either a
limited number of pile load tests or on load tests in certain soil foundations not giving a
wide spectrum of soil properties; Baligh et al. [8].
This research is carried out to investigate the performance of vertically loaded
single bored pile in sandy soil. The major objectives of this research are: (i)
determination of pile resistance obtained from different methods such as Osterberg
Cell (O-Cell), Conventional Method, Egyptian Code for Soil Mechanics and
Foundations; [13], (ii) determination of individual parts of pile resistance, shaft and
base resistance separately, (iii) studying the load-settlement behavior of a single pile
with different L/D ratios, and (iv) studying the effect of sand relative density (Dr).
2. EXPERIMENTAL WORK
In the following sections, descriptions of the components of the experimental model
along with method of carrying out the experiments are presented.
2.1. Test piles and Osterberg cell Model
In this study four circular pipe piles are used. The piles have the same length of 60 cm
and have external diameters 12 cm, 10 cm, 8.6 cm, and 6 cm to give pile length to pile
diameter ratios (L/D), 5, 6, 7, and 10, respectively. A head and Osterberg cell (O-cell)
were attached at the base of each pile model. To roughen the external surface of the

INVESTIGATION OF SHAFT AND BASE RESISTANCE … 855
piles, sandpaper was stacked to simulate the practical piles roughness. The O-cell
model is a small hydraulic jack consists of a casing incorporated moving piston as
shown in Fig. 1. A calibration for O-cell model was done by using a suitable proving
ring attached directly on the pile head. It was designed to give two equal loads and
opposite in direction. When shaft resistance reaches to failure, a stopper is used to
cease the shaft motion to complete the test up to failure in soil at pile base as shown in
Fig. 2. The downward and upward displacements of the pile were measured by using a
mechanical dial gauge with accuracy 0.00245 cm.
2.2. Steel Tank and Main Frame
The test model consists of steel tank and a main frame. The tank is resting on a steel
base. The tank is a steel box of dimensions 120 x 120 cm in plan and 120 cm height.
The box dimensions were selected to ensure that no effects of the boundary walls on
the behavior of a single pile. The steel tank is divided into two equal parts each has 60
cm height. The tank was provided by vertical stiffeners (i.e., angle 50x50x5). The main
frame consists of two vertical I beams and horizontal I beam.
Figure 1. Components of O-cell Figure 2. Elevation view for the conventional pile test
2.3. Soil Description
The used soil for the tests is well graded sand. The maximum and minimum dry
densities are equal to 18.7 KN/m3 and 15.0 KN/m
3, respectively. The sieve analysis
test was carried out to determine the grain size distribution curve of the tested sand as
shown in Fig. 3. The properties of used sand such as effective diameter (D10), D30, D60,
uniformity coefficient (Cu), and coefficient of curvature (Cc) is shown in Figure 3. To
obtain any certain value of relative density, the sand is placed into a box having a
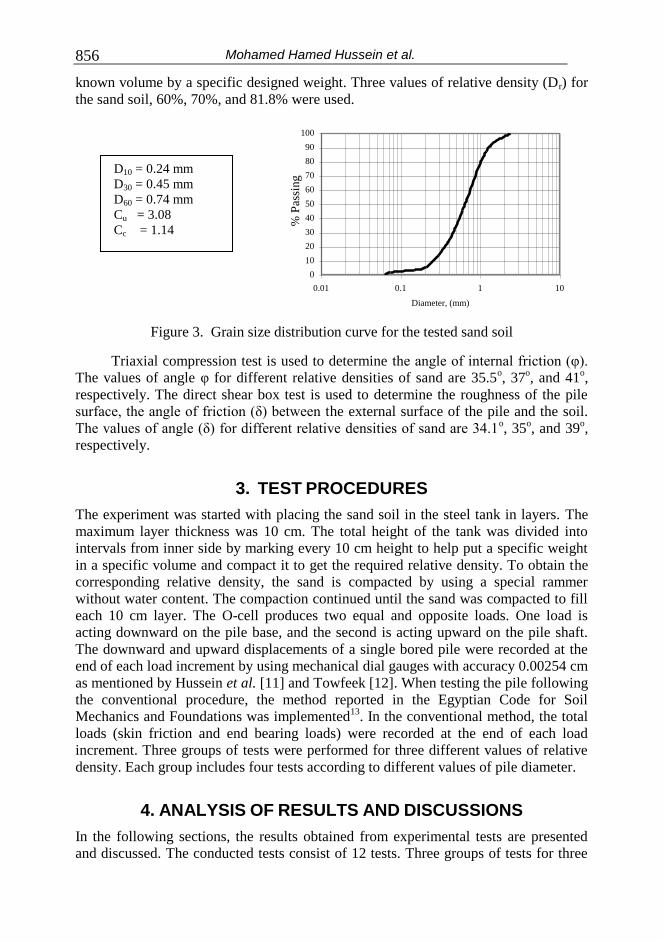
Mohamed Hamed Hussein et al. 856
known volume by a specific designed weight. Three values of relative density (Dr) for
the sand soil, 60%, 70%, and 81.8% were used.
0
10
20
30
40
50
60
70
80
90
100
0.01 0.1 1 10
Diameter, (mm)
% P
assi
ng
Figure 3. Grain size distribution curve for the tested sand soil
Triaxial compression test is used to determine the angle of internal friction (φ).
The values of angle φ for different relative densities of sand are 35.5o, 37
o, and 41
o,
respectively. The direct shear box test is used to determine the roughness of the pile
surface, the angle of friction (δ) between the external surface of the pile and the soil.
The values of angle (δ) for different relative densities of sand are 34.1o, 35
o, and 39
o,
respectively.
3. TEST PROCEDURES
The experiment was started with placing the sand soil in the steel tank in layers. The
maximum layer thickness was 10 cm. The total height of the tank was divided into
intervals from inner side by marking every 10 cm height to help put a specific weight
in a specific volume and compact it to get the required relative density. To obtain the
corresponding relative density, the sand is compacted by using a special rammer
without water content. The compaction continued until the sand was compacted to fill
each 10 cm layer. The O-cell produces two equal and opposite loads. One load is
acting downward on the pile base, and the second is acting upward on the pile shaft.
The downward and upward displacements of a single bored pile were recorded at the
end of each load increment by using mechanical dial gauges with accuracy 0.00254 cm
as mentioned by Hussein et al. [11] and Towfeek [12]. When testing the pile following
the conventional procedure, the method reported in the Egyptian Code for Soil
Mechanics and Foundations was implemented13
. In the conventional method, the total
loads (skin friction and end bearing loads) were recorded at the end of each load
increment. Three groups of tests were performed for three different values of relative
density. Each group includes four tests according to different values of pile diameter.
4. ANALYSIS OF RESULTS AND DISCUSSIONS
In the following sections, the results obtained from experimental tests are presented
and discussed. The conducted tests consist of 12 tests. Three groups of tests for three
D10 = 0.24 mm
D30 = 0.45 mm
D60 = 0.74 mm
Cu = 3.08
Cc = 1.14

INVESTIGATION OF SHAFT AND BASE RESISTANCE … 857
values of relative density (Dr = 60%, 70%, and 81.8%) were performed. Each group
includes four tests for pile diameters (D = 12cm, 10cm, 8.6cm, and 6cm). For O-cell,
conventional method tests and equation of Egyptian code, values of the ultimate pile
resistance corresponding to a settlement equal to 10 % of the pile diameter are given in
Table 1. These values include the ultimate shaft loads obtained from O-cell tests (Qs O-
cell), the ultimate base loads obtained from O-cell tests (Qb O-cell), the ultimate loads
obtained from conventional method (Qu Conv), and from equation of Egyptian code (Qu
EC). The coefficients of lateral soil pressure on pile shaft obtained from O-cell tests (KH
O-cell) and from Egyptian code (KH EC), which includes (KHC) or (KHT) in the case of
compression or tension piles respectively, are tabulated in Table 1. Also, the bearing
capacity coefficients obtained from O-cell tests (Nq O-cell) and these obtained from
Egyptian code (Nq EC) are tabulated in Table 1.
Table (1): Values of pile resistance, coefficient (Nq), and coefficient (KH) obtained
from experimental results and Egyptian code
Diameter,
cm 12 10 8.6 6 12 10 8.6 6 12 10 8.6 6
L/D 5 6 7 10 5 6 7 10 5 6 7 10
Dr (%) 81.8 70 60
φ 41o 37
o 35.5
o
δ 39o 35.5
o 34.15
o
Qs O-cell 2.16 1.63 1.31 0.78 1.69 1.24 0.91 0.42 1.20 1.00 0.75 0.45
Qb O-cell 10.32 7.11 4.70 2.10 6.51 4.10 2.65 1.10 4.27 3.04 2.10 0.90
S1 0.21 0.23 0.28 0.37 0.26 0.30 0.34 0.38 0.28 0.33 0.36 0.50
Qu O-cell 12.48 8.74 6.01 2.88 8.20 5.34 3.56 1.52 5.47 4.04 2.85 1.35
S2 0.17 0.19 0.22 0.27 0.21 0.23 0.26 0.28 0.22 0.25 0.26 0.33
Qu Conv 12.12 8.10 6.5 2.94 8.50 5.69 3.86 1.69 5.88 4.59 3.12 1.51
Qu EC 11.54 8.08 6.02 2.98 7.11 5.02 3.75 1.89 5.22 3.71 2.78 1.42
KH O-cell 2.21 2.00 1.87 1.60 2.00 1.77 1.51 1.00 1.53 1.53 1.34 0.92
KH EC KHC = 0.7 – 1.5 and KHT = 0.4 – 1.0
Nq O-cell 85.0 84.3 75.4 69.2 55.1 50.0 43.7 37.2 37.0 38.0 35.4 31.2
Nq EC 120 66 52.5
R1 1.08 1.08 1.00 0.97 1.15 1.06 0.95 0.80 1.05 1.09 1.03 0.95
R2 1.05 1.00 1.08 0.99 1.19 1.03 1.03 0.89 1.13 1.24 1.13 1.06
Note: Q in KN
The relation between ultimate shaft resistance (Qs O-cell) and ultimate base
resistance (Qb O-cell) obtained from O-cell tests was represented by ratio S1 and
calculated using Eq. (1). Also, in this Equation, the relation between ultimate shaft
resistance (Qs O-cell) and ultimate pile resistance (Qu O-cell) obtained from O-cell tests was
calculated and represented by ratio S2.
( ) ( )1 2
( ) ( )
s O cell s O cellS and S
b O cell u O cell
Q Q
Q Q
(1)
From Table 1, it can be seen that, for the same pile diameter, the values of ratios
S1 and S2 increase as the ratio L/D increases and as the relative density (Dr) decreases
Mohamed Hamed Hussein et al. 858
and this due to increasing in base resistance. To compare the results obtained from O-
cell and conventional tests with these obtained from the equation of Egyptian code,
ratios R1 and R2 were calculated using Eq. (3) as,
( ) ( )1 2
( ) ( )
u O cell u ConvR R
u EC u EC
Q Qand
Q Q
(2)
It can be seen that the values of ultimate pile loads obtained from O-cell and
conventional tests are approximately agree with these calculated from Egyptian code
except certain values.
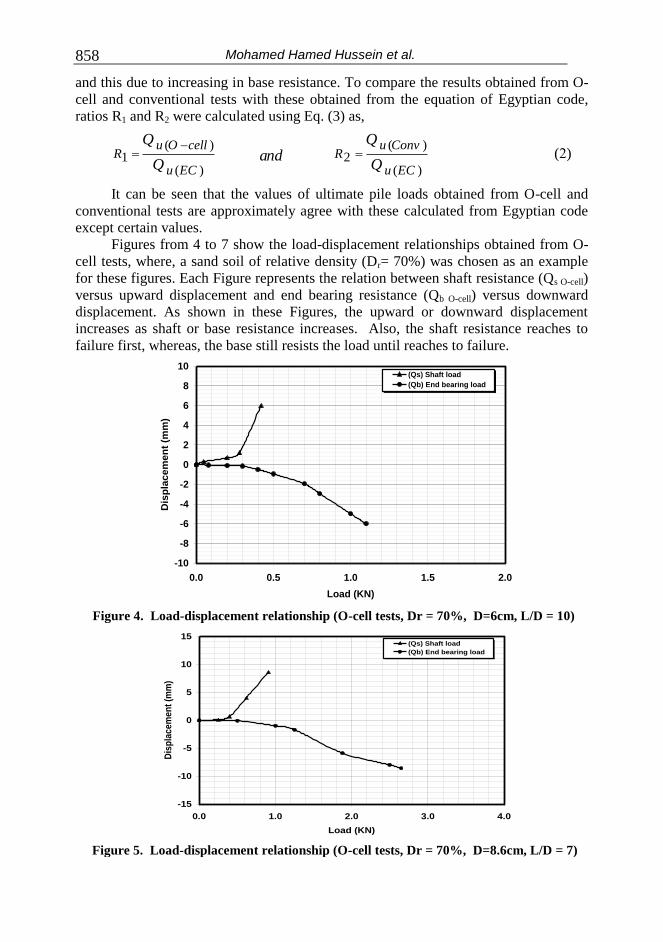
Figures from 4 to 7 show the load-displacement relationships obtained from O-
cell tests, where, a sand soil of relative density (Dr= 70%) was chosen as an example
for these figures. Each Figure represents the relation between shaft resistance (Qs O-cell)
versus upward displacement and end bearing resistance (Qb O-cell) versus downward
displacement. As shown in these Figures, the upward or downward displacement
increases as shaft or base resistance increases. Also, the shaft resistance reaches to
failure first, whereas, the base still resists the load until reaches to failure. D=6 cm, L/d = 10, Dr = 70%
-10
-8
-6
-4
-2
0
2
4
6
8
10
0.0 0.5 1.0 1.5 2.0
Load (KN)
Dis
pla
cem
en
t (m
m)
(Qs) Shaft load
(Qb) End bearing load
Figure 4. Load-displacement relationship (O-cell tests, Dr = 70%, D=6cm, L/D = 10) D=8.6, L/D = 7, Dr=70%
-15
-10
-5
0
5
10
15
0.0 1.0 2.0 3.0 4.0
Load (KN)
Dis
pla
ce
me
nt
(mm
)
(Qs) Shaft load
(Qb) End bearing load
Figure 5. Load-displacement relationship (O-cell tests, Dr = 70%, D=8.6cm, L/D = 7)
INVESTIGATION OF SHAFT AND BASE RESISTANCE … 859 D=10 cm, L/D = 6, Dr=70%
-15
-10
-5
0
5
10
15
0.0 1.0 2.0 3.0 4.0 5.0 6.0
Load (KN)
Dis
pla
ce
me
nt
(mm
)
(Qs) Shaft load
(Qb) End bearing load
Figure 6. Load-displacement relationship (O-cell tests, Dr = 70%, D=10cm, L/D = 6 )
D=12 cm , L/d = 5 , Dr = 70%
-15
-10
-5
0
5
10
15
0.0 1.0 2.0 3.0 4.0 5.0 6.0 7.0
Load (KN)
Dis
pla
ce
me
nt
(mm
)
(Qs) Shaft load
(Qb) End bearing load
Figure 7. Load-displacement relationship (O-cell tests, Dr = 70%, D=12cm, L/D = 5 )
From these figures it can be noticed that the shaft resistance (Qs O-cell) reaches to
65 % of the ultimate shaft load when displacement reaches to a value ranged from 1.0
mm to 2.0 mm. This means that ultimate shaft resistance occurs when displacement
reaches to 10 % of pile diameter. On the other hand, it can be found that the base
resistance (Qb O-cell) reaches to 35 % of the ultimate base resistance when displacement
reaches 1.6 % of pile diameter and the last 65% of the ultimate base resistance occurs
when displacement reaches to 10 % of pile diameter.
The ultimate pile resistances obtained from O-cell tests, conventional method,
and equation of Egyptian code were plotted in figures from 8 to 11.
Figures from 8 to 11 show the effect of relative density on the values of ultimate
pile resistance. It can be found that, the ultimate pile resistance obtained from O-cell
test is in agreement with these obtained from conventional tests and equation of
Egyptian code. It can be noticed that, the ultimate pile resistance increases as the
relative density increases. From these Figures, it can be observed that the ultimate shaft
resistance slightly increases linearly as relative density increases, whereas, the ultimate

Mohamed Hamed Hussein et al. 860
base resistance highly increases as relative density increases. It can be found that, in
the case of O-cell tests, the ultimate resistance for pile base is more affected by relative
density than that for pile shaft. Also, this effect clearly increases as pile diameter
increases.
Dr-Qs-Qb-Qu-(D=6 cm)
0
2
4
6
8
50 55 60 65 70 75 80 85 90
Relative density (Dr %)
Lo
ad
(K
N)
(Qu-s) O-cell
(Qu-b) O-cell
(Qu-t) O-cell
(Qu) Conv.
(Qu) EG
D = 6 cm , L = 60 cm
L/D =10.0
Figure 8. Ultimate load-relative density relationship (D=6cm, L/D = 10 )
Dr-Qs-Qb-Qu-(D = 8.6)
0
4
8
12
50 55 60 65 70 75 80 85 90
Relative density (Dr %)
Lo
ad
(K
N)
(Qu-s) O-cell
(Qu-b) O-cell
(Qu-t) O-cell
(Qu) Conv.
(Qu) EG
D = 8.6 cm , L = 60 cm, L/D =
7.0
Figure 9. Ultimate load-relative density relationship (D=8.6cm, L/D = 7 )

INVESTIGATION OF SHAFT AND BASE RESISTANCE … 861
Dr-Qs-Qb-Qu-(D=10)
0
5
10
15
50 55 60 65 70 75 80 85 90
Relative density (Dr %)
Lo
ad
(K
N)
(Qu-s) O-cell
(Qu-b) O-cell
(Qu-t) O-cell
(Qu) Conv.
(Qu) EG
D = 10 cm , L = 60 cm
L/D = 6.0
Figure 10. Ultimate load-relative density relationship (D=10cm, L/D = 6 )
Dr-Qs-Qb-Qt
0
5
10
15
20
50 55 60 65 70 75 80 85 90
Relative density (Dr %)
Lo
ad
(K
N)
(Qu-s) O-cell
(Qu-b) O-cell
(Qu-t) O-cell
(Qu) Conv.
(Qu) EG
D = 12 cm , L = 60 cm L/D = 5.0
Figure 11. Ultimate load-relative density relationship (D=12cm, L/D = 5 )
The relationships between ultimate resistance and L/D ratio in the case of
relative density (Dr=70%) for the results obtained from O-cell tests, conventional tests,
and equation of Egyptian code are tabulated in Table 1 and illustrated as shown in Fig.
12. It can be found that, the ultimate pile resistance decreases as L/D ratio increases.
This is due to decreasing in pile diameter which leads to decreasing in the ultimate
base load. Also, it can be noticed that, both ultimate resistance for pile shaft and pile
base decrease as L/D ratio increases, but the range of decreasing in ultimate resistance
for pile base is more than that for pile shaft.
Mohamed Hamed Hussein et al. 862 L/D - Q
0
1
2
3
4
5
6
7
8
9
10
4 6 8 10 12 14 16
L/D ratio
Lo
ad
(K
N)
(Qu-s) o-cell
(Qu-b) O-cell
(Qu-t) O-cell
Qu- Conv.
Qu-EC
Dr = 70 %
Figure 12. Ultimate load -L/D ratio relationship (Dr = 70 %)
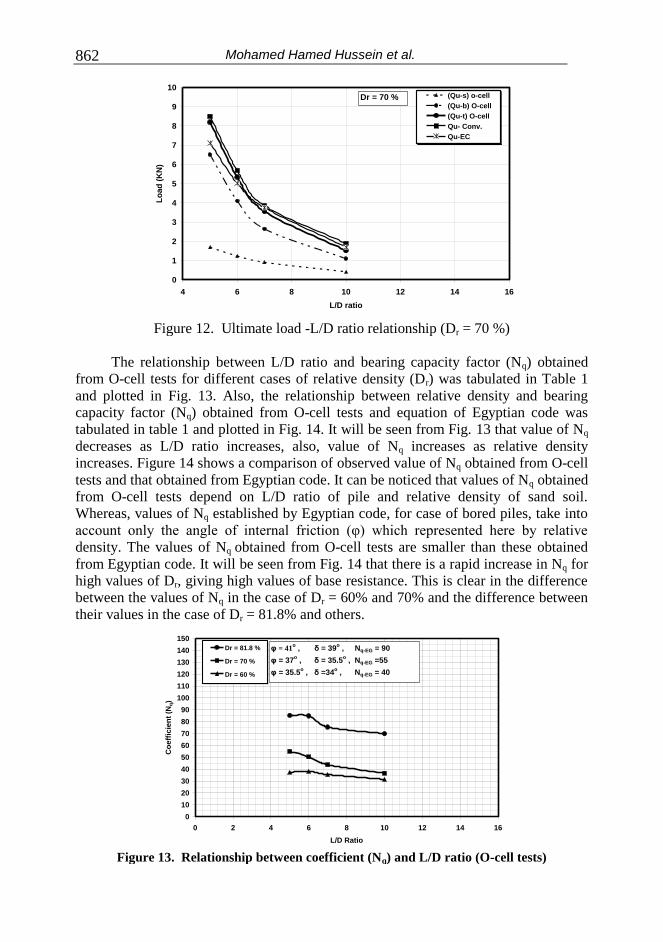
The relationship between L/D ratio and bearing capacity factor (Nq) obtained
from O-cell tests for different cases of relative density (Dr) was tabulated in Table 1
and plotted in Fig. 13. Also, the relationship between relative density and bearing
capacity factor (Nq) obtained from O-cell tests and equation of Egyptian code was
tabulated in table 1 and plotted in Fig. 14. It will be seen from Fig. 13 that value of Nq
decreases as L/D ratio increases, also, value of Nq increases as relative density
increases. Figure 14 shows a comparison of observed value of Nq obtained from O-cell
tests and that obtained from Egyptian code. It can be noticed that values of Nq obtained
from O-cell tests depend on L/D ratio of pile and relative density of sand soil.
Whereas, values of Nq established by Egyptian code, for case of bored piles, take into
account only the angle of internal friction (φ) which represented here by relative
density. The values of Nq obtained from O-cell tests are smaller than these obtained
from Egyptian code. It will be seen from Fig. 14 that there is a rapid increase in Nq for
high values of Dr, giving high values of base resistance. This is clear in the difference
between the values of Nq in the case of Dr = 60% and 70% and the difference between
their values in the case of Dr = 81.8% and others.
L/D Ratio , Nq
0
10
20
30
40
50
60
70
80
90
100
110
120
130
140
150
0 2 4 6 8 10 12 14 16
L/D Ratio
Co
eff
icie
nt
(Nq)
Dr = 81.8 %
Dr = 70 %
Dr = 60 %
φ = 41o , δ = 39
o , Nq-EG = 90
φ = 37o , δ = 35.5
o , Nq-EG =55
φ = 35.5o , δ =34
o , Nq-EG = 40
Figure 13. Relationship between coefficient (Nq) and L/D ratio (O-cell tests)

INVESTIGATION OF SHAFT AND BASE RESISTANCE … 863 Dr-Nq-Eg
0
20
40
60
80
100
120
140
160
50 60 70 80 90
Relative density (Dr %)
Co
eff
icie
nt
(Nq)
D = 12 cm
D = 10 cm
D = 8.6 cm
D = 6 cm
Egyptian Code
Figure 14. Relationship between coefficient (Nq) and relative density (O-cell tests)
From Fig. 14, it can be found that the values of Nq obtained from Egyptian code
are overestimated if compared with the measured values.
From the above O-cell test results shown in Figs. 13 and 14 and regression
analysis, an equation to estimate value of Nq for different case of densities and pile
diameters is as follows:
11q
ba DN (3)
Where
1
247.31 139.54a (4)
1
2221.52165.74 73.33b (5)
Where D is the pile diameter in cm and φ is the angle of internal friction in radians.
The above equations have coefficients correlation (R2) range from 0.883 to 1.0, which
are considered very good.
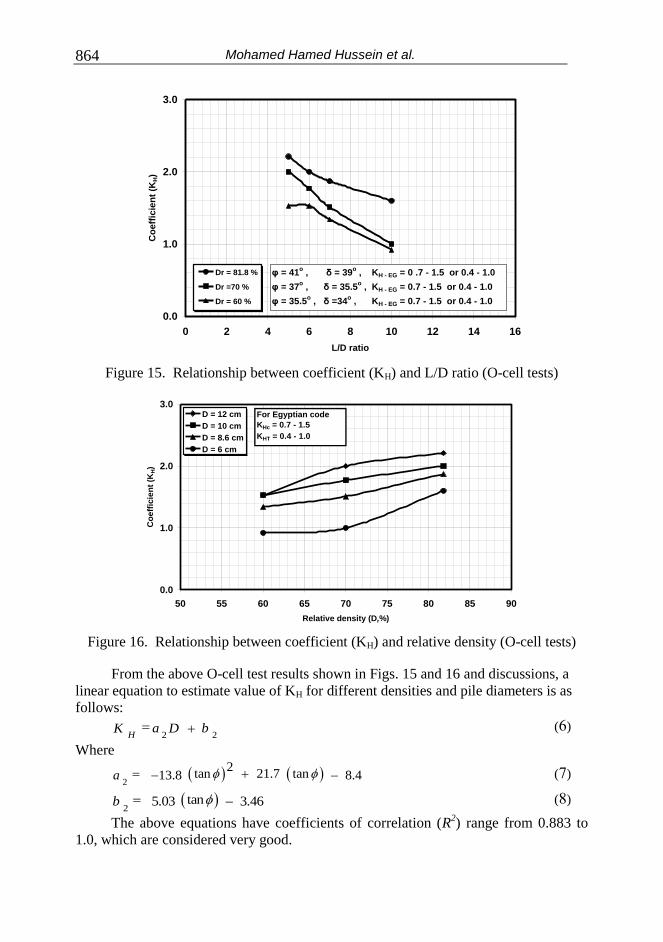
The relationship between L/D ratio and the coefficients of lateral soil pressure on
pile shaft (KH) obtained from O-cell tests and Egyptian code for different cases of
relative density was tabulated in Table 1 and plotted in Fig. 15. Also, the relationship
between relative density and coefficient (KH) obtained from O-cell tests and Egyptian
code was tabulated in Table 1 and plotted in Fig. 16. It will be seen from Figure 15 that
values of KH decrease as L/D ratio increases. Because pile length is constant, the
change in KH values due to change in pile diameter. From Fig. 16, it can be found that
values of KH increase as relative density increases. It may be argued that increasing the
soil density results in increasing in the value of φ. From this discussion, it can be
concluded that, the coefficient of lateral soil pressure on pile shaft (KH) depends not
only on angle of internal friction (φ) but also on pile diameter.
From Figs. 15 and 16, it can be found that, for O-cell tests, value of KH ranges
between 2.21 to 0.92, whereas, in the case of Egyptian code, KH ranges between 0.7 to
1.5 for compression piles (KHC) and 0.4 to 1.0 for tension piles (KHT). The procedure of
O-cell tests was carried out to push the pile upward. This means that O-cell test is
suitable for case of tension piles. It can be found that the values of KH obtained from
Egyptian code are underestimated if compared with the measured values.
Mohamed Hamed Hussein et al. 864
Coefficient (Khc)
0.0
1.0
2.0
3.0
0 2 4 6 8 10 12 14 16
L/D ratio
Co
eff
icie
nt
(KH)
Dr = 81.8 %
Dr =70 %
Dr = 60 %
φ = 41o , δ = 39
o , KH - EG = 0 .7 - 1.5 or 0.4 - 1.0
φ = 37o , δ = 35.5
o , KH - EG = 0.7 - 1.5 or 0.4 - 1.0
φ = 35.5o , δ =34
o , KH - EG = 0.7 - 1.5 or 0.4 - 1.0
Figure 15. Relationship between coefficient (KH) and L/D ratio (O-cell tests)
Dr -KHC
0.0
1.0
2.0
3.0
50 55 60 65 70 75 80 85 90
Relative density (Dr%)
Co
eff
icie
nt
(KH)
D = 12 cm
D = 10 cm
D = 8.6 cm
D = 6 cm
For Egyptian code
KHc = 0.7 - 1.5
KHT = 0.4 - 1.0
Figure 16. Relationship between coefficient (KH) and relative density (O-cell tests)
From the above O-cell test results shown in Figs. 15 and 16 and discussions, a
linear equation to estimate value of KH for different densities and pile diameters is as
follows:
2 2Ha bK D (6)
Where
2
2tan 21.7 tan13.8 8.4a (7)
2
tan5.03 3.46b (8)
The above equations have coefficients of correlation (R2) range from 0.883 to
1.0, which are considered very good.

INVESTIGATION OF SHAFT AND BASE RESISTANCE … 865
5. CONCLUSIONS
The present study is concerned with the investigation of shaft and base resistance of a
single bored pile using Osterberg cell. In the O-cell tests, the ultimate resistance for
pile shaft (Qs) and pile base (Qb) was measured separately. The results obtained from
O-cell tests were compared with these obtained from conventional method and
equation of Egyptian code for soil mechanics and foundations. A sand soil with
different relative densities and different pile diameters were studied.
Based on the presented discussion and analysis of experimental results, the
following main conclusions are noted:
(1) The ultimate resistance for pile base is more affected by the relative density
than that for pile shaft. Also, this effect clearly increases as pile diameter
increases.
(2) The shaft resistance reaches to failure before base resistance.
(3) When displacement reaches approximately to 1.6% of pile diameter, shaft
resistance reaches to 65% of ultimate shaft resistance and base resistance to
35% of ultimate base resistance.
(4) Both ultimate resistances for pile shaft and pile base decrease as L/D ratio
increases, but the range of decreasing in ultimate resistance for pile base is
more than that for pile shaft.
(5) Both bearing capacity factor Nq and coefficient of lateral soil pressure (KH)
depend not only on angle of internal friction but also on L/D ratio.
(6) The values of bearing capacity factor Nq obtained from Egyptian code is
overestimated if compared with the measured values.
(7) Coefficient of lateral soil pressure (KH) obtained from Egyptian code is
underestimated if compared with the measured values.
REFERENCES
1. El Naggar, M.H., “Some Aspects of Soil-Structure Interaction in Foundation
Engineering,” 1st International Conference of Civil Engineering Science,
ICCES1, Assiut, Egypt. Oct. 6-8, Vol. 1, pp. 860-878, (2003).
2. Osterberg J., “The Osterberg Load Test Method for Bored and Driven Piles-
The First Ten Years,” Presented at 7th International Conference and
Exhibition on Piling and Deep Foundations, Deep Foundations Institute,
Vienna, Austria, (1998).
3. Osterberg, J., “The Osterberg Cell Technology for Loaded Testing Drilled
Shafts and Driven piles,” Publication FHWA-SA-94-O35, (1998).
4. Osterberg J., “What has been learned about Drilled Shafts from the Osterberg
cell,” Presented at the Deep Foundations Institute Annual Meeting, Dearborn,
Michigan, (1998).
5. Osterberg, J., “Load Testing High Capacity Piles what have we Learned,” The
5th International Conference on Deep Foundation Practice Singapore, (2001).
6. Osterberg, J., “The Osterberg Load Test as a Research Tool,” The 15th
International Conference on Soil Mechanics and Geotechnical Engineering,
Istanbul, Turkey, (2001).

Mohamed Hamed Hussein et al. 866
7. El Garhy, B.M., Youssef, A. and Abdel-Hady, S., “Load Settlement Behavior
of Vertically Loaded Free Standing Pile Groups Driven in Sand,” 11th
International Colloquium on Structural and Geotechnical Engineering,
ICSGE, Ain Shams University, Cairo, Egypt, May 17-19, (2005).
8. Baligh, F.A. and Mansour, M.A., “Predicting Pile Performance from Pile Load
Test and SPT Data,” 11th International Colloquium on Structural and
Geotechnical Engineering, ICSGE, Ain Shams University, Cairo, Egypt, May
17-19, (2005).
9. Tomlinson, M.J., “Foundation Design and Construction,” Addison Wesley
Longman Limited, Edinburgh Gate, Harlow, Essex CM20 2JE, 6th Edit., 1995.
10. Russo, G. and Viggiani, C., “Factors Controlling Soil-Structure Interaction for
Piled Rafts,” Darmstadt Geotechnics, Darmstadt University of Technology,
No. 4, pp. 297-322, (1998).
11. Hussein, M.H., Abdel–Naiem, M.A. and Towfeek, A.R., “Study on Single Pile
Resistance Using Osterberg Cell,” The Egyptian Geotechnical Society, EGS,
Giza, Egypt, Vol. 17, Part 1, (2006).
12. Towfeek, A.R., “Study on Pile Resistance Using Osterberg Cell,” M.Sc.
Thesis, Assiut University, (2006).
13. "Egyptian Code for Soil Mechanics & Design and Construction of
Foundations, Deep Foundations," Part 4, (2001).
خلية أوستربرج باستخدامدراسة على مقاومة جذع و قاعدة خازوق مدفون مفرد
المنارقت النندسر ولارخقم األلمرقن النقتنر عننرق علر فرياألبررا الارقة استخدام فينظراً للتوسع
ب ر م تفريمسقل كب رر مرا األسقسرق السر ل لتر إل الترب عند منسوب التأس س ممق نعلنق تلتق األسقسق الخقزوق . إل و النبو المسموح بنمق وللتغلب عل ذلك تم اللنوء االرتكقزع س
منقن النندس اإلناقئ . والخواز ق تن ن األلمقن فيتعتبر األسقسق الخقزوق ما المواوعق النقم معقً. وقدم بقالثن اعا ر ق ققعدتنق السفل أو بقالرتكقزعا ر ق نذعنق أو بقاللتكقكالترب إمق إل
لم كقن كق الترب وتصم م وتنف ذ األسقسق معقدال للسقب لمن الخقزوق المنفررد لسرب المصريالكود الخواز ررق ذا قرردر التلم ررن العقل رر لللصررون علرر اللمرررن والختبررقرنرروا الخررقزوق ونرروا التربرر .
أبتكررلردود أفعقن كب ر , ولرذلك ف رد اللت قننقصبح مكلف للغق وذلك فإا ال ر الت ل د ت التصم مي ارتكرقزالعقلم أوستربر ر ند د ألنرراء تنرقرب تلم رن الخواز رق وذلرك بوارع خل ر عنرد ققعرد
ال قبررقا و الوال رق المتلررد األمر ك رر لت رر م مررد فرريالخرقزوق وتررم إنررراء العد ررد مرا التنررقرب الل ل رر . وتتم رررز ر رر أوسرررتربر بأننرررق ررتم الترررأث ر علررر الخررقزوق ب ررروت ا متسرررقو ت ا اسرررتخدامنق صرريل
( Qb) بقالرتكرقزألردةمق ألسرفن لتلد رد اللمرن المن رون بواسر ققعرد الخرقزوق االتنرق فيومتاقدت ا ال ر ر لر ا أنرف فر فري( Qs) بقاللتكرقكوالثقن ألعل لتلد د اللمن المن ون بواس نرذا الخرقزوق
فر اق ر األةم ر لمعرفر كرن Qsو Qbالكل . والفصن ب ا التصم ميالت ل د تم اللصون عل اللمن ف . بقاللتكقكالترب إل تن ن لملنق التيوالد بمفردةق وةذا مف د خصوصقً لخواز ق الاد
المتغ ررا مثرن ق رر ترب رمل مرع دراسر بعر فيةذا البلث تم دراس سلوك الخقزوق المدفوا فيترثثر والتري( Dr( وكرذلك الكثقفر النسرب للرمرن )L/D( ونسب ون الخقزوق الر ق رر )Dالخقزوق )
(. وقرد ترم دراسر أربرع أق رقر مختلفر مرا الخواز رق مرع ثريث φ) الرداخلي االلتكرقكزاو ر فريبدورةق
معرقمي مثرن معقمرن قردر تلمرن لقال مرا الكثقفر النسرب للرمرن المردموك. كرذلك ترم دراسر بعر ال

INVESTIGATION OF SHAFT AND BASE RESISTANCE … 867
تررم اللصررون عل نررق مررا والترري( KHعلرر نررذا الخررقزوق ) النررقنبي( ومعقمررن اررغ التربرر (Nqالتربرر
. المصريبقلكود قمث يتنتنقرب أوستربر وتم م قرن ةذ ال م مع وقرد ونرد أا لقلر التربر الرمل ر . فري( KH( و )(Nqتم ت د م معقدال تنر ب ر للسرقب قر م المعرقمي
( (Nqكمق أا ق م الداخلي االلتكقك( تعتمد عل كيً ما ق ر الخقزوق و زاو KH( و )(Nqالمعقمي
الكررود فرريتررم اللصررون عل نررق مررا تنررقرب أوسررتربر علرر الرمررن المسررتخدم اقررن مررا مث يتنررق والترريرمن المستخدم اكبر مرا تم اللصون عل نق ما تنقرب أوستربر عل ال التي( و (KHوأا ق م المصري . المصريالكود فيمث يتنق