investigation of signalling involved in maintaining the
TRANSCRIPT

Copyright is owned by the Author of the thesis. Permission is given for a copy to be downloaded by an individual for the purpose of research and private study only. The thesis may not be reproduced elsewhere without the permission of the Author.

i
Investigation of signalling involved in maintaining
the mutually beneficial association between
Epichloë festucae and perennial ryegrass
A thesis presented in partial fulfilment of the requirements for the degree of
Doctor of Philosophy
in
Genetics
at Massey University, Palmerston North, New Zealand.
Carla Jane Eaton
2009

ii
Abstract
In the mutually beneficial association between the fungal endophyte Epichloë festucae and
perennial ryegrass, fungal growth is highly regulated and coordinated with that of the
host. This implies there must be signalling between the fungus and its host to maintain
this close association. Recent work has shown a novel role for reactive oxygen species
(ROS) in this symbiotic maintenance, with multiple components of the superoxide-
producing NADPH oxidase (Nox) complex being essential for normal association.
However, the mechanism by which the Nox complex is regulated is unclear.
To identify potential regulators of the E. festucae Nox complex, comparisons were made
with well-characterised mammalian systems. This search identified three candidate
regulators: a stress activated MAP kinase, sakA, and the p21-activated kinases, pakA and
pakB. To investigate if these genes were involved in symbiotic maintenance, replacement
mutants were generated by homologous recombination. In culture analysis revealed that
the ΔsakA mutant was hypersensitive to a range of stresses, whereas the pak mutants
were hypersensitive to cell wall stress-inducing agents and displayed altered growth and
morphology. Examination of perennial ryegrass infected with these mutants revealed
drastically altered plant interaction phenotypes for the ΔsakA and ΔpakA mutants in
comparison to the wild-type strain. ΔsakA-infected plants were stunted and displayed
striking changes in development, with the base of tillers showing loss of anthocyanin
pigmentation and disorganisation of host cells below the meristem, resulting in swollen
bases. Plants infected with the ΔpakA mutant were severely stunted, had no more than
two tillers and senesced soon after planting. In contrast, plants infected with the ΔpakB
mutant were similar to wild-type, with only slight deregulation of growth in planta.
Examination of ROS in culture revealed that ΔsakA and ΔpakA displayed elevated levels
of both superoxide and hydrogen peroxide. ROS levels were also elevated around ΔsakA
hyphae in planta. These results support roles for SakA and PakA in Nox regulation. This
work highlights the fine balance between mutualism and antagonism, and provides
insight into the molecular basis for mutualism.

iii
Acknowledgments
Firstly, I must thank Barry Scott for his excellent supervision. You really were the best
supervisor someone undertaking the trials and tribulations of a PhD could ask for.
Thank you for your guidance and patience through the good times and the bad times.
Your faith in me kept me going during the times when it felt like nothing was working
and I questioned whether I could ever finish. To my co-supervisor Jerry Hyams, thanks
for your expert guidance with the S. pombe work and for your humour, which was like a
breath of fresh air during the trying times of this PhD.
Thanks to the New Zealand Tertiary Education Commission for funding this project
through a Top Achievers Doctoral Scholarship, and to the Lincoln Bioprotection CoRE
for additional funding. Thanks to Chris Schardl for provision of E. festucae 2368 genomic
sequence through grant EF-0523661 from the US National Science Foundation.
To Isabelle Jourdain, without your help with the S. pombe work and E. festucae
microscopy much of the results presented in this thesis could not have been achieved. I
have valued your help, advice and most importantly your friendship. You were a
listening ear when I needed to vent my problems and most of the time could even offer a
solution. Without your support all this would not have been possible.
Thanks to all past and present members of the Scottbase lab, you all helped me in so
many ways. Special thanks to Michelle Bryant for your support, advice and friendship,
especially at the start of my PhD; to Matt Nicholson, for answering my endless questions
and helping to ‘problem-solve’ when things just did not seem to work. Thanks also to
Yvonne Rolke for your advice and support, especially during the writing phase, and to
Matthias Becker for helping dissect meristems and for the top quality SEM images. To
Aiko, Daigo, Sanjay, Kim and Sarah for helpful advice and suggestions. A big thanks to
Milena Mitic, Emma Brasell, Gemma Cartwright and Ruth Wrenn for your great
friendship throughout my PhD and for helping me to smile during the tough times.
Many thanks to everyone at AgResearch who helped me during this project, especially
Mike Christensen for advice and help with analysing the in planta phenotypes, Anouck

iv
de Bonth for developing my many immunoblots during the arduous infection
experiments, and Wayne Simpson for together with Anouck taking good care of my
plants. Thanks to everyone at the Manawatu Microscopy and Imaging Centre,
particularly Doug Hopcroft for your top quality sample preparation and advice to help
me get the best images possible. Thanks also to Barbara Ambrose for advice and help
with plant tissue preparation, sectioning and staining.
Special thanks are due to Ann Truter and Cynthia Cresswell. You two are like the
guardian angels of IMBS and I’m sure without you things would fall to pieces – I know I
would have, especially during poster printing times! Thanks for all your help with so
many things throughout my PhD.
A big thank-you to John O’Sullivan for your support and help during the writing of this
thesis. I will forever be grateful to you for introducing me to the wonder of biology all
those long years ago. The phrase ‘a good teacher makes all the difference’ could not be
any truer. Your passion for biology inspired me - who knew it would lead me to this
point.
Lastly, my deepest thanks must go to my family. Mum, without your support and love
none of this would have been possible. Thank you for enduring many hours as an
audience for me to practice my presentations to, and for all your advice on the layout
and design of presentations and posters. Thanks to my sister and sister-in-law Debbie
and Anne-Marie for enduring many “practice presentations” even though you probably
have no real interest in grass, fungus or any of those other things I rambled on about.
Debbie, your faith in me being able to achieve whatever I set my mind to has meant
more to me than you realise. To my brother Shane – thanks for bringing me back to
earth when my head gets lost in the world of science! To my nephews and nieces James,
Caleb, Tyler, Cassandra, Bailey, Riley and Maia. You have kept me anchored in reality
by being able to brighten my mood even on those days when nothing seemed to be
going right, and loving me whether or not my experiments were working. Tyler, thank
you for always being interested in my work, and for listening to my presentations and
asking some pretty good questions – I may make a scientist out of you yet! Dad and
Sherree, I love you and miss you and wish you could be here to share this moment with
me, but I know you would have been proud.
v
Table of contents
Abstract ......................................................................................... ii
Acknowledgments .......................................................................... iii
Table of contents ..............................................................................v
Abbreviations ...............................................................................xiii
List of figures................................................................................ xix
List of tables................................................................................. xxi
1. Introduction...............................................................................1
1.1. Plant-microbe associations...............................................................................2
1.2. Plant-fungal associations..................................................................................2
1.3. Endophyte associations with cool-season grasses ..............................................3
1.3.1. Endophyte diversity and lifecycle ............................................................................. 3
1.3.2. Benefits of association ........................................................................................... 5
1.3.3. Endophyte growth in planta ................................................................................... 6
1.3.4. Role of reactive oxygen species in maintenance of association....................................... 6
1.4. Role of NADPH oxidase (Nox) complexes in fungal symbioses ........................8
1.4.1. The mammalian Nox complex as a model................................................................ 8
1.4.2. Roles of the Nox complex in other fungi ................................................................... 9
1.4.3. Possible mechanisms of Nox regulation in fungi ........................................................ 9
1.5. MAP kinase signalling ................................................................................... 11
1.5.1. The MAP kinase cascade .................................................................................... 11
1.5.2. MAP kinase pathways in fungi ............................................................................ 12
1.5.3. Yeast stress-activated MAP kinase pathways ......................................................... 14
1.5.4. Role of the stress-activated MAP kinase pathway in filamentous fungi ...................... 14
1.5.4.1. Saprotrophic fungi ....................................................................................... 15
1.5.4.2. Animal and insect pathogens ......................................................................... 15
1.5.4.3. Plant pathogens........................................................................................... 17
1.5.4.4. Role in fungicide sensitivity........................................................................... 18
1.6. p21-activated kinase signalling....................................................................... 19
1.6.1. The Rho GTPase molecular switches.................................................................... 19

vi
1.6.1.1. The tripartite role of RhoGDI....................................................................... 21
1.6.2. The pak conundrum............................................................................................ 21
1.6.3. Role of the p21-activated kinases in yeast .............................................................. 23
1.6.4. Roles in filamentous fungi.................................................................................... 24
1.7. Aims.............................................................................................................. 25
2. Materials and Methods.............................................................. 28
2.1. Biological material......................................................................................... 29
2.2. Medium and growth conditions..................................................................... 33
2.2.1. Escherichia coli .................................................................................................. 33
2.2.1.1. Luria-Bertani medium (LB)......................................................................... 33
2.2.1.2. SOC medium.............................................................................................. 33
2.2.2. Schizosaccharomyces pombe ................................................................................. 33
2.2.2.1. Edinburgh minimal medium (EMM)............................................................ 34
2.2.2.1.1. Salts solution ....................................................................................... 34
2.2.2.1.2. Vitamins solution ................................................................................. 34
2.2.2.1.3. Minerals solution ................................................................................. 34
2.2.2.2. Yeast extract medium (YE)........................................................................... 35
2.2.2.3. Growth tests................................................................................................ 35
2.2.3. Epichloë festucae................................................................................................. 35
2.2.3.1. Potato dextrose medium (PD) ....................................................................... 35
2.2.3.2. Regeneration medium (RG) .......................................................................... 36
2.2.3.3. Growth tests................................................................................................ 36
2.2.4. Lolium perenne ................................................................................................... 36
2.2.4.1. Murashige and Skoog (MSO)-Phytoagar ....................................................... 36
2.2.4.2. Maintenance of plants in the greenhouse ......................................................... 37
2.3. DNA isolation ............................................................................................... 37
2.3.1. Plasmid DNA.................................................................................................... 37
2.3.2. Cosmid DNA..................................................................................................... 37
2.3.3. Fungal genomic DNA ......................................................................................... 38
2.4. DNA manipulation........................................................................................ 39
2.4.1. Quantification .................................................................................................... 39
2.4.2. Restriction endonuclease digestion.......................................................................... 39
2.4.3. DNA purification ............................................................................................... 39
2.4.4. DNA concentration by ethanol precipitation............................................................ 40

vii
2.4.5. Sub-cloning........................................................................................................ 40
2.4.5.1. A-tailing .................................................................................................... 40
2.4.5.2. Calf intestinal alkaline phosphatase (CIAP) treatment of vectors ....................... 41
2.4.5.3. Gel extraction.............................................................................................. 41
2.4.5.4. PCR product purification ............................................................................. 41
2.4.5.5. Ligation ..................................................................................................... 41
2.4.5.6. E. coli transformation .................................................................................. 42
2.4.5.6.1. Cracking analysis of transformants ......................................................... 42
2.4.6. Agarose gel electrophoresis .................................................................................... 42
2.4.6.1. Electrophoresis of RNA................................................................................ 43
2.4.7. Southern blotting................................................................................................. 43
2.4.7.1. Radioactive hybridisation ............................................................................. 44
2.4.7.2. Stripping of radioactive membranes ................................................................ 45
2.4.8. Screening the cosmid library ................................................................................. 45
2.5. RNA isolation and manipulation ................................................................... 45
2.5.1. RNA isolation.................................................................................................... 45
2.5.2. RT-PCR .......................................................................................................... 46
2.6. DNA sequencing and bioinformatics ............................................................. 46
2.6.1. DNA sequencing................................................................................................. 46
2.6.2. Sequence comparison and domain characteristics ..................................................... 46
2.6.3. Synteny analysis ................................................................................................. 47
2.6.4. Bioinformatic analysis of MAP kinase cascades ..................................................... 47
2.6.5. Statistical analysis .............................................................................................. 47
2.7. PCR analysis ................................................................................................. 48
2.7.1. Standard PCR ................................................................................................... 49
2.7.2. Extract-N-Amp PCR ......................................................................................... 49
2.7.3. High fidelity enzymes.......................................................................................... 50
2.8. Fungal transformations.................................................................................. 50
2.8.1. E. festucae ......................................................................................................... 50
2.8.1.1. Protoplast preparation .................................................................................. 50
2.8.1.2. Transformation ........................................................................................... 51
2.8.2. S. pombe lithium-acetate/PEG transformation ...................................................... 52
2.9. Plant inoculation and growth analysis ............................................................ 52
2.9.1. Seed sterilisation ................................................................................................. 52

viii
2.9.2. Seedling germination and inoculation..................................................................... 52
2.9.3. Immunoblotting .................................................................................................. 53
2.9.4. Aniline blue staining ........................................................................................... 53
2.10. Plant sectioning and staining........................................................................ 53
2.10.1. Tissue fixation and wax embedding .................................................................... 53
2.10.2. Alcian blue/safranin O Staining ........................................................................ 54
2.11. Microscopy.................................................................................................. 54
2.11.1. Light microscopy............................................................................................... 55
2.11.2. Fluorescence microscopy..................................................................................... 55
2.11.2.1. GFP........................................................................................................ 55
2.11.2.2. FM4-64.................................................................................................. 56
2.11.2.3. Calcofluor white (CFW)............................................................................ 56
2.11.3. Confocal microscopy.......................................................................................... 56
2.11.4. Transmission electron microscopy ....................................................................... 56
2.11.4.1. Cerium chloride staining for ROS................................................................ 57
2.11.5. Scanning electron microscopy .............................................................................. 57
2.12. Protein isolation and analysis ....................................................................... 58
2.12.1. Protein isolation from S. pombe .......................................................................... 58
2.12.2. Western blotting ............................................................................................... 58
2.13. Colony staining............................................................................................ 59
2.13.1. Diaminobenzidine............................................................................................. 59
2.13.2. Nitroblue tetrazolium ........................................................................................ 59
2.14. Host defense response analysis ..................................................................... 59
2.14.1. Lactophenol-trypan blue staining ........................................................................ 59
3. Role of sakA in Maintenance of Symbiosis .................................... 60
3.1. Isolation of the E. festucae stress-activated MAP kinase.................................... 61
3.2. The sakA locus displays conserved micro-synteny........................................... 61
3.3. SakA is a functional orthologue of S. pombe Sty1............................................. 66
3.3.1. Complementation of stress sensitivity ..................................................................... 66
3.3.2. Complementation of cell morphology defect ............................................................. 68
3.3.3. S. pombe is unable to splice E. festucae introns....................................................... 68
3.4. Translocation of SakA to the nucleus is induced by stress .............................. 71
3.5. Deletion of sakA alters growth and stress responses in culture ......................... 71
3.5.1. Complementation of the ∆sakA mutant.................................................................. 78
ix
3.6. The sakA mutant has increased ROS levels in culture .................................... 78
3.7. SakA does not regulate nox expression............................................................ 80
3.8. sakA is required for normal association with perennial ryegrass ...................... 80
3.8.1. Growth in planta................................................................................................ 84
3.8.2. The ΔsakA mutant does not induce a host defense response....................................... 87
3.8.3. The ΔsakA mutant induces branching of the host vascular tissues ............................. 87
3.8.4. Epiphyllous growth ............................................................................................. 91
3.9. The ΔsakA mutant alters development of its grass host ................................... 91
3.10. In planta ROS levels are increased in ΔsakA mutant associations ................... 94
4. Analysis of the p21-Activated Kinases........................................... 98
4.1. Isolation and characterisation of the E. festucae pak genes ................................ 99
4.1.1. Identification of the E. festucae pak genes............................................................... 99
4.1.2. Conserved microsynteny and genomic rearrangement at the pak loci..........................102
4.2. Targeted replacement of the pakA and pakB genes........................................ 109
4.2.1. Preparation of pakA and pakB replacement constructs ...........................................109
4.2.2. Screening for pakA and pakB replacement mutants................................................112
4.2.3. Complementation of the ΔpakA and ΔpakB mutants.............................................114
4.3. pakA and pakB are essential for normal growth in culture.............................. 115
4.3.1. Growth in culture..............................................................................................115
4.3.2. Changes at the microscopic level..........................................................................115
4.3.2.1. The ΔpakA mutant displays altered cell compartment size..............................118
4.3.2.2. The ΔpakA mutant displays increased vacuole size........................................118
4.3.2.3. Structures at the hyphal tip .........................................................................121
4.4. The ΔpakA mutant displays increased ROS levels in culture......................... 121
4.5. pakA is required for symbiotic maintenance.................................................. 124
4.5.1. The ΔpakA mutant reduces host survival and induces severe stunting.......................124
4.5.2. The pak mutants display deregulated growth in planta ..........................................126
4.5.2.1. The ΔpakA mutant colonises host vascular bundles........................................126
4.5.3. ΔpakA mutant hyphae display altered morphology in planta...................................129
5. Bioinformatic Analysis of MAP Kinase Pathways ..........................131
5.1. Analysis of E. festucae MAP kinase pathways................................................. 132
5.1.1. Search approach ...............................................................................................132
5.2. The stress-activated MAP kinase pathway ................................................... 134

x
5.2.1. Primary kinases................................................................................................134
5.2.2. The MAP kinase cascade ..................................................................................134
5.2.2.1. Ssk2p/22p ..............................................................................................134
5.2.2.2. Ste11p .....................................................................................................139
5.2.2.3. Pbs2p ......................................................................................................139
5.2.2.4. OSM1.....................................................................................................140
5.2.3. Phosphatases....................................................................................................140
5.2.3.1. Ptp2p ......................................................................................................140
5.2.3.2. Ptp3p ......................................................................................................141
5.3. The pheromone response pathway .............................................................. 141
5.3.1. Primary kinases................................................................................................141
5.3.1.1. Bem1p.....................................................................................................141
5.3.1.2. MST20...................................................................................................145
5.3.2. The MAP kinase cascade ..................................................................................145
5.3.2.1. Ste11p .....................................................................................................145
5.3.2.2. Ste7p .......................................................................................................145
5.3.2.3. PMK1.....................................................................................................146
5.3.2.4. Ste50p .....................................................................................................146
5.3.2.5. Ste5p .......................................................................................................146
5.3.3. Phosphatases....................................................................................................147
5.3.3.1. Ptp2p ......................................................................................................147
5.3.3.2. Ptp3p ......................................................................................................147
5.3.3.3. Msg5.......................................................................................................147
5.4. The cell integrity pathway ........................................................................... 147
5.4.1. Primary kinases................................................................................................150
5.4.1.1. MPKC ....................................................................................................150
5.4.2. The MAP kinase cascade ..................................................................................150
5.4.2.1. Bck1p ......................................................................................................150
5.4.2.2. MKK1.....................................................................................................151
5.4.2.3. MPS1 .....................................................................................................151
5.4.3. Phosphatases....................................................................................................151
6. Discussion ..............................................................................152
6.1. E. festucae sakA encodes a functional MAP kinase.......................................... 153
6.1.1. sakA complements S. pombe sty1Δ stress sensitivity and morphology defects .............153

xi
6.1.2. SakA translocates to the nucleus in response to osmotic stress ..................................153
6.2. Loss of sakA induces stress sensitivity and fungicide resistance ...................... 154
6.2.1. The ΔsakA mutant displays increased stress sensitivity in culture............................154
6.2.2. sakA is required for sensitivity to the phenylpyrrole fungicide fludioxonil...................155
6.3. Difficulties in generation and complementation of ΔsakA ............................. 155
6.4. The ΔsakA mutant displays altered morphology in culture ........................... 156
6.5. Loss of sakA induces changes associated with increased aging....................... 158
6.6. Link between sakA and ROS signalling ........................................................ 159
6.6.1. The ΔsakA mutant displays increased ROS levels in culture and in planta ..............159
6.6.2. Other potential sources of ROS...........................................................................160
6.7. sakA is required for symbiotic maintenance .................................................. 162
6.7.1. The ΔsakA mutant has reduced ability to colonise perennial ryegrass.......................162
6.7.2. Loss of sakA induces increased tillering................................................................164
6.7.3. Plants infected with the ΔsakA mutant have poor root systems ................................164
6.7.4. The ΔsakA mutant induces host stunting and precocious senescence.........................165
6.7.5. The ΔsakA mutant displays reduced epiphyllous growth ........................................166
6.7.6. Growth of the ΔsakA mutant in planta is deregulated............................................168
6.7.7. The ΔsakA mutant shows altered morphology in planta.........................................168
6.7.8. ΔsakA mutant hyphae are surrounded by an electron dense ECM in planta .............169
6.8. Loss of sakA induces changes in host development........................................ 170
6.8.1. ΔsakA mutant-infected tillers display swollen bases ..............................................170
6.8.2. ΔsakA mutant-infected tillers display a loss of anthocyanin pigmentation.................171
6.8.3. ΔsakA mutant-infection induces increased branching of host vasculature ..................173
6.9. The sakA locus displays conserved micro-synteny......................................... 174
6.10. Sequence analysis of the E. festucae pak genes .............................................. 175
6.11. Paks are required for normal growth in culture.......................................... 175
6.11.1. Paks are required for growth under cell wall-stressing conditions...........................176
6.12. The E. festucae pak mutants display altered morphology in culture............... 176
6.12.1. The pak mutants display altered branching in culture..........................................176
6.12.2. The ΔpakA mutant displays altered cell dimensions ............................................178
6.12.3. The ΔpakA mutant contains large vacuoles in culture..........................................178
6.13. Loss of pakA induces increased ROS levels in culture ................................. 179
6.14. pakA is likely required for symbiotic maintenance....................................... 180
6.15. Inability of pakA and pakB to complement the altered symbioses................. 182

xii
6.16. The pak loci display conserved synteny and gene rearrangement............... 184
6.17. Features of the E. festucae MAP kinase pathways......................................... 185
6.18. Conclusions ............................................................................................... 186
7. Appendices .............................................................................188
7.1. Multiple sequence alignments...................................................................... 189
7.1.1. Alignment of pak sequences for primer design........................................................189
7.2. Vector and construct maps .......................................................................... 189
7.2.1. pGEM®-T Easy (Promega)..............................................................................190
7.2.2. pUC118 .........................................................................................................190
7.2.3. pPN83............................................................................................................191
7.2.4. pII99..............................................................................................................191
7.2.5. pCR4-TOPO..................................................................................................192
7.2.6. pCE1 (sakA complementation construct) .............................................................192
7.2.7. pCE12 (sakA replacement construct) ..................................................................193
7.2.8. pCE22 (S. pombe gDNA complementation construct) ...........................................193
7.2.9. pCE23 (S. pombe cDNA complementation construct) ...........................................194
7.2.10. pCE36 (pakA replacement construct)................................................................194
7.2.11. pCE38 (pakB replacement construct)................................................................195
7.2.12. pCE42 (pakB complementation construct).........................................................195
7.2.13. pCE43 (pakA complementation construct).........................................................196
7.3. Sequence Data ............................................................................................ 196
7.4. Statistical Analysis ....................................................................................... 196
Bibliography.................................................................................198
Publication - Eaton et al. (2008). Curr Genet. 53: 163-174……………………….220
Publication - Scott and Eaton. (2008). Curr Opin Microbiol. 11: 488-493……….232
xiii
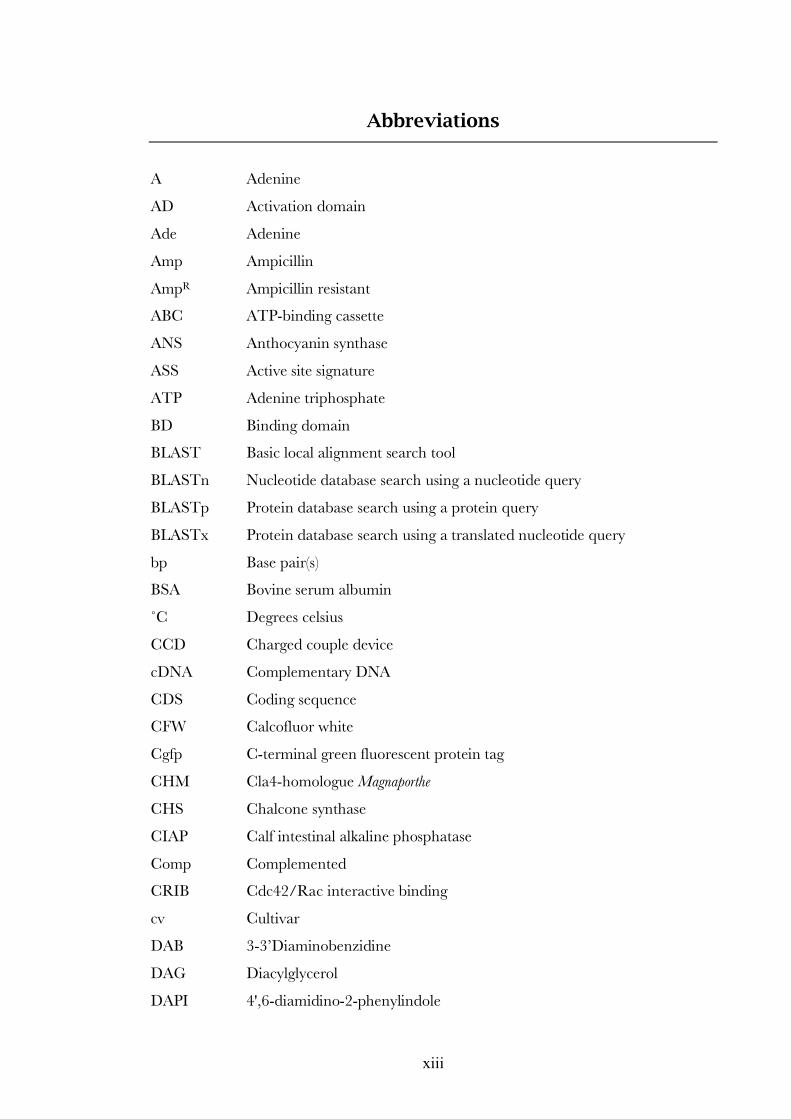
Abbreviations
A Adenine
AD Activation domain
Ade Adenine
Amp Ampicillin
AmpR Ampicillin resistant
ABC ATP-binding cassette
ANS Anthocyanin synthase
ASS Active site signature
ATP Adenine triphosphate
BD Binding domain
BLAST Basic local alignment search tool
BLASTn Nucleotide database search using a nucleotide query
BLASTp Protein database search using a protein query
BLASTx Protein database search using a translated nucleotide query
bp Base pair(s)
BSA Bovine serum albumin
˚C Degrees celsius
CCD Charged couple device
cDNA Complementary DNA
CDS Coding sequence
CFW Calcofluor white
Cgfp C-terminal green fluorescent protein tag
CHM Cla4-homologue Magnaporthe
CHS Chalcone synthase
CIAP Calf intestinal alkaline phosphatase
Comp Complemented
CRIB Cdc42/Rac interactive binding
cv Cultivar
DAB 3-3’Diaminobenzidine
DAG Diacylglycerol
DAPI 4',6-diamidino-2-phenylindole

xiv
dATP Deoxyadenine triphosphate
DBD DND binding domain
dCTP Deoxycytosine triphosphate
DIC Differential interference contrast
DEPC Diethylpyrocarbonate
DMSO Dimethyl sulfoxide
DNA Deoxyribose nucleic acid
dNTP Deoxynucleotide triphosphate
DSPTP Dual specificity protein tyrosine phosphatase
Ec Ectopic
EC Enzyme commission
ECM Extracellular matrix
EDTA Ethylene diamine tetra-acetic acid
EGFP Enhanced green fluorescent protein
EGTA Ethylene glycol tetraacetic acid
EMM Edinburgh minimal medium
FAA Formaldehyde acetic acid
FAD Flavin adenine dinucleotide
Fg Fusarium graminearum
FGI Fungal Genome Initiative
Flu Fludioxonil
g Gram
GAP GTPase-activating protein
GDI Guanine dissociation inhibitor
gDNA Genomic DNA
GDP Guanosine Diphosphate
GEF Guanine nucleotide-exchange factor
GenR Geneticin resistant
GFP Green fluorescent protein
GO Gene ontology
GST Glutathione S-transferase
GTP Guanosine triphosphate
h Hour(s)
H Histidine

xv
H2O2 hydrogen peroxide
HA Hemagglutinin
HCT Hydroxycinnamoyl transferase
Hepes 4-2-hydroxyethyl-1-piperazineethanesulfonic acid
His Histidine
HOG High osmolarity glycerol
Hph Hygromycin phosphotransferase
HRP Horse-radish peroxidase
HygR Hygromycin resistant
IAA Indole-3-acetic acid
ID Identity
IDA Inferred direct assay
IDI Inferred direct interaction
IGI Inferred genetic interaction
IMP Inferred mutant phenotype
iNOS Inducible nitric oxide synthase
IPTG Isopropyl α-D-1-thiogalactopyranoside
IS Intercellular space(s)
kb Kilobases
KIND Kinase non-catalytic C-lobe domain
KO Knock-out
LB Luria-Bertaini broth
L Leucine
Leu Leucine
Lys Lysine
M Molar
MAP Mitogen activated protein
MAPK Mitogen activated protein kinase
MAPKK Mitogen activated protein kinase kinase
MFS Major facilitator superfamily
min Minute(s)
µg Micro-gram
mg Milli-gram
Mg Magnaporthe grisea

xvi
µL Micro-litre
mL Milli-litre
µM Micro-molar
mM Milli-molar
mm Milli-metre
MOPS 3-(N-morpholino)-propanesulfonic acid
mRNA Messenger ribonucleic acid
MSO Murashige and Skoog medium
MST Magnaporthe Ste20
NA Numerical aperture
NADH Nicotinamide adenine dinucleotide (reduced form)
NADPH Nicotinamide adenine dinucleotide phosphate (reduced form)
NBT Nitroblue tetrazolium
Nc Neurospora crassa
NCBI National centre for biotechnology information
NEB New England Biolabs
ng Nano-gram
Nh Nectria haematococca
nmt No message in thiamine
NO Nitric oxide
Nox NADPH oxidase
Npt Neomycin Phosphotransferase
OD Optical density
P Plant cell
pak p21-activated kinase
PASS Phosphatase active site signature
PBD p21-Rho binding domain
PCR Polymerase chain reaction
pcw Plant cell wall
PD Potato dextrose
PEG Polyethylene glycol
PH Pleckstrin homology
Phox Phagocyte oxidase
PKC Protein kinase C

xvii
pmol Picomole
PMSF Phenylmethylsulphonyl fluoride
PTP Protein tyrosine phosphatase
PVP Polyvinylpyrolidone
PX Phox homology
RA Ras-associating
RCA Reviewed computational analysis
RG Regeneration
RNA Ribonucleic acid
RNase Ribonuclease
RO Reverse osmosis
ROS Reactive oxygen species
rpm Revolutions per minute
RT Room temperature
RT Reverse transcriptase
RT-PCR Reverse transcriptase-polymerase chain reaction
Sak Stress-activated kinase
SAM Sterile α motif
SD Synthetic dropout
SDS Sodium dodecyl sulphate
SE Standard error
SEM Scanning electron microscopy
Ser Serine
SH Src homology
SLS Sodium lauroyl sarcosine
SOD Superoxide dismutase
Sorb Sorbitol
SSC Sodium-sodium citrate
Sty Suppressor of tyrosine phosphatase
T Thiamine
TAS Traceable author statement
TAT Tubulin antibody
TBE Tris-boric acid-EDTA
tBLASTn Translated nucleotide database search using a protein query

xviii
tBLASTx Translated nucleotide database search using translated nucleotide query
TEM Transmission electron microscopy
Thi Thiamine
Tr Trichoderma reesei
tRNA Transfer RNA
Trp Tryptophan
Tub Tubulin
Ura Uracil
UTR Untranslated region
UV Ultra-violet
v Vacuole
V Volts
v/v Volume/volume ratio
WT Wild-type
w/v Weight/volume ratio
X-gal 5-bromo-4-chloro-3-indolyl-β-D-galactopyranoside
YE Yeast extract
YPAD Yeast extract-peptone-adenine-dextrose

xix
List of figures
Figure 1.1 Life-cycle of endophyte-grass associations……...………………… 4
Figure 1.2 NADPH oxidase complexes in mammalian phagocytes and fungi 10
Figure 1.3 General scheme of a MAPK pathway……….…………………… 13
Figure 1.4 Model showing activation of mammalian p21-activated kinases
(paks) by the GTPases Cdc42 and Rac……………………………
20
Figure 1.5 Model showing regulation of Rho GTPases by RhoGDI and a
p21-activated kinase (pak)………………………………………….
22
Figure 1.6 Hypothesised regulation of the fungal Nox complex……………… 26
Figure 3.1 Amino acid sequence alignment of fungal MAP kinases………….. 62
Figure 3.2 Organisation of the E. festucae sakA gene and predicted polypeptide 63
Figure 3.3 Conserved micro-synteny at the sakA locus………………………... 64
Figure 3.4 Complementation of S. pombe sty1Δ stress sensitivity………………. 67
Figure 3.5 Complementation the sty1Δ morphology………………………….. 69
Figure 3.6 Agarose gel electrophoresis of sakA RT-PCR products………......... 70
Figure 3.7 Fluorescence microscopy showing GFP localisation of SakA
in S. pombe sty1Δ mutant cells under osmotic stress…………………
72
Figure 3.8 Complementation of S. pombe sty1Δ osmosensitivity with a sakA
C-terminal GFP fusion protein……………………………………..
73
Figure 3.9 Replacement of sakA by homologous recombination……………… 74
Figure 3.10 Culture phenotype of the ΔsakA mutant…………………………… 76
Figure 3.11 Examination of structures at the hyphal tip by DIC and
fluorescence microscopy……………………………………………
77
Figure 3.12 Calcofluor white (CFW) staining of hyphal growth in culture…….. 79
Figure 3.13 Nitroblue-tetrazolium (NBT) detection of superoxide anion
production by E. festucae…………………………………………….
81
Figure 3.14 nox expression analysis………………………………………........... 82
Figure 3.15 Symbiotic phenotype of the E. festucae ΔsakA mutant…………….... 83
Figure 3.16 Growth of the ΔsakA mutant in planta……………………………… 85
Figure 3.17 Examination of hyphal morphology and density in planta by TEM.. 86
Figure 3.18 Fluorescence micrographs of FM4-64 stained vacuoles in culture… 88

xx
Figure 3.19 Analysis of host defense responses by lactophenol trypan blue
staining……………………………………………………………..
89
Figure 3.20 Branching of perennial ryegrass vasculature………………………. 90
Figure 3.21 Examination of epiphyllous hyphal growth………………………... 92
Figure 3.22 Altered development of ΔsakA-infected perennial ryegrass………... 93
Figure 3.23 Alteration of cell organisation below the shoot apical meristem…... 95
Figure 3.24 Elevated ROS levels in the ΔsakA mutant association……………... 96
Figure 4.1 Degenerate PCR amplification of the p21-activated kinases……… 100
Figure 4.2 Organisation of the E. festucae p21-activated kinase genes and
predicted polypeptides……………………………………………...
101
Figure 4.3 Amino acid sequence alignment of fungal Cla4 homologues……… 103
Figure 4.4 Amino acid sequence alignment of fungal Ste20 homologues…….. 104
Figure 4.5 Conserved micro-synteny and genomic rearrangement at the
pak loci ……………………………………………………………...
105
Figure 4.6 Replacement of pakA and pakB by homologous recombination…… 111
Figure 4.7 PCR screen to identify pakA and pakB replacement mutants……… 113
Figure 4.8 Culture phenotype of the pak mutants…………………………….. 116
Figure 4.9 Growth of the pak mutants in culture……………………………... 117
Figure 4.10 Calcofluor white (CFW) staining of the pak mutants in culture…… 119
Figure 4.11 Fluorescence microscopy showing FM4-64 stained vacuoles in
culture………………………………………………………………
120
Figure 4.12 Examination of structures at the hyphal tip by DIC microscopy….. 122
Figure 4.13 Examination of reactive oxygen species (ROS) levels in culture…... 123
Figure 4.14 Symbiotic phenotype of the E. festucae pak mutants……………….. 125
Figure 4.15 Growth of the pak mutants in planta………………………………... 127
Figure 4.16 Growth of strain B3 in planta………………………………………... 128
Figure 4.17 Examination of hyphal morphology and density in planta by TEM.. 130
Figure 5.1 Comparison of MAP kinase signalling pathways between
S. cerevisiae and M. grisea……………………………………………...
133
Figure 5.2 The E. festucae stress-activated MAP kinase pathway……………… 135
Figure 5.3 The E. festucae pheromone response pathway……………………… 142
Figure 5.4 The E. festucae cell integrity pathway………………………………. 148
xxi
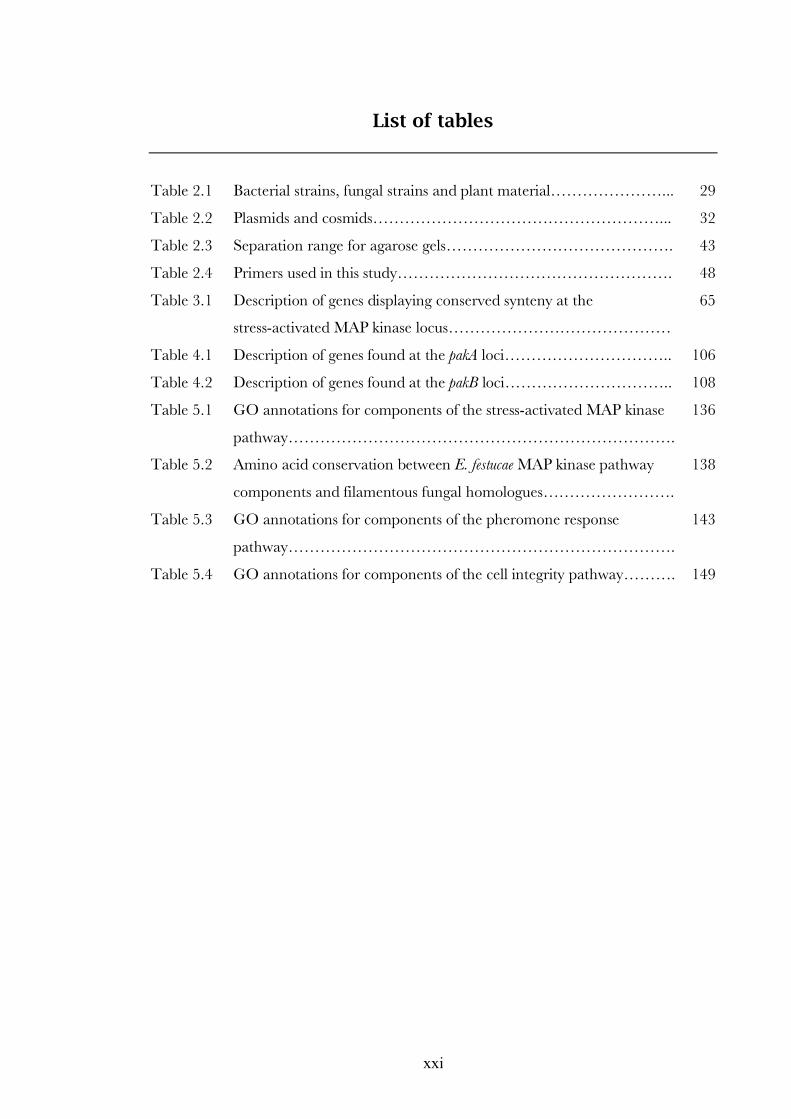
List of tables
Table 2.1 Bacterial strains, fungal strains and plant material…………………... 29
Table 2.2 Plasmids and cosmids………………………………………………... 32
Table 2.3 Separation range for agarose gels……………………………………. 43
Table 2.4 Primers used in this study……………………………………………. 48
Table 3.1 Description of genes displaying conserved synteny at the
stress-activated MAP kinase locus……………………………………
65
Table 4.1 Description of genes found at the pakA loci………………………….. 106
Table 4.2 Description of genes found at the pakB loci………………………….. 108
Table 5.1 GO annotations for components of the stress-activated MAP kinase
pathway……………………………………………………………….
136
Table 5.2 Amino acid conservation between E. festucae MAP kinase pathway
components and filamentous fungal homologues…………………….
138
Table 5.3 GO annotations for components of the pheromone response
pathway……………………………………………………………….
143
Table 5.4 GO annotations for components of the cell integrity pathway………. 149