investigation of sugar metabolism in rhizopus oryzae · 2010-07-21 · investigation of sugar...
TRANSCRIPT

INVESTIGATION OF SUGAR METABOLISM IN Rhizopus oryzae
A THESIS SUBMITTED TO THE GRADUATE SCHOOL OF NATURAL AND APPLIED SCIENCES
OF MIDDLE EAST TECHNICAL UNIVERSITY
BY
ALİ OĞUZ BÜYÜKKİLECİ
IN PARTIAL FULLFILMENT OF THE REQUIREMENTS FOR
THE DEGREE OF DOCTOR OF PHILOSOPHY IN
BIOTECHNOLOGY
AUGUST 2007

Approval of the thesis:
INVESTIGATION OF SUGAR METABOLISM IN Rhizopus oryzae
submitted by ALİ OĞUZ BÜYÜKKİLECİ in partial fulfillment of the requirements for the degree of Doctor of Philosophy in Biotechnology Department, Middle East Technical University by, Prof. Dr. Canan Özgen _____________________ Dean, Graduate School of Natural and Applied Sciences Prof. Dr. Fatih Yıldız _____________________ Head of Department, Biotechnology Prof. Dr. Haluk Hamamcı ______________________ Supervisor, Food Engineering Dept., METU Prof. Dr. Şebnem Harsa ______________________ Co-Supervisor, Food Engineering Dept., IYTE Examining Committee Members: Prof. Dr. Meral Yücel ______________________ Biological Sciences Dept, METU Prof. Dr. Haluk Hamamcı ______________________ Food Engineering Dept, METU Prof. Dr. İnci Özer ______________________ Biochemistry Dept, School of Pharmacy, HU Prof. Dr. Zümrüt Begüm Ögel ______________________ Food Engineering Dept, METU Prof. Dr. Hüseyin Avni Öktem ______________________ Biological Sciences Dept, METU Date: (24.07.2007)

iii
PLAGIARISM
I hereby declare that all information in this document has been obtained and presented in accordance with academic rules and ethical conduct. I also declare that, as required by these rules and conduct, I have fully cited and referenced all material and results that are not original to this work. Name, Last name:
Signature :

iv
ABSTRACT
INVESTIGATION OF SUGAR METABOLISM OF Rhizopus oryzae
Büyükkileci, Ali Oğuz
Ph. D., Department of Biotechnology
Supervisor: Prof. Dr. Haluk Hamamcı
Co-supervisor: Prof. Dr. Şebnem Harsa
August 2007, 78 pages
Rhizopus oryzae is a filamentous fungus, which can produce high amounts of L(+)-
lactic acid and produces ethanol as the main by-product. In an effort to understand
the pyruvate branch point of this organism, fermentations under different inoculum
and glucose concentrations were carried out.
At low inoculum size (1x10³ spores ml-1), high amount of lactate (78 g l-1) was
produced, whereas high ethanol concentration (37 g l-1) was obtained at high
inoculum sizes (1x10⁶ spores ml-1). Decreasing working volume increased lactate
production significantly at high inoculum sizes (1x10⁵ and 1x10⁶ spores ml-1), but
did not influenced the physiology at low inoculum sizes (1x10³ and 1x10⁴ spores
ml-1).
In shake flask cultures, at low initial glucose concentrations biomass yield was high
and lactate and ethanol yields were low. Higher lactate and ethanol and lower
biomass yields were obtained by increasing the initial glucose concentrations. In
v
alginate immobilized, semi-continuous cultures with cell retention, glucose level in
the medium was kept at low values. Like in shake flask cultures, as the glucose
concentration decreased lactate and ethanol yields decreased and biomass yields
increased. Increasing the glucose concentration by a pulse of glucose caused
increases in branch point enzyme activities, as well as in concentrations of the
metabolites. In fed batch cultures higher biomass yield (0.25 g DCW g glucose-1)
could be obtained.
Lactate dehydrogenase was influenced by the inoculum size and glucose
concentration more than pyruvate decarboxylase and alcohol dehydrogenase. It
showed higher activity at lactate producing fermentations. Unlike lactate
dehydrogenase, pyruvate decarboxylase and alcohol dehydrogenase showed high
activity even at low glucose concentrations.
Keywords: Rhizopus oryzae, pyruvate branch point, L(+)-lactic acid, ethanol

vi
ÖZ
Rhizopus oryzae’ NİN ŞEKER METOBOLISMASININ İNCELENMESİ
Büyükkileci, Ali Oğuz
Doktora, Biyoteknoloji
Tez yöneticisi: Prof. Dr. Haluk Hamamcı
Ortak tez yöneticisi: Prof. Dr. Şebnem Harsa
Ağustos 2007, 78 sayfa
Rhizopus oryzae, yüksek miktarda L(+)-laktik asit üretirken, yan ürün olarak da etil
alkol üreten filementli bir küftür. Bu organizmanın pirüvat ayrılma noktasını
anlamak amacıyla değişik aşı ve glikoz derişimlerinde fermantasyonlar yapıldı.
Düşük aşı derişiminde (1x10³ spor ml-1) yüksek laktat derişimi (78 g l-1) elde
edilebilirken yüksek etil alkol derişimleri (37 g l-1) yüksek inoculum
derişimlerinde (1x10⁶ spor ml-1) elde edildi. Yüksek aşı konsantrasyonlarında
(1x10⁵ and 1x10⁶ spor ml-1) çalışma hacminin düşürülmesi laktat üretimini artırdı,
ama hacim değişikliği düşük aşı derişimlerde (1x10³ and 1x10⁴ spor ml-1) etki
göstermedi.
R. oryzae’nın düşük glikoz derişimlerindeki fizyolojisi çalkalamalı kültür ve
fermentörde incelendi. Çalkalamalı kültürde, düşük başlangıç glikoz derişimlerinde
biyokütle verimi yüksek, laktat ve etil alkol verimleri düşük oldu. Başlangıç glikoz
derişimini yükselterek daha yüksek laktat ve etil alkol derişimleri elde edildi.

vii
Aljinata tutuklanmış yarı kesikli R. oryzae kültürlerinde glikoz çok düşük
derişimlerde tutuldu. Çalkalamalı kültürdekine benzer şekilde, glikoz derişimi
düştükçe laktat ve etil alkol derişimi düşmüş, biyokütle verimi yükseldi. Glikoz
derişimi birden artırıldığında, pirüvat ayrılma noktası enzimlerinin faaliyeti ve
metabolit derişimlerinde artışa sebep oldu. Yarı-kesikli kültürde, daha Yüksek
biyokütle verimi (0.25 g kuru hücre ağırlığı g glikoz-1)elde edildi.
Laktat dehidrogenaz, aşı derişiminden ve glikoz konsantrasyonundan pirüvat
dekarboksilaz ve alkol dehidrogenaza göre daha fazla etkilenmiştir. Bu enzim laktat
üreten kültürde daha yüksek aktivite gösterdi. Laktat dehidrogenazın tersine, pirüvat
dekarboksilaz ve alkol dehidrogenaz düşük glikoz konsantrasyonlarında bile yüksek
aktivite gösterdi.
Anahtar Kelimeler: Rhizopus oryzae, pirüvat ayrılma noktası, L-(+)-laktik asit, etil
alkol

viii
ACKNOWLEDGEMENTS
I would like to express my deepest gratitude to Prof. Dr. Haluk Hamamcı and Prof.
Dr. Meral Yücel for their invaluable guidance and supervision. I wish to thank for
their understanding and support.
My special thanks are due to the thesis committee member Prof. Dr. İnci Özer for
her critics on the work done for this thesis.
I am very grateful to Prof. Dr. Şebnem Harsa for her endless support and guidance
for nearly ten years, not only for academic studies, but also for life.
I would like to thank deeply to my dear friends and colleagues; Ceylan, Şeyda,
Ebru, Gül, Betül, Tamay, Eda, Didem, Benek, Lütfiye, Gökçen, Aysu, Ayşem,
Umut, Yeşim, Incinur, Çağatay, Suzan, Beray, Peruze...
The last but never the least I want to send all my love to my family, Hale, Bülent
and Can and wish to thank them for their support throughout all these years.

ix
TABLE OF CONTENTS
ABSTRACT............................................................................................................ iv
ACKNOWLEDGEMENTS .................................................................................. viii
LIST OF FIGURES................................................................................................ xii
LIST OF TABLES ................................................................................................ xiv
LIST OF ABBREVIATIONS................................................................................ xv
CHAPTERS ............................................................................................................. 1
1. INTRODUCTION................................................................................................ 1
1.1. Rhizopus oryzae ....................................................................................... 1
1.2. Lactic Acid ............................................................................................... 2
1.2.1. Uses of Lactic Acid ................................................................................ 2
1.2.2. Industrial Lactic Acid Production .......................................................... 3
1.3. Organic Acid and Ethanol Production by Rhizopus oryzae ..................... 4
1.3.1. Lactic Acid ............................................................................................. 4
1.3.2. Fumaric Acid.......................................................................................... 5
1.3.3. Ethanol ................................................................................................... 6
1.4. Morphology of Rhizopus ......................................................................... 6
1.5. Sugar Metabolism and Pyruvate Branch Point ........................................ 8
1.5.1. Glycolysis............................................................................................... 8
1.5.3. Regulation of Sugar Metabolism of Yeast ........................................... 13
1.5.4. Pyruvate Branch Point Enzymes .......................................................... 14
1.5.4.1. Lactate Dehydrogenase ................................................................. 15
1.5.4.2. Pyruvate Decarboxylase................................................................ 16
1.5.4.3. Alcohol Dehydrogenase ................................................................ 16
1.5.4.4. Pyruvate Carboxylase.................................................................... 17
1.5.4.5. Pyruvate Dehydrogenase............................................................... 17
1.5.4.6. Competition between Enzymes for Pyuvate ................................. 18

x
1.6. Aim of the Study .................................................................................... 19
2. MATERIAL AND METHODS ......................................................................... 20
2.1. Chemicals ............................................................................................... 20
2.2. Organism ................................................................................................ 20
2.3. Preparation of Spore Suspension............................................................ 20
2.4. Immobilization of Spores in Ca-alginate Beads..................................... 21
2.5. Culture Conditions ................................................................................. 21
2.5.1. Shake Flask Cultures............................................................................ 21
2.5.2. Preculture for Fermenter ...................................................................... 22
2.5.3. Preparation of the Fermenter................................................................ 22
2.5.5. Fed-batch Culture................................................................................ 24
2.6. Analytical Methods ................................................................................ 24
2.6.1. Extraction of Proteins........................................................................... 25
2.6.2. Enzyme Assays .................................................................................... 25
2.6.2.1. Lactate Dehydrogenase Assay ...................................................... 26
2.6.2.2. Pyruvate Decarboxylase Assay ..................................................... 26
2.6.2.3. Alcohol Dehydrogenase Assay ..................................................... 27
3. RESULTS AND DISCUSSION ........................................................................ 28
3.1. Shake Flask Cultures.............................................................................. 28
3.1.1. Effect of Inoculum Size and Working Volume on Lactic Acid and
Ethanol Production and Morphology ............................................................. 28
3.1.2. Kinetics of High Lactate Producing Fermentation............................... 35
3.1.3. Time Course of Enzymatic Activities .................................................. 37
3.2.1. Continuous Cultures with Cell Retention............................................. 47
3.2.3. Glucose Pulse ....................................................................................... 57
3.2.4. Fed-batch Culture................................................................................. 59
4. CONCLUSION.................................................................................................. 60
REFERENCES....................................................................................................... 61
APPENDICIES
A. Definitions of Yield Coefficients ............................................................. 70
B. Sample HPLC Chromatogram.................................................................. 71
C. Carbon Mass Balance Calculation............................................................ 72

xi
D. Kinetic Analysis of Product Formation in Terms of Enzymatic Activities
....................................................................................................................... 73
CURRICULUM VITAE ........................................................................................ 78

xii
LIST OF FIGURES
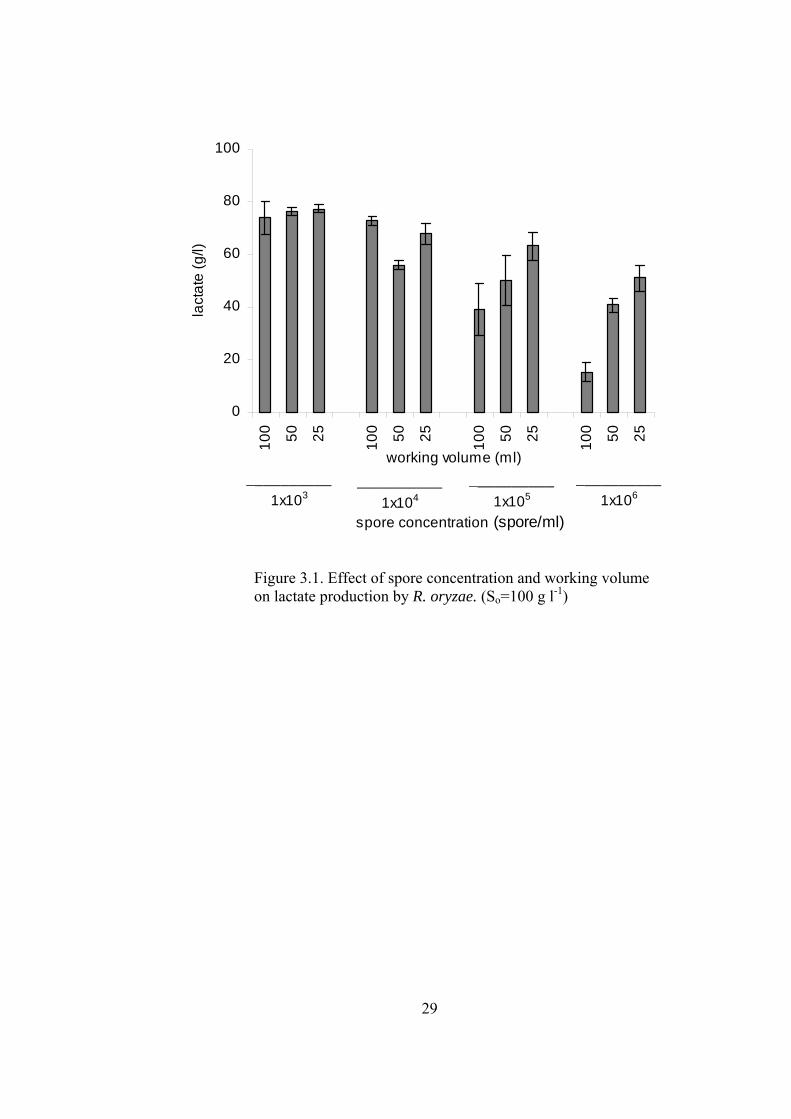
Figure 3.1. Effect of spore concentration and working volume on lactate
production by R. oryzae ......................................................................................... 29
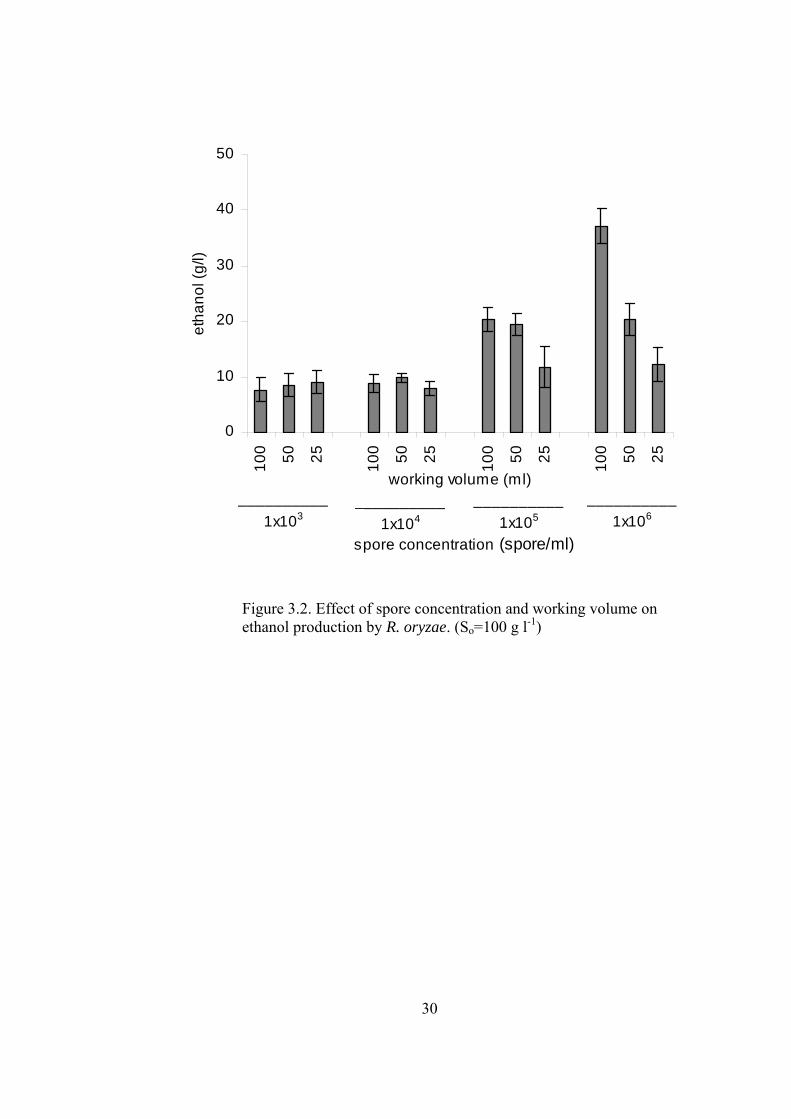
Figure 3.2. Effect of spore concentration and working volume on ethanol
production by R. oryzae. ........................................................................................ 30
Figure 3.3. Effect of spore concentration and working volume on biomass
production by R. oryzae ......................................................................................... 31
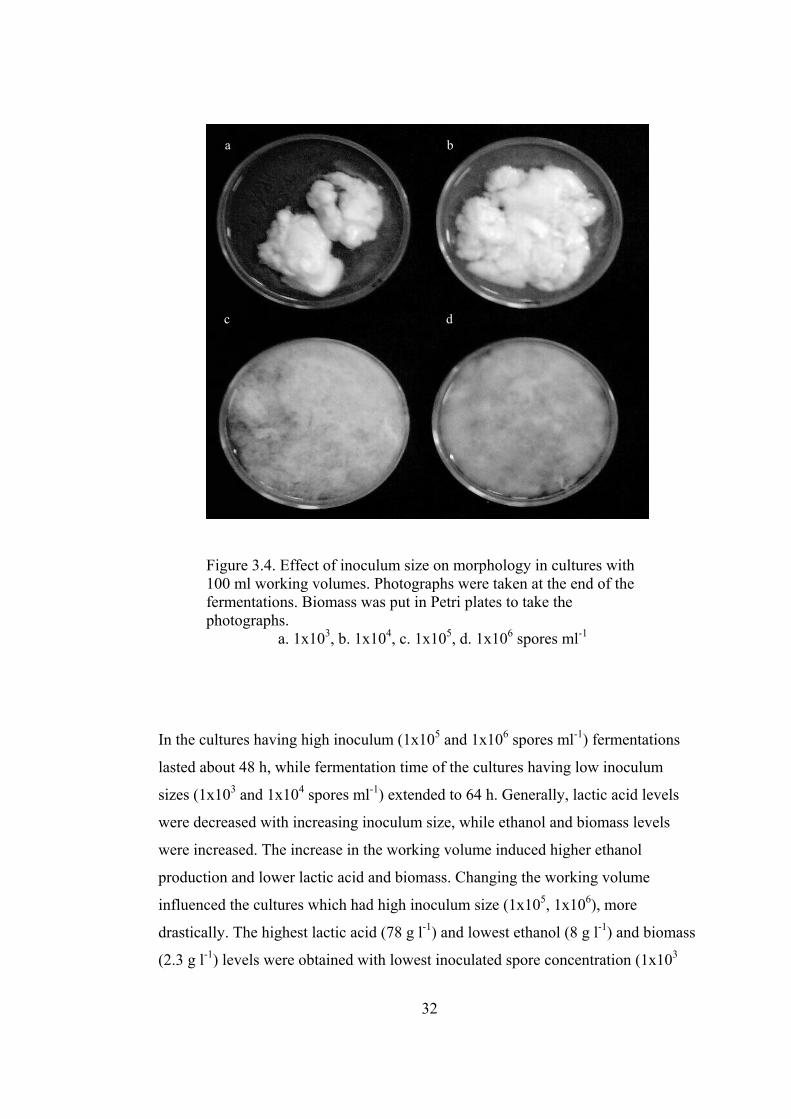
Figure 3.4. Effect of inoculum size on morphology .............................................. 32
Figure 3.5. Time course of glucose consumption, lactate and ethanol production
and dry cell weight in low inoculum size culture................................................... 36
Figure 3.6. Glucose consumption and lactate and ethanol productions in cultures
inoculated with A: 1x10³ spores ml-1, B: 1x10⁶ spores ml-1. Error bars indicate
standard deviations................................................................................................. 41
Figure 3.7. Comparison of specific activities of lactate dehydrogenase (LDH),
pyruvate decarboxylase (PDC) and alcohol dehydrogenase (ADH) in cultures
inoculated with 1x10³ (□) or 1x10⁶ spores ml-1. Error bars indicate standard
deviations ............................................................................................................... 42
Figure 3.8. Effect of initial glucose concentration on lactate, ethanol and biomass
yields ...................................................................................................................... 44
Figure 3.9. Effect of initial glucose concentration on yield values (g product per g
DCW). .................................................................................................................... 44
Figure 3.10. Change in glucose concentration ....................................................... 46
Figure 3.11 Pictures of R. oryzae in bioreactor. Left: Alginate immobilized
mycelia, Right: Free mycelia attached on the impeller, probes and sparger.......... 47
Figure 3.12. Fermentation kinetics in continuous cultures with cell retention ...... 54
Figure 3.13. Time course of fermentation after the glucose pulse. ........................ 58
Figure 3.14. Time course enzymatic activities after the glucose pulse.................. 58

xiii
Figure A. 1. A sample HPLC chromatogram showing the glucose , lactate and
ethanol peaks .......................................................................................................... 71
Figure A.2. Dependence of rate of LDH (closed squares) and PDC (open squares)
catalyzed reactions on pyruvate concentration according to Michealis-Menten
kinetics in lactate producing batch culture............................................................. 76
Figure A.3. Dependence of rate of LDH (closed squares) and PDC (open squares)
catalyzed reactions on pyruvate concentration according to Michealis-Menten
kinetics in ethanol producing batch culture............................................................ 76

xiv
LIST OF TABLES
Table 3.1. Lactic acid and biomass yields of R. oryzae grown on low
concentrations of glucose in shake flasks……………………………………….45
Table 3.2. Lactate, ethanol and biomass levels and yields in continuous alginate
immobilized R. oryzae cultures…………………………………………………55
Table 3.3. Specific activities of pyruvate branch point enzymes in continuous
alginate immobilized R. oryzae cultures………………………………………..56

xv
LIST OF ABBREVIATIONS
ADH Alcohol dehydrogenase
CE Ethanol concentration (g l-1)
CG Glucose concentration (g l-1)
CG,feed Feed glucose concentration (g l-1)
CG,reactor Reactor glucose concentration (g l-1)
CL Lactate concentration (g l-1)
DCW Dry cell weight (g)
DTE 1,4-Dithioerythritol
EDTA Ethelyne diamine tetra acetic acid
FUM Fumarase
GRAS Generally recognized as safe
LDH Lactate dehydrogenase
LAB Lactic acid bacteria
lpm Liter per minute
MES 2-[N-Morpholino]ethanesulfonic acid
MDH Malate dehydrogenase
PDC Pyruvate decarboxylase
PDH Pyruvate dehydrogenase
PMSF Phenyl methyl sulfonyl fluoride
So Initial glucose concentration (g l-1)
Tris trishydroxymethylaminomethane
TM Trypton-Minerals
vvm Volume per volume per minute
YSE Ethanol yield (g ethanol g glucose-1)
YSL Lactate yield (g lactate g glucose-1)
YSX Biomass yield (g DCW g glucose-1)
YXE Yield (g ethanol g DCW-1)

xvi
YXL Yield (g lactate g DCW-1)
X Biomass concentration (g l-1)
1
CHAPTER 1
CHAPTERS
1. INTRODUCTION
Rhizopus oryzae is an industrially important filamentous fungus, which is capable
of producing high amounts of L(+)-lactic acid. Some strains can produce fumaric
acid. Ethanol was produced in fermentations and has generally been considered as
by-product. However, with the increase in interest in bioethanol production,
ethanol production by R. oryzae also draws attention. Investigation of pyruvate
branch point of the organisms is of great interest because pyruvate lies in the
junction of many pathways; e.g. lactic, fumaric and ethanol producing pathways
and tricarboxylic acid cycle, which is the most efficient energy yielding pathway.
The possible overflow at the pyruvate level should result in production of the
partially oxidized organic acids and ethanol, like the ethanol production in yeasts.
In the literature, attempts are made, generally to increase product yield by
optimizing the nutritional and physical conditions for fermentation. In order to
better understand the distribution at the pyruvate level, regulation of the pathways
should be elucidated by more in-depth analysis. The targets for genetic
engineering can be determined by characterizing the enzymes and metabolites of
the pyruvate branch point as well as glycolysis and other central pathways.
Following, the properties of the organism and of some of the pyruvate branch
point enzymes are presented as well as general ideas about the regulation of sugar
metabolism and branch point by referring mainly to the studies on yeast.
1.1. Rhizopus oryzae
Rhizopus oryzae is a filamentous fungus, which is an active component in some
traditional foods of Indonesia, China and Japan. It is an obligate aerobe and it

2
lacks septation. Their asexual spores are contained within sporangia borne on
sporangiophores (19). Full classification of R. oryzae is given as: Eukaryota;
Fungi/Metazoa group; Fungi; Zygomycota; Zygomycetes; Mucorales;
Mucoraceae; Rhizopus. The synonyms of this fungus are: R. tritici, R. thermosus,
R. tamarii, R. suinus, R. peka, R. hangchow, R. formosaensis, R. formasaensis var.
chylamydosporus, R. delemar, R. chiuniang, R. arrhizus, R. liquefaciens, R.
javanicus Y. Takeda, R. pseudochinensis. R. oryzae is known to produce lactic
acid (41) and fumaric acids (35). There are also studies on the production of
ethanol (79), lipase (67), glucoamylase (88), xylanase (4), pectinolytic enzymes
(65) and chitosan (24) using this fungus.
1.2. Lactic Acid
1.2.1. Uses of Lactic Acid
Lactic acid and its salts have widely been used in industry. Main applications are
in food, chemical, pharmaceutical and cosmetic industries. Worldwide production
of lactic acid was 40 000 tons year-1 in 1990 (10), 120 000 tons per year in 2006
(9).
Since it is non-volatile, odorless and classified as GRAS, it has wide applications
in the food industry, such as flavouring, pH regulation, inhibition of microbial
spoilage, mineral fortification, acidulation and pickling agent. Esters of lactate
salts are used as emulsifying agents for bakery goods. Lactic acid and ethyl lactate
are used in pharmaceutical and cosmetic industries, in topical ointments, lotions,
anti acne solutions, humectants, parenteral solutions, in dialysis for anti carries
agents and biodegradable polymers for medical applications (10; 49). Lactate is
preferred for this applications, since it has water retaining capacity and skin
lightening property and it is a natural ingredient of the human body (83).
Technical grade lactic acid is used for leather tanning and textile finishing (49).
Currently, lactic acid draws a great attention as a feedstock for the poly lactic acid
production, which is biodegradable. In medicine, PLA are used as sutures,

3
orthopedic implants and in controlled drug release (49). It is also a good packaging
material for food products, since it is transparent and degrades slowly by
hydrolysis (10). Other potential applications of lactic acid and its derivatives are
oxygenated chemicals, green chemicals and growth regulators (10; 9).
1.2.2. Industrial Lactic Acid Production
Lactic acid can be produced chemically and biotechnologically. The chemical
route produces racemic lactic acid, while fermentative production can produce the
desired isomer. Ninety percent of the worldwide production of lactic acid is by
fermentative route (27). In chemical route hydrogen cyanide is added to
acetaldehyde to yield lactonitrile, which is recovered and distilled. It is hydrolyzed
to lactic acid by HCl or by H2SO4. Methyl lactate is produce by esterification of
lactate with methanol. Methyl lactate is recovered and purified by distillation and
hydrolyzed by water under acid catalysis to produce lactic acid.
Commercial fermentative lactic acid production relies on lactic acid bacteria,
mainly the genus Lactobacillus (10; 83). Carbohydrate feedstocks (molasses, corn
syrup, whey, dextrose, sugar) are used as the carbon source and proteinaceous and
complex nutrients are supplied in the form of yeast extract, corn steep liquor, soy
hydrolysate, etc. Acid formed is neutralized by excess CaCO3. Carbohydrate,
which is around 10% is utilized in 4-6 days in batch fermentation (10). Lactic acid
yield is around 90% (See Appendix A for definition of yields). Fermentation broth
is filtered to remove cells, carbon treated, evaporated. Ca salt of lactic acid in the
broth is acidified with sulphuric acid to get lactic acid and resulting insoluble
CaSO4 (gypsum) is removed by filtration. Lactic acid is purified by carbon and ion
exchange columns and evaporated. Esterification, distillation and hydrolysis can
be used for further purification.
Lactic acid yield of bacterial fermentation is high, however LAB have complex
nutritional requirements, which increases the raw material cost and adds
purification steps. In addition to these, lactic acid isomer is not 100% pure.
Producing pure L(+)-lactic acid and having the ability to grow on inorganic

4
nitrogen salts, causes R. oryzae to draw attention. However, lower lactic acid yield
than LAB prevents its commercial use.
1.3. Organic Acid and Ethanol Production by Rhizopus oryzae
1.3.1. Lactic Acid
Fungal lactic acid production draws attention, since it has simpler nutritional
requirements than lactic acid bacteria (LAB), thus product clarification is easier.
However, it requires vigorous aeration for lactic acid production (80) and lactic
acid yield is lower than LAB, due to producing ethanol and fumaric acid as by-
products. Recently, the number of reports on the fungal lactic acid production has
increased, since the demand for poly L-lactic acid is increasing (9). R. oryzae
produces enantiometrically pure L-lactic acid, which is the preferred feedstock for
poly-lactic acid production.
The first submerged cultivation of R. oryzae for lactic acid production was
described in 1936 (41). In this study, Lockwood and Ward (41) found the optimum
conditions for lactic acid production by R. oryzae including glucose concentration,
temperature and concentrations of mineral salts. Their findings about the
nutritional requirements for lactic acid production are still being used today. R.
oryzae converts glucose to lactic acid aerobically, while limited O2 concentrations
in the culture medium increases ethanol production (80). The fungus can also
utilize starch directly to produce lactic acid (23; 28). It is also reported to produce
lactic acid from xylose (43). In recent years there have been attempts to utilize
wastes for lactic acid production, such as potato starch wastewater (28; 29), food
processing waste streams (30) waste office paper (53)and corncobs (62; 3; 47). Yin
et. al. investigated the effect of various carbon sources on lactic aid production by
R. oryzae and obtained the highest yield by corn starch either liquefied by α-
amylase (82%, based on initial carbohydrate concentration) or hydrolyzed by HCl
(79%), followed by glucose (77%), fructose (73%), mannose (70%) and sucrose
(52%). Yields obtained by galactose and pentoses were found to be not significant

5
(below 3%). Ammonia nitrogen can be utilized by the fungus; (NH4)2SO4 or
NH4NO3 are sufficient for the lactic acid fermentation (41). Sugar and the nitrogen
source were supplemented with K+, Mg+2, Zn+2, SO4- and PO4
-. CaCO3 is used
generally to neutralize the acid formed.
Lactic acid yields have typically been below 85% and productivity is around 2 g/L .h (80). These prevent R. oryzae to compete with LAB for industrial lactic acid
production. Starting from eighties, reports on fungal lactic acid production are
increased, mostly concentrating on the optimizing fungal morphology. Approaches
include entrapment of cells in polymeric matrix (25; 22; 12; 77; 84; 80; 14),
attachment of cells on a support (12; 76; 84) natural immobilization of cells (80)
and promotion of pelleted (36; 85; 2) or mycelial growth(36). These approaches
resulted in increased production yields and rates. Increased yields and rates can
make fungal lactic acid production economically feasible (44).
1.3.2. Fumaric Acid
Some strains of R. oryzae are capable of producing high amounts of fumaric acid.
Other Mucorales genera that can produce this acid are Mucor, Cunnighamella, and
Circinella. Rhodes et. al.. (1959) examined the effects of several physical and
nutritional factors on fumaric acid production by R. arrhizus (60). In 3 to 8 days 60
to 70 % of the sugar utilized was converted to fumaric acid at 33 oC in vigorously
shaken submerged culture. Urea and ammonium sulfate were the most suitable
nitrogen sources. Zinc, magnesium, phosphorus, iron and corn steep liquor were
necessary for high fumaric acid accumulation (60). Zhou et al.. (91) showed that
an initial pH of 3.05 and optimal Mg+2, Zn+2 and Fe+2 concentrations (50 ppm, 4
ppm and 100 ppb, respectively) were optimal conditions for the formation of small
(diameter <1 mm), spherical and uniformly distributed pellets, which favored high
fumaric acid production. Like in lactic acid producing strains, some of the glucose
is converted to ethanol in fumaric acid producing strains. Generally CaCO3 is used
to neutralize the acid formed in fumaric acid fermentations. However, calcium
fumarate has low solubility, which limits the product concentration in the

6
fermentation broth (90). In addition carbonate is the source of the CO2 in the
formation of oxaloacetate from pyruvate by pyruvate carboxylase (See Section
1.5.4. Pyruvate Branch Point Enzymes). Fumaric acid accumulation by R. oryzae
occurs by a cytosolic pathway. Pyruvate is converted to fumarate by the combined
activities of pyruvate carboxylase, malate dehydrogenase, and fumarase (51; 35).
1.3.3. Ethanol
There is an increasing interest in biomass based ethanol (bio-ethanol) production.
The risk of global warming and shortage and environmental risks of petroleum
based fuels promote bioethanol usage. Many filamentous fungus can produce
ethanol and some posses xylanase, cellulase and amylase (71). This enables them
to carry out simultaneous saccharification and fermentation of biomass, such as
agricultural wastes, to ethanol. S. cerevisiae has been used widely to produce
ethanol; however it does not ferment xylose, the main ingredient in agricultural
biomass. Skory et al. (1997) screened several Aspergillus and Rhizopus strains for
their ability to ferment simple sugars and some complex substrates. and observed
that Rhizopus strains could produce more than 31 g ethanol/l under anaerobic
stress from 100 g /l glucose (71). Using 50 g/l initial glucose concentrations 25 g/l
ethane was produced. Xylose, cellubiose and corn fiber were also fermented with
poorer yields. Paperpulp sulfite liquor (79), wood hydrolyzates (46), corn flour
(82), and dilute acid pretreated rice straw (33) were tested as a substrate for
ethanol production by Rhizopus strains. R. oryzae could ferment the hexoses and
pentoses in the paperpulp spent sulfite liquor with a ethanol and lactic yields of
0.37 and 0.30 g/g, respectively (79). From dilute acid wood hyrolyzates, R. oryzae
produces ethanol with a yield of 0.41 g/g substrate (46). Results show that ethanol
production capability of Rhizopus from wastes is promising.
1.4. Morphology of Rhizopus
Morphology of filamentous fungi in submerged culture is of great importance,
since it influences the physiology of the organism and the reactor performance.

7
Filamentous fungi exhibit different growth forms in liquid media; such as freely
dispersed mycelia, loose hyphal aggregates (clumps), dense aggregates (pellets) of
different sizes (17; 93). The morphology influences the rheology of the
fermentation media and the heat and mass transfer properties in the reactor.
Dispersed mycelia increases the viscosity of the fermentation broth, which needs
more power input to achieve sufficient mixing (17). Pelleted growth does not
increase the broth viscosity; however, pellets are not uniform aggregates, in which
mass transfer limitation may occur. These different macro-morphologies observed
in filamentous fungi strongly affect the transport of nutrients and gases into and
out of the mycelial aggregates. Therefore, the metabolites produced and their
yields depend on the growth form of the organism (17; 93). Factors that influence
the morphology includes agitation, pH, medium components, inoculum size,
temperature, substrate concentration and aeration (6; 5; 48; 91; 92; 93; 39).
Morphology of Rhizopus spp. has been studied by several authors, generally, in an
effort to increase the lactic or fumaric acid yields. Like other filamentous fungi,
the morphology of Rhizopus spp. ranged from small and large aggregates to
filamentous form. Filamentous form anchors on the internal elements of the
bioreactors, such as impellers, probes and baffles. Initial pH values between 2.60
to 3.36 were shown to induce formation of small pellets (<1mm), whereas trace
metals had also significant effects on growth type in fumaric acid producing R.
oryzae (91). Inoculum concentration was shown to strongly affect the morphology
in R. oryzae (85; 2; 39). Small pellets obtained by adjusting the inoculated spore
concentration to the preculture increased the lactic acid yield, while filamentous
growth and clumps/congealed masses yield lower lactic acid (85; 2). Metal ions
negatively affected the pellet formation, while soybean peptone had a positive
effect and potato dextrose broth and calcium carbonate were beneficial to R.
oryzae for growing small and smooth pellets (39). The effect of peptone on growth
type and pellet number was also observed by Byrne and Ward (1989), while the
glucose concentration affected only the pellet number (5). Increasing agitation
speed caused fungal pellets to decrease in size, while increasing aeration caused an
increase (2). The morphology of R. oryzae could be manipulated by immobilizing
the spores in alginate beads (25; 38; 84), on polyurethane foams (12; 78), on loofa
8
sponge(16), in polyvinylalcohol-cryogel (14). It was also immobilized naturally in
a rotating fibrous bed placed around the impeller in a bioreactor (80).
Immobilization generally prevents either formation of viscous fermentation broth
or adhesion of the mycelia on the reactor elements, which increases the lactic acid
yields. Immobilized cells and pellets can be reused in successive fermentations.
Another approach was to use mycelial flocs obtained by adding a mineral support
and polyethylene oxide, which also enhanced the lactic acid yield significantly
(36; 54).
1.5. Sugar Metabolism and Pyruvate Branch Point
1.5.1. Glycolysis
Microorganisms hydrolyze oligosaccharides, transport sugars into the cell, and
oxidize them to pyruvate and catabolize pyruvate (Figure 1.1). Sugar phosphates
are cleaved to triose phosphates by either Embden-Mayerhof (often referred as
glycolysis) pathway, Entner-Doudoroff pathway or hexose-monophosphate
pathway. Triose phosphates are oxidized to pyruvate by Embden-Mayerhof
pathway, which is common for all organisms (58). Glycolysis is the central
metabolic pathway and is present in almost all of the organisms. In glycolysis one
mole of glucose is converted to two moles of pyruvate via 10 enzymatic steps.
Glucose, the breakdown product of oligosaccharides and storage polysaccharides,
and other carbohydrates are oxidized to pyruvate. In the first part of glycolysis
(five reactions), in which energy is invested, the sugar is phosphorylated to
fructose-1,6-bisphosphate using two ATPs. This molecule is cleaved to yield two
moles of glyceraldehyde-3-phosphate, which is dehydrogenated and
phosphorylated to yield 1,3-bisphospo-glycerate. This is the first “high energy
compound”, the second is phosphoenol-pyruvate. These transfer their phosphates
to ADP, yielding ATP, which process is called “substrate level phosphorylation”.
Thus, net two molecules of ATP and two molecules of NADH are produced during
glycolysis.

9
Fermentative capacity of organisms is important in industrial applications, such as
production of ethanol and organic acids. A classical application is production of
ethanol by S. cerevisiae in distillers or as fuel alcohol. Faster utilization of sugar is
important for the economy of the processes. Therefore, there have been attempts to
improve glycolytic flux of this yeast (66; 26; 74). Flux through a pathway is
controlled mainly by the amount of enzymes and by allosteric effectors. It was
suggested that flux is controlled at “key points”, i.e. at the sugar uptake, and at the
irreversible steps: hexokinase, phosphofructokinase and pyruvate kinase (66).
Each glycolytic enzyme was overexpressed of S. cerevisiae including the above
ones and also some pairs of them were overexpressed. No increase in ethanol
production rates were observed (66). This questioned the hypothesis that suggested
a single flux-controlling enzyme. Similarly, overexpression of
phosphofructokinase and pyruvate kinase did not increase citric acid production in
Aspergillus niger (63). Authors observed decreased fructose-2,6-bisphosphate
levels, which could decrease the specific activity of phosphofructokinase. The
control may be shared among more than one or all of the glycolytic enzymes. In an
effort to increase the fermentative capacity of S. cerevisiae, Smits et.al. (2000)
overexpressed simultaneously the seven enzymes of the lower part of glycolysis
in; glyceraldehydes-3-phosphate dehydrogenase, phosphoglycerate mutase,
phosphoglycerate kinase, enolase, pyruvate kinase, pyruvate decarboxylase and
alcohol dehydrogenase. The recombinant strain exhibited higher enzyme level than
the host strain. Upon a glucose pulse to aerobic glucose-limited continuous culture,
specific CO2 production rate was increased in the host and the recombinant strain.
The increase was higher in the recombinant strain, which showed an increased
fermentative capacity. However, the ethanol yield was the same in both strains. On
the other hand Otterdtedt et al. (52) could alter the mode of metabolism of S.
cerevisiae by changing a single step. They generated a strain in which glucose
uptake was dependent on a chimeric hexose transporter mediating a reduced sugar
uptake. This strain respired the glucose even at high glucose levels, i.e., it did not
exhibit Crabtree effect (see below).

10
GlucoseATP
ADP
Hexokinase
Glucose-6-phosphate
Phosphoglucoisomerase
Fructose-6-phosphate
NAD+
Phosphate Glyceraldehyde-3-phosphate dehydrogenase
1,3-bisphosphoglycerate
Glyceraldehyde-3-phosphate Dihydroxyacetone phosphate
Aldolase
Triosephosphate isomerase
ATP
H+
ADP
Phosphofructokinase
Fructose-1,6-bisphosphate
ADP
ATP
Phosphoglycerate kinase
3-phosphoglycerate
Phosphoglycerate mutase
2-phosphoglycerate
Enolase
Phosphoenolpyruvate
H2O
ATP
H+
ADPPyruvate kinase
Pyruvate
NADH
Figure 1.1. Scheme of glycolysis.
11
1.5.2. Pyruvate metabolism
Pyruvate lies in the junction of many pathways (Figure 1.2). In aerobic organisms
pyruvate is oxidized to acetyl-CoA and further oxidized to CO2 and water in
mitochondria via TCA cycle. Reducing equivalents generated in glycolysis and
TCA (NADH and FADH) are reoxidized through the electron transport chain.
Complete combustion of one mole of glucose in aerobic metabolism yields up to
38 molecules of ATP. In anaerobes pyruvate is not further oxidized. NADH
molecules generated in glycolysis are reoxidized to NAD+ by transferring electrons
to an electron acceptor. Some microorganisms can transfer electrons to inorganic
ions, while some reduce organic substances. Lactate is one of these organic
substances. Pyruvate is reduced to lactate while NADH is reoxidized to NAD+.
Lactic acid bacteria, which are facultative anaerobes, reduce pyruvate mainly to
lactate, but acetate, formate, ethanol, acetaldehyde, diacetyl, acetoin and 2,3-
butanediol can also be produced from pyruvate (40). Aerobic organisms can also
reduce pyruvate rather than further oxidize them under limiting O2 conditions or
pyruvate is produced in excess of mitochondrial capacity. Animal cells reduce
pyruvate to lactate upon heavy exercise; when pyruvate is produced faster than
that can be metabolized by mitochondria. Yeasts can cleave pyruvate into
acetaldehyde and CO2; acetaldehyde is further reduced to ethanol. This is the
generation of alcohol in beverages by yeast fermentation. Baker’s yeast uses this
mechanism for leavening of dough, where O2 that is initially present is depleted
rapidly leading to anaerobic conditions. In plants, anaerobiosis occurs upon soil
flooding and submergence, under which conditions, the organism depends mainly
on fermentation as the main energy source. According to Davies-Roberts
hypothesis, plants respond to anaerobiosis by producing lactate initially, which
causes a drop in cytoplasmic pH. Upon the pH drop, ethanol production is initiated
(34).
There are many organic acids produced commercially by biotechnological routes,
including citric, gluconic, lactic, itaconic, oxalic, fumaric, malic acids. Their
production based on utilization of sugars by specific microorganisms. Ethanol is

12
another large volume product produced by fermentation by yeast species.
Commercial success of biotechnological production of ethanol and organic acid or
fungal biomass (such as baker’s yeast) depends on rapid (and economical)
conversion of sugars to acids and ethanol. Therefore, it is of great importance to
characterize the reactions, understanding the mechanisms and regulation of sugar
uptake, glycolysis and further oxidation and reduction reactions of pyruvate.
Ethanol
AcetaldehydeL-Lactate PYRUVATE
CO2
Cytosol
Pyruvate
Ac-CoAMitochondrion
TCA
ADH
LDH PDC
Glucose
Oxaloacetate
Fumarate
Malate
CO2
MDH
FUM
PC
Figure 1.2. Pyruvate branch point of Rhizopus oryzae

13
1.5.3. Regulation of Sugar Metabolism of Yeast
The yeast S. cerevisiae has been the subject of many studies, since not only it has
been used for centuries for leavening of bread and production of beer and wine,
but also it has a distinct sugar metabolism. Sugar metabolism can be considered
the most important metabolic activity, thus is the main subject of research. S.
cerevisiae has been the model organism in cell biology and molecular genetics.
The regulation of yeast sugar metabolism may give insights for our studies on R.
oryzae.
There are four “effects” that regulate sugar metabolism of yeast; Pasteur, Crabtree,
Kluywer and Custers effects. They are all related to respiratory and fermentative
metabolism. The most prominent one is the Crabtree effect, because it is the main
consideration in biomass-directed applications, such as in production of baker’s
yeast. It is the occurrence of alcoholic fermentation under aerobic conditions (58).
At high growth rates, Crabtree positive yeasts, such as S. cerevisiae, ferment
glucose to ethanol due to low capacity of respiratory pathway for pyruvate
dissimilation. When cells growing under sugar limitation are exposed to glucose
excess, respiratory route is saturated and excess pyruvate is converted to ethanol.
This effect was named after Crabtree, who first showed the repression of
respiration in tumor cells (8). De Deken (11) found the same phenomenon in S.
cerevisiae and concluded that an energy source (respiration) was repressed by
another energy source (fermentation). Glucose represses the genes encoding
enzymes that are involved in gluconeogenesis, TCA cycle, respiration,
mitochondria development and the utilization of carbon sources other than
glucose, fructose or mannose (45). Kappeli (32), however, explained the
occurrence of respire-fermentative metabolism (fermentation under aerobic
conditions) by limited capacity of the respiratory pathway. In glucose limited
aerobic continuous culture, O2 uptake rate increases as dilution rate increases and
is constant at the maximum value after the dilution rate at which
respirofermentative metabolism starts. This phenomenon is considered in baker’s
yeast production. In baker’s yeast production, cost of the carbohydrate feedstock is

14
the major factor. Therefore biomass yield on carbohydrate should be high. In
fermentative metabolism biomass yield is much lower than in respiratory
metabolism. In order to avoid fermentative metabolism, broth is aerated vigorously
while sugar is added at the same pace with that of sugar consumption.
Pasteur effect is defined by suppression of alcoholic fermentation in the presence
of O2. It occurs in yeasts that do not exhibit Crabtree effect. In S. cerevisiae this
can be seen only in slowly growing cells, in which glycolytic flux is low. Custers
effect is known as the inhibition of alcoholic fermentation by the absence of
oxygen. Yeasts exhibiting this effect can not close the redox balance by producing
glycerol or other metabolites under aerobic conditions (58; 61). Some yeasts do
not ferment disaccharides, although they can ferment glucose, which is called
Kluyver effect. This is due to the control and/or synthesis of the sugar carrier (58).
Maximum specific growth rate and biomass yield of S. cerevisiae is influenced by
the mode of growth. In aerobic batch cultures respirofermentative growth is
observed, which is characterized by fast growth but low biomass yield. Full
respiratory growth can be achieved in chemostat at low dilution rates and fed-
batch cultures, in which sugar is added slowly. The specific glucose uptake rate
increases with the specific growth rate up to a point, after which
respirofermentative metabolism initiated. Below that critical specific growth rate
S. cerevisiae produces biomass and CO2 with a yield on glucose of 0.55 and 0.45 g
g-1, respectively. At high glucose uptake rates carbon flow through biomass is
lower, around 0.12 g g-1, and rest of the glucose is diverted to ethanol, CO2 and
other products. Under anaerobic conditions; S. cerevisiae can grow as long as
ergosterol and unsaturated fatty acids are supplied. Energy is generated from
glycolysis and ethanol is produced in relation to growth. Biomass yield is around
0.1 g g glucose-1.
1.5.4. Pyruvate Branch Point Enzymes
There are several fates of pyruvate in the cell. In order to increase the flux through
the desired branch, the characterization of the pyruvate branch point enzymes and
understanding the regulation of the flux distribution are of great importance.

15
Pyruvate is used as substrate by pyruvate dehydrogenase, pyruvate decarboxylase,
pyruvate carboxylase and lactate dehydrogenase. Pyruvate is transported to
mitochondria and decarboxylated and oxidized to acetyl-CoA by pyruvate
dehydrogenase complex (EC 1.2.4.1). Cytosolic pyruvate can be decarboxylated to
acetaldehyde by pyruvate decarboxylase (EC 4.1.1.1), which in turn is reduced to
ethanol by the action of alcohol dehydrogenase (EC 1.1.1.1). Another fate of
pyruvate in cytosol is the reduction to lactate by lactate dehydrogenase (EC
1.1.1.27). Pyruvate carboxylase (EC 6.4.1.1) catalyzes the ATP dependent
carboxylation of pyruvate to oxaloacetate. In yeast, researches generally focused
on competition for pyruvate by pyruvate dehydrogenase and pyruvate
decarboxylase (58). R. oryzae has another competitor for pyruvate, lactate
dehydrogenase, which is responsible for high amounts of lactic acid. Fumaric and
malic acids are produced via pathway starting by carboxylation of pyruvate by
pyruvate decarboxylase in this fungus (44).
1.5.4.1. Lactate Dehydrogenase
Three lactate dehydrogenase have been described in R. oryzae (50; 56; 57; 68).
The NAD+-dependent LDH catalyzes reduction of pyruvate by NADH, but not the
reverse reaction. It shows high activity at high glucose levels and during the early
vegetative growth (57). Enzyme obeyed the Michaelis-Menten kinetics with
respect to pyruvate and the Km values for pyruvate reported were 0.55 (57) and
0.64 mM (89). The Km for NADH was reported as 0.29 (57) and 0.15 mM (89).
Reaction velocity showed a sigmoidal response to NADH concentrations up to
0.03 mM. Lineweaver-Burk plot was linear above this NADH concentration.
NAD+-dependent LDH level decreases when glucose was exhausted in the
medium. An NAD+-independent enzyme replaced and oxidized lactate to pyruvate
(56). It can use dichlorophenol indophenol, ferricyanide or cytochrome c but not
oxygen as electron acceptors. The Km for L-lactate was calculated as 3.85 mM
(using dichlorophenol indophenol as electron acceptor).

16
Skory (2000) cloned two genes, ldhA and ldhB, which encode NAD+-dependent
LDH from R. oryzae. LdhA was involved in lactic acid production and was present
when glucose, xylose or trehalose was the carbon source. LdhB was present only
when the fungus was grown on non fermentable substrates; ethanol, glycerol or
lactate. Skory (2004) transformed R. oryzae with plasmids containing various
lengths of ldhA gene fragment and one of the transformants could produce 7%
more lactic acid than the parent strain.
1.5.4.2. Pyruvate Decarboxylase
Pyruvate is decarboxylated to acetaldehyde by PDC, which is a TPP and
magnesium dependent cytosolic enzyme. Pyruvate decarboxylases of R. oryzae
were purified and characterized (1). Two isoenzymes had similar characteristics.
The Km for pyruvate was found as 3.9 and 4.5 mM for the two isoenzymes (1).
Two PDC genes were cloned and they showed 85% nucleotide sequence identity
within the coding region (69). In a non fermentable substrate, glycerol, no pdc
transcript was detected, but induced upon glucose addition. Shifting from aerobic
to anaerobic conditions enhanced PDC activity, pdc transcript, and ethanol
production, compared to aerobic cultures.
In aerobic sugar limited cultures of S. cerevisiae, PDC activity increases above the
critical dilution rate (growth rate) at which alcoholic fermentation is initiated (55).
When three pdc genes (pdc 1, pdc5 and pdc6) of S. cerevisiae that encodes active
PDC were knocked-out, the organism could not grow on glucose as the sole
carbon source unless small amounts of ethanol or acetate were added to the
medium (15). It was concluded that PDC was indispensable for growth of S.
cerevisiae, providing the cytosolic acetyl-CoA to be used in lipid synthesis.
1.5.4.3. Alcohol Dehydrogenase
Alcohol dehydrogenase (ADH) reduces acetaldehyde, which is produced from
pyruvate by the action of pyruvate decarboxylase, to ethanol by oxidizing NADH.

17
Two ADH isozymes from R. javanicus were characterized (86; 87). Both isozymes
have a molecular weight of 62000 and are composed of four subunits. ADH I was
thought to be responsible for the ethanol formation, while ADH II was involved in
ethanol catabolism. ADH I could oxidize straight chain primary alcohols, whereas
ADH II showed broader substrate specificity. NADP was not required as the
cofactor for either enzyme (87). The Km of ADH I for ethanol and NAD were
determined as 20.8 mM and 0.311 mM, respectively (86).
S. cerevisiae contains five ADH forms. ADH I is cytosolic and constitutive. It is
the major enzyme in fermentative growth, reducing acetaldehyde to ethanol . ADH
II is also cytosolic but absent from glucose-grown cells and ADH III is
mitochondrial (7). ADH IV is a formaldehyde dehydrogenase and has no effect on
ethanol production (13). The function of ADH V is currently unknown (73).
1.5.4.4. Pyruvate Carboxylase
Pyruvate carboxylase is a member of biotin dependent enzyme family and
catalyzes the ATP-dependent carboxylation of pyruvate to oxaloacetate (31).
Pyruvate carboxylase is localized in cytosol in R. oryzae as well as in S. cerevisiae
and in higher fungi, although in many higher organisms it is a mitochondrial
enzyme (51; 58). Malate dehydrogenase and fumarase, which are the other
enzymes of the fumarate accumulating pathway are also cytosolic in R. oryzae
(35). Purified R. arrhizus pyruvate carboxylase is partially inhibited by L-aspartate
and 2-oxoadipate. It is activated by acyl derivatives of coenzyme (51). In S.
cerevisiae the Km values of the enzyme for pyruvate, bicarbonate and ATP were
estimated as 0.8 mM, 2.7 mM and 0.24 mM, respectively (58).
1.5.4.5. Pyruvate Dehydrogenase
Pyruvate produced by glycolysis is transported to mitochondria and converted into
acetyl-CoA in mitochondria by pyruvate dehydrogenase complex. Complete
oxidation of acetyl-CoA by TCA cycle provides high amounts of energy under
aerobic conditions. Acetyl-CoA can alternatively be produced by PDH bypass

18
pathway, by the enzymes pyruvate decarboxylase and acetaldehyde
dehydrogenase.
PDH is a large multi enzyme complex. Conversion of pyruvate to acetyl-CoA is
catalyzed by the concerted action of the catalytic subunits. In S. cerevisiae Km
values of PDH for pyruvate, NAD+, and CoA are 625 µM, 23 µM and 18 µM,
respectively (37). Enzyme shows no cooperativity with respect to pyruvate, unlike
the other prokaryotic PDHs. Kinetic and regulatory properties were found similar
to the mammalian PDH, except that Km for pyruvate was much higher than
mammalian enzyme, but similar to values reported for the enzyme in Gram
negative bacteria (37). Pdh- S. cerevisiae mutants could grow on glucose,
indicating that pyruvate dehydrogenase bypass could replace PDH (59). However,
the bypass consumes one ATP, therefore biomass yield was lower (0.52 vs. 0.44 g
g-1 glucose) (59).
1.5.4.6. Competition between Enzymes for Pyruvate
The rate of a metabolic reaction can be controlled in vivo by amount (synthesis) of
the enzyme catalyzing the reaction, by modification of the enzyme and by the
concentrations of the substrates, activators and inhibitors.
Pyruvate concentration may be the main factor that determines the fate of it. Km
for pyruvate of the pyruvate dehydrogenase is an order of magnitude lower than
that of pyruvate decarboxylase in S. cerevisiae. Therefore, at low intercellular
concentrations of pyruvate PDC is by-passed and it is dissimilated by the
respiratory pathway. At high concentrations of pyruvate, it is dissimilated by the
fermentative pathway producing ethanol. In aerobic chemostat cultures with
limiting glucose concentrations, the onset of ethanol production coincided with the
increase in the extracellular pyruvate concentration, which was the indicative of
the intracellular concentration of it (55). In S. cerevisiae the pyruvate branch point
enzymes are expressed under all growth conditions investigated, although at
different amounts. PDC is present in the cell at high levels irrespective of the O2

19
and glucose availability, but it is bypassed in glucose limited respiratory growth.
On the other hand, switch to respirofermentative metabolism in S. cerevisiae is at
least partly due to the limited synthesis of acetaldehyde dehydrogenase, which is a
PDH bypass enzyme (58).
1.6. Aim of the Study
The morphology and low lactic acid yield due to ethanol production as by product
are the disadvantages of this organism in competing with lactic acid bacteria for
industrial lactic acid production. Elucidating the pyruvate branch point can help to
increase the lactic acid or ethanol production.
Lactic acid and ethanol portioning at pyruvate branch point of the organism was
the main focus of this study. Under some conditions that influenced the lactic acid
and ethanol production physiology was defined and supported with activities of
pyruvate branch point enzymes. Previous researches in our group and the
preliminary work of this study as well as the reports in the literature showed that
inoculum concentration influence the physiology and morphology of R. oryzae. In
the first part of this study we aimed to quantify the effect of inoculum
concentration on the physiology of the organism. In the second part, the possible
overflow mechanism at the pyruvate branch point was sought.
This study was composed of two main parts: 1) Investigation of the effect of
inoculum size and working volume on the physiology of R. oryzae, 2)
Investigation of the physiology of R. oryzae at different glucose concentrations.
Both parts included the measurement of the extracellular metabolites, namely,
lactate, ethanol, glycerol, as well as biomass and measurement of the activities of
lactate dehydrogenase, pyruvate decarboxylase and alcohol dehydrogenase.
20
CHAPTER 2
2. MATERIAL AND METHODS
2.1. Chemicals
The chemicals used in all experiments were all of analytical grade and
commercially available from Sigma, Aldrich, Merck, Oxoid and Fluka.
2.2. Organism
Rhizopus oryzae ATCC 9363 (NRRL 395), a lactic acid producing fungal strain,
was used in this study.
2.3. Preparation of Spore Suspension
The organism was maintained and sporulated on potato dextrose agar plates at 30 oC in 4-7 days. Plates were inoculated with 10-20 µl of spore suspension. Fungal
mat carrying the spores was separated from agar using forceps and suspended in
water. Shaking vigorously spores were transferred from the mat to suspension.
Fungal mat was taken out and remaining spore suspension was filtered through a
layer of glass wool to remove to carry over mycelia and agar particles. Suspension
was centrifuged at 15000 rpm for 5 min (Hettich Microlitre, Germany) and
supernatant was discarded. Spore pellet was resuspended in water. Spore
concentrations were determined by counting the spores on a haemocytometer.
Spore concentration was around 1x10⁷-1x10⁸ spores ml-1 of the suspension. Spore
suspension was used not more than one week.

21
2.4. Immobilization of Spores in Ca-alginate Beads
In 20-50 ml 2.0% Na-alginate solution 1x10⁶ spores ml-1 alginate were suspended.
This suspension was pumped slowly in to the 200-300 ml 4% CaCl2.2H2O solution
by a peristaltic pump through a hypodermic needle. Droplets formed in the needle
tip fall into the CaCl2 solution, which was being stirred on magnetic stirrer, from
approximately 10 cm and hardened immediately as Ca-alginate beads. Beads were
approximately 2.5 mm in diameter. Beads were allowed to harden for 30-60 min
and then were filtered on a mesh having a pore size of approximately 1mm in
diameter, washed once with distilled water and suspended in culture media.
2.5. Culture Conditions
R. oryzae was cultivated in shake flasks and in bioreactor. In bioreactor continuous
cultures with cell retention were performed. Unless otherwise stated mineral
solution used in the cultivations were composed of (g l-1); (NH4)2SO4 (2), KH2PO4
(0.65), MgSO4.7H2O (0.25), ZnSO4
.7H2O (0.05). Glucose, the carbon source of the
fermentations, was supplied as glucose monohydrate.
2.5.1. Shake Flask Cultures
Lactate production medium was composed of mineral solution and varying amount
of glucose. This medium was inoculated directly from the spore suspension to
have final spore concentration of 1 x 10³, 1x10⁴, 1x10⁵ or 1x10⁶ spores ml-1 of the
culture medium. Fermentations were carried out in 250 ml cotton-plugged flasks
containing 25, 50 or 100 ml culture medium in flask shaker with a shaking
diameter of 12.5 mm (Aerotron, Infors AG) at 150 rpm and 35 oC. CaCO3 powder
was added intermittently in 0.25-0.50 g aliquots, when the media became clear due
to the total utilization of CaCO3. This ensured that pH was kept around 5-6. Media
were sterilized in autoclave at 121 oC for 15 minutes. CaCO3 powder was sterilized
in oven at 100 oC overnight. Results reported for shake flask culture were
generally average of three experiments.
22
2.5.2. Preculture for Fermenter
R. oryzae was pregrown in either mineral medium or in trypton-minerals (TM)
medium.
For continuous cultures with cell retention, 50 ml alginate immobilized R. oryzae
was pre-cultured in the fermenter in 1 l TM medium, containing of 10 g l-1 trypton
and minerals at concentrations given above. pH of the medium was adjusted to 5.5
by concentrated HCl and was not controlled throughout the cultivation. pH
increased to 6.5-7.0 in 24 h. Temperature was kept at 30 oC and stirring speed was
150 rpm. After 24-30 h stirring and aeration was shut down, so that beads were
settled. Preculture medium was pumped out of the reactor using the exhaust line.
Distilled water was added to wash the beads. After water was pumped out main
culture medium was added.
Preculture for the glucose pulse experiments was conducted in 500 ml flask
containing 100 ml medium containing minerals and 20 g l-1 glucose. Twenty ml
alginate beads were grown for 28 h at 30 oC and 175 rpm.
For fed-batch cultures 50 ml alginate immobilized R. oryzae was pre-cultured in
2000 ml shake flask containing 500 ml mineral salts medium containing 50 g l-1
glucose and 7.5 g l-1 CaCO3. Precultivation was carried out in flask shaker at 30 oC
and 175 rpm for about 40 h. Beads were filtered through a mesh of pore size about
1 mm, washed with water and added to fermenter.
2.5.3. Preparation of the Fermenter
Fermentations were conducted in 3 l fermenter with a working volume of 2 l
(Protem, Turkey). However, the culture volume of 1 l was used for this study. The
fermenter was equipped with temperature, pH and dissolved O2 controllers.
Throughout the continuous cultures, pH was kept at 5.5 by automatic addition of
4-5 N KOH by a peristaltic pump connected to the pH controller. pH probe was
23
calibrated to pH 7 and pH 4 with commercial calibration buffers before
sterilization of the fermenter. Cultures were aerated with 0.5-2 lpm air to keep
dissolved oxygen above 25%, mostly around 40-50% of air saturation. Dissolved
O2 probe was calibrated to 0% by N2 and to 100% by air before inoculation.
Fermenter was sterilized at 121 oC for 20-30 minutes.
2.5.4. Continuous Culture with Cell Retention
After the preculture was pumped out of the fermenter and beads were washed once
with water, 1 l mineral salts medium was added to the fermenter. Mineral salt
concentrations were half of the values given for the shake flask cultures.. Feed
medium composed of glucose at varying amounts and minerals was added for
approximately 55 h. Mineral concentration of the feed medium was adjusted, so
that carbon/nitrogen ration was 5 g g-1. For every 4 g of glucose, (g l-1) (NH4)2SO4
(2), KH2PO4 (0.65), MgSO4.7H2O (0.25), ZnSO4
.7H2O (0.05) was used. Feed
medium was pumped using a speed adjustable peristaltic pump. Feeding was
started at a low rate (around 0.6 ml min-1) and after about 6 h feeding rate was
increased to 2.24-3.05 ml/min. Culture volume was kept at 1 l by placing a exhaust
pipe at the upper level of the medium (1 l). Liquid exceeding this level was
pumped out by the exhaust pump running constantly (running faster than the feed
pump). A mesh was attached to the pipe mouth, so that alginate beads did not
leave the reactor in the exit stream. This set up was called continuous culture with
cell retention, since there was a constant feed into and out of the reactor but the
biomass stayed in the reactor. At the end of the fermentation, beads and free
mycelium were filtered through cheese cloth and washed several times with water
and dried at 100 oC overnight.
Average medium glucose concentration was estimated from the measured glucose
concentration throughout the experiment. The total lactate and ethanol produced
was calculated by calculating the areas under the lactate and ethanol curves in the
time vs. concentration graphs multiplied by the feeding rate. Results were used to
calculate the product yields. Product yield was defined as the total product (lactate
24
or ethanol) produced per total glucose consumed (g product g glucose-1). Biomass
yield was the difference of the biomass measured at the end and at the start of the
continuous culture per total glucose consumed. The amount of glucose consumed
was calculated by subtracting the unused glucose from the amount of glucose
added in the feed. Unused glucose was calculated similar to the total product
concentration.
2.5.5. Fed-batch Culture
Alginate beads were transferred to reactor containing one liter mineral solution.
Feed was composed of mineral solutions and 20 g l-1 glucose. Feeding started at a
rate of 3.4 ml h-1 and rate was increased to 17.1 ml h-1 in 72 h.
2.6. Analytical Methods
One to two ml of fermentation medium either from the shake flasks or the
fermenter were sampled and centrifuged at 12000 g for 5 min. Pellet was discarded
and the supernatants were kept at -18 oC until used. Samples were thawed at 4 oC,
diluted with HPLC eluent and analyzed for glucose, lactate, and ethanol by HPLC
(LKB, USA) using an organic acid analysis column, which using mainly ion –
exclusion mechanism (Phenomenex, Torrance, CA, USA), and a differential
refractometer (Schambeck RI2000, Bad Honnef, Germany) (See Appendix B for a
sample chromatogram). The column contained sulfonated styrene-divinylbenzene
spheresin 8% cross-link form as well as hydrogen ionic form. The column was
kept at 50-65 oC and was eluted with 5 mM H2SO4. The detector cell was kept at
35 oC. Glucose, lactate and ethanol standard solutions of known concentrations
were used for calibration. Signal from the detector was processed by
Chromasimple data acquisition software (Dizge Analitik, Turkey). Lactate was
also analyzed with a lactate analyzer (YSI 1500 Sport Lactate Analyzer, Yellow
Spring, USA). The immobilized L-lactate oxidase converted L-lactate to hydrogen
peroxide, which was oxidized at the platinum electrode producing electrons. The
resulting current was proportional to L-lactate. Glucose concentration of the
continuous culture was determined by an enzymatic glucose kit (Infinity TM,

25
Thermo, Victoria, Australia). Glucose oxidase in the reaction mixture converted
glucose to gluconic acid and produced hydrogen peroxide. Peroxide reacted with
4-hydrobenzoic acid and 4-aminoantipyrine in the presence of peroxidase forming
a quinoneimine dye. The intensity of the color formed was proportional to the
glucose concentration and measured at 500 nm.
At the end of the fermentations, mycelia were collected on a metal mash having a
pore size approximately 1 mm. Unused CaCO3 remaining on the mycelia from
shake flask cultures was dissolved by HCl. After washing several times with
distilled water, dry cell weight was determined by drying the mycelia overnight at
100 oC.
2.6.1. Extraction of Proteins
Free mycelia from shake flask cultures or alginate immobilized mycelia was
filtered and washed twice with distilled water and once with the extraction buffer
(100 mM phosphate buffer at pH 7, containing 1 mM EDTA, 1.4 mM β-
mercaptoethanol and 1 mM PMSF). Samples were dried between filter papers and
squeezed gently to form a thin layer of biomass. Samples were packed in
aluminum foil and were frozen in liquid nitrogen and kept at –80 oC until used.
Frozen cells were brought to powder form by Mikro-D95 dismembrator
(Sartorius). A thin biomass layer and a steel ball were put in PTFE container,
which were cooled in liquid nitrogen. This container was shaken for 30-60 seconds
at 2000 rpm. This procedure crushed the mycelia to a powder form, which was
then suspended in cold extraction buffer. Cell debris was removed by
centrifugation at 12500 g for 30 min at 4 oC. Supernatant (crude extract) was used
for enzyme assays.
2.6.2. Enzyme Assays
All enzyme activities were measured at 30 oC by monitoring the oxidation of
NADH or reduction of NAD+ at 340 nm in spectrophotometer (Shimadzu UV-

26
NADH NAD+
LDH
NAD+ NADH
ADH PDC
1202, Japan). Crude extract concentration in the assay mixture were adjusted to
ensure that change in absorbance followed first order kinetics at least for 4 min
and that change in absorbance was proportional to the amount of crude extract
added. One unit of enzyme activity was defined as the amount of enzyme required
to catalyze the oxidation of 1 µmole of NADH to NAD+ or reduction of 1 µmole
of NAD+ to NADH in 1 min under specified conditions. Extinction coefficient of
NADH was taken as 6.22 mM-1 cm-1. Assays were done in 1.4 ml special glass
cells (Hellma, Germany) having a light path of 1 cm and assay volume was 1.2 ml
for all assays. Activities were reported as specific activities, which were defined as
the unit of enzyme per mg of protein in the crude extract. Protein was determined
by Lowry method (42) with bovine serum albumin as the standard. Crude extracts
generally contained 1-2 mg protein ml-1.
2.6.2.1. Lactate Dehydrogenase Assay
LDH was assayed in 100 mM bis-Tris-propane buffer (pH 6.8) containing 0.175
mM NADH (68). Reaction was started by adding 4mM pyruvate.
When R. oryzae was grown at low glucose concentrations, Tris buffer (pH=7.5)
was used. Pyruvate and NADH concentrations were the same as above.
Pyruvate Lactate
2.6.2.2. Pyruvate Decarboxylase Assay
PDC was assayed in 100 mM MES buffer (pH 6.2) containing 0.175 mM NADH,
2mM MgCl2, 1mM TPP, 0.04 Units yeast ADH µl-1 (69). ADH was used as the
coupling enzyme. Reaction was started by adding 4 mM pyruvate. Interfering
LDH activity was inhibited by adding 25 mM oxamate.
Pyruvate Acetaldehyde Ethanol

27
ADH
NAD+ NADH
ADH
NAD+ NADH
2.6.2.3. Alcohol Dehydrogenase Assay
ADH assay was optimized in our laboratory and the reaction mixture contained
100 mM phosphate buffer (pH 6.3) 0.15 mM NADH. Reaction was started by
adding 5mM acetaldehyde. When R. oryzae was grown at low glucose
concentrations, ADH was assayed in the other direction, reduction of ethanol to
acetaldehyde, in glycine buffer (pH 9.0), containing 100 mM ethanol and 1 mM
NAD.
Acetaldehyde Ethanol
Ethanol Acetaldehyde

28
CHAPTER 3
3. RESULTS AND DISCUSSION
3.1. Shake Flask Cultures
3.1.1. Effect of Inoculum Size and Working Volume on Lactic Acid and
Ethanol Production and Morphology
Previous studies in our laboratory and the preliminary experiments of this study, as
well as the literature, showed that inoculum size had a drastic effect on the fungal
physiology and morphology. Our aim was to quantify the effect through
extracellular metabolites and examine the macro-morphology. Previous reports also
showed that lactate production by Rhizopus oryzae needs vigorous aeration of the
cultures. Therefore, we conducted fermentation runs with different inoculum
concentrations and working volumes in shake flasks.
Lactic acid and ethanol and biomass productions by R. oryzae were investigated in
250 ml shake flask cultures containing 25, 50 or 100 ml culture medium inoculated
with 1x10³, 1x10⁴, 1x10⁵ or 1x10⁶ spores ml-1. Cultures, which had 100 g l-1 initial
glucose concentration, were inoculated directly from spore suspension. The final
concentrations of lactic acid, ethanol, and biomass (dry cell weight) are shown in
Figure 3.1, Figure 3.2 and Figure 3.3, respectively. Fermentations were ended when
all glucose was utilized. Final volumes were recorded and metabolite concentrations
were corrected for the initial volumes.
29
0
20
40
60
80
100
100 50 25 100 50 25 100 50 25 100 50 25
working volume (ml)
lact
ate
(g/l)
__________1x103
__________1x104
__________1x105
__________1x106
spore concentration (spore/ml)
Figure 3.1. Effect of spore concentration and working volume on lactate production by R. oryzae. (So=100 g l-1)
30
0
10
20
30
40
50
100 50 25 100 50 25 100 50 25 100 50 25
working volume (ml)
etha
nol (
g/l)
__________1x103
__________1x104
__________1x105
__________1x106
spore concentration (spore/ml)
Figure 3.2. Effect of spore concentration and working volume on ethanol production by R. oryzae. (So=100 g l-1)

31
0
1
2
3
4
5
6
100 50 25 100 50 25 100 50 25 100 50 25
working volume (ml)
dry
cell
wei
ght (
g/l)
__________1x103
__________1x104
__________1x105
__________1x106
spore concentration (spore/ml)
Figure 3.3. Effect of spore concentration and working volume on biomass production by R. oryzae. (So=100 g l-1)
32
Figure 3.4. Effect of inoculum size on morphology in cultures with 100 ml working volumes. Photographs were taken at the end of the fermentations. Biomass was put in Petri plates to take the photographs.
a. 1x10³, b. 1x10⁴, c. 1x10⁵, d. 1x10⁶ spores ml-1
In the cultures having high inoculum (1x10⁵ and 1x10⁶ spores ml-1) fermentations
lasted about 48 h, while fermentation time of the cultures having low inoculum
sizes (1x10³ and 1x10⁴ spores ml-1) extended to 64 h. Generally, lactic acid levels
were decreased with increasing inoculum size, while ethanol and biomass levels
were increased. The increase in the working volume induced higher ethanol
production and lower lactic acid and biomass. Changing the working volume
influenced the cultures which had high inoculum size (1x10⁵, 1x10⁶), more
drastically. The highest lactic acid (78 g l-1) and lowest ethanol (8 g l-1) and biomass
(2.3 g l-1) levels were obtained with lowest inoculated spore concentration (1x10³
a b
c d

33
spores ml-1). At this inoculum size, working volume did not have an effect on the
metabolite concentrations, while biomass concentrations were higher in 25 and 50
ml cultures (2.8 and 2.7 g l-1, respectively). The lowest lactic acid (15.3 g l-1) and
highest ethanol (37.2 g l-1) production were obtained with 1x10⁶ spores ml-1
inoculum and 100 ml culture volume, which may have had the lowest dissolved O2
concentration. The maximum biomass concentration (4.9 g l-1) was obtained with
high inoculum (1x10⁶ spores ml-1) and low volume (25 ml). Highest lactate
productivity values were around 1.1-1.2 g l-1 h-1, which is obtained at low inoculum
size. Ethanol productivity was maximized by using high inoculum and high
working volume (0.77 g l-1 h-1). Mass balance showed that 84-100 % of the initial
glucose was accounted for biomass, lactate and ethanol (See Appendix C for sample
mass balance). The glucose that not accounted may have been used for production
of other trace metabolites.
High lactic acid concentration (72.8 g l-1) obtained in 100 ml culture having a spore
concentration of 1x10⁴ spores ml-1 was unexpected since this value was higher than
that of the lower culture volumes. At this inoculum level aeration did not have a
significant effect on the ethanol concentrations, which were comparable to that of
obtained by 1x10³ spores ml-1 inoculum.
Growth form varied from clumps to filamentous mycelia. In Figure 3.4 the
morphologies in the 100 ml cultures are shown. Inoculum concentrations of 1x10³
and 1x10⁴ spores ml-1 induced one big tightly packed clump composed of both the
mycelia and CaCO3 particles (Figure 3.4 a and b). This form left a clear medium
around it. In the cultures having higher inocula R. oryzae grew as filamentous
mycelia (Figure 3.4 c and d). In 50 ml cultures morphologies were similar to that of
100 ml cultures. In the flasks having 25 ml culture medium, however, the
morphologies were harder to define. Since the liquid levels in the flasks were low,
most of the culture skimmed over the walls. Therefore, biomass together with
CaCO3 adhered to the walls of the flask. In most of the cultures, these masses fell
into the medium and formed a ribbon like structure.

34
High lactate yield obtained at low inoculum sizes is comparable to other studies.
Lactic acid yields in previous reports ranged from 65 to 90 % (80). Although R.
oryzae is generally known to produce lactate, the results showed the potential of
this fungus for ethanol production. The ethanol yield was higher than the
Aspergillus and Rhizopus species screened by Skory et al. (71). Soccol et al. (75)
obtained similar ethanol yield with R. oryzae NRRL 393 by sealing the flasks to
supply O2 limited conditions. In this study, all fermentations were conducted under
aerobic conditions in cotton plugged shake flask. Therefore, decreasing the aeration
may have increased the ethanol concentration (Fig. 3.2).
The inoculated spore concentration and the working volume were shown to
influence the morphology and the lactate and ethanol productions in the shake flask
cultures of R. oryzae (Fig. 3.1, Fig. 3.2, and Fig. 3.4). Thus, inoculum size and
working volume (aeration) can be adjusted for desired applications, namely lactate
production, ethanol production or biomass related applications. For example, when
one intends to produce lactic acid, 1x10³ or 1x10⁴ spores ml-1 are the most suitable
inoculum sizes, while inoculum size of 1x10⁶ spores ml-1 and high working volume
should be used to produce ethanol. Inoculum size of 1x10⁶ spores ml-1 and low
working volume could yield high biomass concentration.
In this study higher lactate and lower ethanol levels were obtained by decreasing the
inoculated spore concentration, under which conditions R. oryzae grew as clumps
(85). This is contradictory to the results of Yin et al. (85) and Bai et al.(2). Both
groups generally obtained higher lactate and biomass levels as they increased the
inoculated spore concentration. Lactic acid concentration was maximized when the
R. oryzae grew as pellets of definite sizes, and congealed or flocculated mycelia
resulted in lower lactic acid yield. Pellets were obtained with inoculum size of
1x10⁶ spores ml-1 (2) or 2x10⁶ spores ml-1 (85). They concluded that mass (both
nutrient and oxygen) transfer was better in the pellets than in the big mycelial
masses. Therefore, we propose that the relation between the morphology and the
physiology of R. oryzae is complicated and should be studied in more detail.

35
Lactic acid production has been reported to increase with increasing aeration (80).
Aeration may have been changed in the flask cultures by changing the working
volume. Each aeration level was investigated at each inoculum size and the lactate,
ethanol and biomass levels were influenced differently at different inoculum sizes.
Increasing aeration yielded higher lactate and biomass and lower ethanol. The effect
of aeration was negligible at 1x10³ spore ml-1 inoculum size and become more
considerable as the inoculum size increased. Available O2 may have been sufficient
in 100 ml cultures in the low inoculum size cultures; therefore, increasing aeration
may have not increased the lactate production (Fig. 3.1). One hundred milliliters of
working volume in 250 ml flask is generally considered too much for an aerobic
organism. In this study, however, at low inoculum sizes working volume could be
increased as high as 100 ml without a decrease in lactate production. It should be
noted that the dissolved O2 levels were not measured and they should have been
different for each inoculum size and working volume.
3.1.2. Kinetics of High Lactate Producing Fermentation
In this part of the study, biomass concentration of the organism was followed
under the conditions yielding high lactate production, as well as the lactate and
ethanol levels. For this purpose several 250 ml flasks containing 50 ml medium
were inoculated at same time and for each time point one flask was sacrificed.
Initial glucose concentrations of the cultures were 100 g l-1. Metabolite levels and
dry cell weight were determined (Figure 3.5). Biomass concentration followed a
parallel trend with metabolites. Approximately 2.5 g l-1 biomass and 70 g l-1
lactate and 15 g l-1 ethanol were obtained at the end of the fermentation. Between
42 and 53 h of the fermentation, glucose consumption and lactate and ethanol
production was fastest. Glucose consumption rate was 4.4 g l-1 h-1, lactate and
ethanol production rates were 3.7 and 0.3 g l-1 h-1, respectively. Biomass
production rate was around 0.15 g l-1 h-1 in this period. Overall lactate production
rate was around 1 g l-1 h-1 and lactate yield (YSX) was 0.67, g g glucose-1. Under
these conditions, high lactate concentrations could be obtained. However, due to
the low amount of inoculum fast utilization of glucose started after 35 h of
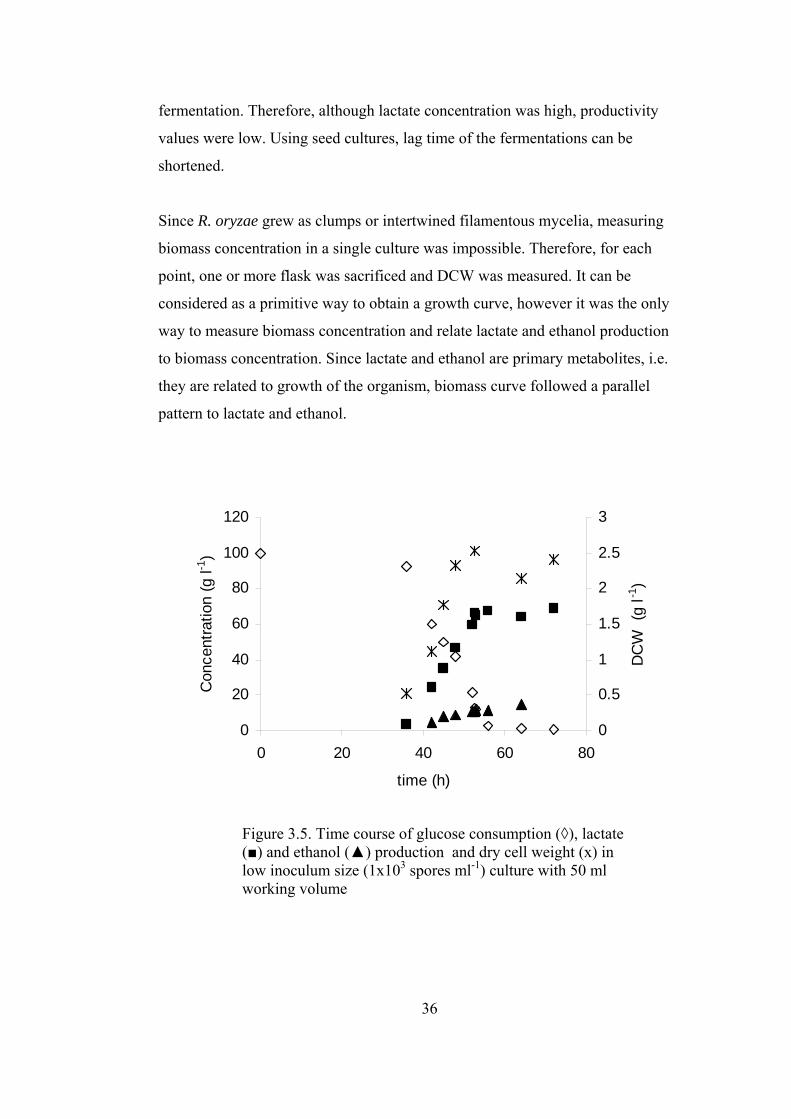
36
fermentation. Therefore, although lactate concentration was high, productivity
values were low. Using seed cultures, lag time of the fermentations can be
shortened.
Since R. oryzae grew as clumps or intertwined filamentous mycelia, measuring
biomass concentration in a single culture was impossible. Therefore, for each
point, one or more flask was sacrificed and DCW was measured. It can be
considered as a primitive way to obtain a growth curve, however it was the only
way to measure biomass concentration and relate lactate and ethanol production
to biomass concentration. Since lactate and ethanol are primary metabolites, i.e.
they are related to growth of the organism, biomass curve followed a parallel
pattern to lactate and ethanol.
0
20
40
60
80
100
120
0 20 40 60 80
time (h)
Con
cent
ratio
n (g
l-1)
0
0.5
1
1.5
2
2.5
3
DC
W (
g l-1
)
Figure 3.5. Time course of glucose consumption (◊), lactate (■) and ethanol (▲) production and dry cell weight (x) in low inoculum size (1x10³ spores ml-1) culture with 50 ml working volume.
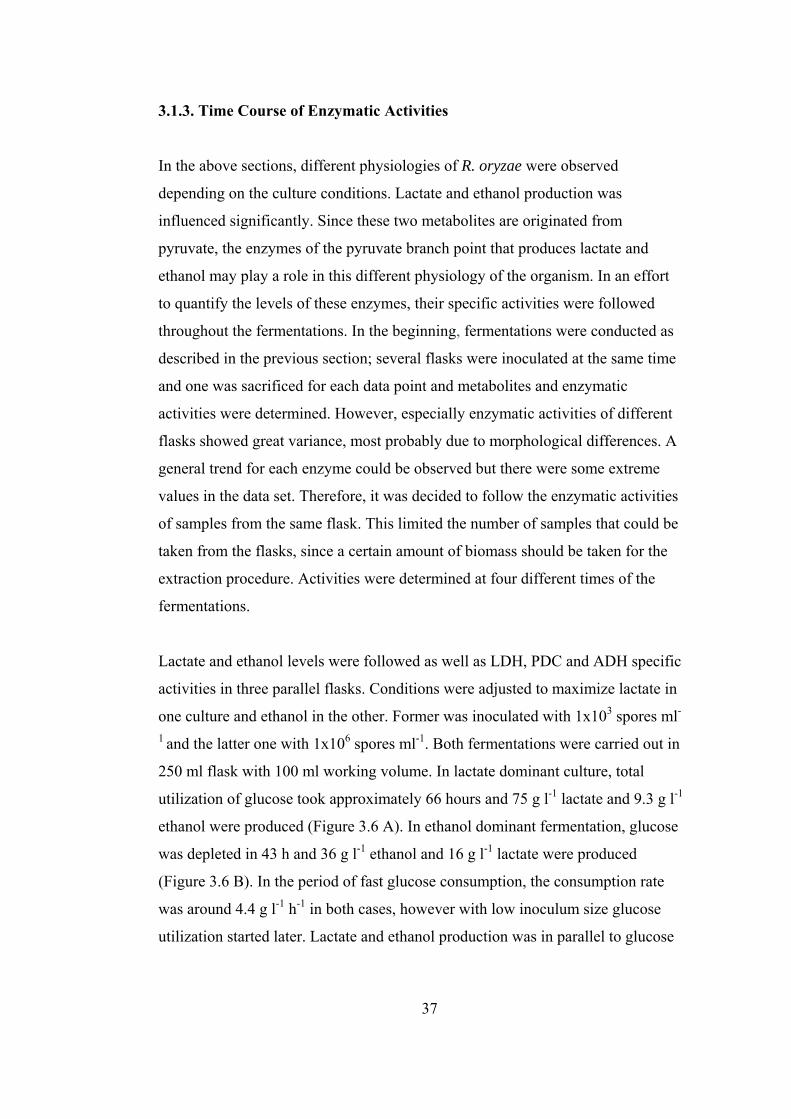
37
3.1.3. Time Course of Enzymatic Activities
In the above sections, different physiologies of R. oryzae were observed
depending on the culture conditions. Lactate and ethanol production was
influenced significantly. Since these two metabolites are originated from
pyruvate, the enzymes of the pyruvate branch point that produces lactate and
ethanol may play a role in this different physiology of the organism. In an effort
to quantify the levels of these enzymes, their specific activities were followed
throughout the fermentations. In the beginning, fermentations were conducted as
described in the previous section; several flasks were inoculated at the same time
and one was sacrificed for each data point and metabolites and enzymatic
activities were determined. However, especially enzymatic activities of different
flasks showed great variance, most probably due to morphological differences. A
general trend for each enzyme could be observed but there were some extreme
values in the data set. Therefore, it was decided to follow the enzymatic activities
of samples from the same flask. This limited the number of samples that could be
taken from the flasks, since a certain amount of biomass should be taken for the
extraction procedure. Activities were determined at four different times of the
fermentations.
Lactate and ethanol levels were followed as well as LDH, PDC and ADH specific
activities in three parallel flasks. Conditions were adjusted to maximize lactate in
one culture and ethanol in the other. Former was inoculated with 1x10³ spores ml-
1 and the latter one with 1x10⁶ spores ml-1. Both fermentations were carried out in
250 ml flask with 100 ml working volume. In lactate dominant culture, total
utilization of glucose took approximately 66 hours and 75 g l-1 lactate and 9.3 g l-1
ethanol were produced (Figure 3.6 A). In ethanol dominant fermentation, glucose
was depleted in 43 h and 36 g l-1 ethanol and 16 g l-1 lactate were produced
(Figure 3.6 B). In the period of fast glucose consumption, the consumption rate
was around 4.4 g l-1 h-1 in both cases, however with low inoculum size glucose
utilization started later. Lactate and ethanol production was in parallel to glucose

38
consumption, but their production rates were different and affected by the
conditions studied.
Enzyme activities generally increased with time and decreased as glucose was
depleted (Figure 3.7). Time course of three enzyme activities generally followed
the same pattern. In lactate dominant culture, maximum LDH activity was
approximately 8.5 times higher than in ethanol dominant one. PDC and ADH
specific activities were 1.5 and 1.8 times higher in ethanol dominant fermentation,
respectively. They were not influenced as much as LDH under the conditions
studied. The amount of LDH may have determined the fate of pyruvate to ethanol
or lactate. PDC is involved in supplying cytosolic acetyl-CoA, which is used for
the synthesis of lipids and some amino acids. Therefore, its high activity in lactate
dominant cultures may be explained by this role of the enzyme. A portion of the
acetaldehyde produced by the action of PDC can be oxidized to acetate by
acetaldehyde dehydrogenase. Acetate, in turn, can be converted to acetyl-CoA by
acetyl-CoA synthetase, by using ATP. However, activity of ADH in lactate
dominant cultures can not be explained by this, since it is not involved in
cytosolic production of acetyl-CoA.
Specific activities of the enzymes agreed well with the dominance of lactate or
ethanol, i.e. specific activity of LDH was high in high lactate yielding
fermentation, whereas PDC and ADH exhibited higher specific activities in high
ethanol yielding fermentation. Time course trends observed for R. oryzae LDH
activity were similar to previous results ((57; 68; 70)). Skory (69) observed
increased transcript of both pdcA and pdcB, and also increased enzymatic
activities and increased ethanol in anoxic R. oryzae cultures compared to aerobic
ones. ADH was also shown to exhibit higher activities in anaerobic R. oryzae
cultures (72). To our knowledge, this is the first study that compared the actions
of these three enzymes.
The enzyme activity data was used to estimate the flux through lactate and
ethanol producing pathways (See Appendix D for calculations). LDH was
39
assumed to obey Michealis-Menten kinetics (57), while PDC was shown to obey
the Hill equation (1). ADH was excluded from this calculation, since its in vitro
activity was much higher than PDC. In vivo rate of the lactate and ethanol
productions were estimated using the measured activities of the enzymes and Km
values taken from the literature. Rates were calculated for a range of intracellular
pyruvate concentrations using Michaelis-Menten and Hill kinetic expression. The
rates calculated were compared to the experimental data. In lactate producing
batch culture measured rates of lactate and ethanol were obtained at pyruvate
concentrations of 0.16 and 0.67 mM, respectively. In ethanol producing batch
culture, measured rates were obtained at 0.26 and 0.88 mM pyruvate for lactate
and ethanol production rates, respectively. In the literature, different intracellular
concentrations of pyruvate were reported (0.04 mM for Aspergillus niger (64),
2.2-4.9 mM for Monascus rubber (21), 7-10 mM (18; 20), 1.85 mM (81) for S.
cerevisiae). The pyruvate concentrations estimated using the Michaelis-Menten
and the Hill equations were in the reasonable range for an organism. In both of the
cases, measured fluxes of lactate and ethanol could be described by different
pyruvate concentrations. Pyruvate needed was lower for the flux through lactate
than flux through ethanol. Reason for that could be the insufficiency of in vitro
determination of the enzyme activities to describe the in vivo activity. The
measured activities may have either overestimated or underestimated the in vivo
activity. The Michaelis-Menten and the Hill type kinetics may have not been
sufficient to describe the rate of the reactions. In addition to these, several
assumptions were made in calculations, which could cause deviations from the
actual values.
In another approach, kinetic parameters, Km and Vmax, were calculated using the
measured rates of the lactate and ethanol productions (See Appendix D for
equations). In order to calculate Km values, measured enzyme activities were used
as the Vmax. On the other hand, to estimate Vmax values, Km values from the
literature were used. For example, assuming an intracellular pyruvate
concentration of 1 mM, Km value of LDH of 3.81 mM and of PDC 9.43 mM
would yield the observed rate of lactate and ethanol productions in lactate

40
producing culture. Using the Km values reported in the literature required
maximum activity of LDH and PDC were calculated as 0.80 and 0.65 U mg
protein-1, respectively. Similarly, in ethanol producing culture, at a pyruvate
concentration of 1mM, Km values of 2.29 and 5.47 mM of LDH and PDC,
respectively, were approximated. Required maximum activity values would be
0.15 and 1.45 U mg protein-1 for LDH and PDC, respectively. Calculated values
for Km of LDH for pyruvate was 5-7 fold higher than the literature value, while
Km of PDC was not higher more than 2 fold. At a pyruvate concentration of 2 mM
Km values calculated for both enzymes in both cases were very high, indicating
that intracellular pyruvate concentration should be below 2mM. Required LDH
activity at a pyruvate concentration of 1 mM was lower than the experimental
activity for both lactate and ethanol producing cultures. Calculated activities of
the PDC were not as different from the experimental activity as of LDH. This
could indicate that PDC assay was more reliable than LDH assay. PDC may have
interfered in the LDH activity measurement. However, for a more reliable
discussion of the results obtained by kinetic analysis, the concentration of the
intracellular metabolites, i.e. pyruvate in this case, should be known.

41
0
20
40
60
80
100
0 10 20 30 40 50 60
time (h)
Com
cent
ratio
n (g
l-1)
0
20
40
60
80
100
0 10 20 30 40 50 60
time (h)
Con
cent
ratio
n (g
l-1)
Figure 3.6. Glucose consumption (♦) and lactate (□) and ethanol (●) productions in cultures inoculated with A: 1x10³ spores ml-1, B: 1x10⁶ spores ml-1. Error bars indicate standard deviations. (Culture volume=100 ml, So=100 g l-1)
A
B

42
0
1
2
3
4
0 10 20 30 40 50 60
time (h)
spec
ific
activ
ity
(U m
g pr
otei
n-1)
0
0.5
1
1.5
2
2.5
0 10 20 30 40 50 60
time (h)
spec
ific
activ
ity(U
mg
prot
ein-1
)
0
10
20
30
40
50
60
0 10 20 30 40 50 60
time (h)
Spe
cific
act
ivity
(U m
g pr
otei
n-1)
Figure 3.7. Comparison of specific activities of lactate dehydrogenase (LDH), pyruvate decarboxylase (PDC) and alcohol dehydrogenase (ADH) in cultures inoculated with 1x10³ (□) or 1x10⁶ (■) spores ml-1. Error bars indicate standard deviations. (Culture volume=100 ml, So=100 g l-1
)
LDH
PDC
ADH
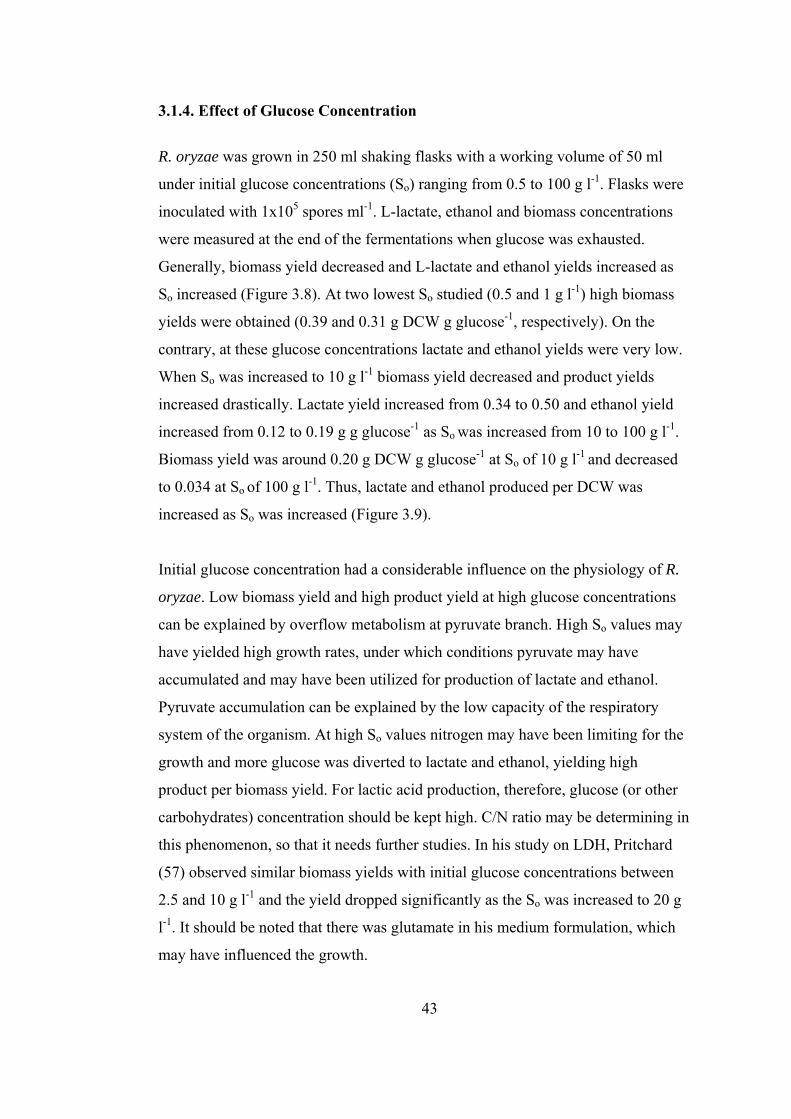
43
3.1.4. Effect of Glucose Concentration
R. oryzae was grown in 250 ml shaking flasks with a working volume of 50 ml
under initial glucose concentrations (So) ranging from 0.5 to 100 g l-1. Flasks were
inoculated with 1x10⁵ spores ml-1. L-lactate, ethanol and biomass concentrations
were measured at the end of the fermentations when glucose was exhausted.
Generally, biomass yield decreased and L-lactate and ethanol yields increased as
So increased (Figure 3.8). At two lowest So studied (0.5 and 1 g l-1) high biomass
yields were obtained (0.39 and 0.31 g DCW g glucose-1, respectively). On the
contrary, at these glucose concentrations lactate and ethanol yields were very low.
When So was increased to 10 g l-1 biomass yield decreased and product yields
increased drastically. Lactate yield increased from 0.34 to 0.50 and ethanol yield
increased from 0.12 to 0.19 g g glucose-1 as So was increased from 10 to 100 g l-1.
Biomass yield was around 0.20 g DCW g glucose-1 at So of 10 g l-1 and decreased
to 0.034 at So of 100 g l-1. Thus, lactate and ethanol produced per DCW was
increased as So was increased (Figure 3.9).
Initial glucose concentration had a considerable influence on the physiology of R.
oryzae. Low biomass yield and high product yield at high glucose concentrations
can be explained by overflow metabolism at pyruvate branch. High So values may
have yielded high growth rates, under which conditions pyruvate may have
accumulated and may have been utilized for production of lactate and ethanol.
Pyruvate accumulation can be explained by the low capacity of the respiratory
system of the organism. At high So values nitrogen may have been limiting for the
growth and more glucose was diverted to lactate and ethanol, yielding high
product per biomass yield. For lactic acid production, therefore, glucose (or other
carbohydrates) concentration should be kept high. C/N ratio may be determining in
this phenomenon, so that it needs further studies. In his study on LDH, Pritchard
(57) observed similar biomass yields with initial glucose concentrations between
2.5 and 10 g l-1 and the yield dropped significantly as the So was increased to 20 g
l-1. It should be noted that there was glutamate in his medium formulation, which
may have influenced the growth.

44
0
0.1
0.2
0.3
0.4
0.5
0.6
0.7
0 20 40 60 80 100
initial glucose concentration (g l-1)
yiel
d (g
g g
luco
se-1
)
.
0
2
4
6
8
10
12
14
16
0 20 40 60 80 100
initial glucose concentration (g l-1)
Yie
ld (g
g d
ry c
ell w
eigh
t-1)
.
.
Figure 3.8. Effect of initial glucose concentration on lactate (■), ethanol (▲) and biomass yields (○). (g product per g glucose consumed). Error bars indicate standard deviations (Inoculum size=1x10⁵ spores ml-1, culture volume=50 ml, So=100 g l-1
Figure 3.9. Effect of initial glucose concentration on yield values (g product per g DCW). lactate yield on biomass (■), ethanol yield on biomass (▲).(Inoculum size=1x10⁵ spores ml-1, culture volume=50 ml, So=100 g l-1

45
Physiology of R. oryzae at low glucose concentration was further investigated
by intermittent addition of small portions of glucose, so that glucose was kept
below certain concentrations. Glucose was kept below 0.40 l-1 in one culture
and 0.72 g l-1 in the other. When CG dropped below about 0.1 g l-1, glucose was
added to attain a CG of either concentration (Figure 3.10). In 12 h. total of 2.90
and 5.63 g glucose was added to former and latter cultures, respectively. Lactate
and biomass concentrations and yield values are shown in Table 3.1. Lactate
yields were lower than biomass yields as expected, however, YSL values were
higher and YSX values were below those were obtained in the experiments
mentioned above in this section.
Table 3.1. Lactic acid and biomass yields of R. oryzae grown on low concentrations of glucose in shake flasks
Glucose concentration, CG
(g l-1)
Glucose utilized (g l-1)
Lactic Acid, CL
(g l-1)
Lactate Yield, YSL
(g g-1)
Dry Weight, CX
(g l-1)
Biomass Yield, YSX
(g g-1) Glu ≤ 0.40 2.90 0.44 0.151 0.878 0.26
Glu ≤ 0.72 5.63 1.06 0.190 1.932 0.31

46
0
0.1
0.2
0.3
0.4
0.5
0 5 10 15 20 25 30
time (h)
gluc
ose
(g l-1
)
0
0.2
0.4
0.6
0.8
0 5 10 15 20 25 30
time (h)
gluc
ose
(g l-1
)
Figure 3.10. Change in glucose concentration. (Inoculum size=1x10⁵ spores ml-1, culture volume=50 ml
A
B

47
3.2. Fermenter Cultures with Immobilized Cells
In order to elucidate the effect of glucose concentration on physiology, experiments
under controlled conditions were needed. In bioreactor, pH and dissolved O2
concentration could be measured and controlled as well as temperature and
agitation. Apart from those, bioreactor allowed us to carry out continuous culture
(See Material ands Methods). Having adhered the inside elements (including the
probes) of the reactors, R. oryzae was hard to cultivate as free mycelium (Figure
3.11). Therefore, we immobilized the spores in alginate beads.
Figure 3.11 Pictures of R. oryzae in bioreactor. Left: Alginate immobilized mycelia, Right: Free mycelia attached on the impeller, probes and sparger.
3.2.1. Continuous Cultures with Cell Retention
Alginate immobilized R. oryzae was cultured continuously by feeding glucose at
varying concentrations (2.5-20 g l-1). The organism was first grown in batch mode

48
in Trypton-Mineral Salts (TM) medium in the reactor. In the beginning, batch
culture was carried out in the medium as proposed by Skory (69). In that study, the
medium containing glycerol and trypton was shown not to support synthesis of
lactate and ethanol. However, in this study, in the same medium R. oryzae did not
use glycerol in two days (Results not shown). Therefore, glycerol was excluded
and grew the fungus in a medium containing only trypton and minerals. Using
such a medium provided substantial amount of fungal biomass, in which PDC and
LDH showed little or no activity (data not shown). After 24 h, this medium was
pumped out and beads were washed once with distilled water. Fresh mineral
medium containing no glucose was added and glucose feed started. In each
culture, single feed glucose concentration (CG, feed) was used. Different CG, feed
yielded different reactor glucose concentrations (CG, reactor), which allowed us to
investigate the effect of glucose concentration on physiology of the organism.
Feeding rate was adjusted between 2.5-3.0 ml min-1, so that at least four volume
changes were guarantied in two days. Fermentation kinetics of the cultures are
shown in Figure 3.11. 1-5.
In Table 3.2 total amount of glucose fed to the reactor and total amount of lactate
and ethanol drawn out from the reactor in the effluent stream are shown. Lactate
and ethanol levels of the cultures were frequently measured throughout the
cultures. Total amounts of the metabolites produced throughout the continuous
culture were calculated by integrating the concentration curves. Yield values were
calculated by dividing the total amount of lactate, ethanol and biomass produced,
by the total amount of glucose utilized. Amount of glucose utilized was the
difference between the amounts of glucose fed to the reactor and unused glucose
drawn out in the effluent stream.
As (CG, feed) was increased, CG, reactor and lactate yield (YSL) increased and biomass
yield (YSX) decreased. Ethanol yield (YSE) was first increased, but then decreased
upon further increase in CG, feed. Comparing the lactate and ethanol yields, one can
see that ethanol was predominant at low glucose concentrations (Table 3.2). At
higher concentrations lactate yield was higher than ethanol yield. Lactate yield

49
showed a sharp increase as glucose concentration increased to 0.2-0.3 g l-1. Further
increase to 0.5-0.6 g l-1 supported higher lactate yield than ethanol yield. At
CG,reactor of 0.03-0.05 g l-1, lactate yield was very low, but ethanol yield was
considerably high. Biomass yield was influence by the glucose concentration
inversely. As glucose concentration was increased more glucose is fermented to
lactate and ethanol, and consequently less is used for the growth. Higher biomass
yields were observed at lower CG, reactor, however, values were much below than
the expected maximum yield (around 0.5 g g glucose-1 for S. cerevisiae). The
biomass concentration was estimated by the difference between the weight of the
beads before and after the cultures. Portion of the Ca-alginate forming the beads
may have dissolved in the fermentation media. Therefore, biomass concentration
determined could be a little bit less than the actual value.
Carbon balance was determined for the cultures. Carbon accounted by lactate,
ethanol and biomass were about 0.7-0.8 of the carbon added to the culture as
glucose. This may have been due to the other metabolites produced by R. oryzae,
such as glycerol and fumaric acid. Some carbon could have been lost due to
evaporation of ethanol in the off gas.
The distribution of pyruvate among the fermentative and respiratory pathways was
different at different glucose availability. Kinetics and the levels of the pyruvate
branch point enzymes may have played role as was shown in the shake flask
cultures. Specific activity measurements of LDH, PDC and ADH showed that
these three enzymes were influenced by the medium glucose concentration (Table
3.3). Generally, LDH and PDC increased as CG, reactor was increased. LDH activity
was generally low and a marked increase only could be seen as lactate yield
became dominant at higher glucose concentrations. PDC activity was not
influenced as LDH. Ten fold increase in CG, reactor, from 0.03-0.05 to 0.4-0.6 g l-1
increased LDH activity 7-8 fold, while PDC activity increased only 2.5 fold. PDC
showed a substantial activity at different glucose availability. A similar situation
was shown in S. cerevisiae, whose PDC was present at high levels at all dilution
rates in aerobic glucose limited chemostat culture (55). ADH activity showed a

50
slight increase as CG, reactor was increased from 0.03-0.05 to 0.2-0.3 g l-1, but
remained at the same level as CG, reactor was increased to 0.5-0.6 g l-1.
Enzymatic activities were measured both in the first and the second day, in order
to check for a possible pseudo steady state in the continuous cultures. Generally,
the values were not different more than 16%, except the LDH activities observed
at low glucose concentrations. At those cultures LDH activities were so low that
they could be hardly measured. LDH and PDC activities were measured at similar
pyruvate and NADH concentrations. Therefore, activity of the one of the enzymes
may interfere with the assay of the other. Since PDC was more active, it may have
interfered with the LDH assay. One solution to this problem is the incorporation of
pyrazole, an ADH inhibitor, to LDH assay. However, this did not work, most
probably due to high activity of ADH in R. oryzae. Another approach was to
repeat the LDH assays by adding a LDH inhibitor, oxamate. In some of the
samples, oxamate did not inhibit the activity completely, which was an evidence
for the interference of PDC to LDH assays. Consequently, LDH activities reported
in Table 3.3 could be more than the actual activities.
Dominance of ethanol production at low glucose levels can not be explained by the
kinetics of the LDH and PDC enzymes of R. oryzae. Affinity of LDH for pyruvate
is an order of magnitude lower than the affinity of PDC. If kinetics of the enzyme
had determined the flux, lactate would have been produced at low glucose
concentrations and ethanol production would have started or become dominant at
higher glucose levels. Rather, levels (activities) of the enzymes may have
determined the fate of the pyruvate. At low glucose concentrations LDH level was
low and PDC was considerably high, therefore ethanol was produced more than
lactate. When substantial LDH activity was observed, lactate production was high.
It was expected to minimize the production of fermentation end products (lactate
and ethanol) and maximize the biomass production by keeping the concentration
of the carbon source (glucose) low in the culture medium. Respiratory
dissimilation of pyruvate may have been obtained under aerobic conditions at low
glucose feeding rates. Reactor glucose concentration (CG, reactor) was kept as low as

51
possible in order to avoid glucose repression on the respiratory enzymes and an
overflow at the pyruvate level. All pyruvate was expected to be channeled to
respiratory system and no pyruvate would be available for LDH and PDC.
However, even at low concentrations of glucose (0.03-0.05 g l-1) lactate and
ethanol was observed. Ethanol production was unexpectedly high (0.17 g g
glucose-1) and was not influenced considerably as CG, reactor changed. Lactate yield,
on the other hand, was very low at low CG, reactor, however it was influenced greatly
by glucose concentration. LDH and PDC specific activities showed similar trends
with lactate and ethanol yields, respectively. LDH needed high glucose
concentrations for high activity, which was reflected in lactate yields. Pritchard
(57) showed that LDH activity was very low in batch R. oryzae cultures with 2.5-5
g l-1 initial glucose concentration. Increasing the glucose concentration to 10 and
20 g l-1 increased the LDH activity 4 and 9 folds, respectively. Our findings
supported his findings, i.e. high level of glucose was needed for high LDH
activity, hence lactic acid production.
As discussed at the beginning of the section, R. oryzae is difficult to cultivate in
the bioreactor, since it attaches the inner elements of the reactor, which hinders the
control of the process. Mycelia often clog the sparger, so that aeration is blocked.
Even in well aerated cultures, the O2 transfer, as well as other nutrients transfer,
may be limited into the big mycelial mass formed around the elements of the
reactor. Entrapment of the fungus inside Ca-alginate beads prevented these. Beads
formed by the immobilization procedure described in Materials and Methods
section had a diameter of 2.0-2.3 mm. Beads enlarge as the mycelium grows in
them. Some free mycelia attached to impeller were observed. There were transport
limitations for oxygen and nutrients to inner parts of the beads. That could be the
reason for the ethanol production (recall that anaerobic conditions increase ethanol
production).

52
0
0.005
0.01
0.015
0.02
0 20 40 60
time (h)
Con
cent
ratio
n (g
l-1)
0
0.1
0.2
0.3
0.4
0.5
0.6
0 20 40 60
time (h)
Con
cent
ratio
n (g
l-1)
Continued in next page
See page 54 for the legend
1 CG, feed: 1 g l-1
2 CG, feed: 2.5 g l-1

53
0
0.5
1
1.5
2
2.5
3
0 20 40 60
time (h)
Con
cent
ratio
n (g
l-1)
012345678
0 20 40 60
time (h)
Con
cent
ratio
n (g
l-1)
Continued in next page
See page 54 for the legend
3 CG, feed: 10 g l-1
4 CG, feed: 20 g l-1

54
0123456789
0 20 40 60
time (h)
Con
cent
ratio
n (g
l-1)
1
Figure 3.12. Fermentation kinetics in continuous cultures with cell retention, run number 1-5, which had different feed glucose concentrations. Feeding start time is designated as time 0. glucose (◊),lactate (■),ethanol (▲).
5 CG, feed: 20 g l-1
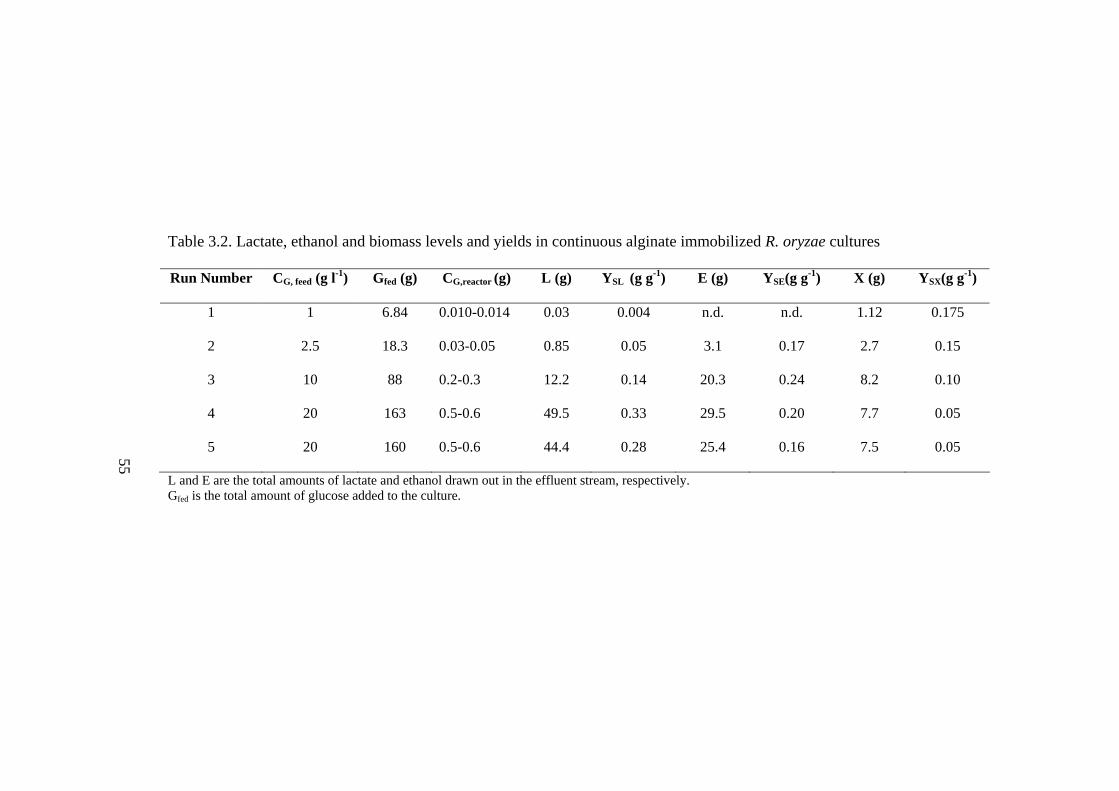
Table 3.2. Lactate, ethanol and biomass levels and yields in continuous alginate immobilized R. oryzae cultures.
Run Number CG, feed (g l-1) Gfed (g) CG,reactor (g) L (g) YSL (g g-1) E (g) YSE(g g-1) X (g) YSX(g g-1)
1 1 6.84 0.010-0.014 0.03 0.004 n.d. n.d. 1.12 0.175
2 2.5 18.3 0.03-0.05 0.85 0.05 3.1 0.17 2.7 0.15
3 10 88 0.2-0.3 12.2 0.14 20.3 0.24 8.2 0.10
4 20 163 0.5-0.6 49.5 0.33 29.5 0.20 7.7 0.05
5 20 160 0.5-0.6 44.4 0.28 25.4 0.16 7.5 0.05
L and E are the total amounts of lactate and ethanol drawn out in the effluent stream, respectively. Gfed is the total amount of glucose added to the culture.
55
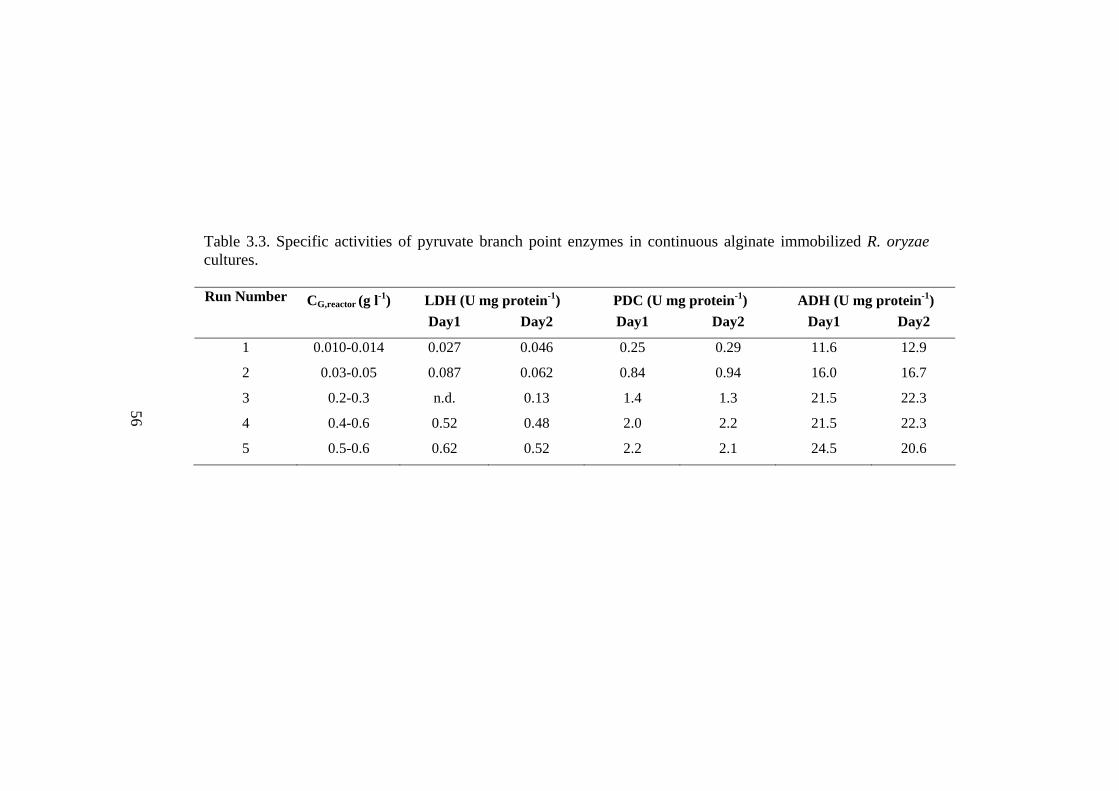
Table 3.3. Specific activities of pyruvate branch point enzymes in continuous alginate immobilized R. oryzae cultures.
Run Number CG,reactor (g l-1) LDH (U mg protein-1) PDC (U mg protein-1) ADH (U mg protein-1)
Day1 Day2 Day1 Day2 Day1 Day2
1 0.010-0.014 0.027 0.046 0.25 0.29 11.6 12.9
2 0.03-0.05 0.087 0.062 0.84 0.94 16.0 16.7
3 0.2-0.3 n.d. 0.13 1.4 1.3 21.5 22.3
4 0.4-0.6 0.52 0.48 2.0 2.2 21.5 22.3
5 0.5-0.6 0.62 0.52 2.2 2.1 24.5 20.6
56
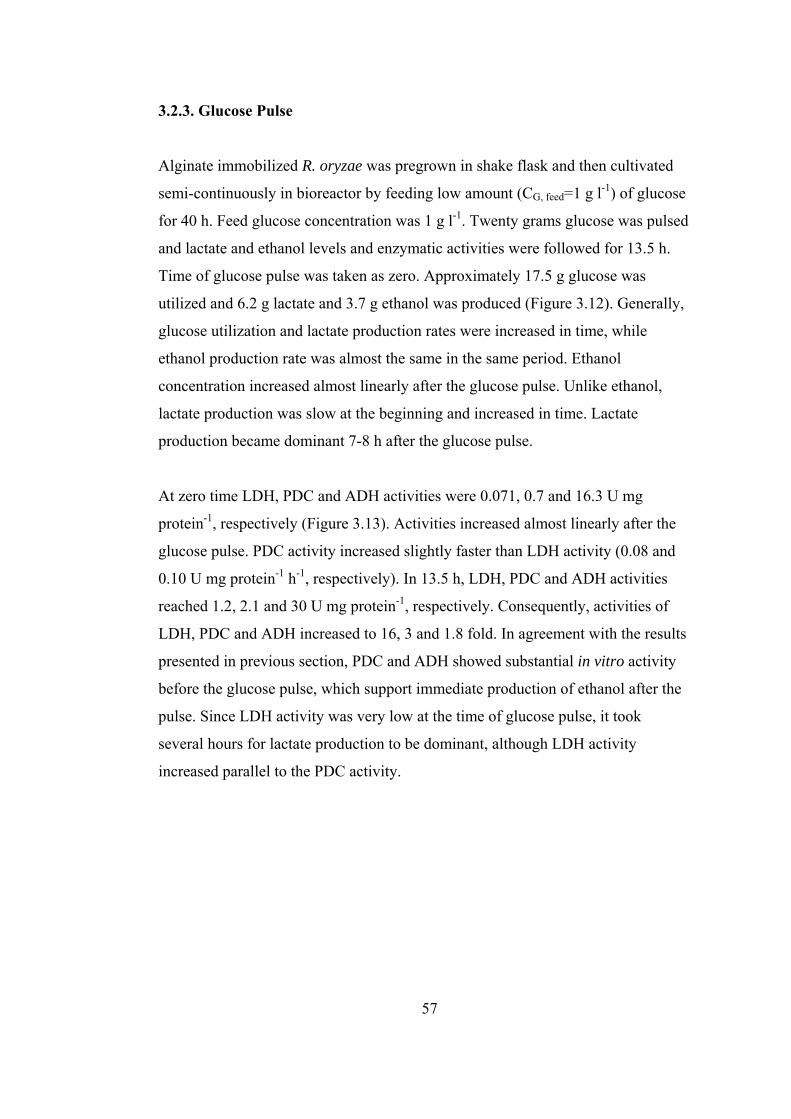
57
3.2.3. Glucose Pulse
Alginate immobilized R. oryzae was pregrown in shake flask and then cultivated
semi-continuously in bioreactor by feeding low amount (CG, feed=1 g l-1) of glucose
for 40 h. Feed glucose concentration was 1 g l-1. Twenty grams glucose was pulsed
and lactate and ethanol levels and enzymatic activities were followed for 13.5 h.
Time of glucose pulse was taken as zero. Approximately 17.5 g glucose was
utilized and 6.2 g lactate and 3.7 g ethanol was produced (Figure 3.12). Generally,
glucose utilization and lactate production rates were increased in time, while
ethanol production rate was almost the same in the same period. Ethanol
concentration increased almost linearly after the glucose pulse. Unlike ethanol,
lactate production was slow at the beginning and increased in time. Lactate
production became dominant 7-8 h after the glucose pulse.
At zero time LDH, PDC and ADH activities were 0.071, 0.7 and 16.3 U mg
protein-1, respectively (Figure 3.13). Activities increased almost linearly after the
glucose pulse. PDC activity increased slightly faster than LDH activity (0.08 and
0.10 U mg protein-1 h-1, respectively). In 13.5 h, LDH, PDC and ADH activities
reached 1.2, 2.1 and 30 U mg protein-1, respectively. Consequently, activities of
LDH, PDC and ADH increased to 16, 3 and 1.8 fold. In agreement with the results
presented in previous section, PDC and ADH showed substantial in vitro activity
before the glucose pulse, which support immediate production of ethanol after the
pulse. Since LDH activity was very low at the time of glucose pulse, it took
several hours for lactate production to be dominant, although LDH activity
increased parallel to the PDC activity.
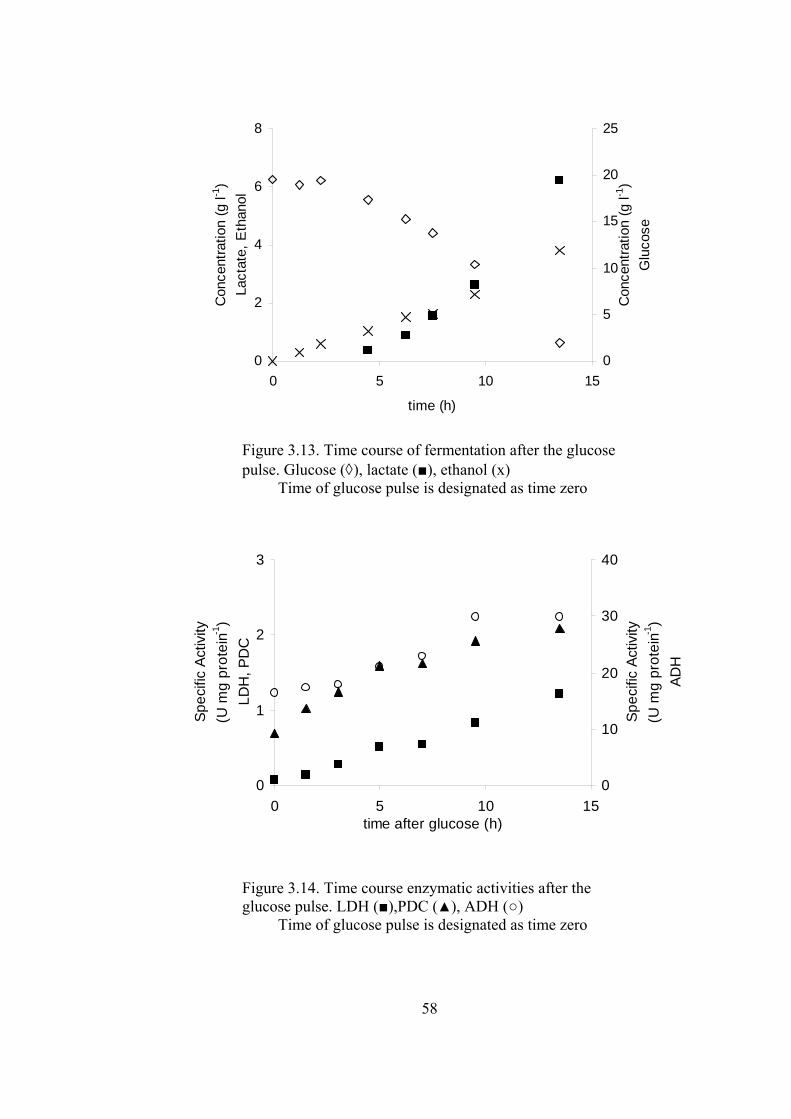
58
0
2
4
6
8
0 5 10 15
time (h)
Con
cent
ratio
n (g
l-1)
Lact
ate,
Eth
anol
0
5
10
15
20
25
Con
cent
ratio
n (g
l-1)
Glu
cose
Figure 3.13. Time course of fermentation after the glucose pulse. Glucose (◊), lactate (■), ethanol (x)
Time of glucose pulse is designated as time zero
0
1
2
3
0 5 10 15time after glucose (h)
Spec
ific
Activ
ity
(U m
g pr
otei
n-1)
LDH
, PD
C
0
10
20
30
40
Spec
ific
Activ
ity(U
mg
prot
ein-1
)AD
H
Figure 3.14. Time course enzymatic activities after the glucose pulse. LDH (■),PDC (▲), ADH (○)
Time of glucose pulse is designated as time zero

59
3.2.4. Fed-batch Culture
In an effort to minimize the glucose concentration in order to maximize biomass
yield, R. oryzae was cultivated in fed-batch mode. Alginate immobilized cells
were pre-grown in shake flask and transferred to bioreactor to start glucose
feeding. Feed contained 20 g l-1 glucose and mineral salts at 1X concentration.
Feeding rate was 3.4 ml h-1 at time zero and increased to 17.1 ml h-1 linearly in 72
h. Total of 740 ml feed, which contained 14.8 g glucose was added. Dry cell
weight increased from 0.76 to 4.52 g, so that YSX was calculated as 0.25 g DCW
per g glucose utilized. Glucose was not detected and lactate and ethanol
concentrations were very low. After 72 h only 1 g ethanol and less than 0.1 g
lactate was measured. Thus, ethanol yield was 0.07 and lactate yield was 0.007 g g
glucose -1.
Lactate and ethanol yields could be kept quite low and biomass yield was high;
however biomass yield, like in the other experiments in this dissertation, was
lower than expected. In glucose limited aerobic cultivation S. cerevisiae YSX of 0.5
can be achieved in aerobic glucose limited chemostat cultures.
60
CHAPTER 4
4. CONCLUSION
Rhizopus oryzae ATCC 9363 has two fermentative pathways, lactic acid and
ethanol producing pathways, both of which utilize pyruvate. This work gave us
some clues about the regulation of the pyruvate branch point. Flux through the
fermentative pathways was shown to be influenced by environmental conditions.
PDC, being active at all external glucose concentration, should be the first target
for knock-out studies in an effort to increase lactate yield. On the other hand,
considerable ethanol production and ability to ferment starch make this fungus a
potential organism for bioethanol production. LDH levels were influenced by the
environmental conditions greatly. Therefore, overexpression of ldh gene(s) may
increase lactate production. Clumped growth form was always avoided in lactate
fermentation by R. oryzae due to the mass transfer difficulty. However, in this
study comparable lactate yield could be obtained with clumped morphology. This
shows that morphology of this fungus and its effect on physiology needs more in
depth studies.

61
REFERENCES
1 Acar, S., Yucel, M. and Hamamci, H. (2007). "Purification and characterisation of two isozymes of pyruvate decarboxylase from Rhizopus oryzae." Enzyme and Microbial Technology 40(4): 675-682.
2 Bai, D. M., Jia, M. Z., Zhao, X. M., Ban, R., Shen, F., Li, X. G. and Xu, S.
M. (2003). "L(+)-lactic acid production by pellet-form Rhizopus oryzae R1021 in a stirred tank fermenter." Chemical Engineering Science 58(3-6): 785-791.
3 Bai, D. M., Li, S. Z. and Lin, F. Q. (2004). "Production of ammonium
lactate by fed-batch fermentation of Rhizopus oryzae from corncob hydrolysate." Chemical Research in Chinese Universities 20(4): 403-406.
4 Bakir, U., Yavascaoglu, S., Guvenc, F. and Ersayin, A. (2001). "An endo-
beta-1,4-xylanase from Rhizopus oryzae: production, partial purification and biochemical characterization." Enzyme and Microbial Technology 29(6-7): 328-334.
5 Byrne, G. S. and Ward, O. P. (1989). "Effect of nutrition on pellet
formation by Rhizopus arrhizus." Biotechnology and Bioengineering 33(7): 912-914.
6 Byrne, G. S. and Ward, O. P. (1989). "Growth of Rhizopus arrhizus in
Fermentation Media." Journal of Industrial Microbiology 4(2): 155-161. 7 Ciriacy, M. (1997). Alcohol dehydrogenases. in Yeast Sugar Metabolism.
K. D. Entian Lancester, PA., Technomic Publishing Co.: 213-224. 8 Crabtree, H. G. (1929). "Observations on the carbohydrate metabolism of
tumours." Biochemical Journal 23: 536-545. 9 Datta, R. and Henry, M. (2006). "Lactic acid: recent advances in products,
processes and technologies - a review." Journal of Chemical Technology and Biotechnology 81(7): 1119-1129.
10 Datta, R., Tsai, S. P., Bonsignore, P., Moon, S. H. and Frank, J. R. (1995).
"Technological and economic potential of poly(lactic acid) and lactic acid derivatives." Fems Microbiology Reviews 16(2-3): 221-231.

62
11 Dedeken, R. H. (1966). "Crabtree effect - a regulatory system in yeast." Journal of General Microbiology 44(2): 149-&.
12 Dong, X. Y., Bai, S. and Sun, Y. (1996). "Production of L(+)-lactic acid
with Rhizopus oryzae immobilized in polyurethane foam cubes." Biotechnology Letters 18(2): 225-228.
13 Drewke, C., Thielen, J. and Ciriacy, M. (1990). "Ethanol formation in adho
mutants reveals the existence of a novel acetaldehyde reducing activity in Saccharomyces cerevisiae." Journal of Bacteriology 172(7): 3909-3917.
14 Efremenko, E. N., Spiricheva, O. V., Veremeenko, D. V., Baibak, A. V.
and Lozinsky, V. I. (2006). "L(+)-lactic acid production using poly(vinyl alcohol)-cryogel-entrapped Rhizopus oryzae fungal cells." Journal of Chemical Technology and Biotechnology 81(4): 519-522.
15 Flikweert, M. T., VanderZanden, L., Janssen, W., Steensma, H. Y.,
VanDijken, J. P. and Pronk, J. T. (1996). "Pyruvate decarboxylase: An indispensable enzyme for growth of Saccharomyces cerevisiae on glucose." Yeast 12(3): 247-257.
16 Ganguly, R., Dwivedi, P. and Singh, R. P. (2007). "Production of lactic
acid with loofa sponge immobilized Rhizopus oryzae RBU2-10." Bioresource Technology 98(6): 1246-1251.
17 Gibbs, P. A., Seviour, R. J. and Schmid, F. (2000). "Growth of filamentous
fungi in submerged culture: Problems and possible solutions." Critical Reviews in Biotechnology 20(1): 17-48.
18 Gonzalez, B., Francois, J. and Renaud, M. (1997). "A rapid and reliable
method for metabolite extraction in yeast using boiling buffered ethanol." Yeast 13(14): 1347-1355.
19 Griffin, D. H. (1994). Fungal Physiology. New York, Wiley-Liss, Inc. 20 Groussac, E., Ortiz, M. and Francois, J. (2000). "Improved protocols for
quantitative determination of metabolites from biological samples using high performance ionic-exchange chromatography with conductimetric and pulsed amperometric detection." Enzyme and Microbial Technology 26(9-10): 715-723.
21 Hajjaj, H., Blanc, P. J., Goma, G. and Francois, J. (1998). "Sampling
techniques and comparative extraction procedures for quantitative determination of intra- and extracellular metabolites in filamentous fungi." Fems Microbiology Letters 164(1): 195-200.

63
22 Hamamci, H. and Ryu, D. D. Y. (1994). "Production of L(+)-Lactic acid using immobilized Rhizopus oryzae - Reactor performance based on kinetic model and simulation." Applied Biochemistry and Biotechnology 44(2): 125-133.
23 Hang, Y. D. (1989). "Direct fermentation of corn to L(+)-lactic acid by
Rhizopus oryzae." Biotechnology Letters 11(4): 299-300. 24 Hang, Y. D. (1990). "Chitosan production from Rhizopus oryzae mycelia."
Biotechnology Letters 12(12): 911-912. 25 Hang, Y. D., Hamamci, H. and Woodams, E. E. (1989). "Production of
L(+)-lactic acid by Rhizopus oryzae immobilized in calcium alginate gels." Biotechnology Letters 11(2): 119-120.
26 Hauf, J., Zimmermann, F. K. and Muller, S. (2000). "Simultaneous
genomic overexpression of seven glycolytic enzymes in the yeast Saccharomyces cerevisiae." Enzyme and Microbial Technology 26(9-10): 688-698.
27 Hofvendahl, K. and Hahn-Hagerdal, B. (2000). "Factors affecting the
fermentative lactic acid production from renewable resources." Enzyme and Microbial Technology 26(2-4): 87-107.
28 Huang, L. P., Jin, B. and Lant, P. (2005). "Direct fermentation of potato
starch wastewater to lactic acid by Rhizopus oryzae and Rhizopus arrhizus." Bioprocess and Biosystems Engineering 27(4): 229-238.
29 Huang, L. P., Jin, B., Lant, P. and Zhou, J. T. (2005). "Simultaneous
saccharification and fermentation of potato starch wastewater to lactic acid by Rhizopus oryzae and Rhizopus arrhizus." Biochemical Engineering Journal 23(3): 265-276.
30 Jin, B., Yin, P. H., Ma, Y. H. and Zhao, L. (2005). "Production of lactic
acid and fungal biomass by Rhizopus fungi from food processing waste streams." Journal of Industrial Microbiology & Biotechnology 32(11-12): 678-686.
31 Jitrapakdee, S. and Wallace, J. C. (1999). "Structure, function and
regulation of pyruvate carboxylase." Biochemical Journal 340: 1-16. 32 Kappeli, O. (1986). "Regulation of carbon metabolism in Saccharomyces
cerevisiae and related yeasts." Advances in Microbial Physiology 28: 181-209.

64
33 Karimi, K., Emtiazi, G. and Taherzadeh, M. J. (2006). "Ethanol production from dilute-acid pretreated rice straw by simultaneous saccharification and fermentation with Mucor indicus, Rhizopus oryzae, and Saccharomyces cerevisiae." Enzyme and Microbial Technology 40(1): 138-144.
34 Kato-Noguchi, H. (2006). "Pyruvate metabolism in rice coleoptiles under
anaerobiosis." Plant Growth Regulation 50(1): 41-46. 35 Kenealy, W., Zaady, E., Dupreez, J. C., Stieglitz, B. and Goldberg, I.
(1986). "Biochemical aspects of fumaric acid accumulation by Rhizopus arrhizus." Applied and Environmental Microbiology 52(1): 128-133.
36 Kosakai, Y., Park, Y. S. and Okabe, M. (1997). "Enhancement of L(+)-
lactic acid production using mycelial flocs of Rhizopus oryzae." Biotechnology and Bioengineering 55(3): 461-470.
37 Kresze, G. B. and Ronft, H. (1981). "Pyruvate dehydrogenase complex
from bakers yeast .1. Purification and some kinetic and regulatory properties." European Journal of Biochemistry 119(3): 573-579.
38 Li, X. M., Lin, J. P., Liu, M. and Cen, P. L. (1998). "Repeated-batch and
continuous production of L-lactic acid by Rhizopus oryzae immobilized in calcium alginate beads: Reactor performance and kinetic model." Chinese Journal of Chemical Engineering 6(4): 330-339.
39 Liao, W., Liu, Y., Frear, C. and Chen, S. (2006). "A new approach of pellet
formation of a filamentous fungus -Rhizopus oryzae." Bioresource Technology(dol:10.1016/j.biortech.2006.10.028).
40 Liu, S. Q. (2003). "Practical implications of lactate and pyruvate
metabolism by lactic acid bacteria in food and beverage fermentations." International Journal of Food Microbiology 83(2): 115-131.
41 Lockwood, L. B. and Ward, G. E. (1936). "The physiology of Rhizopus
oryzae." Journal of Agricultural Research 53(11): 849-857. 42 Lowry, O. H., Rosebrough, N. J., Farr, A. L. and Randall, R. J. (1951).
"Protein measurement with the folin phenol reagent." Journal of Biological Chemistry 193(1): 265-275.
43 Maas, R. H. W., Bakker, R. R., Eggink, G. and Weusthuis, R. A. (2006).
"Lactic acid production from xylose by the fungus Rhizopus oryzae." Applied Microbiology and Biotechnology 72(5): 861-868.
44 Magnuson, J. K. and Lasure, L. L. (2004). Organic acid production by
filamentous fungi. in Advances in Fungal Biotechnology for Industry, Agriculture, and Medicine. L. Lange, Kluwer Academic/Plenum Publishers: 307-340.

65
45 Meijer, M. M. C., Boonstra, J., Verkleij, A. J. and Verrips, C. T. (1998). "Glucose repression in Saccharomyces cerevisiae is related to the glucose concentration rather than the glucose flux." Journal of Biological Chemistry 273(37): 24102-24107.
46 Millati, R., Edebo, L. and Taherzadeh, M. J. (2005). "Performance of
Rhizopus, Rhizomucor, and Mucor in ethanol production from glucose, xylose, and wood hydrolyzates." Enzyme and Microbial Technology 36(2-3): 294-300.
47 Miura, S., Arimura, T., Itoda, N., Dwiarti, L., Feng, J. B., Bin, C. H. and
Okabe, M. (2004). "Production of L-lactic acid from corncob." Journal of Bioscience and Bioengineering 97(3): 153-157.
48 Morrin, M. and Ward, O. P. (1990). "Relationships between fungal growth,
morphology and fumaric acid production by Rhizopus arrhizus." Mycological Research 94: 505-510.
49 Narayanan, N., Roychoudhury, P. K. and Srivastava, A. (2004). "L
(+)lactic acid fermentation and its product polymerization." Electronic Journal of Biotechnology 7(2): 167-U2.
50 Obayashi, A., Yorifuji, H., Yamagata, T., Ijichi, T. and Kanie, M. (1966).
"Respiration in organic acid forming molds. I. Purification of cytochrome C coenzyme Q9 and L-lactic dehydrogenase from lactate forming Rhizopus oryzae." Agricultural and Biological Chemistry 30(8): 717-724.
51 Osmani, S. A. and Scrutton, M. C. (1985). "The sub-cellular localization
and regulatory properties of pyruvate carboxylase from Rhizopus arrhizus." European Journal of Biochemistry 147(1): 119-128.
52 Otterstedt, K., Larsson, C., Bill, R. M., Stahlberg, A., Boles, E., Hohmann,
S. and Gustafsson, L. (2004). "Switching the mode of metabolism in the yeast Saccharomyces cerevisiae." Embo Reports 5(5): 532-537.
53 Park, E. Y., Anh, P. N. and Okuda, N. (2004). "Bioconversion of waste
office paper to L(+)-lactic acid by the filamentous fungus Rhizopus oryzae." Bioresource Technology 93(1): 77-83.
54 Park, E. Y., Kosakai, Y. and Okabe, M. (1998). "Efficient production of L-
(+)-lactic acid using mycelial cotton-like flocs of Rhizopus oryzae in an air-lift bioreactor." Biotechnology Progress 14(5): 699-704.
55 Postma, E., Verduyn, C., Scheffers, W. A. and Vandijken, J. P. (1989).
"Enzymic analysis of the Crabtree effect in glucose limited chemostat cultures of Saccharomyces cerevisiae." Applied and Environmental Microbiology 55(2): 468-477.

66
56 Pritchard, G. G. (1971). "NAD+-independent L-lactate dehydrogenase from Rhizopus oryzae." Biochimica Et Biophysica Acta 250(1): 25-&.
57 Pritchard, G. G. (1973). "Factors affecting activity and synthesis of NAD
dependent lactate dehydrogenase in Rhizopus oryzae." Journal of General Microbiology 78(SEP): 125-137.
58 Pronk, J. T., Steensma, H. Y. and vanDijken, J. P. (1996). "Pyruvate
metabolism in Saccharomyces cerevisiae." Yeast 12(16): 1607-1633. 59 Pronk, J. T., Wenzel, T. J., Luttik, M. A. H., Klaassen, C. C. M., Scheffers,
W. A., Steensma, H. Y. and Vandijken, J. P. (1994). "Energetic aspects of glucose metabolism in a pyruvate dehydrogenase negative mutant of Saccharomyces cerevisiae." Microbiology-UK 140: 601-610.
60 Rhodes, R. A., Moyer, A. J., Smith, M. L. and Kelley, S. E. (1959).
"Production of fumaric acid by Rhizopus arrhizus." Applied Microbiology 7(2): 74-80.
61 Rodrigues, F., Ludovico, P. and Leão, C. (2006). Sugar metabolism in
yeasts: an overview of aerobic and anaerobic glucose catabolism. in The Yeast Handbook: Biodiversity and Ecophysiology of Yeasts. C. Rosa. Berlin Heidelberg, Springer: 101-121.
62 Ruengruglikit, C. and Hang, Y. D. (2003). "L(+)-lactic acid production
from corncobs by Rhizopus oryzae NRRL-395." Lebensmittel-Wissenschaft Und-Technologie-Food Science and Technology 36(6): 573-575.
63 Ruijter, G. J. G., Panneman, H. and Visser, J. (1997). "Overexpression of
phosphofructokinase and pyruvate kinase in citric acid-producing Aspergillus niger." Biochimica Et Biophysica Acta-General Subjects 1334(2-3): 317-326.
64 Ruijter, G. J. G. and Visser, J. (1996). "Determination of intermediary
metabolites in Aspergillus niger” Journal of Microbiological Methods 25(3): 295-302.
65 Saito, K., Kawamura, Y. and Oda, Y. (2003). "Role of the pectinolytic
enzyme in the lactic acid fermentation of potato pulp by Rhizopus oryzae." Journal of Industrial Microbiology & Biotechnology 30(7): 440-444.
66 Schaaff, I., Heinisch, J. and Zimmermann, F. K. (1989). "Overproduction
of glycolytic enzymes in yeast." Yeast 5(4): 285-290. 67 Sharma, R., Chisti, Y. and Banerjee, U. C. (2001). "Production,
purification, characterization, and applications of lipases." Biotechnology Advances 19(8): 627-662.

67
68 Skory, C. D. (2000). "Isolation and expression of lactate dehydrogenase genes from Rhizopus oryzae." Applied and Environmental Microbiology 66(6): 2343-2348.
69 Skory, C. D. (2003). "Induction of Rhizopus oryzae pyruvate
decarboxylase genes." Current Microbiology 47(1): 59-64. 70 Skory, C. D. (2004). "Lactic acid production by Rhizopus oryzae
transformants with modified lactate dehydrogenase activity." Applied Microbiology and Biotechnology 64(2): 237-242.
71 Skory, C. D., Freer, S. N. and Bothast, R. J. (1997). "Screening for ethanol-
producing filamentous fungi." Biotechnology Letters 19(3): 203-206. 72 Skory, C. D., Freer, S. N. and Bothast, R. J. (1998). "Production of L-lactic
acid by Rhizopus oryzae under oxygen limiting conditions." Biotechnology Letters 20(2): 191-194.
73 Smith, M. G., Des Etages, S. G. and Snyder, M. (2004). "Microbial
synergy via an ethanol-triggered pathway." Molecular and Cellular Biology 24(9): 3874-3884.
74 Smits, H. P., Hauf, J., Muller, S., Hobley, T. J., Zimmermann, F. K., Hahn-
Hagerdal, B., Nielsen, J. and Olsson, L. (2000). "Simultaneous overexpression of enzymes of the lower part of glycolysis can enhance the fermentative capacity of Saccharomyces cerevisiae." Yeast 16(14): 1325-1334.
75 Soccol, C. R., Stonoga, V. I. and Raimbault, M. (1994). "Production of L-
lactic acid by Rhizopus species." World Journal of Microbiology & Biotechnology 10(4): 433-435.
76 Sun, Y., Li, Y. L., Bai, S. and Hu, Z. D. (1999). "Modeling and simulation
of an in situ product removal process for lactic acid production in an airlift bioreactor." Industrial & Engineering Chemistry Research 38(9): 3290-3295.
77 Sun, Y., Li, Y. L., Bai, S., Yang, H. and Hu, Z. D. (1998). "Stability of
immobilized R. oryzae in repetitive batch productions of L(+)-lactic acid: effect of inorganic salts." Bioprocess Engineering 19(2): 155-157.
78 Sun, Y., Li, Y. L., Yang, H., Bai, S. and Hu, Z. D. (1996). "Characteristics
of immobilized Rhizopus oryzae in polyurethane foam cubes." Biotechnology Techniques 10(11): 809-814.
79 Taherzadeh, M. J., Fox, M., Hjorth, H. and Edebo, L. (2003). "Production
of mycelium biomass and ethanol from paper pulp sulfite liquor by Rhizopus oryzae." Bioresource Technology 88(3): 167-177.

68
80 Tay, A. and Yang, S. T. (2002). "Production of L(+)-lactic acid from glucose and starch by immobilized cells of Rhizopus oryzae in a rotating fibrous bed bioreactor." Biotechnology and Bioengineering 80(1): 1-12.
81 Teusink, B., Passarge, J., Reijenga, C. A., Esgalhado, E., van der Weijden,
C. C., Schepper, M., Walsh, M. C., Bakker, B. M., van Dam, K., Westerhoff, H. V. and Snoep, J. L. (2000). "Can yeast glycolysis be understood in terms of in vitro kinetics of the constituent enzymes? Testing biochemistry." European Journal of Biochemistry 267(17): 5313-5329.
82 Wang, L. S., Ge, X. Y. and Zhang, W. G. (2007). "Improvement of ethanol
yield from raw corn flour by Rhizopus sp." World Journal of Microbiology & Biotechnology 23(4): 461-465.
83 Wee, Y. J., Kim, J. N. and Ryu, H. W. (2006). "Biotechnological
production of lactic acid and its recent applications." Food Technology and Biotechnology 44(2): 163-172.
84 Xuemei, L., Jianping, L., Moe, L. and Peilin, C. (1999). "L-lactic acid
production using immobilized Rhizopus oryzae in a three-phase fluidized-bed with simultaneous product separation by electrodialysis." Bioprocess Engineering 20(3): 231-237.
85 Yin, P. M., Yahiro, K., Ishigaki, T., Park, Y. and Okabe, M. (1998). "L(+)-
lactic acid production by repeated batch culture of Rhizopus oryzae in air-lift bioreactor." Journal of Fermentation and Bioengineering 85(1): 96-100.
86 Yoneya, T. and Sato, Y. (1979). "Alcohol dehydrogenase from Rhizopus javanicus." Applied and Environmental Microbiology 37(6): 1073-1078.
87 Yoneya, T. and Sato, Y. (1980). "Comparison of 2 alcohol dehydrogenases
in the fungus Rhizopus javanicus." Applied and Environmental Microbiology 40(5): 967-969.
88 Yu, R. C. and Hang, Y. D. (1991). "Purification and characterization of a
glucoamylase from Rhizopus oryzae." Food Chemistry 40(3): 301-308. 89 Yu, R. C. and Hang, Y. D. (1991). "Purification and characterization of
NAD-dependent lactate dehydrogenase from Rhizopus oryzae." Food Chemistry 41(2): 219-225.
90 Zhou, Y., Du, J. and Tsao, G. T. (2002). "Comparison of fumaric acid
production by Rhizopus oryzae using different neutralizing agents." Bioprocess and Biosystems Engineering 25(3): 179-181.

69
91 Zhou, Y., Du, J. X. and Tsao, G. T. (2000). "Mycelial pellet formation by Rhizopus oryzae ATCC 20344." Applied Biochemistry and Biotechnology 84-6: 779-789.
92 Znidarsic, P., Komel, R. and Pavko, A. (2000). "Influence of some
environmental factors on Rhizopus nigricans submerged growth in the form of pellets." World Journal of Microbiology & Biotechnology 16(7): 589-593.
93 Znidarsic, P. and Pavko, A. (2001). "The morphology of filamentous fungi
in submerged cultivations as a bioprocess parameter." Food Technology and Biotechnology 39(3): 237-252.

70
APPENDIX A
DEFINITIONS OF YIELD COEFFICIENTS
Yield on substrate:
Lactic acid (lactate) yield: )l (g consumed (glucose) substrate
)l (g produced acid lactic 1
1
−
−
=SLY
Ethanol yield: )l (g consumed (glucose) substrate
)l (g produced ethanol 1
1
−
−
=SEY
Biomass yield: )l (g consumed (glucose) substrate
)l (g produced biomass 1
1
−
−
=SXY
Yield on biomass:
Lactic acid (lactate) yield: )l (g produced biomass)l (g produced acid lactic
1
1
−
−
=XLY
Ethanol yield: )l (g produced biomass)l (g produced ethanol
1
1
−
−
=XEY

71
APPENDIX B
SAMPLE HPLC CHROMATOGRAM
Figure A.1. A sample HPLC chromatogram showing the glucose , lactate and ethanol peaks.
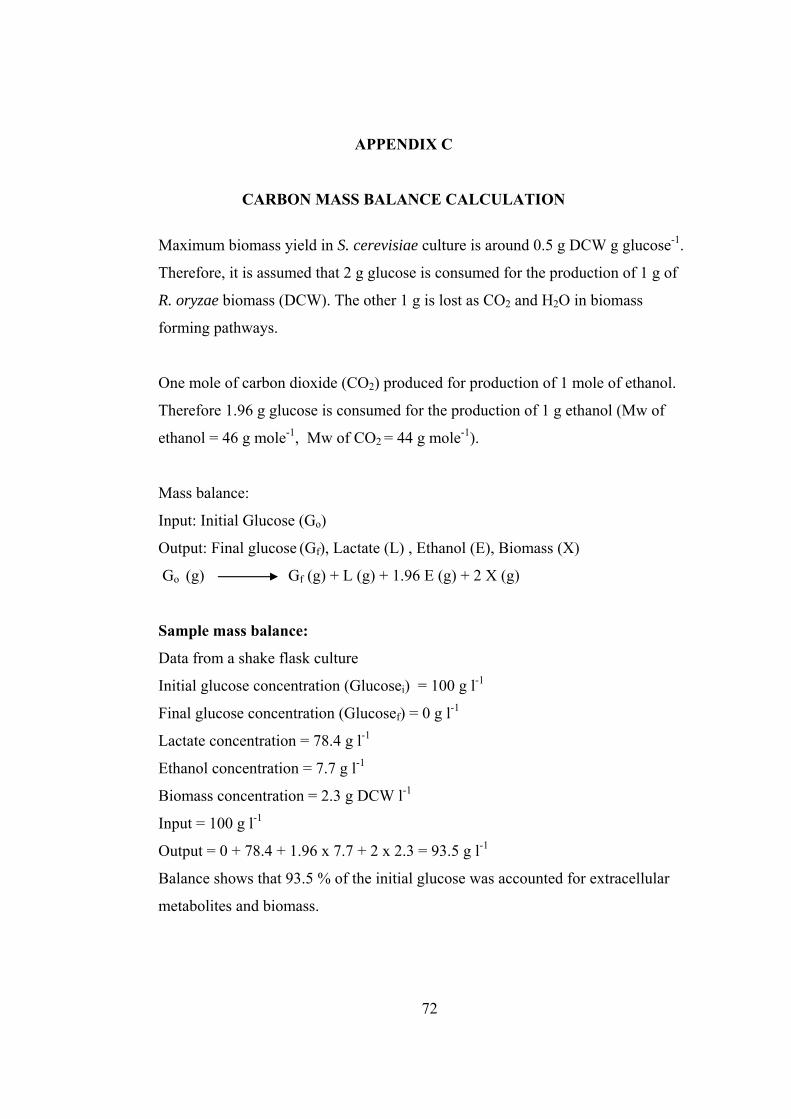
72
APPENDIX C
CARBON MASS BALANCE CALCULATION
Maximum biomass yield in S. cerevisiae culture is around 0.5 g DCW g glucose-1.
Therefore, it is assumed that 2 g glucose is consumed for the production of 1 g of
R. oryzae biomass (DCW). The other 1 g is lost as CO2 and H2O in biomass
forming pathways.
One mole of carbon dioxide (CO2) produced for production of 1 mole of ethanol.
Therefore 1.96 g glucose is consumed for the production of 1 g ethanol (Mw of
ethanol = 46 g mole-1, Mw of CO2 = 44 g mole-1).
Mass balance:
Input: Initial Glucose (Go)
Output: Final glucose (Gf), Lactate (L) , Ethanol (E), Biomass (X)
Go (g) Gf (g) + L (g) + 1.96 E (g) + 2 X (g)
Sample mass balance:
Data from a shake flask culture
Initial glucose concentration (Glucosei) = 100 g l-1
Final glucose concentration (Glucosef) = 0 g l-1
Lactate concentration = 78.4 g l-1
Ethanol concentration = 7.7 g l-1
Biomass concentration = 2.3 g DCW l-1
Input = 100 g l-1
Output = 0 + 78.4 + 1.96 x 7.7 + 2 x 2.3 = 93.5 g l-1
Balance shows that 93.5 % of the initial glucose was accounted for extracellular
metabolites and biomass.
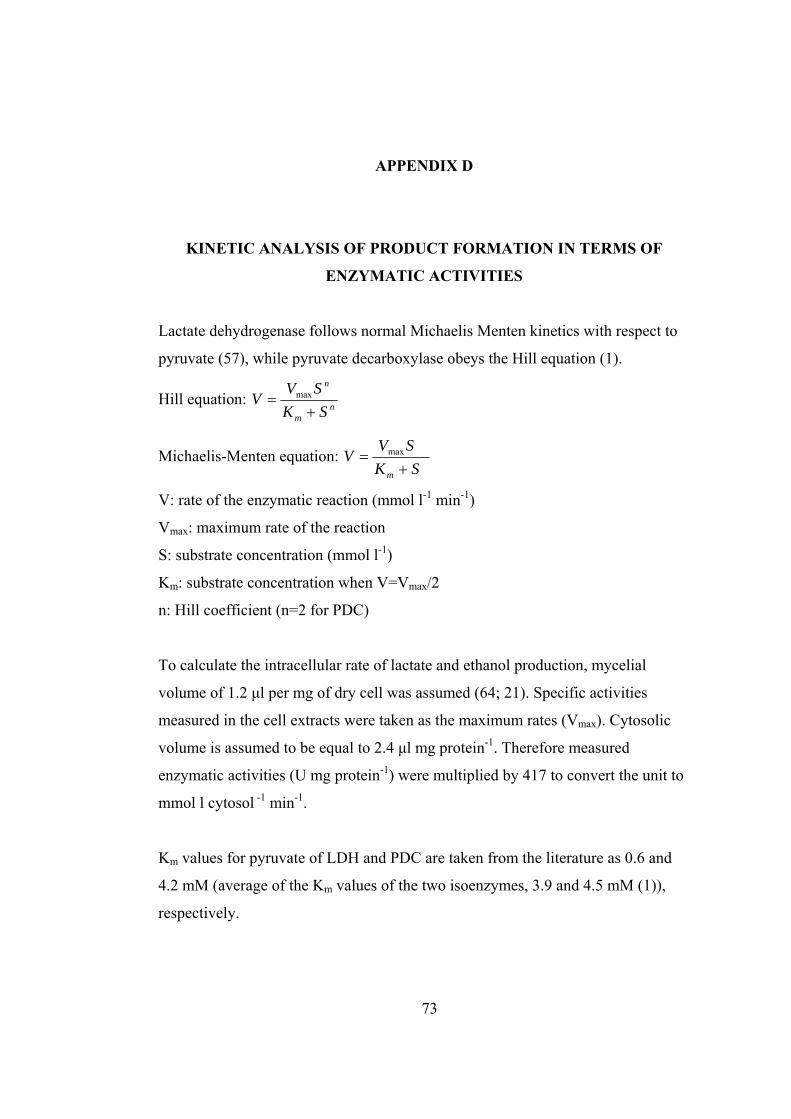
73
APPENDIX D
KINETIC ANALYSIS OF PRODUCT FORMATION IN TERMS OF
ENZYMATIC ACTIVITIES
Lactate dehydrogenase follows normal Michaelis Menten kinetics with respect to
pyruvate (57), while pyruvate decarboxylase obeys the Hill equation (1).
Hill equation: nm
n
SKSV
V+
= max
Michaelis-Menten equation: SK
SVV
m += max
V: rate of the enzymatic reaction (mmol l-1 min-1)
Vmax: maximum rate of the reaction
S: substrate concentration (mmol l-1)
Km: substrate concentration when V=Vmax/2
n: Hill coefficient (n=2 for PDC)
To calculate the intracellular rate of lactate and ethanol production, mycelial
volume of 1.2 µl per mg of dry cell was assumed (64; 21). Specific activities
measured in the cell extracts were taken as the maximum rates (Vmax). Cytosolic
volume is assumed to be equal to 2.4 µl mg protein-1. Therefore measured
enzymatic activities (U mg protein-1) were multiplied by 417 to convert the unit to
mmol l cytosol -1 min-1.
Km values for pyruvate of LDH and PDC are taken from the literature as 0.6 and
4.2 mM (average of the Km values of the two isoenzymes, 3.9 and 4.5 mM (1)),
respectively.

74
Case 1: Lactate producing batch culture.
Dry cell weight at the end of the culture was 0.1125 g. Therefore, cytosolic volume
was calculated as 0.135 ml. Since the total culture volume is 50 ml, rate should be
50/0.135 times higher in the cytosol. Therefore, the rate of product formation
should be approximately 400 fold of the rate in the culture media.
Rate of product formations measured in the culture:
dtlactated )( = 0.52 mmol l-1 min-1
dtethanold )( = 0.13 mmol l-1 min-1
Rate of product formations in the cytosol were calculated as:
dtlactated )( = 208 mmol l-1 min-1
dtethanold )( = 52 mmol l-1 min-1
Vmax values measured in cell extracts are:
LDH: 2.4 U mg protein-1 (µmol min-1 mg protein-1)
PDC: 1.3 U mg protein-1 (µmol min-1 mg protein-1)
Vmax values calculated for the activities in the cytosol
LDH: 1000.8 mmole min-1 l cytosol-1
PDC: 542.1 mmole min-1 l cytosol-1
Case 2: Ethanol producing batch culture.
Dry cell weight at the end of the culture was 0.23. Therefore, cytosolic volume
was calculated as 0.28 ml cytosol. Since the total culture volume is 50 ml, rate

75
should be 50/0.28 times higher in the cytosol. Therefore, the rate of product
formation should be approximately 200 fold of the rate in the culture media.
Rate of product formations measured in the culture:
dtlactated )( = 0.19 mmol l-1 min-1
dtethanold )( = 0.58 mmol l-1 min-1
Rate of product formations in the cytosol were calculated as:
dtlactated )( = 38 mmol l-1 min-1
dtethanold )( = 116 mmol l-1 min-1
Vmax values measured in cell extracts are:
LDH: 0.3 U mg protein-1 (µmol min-1 mg protein-1)
PDC: 1.8 U mg protein-1 (µmol min-1 mg protein-1)
Vmax values calculated for the activities in the cytosol
LDH: 125.1 mmole min-1 l cytosol-1
PDC: 750.6 mmole min-1 l cytosol-1

76
0100200300400500600700800900
1000
0 2 4 6 8 10 12
pyruvate concentration (mmol l cytosol-1)
rate
(mm
ol l
cyto
sol-1
min
-1)
Figure A.2. Dependence of rate of LDH (closed squares) and PDC (open squares) catalyzed reactions on pyruvate concentration according to the Michealis-Menten equation in lactate producing batch culture
0
100
200
300
400
500
600
700
800
0 2 4 6 8 10 12
pyruvate concentration (mmol l cytosol-1)
rate
(mm
ol l
cyto
sol-1
min
-1)
Figure A.3. Dependence of rate of LDH (closed squares) and PDC (open squares) catalyzed reactions on pyruvate concentration according to the Hill equation in ethanol producing batch culture.

77
In order to calculate Km and Vmax values for a given pyruvate concentration,
following equations derived from the reciprocals of the Michaelis-Menten and Hill
equations were used:
Michaelis-Menten equation used for LDH:
)1(11
max
+=S
KVV
m , )1(max +=S
KVV m , )11(
maxmax VV
SVK m −=
Hill equation used for PDC:
)1(112
max
+=SK
VVm , )1( 2max +=
SK
VV m , )11(max
2max VV
SVK m −=
78
CURRICULUM VITAE
PERSONAL INFORMATION Surname, Name: Büyükkileci, Ali Oğuz Nationality: Turkish (TC) Date and Place of Birth: 16 September 1975, İstanbul Marital Status: Single Phone: +90 312 210 5622 Fax: +90 312 210 2767 e-mail: [email protected] EDUCATION Degree Institution Year of Graduation MS Izmir Institute of Technology, Biotechnology 2000 BS Middle East Technical University, Food
Engineering, Ankara 1997
High School Atatürk Anadolu High School, Zonguldak 1993 WORK EXPERIENCE Year Place Enrollment 2001- Present METU Biotechnology Research Assistant 1997-2001 Izmir Institute of Technology
Biotechnology Research Assistant
1996 July FÜRSAN, Fermentation Products, Inc. Intern Engineering Student 1996 August MİS Dairy Products, Inc. Intern Engineering Student FOREIGN LANGUAGES Advanced English, Entry level German, Entry level French PUBLICATIONS 1. Büyükkileci A.O., Hamamcı H., Yücel M., “Lactate and Ethanol Production by Rhizopus oryzae and activities of related pyruvate branch point enzymes, Journal of Bioscience and Bioengineering, 5(12), 225-228 (2006) 2. Büyükkileci A.O, Harsa Ş., “L(+)-lactic acid production from whey by Lactobacillus casei NRRL-B441”, Journal of Chemical Technology and Biotechnology, 121-125 (2003) HOBBIES Music, Sports