investigation of the 2006 drought and 2007 flood extremes at the sgp through an integrative analysis...
TRANSCRIPT

Investigation of the 2006 Drought Investigation of the 2006 Drought and 2007 Flood Extremes at the and 2007 Flood Extremes at the
SGP Through an Integrative SGP Through an Integrative Analysis of ObservationsAnalysis of Observations
Xiquan Dong, University of North Dakota
1
Contributors: B. Xi, A. Kennedy, Z. Feng, J. Entin, P. Houser, B. Schiffer, W.
Olson, T. L’Ecuyer, T. Liu, K-L Hsu, B. Lin , Y. Deng, and T. Jiang
Dong et al. JGR 2010

Hydrological years 2006 (HY06, 10/2005-09/2006) and 2007 (HY07, 10/2006-09/2007) provide a unique
opportunity to examine hydrological extremes in the central US because
1) There are no other examples of two such highly contrasting precipitation extremes occurring in consecutive years at the SGP in recorded history.
2) No such a comprehensive dataset available concerning the droughts and floods in the SGP relative to other periods in history.
To investigate these two golden years, we have collocated ARM ground-based, Oklahoma Mesonet, GPCP and TRMM satellite data, PDSI, and NCEP/MERRA reanalyses over the SGP.
Motivation

Data sets collected for this studyTime period: From January 1997 to December 2007Spatial Domain: Entire Oklahoma, including ARM SGP Data sets: (Observed or derived)1) ARM: (point observation)Cloud fraction and Cu thickness derived from radar-lidar paired measurementsCloud LWP and atmospheric PWV retrieved from microwave radiometerRain rate measured by Tipping bucket rain gauge Net radiation, SH and LH measured by ARM SGP energy balance Bowen ratio
system.
2) Oklahoma Mesonet rain gauge (entire OK state): To quantify the accumulated precipitation for each event and monthly accumulation
4) GPCP and TRMM precipitation over a 5ox5o grid box centered on the SGP
5) NCEP/MERRA reanalyses: To investigate the role of large-scale dynamics in controlling the 2006 dry and 2007 wet events, and LLJ,.
6) Palmer Drought Severity Index (PDSI): -6 (dry) to +6 (wet)

4
Four scientific questions to addressFour scientific questions to address
1. Are HY06 and HY07 representative of significant drought and pluvial conditions and, if so, how severe and widespread are the effects?
2. How do large-scale dynamics play a role in these extreme events?
3) To what extent are the severities of the drought and flood affected by cloud and surface energy feedbacks?
4) How are these extreme events linked to the moisture transport from the Gulf of Mexico?

Question 1
1. Are HY06 and HY07 representative of significant drought and pluvial conditions and, if so, how severe and widespread are the effects?

a) PDSI values show HY06 is dry year and HY07 is wet
b)-d) Four precipitation
datasets show: HY06 is below theclimate mean,especially during11/2005-02/2006extreme dry
periodHY07 is above the climate mean, especially May-July 2007extreme wet
FloodDroughtPDSI
Precip
Anomaly
Anom: %

HY06
HY07
Answering question 1HY06 ranks assecond-driest year
over entire OK state.
HY07 is seventh-wettest year over OK statewide and the wettest year over central OK.

Seasons Percentage of normal precipitation (1921-2008)
Severities in historical record
HY2006 (10/05 to 09/06) 61% 2nd driest
HY2007 (10/06 to 09/07) 121% 7th wettest for OK state, 1st wettest for central OK
2005 SON 44% 13th driest
2005-2006 DJF 27% 1st driest
2006 MAM 80% 23rd driest
2006 JJA 75% 21st driest
2006 SON 73% 32nd driest
2006-2007 DJF 123% 19th wettest
2007 MAM 117% 13th wettest
2007 JJA 168% 2nd wettest
2007 SON 63% 21st driest 8
Table 1: Seasonal statistics of precipitation and their severities during 2006-2007 From Oklahoma Climatological Survery (http://climate.mesonet.org/)

Question 2
How do large-scale dynamics play a role in these extreme events?

500mb Geopotential height Mean and Anomalies
H
H
HH
L
L
L
L Extreme Dry
Extreme Wet
Transport of dry air from Canada southward into SGP + strong sinking motion over SGPblocks the inflow of Low-level moisture from Gulf of Mexico
Anomalous low over the TX/OK region was associated with the passage of numerous short-wave troughs in the lee of the Rocky Mountains and a persistent upper-level low. These patterns were associated with rising motion and were conducive to thunderstorm development. Thus the precipitation events during the extreme wet period were initially generated by active weather patterns and enhanced by MCSs.
LL

925 mb RH mean and anomalies925 mb RH mean and anomalies Extreme Dry
Extreme Wet
10-20% below
10-20% above
The dry area is much larger than wet area

Question 3
To what extent are the severities of the drought and
flood affected by cloud and surface energy feedbacks?
We have demonstrated that HY06 and HY07 are indeed under significant drought and pluvial conditions, respectively, and dominated by large-scale dynamic patterns. However, it is unclear to what extent these extreme events are associated with the seasonal variations of cloud properties and surface energy, and affected by cloud and surface energy feedbacks. Further, what phase relationships exist between the cloud and surface properties? For variables that have either leading or lagging relationships each other, what does this imply about maintaining and reinforcing drought and pluvial conditions?

13
1) Compared to the 11-yr averages,
HY06 CF, CU cloudthickness, LWP, and Precip are much less, and those in HY07 are much more.2) Precip has high correlations with CF, Cu cloud thickness, LWP and PWV.3) Two extremeperiods are selected
Extreme wet period MJJ 2007
Extreme dry period NDJF 2005-2006
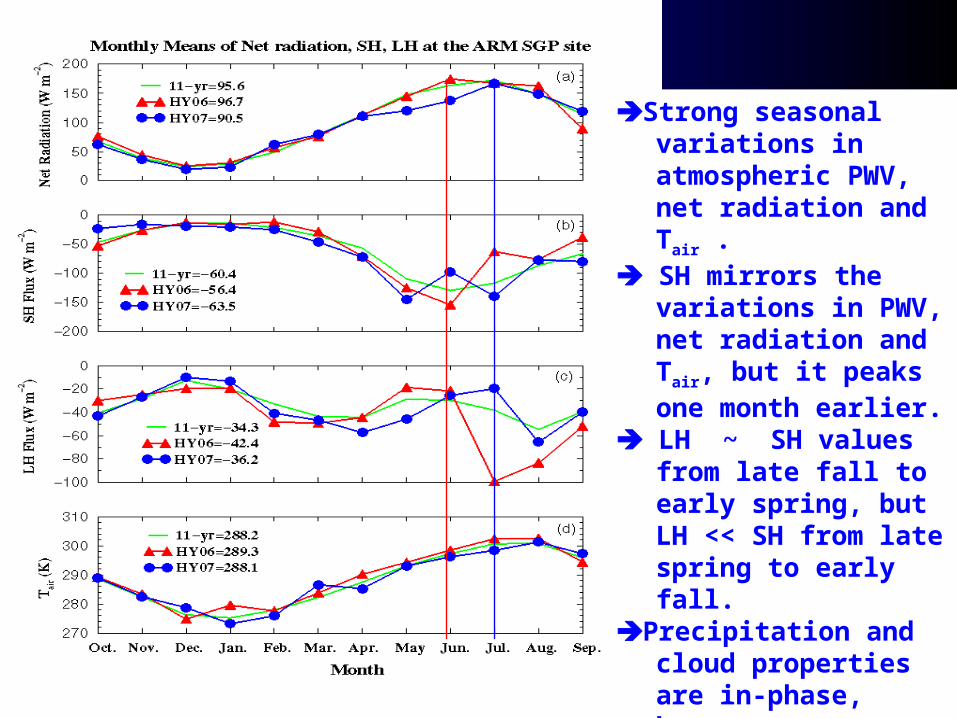
Strong seasonal variations in atmospheric PWV, net radiation and Tair .
SH mirrors the variations in PWV, net radiation and Tair, but it peaks one month earlier.
LH ~ SH values from late fall to early spring, but LH << SH from late spring to early fall.
Precipitation and cloud properties are in-phase, however, temperature change lags that of net radiation, especially solar radiation, about a month with CL>99%.

Two positive feedback processesTwo positive feedback processesAlthough the drought and pluvial conditions are dominated by large-scale
dynamic patterns, we have demonstrated that the two positive feedback processes during the extreme dry and wet periods play certain roles to maintain and reinforce the length and severity of existing drought and flood events.
During the extreme dry period, with less clouds, LWP, PWV, precipitation, and thinner Cu cloud thickness, more net radiation was absorbed and used to evaporate water from the ground. The evaporated moisture, however, was removed by low-level divergence. Thus, with less precipitation and removed atmospheric moisture, more absorbed incoming solar radiation was used to increase surface temperature and to make the ground drier.
During the extreme wet period, more precipitation is strongly associated with increased CF, LWP, PWV, and thicker Cu cloud thickness, but with decreased net radiation and surface temperature. The precipitation events during the extreme wet period were initially generated by active weather patterns and enhanced by the frequency of thunderstorms and their associated latent heat release.
15

Question 4
How are these extreme events linked to the moisture transport from the Gulf of Mexico?

Moisture Transport from the Gulf of Mexico (+northward)
The moisture transports during the extreme dry and wet periods are
85% and 113% relative to their corresponded 9-yr averages, indicating much less moisture transport during the extreme dry period and HY06, and much more moisture transport during the extreme wet period and HY07 than normal years.
There are less (-8.9%) moisture transport in HY06 and more (+8.1%) in HY07 than
the average of 1999-2007.

Monthly Mean Low Level Jet (MJJ, 2007)Monthly Mean Low Level Jet (MJJ, 2007)Mean AnomalyMay
June
July
During May, the LLJ anomaly was slightly stronger (2 ms-1) in NGP, however, the moisture source of the Gulf of Mexico was weaker
During June, the LLJ anomaly was also slightly stronger with a dipole of ~2 ms-1 meridional wind existed over the southwest of OK. This dipole pattern is in agreement with the persistent low pressure system over the SGP region during this month
For July, both LJJ mean and anomaly were weaker with negative anomalies on order of -1 to -2 ms-1 throughout the SGP region.

Briefly answering Question 4Briefly answering Question 41) During the extreme dry period, there were only weak (~ -0.5 ms-1, southward) anomalies over portions of OK and southern Kansas. Thus, the droughts during the extreme dry period were associated with more northerly winds on average and reduced moisture transport from the Gulf of Mexico.
19
2) During the extreme wet period, however, the monthly LLJ means and anomalies were much larger and their values of moisture transport were higher. These results have demonstrated that the precipitation events over the SGP region, especially in June 2007, are definitely linked with strong LLJ and high moisture transport from the Gulf of Mexico.
Challenges and Future WorkThese observational results can provide
constraints and ground truth for modelers to improve their simulations of drought and flood events.
To what extent are these extremes and processes predictable and on what time scales?
How can we build upon this SGP study, and devise observational strategy and diagnostic tool to explore hydrological extremes in other climatic regions, and link with continental/global scale processes?

04/18/23 21
Thanks for your attention

Raining CloudsHigh Clouds
Low CloudsTotal
NET
SW
LWDry Period <0 cooling
TRMM-based QR(z) at SGPTRMM-based QR(z) at SGP
Wet Period >0warming
Radiative flux anomalies derived from TRMM observations agree very well with ARM SGP data.
The HERB dataset can, therefore, be used to extend the localized SGP measurements to the larger domain from 33-38°N and 95-100°W.
. The overall net (SW+LW) effect due to the increased clouds during the extreme wet period is the heating of the atmosphere from the surface up to 10 km, consistent with ARM SGP surface energy balance (upward).

24
25