investigation of the genetic and environmental …
TRANSCRIPT

The Pennsylvania State University
The Graduate School
Intercollege Graduate Degree Program in Genetics
INVESTIGATION OF THE GENETIC AND ENVIRONMENTAL EFFECTS ON
HYPERTENSION (HIGH BLOOD PRESSURE) IN AFRICAN AMERICANS
A Thesis in
Genetics
by
Xiaopan Yao
© 2007 Xiaopan Yao
Submitted in Partial Fulfillment of the Requirements
for the Degree of Doctor of Philosophy
August 2007

The thesis of Xiaopan Yao was reviewed and approved* by the following:
George Vogler Professor of Biobehavioral Health Chair of Committee
David Vandenbergh Associate Professor of Biobehavioral Health Thesis Advisor
Keith Whitfield Professor of Biobehavioral Health
Karen Boomer Assistant Professor of Statistics
Runze Li Associate Professor of Statistics.
Richard Ordway Associate Professor of Biology Head of Intercollege Graduate Degree Program in Genetics
*Signatures are on file in the Graduate School

iii
ABSTRACT
According to the National Center for Health Statistics, African Americans have
among the highest rates of hypertension of any race or ethnic type in the world. Thirty-
five percent of African Americans have hypertension, which accounts for 20% of the
African American deaths in the United States.
This project addresses the question of genetic predisposition and environmental
effects on hypertension in a population of African Americans through biological and
statistical approaches. The primary objectives of this project are to (1) identify relevant
gene(s) associated with hypertension in the population of African Americans by
evaluating several candidate genes; (2) to investigate the genetic and environmental
effects on hypertension in African Americans.
Three Single Nucleotide Polymorphisms (SNPs) were chosen from three primary
genes of the renin-angiotensin system. These three SNPs were M235T in the
Angiotensinogen (AGT) gene, A-240T in the Angiotensin I Converting Enzyme (ACE)
gene, and A44221G in the Angiotensinogen II receptor, subtype 1 (AGTR1) gene. A total
of 706 African Americans, including 101 monozygotic twin pairs (MZ twins), 182
dizygotic twin pairs (DZ twins), 31 sibling pairs, and 78 singletons, were interviewed and
genotyped at the three genetic loci.
There were three steps in this project. Association tests and logistic regression
analyses were performed to investigate the association between hypertension status and
the three SNPs separately to find the gene(s) associated with high blood pressure in the
population of African Americans. Next two general linear mixed models were built to

iv
explain the effect of particular relevant gene(s) and the effect of other determining factors
on blood pressure in African Americans. Finally structural equation modeling (SEM) was
used to estimate the genetic and environmental effects on blood pressure in African
Americans. The measured genotype of the relevant gene(s) that had been detected by
association tests were added into the traditional SEM with the aim to estimate the effect
of particular genetic loci separately from the effect of unmeasured genetic factors and to
assess the importance of particular gene(s) relative to the influence of genetic effects in
sum.

v
TABLE OF CONTENTS
LIST OF FIGURES .....................................................................................................vii
LIST OF TABLES.......................................................................................................viii
ACKNOWLEDGEMENTS.........................................................................................x
Chapter 1 Introduction ................................................................................................1
1.1 Specific Aims..................................................................................................1 1.1.1 First Aim-Identify Gene(s) Associated with Hypertension in
African Americans .................................................................................2 1.1.1.1 Linkage Analysis........................................................................3 1.1.1.2 Quantitative Trait Locus (QTL) Mapping and Genome Scans ..4 1.1.1.3 Animal Models ...........................................................................4 1.1.1.4 Association Studies ....................................................................5
1.1.2 Second Aim-Explain the Genetic and Environmental Effects on Hypertension in African Americans.......................................................8
1.2 Background.....................................................................................................10 1.2.1 Hypertension in African Americans.....................................................10 1.2.2 Genetics of Hypertension .....................................................................11
1.2.2.1 Angiotensinogen (AGT) Gene ....................................................11 1.2.2.2 Angiotensin I-Converting Enzyme (ACE) Gene .........................13 1.2.2.3 Angiotensin II Receptor, Subtype 1 (AGTR1) Gene...................14
1.2.3 Other Determinant Factors ...................................................................15
Chapter 2 Data Collection and Analysis Procedure....................................................17
2.1 Data Structure .................................................................................................17 2.2 DNA Collection and Genotyping ...................................................................17 2.3 Analysis Procedure .........................................................................................19
Chapter 3 Association Test and Logistic Regression .................................................23
3.1 Population Stratification ................................................................................23 3.2 Association Test.............................................................................................24 3.3 Logistic Regression .......................................................................................26
Chapter 4 General Linear Mixed Model.....................................................................38
4.1 Using the General Linear Mixed Model for Twin Data .................................38 4.2 Intra-Class Correlation Calculation ...............................................................41 4.3 Result .............................................................................................................43
Chapter 5 Structural Equation Modeling ....................................................................55

vi
5.1 Bivariate Cholesky Decomposition Model.....................................................56 5.2 Modeling the Effects of the ACE Gene ..........................................................58 5.3 The Full Model and Reduced Models ...........................................................60 5.4 Test the Effect of the ACE Gene....................................................................61 5.5 Result of Structural Equation Modeling (SEM) ............................................63
Chapter 6 Conclusion and Future Work .....................................................................75
Bibliography ................................................................................................................80

vii
LIST OF FIGURES
Figure 1-1: Angiotensin System (RAS) and Regulation of Blood Pressure................16
Figure 3-1:Genotype frequency (%) of the ACE gene in the normotensive and hypertensive subjects ............................................................................................36
Figure 3-2:Allele frequency of the ACE gene in the normotensive and hypertensive subjects. ...........................................................................................37
Figure 5-1: The Cholesky factor ACE model for two variables systolic blood pressure (SBP) and diastolic blood pressure (DBP). ............................................73
Figure 5-2: Diagram of the full model: the Cholesky factor ACE model with additive and dominance effects of the ACE gene for systolic blood pressure (SBP) and diastolic blood pressure (DBP). ..........................................................74
viii
LIST OF TABLES
Table 3-1: Chi-square statistics and p-values for association tests between the genotype of each gene and hypertension, and between the allele of each gene and hypertension...................................................................................................30
Table 3-2: Genotype frequencies of ACE by hypertension ........................................31
Table 3-3: Alleles frequencies of ACE by hypertension.............................................32
Table 3-4: Model fit statistics .....................................................................................33
Table 3-5: Analysis of maximum likelihood estimates ..............................................34
Table 3-6: Odds ratio estimates ..................................................................................35
Table 4-1: Tests of significance for fixed effects in the model for systolic blood pressure and diastolic blood pressure ...................................................................47
Table 4-2: Estimate for fixed effects in the model for systolic blood pressure ..........48
Table 4-3: Least squares means of systolic blood pressure based on different genotypes of the ACE gene...................................................................................49
Table 4-4: Differences of least squares means of systolic blood pressure between different genotypes ...............................................................................................50
Table 4-5: Variances of random effects from the mixed model of systolic blood pressure and diastolic blood pressure ...................................................................51
Table 4-6: Intra-Class Correlations Calculated for MZ twin-pairs, DZ twin-pairs and siblings ...........................................................................................................52
Table 4-7: Estimated Proportions of the Variance Owing to Additive Genetic Effects ( 2h ) and Environmental Factors among Twins ( 2
tc ) and Siblings ( 2sc )
for SBP..................................................................................................................53
Table 4-8: Estimated Proportions of the Variance Owing to Additive Genetic Effect ( 2h ), Dominant Genetic Effect ( 2d ) and Environmental Factor among Twins ( 2
tc ) for DBP ..............................................................................................54
Table 5-1: Models with all possibilities of ACE gene effects on SBP and DBP........68
Table 5-2: Means and Standard Deviations of Systolic Blood Pressure (SBP) and Diastolic Blood Pressure (DBP) in ACE Genotype Groups .................................69

ix
Table 5-3: Competing Models for Factor Structure of Genetic, Common Environment and Unique Environment Influences ..............................................70
Table 5-4:Completing Models for ACE gene effect on systolic blood pressure and diastolic blood pressure ........................................................................................71
Table 5-5: Parameter Estimates from Best Fitting Model ..........................................72

x
ACKNOWLEDGEMENTS
I would like to express my deepest appreciation to my advisor, Dr. David Vandenbergh, for his patience, encouragement, support and guidance during the course of my graduate study. I would also like to thank Dr. George Vogler, Dr. Keith Whitfield, Dr. Karen Boomer and Dr. Runze Li for their interest in my work by serving as my Ph.D committee members.
I extend sincere appreciation to my colleagues Jennifer Foreman and Kate Anthony for their help and suggestion. I also want to take this opportunity to express my love and sincere thanks to my parents for their endless love, patience and support.

Chapter 1
Introduction
The intent of this project is to study the effect of genetic and environmental risk
factors on hypertension in African Americans through biological and statistical
approaches. Based on the theory of genetic epidemiology, human disease, such as
hypertension, involves multiple genes and a single gene’s variants might account for only
a small portion of the vulnerability to the disease. In addition, it has been realized that
human disease results from complex interaction of genetic susceptibility factors and
environmental risk factors, which is a broad definition, including infectious, chemical,
behavioral and nutritional factors. These environmental risk factors may cause or
otherwise influence the onset of various disorders in susceptible individuals. In this sense,
genetic variations do not cause disease but rather influence a person’s susceptibility to
environmental factors. Thus, researchers in the field of genetic epidemiology are working
with two primary goals: one is to identify relevant genes involved in the disease under
study and establish how each gene influences the disorder, and the other is to separate out
and estimate environmental effects and genetic effects for the disease.
1.1 Specific Aims
This project addresses the question of genetic predisposition and environmental
effects on hypertension in a population of African Americans. Genetic predisposition will

2
be queried from the aspect of inborn genetic variation and the traditional view of
polymorphisms. The first aim of this research is to identify gene(s) associated with
hypertension in a sample of African Americans by evaluating several candidate genes,
and the second aim is to investigate the genetic and environmental effects on
hypertension in African Americans.
1.1.1 First Aim-Identify Gene(s) Associated with Hypertension in African Americans
Hypertension can be classified as either essential hypertension or secondary
hypertension. Essential hypertension, which accounts for 95% of hypertension, refers to
high blood pressure with no identifiable cause while secondary hypertension refers to
high blood pressure that is a result of a specific abnormality in one of the organs or
systems of the body, such as the kidney, adrenal gland or aortic artery.
Because human essential hypertension is a polygenic disorder that is intrinsically
genetically heterogenerous, different patients carry different subsets of genes that lead to
elevated blood pressure. To identify individual genes from the polygenic systems of
complex phenotypes, researchers have developed several strategies, such as linkage
analysis, Quantitative Trait Locus (QTL) mapping, animal models and genetic
association test. These methods will be described briefly to provide a basis for the
approach used in the present work.

3
1.1.1.1 Linkage Analysis
The aim of linkage analysis is to establish linkage between genes and further
identify the location on a chromosome of a given gene. The identification of the locus of
a gene is the first step towards the identification and positional cloning of the gene itself.
Linkage is the tendency for genes and other genetic markers to be inherited
together because they are located near one another on the same chromosome. The
statistical estimate of whether two loci are likely to lie near each other on a chromosome,
and are therefore likely to be inherited together, is measured by LOD score, which stands
for logarithm of the odds (to the base 10). In the past few decades, many genes,
implicated in simple (Mendelian) diseases, have been identified by using genetic linkage
analysis and positional cloning methods. One of the best known examples is the study of
Huntington's Disease (Marazita 1985).
Linkage mapping has been successfully applied to investigate the relationship
between diseases and some rare, severe, high-risk mutations because the diagnosis in this
situation is the least ambiguous and there is a near one-to-one correspondence between
genotype and phenotype. However, a linkage analysis approach is unlikely to identify
genes that cause polygenetic disease, such as essential hypertension, because this
approach requires the presence of a single major disease gene with a specific mode of
inheritance.

4
1.1.1.2 Quantitative Trait Locus (QTL) Mapping and Genome Scans
Quantitative Trait Locus (QTL) mapping is defined as the positioning of
chromosomal fragments containing polygenes that are correlated with quantitatively or
qualitatively measured phenotypes (Falconer DS, Mackay TFC 1996). Polymorphic
genetic markers, initially examined for candidate genes, can also be examined at regular
distances along each chromosome. Thus, the whole genome can be scanned for
chromosomal regions having elevated levels of genetic marker similarity. In the past ten
years, QTL mapping and genome scanning approaches dominated the study of polygenic
determinants of traits like blood pressure, particularly in animal models of genetic
hypertension. Computer programs are used in this type of analysis to identify
chromosomal regions most likely to contain genes (or loci) associated with variation in
blood pressure. However, this strategy also has some insurmountable difficulties:
quantitative trait locus mapping can only position chromosomal regions containing
polygenes but not directly identify specific genes involved in a disease.
1.1.1.3 Animal Models
Studying inbred rats rather than human populations has the advantage that in
animal models a single set of genetic factors (the segregating alleles carried by each of
the inbred strains that were crossbred) makes all polymorphic genetic markers fully
informative for the genotype at all chromosomal loci.
Selectively bred rat strains have been developed that are divergent for a polygenic
quantitative trait such as blood pressure. After systematic blood pressure measurement of
5
a large heterogeneous population, several pairs of rats with the highest blood pressures
are selected for mating to produce a high blood pressure strain, as has been accomplished
with the spontaneously hypertensive rat strain (Rapp 2000). Blood pressures of the
progeny are measured, and several pairs of rats with the highest blood pressures are
selected for mating. Repetition of this procedure further selects alleles associated with
high blood pressure. At some point, further selection does not result in progeny with
higher blood pressure than their parents, and the selectively bred strain is then inbred to
fix the genes responsible for the trait. After brother-sister mating of rats from the
selectively bred strain has occurred for at least 20 additional generations, more than 99%
of the loci become homozygous (i.e. have two copies of the same allele) and the inbred
strain is considered genetically homogeneous. Creation of inbred strains results in
homozygous alleles at virtually all loci, including genes that are not involved in the
genetic determination of blood pressure.
Genome scanning approaches have been used to identify blood pressure QTLs in
segregating populations bred by crossing hypertensive rats from a number of different
genetic models with contrasting normotensive strains. To date, blood pressure QTLs have
been identified on many rat chromosomes, confirming the complex polygenic nature of
blood pressure regulation in this species (Rapp JP, 2000).
1.1.1.4 Association Studies
Although researchers have identified successfully many candidate genes by
genome scanning in animal models, a problem still remains: the results from the animal

6
models might not directly reflect the genetic mechanism in human beings. As a result of
these inborn difficulties carried by investigative strategies mentioned above, another
method, genetic association, has attracted greater attention.
The main use of association studies, in general, is to identify a particular gene as a
strong candidate after a chromosomal region has already been linked to the trait.
Association study has been used widely to assess correlations between genetic variants
and disease phenotypes on a population scale, relying on linkage disequilibrium (LD)
between genotyped markers and unknown disease loci. Linkage disequilibrium refers to
the situation where certain allele combinations at closely linked genes are more frequent
than might be expected from a random formation of haplotypes from alleles based on
their frequencies. Non-random associations between genes at different loci are measured
by the degree of linkage disequilibrium.
The logic of genetic association study is straightforward—genotype individuals at
the genetic locus of interest in a particular gene and test whether individual differences at
this locus are statistically associated with a phenotype between cases with hypertension
and controls with no hypertension. Chi-square tests are often used in genetic association
studies to determine whether the distribution of the genotypes in the controls differs from
the distribution in the cases.
In practice, frequencies of the different alleles for the proposed locus are
examined in hypertensive patients and normotensive control subjects who have been
carefully matched for confounding factors such as age, sex, and race. Linkage
disequilibrium occurs when combinations of alleles at different loci are observed at
frequencies significantly higher than expected from chance association alone. If alleles

7
have strikingly different frequencies in patients compared with unaffected control
subjects, the differences could arise from causal involvement of the allele in disease
susceptibility or from linkage disequilibrium with an allele at a nearby polymorphic site,
presumably within the gene. Although linkage disequilibrium can arise from several
sources including recent admixtures of groups within a population, selection for a
specific allele, or random genetic drift, disequilibrium occurring between tightly linked
loci is expected to be more robust. In this way, linkage disequilibrium between a genetic
marker and a disease or trait locus could lead to identifying one of the genes responsible
for susceptibility to high blood pressure.
The single Nucleotide Polymorphism (SNP) is one kind of DNA sequence
variation on which researchers usually focus in recent studies. A SNP occurs when a
single nucleotide in the genome differs between members of a species or between paired
chromosomes in an individual. In this project, three SNPs were chosen from three
candidate genes, one in each, and genetic association tests were conducted to test the
association between each of these three SNPs and hypertension in African Americans.
One concern about association study comes from the potential existence of
population stratification. Population stratification refers to differences in allele
frequencies of a genetic variant, or variants, under study between cases and controls due
to systematic differences in ancestry rather than association of genetic marker with
disease. Population stratification serves as a significant confound in association studies
and very likely causes false positive results. When population subdivision exists, it is
possible to find statistical associations between a disease and genetic markers that have
no physical linkage to causative unknown disease loci (Lander and Schork 1994; Ewens

8
and Spielman 1995). Due to genetic drift, marker-allele frequencies may vary among
population subdivisions (Slatkin 1991). As a result, if one disease is more prevalent in
one subpopulation, this disease will be associated with any alleles that are in high
frequency in this subpopulation. In order to use association tests to identify relevant
genes, we need to consider the possibility of population stratification and try to eliminate
the interference from this factor.
1.1.2 Second Aim-Explain the Genetic and Environmental Effects on Hypertension in African Americans
The second aim of this research is to use statistical methods to explain the genetic
and environmental effects on hypertension in African Americans. The influence of genes
on hypertension was initially studied by comparing adopted children with biologic
children, identical and non-identical twins, and by assessing kindreds (Williams et al
1988). Such studies have indicated, however, that half or less of the blood pressure
variation in the general population is explained by genetic factors.
To sort biological from environmental influences, this second stage of the
research project will utilize a twin study design. The classical twin study design relies on
studying twins raised in the same family environments, and the traditional design was
explicitly described in a very early paper published in Psychological Monographs by
Merriman (1924):
There are two distinct types of twins, fraternal and duplicate. The fraternal, being
of the two egg origin, should show no greater resemblance than ordinary

9
siblings....The duplicate, being of the one-egg origin, should show a very much
higher degree of resemblance than the fraternal (quoted in Reference 36, p.281).
Because monozygotic twins (MZ), called duplicate twins in the original paper,
result from the splitting of the same fertilized egg, such twins share 100% of their genes.
On average, dizygotic twins (DZ), which used to be called fraternal twins, share 50% of
their genes. If a researcher compares the similarity between monozygotic twins to the
similarity between dizygotic twins for a particular trait, then any excess likeness between
the monozygotic twins should be due to genes rather than environment. Researchers use
this method, and variations on it, to estimate the heritability of traits: The percentage of
variance in a population due to genes. Modern twin studies also try to quantify the effect
of a person's shared environment and unique environment on a trait.
Twin studies rely on several assumptions. The first one is random mating, which
means people are as likely to choose partners who are different from themselves as they
are to choose partners who are similar for a particular trait. If, instead, people tend to
choose mates like themselves, then DZ twins could share more than 50% of their genes-
and hence more similarities on genetically influenced traits-because they would receive
similar genes from their mothers and fathers. Another important assumption is that MZ
twins and DZ twins raised in the same homes experience equally similar environments.
However, it can be argued that parents, teachers, peers and others may treat MZ twins
more similarly than DZ twins (Kenneth S. Kendler et al. 1993).
Over the past few decades, genetic epidemiology has advanced rapidly with great
extension in the understanding of disease mechanism and with notable development of

10
new experimental technology and analytic methodology. Researchers in the field of
genetics epidemiology are working to identify the set of risk factors for disease and
predictors of treatment response that influence a person’s health for more effectively
treating and preventing disease. The development of genetic epidemiology will make it
possible to predict an individual’s medical status, and will greatly promote the
understanding of modern medicine in the 21st century.
1.2 Background
1.2.1 Hypertension in African Americans
Hypertension is clinically defined as a sustained elevation of the systolic (>140
mmHg) and/or diastolic (>90 mmHg) systemic arterial blood pressure. According to the
National Center for Health Statistics, African Americans, and people of African descent
in the United Kingdom, have among the highest rates of hypertension of any race or
ethnic group in the world. Thirty-five percent of African Americans have hypertension,
which accounts for 20% of the African American deaths in the United States - twice the
percentage of deaths among Whites from hypertension. In addition, African Americans
have greater risk for developing blood pressure-related target organ damage, which
includes heart failure, end-stage renal disease, fatal and nonfatal stroke, and overall heart
disease (Cooper R, Rotimi C. 1997).

11
1.2.2 Genetics of Hypertension
Hypertension is a multifactorial disorder arising from the influence of several
susceptibility genes and environmental stimuli. Evidence suggests that genes may
contribute to 30%-40% of the variation of blood pressure. The renin-angiotensin system
(RAS) plays a key role in the regulation of blood pressure. Genes that encode components
of the RAS are in turn thought to play a role in determining genetic susceptibility to
hypertension and have been intensively scrutinized. Up to the present at least, consistent
associations have been difficult to demonstrate. We sought to reexamine this question in a
large population-based sample of African Americans by focusing on the 3 primary genes
of the RAS: angiotensinogen (AGT), angiotensin I-converting enzyme (ACE), and the
angiotensin II receptor, subtype 1 (AGTR1).
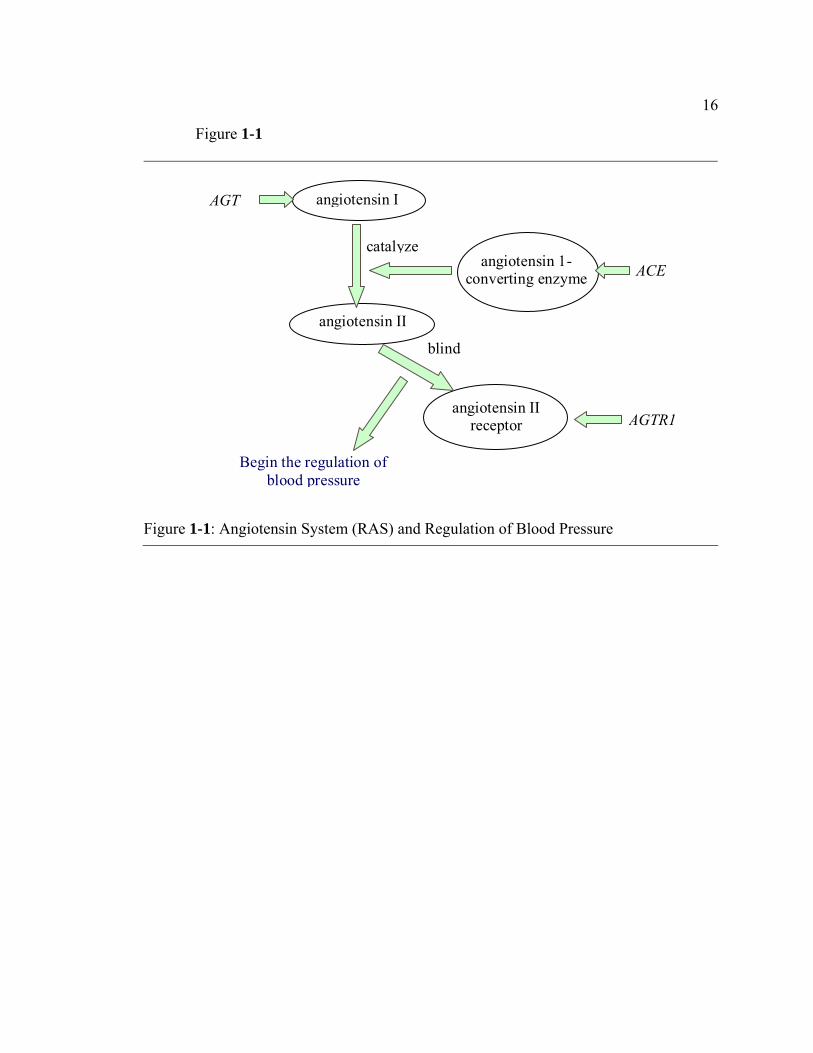
The biological mechanism for hypertension is described in Figure 1-1. The
angiotensinogen (AGT) gene produces angiotensinogen, a polypeptide primarily
produced by the liver. The angiotensinogen molecule is cleaved into angiotensin I by
renin, and then converted into angiotensin II by Angiotensin 1-Converting Enzyme
(ACE), which is encoded by the ACE gene. This product binds to its receptor, which is
encoded by AGTR1, and exerts physiologic effects on sodium homoeostasis and vascular
resistance, thus regulating blood pressure (Gardes et al. 1982).
1.2.2.1 Angiotensinogen (AGT) Gene
Angiotensinogen is the propeptide of angiotensin II, which acts as a
physiologically important regulator of blood pressure and electrolyte homeostasis, as well

12
as a growth factor of cardiac myocytes. The variant at codon 235 of the AGT gene
resulting in a methionine to threonine amino acid substitution (AGT M235T) was chosen
in this project as a genetic risk for essential hypertension.
The AGT gene has been cloned, the genomic sequence and its chromosomal
location determined. Only one copy of the gene is present in human and other
mammalian genomes. The human AGT gene consists of five exons, four introns, and
nontranslated-5’ and -3’ termini. In humans AGT is located on chromosome 1, in mice on
chromosome 8, and in the rat on chromosome 17.
The association of AGT with hypertension has been confirmed in many ethnic-
based studies, but not in all. In the first report linking a gene to hypertension, Jeunemaitre
et al. (1992) suggested that AGT M235T is related with essential hypertension and
increased concentration of plasma angiotensinogen in Whites, because the homozygous
TT was associated with an approximate 20% increase in plasma angiotensinogen and an
odds ratio for hypertension of 1.95 compared with the MM wild type. Another variant of
AGT, G-6A, located in the proximal promoter and in almost complete linkage
disequilibrium with M 235T, is an important site to consider. The A allele of this site
leads to a higher basal transcription rate of the AGT gene (Inoue et al. 1997), which
suggests a biological mechanism to explain why individual differences in the AGT gene
may predispose carriers to essential hypertension. Subsequent studies have shown that
M235T polymorphism is associated with high plasma angiotensinogen levels in subjects
who are homozygous for the T variant and hence associated with hypertension in some
European and Asian populations (Danser et al. 1998), but not all populations (Caulfield et
al. 1994; Staessen et al. 1999), including African Americans (Rotimi et al. 1994).

13
In 2003, Sethi et al. (2003) conducted a meta-analysis using one hundred twenty-
seven studies published between Jan 1992 and Mar 2002 and focused on the association
of the M235T polymorphism with angiotensinogen level and hypertension in the White,
Black and Asian subjects. This meta-analysis suggested M235T genotype was associated
with a stepwise increase in plasma angiotensinogen levels in White subjects and a
corresponding increase in risk of hypertension in both White and Asian subjects.
However, in the Black subjects, M235T genotype did not predict risk of hypertension,
and in addition the association between the plasma angiotensionogen levels and M235T
was not statistically significant in the Blacks.
1.2.2.2 Angiotensin I-Converting Enzyme (ACE) Gene
Angiotensin-Converting Enzyme gene is localized on the band 17q23 of 17th
chromosome in humans. The human ACE gene contains 26 exons interrupted by 25
introns and spans approximately 21 kb of DNA (Hubert et al. 1991; Erdos et al. 1990).
Studies on the structure of the human ACE gene revealed an
insertion(I)/deletion(D) polymorphism in a noncoding region, corresponding to the
presence or absence of a 287-base pair sequence in intron 16. Individuals homozygous
for the insertion polymorphism (II) have lower levels of ACE in plasma than do those
with the DD genotype. Extensive association studies have been done between this
insertion/deletion (I/D) polymorphism of the ACE gene and hypertension, with both
positive ((Barley et al. 1996, Morise et al. 1994, Borecki et al. 1997) and negative results
(Schmidt et al. 1993, Vassilikioti et al. 1996).

14
Zhu X et al. (2001) suggested another polymorphism located in the 5’ section of
the ACE gene, A-240T, was significantly associated with blood pressure in an African
population. It was reported by Zhu that A-240T accounts for 6% of the variance in ACE
concentration and the A allele of this locus is associated with the increased ACE
concentration in the African population. In a large study of family members from
Nigerians, African-Caribbeans, and African-Americans, A-240T was associated with
circulating ACE levels, but the relationship to hypertension was not consistent (Bouzekri
et al.).
1.2.2.3 Angiotensin II Receptor, Subtype 1 (AGTR1) Gene
There are two well-characterized receptors for angiotensin II, denoted as AGTR1
and AGTR2. Both receptor subtypes have strong affinity for angiotensin II and virtually
non for angiotensin I. AGTR1 receptors, the subtype that mediates most of the classic
effects of angiotensin II, are blocked by angiotensin receptor blockers (ARBs). The gene
for AGTR1 is located on human chromosome 3; the gene for AGTR2 is located on the X
chromosome. Both subtypes are typical of receptors that have 7 membrane-spanning
sequences and transmit signals internally via G-Proteins, but they share only 34% of their
amino acid sequences.
An increase in the frequency of the A1166C allele of the AGTR1 gene in
hypertensive individuals has been found in some populations (Katariina et al. 1999;
Castellano et al. 2003), but not in African Americans (Gainer et al. 1997). In 2003, the
analysis of Zhu et al. indicated another genetic marker, A44221G in the gene of AGTR1,

15
was associated with hypertension in a population of African Americans at a nominal level
of significance (P < 0.05). In our project, A44221G was chosen as the SNP in the AGTR1
gene to be genotyped.
1.2.3 Other Determinant Factors
Blood pressure is a very complex phenotype that is determined by the interaction
of multiple genetic and environmental factors. A number of environmental risk factors
have been identified in the development of hypertension, including obesity, salt intake
and alcohol intake. Familial aggregation of blood pressure and particularly a parental
history of hypertension are to some extent predictors of hypertension (He et al. 1997;
Overfield et al. 1995).
16
Figure 1-1
AGT
ACE
angiotensin I
angiotensin 1-converting enzyme
angiotensin II receptor
Begin the regulation of blood pressure
angiotensin II
catalyze
blind
AGTR1
Figure 1-1: Angiotensin System (RAS) and Regulation of Blood Pressure

Chapter 2
Data Collection and Analysis Procedure
2.1 Data Structure
This project is designed to address the question of hypertension in African
Americans using data from the Carolina African American Twin Study of Aging
(CAATSA). A total of 706 individuals were interviewed, which included 101
monozygotic twin pairs (MZ twins), 182 dizygotic twin pairs (DZ twins), 31 sibling pairs,
and 78 singletons.
A wide range of data was collected from these individuals including whether they
had been diagnosed as hypertensive. In addition, demographic information, such as
gender, age, Body Mass Index (BMI), systolic blood pressure and diastolic blood
pressure was collected.
2.2 DNA Collection and Genotyping
Buccal DNA was collected from cotton swabs as described (Vandenbergh et al.,
2002). The purified DNA was diluted to 50 ng/ul, and some samples that were low in
concentration were amplified by the Whole Genome Amplification method using the
REPLI-g kit from Qiagen, Inc. (Valencia, CA).
For ACE and AGTR1, SNPs were genotyped using the TaqMan PCR assays
(Applied Biosystems Inc.), C_11942507_10 and AGTR1, C_12080382_10, in a 96-well

18
microplate format. Briefly, 8 ng of DNA was amplified in a final volume of 20 lµ
containing 1 lµ of 20×MGB probes and primers, 10 lµ of 2 ×TaqMan Universal PCR
Master Mix, and 8.8 lµ distilled H2O. Amplification conditions were 95 oC for 10 min,
followed by 34 cycles of denaturation at 95 oC for 30 s, annealing at 58 oC for 30 s, and
extension at 72 oC for 1min. Allelic discrimination was performed using the ABI PRISM
7900 Sequence Detection System (Applied Biosystems Inc., Foster City, CA, USA).
For AGT, a melting curve method (McSNP) was used (Akey et al. 2001), which
distinguishes alleles based on differences in melting temperatures (Tm’s) of PCR products
after restriction digest (digested fragments having lower Tm’s than undigested parent
fragment). The following reagents were included in the reaction: a forward primer, 5’-
AGG CTG TGA CAG GAT GGA AG-3’; a reverse primer, 5’-CAG GGT GCT GTC
CAC ACT GGA CCC C-3’. 2 µl 10×PCR buffer, 0.4µl 10mM dNTP, 1.2µl 25mM
MgCl2, 0.5µl Taq enzyme and 9.9µl H2O were mixed with the primers in a total volume
of 20µl and amplification was carried out on 50 ng genomic DNA in a Gene Amp 9700
(Applied Biosystems, Inc.) under the following conditions: 35 cycles of 95oC for 60
seconds, 68oC for 60 seconds, and 72oC for 60 seconds, followed by one cycle of 9
minutes at 72oC. After PCR, the samples were digested with 1 unit of TthШ restriction
enzyme for 2 hours. A 20 µl aliquot of digested product was mixed with 30 µl of 14%
DASH solution. The 14% DASH solution is comprised of 1.4ml Formamide, 8.6ml de-
ionized H2O, and 2µl SYBER green 1. A melting curve was generated on an ABI 7300
thermocycler. The uncut allele “T” produced a fragment of PCR amplified DNA with a

19
Tm = 81oC and the cut allele “C” produced two fragments with a peak in the melting
curve at 75oC.
2.3 Analysis Procedure
There are three steps in this project. The first step is to investigate the association
between hypertension status and the genotypes of three single nucleotide polymorphism
(SNP) sites chosen in the three candidate genes with the aim to find the gene(s)
associated with high blood pressure in the population of African Americans. For this step,
independent individuals need to be used, which means the samples used here should only
consist of a single random individual from each pair of twins or siblings, plus singleton
individuals. The total sample size for independent individuals is 392. Four individuals are
removed because their information of hypertension status is missing. The sample of 388
individuals includes 215 non-hypertensive subjects and 173 hypertensive subjects.
Because the application of an association test is compromised by false or
nonreplicable findings, partially due to population stratification, which caused unlinked
markers to show association with disease, a correction strategy has been used in this
project. It has been proposed that false positive associations due to stratification can be
controlled by genotyping a few dozen unlinked genetic markers throughout the genome.
These markers are often called “genomic control (GC) markers”. Under the assumption
of no association between GC markers and disease and no population stratification, the
2χ statistics of association test between the ith GC marker and disease status follows a
Chi-square distribution with one degree of freedom. The sum of the 2χ statistics of n GC

20
markers follows a Chi-square distribution with n degrees of freedom. Using this method,
we can easily test whether population stratification is present in the sample being
analyzed.
A chi-square test was performed to test whether there is any association between
the genotype and hypertension status for each gene. Genotype was a categorical variable
with three categories (e.g. AA, AT, TT), while hypertension had two categories, so there
is a 3 2× table for each gene. An odds ratio was also calculated to see whether a certain
allele is more common in the hypertensives than the normotensives.
Logistic regression analysis was used to confirm the results of association tests
and to explain the relationship between hypertension status and the genotype of relevant
gene(s), taking gender, age, and Body Mass Index (BMI) into account. Logistic
regression was used here not only to rank the relative importance of independent
variables, but also to assess interaction effects and even predict the hypertension status
for an individual based on the individual’s genotype and the information of other
independent variables from this person. The results of chi-square tests and logistic
regression will be shown in the chapter three.
The second step is to build a general linear mixed model to explain the effect of
particular relevant gene(s) and the effect of other determinant factors on blood pressure in
African Americans. To be fitted with twin data, this model can also be regarded as a two-
level multilevel linear model as individuals are treated as level-one units and families are
treated as level-two units. Introduced by Guo et al. in 2002, the application of general
linear mixed models in genetic epidemiology is still relatively new and exploratory. A
mixed model has the advantage of handling complex family structure; therefore this

21
model is regarded as a promising alternative to the traditional correlation analysis,
especially in the twin studies. The specific approach and results will be shown in chapter
four.
The last step of this project is to use structural equation modeling (SEM) to
estimate the genetic and environmental effects on blood pressure in the population of
African Americans by using twin data. The SEM is commonly used in twin studies
because it allows researchers to estimate the environmental effects and genetic effects as
latent variables by comparing the information gained from MZ twins and DZ twins. The
most significantly instructive point of using the SEM in our project is that the measured
genotype of the relevant gene(s) that has been detected by association tests in the first
step will be added into the traditional classic SEM with the aim to estimate the effect of a
particular genetic locus (or loci) separately from the effect of unmeasured genetic factors.
This innovation will make this study of significance as it is the first time for researchers
to build a structural equation model for hypertension with measured genotype of relevant
gene(s) included. The specific approach and results will be shown in chapter five.
It is important to explain the similarity and difference of performing general linear
mixed model and structural equation model (SEM) here. The common feature shared by
SEM and the general linear mixed model is that they both estimate the effects of
determinant factors on a trait and both of them can be used to decompose the variance of
a trait to the heritability and environmental factors. However, there are distinct
characteristics of these two methods. SEM, commonly used to estimate the effects of
latent predictor variables on the response variable, is usually conceived in terms of
theoretical or latent constructs, which cannot be directly measured. Compared with the

22
complicated relationship between any two variables involved in a process constructed by
SEM, the general linear mixed model is good at explaining the direct causal relationship
between the measurable predictor variable and response outcome variable by a concise
linear equation, which is much easier to be interpreted than a diagram given by SEM.

Chapter 3
Association Test and Logistic Regression
Before any analysis can be performed, the Hardy-Weinberg equilibrium needs to
be checked in the sample that is going to be used. The Hardy–Weinberg law states that if
an infinitely large, random mating population is free from outside evolutionary forces (i.e.
mutation, migration and natural selection), then after one generation of random mating,
the genotype frequencies at a single gene locus will become fixed at a particular
equilibrium value. In addition, those equilibrium frequencies can be represented as a
simple function of the allele frequencies at that locus.
In the simplest case of a single locus with two alleles A and a with allele
frequencies of p and q, respectively, the Hardy–Weinberg law predicts that the genotypic
frequencies for the AA homozygote to be p2, the Aa heterozygote to be 2pq and the other
aa homozygote to be q2. The result of Hardy-Weinberg tests show that the three SNPs
used in this study were in Hardy-Weinberg Equilibrium (p-values > 0.22) in the subjects
studied.
3.1 Population Stratification
We used the method of Pritchard and Rosenberg (Pritchard et al, 2000) to assess
the possibility of population stratification in our hypertensive and normotensive
volunteers. This test statistic was computed with STRAT software
24
(<http://pritch.bsd.uchicago.edu/software.html). Based on the genotype data of 90
unlinked markers, we were allowed to determine whether cases and controls are
appropriately matched by summing the χ2 test statistic for case-control comparisons at
each of the unlinked stratification test loci. If mismatched, they are potentially subject to
stratification error.
After the potential for population stratification evaluated by the program STRAT,
no significant difference was found between hypertensive subjects and control subjects
(χ2 = 83.85, df = 90, P = 0.662). Thus, use of this entire sample in an analysis of
hypertension should not be subject to stratification artifact.
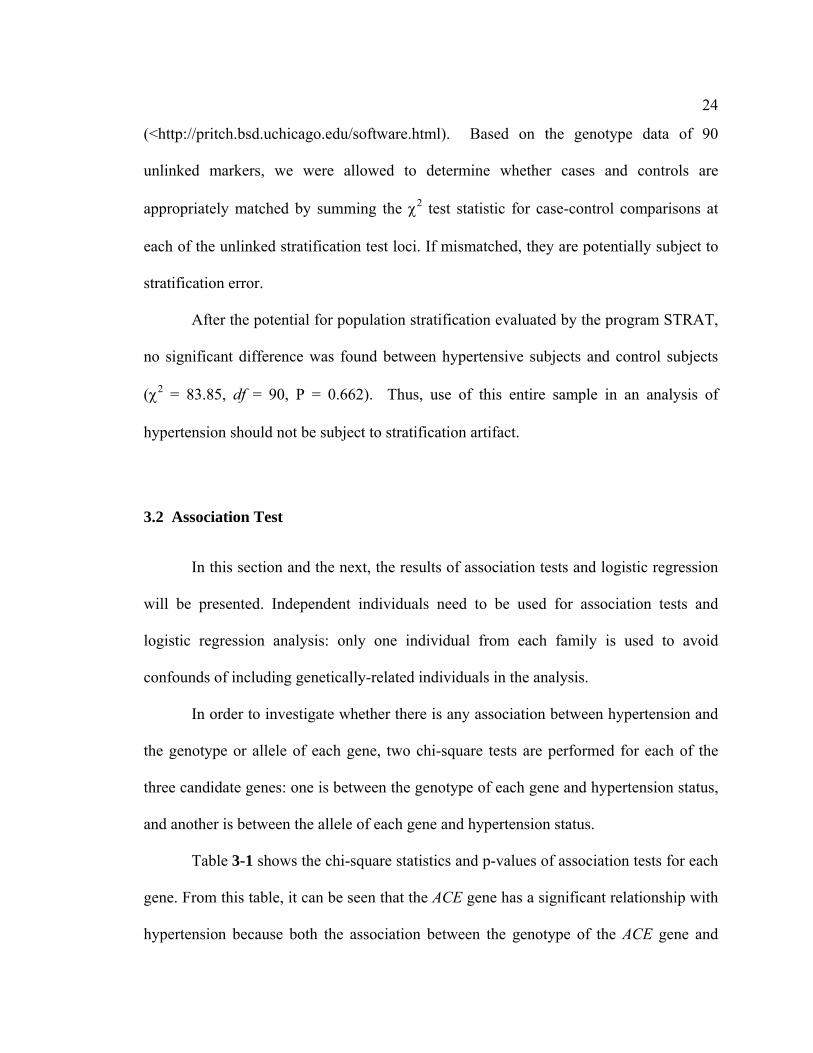
3.2 Association Test
In this section and the next, the results of association tests and logistic regression
will be presented. Independent individuals need to be used for association tests and
logistic regression analysis: only one individual from each family is used to avoid
confounds of including genetically-related individuals in the analysis.
In order to investigate whether there is any association between hypertension and
the genotype or allele of each gene, two chi-square tests are performed for each of the
three candidate genes: one is between the genotype of each gene and hypertension status,
and another is between the allele of each gene and hypertension status.
Table 3-1 shows the chi-square statistics and p-values of association tests for each
gene. From this table, it can be seen that the ACE gene has a significant relationship with
hypertension because both the association between the genotype of the ACE gene and

25
hypertension status and the association between the allele of the ACE gene and
hypertension status prove to be statistically significant with p-values for the two chi-
square tests less than 0.05. There is insignificant evidence to suggest an association
between AGTR1 or AGT and hypertension status.
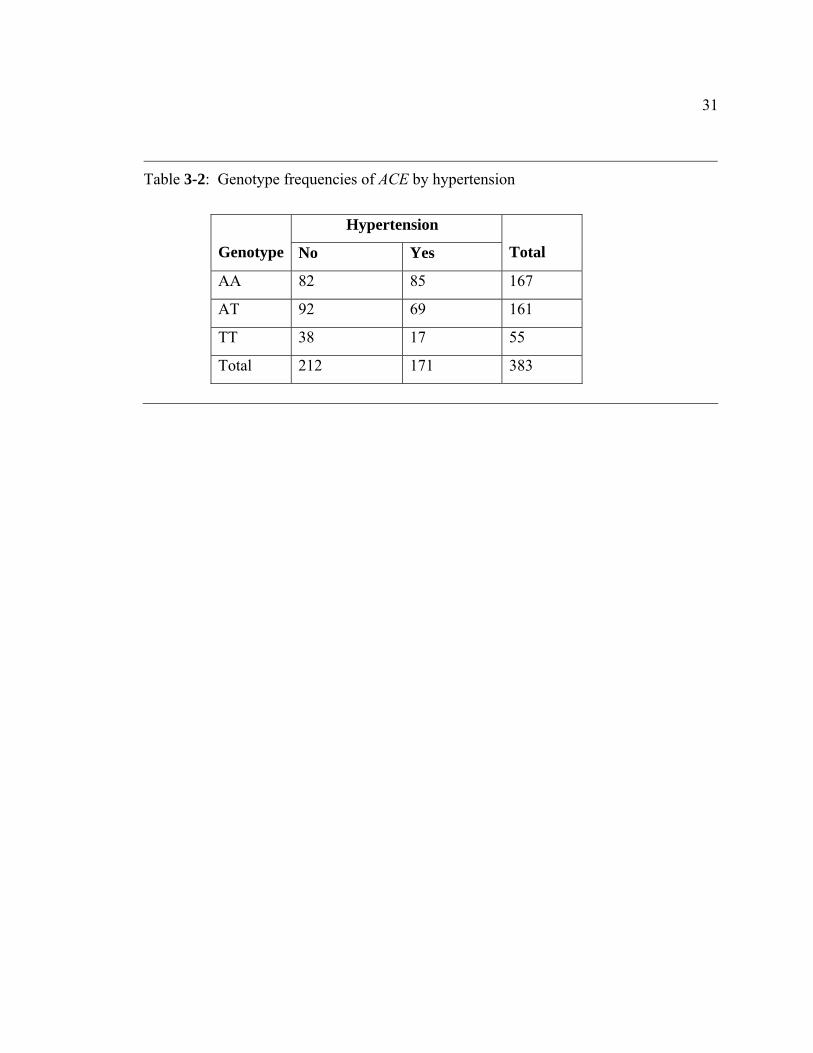
Figure 3-1 shows the distribution of ACE genotype among the hypertension group
and non-hypertension group. Table 3-2 presents genotype of the ACE gene by
hypertension status. As there are five individuals with ACE genotype missing, 383
independent individuals were included in the chi-square tests here. Among these
individuals, there are 167 subjects with AA genotype, 161 subjects with AT genotype,
and 55 subjects with TT genotype.
The different distribution of ACE alleles in the normotensive and hypertensive
subjects is presented in Figure 3-2 and Table 3-3 . If allele A is present, the odds of
having hypertension is 0.93; while with allele T present the odds of having hypertension
is 0.61.
The estimated odds ratio of carrying A allele between hypertensive group and
normotensive group is 1.52 with a 95% confidence interval of (1.13, 2.06). The odds
ratio result confirms that there is an association between alleles of ACE and hypertension
status because the 95% confidence interval does not include one. This odds ratio means
that the odds of having A allele in the hypertension group is 1.52 times greater than the
odds of in the non-hypertension group.

26
3.3 Logistic Regression
To build a logistic regression model, the dependent variable must be transformed
into a logit variable by calculating the natural log of the odds of the dependent variable
occurring or not. Consequently, logistic regression estimates the probability of
hypertension occurring based on the information of the independent variables. One
notable feature of logistic regression is that it is used to calculate changes in the log odds
of the dependent variable, but not the changes in the dependent variable itself.
In this project, the full model for the logistic regression analysis is
Here iπ is used to denote the probability for observing hypertension in the ith person. If
we use iY to represent the hypertension status for the ith person, iY is equal to one for
hypertensives and equal to zero for normotensives. Thus we have
According to the definition of expectation, iπ is also the expected value of iY ,
which is denoted as
This logistic regression model includes the main effects for the three candidate
genes and all the two-way interactions between genes, with consideration of the effects of
gender, age, and BMI on hypertension status. Among these independent variables,
BMIagegendergenegenegenegenegenegene
genegenegenei
i
+++×+×+×+
++=⎟⎟⎠
⎞⎜⎜⎝
⎛−
323121
3211
lnπ
π(3.1)
( )1== ii YPπ (3.2)
{ }ii YE=π (3.3)

27
genotype and gender are categorical variables with three and two categories respectively,
and age and BMI are continuous. The difficulty in interpreting the higher order
interaction leads to the lack of practical significance, and that is the reason why three-
way or four-way interactions were not included into the logistic regression model.
After running this model, if any independent variables prove not to be significant,
these variables would be removed from the model. Pearson and Deviance statistics would
be used to judge the goodness-of-fit for reduced models. The best model that was found
after backwards logistic regression was the model containing only the ACE gene as the
predictor variable. The model was written as
As there were three categories for the genotype of ACE, SAS would create two
dummy variables, X1 and X2, by default: X1=1 if genotype of ACE was AT, zero
otherwise; X2=1 if genotype of ACE was TT, zero otherwise. Thus the logistic regression
model could also be written as
SAS was used to fit this model to the dataset of independent individuals. The
convergence criterion is satisfied, which means that it is appropriate to find the maximum
likelihood estimates. After that one must check the goodness-of-fit for this model. As the
model is a saturated model, both the deviance statistics and the Pearson statistics are zero.
Table 3-4 shows the model fit statistics. Comparing the best fitting model to the reduced
model with only an intercept, the likelihood-ratio statistic is
ACEterceptini
i +=⎟⎟⎠
⎞⎜⎜⎝
⎛−ππ
1ln (3.4)
221101ln XX
i
i βββπ
π++=⎟⎟
⎠
⎞⎜⎜⎝
⎛−
(3.5)

28
with 2 degree of freedom. As the p-value is 2 22( ) 0.0276P Gχ ≥ ∆ = , the model with the
ACE gene is significantly better than the model with only an intercept. In addition, the
ACE gene proved to be statistically significant in this logistic regression model
(Wald 2 6.9χ = ; df=2; p-value= 0.0316).
Table 3-5 shows the analysis of maximum likelihood estimates for the
coefficients in the model. With the estimated coefficients above, the logistic regression
was
Thus the probability of an individual having hypertension given a certain ACE
genotype can be estimated by the formula
For example, the predicted probability of an individual having hypertension given
that the ACE genotype is AA is
The predicted probability of an individual having hypertension given that the ACE
genotype is AT is
( ) ( ) 178.7375.519553.526log2log2 2mod1mod2 =−=−−−=∆ elel LLG (3.6)
21 8401.03236.00359.01
ln XXi
i −−=⎟⎟⎠
⎞⎜⎜⎝
⎛−ππ
(3.7)
( )( )21
21
8401.03236.00359.0exp18401.03236.00359.0exp
XXXX
i −−+−−
=π (3.8)
( ) ( )( ) 51.0
0359.0exp10359.0exp01 21 =
+===== XXYP iπ (3.9)
( ) ( )( ) 43.0
3236.00359.0exp13236.00359.0exp0,11 21 =
−+−
===== XXYP iπ (3.10)

29
The predicted probability of an individual having hypertension given that the ACE
genotype is TT is
Thus, people with genotype TT are the least likely to be hypertensive and people
with genotype AA are the most likely to be hypertensive.
SAS also provided the odds ratio estimates shown in Table 3-6. The point
estimate of the odds ratio of having hypertension between AT and AA is 0.724 (95% CI,
0.468-1.118). As this confidence interval contains one, there is no evidence to show that
this odds ratio between AT and AA is significantly different from one. The point estimate
of the odds ratio of having hypertension between TT and AA is 0.432 (95% CI, 0.226-
0.825). As this interval does not contain one, it can be concluded that the odds between
the TT and AA groups are significantly different from each other. The odds of having
hypertension given AA genotype is 2.31 times greater than the odds given TT genotype,
which means that an individual is 131% more likely, on the odds scale, to have
hypertension if he or she has two A alleles rather than two T alleles.
( ) ( )( ) 31.0
8401.00359.0exp18401.00359.0exp1,01 21 =
−+−
===== XXYP iπ (3.11)

30
Table 3-1: Chi-square statistics and p-values for association tests between the genotype of each gene and hypertension, and between the allele of each gene and hypertension.
Gene
Chi-square Statistic for the
association between
genotype and hypertension
P-value
Chi-square Statistic for
the association between
allele and hypertension
P-value
ACE 7.0495 0.0295 7.4819 0.0062
AGTR1 0.9119 0.6338 0.1908 0.6623
AGT 1.3459 0.5102 1.4081 0.2354
31
Table 3-2: Genotype frequencies of ACE by hypertension
Hypertension
Genotype No Yes
Total
AA 82 85 167
AT 92 69 161
TT 38 17 55
Total 212 171 383

32
Table 3-3: Alleles frequencies of ACE by hypertension
Hypertension
Allele No Yes
Total
A 256 239 495
T 168 103 271
Total 424 342 766

33
Table 3-4: Model fit statistics
Criterion Intercept Only (Model 1) Intercept and ACE (Model 2)
AIC 528.553 525.375
SC 532.501 537.219
-2log L 526.553 519.375

34
Table 3-5: Analysis of maximum likelihood estimates
Parameter df Estimate Standard Error Wald Chi-Square P-value
Intercept 1 0.0359 0.1548 0.0539 0.8164
ACE (X1) 1 -0.3236 0.2221 2.1233 0.1451
ACE (X2) 1 -0.8401 0.3303 6.4696 0.0110

35
Table 3-6: Odds ratio estimates
Effect Point Estimate 95% Wald Confidence Interval
ACE AT vs AA 0.724 (0.468,1.118)
ACE TT vs AA 0.432 (0.226,0.825)

36
Figure 3-1
0%
10%
20%
30%
40%
50%
60%
AA AT TT
Genotype
Perc
ent f
requ
ency
NormHyper
Figure 3-1:Genotype frequency (%) of the ACE gene in the normotensive and hypertensive subjects

37
Figure 3-2
0%10%20%30%40%50%60%70%80%
A T
Allele
Perc
ent f
requ
ency
NormHyper
Figure 3-2:Allele frequency of the ACE gene in the normotensive and hypertensive subjects.

Chapter 4
General Linear Mixed Model
The results of the chi-square tests and logistic regression have revealed a
significant association between the ACE gene and hypertension; however, the pathway
through which ACE exerts an effect on hypertension still remains unclear. In addition, it
is important to estimate the average blood pressure based on the different genotypes of
the ACE gene and other independent demographic variables, such as sex. To achieve
these aims, two ordinary regressions will be performed with a mixed model by using
systolic blood pressure, and diastolic blood pressure, as the response variables,
respectively.
4.1 Using the General Linear Mixed Model for Twin Data
The General Linear Mixed Model refers to linear models with both fixed and
random effects: the fixed effects represent parameters that are the same for all individuals,
and the random effects represent parameters that are allowed to vary over different
individuals, even in one family. This is a powerful approach for twin data in that it
permits estimation of the significance of fixed effects while permitting error structures to
vary by pair type (i.e. MZm = , DZd = , and siblings = ). The Linear Mixed Model is
represented in its most general form as
εβ ++= uZXY , (4.1)

39
where X is the matrix of independent fixed variables and β is the corresponding vector
of fixed effects parameters. Z is the matrix of group-specific random effects (e.g. family-
specific in a twin study) with the vector of random effects parameters u, where u is
normally distributed with mean zero and variance G. The components of G represent the
variability between groups (e.g. families). The within-family error is represented by ε
where the vector ε is normally distributed with mean zero and variance R.
For our project, we want to model the effect of ACE on SBP and DBP,
considering the effect of sex and BMI. Thus, the model 4.1 could be expanded in our
situation as
where Yij is the blood pressure for the i-th individual (i =1, 2) in the j-th pair (j=1, … , N).
The fixed effect of sex is denoted by X1ij (X1=1 for males, 0 for females). X2ij and X3ij are
vectors of the genetic components indicating the genotype of the ACE gene, such that
The matrix Z contains indicator variables for each sibling pair, a random effect,
such that
The vector u has N components, one for each twin or sibling pair, such that
( )TNuuuu ,,, 21 L= . The ju are deviations from the mean response for each sibling pair;
thus it is possible to estimate the mean response for each sibling pair. Further, the
ijjjijjijjijjjij ZuXXXY εββββ +++++= 3322110 (4.2)
⎩⎨⎧
=01
3ijXIf AA is present otherwise ,
If TT is present otherwise ⎩
⎨⎧
=01
4ijX
(4.3)
[ ]⎩⎨⎧
== Nj ZZZji
Z ,,,Z and , otherwise0pairth - in the is individualth - theif1
21 K (4.4)

40
variance of the ju is 2uσ and the covariance matrix for the vector u is G , an NN ×
matrix with 2uσ on the diagonal. That is, Var [ ] Nu IGu 2σ== is the matrix that estimates
the covariance between sibling pairs.
The error in each individual’s Eq. 4.2 is ijε . As each sibling group consists of two
individuals, the vector of residuals has N2 components: ( )TNN 2122122111 ,,,,, εεεεεεε L= .
The variance of the ijε is 2εσ , and the covariance matrix of the vector ε is the NN 22 ×
diagonal matrix NIR 22εσ= . This quantifies the covariance between the siblings within a
sibling pair.
To incorporate the sibling pair type, let Yij(t) denote the i-th individual in the j-th
sibling pair within the t-th sibling pair type, where t=m (MZ twin), d (DZ twin), or f (full
sibling). As a result, the random effects, uj, can then grouped by sibling type,
when there are nm MZ pairs, nd DZ pairs, and nf full sibling pairs and N = nm+nd+nf. As
the three sibling groups are distinct, they are statistically independent, so there is an
estimated variance for each sibling pair type in the covariance matrix G , such that
where tnI is an identity matrix of dimension tn . Similarly the vector of residuals is
partitioned by sibling pair type,
( ) ( ) ( ) ( ) ( ) ( )( )Tfnfdndmnm fdmuuuuuuu ,,,,,,,, 111 LLL= (4.5)
( )
( )
( )⎥⎥⎥
⎦
⎤
⎢⎢⎢
⎣
⎡
=
f
d
m
nfu
ndu
nmu
II
IG
2
2
2
000000
σσ
σ
(4.6)

41
The covariance within each sibling pair nested in a pair type is represented
by 2)(tεσ , t=m, d, f. The NN 22 × covariance matrix R is thus
4.2 Intra-Class Correlation Calculation
Now for each cluster type, we have an estimate of variance between twin/sibling
pairs ( 2)(tuσ ) and within twin/sibling pairs ( 2
)(tεσ ). From these, an estimate of the intra-
class correlation can be made, which is the proportion of total variability attributed to
variability between twin/sibling pairs:
The intra-class correlation is a measure of the degree of similarity within a pair
and is often interpreted as the correlation between two individuals within a pair. Two
models, the additive genetic model and the dominant genetic model, are commonly used
to partition the intra-class correlation between two individuals in one twin or sibling pair
into genetic factors and environmental factors. The additive genetic model includes
proportion of variance due to additive genetic effect ( 2xh ) and variance for environmental
factors among twins ( 2,xtc ) and among siblings ( 2
,xsc ) separately. Recognizing that DZ
( ) ( ) ( ) ( ) ( ) ( ) ( ) ( )(( ) ( ) ( ) ( ) )Tfnfnff
dndnddmnmnmm
ff
ddmm
212111
212111212111
,,,
,,,,,,,,
εεεε
εεεεεεεεε
L
LL= (4.7)
( )
( )
( )⎥⎥⎥
⎦
⎤
⎢⎢⎢
⎣
⎡
=
f
d
m
nf
nd
nm
II
IR
22
22
22
000000
ε
ε
ε
σσ
σ (4.8)
2)(
2)(
2)(
ttu
tut
εσσσ
ρ+
= (4.9)

42
twins and full siblings share half the genetic factors whereas MZ twins share all genetic
factors, we can write a system of equations for additive genetic model as follows:
The dominant model includes a dominant genetic effect ( 2xd ), an additive genetic
effect ( 2xh ), and an environmental effect for twin pair or sibling pair. The system of
equations for dominant genetic model can be written as:
where 2,xtc represents the environmental effects among twins.
In calculating the heritability and environmental factors, it is useful to keep in
mind that the intra-class correlations are calculated from estimated variance, and
consequently there is some error. With the within-cluster correlation calculated from
Eq. 4.9, the variance due to heritability and environmental factors can be solved
algebraically as both Eq. 4.10 and Eq. 4.11 have three equations and three unknowns.
2 2, ( ),
2 2, ( ),
2 2, ( ),
1212
x t x m x
x t x d x
x s x s x
h c
h c
h c
ρ
ρ
ρ
+ =
+ =
+ =
(4.10)
( )
( )
( ) xsxx
xdxtxx
xmxtxx
dh
cdh
cdh
,22
,2,
22
,2,
22
41
21
41
21
ρ
ρ
ρ
=+
=++
=++
(4.11)

43
4.3 Result
The general linear mixed models built for SBP and DBP can be represented by
the simple format of the linear equation as response=intercept+ ACE+ sex+ error, where
response can be SBP or DBP. The result of the test for the fixed effects is shown in
Table 4-1. By taking sex into account, ACE has a statistically significant effect on
systolic blood pressure (p-value=0.0260) but not on diastolic blood pressure (p-
value=0.1482). Additionally sex has a significant effect on SBP (p-value=0.0120) but not
on DBP (p-value=0.2570).
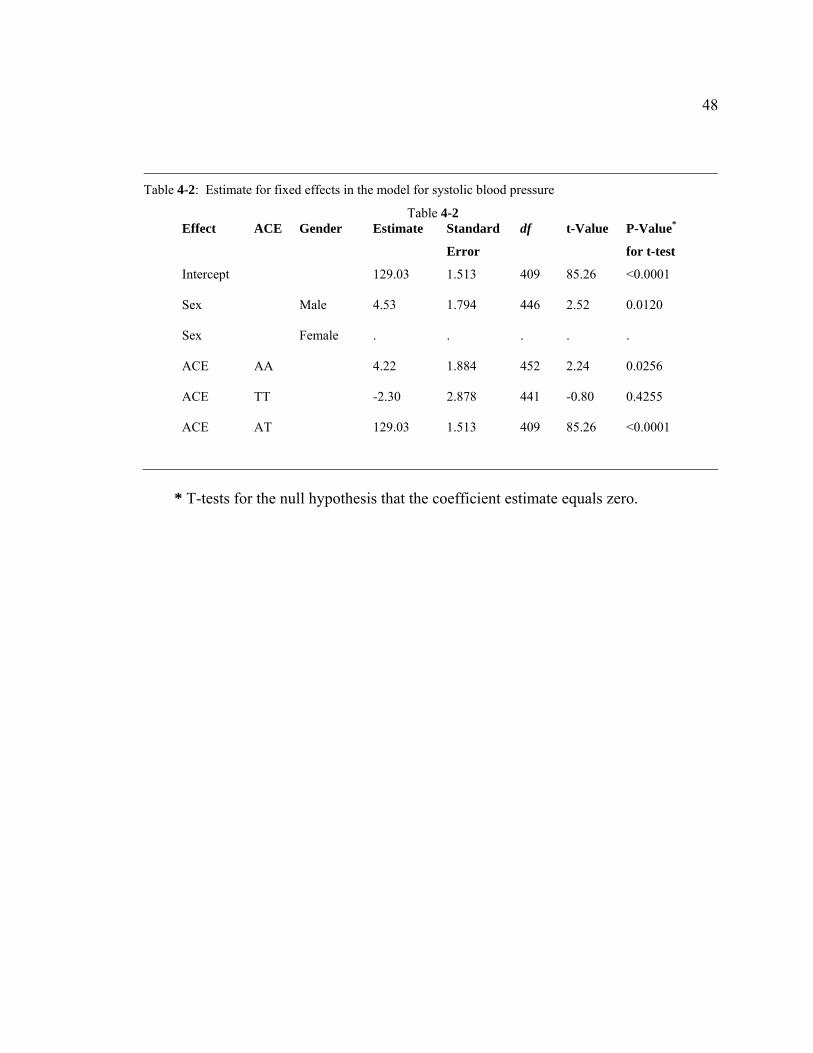
The estimates for fixed effects in the model constructed for systolic blood
pressure are shown in Table 4-2. After the estimates of coefficients were plugged into
equation 2, the linear model for the systolic blood pressure can be written
as 321 3.222.453.403.129 XXXSBP −++= . Using this model, the average systolic blood
pressure can be estimated based on the values of predictor variables.
Table 4-3 shows the least squares means of Systolic blood pressure based on
different genotypes of the ACE gene. The estimate values of SBP for individuals with AA,
TT and AT genotypes are 135.51 mm Hg, 128.99 mm Hg and 131.29 mm Hg,
respectively. Table 4-4 presents the difference of least squares means of SBP between
individuals with different genotype. From this table, it can be seen that the SBP of
individuals carrying two A alleles is significantly higher than the individuals with TT
genotype (p-value=0.0270), and the individuals with AT genotype (p-value=0.0256).
However, there is no significantly difference in SBP between individuals with AT
genotype and TT genotype (p-value=0.4255). More specific, on average the SBP of an

44
individual with AA genotype for the ACE locus is 4.22 mm Hg higher than the blood
pressure of an individual whose genotype is AT and 6.51 mm Hg higher than for an
individual carrying two T alleles.
The variances of random effects from the mixed model of systolic blood pressure
and diastolic blood pressure are presented in Table 4-5 . Eq. 4.9 was used to calculate the
intra-class correlations between the two individuals in a pair for MZ twin-pairs, DZ twin-
pairs and sibling-pairs separately and presented the results in Table 4-6.
For systolic blood pressure, the intra-class correlation for DZ twins is more than
half of the correlation between MZ twins, which suggests the additive genetic model is a
suitable genetic model to use. According to the additive genetic model (Eq. 4.10), we
calculated the variances due to additive genetic effect ( 2h ), environmental factors among
twins ( 2tc ) and siblings ( 2
sc ) and the results are shown in Table 4-7 . For diastolic blood
pressure, however, the intra-class correlation for DZ twins is far less than half of the
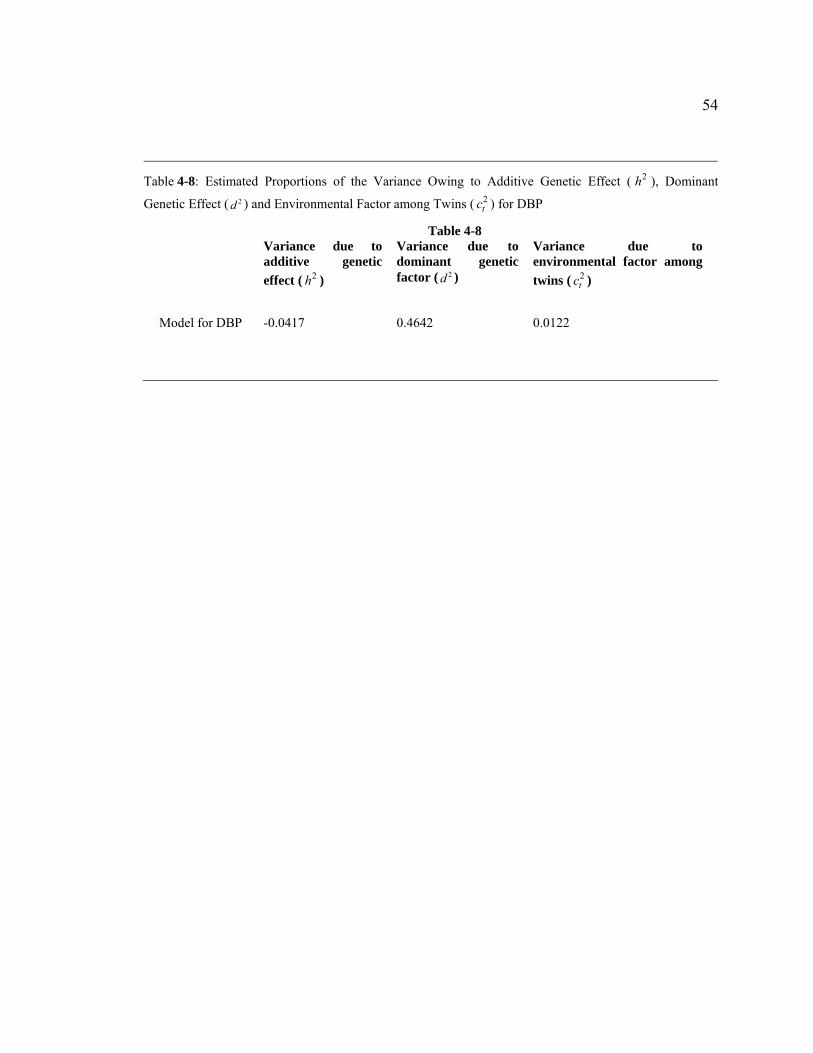
correlation between MZ twins, which suggests the dominant genetic model is more
applicable. Using dominant genetic model, we calculated both additive ( 2h ) and
dominant ( 2d ) genetic effects for twins and siblings plus environmental factors among
twins (Table 4-8 ). The environmental effects are small regardless of the type of clusters,
at most a few percentage points of the total effects, while genetic factors account for large
proportion of the variation of both SBP (55.52%) and DBP (42.25%).
Using an additive genetic model, we decomposed the variance of SBP into the
variance due to the additive genetic effect, and environmental factors among twins and
siblings. The environmental effects, only a few percentage points of the total effects, are

45
small compared to the proportion of additive genetic component. Similarly, we
decomposed the variance of DBP into the variance due to the additive genetic effect, the
dominant genetic effect and environmental factors among twins. For DBP, the dominant
genetic effect component accounts for the largest proportion of the variation, while the
variance due to additive genetic effect is close to zero in the absolute value. All these
results suggests that, compared to other components, the additive genetic effect and the
dominant genetic effect are two components of overwhelming importance for the
variance of SBP and the variance of DBP respectively.
Several points from this illustration are noteworthy. First, a general liner mixed
model has the advantage over an association test and logistic regression that both
individuals from a twin-pair or sibling-pair can be included into analysis because general
linear mixed model allows us to estimate the covariance between the individuals from
one family. In contrast, in order to meet the assumption of independence, only one
randomly chosen individual from each twin-pair or sibling-pair can be used in an
association test and logistic regression. (In this type of data, while the individuals within
a pair are correlated due to genetic relatedness, the individuals across pairs are considered
independent). As a result, when we use the general liner mixed model, the sample size
not only increases greatly, but it also employs a great variety of relationships between
individuals, which make it possible for us to study the genetic and environmental effect
on the difference between individuals within the same twin or sibling pair.
It is worth noticing that we could use Generalized Estimating Equation (GEE)
with the binary variable, hypertension as response variable to expand the logistic
regression by including correlated individuals in a pair. However, we would be assuming

46
the same covariance structure for MZ twins, DZ twins and siblings. In contrast, the
general linear mixed model allows us to estimate covariance parameters for each pair
type independently.
The second remark is that in the general linear mixed model, the continuous
variable, blood pressure, is used as the response variable instead of hypertension status as
was used in the logistic regression. Hypertension is diagnosed by checking individual’s
blood pressure, so hypertension status is a variable created by splitting the continuous
variable of blood pressure into two categories at some cut-off point. Thus, using
hypertension status will lead to a loss of information contained in the variable of blood
pressure and the statistical power will be drastically reduced as a result. In addition, using
blood pressure as response variable, the relationship between blood pressure and
determinant factors can be represented with ordinary linear regression, which is much
easier to interpret and be accepted by others than the logistic regression.
The third remark is that a general linear mixed model can be used to decompose
variance of a trait to the heritability and environmental factors, which is a great help for
researchers to estimate the genetic and environmental influence on the trait. This aim is
usually achieved by constructing structural equation models (Neale and Cordon, 1992),
which have been established as the main methodological approach for behavioral genetic
analysis.

47
Table 4-1: Tests of significance for fixed effects in the model for systolic blood pressure and diastolicblood pressure
Table 4-1 Model for Systolic Blood Pressure (SBP) Model for Diastolic Blood Pressure (DBP)
Effect Num df Den df F-Value P-Value Num df Den df F-Value P-Value
ACE 2 445 3.68 0.0260 2 434 1.92 0.1482
Sex 1 446 6.37 0.0120 1 454 1.29 0.2570
48
* T-tests for the null hypothesis that the coefficient estimate equals zero.
Table 4-2: Estimate for fixed effects in the model for systolic blood pressure
Table 4-2 Effect ACE Gender Estimate Standard
Error
df t-Value P-Value*
for t-test
Intercept 129.03 1.513 409 85.26 <0.0001
Sex Male 4.53 1.794 446 2.52 0.0120
Sex Female . . . . .
ACE AA 4.22 1.884 452 2.24 0.0256
ACE TT -2.30 2.878 441 -0.80 0.4255
ACE AT 129.03 1.513 409 85.26 <0.0001

49
Table 4-3: Least squares means of systolic blood pressure based on different genotypes of the ACE gene
Table 4-3
Effect Genotype Estimate Standard Error
ACE AA 135.51 1.430
ACE TT 128.99 2.601
ACE AT 131.29 1.370

50
Table 4-4: Differences of least squares means of systolic blood pressure between different genotypes
Table 4-4
Difference Estimate Standard Error df t-Value P-value for t-test
AA and AT 6.51 2.935 438 2.22 0.0270
AA and TT 4.22 1.884 452 2.24 0.0256
TT and AT -2.30 2.878 441 -0.80 0.4255

51
Table 4-5: Variances of random effects from the mixed model of systolic blood pressure and diastolic blood pressure
Table 4-5
Model for Systolic Blood Pressure Model for Diastolic Blood Pressure Estimate Standard Error Estimate Standard Error
2( )mµσ (MZ twins) 192.77 42.139 57.89 14.990
2( )dµσ (DZ twins) 109.65 32.173 16.00 12.115
2( )sµσ (siblings) 150.43 103.140 11.23 28.962
2( )e mσ (MZ twins) 151.44 22.807 75.28 10.992
2( )e dσ (DZ twins) 278.62 31.383 132.96 14.902
2( )e sσ (siblings) 280.61 88.684 106.75 34.472

52
Table 4-6: Intra-Class Correlations Calculated for MZ twin-pairs, DZ twin-pairs and siblings
Table 4-6 Type of genetic relatedness
Model for Systolic Blood Pressure
Model for Diastolic Blood Pressure
MZ twins 0.5600 0.4347
DZ twins 0.2824 0.1074
Siblings 0.3490 0.0952

53
Table 4-7: Estimated Proportions of the Variance Owing to Additive Genetic Effects ( 2h ) and
Environmental Factors among Twins ( 2tc ) and Siblings ( 2
sc ) for SBP.
Table 4-7
Variance due to additive genetic effect ( 2h )
Variance due to environmental factor among twins ( 2
tc )
Variance due to environmental factor among siblings ( 2
sc ) Model for SBP 0.5552 0.0048 0.0714
54
Table 4-8: Estimated Proportions of the Variance Owing to Additive Genetic Effect ( 2h ), Dominant
Genetic Effect ( 2d ) and Environmental Factor among Twins ( 2tc ) for DBP
Table 4-8 Variance due to
additive genetic effect ( 2h )
Variance due to dominant genetic factor ( 2d )
Variance due to environmental factor among twins ( 2
tc )
Model for DBP -0.0417 0.4642 0.0122

Chapter 5
Structural Equation Modeling
In this section we present the process of our further analysis to explain the effect
of the ACE gene on blood pressure in African Americans by including measured
genotype of the ACE gene into a structural equation model (SEM). Genes may influence
the individual’s sensitivity to environmental fluctuation by influencing the variance of a
quantitative trait instead of the mean (Falconer, 1989) and SEM has the advantage of
partitioning the variance of a quantitative trait into additive genetic, shared environmental,
and non-shared environmental components by comparing the information gained from
MZ twins, DZ twins and siblings.
Including measured genotype into structural equation modeling (SEM) will
improve our understanding of human traits and gene function (Van den Oord et al. 2002,
van den Oord et al. 2004). Genes tend to interact with other etiological factors and exert
their effects in a certain environment composed by multiply determinants, including both
inherent factors, like other genes in the genome, and also external factors. Constructing
SEM with measured genotype of relevant genes will help us to investigate the interaction
between the particular genetic locus under study and other influencing factors.

56
5.1 Bivariate Cholesky Decomposition Model
Classical twin studies compare the similarity of MZ twins, DZ twins and full
siblings (Rende et al. 1990). MZ twins share all their genes and, on average, DZ twins
and full siblings share half of their genes. Therefore, to the extent that genetic factors
influence a trait, then MZ twins will be more similar than DZ twins and siblings. By
comparing the co-variation among MZ twins, DZ twins and siblings, basic twin models
partition the variance of a measured trait into additive genetic, shared environmental, and
non-shared environmental components. This model is usually called the ACE model, in
which the A latent variable represents additive genetic effects. Therefore, the parameter
relating the twins’ additive genetic variance components is set at 1.0 for the MZ twins
and 0.5 for the DZ twins and full siblings. The C latent variable represents the shared
environmental component, which correlates 1 in twins (both MZ and DZ) and less than 1
in siblings. The E denotes the non-shared environmental component, and there is no
correlation in non-shared environmental factors for either twins or siblings.
For this project, the first step was to construct a bivariate ACE model for twin
analysis because for each twin there are two measured variables, systolic blood pressure
(SBP) and diastolic blood pressure (DBP). In bivariate or even multivariate genetic
analysis, Cholesky decomposition is often used to construct a SEM (Neale et al. 1992). It
has a simple graphic representation as a path diagram presented in Figure 5-1. In the
diagram an ellipse represents latent variables and a rectangle represents observed
variables. To use the Cholesky decomposition model, the latent variables need to be split
into several latent factors and the number of the latent factors split from each latent

57
variables should be equal to the number of the observed variables. In this project, we
have two observed variables, SBP and DBP, so each of the three latent variables, A, C
and E, must be split into two latent factors, A1, A2, C1, C2, E1, and E2. The first set of latent
factors, A1, C1, and E1, would load on both SBP and DBP, and the second set of latent
factors, A2, C2, and E2, would only load on DBP.
The reason for us to use Cholesky Decomposition is due to the important
restriction that A, C, and E must be positive definite. If estimating A, C and E without
imposing this constraint, they will very often not be positive definite and thus give
nonsense values, greater than or less than unity, for the genetic and environmental
correlations. It is simple to impose this constraint by recognizing that any symmetric
positive definite matrix can be decomposed into the product of a triangular matrix and its
transpose. Thus, the genetic, shared environmental and non-shared environmental
covariance matrices can be represented by their respective Cholesky factorizations:
and
where X, Y, and Z are triangular matrices of additive genetic, within-family
environmental, and non-shared environmental factor loadings. Thus, X, Y, and Z can be
represented as
XXA ′= (5.1)
YYC ′= (5.2)
ZZE ′= (5.3)

58
The elements in these three matrices serve as the coefficients loading from latent factors
to measured variables.
5.2 Modeling the Effects of the ACE Gene
The effect of ACE can be represented by two dummy variables, ACEA and ACED,
which denotes the additive effect and dominant effect of the ACE gene respectively.
Because the genetic effects are modeled as deviations from the general model, the
maximum number of dummy variables equals the number of genotype groups minus one.
In this case, with only three genotype groups, AA, AT, and TT, two dummy variables,
ACEA and ACED sufficed. RA and RD were used to denote the correlation of the
additive effect of the ACE gene and the correlation of the dominance effect of the ACE
gene between two individuals in the same twin or sibling pair. If the ACEA has the same
value for both individuals in one pair, RA is equal to 1; otherwise, RA equals zero.
Similarly, if the ACED has the same value for both individuals in one twin or sibling pair,
RD is equal to 1; otherwise, RD equals zero.
Two 2 1× matrices M and N are used to denote the effect of ACEA and the effect
of ACED on blood pressure.
⎟⎟⎠
⎞⎜⎜⎝
⎛=
2221
11 0xx
xX (5.4)
⎟⎟⎠
⎞⎜⎜⎝
⎛=
2221
11 0yy
yY (5.5)
⎟⎟⎠
⎞⎜⎜⎝
⎛=
2221
11 0zz
zZ (5.6)

59
11m and 21m are used to denote the effect of ACEA on SBP and DBP respectively, and
serve as the coefficients loading from ACEA to these two observed variables; similarly,
11n and 21n are used to denote the effect of ACED on SBP and DBP respectively, and also
serve as the loading factors from ACED to SBP and DBP. The three genotypes, AA, AT,
and TT, were assigned to scores of 1, 0, and -1, respectively, on ACEA and 0, 1, 0,
respectively, on ACED. Thus the elements in matrix M can be regarded as additive
scores and the elements in matrix N as dominance scores. Taking systolic blood pressure
as an example, 11m is the deviation of AA homozygote individuals, 11n is the deviation of
AT, heterozygote individuals, and - 11m is the deviation of TT homozygote individuals
from overall mean of SBP. When 11n is zero the heterozygote is exactly in the middle of
the two homozygotes for SBP, and the genotypic differences are proportional to the
number of A alleles, which indicates the complete additive effect of the ACE gene on
SBP. Values for 1n unequal to zero indicate the existence of dominance effect of one
allele over the other on SBP. Using above denotation of the ACE genotype to investigate
the effect of two alleles on DBP is exactly the same.
⎟⎟⎠
⎞⎜⎜⎝
⎛=
21
11
mm
M (5.7)
⎟⎟⎠
⎞⎜⎜⎝
⎛=
21
11
nn
N (5.8)

60
5.3 The Full Model and Reduced Models
The models for SBP and DBP were fitted with Mx (Neale et al., 1999) using
maximum likelihood analysis. Figure 5-2 shows a diagram of the full model. After
constructing the full model, the reduced models nested to this saturated Cholesky
Decomposition model were tested to determine whether or not the latent variables A or C
(or even both of them) could be removed. In practice this means that one can test whether
the components, A, and C, are significantly greater than zero (i.e. present). E is usually
kept in the model because it is also regarded as the residual for the measured variables.
To test the significance of A and C, we need to remove the latent variable under study
from the model to construct a nested reduced model. For example, the CE model is
formed by dropping A, the AE model formed by dropping C, and the most parsimonious
model, the model containing only E, is constructed by dropping both A and C. The
goodness-of-fit of the model relative to a perfectly fitting (saturated) model can be
measured by a likelihood ratio chi-square statistic. The statistical significance of the
difference between two competing models, provided that the models are nested (i.e. the
set of parameters of the model is a subset of the parameters of the other), can be tested by
the difference in chi-square statistic and the difference in degrees of freedom between the
two models. For example, it is possible to compare an AE model with an ACE model,
and, in doing so, the significance of the shared environmental component, C, is being
tested. If the fit of the simpler, nested model is not significantly worse than that of the full
model, the simpler model is preferred, because it provides a more parsimonious
explanation of the observed data.

61
5.4 Test the Effect of the ACE Gene
With the most parsimonious Cholesky decomposition model we have built, we
studied the effect of the ACE gene by specifying ten models (Table 5-1). The first model
includes full effects of the ACE gene on SBP and DBP. With no restriction on matrix M
and matrix N, this model contains both the additive effect and the dominance effect of the
ACE gene on SBP and DBP. The second model was constructed with only the additive
effect of ACE on DBP but a full effect on SBP by setting 021 =n . The third model was
built with a full effect on SBP but only a dominant ACE effect on DBP by
setting 2121 nm = . With the restriction 011 =n , the fourth model includes only an additive
effect on SBP but a full effect on DBP. Removing the N matrix, the fifth model has only
additive gene effects on both SBP and DBP. By setting 011 =n and 2121 nm = , the sixth
model investigates the additive ACE effect on SBP and the dominant ACE effect on DBP.
The seventh model includes a dominant ACE effect on SBP and full gene effect on DBP
by setting the restriction 1111 nm = . The eighth model contains only the dominant effect on
SBP and an additive gene effect on DBP. This is achieved by allowing
1111 nm = and 022 =n . The last two models contain only dominant effect on both SBP and
DBP. However, the difference between them is important: in the ninth model the same
allele has dominant effect on SBP and DBP but in the last model dominant allele is
different for SBP and DBP. Using these ten models, we have included all the possibilities
of ACE’s effect on SBP and DBP. The first model serves as the basic model because it
contains full ACE effects on SBP and DBP. All the other nine models were compared to

62
the first model and Akaike Information Criterion (AIC) values between each of them and
the basic model were calculated. AIC is calculated by df22 −χ and a low AIC value
indicates a preferred simpler model for the gene effect.
To quantify the effect of the ACE locus, we used the parameter estimated from the
best fitting model to compute Cohen’s d effect size (Cohen, 1988) and the contribution of
the ACE locus to the (co) variance. Cohen’s d effect, defined as the difference between
two means divided by the pooled standard deviation for those means, is the appropriate
effect size measure to use in the context of a test on means. As 11m is the deviation of AA
homozygote individuals and - 11m is the deviation of TT homozygote individuals from
overall mean of SBP, the Cohen’s d effect size for SBP between AA and TT homozygote
individuals is calculated as
Similarly, the Cohen’s d effect size for DBP between AA and TT individuals is
calculated as
In addition, the contribution of the ACE gene to the variance of SBP and DBP can
be estimated by the formula
and the formula
)()( 1111
SBPVarmmd −−
= (5.9)
)()( 2121
DBPVarmmd −−
= (5.10)
)(
211
211
SBPVarnm + (5.11)

63
5.5 Result of Structural Equation Modeling (SEM)
Table 5-2 shows the means and standard deviations of SBP and DBP in the ACE
genotype groups. Among three genotype groups the individuals who have two A alleles
have the highest mean value for both SBP and DBP. The average SBP value of the AT
genotype groups is roughly located in the middle of the two homozygotes, which
suggests an additive effect of the A allele on SBP.
First we tested the ACE model, CE model, AE model and E model with the full
effect of the ACE gene, and the model fitting results are shown in Table 5-3. A Cholesky
ACE model was specified as a base against which theoretically driven models were
assessed. Table 5-3 shows that the nested AE model provided a satisfactory fit in
comparison with the ACE model, which means shared environmental effect, denoted by
C, is not a statistically significant latent variable in the full model. Neither the CE model
or the E model provided a satisfactory fit in comparison with the ACE model, which
suggests the genetic effect, A, is of significance, and thus can not be deleted from the full
model. Furthermore, if we remove the effect of the ACE gene from the AE model by
setting the elements in matrices M and N to be zero, the reduced model ( -2 LL =
8561.065, df =1080) will be significantly worse than the model with ACE gene (p-value =
0.012). As a result, we can conclude that the effect of the ACE gene is significant, and
thus can not be deleted from the model.
)(
221
221
DBPVarnm + (5.12)

64
Next we studied the effects of the ACE gene. The model fitting results are shown
in Table 5-4 . The results indicated that the best fitting model was the last model, with the
smallest AIC value (AIC = -2.863). This model assumes only dominant effect of the ACE
gene on both systolic blood pressure and diastolic blood pressure, and this dominant
effect on SBP and DBP comes from different alleles of this genetic locus. Referring to
the mean values of SBP and DBP for different ACE genotypes (shown in Table 5-2 ), the
dominant allele of the ACE gene can be determined: allele A is dominant allele for SBP
and allele T is dominant for DBP.
The un-standardized parameter estimates are shown in Table 5-5. To quantify the
effect of ACE gene, we used the parameter estimates from the best fitting model to
compute Cohen’s d effect size. Cohen’s d Effect size was computed by dividing the
difference between the means in subjects with AA genotype vs. TT subjects by the
pooled standard deviation. As a guide, a value of 0.2 can be interpreted as a small effect,
0.5 as a medium effect and 0.8 indicates a large effect. For systolic blood pressure and
diastolic blood pressure, the Cohen’s d effect sizes were 0.39 and 0.27. Furthermore, the
contribution of the ACE gene to the covariance can be estimated. The ACE gene could
explain 7.74% of the variance of systolic blood pressure and 3.68% of the variance of
diastolic blood pressure. The estimate of ACE’s effect on systolic blood pressure is
3.8346 with 95% confidence interval (1.3782, 5.2308). As this interval does not include
zero, the ACE gene has a significant effect on SBP. In addition, the estimate of the ACE
gene’s effect on diastolic blood pressure is -1.6196 with 95% confidence interval (-
3.1809, -0.0418). As the upper bound of this 95% interval is close to zero, the
significance of the ACE gene effect on DBP is concluded with hesitation. In sum, these

65
results suggested that the ACE gene had significant effect on systolic blood pressure and
some effect on diastolic blood pressure. This conclusion is consistent with our finding by
using general linear mixed model.
Structural equation Modeling (SEM) is a commonly used analytical method to
study the heritable and environmental factors influencing complex phenotypes, such as
hypertension. However, only very few studies have included genotype into SEM with the
aim to study the effect of a particular genetic locus. Adding genotypes of relevant genes
could allow researchers to estimate the effect of a particular gene separately from the
effect of other unmeasured genetic loci, and assess the importance of a particular gene
relative to the influence of genetic effects in sum.
Several points from this approach to study the effect of a specific genetic locus in
a SEM are noteworthy. First, we can study the effects of different alleles, at the same or
different genetic locus, and the interaction between them by SEM. Geneticists typically
distinguish between additive and non-additive genetic effects. Two general types of non-
additivity, dominance and epistasis, are important: dominance describes the interaction
between alleles at the same locus while epistasis describes the interaction between alleles
at different loci. These influences have been studied in many non-human species using
selective breeding experiments, which are impossible in human genetic studies. SEM
provides us the possibility to test the interaction among different alleles at a particular
genetic locus by comparing either an additive effect model or a dominance effect model
for each of the alleles at this specific locus to the model including both additive and
dominance effects. Similarly, if two genes are included, epistasis between these two loci
can also be tested as epistasis exists when the effects of one gene depend on the genotype

66
at another genetic locus. For example, if the difference between individuals having
genotype AA and individuals with genotype aa at locus A depends on whether these
individuals are BB or bb at locus B, then there will be an additive× additive epistatic
interactions.
A second remark is that we can add measured genotype into SEM to study the
effect of this genetic locus in different environmental settings and study the interaction
between inheritable factors with other determinant factors. It has been realized that a gene
may exert different effects or have different functions in different internal or external
environments. For example, a gene may exert its effect in a certain range of age, and it is
also possible to see marked differences in gene expression between males and females.
Thus, we can test whether there is any sex difference of a gene’s influence by comparing
the effect of this genetic locus estimated by SEM in males and females. Measured
genotype is like any other categorical variable in a SEM model, so we also can add the
interaction term between gene effect and other factors, like age or BMI into the model. If
the interaction term proves to be statistically significant, the conclusion could be made
that besides the main effect of this genetic locus, to some extent this gene’s effect also
depends on some other determinants. This type of study will allow us to investigate the
interplay between the genetic factor of interest and other influencing factors. Thus
researchers will be able to gain a more comprehensive picture of complex phenotypes
and study a new domain of mechanisms that describe the function of genes.
In the traditional twin study, the genetic component is an unmeasured latent
variable that can only be estimated by decomposing the variance of the phenotypes. With
measured genotype of relevant genes added, we are provided the possibility to estimate

67
the effect of a certain specific genetic locus separately from the effect of other
unmeasured genetic loci, and to study the interaction of this locus with other influencing
factors.

68
Table 5-1: Models with all possibilities of ACE gene effects on SBP and DBP
Table 5-1 ACE gene effect
Systolic blood pressure Diastolic blood pressure
Restriction
1 Full effect
(additive and dominant effect)
Full effect
(additive and dominant effect)
No
2 Full effect
(additive and dominant effect)
Additive effect 021 =n
3 Full effect
(additive and dominant effect)
Dominant effect 2121 nm =
4 Additive effect Full effect
(additive and dominant effect) 011 =n
5 Additive effect Additive effect 02111 == nn
6 Additive effect Dominant effect 011 =n , 2121 nm =
7 Dominant effect Full effect
(additive and dominant effect) 1111 nm =
8 Dominant effect Additive effect 021 =n , 1111 nm =
9 A allele’s dominant effect on SBP and DBP
or T allele’s dominant effect on SBP and DBP 1111 nm = , 2121 nm = or
1111 nm −= , 2121 nm −=
10 A allele’s dominant effect on SBP and T allele’s dominant effect on DBP or
T allele’s dominant effect on SBP and A allele’s dominant effect on DBP 1111 nm = , 2121 nm −= or
1111 nm −= , 2121 nm =

69
Table 5-2: Means and Standard Deviations of Systolic Blood Pressure (SBP) and Diastolic Blood Pressure (DBP) in ACE Genotype Groups
Table 5-2 Systolic blood pressure Diastolic blood pressure Genotype
Mean SD Mean SD
AA 135.04 19.83 82.19 11.98
AT 131.21 19.83 79.71 12.16
TT 128.08 15.18 80.62 10.21

70
Table 5-3: Competing Models for Factor Structure of Genetic, Common Environment and Unique Environment Influences
Table 5-3
Model -2LL df 2LL∆ − df∆ p-value
ACE model plus ACE gene 8542.334 1072
CE model plus ACE gene 8549.761 1075 7.427 3 0.059
AE model plus ACE gene 8548.161 1076 5.827 4 0.212
E model plus ACE gene 8560.890 1078 18.556 6 0.0049

71
Table 5-4:Completing Models for ACE gene effect on systolic blood pressure and diastolicblood pressure
Table 5-4 Model -2LL Df 2LL∆ − ( 2χ ) df∆ AIC
( 2χ -
2 df∆ )
1 AE model with full effect of the ACE
gene on SBP and DBP
8548.161 1076
2 AE model with full effect of the ACE
on SBP and additive ACE effect on
DBP
8550.103 1077 1.942 1 -0.058
3 AE model with full effect of the ACE
on SBP and dominant ACE effect on
DBP
8548.413 1077 0.252 1 -1.748
4 AE model with additive ACE effect
on SBP and full ACE gene effect on
DBP
8550.626 1077 2.465 1 0.465
5 AE model with only additive ACE
effect on SBP and DBP
8550.626 1078 2.465 2 -1.535
6 AE model with additive ACE effect
on SBP and dominant ACE effect on
DBP
8550.835 1078 2.674 2 -1.326
7 AE model with dominant ACE effect
on SBP and full effect of the ACE
gene on DBP
8549.244 1077 1.083 1 -0.917
8 AE model with dominant ACE effect
on SBP and additive ACE effect on
DBP
8550.110 1078 1.949 2 -2.051
9 AE model with dominant ACE effect
on SBP and DBP (same allele)
8553.173 1078 5.012 2 1.012
10 AE model with dominant ACE effect
on SBP and DBP (different allele)
8549.298 1078 1.137 2 -2.863

72
*1 Fixed to be equal
*2 Fixed to be opposite
Table 5-5: Parameter Estimates from Best Fitting Model
Table 5-5 Label ML estimates
11x 21x 22x
Genetic effect 13.57 5.25 -4.79
11y 21y 22y
Shared environment 0 0 0
11z 21z 22z
Non-shared environment 13.43 6.48 6.88
11m *1 21m *2
ACEA(additive) 3.83 -1.62
11n *1 21n *2
ACED(dominance) 3.83 1.62

73
Figure 5-1
A1
Sys1
x11
1.00
A2
Dia1
x22
1.00
A1
Sys2
x11
1.00
A2
Dia2
x22
1.00
x21 x21
C1
1.00
E11.00
C2
1.00
E2
1.00
C1
1.00
E1
1.00
C2
1.00
E2
1.00
y11z11
y21z21
y22z22
y11z11
y21z21
y22z22
MZ = 1.0 DZ = Sibling = 0.5
MZ = 1.0 DZ = Sibling = 0.5
MZ = DZ = 1 Sibling = r
MZ = DZ = 1 Sibling = r
A1
Sys1
x11
1.00
A2
Dia1
x22
1.00
A1
Sys2
x11
1.00
A2
Dia2
x22
1.00
x21 x21
C1
1.00
E11.00
C2
1.00
E2
1.00
C1
1.00
E1
1.00
C2
1.00
E2
1.00
y11z11
y21z21
y22z22
y11z11
y21z21
y22z22
MZ = 1.0 DZ = Sibling = 0.5
MZ = 1.0 DZ = Sibling = 0.5
MZ = DZ = 1 Sibling = r
MZ = DZ = 1 Sibling = r
Figure 5-1: The Cholesky factor ACE model for two variables systolic blood pressure(SBP) and diastolic blood pressure (DBP).

74
Figure 5-2
A1
x11
1.00
A2
x22
1.00
A1
x11
1.00
A2x22
1.00
x21 x21
1.00 1.00 1.00
C1 E1 C2 E2
1.00 1.00 1.00 1.00
C1 E1 C2 E2
1.00
y11 z11
y21
z21 y22 z22 y11 z11
y21
z21 y22 z22
DBP1DBP1SBP1SBP1 ACED1ACED1 SBP2SBP2 DBP2DBP2 ACEA2ACEA2ACEA1ACEA1 ACED2ACED2
1.001.001.001.00
1
1 1
1
ACEA1 ACEA2 ACED2ACED1
m11m21
n21
n11n21
n11
m21
m11
MZ = 1.0 DZ = Sibling = 0.5
MZ = 1.0 DZ = Sibling = 0.5 Ra Rd
MZ =DZ = 1.0 Sibling = r
MZ = DZ = 1.0 Sibling = r
A1
x11
1.001.00
A2
x22
1.001.00
A1
x11
1.001.00
A2x22
1.001.00
x21 x21
1.00 1.00 1.00
C1 E1 C2 E2
1.001.001.00 1.001.00 1.001.00
C1 E1 C2 E2
1.001.00 1.001.00 1.001.00 1.001.00
C1 E1 C2 E2
1.001.00
y11 z11
y21
z21 y22 z22 y11 z11
y21
z21 y22 z22
DBP1DBP1SBP1SBP1 ACED1ACED1 SBP2SBP2 DBP2DBP2 ACEA2ACEA2ACEA1ACEA1 ACED2ACED2DBP1DBP1SBP1SBP1 ACED1ACED1 SBP2SBP2 DBP2DBP2 ACEA2ACEA2ACEA1ACEA1 ACED2ACED2
1.001.001.001.001.001.001.001.00
1
1 1
1
ACEA1 ACEA2 ACED2ACED1
m11m21
n21
n11n21
n11
m21
m11
MZ = 1.0 DZ = Sibling = 0.5
MZ = 1.0 DZ = Sibling = 0.5 Ra Rd
MZ =DZ = 1.0 Sibling = r
MZ = DZ = 1.0 Sibling = r
Figure 5-2: Diagram of the full model: the Cholesky factor ACE model with additive and dominance effects of the ACE gene for systolic blood pressure (SBP) and diastolicblood pressure (DBP).

Chapter 6
Conclusion and Future Work
Using association tests, we detected an association between one genetic locus,
A-240T, in the Angiotensin I Converting Enzyme (ACE) gene and hypertension in the
population of African Americans. Both the association between the genotypes of A-240T
and hypertension status (p-value=0.0295), and the association between the alleles of A-
240T and hypertension status (p-value=0.0062) proved to be statistically significant. The
estimated odds ratio of carrying A allele in the hypertensive group versus the
normotensive group is 1.52 with a 95% confidence interval of (1.13, 2.06), which means
that the odds of having A allele in the hypertension group is 1.52 times greater than the
odds in the non-hypertension group.
Logistic regression further confirmed the association between A-240T in the
ACE gene and hypertension in African Americans. The best logistic regression model
that was found after backwards logistic regression was the model containing only the
ACE gene as a predictor variable, and the ACE gene proved to be a statistically
significant predictor variable in the model (Wald 2 6.9χ = ; df=2; p-value= 0.0316). The
point estimate of the odds ratio of having hypertension between TT and AA is 0.432
(95% CI, 0.226-0.825), which means the odds of having hypertension given AA genotype
is 2.31 times greater than the odds given TT genotype. Thus an individual is 131% more
likely, on the odds scale, to have hypertension if he or she has two A alleles rather than
two T alleles.

76
Next, two general linear mixed models were built to investigate the effect of the
ACE gene on systolic blood pressure (SBP) and diastolic blood pressure (DBP)
respectively. By taking sex into account, ACE has a statistically significant effect on
systolic blood pressure (p-value=0.0260) but not on diastolic blood pressure (p-
value=0.1482).
The estimate values of SBP for individuals with AA, TT and AT genotypes are
135.51 mm Hg, 128.99 mm Hg and 131.29 mm Hg, respectively. The SBP of individuals
carrying two A alleles is significantly higher than the SBP of individuals with TT
genotype (p-value=0.0270), and the individuals with AT genotype (p-value=0.0256).
However, there is no significantly difference in SBP between individuals with AT
genotype and TT genotype (p-value=0.4255).
Using the intra-class correlations for MZ twin-pairs, DZ twin-pairs and siblings,
we decomposed the variance of SBP and DBP into its genetic component and
environmental component. The environmental effects are small, at most a few percentage
points of the total effects, while genetic factors account for large proportion of the
variation of both SBP (55.52%) and DBP (42.25%). Based on an additive genetic model,
the variance of SBP was decomposed into the variances due to additive genetic effects,
and environmental factors among twins and siblings. Similarly, we decomposed the
variance of DBP into the variance due to additive genetic effects, dominant genetic
effects and environmental factors among twins. For DBP, the component of dominant
genetic effect accounts for the largest proportion of the variation, while the variance due
to additive genetic effect was close to zero in the absolute value. All these results suggest
that, compared to other components, the additive genetic effect and the dominant genetic

77
factor are two components of overwhelming importance for the variance of SBP and the
variance of DBP respectively.
Finally, Structural Equation Modeling (SEM) was used to study the ACE gene’s
effect and latent genetic and environmental influences on blood pressure in the
population of African Americans. The measured genotype of the ACE gene was included
into SEM to estimate the effect of this genetic marker separately from the effect of other
unmeasured genetic loci and to assess the importance of ACE relative to the influence of
genetic effects in sum. By comparing nested models with a full model (an ACE model
with full effect of the ACE gene), we can see that the shared environmental effect,
denoted by C, is not a statistically significant latent variable in the full model, but the
genetic effect, A, is of significance. The best SEM model was the AE model with a
dominant effect of the ACE gene on both systolic blood pressure and diastolic blood
pressure (the dominant effects on SBP and DBP come from different alleles of ACE).
Based on the mean values of SBP and DBP for different ACE genotypes, it can be
concluded that allele A is the dominant allele for SBP and allele T is dominant for DBP.
Furthermore, if we remove the effect of the ACE gene from the AE model, the reduced
model will be significantly worse than the model with the ACE gene (p-value=0.012). As
a result, we can conclude that the ACE gene is significant, and thus can not be deleted
from the model.
The estimate of ACE’s effect on SBP is 3.8346 with 95% CI (1.3782, 5.2308)
and -1.6196 on DBP with 95% CI (-3.1809, -0.0418). Additionally, the ACE gene could
explain 7.74% of the variance of SBP and 3.68% of the variance of DBP. Cohen’s d
Effect size was also computed: the Cohen’s d effect sizes were 0.39 and 0.27 for SBP and

78
DBP. In sum, these results suggested that the ACE gene had significant effect on systolic
blood pressure and some effect on diastolic blood pressure.
The work revealed an important effect of the genetic marker, A-240T in the
ACE gene, on hypertension in the population of African Americans, but the interaction
between this genetic locus and environmental effects still remains unclear. Future work
needs to focus on interactions between this genetic marker and the environment because
it is well known that gene-by-environment interactions between genetic variations and
environmental factors such as stress, diet, and physical activity contribute to the
development of essential hypertension.
Researchers are somewhat limited in their ability to investigate the underlying
causes of gene-environment interactions in humans. It is evident that environment-
dependent gene expression is affected by allelic variation, which can influence how well
signals from the environment are transduced to direct gene expression, as well as
influencing how well the expressed gene’s product performs its functional role.
On a fundamental level, it can be argued that all variation in blood pressure
results from the interaction of genes and environment and that failure to consider this
inextricably intertwined relationship leads to false dichotomization of genetic or
environmental etiologies. However, it is quite difficult to quantify how environmental
variation combines with molecular genetic processes (within an individual) or with
genetic variations (across individuals) to give rise to the wide spectrum of blood
pressures observed in a population.
Multiple interconnected homeodynamic mechanisms regulate the relationship
between salt and water intake and resultant blood pressure levels within an individual.

79
This relationship is known to be heterogeneous among individuals, who can be broadly
categorized as salt-sensitive or salt-resistant. The insertion (I)/deletion (D) in the ACE
gene has been investigated for their association with salt sensitivity. With respect to its
influence on salt sensitivity, the I variant confers greater blood pressure increases
associated with changes from a low-salt (50 mmol/day) to high-salt (260 mmol/day) diet
(Giner et al. 2000).
Gene-environment interaction implies that, in combination, the impact of the
genotype and the environmental factor under study is more than the additive effects of
each factor alone. From a mechanistic viewpoint, interaction suggests that at the
molecular level the effects of the environmental factors modify the molecular function of
the product of the gene under observation.
It is well known that hypertensives respond heterogeneously to antihypertensive
drugs. This heterogeneity probably reflects a wide variety of factors, including
differences in pharmacodynamic and pharmacokinetic properties and differences among
individuals in the pathophysiologic traits influencing blood pressure levels. Knowledge
of gene-by-environment interaction can also lead to improved therapy that matches
specific interventions with specific genetic subgroups.

Bibliography
Akey JM, Sosnoski D, Parra E, Dios S, Hiester K, Su B, Bonilla C, Jin L, Shriver MD
Melting curve analysis of SNPs (McSNP): a gel-free and inexpensive approach for
SNP genotyping. Biotechniques. 2001 Feb;30(2):358-62, 364, 366-7.
Appel LJ, Moore TJ, Obarzanek E, et al. A clinical trial of the effects of dietary patterns
on blood pressure: DASH collaborative research group. N Engl J Med. 1997; 336:
1117-1124.
Barley J, Blackwood A, Miller M, Markandu ND, Carter ND, Jeffery S, Cappuccio FP,
MacGregor GA, Sagnella GA. Angiotensin converting enzyme gene I/D
polymorphism, blood pressure and the rennin-angiotensin system in Caucasian and
Afo-Caribbean peoples. J Hum Hypertens. 1996; 10:31-35.
Bazzano KA, He J, Ogden LG, et al. Fruit and vegetable intake and risk of cardiovascular
disease in US adults: the First National Health and Nutrition Examination Survey
epidemiologic follow-up study. Am J Clin Nutr. 2002; 76:93-99.
Bishop DV. DeFries-Fulker analysis of twin data with skewed distributions: cautions and
recommendations from a study of children’s use of verb inflections. Behavior
Genetics. 2005 Jul; 35 (4):479-90.
Blair D, Habicht JP, Sims EA, et al. Evidence for an increased risk for hypertension with
centrally located body fat and the effect of race and sex on this risk. Am J Epidemiol.
1984; 119:526-540.
81
Borecki IB, Province MA, Ludwig EH, Ellison RC, Folsom AR, Heiss G, Lalouel JM,
Higgins M, Rao DC. Associations of candidate loci angiotensinogen and
angiotensin-converting enzyme with severe hypertension: the NHLBI Family Heart
Study. Ann Epidemiol. 1997;7:13-21
Bouzekri N, Zhu X, Jiang Y, McKenzie CA, Luke A, Forrester T, Adeyemo A, Kan D,
Farrall M, Anderson S, Cooper RS, Ward R (2004) Angiotensin I-converting
enzyme polymorphisms, ACE level and blood pressure among Nigerians,
Jamaicans and African-Americans. Eur J Hum Genet 12:460-468
Castellano M, Glorioso N, Cusi D, Sarzani R, Fabris B, Opocher G, Zoccali C, Golin R,
Veglio F, Volpe M, Mantero F, Fallo F, Rossi GP, Barlassina C, Tizzoni L,
Filigheddu F, Giacche M, Rossi F, Genetic polymorphism of the renin-angiotensin-
aldosterone system and arterial hypertension in the Italian population: the
GENIPER Project. J. Hypertens. 2003 Oct; 21(10):1853-60.
Caulfield M, Lavender P, Farrall M, Munroe P, Lawson M, Turner P, and Clark AJ.
Linkage of the angiotensinogen gene to essential hypertension. N Engl J Med 330:
1629–1633, 1994
Cooper R, Rotimi C. Hypertension in blacks. Am J Hypertens. 1997;10:804-812.
Danser AH, Derkx FH, Hense HW, Jeunemaitre X, Riegger GA, and Schunkert H.
Angiotensinogen (M235T) and angiotensin-converting enzyme (I/D)
polymorphisms in association with plasma renin and prorenin levels. J Hypertens
16: 1879–1883, 1998

82
Edwin J. C. G. van den Oord, and Harold Snieder. Including Measured Genotypes in
Statistical Models to Study the Interplay of Multiple Factors Affecting Complex
Traits. Behavior Genetics, 2002 Jan; 32(1): 1-22.
Edwin J. C. G. van den Oord, Alex J. MacGregor, Harold Snieder, and Tim D. Spector.
Modeling with Measured Genotypes: Effects of the Vitamin D Receptor Gene, Age, and
Latent Genetic and Environmental Factors on Bone Mineral Density. Behavior
Genetics, Mar; 34(2): 197-206
Ehlers MRW, Riordan JF. Angiotensin-converting enzyme: new concepts concerning its
biological role. Biochemistry 1989; 28: 5311–7.
Erdos, E. and Skidgel, R. A. The angiotensin I-converting enzyme. Lab. Invest. 56: 345-
348, 1987
Erdos EG. Angiotensin I converting enzyme and the changes in our concepts through the
years. Hypertension 1990; 16: 363–70.
Ewens WJ, Spielman RS (1995) Then transmission/disequilibrium test: history,
subdivision, and admixture.Am J Hum Genet 1995; 57:455-464.
Falconer DS, Mackay TFC. Introduction to quantitative genetics. 4th ed. New York, NY:
Longman, 1996.
Gainer JV, Hunley TE, Kon V, Nadeau JH, Muldowney JA3rd, Brown NJ. Angiotensin
II type I receptor polymorphism in African Americans: lower frequency of the
C1166 variant. Biochem Mol Biol Int. 43: 227–231, 1997
Ganong WF. Review of medical physiology, 18th Ed., Appleton and Lange, Stanford,
Connecticut, 1997.

83
Gardes J,Bouhnik J, Clauser E, Corvol P, Menard J. Role of angiotensinogen in blood
pressure homeostasis. Hypertension. 1982 Mar-Apr;4(2):185-9.
Giner V,Poch E, Bragulat E,Oriola J, Gonzalez D, Coca A, De La Sierra A. Renin-
angiotensin system genetic polymorphisms and salt sensitivity in essential
hypertension. Hypertension, 2000 Jan;35:512-7.
Guo G, Wang J. The Mixed or Multilevel Model for Behavior Genetic Analysis.
Behavior Genetics. 2002 Jan;32(1):37-49.
He J, Whelton PK. Epidemiology and prevention of hypertension. Med Clin N Am 1997;
81: 1077-1097
Hubert C, Houot AM, Corvol P, Soubrier F. Structure of the angiotensin I-converting
enzyme gene. J Biol Chem 1991; 266: 15377–83.
Inoue I, Nakajima T, Williams CS, Quackenbush J, Puryear R, Powers M, Cheng T,
Ludwig EH, Sharma AM, Hata A, Jeunemaitre X, Lalouel JM. A nucleotide
substitution in the promoter of human angiotensinogen is associated with essential
hypertension and affects basal transcription in vitro. J Clin Invest. 1997 Apr
1;99(7):1786-97.
Jeunemaitre X, Soubrier F, Kotelevtsev YV, Lifton RP, Williams CS, Charru A, Hunt
SC, Hopkins PN, Williams RR, Lalouel JM, and et al. Molecular basis of human
hypertension: role of angiotensinogen. Cell 71: 169–180, 1992
Jones BC. Neurobehavioral Genetics methods and Applications. 1999 CRC Press LLC
Katariina Kainulainen, Markus Perola, Joseph Terwilliger, Jaakko Kaprio, Markku
Koskenvuo, Ann-Christine Syva¨nen, Erkki Vartiainen, Leena Peltonen, Kimmo

84
Kontula. Evidence for Involvement of the Type 1 Angiotensin II Receptor Locus in
Essential Hypertension. Hypertension 1999 Mar; 33(3):844-9.
Kenneth S. Kendler, Michael C. Neale, Ronald C. Kessler, Andrew C. Heath and Lindon
J. Eaves. A test of the equal-environment assumption in twin studies of psychiatric
illness. Behavior Genetics. 1993 Jan 23(1):21-7.
Kim HS, Lee G, John SW, et al. Molecular phenotyping for analyzing subtle genetic
effects in mice: application to an angiotensinogen gene titration. Proc Natl Acad Sci
USA. 2002;99:4602-4607.
Klag MJ, Whelton PK, Randall BL, et al. End-stage renal disease in African-Amerian
and white men: 16-year MRFIT findings. JAMA. 1997;227:1293-1298.
Lander ES, Schork NJ. Genetic dissectin of complex tratis. Science 1994; 265:2037-2048.
Licastro F, Pedrini S, Govoni M, Pession A, Ferri C, Annoni G, Casadei V, Veglia F,
Bertolini S, Grimaldi LM. Apolipoprotein E and alpha-1-antichymotrypsin allele
polymorphism in sporadic and familial Alzheimer's disease. Neurosci Lett. 1999
Aug 6; 270(3):129-32.
Lin JJ, Yueh KC, Chang CY, Chen CH, Lin SZ. The homozygote AA genotype of the
alpha1-antichymotrypsin gene may confer protection against early-onset
Parkinson's disease in women. Parkinsonism Relat Disord. 2004 Dec; 10(8):469-73.
Mary L. Marazita, M. Anne Spence. Linkage analysis of G8 and Huntington's disease.
Genetic Epidemiology 1985 Volume 3, Issue S1 , 247 - 250
Merriman, C., The intellectual resemblance of twins, Psychol.Monogr., 1924,33:1-58.
Morise T, Takeuchi Y, Takeda R. Angiotensin-converting enzyme polymorphism and
essential hypertension. Lancet. 1994;343:125.

85
Morris MC, Sacks FM, Rosner B. Does fish oil lower blood pressure: a meta-analysis of
controlled trials. Circulation. 1993; 88:523-533.
Neale MC, Cardon LR. Methodology for Genetic Studies of Twins and Families. 1992
Kluwer Academic Publishers.
Neale MC, Boker SM, Xie G and Maes HH. (1999). Mx: statistical Modeling.
Department of Psychiatry, Virginia Commonwealth University, Richmond
Ott J (1999). Analysis of Human Genetic Linkage, 3rd edition. Johns Hopkins University
Press, Baltimore.
Overfield T. Biologic Variation in Health and Illness: Race Age and Sex Differences.
New York: CRC, 1995.
Perry RT, Collins JS, Harrell LE, Acton RT, Go RC. Investigation of association of 13
polymorphisms in eight genes in southeastern African American Alzheimer disease
patients as compared to age-matched controls. Am J Med Genet. 2001 May 8;
105(4):332-42.
Rapp JP. Genetic analysis of inherited hypertension in the rat. Physiol Rev. 2000;8:135-
172.
Reaven GM. Banting lecture 1988: role of insulin resistance in human disease. Diabetes.
1988; 37:1595-1607.
Rende, R.D., Plomin, R., and Vandenberg, S., Who discovered the twin method? Behav.
Gebet, 1990, 20:277-285
Rotimi C, Morrison L, Cooper R, Oyejide C, Effiong E, Ladipo M, Osotemihen B, and
Ward R. Angiotensinogen gene in human hypertension. Lack of an association of
the 235T allele among African Americans. Hypertension 24: 591–594, 1994

86
Sacks FM, Kass EH. Low blood pressure in vegetarians: effects of specific foods and
nutrients. Am J Clin Nutr. 1988; 48:795-800.
Sacks FM, Svetkey LP, Vollmer WM, et al. Effects on blood pressure of reduced dietary
sodium and the Dietary Approaches to Stop Hypertension (DASH) diet. N Engl J
Med. 2001;344:3-10.
Schmidt S, van Hooft IM, Grobbee DE, Ganten D, Ritz E. Polymorphism of the
angiotensin converting enzyme gene is apparently not related to high blood pressure:
Dutch Hypertension and Offspring Study. J Hypertens. 1993; 11: 345-348.
Sethi AA, Nordestgaard BG, Tybjaerg-Hansen A. Angiotensinogen gene polymorphism,
plasma angiotensinogen, and risk of hypertension and ischemic heart disease: A
Meta-Analysis. Arterioscler Thromb Vasc Biol. 2003 Jul 1;23(7):1269-75.
Slatkin M. Inbreeding coefficients and coalescence times. Genet Res. 1991;58: 167-175.
Staessen JA, Kuznetsova T, Wang JG, Emelianov D, Vlietinck R, and Fagard R. M235T
angiotensinogen gene polymorphism and cardiovascular renal risk. J Hypertens 17:
9–17, 1999
Vandenbergh, David J., Kate Anthony, and Keith Whitfield (2003) Optimizing DNA
Yield from Buccal Swabs in the Elderly: Attempts to Promote Buccal Cell Growth
in Culture. American Journal of Human Biology 15:637-642.
Vassilikioti S, Doumas M, Douma S, Petidis K, Karagiannis A, Balaska K, Vyzantiadis
A, Zamboulis C. Angiotensin converting enzyme gene polymorphism is not related
to essential hypertension in a Greek population. Am J Hypertens. 1996; 9: 700-702.

87
Wang X, DeKosky ST, Luedecking-Ziemmer E, Ganguli M, and Kkamboh IM, Genetic
variation in alpha-1-antichymotrypsin and its association with Alzheimer’s disease.
Hum Genet 2002 Apr; 110(4):356-65.
Wang X, DeKosky ST, and Ikonomovic MD, Distribution of plasma alpha 1-
antichymotrypsin levels in Alzheimer disease patients and controls and their genetic
controls. Neurobiol. Aging 2002 May-Jun; 23(3):377-82.
Williams RR, Hunt SC, Hopkins PN, et al. Familial dyslipidemic hypertension: evidence
from 58 Utah families for a syndrome present in approximately 12% of patients
with essential hypertension. JAMA. 1988; 259:3579-3586.
Zhu X, Bouzekri N, Southam L, Cooper RS, Adeyemo A, McKenzie CA, Luke A, Chen
G, Elston RC, Ward R. Linkage and association analysis of angiotensin I-
converting enzyme (ACE)-gene polymorphisms with ACE concentration and blood
pressure. Am J Hum Genet. 2001; 68: 1139–1148.
Zhu X, Chang YP, Yan D, Weder A, Cooper R, Luke A, Kan D, Chakravarti A.
Associations between hypertension and genes in the renin-angiotensin system.
Hypertension 2003 May; 41(5):1027-34.

VITA
Xiaopan Yao
Xiaopan Yao was born in Shandong, P.R.China. She received her B.S. degree in
the Department of Biotechnology from Shandong University in 2002 and started her
Ph.D study in the Intercollege Graduate Degree Program in Genetics at the Pennsylvania
State University in 2003. In her Ph.D study, she focused on the investigation of the
genetic and environmental effects on hypertension in African Americans through
biological and statistical approaches.