investigation of the heating rate dependency associated ...szolcsanyi/education/files/organicka...
TRANSCRIPT
pubs.acs.org/JAFC Published on Web 12/22/2010 © 2010 American Chemical Society
684 J. Agric. Food Chem. 2011, 59, 684–701
DOI:10.1021/jf1042344
Investigation of the Heating Rate Dependency Associatedwith the Loss of Crystalline Structure in Sucrose, Glucose,and Fructose Using a Thermal Analysis Approach (Part I)
JOO WON LEE
Department of Food Science and Human Nutrition, University of Illinois at Urbana-Champaign,399A Bevier Hall, 905 South Goodwin Avenue, Urbana, Illinois 61801, United States
LEONARD C. THOMAS
DSC Solutions LLC, 27 East Braeburn Drive, Smyrna, Delaware 19977, United States
SHELLY J. SCHMIDT*
Department of Food Science and Human Nutrition, University of Illinois at Urbana-Champaign,367 Bevier Hall, 905 South Goodwin Avenue, Urbana, Illinois 61801, United States
Thermodynamic melting occurs at a single, time-independent temperature with a constant enthalpy
value. However, substantial variation in the melting parameters (Tmonset, Tmpeak, and ΔH) for sucrose,glucose, and fructose has been reported in the literature. Although a number of explanations have
been put forth, they do not completely account for the observed variation. Thus, this research was
performed to elucidate the fundamental mechanism underlying the loss of crystalline structure in the
sugars using both thermal (Part I) and chemical (Part II) analysis approaches. A strong heating
rate dependency observed in the melting parameters for the sugars implies the occurrence of a
kinetic process during the loss of crystalline structure. The difference in heat capacity and
modulated heat flow amplitude in the stepwise quasi-isothermal modulated differential scanning
calorimetry experiments for the sugars compared to indium and mannitol (thermodynamic melting
comparison materials) strongly suggests thermal decomposition as the kinetic process responsible
for the loss of crystalline structure, which is the critical difference between our conclusion and others.
We propose the term “apparent melting” to distinguish the loss of crystalline structure due to a kinetic
process, such as thermal decomposition, from thermodynamic melting.
KEYWORDS: Thermodynamic melting; apparent melting; kinetic processes; thermal decomposition;sucrose; glucose; fructose; (modulated) differential scanning calorimetry; thermogravimetric analysis
INTRODUCTION
Melting is a first-order phase transition from the crystallinesolid phase to the liquid phase (1, 2), with no change in chemicalcomposition. The parameters associated with the melting process(onset melting temperature, Tmonset; peak melting temperature,Tmpeak; and enthalpy of melting, ΔH) are usually measured byheating a crystalline material at a specified rate to a temperaturewhere the melting endothermic peak is complete, using a thermalanalysis technique, such as differential scanning calorimetry(DSC) or differential thermal analysis (DTA). The meltingparameters provide a good deal of information about the char-acteristics of the crystalline material (e.g., purity, type, size, etc.),thus, melting parameters have been used as unique materialproperties for identification and characterization of crystallinematerials.
However, for some crystalline sugars a wide range of meltingparameters has been reported in the literature (Table 1). Animportant observation contrary to the definition of thermo-dynamic melting based on Table 1 is that the melting parameterstend to increase strongly with increasing heating rate. Thermo-dynamic melting occurs at a single, time-independent (i.e., heat-ing rate independent) temperature (often reported as Tmonset),where the crystalline solid and corresponding liquid phases are inthermodynamic equilibrium (same Gibbs energy, ΔG = 0) at aconstant pressure (Figure 1). Thus, widely varying sugar meltingparameters are not consistent with the definition of thermo-dynamic melting and thus necessitate further investigation.
DSC, one of the thermal analysis techniques used in thisresearch, measures the heat flow difference between a sampleand inert reference (typically an empty pan) as a function oftemperature and time. Integration of the heat flow signal providesenthalpy (H), which is a function of the material’s specific heat(Cp) and energy absorbed or released by thematerial due to phase
*Corresponding author. Phone: 217-333-6963. Fax: 217-265-0925.E-mail: [email protected].
Article J. Agric. Food Chem., Vol. 59, No. 2, 2011 685
transitions. Specific heat or heat capacity is the result ofmolecularmotion, and therefore, changes in heat capacity reflect changes inthe molecular mobility of the material.
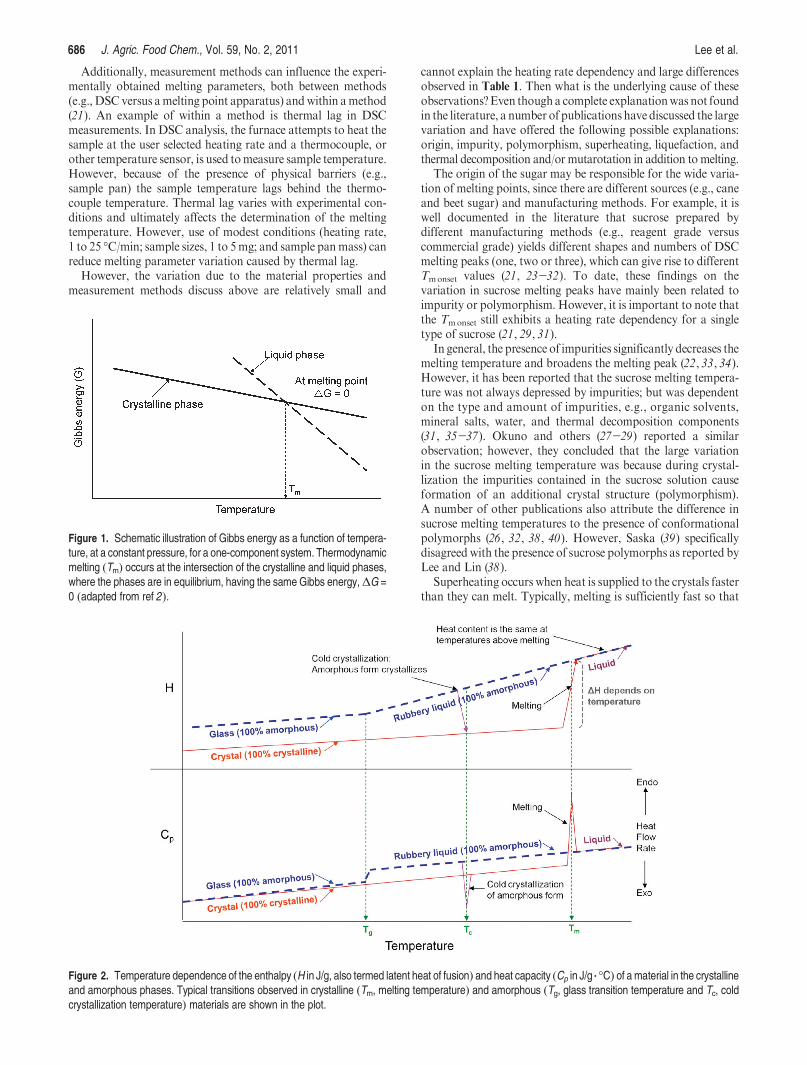
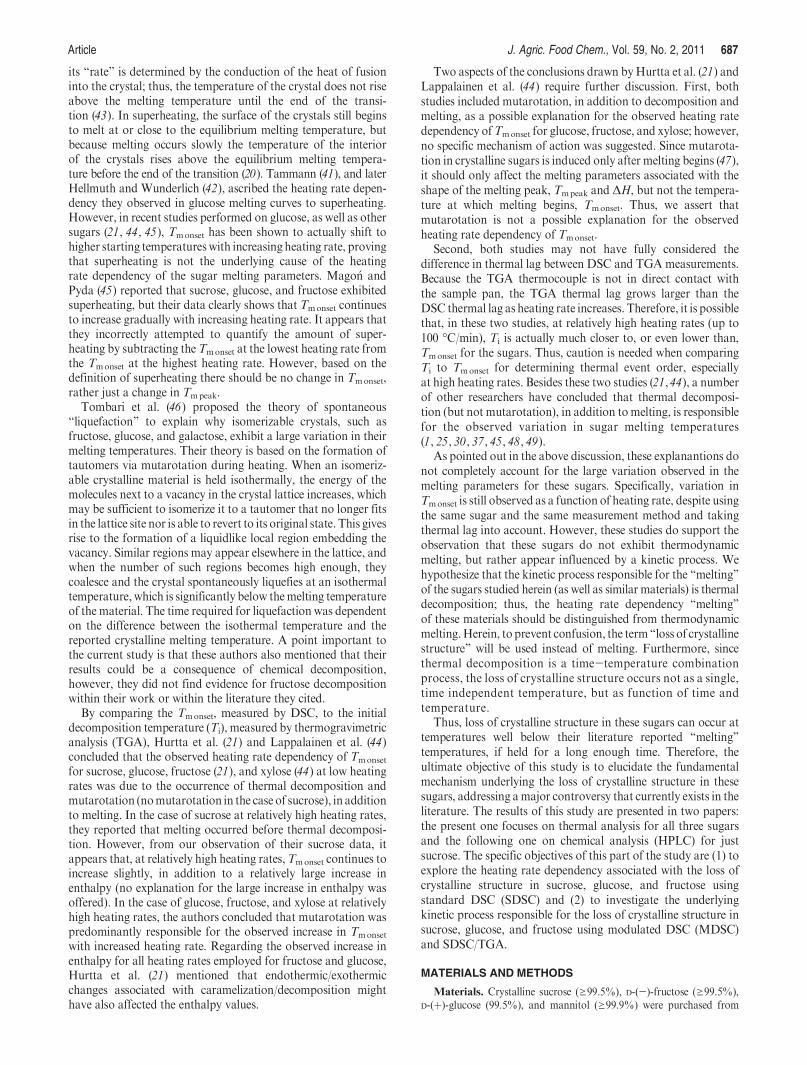
Two important characteristics associatedwith thermodynamicmelting, which DSC makes visible, are (1) at any given tempera-ture, there is an absolute difference in enthalpy (H, J/g) betweenthe crystalline and amorphous phases (i.e., the enthalpydifferenceof amorphization, amorphization being the conversion from acrystalline to an amorphous structure; the laws of thermo-dynamics require a crystalline material to absorb the differencein enthalpy between the twophases in order to become amorphous),and (2) this difference increases with increasing temperature, dueto the difference in heat capacity between the two phases, asshown in Figure 2. The absolute difference in enthalpy betweenthe two phases determines the size (J/g) of the endothermic peakwhen the crystalline material melts and is essentially independent
of what causes the phase transition. Based on these characteristics,the difference in enthalpy between the crystalline and amorphousphases at the thermodynamicmelting temperature should be a single,constant value, equal to the area of the endothermic peak (ΔH, J/g)obtained usingDSC.Thus, theΔH value for thermodynamicmeltingis also independent of time (i.e., heating rate independent).
Theoretically, as discussed above, thermodynamic meltingoccurs at a single temperature with a constant enthalpy value;however, bothmaterial properties andmeasurementmethods canaffect experimentally obtained melting parameters. In the caseof pure and relatively small molecules, thermodynamic meltingusually occurs over a narrow temperature range. However, in thecase of larger molecules (e.g., polymers), thermodynamic meltingoccurs over a broad temperature range due to a number offactors, including molecular weight distribution, crystal purity,type, size, and crystal perfection during heating.
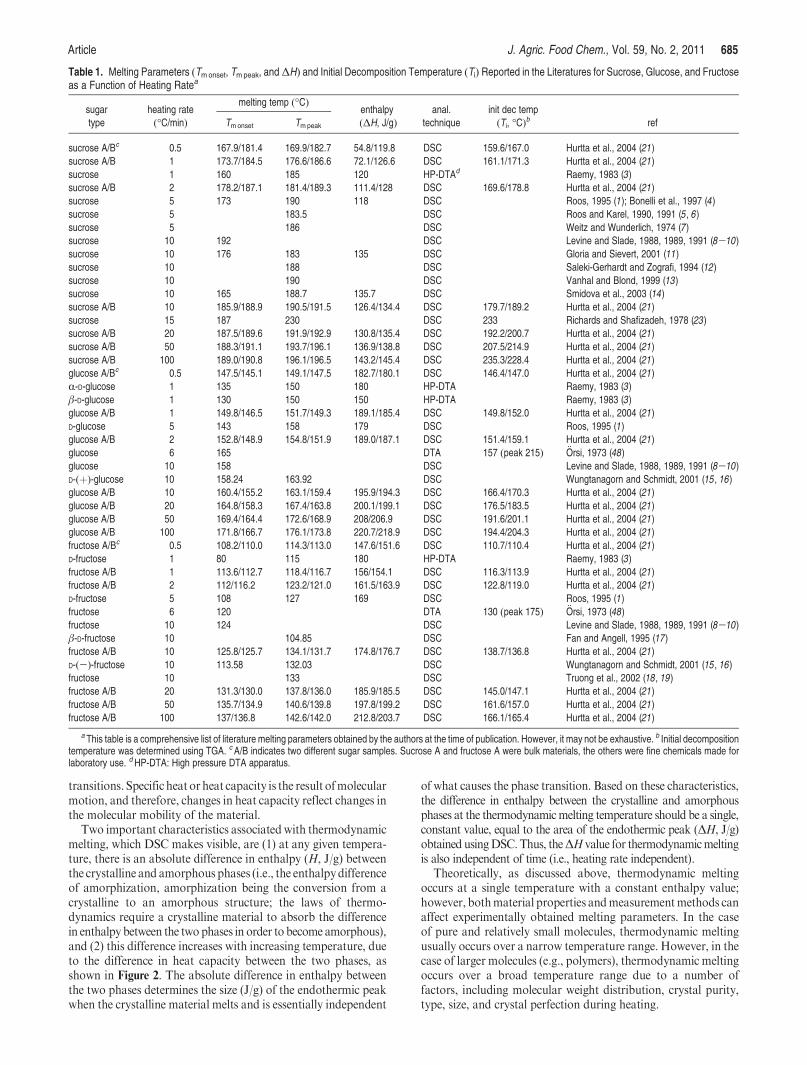
Table 1. Melting Parameters (Tmonset, Tmpeak, andΔH) and Initial Decomposition Temperature (Ti) Reported in the Literatures for Sucrose, Glucose, and Fructoseas a Function of Heating Ratea
melting temp (�C)sugar
type
heating rate
(�C/min) Tmonset Tmpeak
enthalpy
(ΔH, J/g)anal.
technique
init dec temp
(Ti, �C)b ref
sucrose A/Bc 0.5 167.9/181.4 169.9/182.7 54.8/119.8 DSC 159.6/167.0 Hurtta et al., 2004 (21)
sucrose A/B 1 173.7/184.5 176.6/186.6 72.1/126.6 DSC 161.1/171.3 Hurtta et al., 2004 (21)
sucrose 1 160 185 120 HP-DTAd Raemy, 1983 (3 )
sucrose A/B 2 178.2/187.1 181.4/189.3 111.4/128 DSC 169.6/178.8 Hurtta et al., 2004 (21)
sucrose 5 173 190 118 DSC Roos, 1995 (1 ); Bonelli et al., 1997 (4 )
sucrose 5 183.5 DSC Roos and Karel, 1990, 1991 (5 , 6 )
sucrose 5 186 DSC Weitz and Wunderlich, 1974 (7 )
sucrose 10 192 DSC Levine and Slade, 1988, 1989, 1991 (8-10)sucrose 10 176 183 135 DSC Gloria and Sievert, 2001 (11)
sucrose 10 188 DSC Saleki-Gerhardt and Zografi, 1994 (12)
sucrose 10 190 DSC Vanhal and Blond, 1999 (13)
sucrose 10 165 188.7 135.7 DSC Smidova et al., 2003 (14)
sucrose A/B 10 185.9/188.9 190.5/191.5 126.4/134.4 DSC 179.7/189.2 Hurtta et al., 2004 (21)
sucrose 15 187 230 DSC 233 Richards and Shafizadeh, 1978 (23 )
sucrose A/B 20 187.5/189.6 191.9/192.9 130.8/135.4 DSC 192.2/200.7 Hurtta et al., 2004 (21)
sucrose A/B 50 188.3/191.1 193.7/196.1 136.9/138.8 DSC 207.5/214.9 Hurtta et al., 2004 (21)
sucrose A/B 100 189.0/190.8 196.1/196.5 143.2/145.4 DSC 235.3/228.4 Hurtta et al., 2004 (21)
glucose A/Bc 0.5 147.5/145.1 149.1/147.5 182.7/180.1 DSC 146.4/147.0 Hurtta et al., 2004 (21)
R-D-glucose 1 135 150 180 HP-DTA Raemy, 1983 (3 )
β-D-glucose 1 130 150 150 HP-DTA Raemy, 1983 (3 )
glucose A/B 1 149.8/146.5 151.7/149.3 189.1/185.4 DSC 149.8/152.0 Hurtta et al., 2004 (21)
D-glucose 5 143 158 179 DSC Roos, 1995 (1 )
glucose A/B 2 152.8/148.9 154.8/151.9 189.0/187.1 DSC 151.4/159.1 Hurtta et al., 2004 (21)
glucose 6 165 DTA 157 (peak 215) €Orsi, 1973 (48)
glucose 10 158 DSC Levine and Slade, 1988, 1989, 1991 (8-10)D-(þ)-glucose 10 158.24 163.92 DSC Wungtanagorn and Schmidt, 2001 (15 , 16)
glucose A/B 10 160.4/155.2 163.1/159.4 195.9/194.3 DSC 166.4/170.3 Hurtta et al., 2004 (21)
glucose A/B 20 164.8/158.3 167.4/163.8 200.1/199.1 DSC 176.5/183.5 Hurtta et al., 2004 (21)
glucose A/B 50 169.4/164.4 172.6/168.9 208/206.9 DSC 191.6/201.1 Hurtta et al., 2004 (21)
glucose A/B 100 171.8/166.7 176.1/173.8 220.7/218.9 DSC 194.4/204.3 Hurtta et al., 2004 (21)
fructose A/Bc 0.5 108.2/110.0 114.3/113.0 147.6/151.6 DSC 110.7/110.4 Hurtta et al., 2004 (21)
D-fructose 1 80 115 180 HP-DTA Raemy, 1983 (3 )
fructose A/B 1 113.6/112.7 118.4/116.7 156/154.1 DSC 116.3/113.9 Hurtta et al., 2004 (21)
fructose A/B 2 112/116.2 123.2/121.0 161.5/163.9 DSC 122.8/119.0 Hurtta et al., 2004 (21)
D-fructose 5 108 127 169 DSC Roos, 1995 (1 )
fructose 6 120 DTA 130 (peak 175) €Orsi, 1973 (48)
fructose 10 124 DSC Levine and Slade, 1988, 1989, 1991 (8-10)β-D-fructose 10 104.85 DSC Fan and Angell, 1995 (17)
fructose A/B 10 125.8/125.7 134.1/131.7 174.8/176.7 DSC 138.7/136.8 Hurtta et al., 2004 (21)
D-(-)-fructose 10 113.58 132.03 DSC Wungtanagorn and Schmidt, 2001 (15 , 16)
fructose 10 133 DSC Truong et al., 2002 (18 , 19)
fructose A/B 20 131.3/130.0 137.8/136.0 185.9/185.5 DSC 145.0/147.1 Hurtta et al., 2004 (21)
fructose A/B 50 135.7/134.9 140.6/139.8 197.8/199.2 DSC 161.6/157.0 Hurtta et al., 2004 (21)
fructose A/B 100 137/136.8 142.6/142.0 212.8/203.7 DSC 166.1/165.4 Hurtta et al., 2004 (21)
a This table is a comprehensive list of literature melting parameters obtained by the authors at the time of publication. However, it may not be exhaustive. b Initial decompositiontemperature was determined using TGA. cA/B indicates two different sugar samples. Sucrose A and fructose A were bulk materials, the others were fine chemicals made forlaboratory use. dHP-DTA: High pressure DTA apparatus.
686 J. Agric. Food Chem., Vol. 59, No. 2, 2011 Lee et al.
Additionally, measurement methods can influence the experi-mentally obtained melting parameters, both between methods(e.g., DSC versus amelting point apparatus) andwithin amethod(21). An example of within a method is thermal lag in DSCmeasurements. In DSC analysis, the furnace attempts to heat thesample at the user selected heating rate and a thermocouple, orother temperature sensor, is used tomeasure sample temperature.However, because of the presence of physical barriers (e.g.,sample pan) the sample temperature lags behind the thermo-couple temperature. Thermal lag varies with experimental con-ditions and ultimately affects the determination of the meltingtemperature. However, use of modest conditions (heating rate,1 to 25 �C/min; sample sizes, 1 to 5mg; and sample panmass) canreduce melting parameter variation caused by thermal lag.
However, the variation due to the material properties andmeasurement methods discuss above are relatively small and
cannot explain the heating rate dependency and large differencesobserved in Table 1. Then what is the underlying cause of theseobservations?Even thougha complete explanationwas not foundin the literature, a number of publications have discussed the largevariation and have offered the following possible explanations:origin, impurity, polymorphism, superheating, liquefaction, andthermal decomposition and/or mutarotation in addition to melting.
The origin of the sugar may be responsible for the wide varia-tion of melting points, since there are different sources (e.g., caneand beet sugar) and manufacturing methods. For example, it iswell documented in the literature that sucrose prepared bydifferent manufacturing methods (e.g., reagent grade versuscommercial grade) yields different shapes and numbers of DSCmelting peaks (one, two or three), which can give rise to differentTmonset values (21, 23-32). To date, these findings on thevariation in sucrose melting peaks have mainly been related toimpurity or polymorphism. However, it is important to note thatthe Tmonset still exhibits a heating rate dependency for a singletype of sucrose (21, 29, 31).
In general, the presence of impurities significantly decreases themelting temperature and broadens the melting peak (22, 33, 34).However, it has been reported that the sucrose melting tempera-ture was not always depressed by impurities; but was dependenton the type and amount of impurities, e.g., organic solvents,mineral salts, water, and thermal decomposition components(31, 35-37). Okuno and others (27-29) reported a similarobservation; however, they concluded that the large variationin the sucrose melting temperature was because during crystal-lization the impurities contained in the sucrose solution causeformation of an additional crystal structure (polymorphism).A number of other publications also attribute the difference insucrose melting temperatures to the presence of conformationalpolymorphs (26, 32, 38, 40). However, Saska (39) specificallydisagreed with the presence of sucrose polymorphs as reported byLee and Lin (38).
Superheating occurs when heat is supplied to the crystals fasterthan they can melt. Typically, melting is sufficiently fast so that
Figure 2. Temperature dependence of the enthalpy (H in J/g, also termed latent heat of fusion) and heat capacity (Cp in J/g 3 �C) of amaterial in the crystallineand amorphous phases. Typical transitions observed in crystalline (Tm, melting temperature) and amorphous (Tg, glass transition temperature and Tc, coldcrystallization temperature) materials are shown in the plot.
Figure 1. Schematic illustration of Gibbs energy as a function of tempera-ture, at a constant pressure, for a one-component system. Thermodynamicmelting (Tm) occurs at the intersection of the crystalline and liquid phases,where the phases are in equilibrium, having the same Gibbs energy,ΔG =0 (adapted from ref 2).
Article J. Agric. Food Chem., Vol. 59, No. 2, 2011 687
its “rate” is determined by the conduction of the heat of fusioninto the crystal; thus, the temperature of the crystal does not riseabove the melting temperature until the end of the transi-tion (43). In superheating, the surface of the crystals still beginsto melt at or close to the equilibrium melting temperature, butbecause melting occurs slowly the temperature of the interiorof the crystals rises above the equilibrium melting tempera-ture before the end of the transition (20). Tammann (41), and laterHellmuth and Wunderlich (42), ascribed the heating rate depen-dency they observed in glucose melting curves to superheating.However, in recent studies performed on glucose, as well as othersugars (21, 44, 45), Tmonset has been shown to actually shift tohigher starting temperatureswith increasing heating rate, provingthat superheating is not the underlying cause of the heatingrate dependency of the sugar melting parameters. Mago�n andPyda (45) reported that sucrose, glucose, and fructose exhibitedsuperheating, but their data clearly shows that Tmonset continuesto increase gradually with increasing heating rate. It appears thatthey incorrectly attempted to quantify the amount of super-heating by subtracting the Tmonset at the lowest heating rate fromthe Tmonset at the highest heating rate. However, based on thedefinition of superheating there should be no change in Tmonset,rather just a change in Tmpeak.
Tombari et al. (46) proposed the theory of spontaneous“liquefaction” to explain why isomerizable crystals, such asfructose, glucose, and galactose, exhibit a large variation in theirmelting temperatures. Their theory is based on the formation oftautomers via mutarotation during heating. When an isomeriz-able crystalline material is held isothermally, the energy of themolecules next to a vacancy in the crystal lattice increases, whichmay be sufficient to isomerize it to a tautomer that no longer fitsin the lattice site nor is able to revert to its original state. This givesrise to the formation of a liquidlike local region embedding thevacancy. Similar regions may appear elsewhere in the lattice, andwhen the number of such regions becomes high enough, theycoalesce and the crystal spontaneously liquefies at an isothermaltemperature, which is significantly below themelting temperatureof the material. The time required for liquefaction was dependenton the difference between the isothermal temperature and thereported crystalline melting temperature. A point important tothe current study is that these authors also mentioned that theirresults could be a consequence of chemical decomposition,however, they did not find evidence for fructose decompositionwithin their work or within the literature they cited.
By comparing the Tmonset, measured by DSC, to the initialdecomposition temperature (Ti), measured by thermogravimetricanalysis (TGA), Hurtta et al. (21) and Lappalainen et al. (44)concluded that the observed heating rate dependency of Tmonset
for sucrose, glucose, fructose (21), and xylose (44) at low heatingrates was due to the occurrence of thermal decomposition andmutarotation (nomutarotation in the case of sucrose), in additionto melting. In the case of sucrose at relatively high heating rates,they reported that melting occurred before thermal decomposi-tion. However, from our observation of their sucrose data, itappears that, at relatively high heating rates,Tmonset continues toincrease slightly, in addition to a relatively large increase inenthalpy (no explanation for the large increase in enthalpy wasoffered). In the case of glucose, fructose, and xylose at relativelyhigh heating rates, the authors concluded that mutarotation waspredominantly responsible for the observed increase in Tmonset
with increased heating rate. Regarding the observed increase inenthalpy for all heating rates employed for fructose and glucose,Hurtta et al. (21) mentioned that endothermic/exothermicchanges associated with caramelization/decomposition mighthave also affected the enthalpy values.
Two aspects of the conclusions drawn byHurtta et al. (21) andLappalainen et al. (44) require further discussion. First, bothstudies included mutarotation, in addition to decomposition andmelting, as a possible explanation for the observed heating ratedependency ofTmonset for glucose, fructose, and xylose; however,no specific mechanism of action was suggested. Since mutarota-tion in crystalline sugars is induced only after melting begins (47),it should only affect the melting parameters associated with theshape of the melting peak, Tmpeak and ΔH, but not the tempera-ture at which melting begins, Tmonset. Thus, we assert thatmutarotation is not a possible explanation for the observedheating rate dependency of Tmonset.
Second, both studies may not have fully considered thedifference in thermal lag between DSC and TGAmeasurements.Because the TGA thermocouple is not in direct contact withthe sample pan, the TGA thermal lag grows larger than theDSC thermal lag as heating rate increases. Therefore, it is possiblethat, in these two studies, at relatively high heating rates (up to100 �C/min), Ti is actually much closer to, or even lower than,Tmonset for the sugars. Thus, caution is needed when comparingTi to Tmonset for determining thermal event order, especiallyat high heating rates. Besides these two studies (21,44), a numberof other researchers have concluded that thermal decomposi-tion (but not mutarotation), in addition tomelting, is responsiblefor the observed variation in sugar melting temperatures(1, 25, 30, 37, 45, 48, 49).
As pointed out in the above discussion, these explanantions donot completely account for the large variation observed in themelting parameters for these sugars. Specifically, variation inTmonset is still observed as a function of heating rate, despite usingthe same sugar and the same measurement method and takingthermal lag into account. However, these studies do support theobservation that these sugars do not exhibit thermodynamicmelting, but rather appear influenced by a kinetic process. Wehypothesize that the kinetic process responsible for the “melting”of the sugars studied herein (as well as similar materials) is thermaldecomposition; thus, the heating rate dependency “melting”of these materials should be distinguished from thermodynamicmelting.Herein, to prevent confusion, the term“loss of crystallinestructure” will be used instead of melting. Furthermore, sincethermal decomposition is a time-temperature combinationprocess, the loss of crystalline structure occurs not as a single,time independent temperature, but as function of time andtemperature.
Thus, loss of crystalline structure in these sugars can occur attemperatures well below their literature reported “melting”temperatures, if held for a long enough time. Therefore, theultimate objective of this study is to elucidate the fundamentalmechanism underlying the loss of crystalline structure in thesesugars, addressing amajor controversy that currently exists in theliterature. The results of this study are presented in two papers:the present one focuses on thermal analysis for all three sugarsand the following one on chemical analysis (HPLC) for justsucrose. The specific objectives of this part of the study are (1) toexplore the heating rate dependency associated with the loss ofcrystalline structure in sucrose, glucose, and fructose usingstandard DSC (SDSC) and (2) to investigate the underlyingkinetic process responsible for the loss of crystalline structure insucrose, glucose, and fructose using modulated DSC (MDSC)and SDSC/TGA.
MATERIALS AND METHODS
Materials. Crystalline sucrose (g99.5%), D-(-)-fructose (g99.5%),D-(þ)-glucose (99.5%), and mannitol (g99.9%) were purchased from
688 J. Agric. Food Chem., Vol. 59, No. 2, 2011 Lee et al.
Sigma-Aldrich Co. (St. Louis, MO). These analytical reagent gradematerials were used without further purification and stored under roomconditions in their original containers, wrapped tightly with parafilm afteropening. The water contents (wet basis, wb) of the three sugars andmannitol were measured by coulometric Karl Fischer titration withHydranal Coulomat AG as a solvent and were 0.004% wb for sucrose,0.048% wb for glucose, 0.033% wb for fructose, and 0.060% wb formannitol. Material information, including trace anions and cations, forsucrose, glucose, fructose, andmannitol obtained from the Sigma-AldrichCo. and analyzed by the authors of this study is available as SupportingInformation.
Methods. SDSC and stepwise quasi-isothermal MDSC experimentswere carried out using a DSC Q2000 (TA Instruments, New Castle, DE),equipped with a refrigerated cooling system (RCS 90). The TGA experi-mentswere carried out using aTGAQ500 (TA Instruments,NewCastle,DE).
SDSC Experiments. The DSC Q2000 was calibrated for enthalpy(cell constant) and temperature prior to sample measurements. Tempera-ture calibration was performed to correct the difference between the knownmelting temperature of a standard (indium, Tmonset of 156.6 �C, ΔH of28.71 J/g, TA Instruments, New Castle, DE) and its measured meltingtemperature. Hermetic aluminum Tzero pans and lids (TA Instruments,New Castle, DE) were used for all calibration and sample measurements,including an empty pan as the reference. Dry nitrogen, at a flow rate of50 mL/min, was used as the purge gas.
Hermetically sealed sucrose, glucose, and fructose (approximately 2.75 mg)samples were equilibrated at 25 �C and then heated at rates of 2, 5, and10 �C/min over the temperature range where an entire endothermic peakwas obtained. Using a similar method, mannitol (approximately 2 mg)and indium (3.8 mg) were analyzed at heating rates of 1, 5, and 25 �C/min.All samples were measured in triplicate at each heating rate. UniversalAnalysis (UA) software (Version 4.4A, TA Instruments, New Castle, DE)was used to obtain the melting parameters (Tmonset, Tmpeak, and ΔH) andto plot the average heat flow signal of triplicate measurements at eachheating rate against temperature.
Stepwise-Isothermal MDSC Experiments. Stepwise-isothermalMDSC experiments were performed using the modulated mode in theDSC Q2000. In advance of sample measurements, DSC heat capacitycalibration was done using a 22.93 mg sapphire disk (TA Instruments,New Castle, DE) hermetically sealed in a pan for accurate determinationof changes in heat capacity (RevCp). With the same sapphire disk,MDSCheat capacity calibration was conducted using the temperature modula-tion conditions used for the sample measurements; that is, a modulationamplitude of (1.0 �C and a period of 100 s for sucrose, glucose, andfructose, and a modulation amplitude of (0.1 �C and a period of 60 speriod for indium and mannitol. Dry nitrogen purge gas was set at a flowrate of 50 mL/min.
For sample measurements, sucrose (approximately 2 mg) was heatedfrom 80 to 160 �C using a modulation amplitude of (1.0 �C, a period of100 s, a stepwise temperature-increment of 1 �C, and an isothermal timeof 25 min with a data off period of 5 min for initial equilibration. Withthe same modulation conditions as used for sucrose, glucose and fructosewere heated from 70 to 160 �C and from 60 to 120 �C, respectively. Indium(4.7 mg) was heated from 155 to 165 �C using a modulation amplitudeof (0.1 �C, a period of 60 s, a stepwise temperature-increment of 0.1 �C,and an isothermal time of 25 min with a data off period of 5 min for initialequilibration. Mannitol (approximately 2 mg) was heated from 149 to159 �C using the same modulation conditions as in indium. All samplemeasurements were done in duplicate. Results were displayed as plots ofRev Cp, modulated heat flow, and temperature against isothermal timeusing the UA software.
TGA Experiments. The TGA Q500 was calibrated for weight andtemperature in advance of sample measurements. Unlike in DSC, theTGA thermocouple is not in direct contact with the sample pan, whichcauses a larger thermal lag than inDSC. Thus, in order to reduce the effectof this large thermal lag three things were done. First, the TGA thermalcouple was positioned as close as possible to the sample pan. Second, sincethermal lag in TGA becomes larger with increasing heating rate, themaximum heating rate of 10 �C/min (identified via preliminary experi-ments) was used and the TGAwas calibrated at eachheating rate (2, 5, and10 �C/min) using indium (67.05 mg). Indium was used for TGA tempera-ture calibration so as to make the experimental conditions for both TGA
andDSCas identical as possible. Third, helium, at a flow rate of 50mL/min,was used as the furnace purge gas to improve the contact between thesample and the thermocouple. Dry nitrogen at a flow rate of 10 mL/minwas used for the balance purge gas. The DSC Q2000 was also calibratedusing the same methods as described in the SDSC experiments.
For TGA experiments, sucrose, glucose, and fructose (approximately84 mg) were heated at a rate of 2, 5, and 10 �C/min over the same tem-perature range as in the SDSC experiments. Mannitol (approximately25 mg) was heated at a heating rate of 10 �C/min from 25 to 230 �C. AllTGA measurements were done in triplicate. To facilitate comparison, theaverage TGA thermal data were compared with the average SDSCthermal data using the UA software. The TGA thermal data weredisplayed as % weight loss and TGA derivative temperature signalsagainst temperature, while the SDSC thermal data was displayed as heatflow and SDSC derivative temperature signals against temperature.
RESULTS AND DISCUSSION
SDSC Experiments. SDSC experiments were performed inorder to explore the heating rate dependency of themelting param-eters (Tmonset,Tmpeak, andΔH) for sucrose, glucose, and fructoseby comparing to indium, a thermodynamic melting material.Although indium is a well-established thermodynamic meltingmaterial, it is not an organic material like the sugars. It would bedesirable to employ a material more similar to the sugars thanindium, as a comparison thermodynamic melting material. Sugaralcohols, such as mannitol and sorbitol, are frequently used toprevent food products from browning during heat processing,since they are very stable to heat and are thought to melt withoutthermal decomposition (51). Even thoughno literaturewas foundregarding the use of sugar alcohols as comparison thermo-dynamic melting materials, a recent report by Lappalainen et al. (44)used xylitol instead of indium to measure thermal lag in theirexperiments on L- and D-xyloses, noting that xylitol’s meltingbehavior is normal, that is, it appears to be a thermodynamicmelting material. Therefore, mannitol, the alcohol form offructose, and sorbitol, the alcohol form of glucose, were selectedas possible comparison thermodynamic melting materials, inaddition to indium.Throughpreliminary SDSCexperiments (52),mannitol was selected as the comparison material, because itmore closely resembled the thermal behavior of indium.
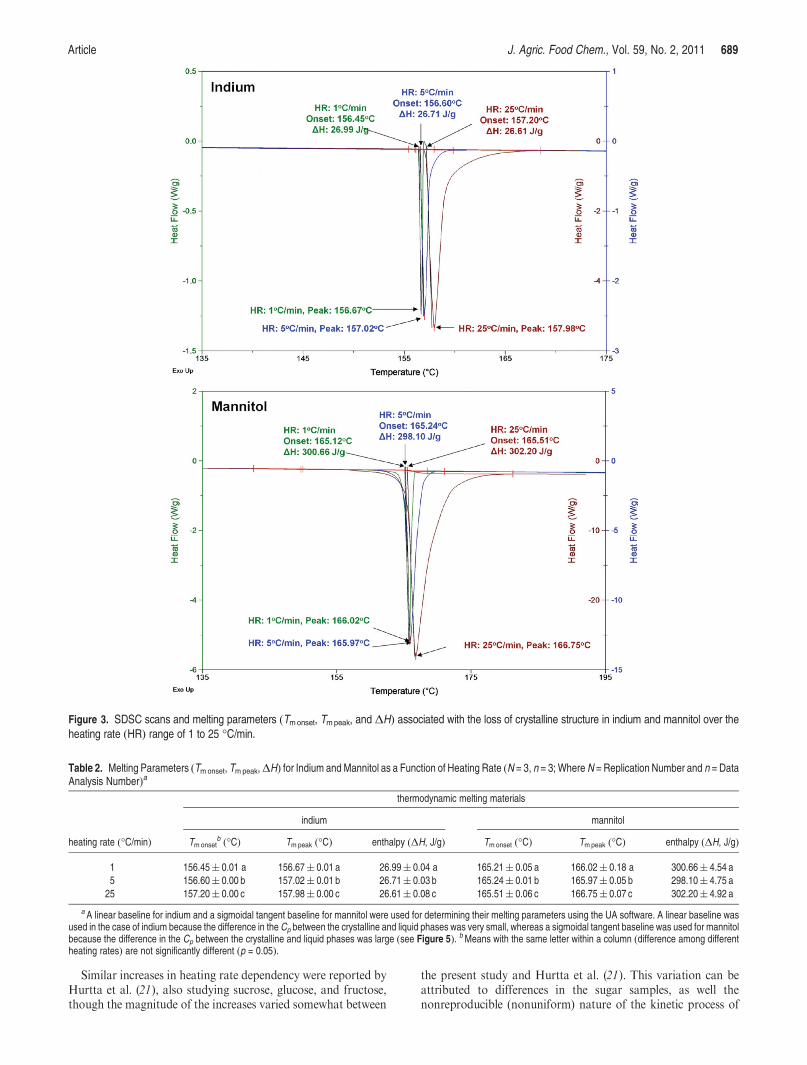
Figure 3 shows themelting parameters (Tmonset,Tmpeak, andΔH)for indiumandmannitol at heating rates of 1, 5, and 25 �C/min. Forboth indium and mannitol these parameters did not exhibit signifi-cant heating rate dependency. Over the heating rate range of 1 to25 �C/min, Tmonset and Tmpeak for indium increased by 0.75 and1.31 �C, respectively, and ΔH changed by 0.38 J/g. Similar toindium, mannitol showed only a slight increase in Tmonset andTmpeak, 0.30 and 0.73 �C, respectively, andΔH changed by 1.54 J/g.Although the differences in Tmonset and Tmpeak for indium andmannitol were statistically significant (p = 0.05) as a function ofheating rate (Table 2), the difference is not meaningful, rather theresult of a very small standard deviation. In addition to similar Tm
parameters, the endothermic peak shape of mannitol was verysimilar to that of indium, however mannitol exhibited a larger ΔHstandard deviation. These results suggest that the use of mannitol asa thermodynamic melting comparison material is justified.
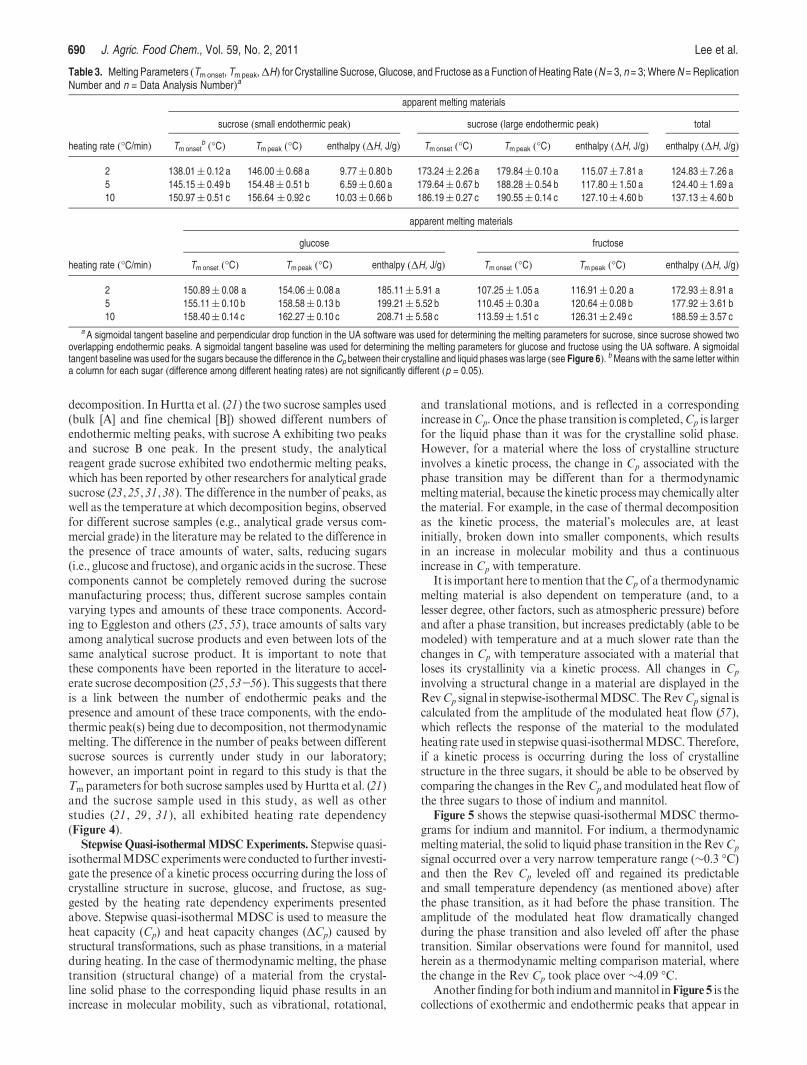
Unlike indium and mannitol, the melting parameters ofsucrose, glucose, and fructose (Table 3) exhibited strong heatingrate dependency as shown inFigure 4. Over the heating rate rangeof 2 to 10 �C/min,Tmonset,Tmpeak, andΔH increased by 12.95 �C,10.71 �C, and 12.03 J/g for sucrose (large endothermic peak),by 7.51 �C, 8.21 �C, and 23.60 J/g for glucose, and by 6.34 �C,9.40 �C, and 15.66 J/g for fructose, respectively. This strong heatingrate dependency suggests that there is a kinetic process associatedwith the loss of crystalline structure occurring in these sugars.
Article J. Agric. Food Chem., Vol. 59, No. 2, 2011 689
Similar increases in heating rate dependency were reported byHurtta et al. (21), also studying sucrose, glucose, and fructose,though the magnitude of the increases varied somewhat between
the present study and Hurtta et al. (21). This variation can beattributed to differences in the sugar samples, as well thenonreproducible (nonuniform) nature of the kinetic process of
Figure 3. SDSC scans and melting parameters (Tmonset, Tmpeak, and ΔH) associated with the loss of crystalline structure in indium and mannitol over theheating rate (HR) range of 1 to 25 �C/min.
Table 2. Melting Parameters (Tmonset, Tmpeak,ΔH) for Indium and Mannitol as a Function of Heating Rate (N = 3, n = 3; WhereN = Replication Number and n = DataAnalysis Number)a
thermodynamic melting materials
indium mannitol
heating rate (�C/min) Tmonsetb (�C) Tmpeak (�C) enthalpy (ΔH, J/g) Tmonset (�C) Tmpeak (�C) enthalpy (ΔH, J/g)
1 156.45( 0.01 a 156.67( 0.01 a 26.99( 0.04 a 165.21( 0.05 a 166.02( 0.18 a 300.66( 4.54 a
5 156.60( 0.00 b 157.02( 0.01 b 26.71( 0.03 b 165.24( 0.01 b 165.97( 0.05 b 298.10( 4.75 a
25 157.20( 0.00 c 157.98( 0.00 c 26.61( 0.08 c 165.51( 0.06 c 166.75( 0.07 c 302.20( 4.92 a
aA linear baseline for indium and a sigmoidal tangent baseline for mannitol were used for determining their melting parameters using the UA software. A linear baseline wasused in the case of indium because the difference in the Cp between the crystalline and liquid phases was very small, whereas a sigmoidal tangent baseline was used for mannitolbecause the difference in the Cp between the crystalline and liquid phases was large (see Figure 5).
bMeans with the same letter within a column (difference among differentheating rates) are not significantly different (p = 0.05).
690 J. Agric. Food Chem., Vol. 59, No. 2, 2011 Lee et al.
decomposition. InHurtta et al. (21) the two sucrose samples used(bulk [A] and fine chemical [B]) showed different numbers ofendothermic melting peaks, with sucrose A exhibiting two peaksand sucrose B one peak. In the present study, the analyticalreagent grade sucrose exhibited two endothermic melting peaks,which has been reported by other researchers for analytical gradesucrose (23,25,31,38). The difference in the number of peaks, aswell as the temperature at which decomposition begins, observedfor different sucrose samples (e.g., analytical grade versus com-mercial grade) in the literature may be related to the difference inthe presence of trace amounts of water, salts, reducing sugars(i.e., glucose and fructose), and organic acids in the sucrose. Thesecomponents cannot be completely removed during the sucrosemanufacturing process; thus, different sucrose samples containvarying types and amounts of these trace components. Accord-ing to Eggleston and others (25, 55), trace amounts of salts varyamong analytical sucrose products and even between lots of thesame analytical sucrose product. It is important to note thatthese components have been reported in the literature to accel-erate sucrose decomposition (25,53-56). This suggests that thereis a link between the number of endothermic peaks and thepresence and amount of these trace components, with the endo-thermic peak(s) being due to decomposition, not thermodynamicmelting. The difference in the number of peaks between differentsucrose sources is currently under study in our laboratory;however, an important point in regard to this study is that theTm parameters for both sucrose samples used byHurtta et al. (21)and the sucrose sample used in this study, as well as otherstudies (21 , 29 , 31 ), all exhibited heating rate dependency(Figure 4).
Stepwise Quasi-isothermal MDSC Experiments. Stepwise quasi-isothermalMDSCexperiments were conducted to further investi-gate the presence of a kinetic process occurring during the loss ofcrystalline structure in sucrose, glucose, and fructose, as sug-gested by the heating rate dependency experiments presentedabove. Stepwise quasi-isothermal MDSC is used to measure theheat capacity (Cp) and heat capacity changes (ΔCp) caused bystructural transformations, such as phase transitions, in a materialduring heating. In the case of thermodynamic melting, the phasetransition (structural change) of a material from the crystal-line solid phase to the corresponding liquid phase results in anincrease in molecular mobility, such as vibrational, rotational,
and translational motions, and is reflected in a correspondingincrease inCp. Once the phase transition is completed,Cp is largerfor the liquid phase than it was for the crystalline solid phase.However, for a material where the loss of crystalline structureinvolves a kinetic process, the change in Cp associated with thephase transition may be different than for a thermodynamicmeltingmaterial, because the kinetic processmay chemically alterthe material. For example, in the case of thermal decompositionas the kinetic process, the material’s molecules are, at leastinitially, broken down into smaller components, which resultsin an increase in molecular mobility and thus a continuousincrease in Cp with temperature.
It is important here tomention that theCp of a thermodynamicmelting material is also dependent on temperature (and, to alesser degree, other factors, such as atmospheric pressure) beforeand after a phase transition, but increases predictably (able to bemodeled) with temperature and at a much slower rate than thechanges in Cp with temperature associated with a material thatloses its crystallinity via a kinetic process. All changes in Cp
involving a structural change in a material are displayed in theRevCp signal in stepwise-isothermalMDSC. TheRevCp signal iscalculated from the amplitude of the modulated heat flow (57),which reflects the response of the material to the modulatedheating rate used in stepwise quasi-isothermalMDSC. Therefore,if a kinetic process is occurring during the loss of crystallinestructure in the three sugars, it should be able to be observed bycomparing the changes in the RevCp andmodulated heat flow ofthe three sugars to those of indium and mannitol.
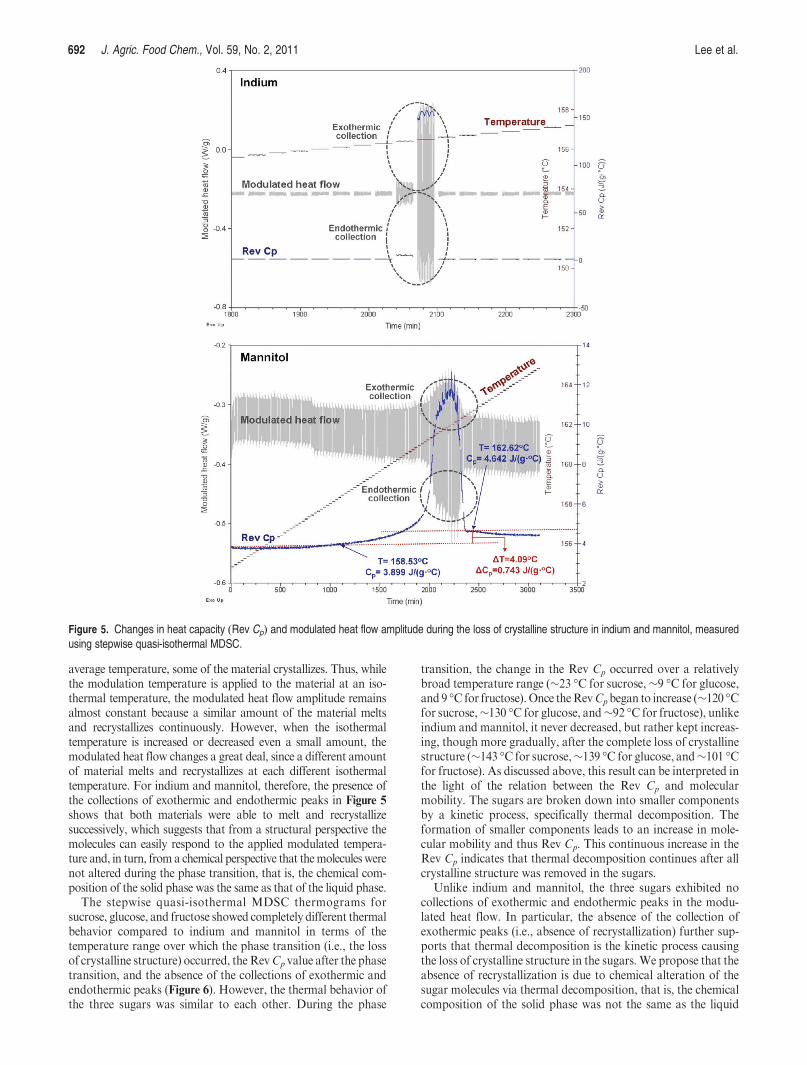
Figure 5 shows the stepwise quasi-isothermal MDSC thermo-grams for indium and mannitol. For indium, a thermodynamicmeltingmaterial, the solid to liquid phase transition in the RevCp
signal occurred over a very narrow temperature range (∼0.3 �C)and then the Rev Cp leveled off and regained its predictableand small temperature dependency (as mentioned above) afterthe phase transition, as it had before the phase transition. Theamplitude of the modulated heat flow dramatically changedduring the phase transition and also leveled off after the phasetransition. Similar observations were found for mannitol, usedherein as a thermodynamic melting comparison material, wherethe change in the Rev Cp took place over ∼4.09 �C.
Another finding for both indiumandmannitol inFigure 5 is thecollections of exothermic and endothermic peaks that appear in
Table 3. Melting Parameters (Tmonset, Tmpeak,ΔH) for Crystalline Sucrose, Glucose, and Fructose as a Function of Heating Rate (N = 3, n = 3;WhereN = ReplicationNumber and n = Data Analysis Number)a
apparent melting materials
sucrose (small endothermic peak) sucrose (large endothermic peak) total
heating rate (�C/min) Tmonsetb (�C) Tmpeak (�C) enthalpy (ΔH, J/g) Tmonset (�C) Tmpeak (�C) enthalpy (ΔH, J/g) enthalpy (ΔH, J/g)
2 138.01( 0.12 a 146.00( 0.68 a 9.77( 0.80 b 173.24( 2.26 a 179.84( 0.10 a 115.07( 7.81 a 124.83( 7.26 a
5 145.15( 0.49 b 154.48( 0.51 b 6.59( 0.60 a 179.64( 0.67 b 188.28( 0.54 b 117.80( 1.50 a 124.40( 1.69 a
10 150.97( 0.51 c 156.64 ( 0.92 c 10.03( 0.66 b 186.19( 0.27 c 190.55( 0.14 c 127.10( 4.60 b 137.13( 4.60 b
apparent melting materials
glucose fructose
heating rate (�C/min) Tmonset (�C) Tmpeak (�C) enthalpy (ΔH, J/g) Tmonset (�C) Tmpeak (�C) enthalpy (ΔH, J/g)
2 150.89( 0.08 a 154.06( 0.08 a 185.11( 5.91 a 107.25( 1.05 a 116.91( 0.20 a 172.93( 8.91 a
5 155.11( 0.10 b 158.58( 0.13 b 199.21( 5.52 b 110.45( 0.30 a 120.64( 0.08 b 177.92( 3.61 b
10 158.40( 0.14 c 162.27( 0.10 c 208.71( 5.58 c 113.59( 1.51 c 126.31( 2.49 c 188.59( 3.57 c
aA sigmoidal tangent baseline and perpendicular drop function in the UA software was used for determining the melting parameters for sucrose, since sucrose showed twooverlapping endothermic peaks. A sigmoidal tangent baseline was used for determining the melting parameters for glucose and fructose using the UA software. A sigmoidaltangent baseline was used for the sugars because the difference in theCp between their crystalline and liquid phases was large (see Figure 6).
bMeans with the same letter withina column for each sugar (difference among different heating rates) are not significantly different (p = 0.05).
Article J. Agric. Food Chem., Vol. 59, No. 2, 2011 691
the modulated heat flow during the phase transition. These collec-tions of peaks are the result of the sinusoidal heat/cool temperatureprofile used in the stepwise quasi-isothermal MDSC experiment.
During the phase transition, when the modulation temperatureincreases above the average temperature, some of the materialmelts, and when the modulation temperature drops below the
Figure 4. SDSC scans andmelting parameters (Tmonset, Tmpeak, andΔH) associated with the loss of crystalline structure in sucrose, glucose, and fructose atheating rates (HR) of 2, 5, and 10 �C/min.
692 J. Agric. Food Chem., Vol. 59, No. 2, 2011 Lee et al.
average temperature, some of the material crystallizes. Thus, whilethe modulation temperature is applied to the material at an iso-thermal temperature, the modulated heat flow amplitude remainsalmost constant because a similar amount of the material meltsand recrystallizes continuously. However, when the isothermaltemperature is increased or decreased even a small amount, themodulated heat flow changes a great deal, since a different amountof material melts and recrystallizes at each different isothermaltemperature. For indium and mannitol, therefore, the presence ofthe collections of exothermic and endothermic peaks in Figure 5
shows that both materials were able to melt and recrystallizesuccessively, which suggests that from a structural perspective themolecules can easily respond to the applied modulated tempera-ture and, in turn, from a chemical perspective that themolecules werenot altered during the phase transition, that is, the chemical com-position of the solid phase was the same as that of the liquid phase.
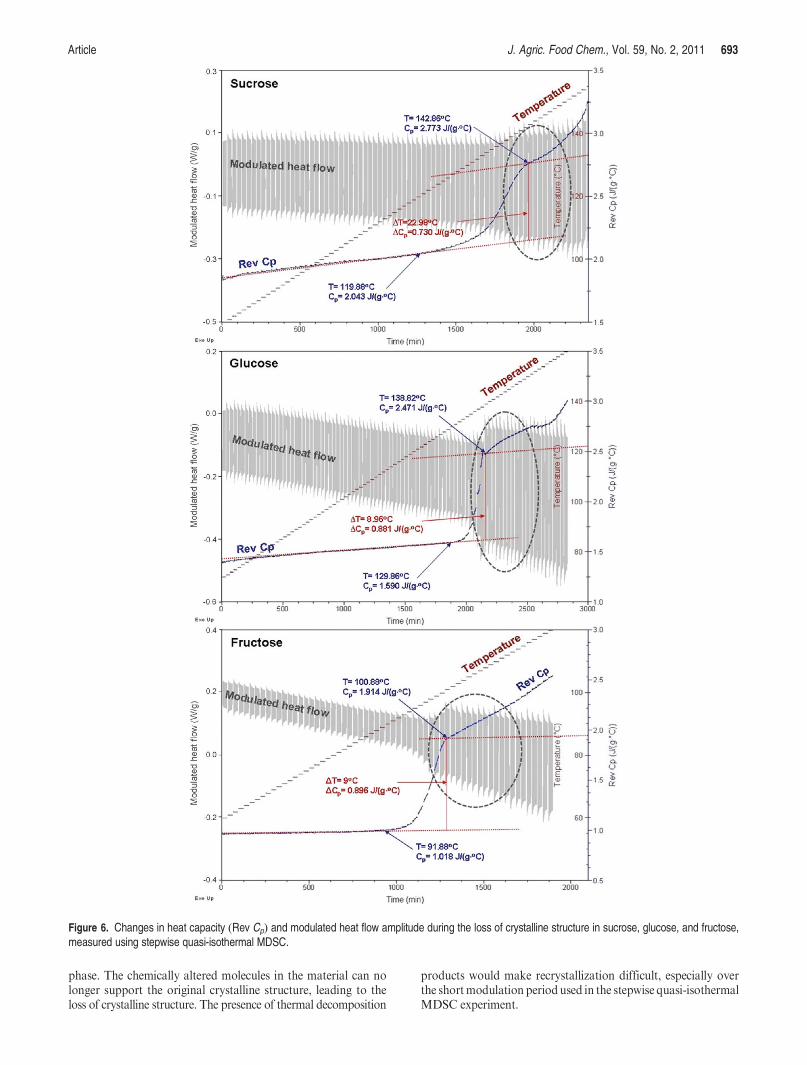
The stepwise quasi-isothermal MDSC thermograms forsucrose, glucose, and fructose showed completely different thermalbehavior compared to indium and mannitol in terms of thetemperature range over which the phase transition (i.e., the lossof crystalline structure) occurred, theRevCp value after the phasetransition, and the absence of the collections of exothermic andendothermic peaks (Figure 6). However, the thermal behavior ofthe three sugars was similar to each other. During the phase
transition, the change in the Rev Cp occurred over a relativelybroad temperature range (∼23 �C for sucrose,∼9 �C for glucose,and 9 �C for fructose). Once theRevCpbegan to increase (∼120 �Cfor sucrose,∼130 �C for glucose, and∼92 �C for fructose), unlikeindium and mannitol, it never decreased, but rather kept increas-ing, though more gradually, after the complete loss of crystallinestructure (∼143 �C for sucrose,∼139 �C for glucose, and∼101 �Cfor fructose). As discussed above, this result can be interpreted inthe light of the relation between the Rev Cp and molecularmobility. The sugars are broken down into smaller componentsby a kinetic process, specifically thermal decomposition. Theformation of smaller components leads to an increase in mole-cular mobility and thus Rev Cp. This continuous increase in theRev Cp indicates that thermal decomposition continues after allcrystalline structure was removed in the sugars.
Unlike indium and mannitol, the three sugars exhibited nocollections of exothermic and endothermic peaks in the modu-lated heat flow. In particular, the absence of the collection ofexothermic peaks (i.e., absence of recrystallization) further sup-ports that thermal decomposition is the kinetic process causingthe loss of crystalline structure in the sugars. We propose that theabsence of recrystallization is due to chemical alteration of thesugar molecules via thermal decomposition, that is, the chemicalcomposition of the solid phase was not the same as the liquid
Figure 5. Changes in heat capacity (Rev Cp) and modulated heat flow amplitude during the loss of crystalline structure in indium and mannitol, measuredusing stepwise quasi-isothermal MDSC.
Article J. Agric. Food Chem., Vol. 59, No. 2, 2011 693
phase. The chemically altered molecules in the material can nolonger support the original crystalline structure, leading to theloss of crystalline structure. The presence of thermal decomposition
products would make recrystallization difficult, especially overthe shortmodulation periodused in the stepwise quasi-isothermalMDSC experiment.
Figure 6. Changes in heat capacity (Rev Cp) and modulated heat flow amplitude during the loss of crystalline structure in sucrose, glucose, and fructose,measured using stepwise quasi-isothermal MDSC.
694 J. Agric. Food Chem., Vol. 59, No. 2, 2011 Lee et al.
Another possible explanation for the absence of the collectionof exothermic peaks is mutarotation. Once the loss of crystallinestructure is initiated, mutarotation can occur and the tautomer(s)formed could interfere with the recrystallization process (especiallyover the short MDSC experimental time frame as mentionedabove). Two observations make it very unlikely that mutarota-tion is solely responsible for the absence of the collection ofexothermic peaks observed in Figure 6. First, mutarotation is notpossible in the case of sucrose, so the absence of the collection ofexothermic peaks for sucrose cannot be explained by mutarota-tion only, leaving thermal decomposition as the likely cause.Second, even if mutarotation were responsible for the absence ofthe collectionof exothermic peaks, itwouldnot be the cause of theheating rate dependency ofTmonset, sincemutarotation affects thepeak shape parameters (Tmpeak and ΔH), but not the beginningof the loss of crystalline structure (Tmonset), as previously discussedin the Introduction. Thus, mutarotation may occur in additionto thermal decomposition in the case of glucose and fructose, butfor the reasonsgivenabove, it is not solely responsible for the absenceof the collection of exothermic peaks observed in Figure 6.
It is important here to clarify the role of mutarotation in sugarmelting hypothesized by Tombari et al. (46). As discussed in theIntroduction, Tombari et al. (46) proposed thatmutarotationwasthe cause of the loss of crystalline structure in isomerizable sugars,e.g., glucose, fructose, and galactose. However, we found thatsucrose, a nonisomerizable sugar, exhibited the same behavior asthe isomerizable sugars (glucose, fructose, and galactose studiedby Tombari et al. (46) and glucose and fructose studied herein),which leads us back to our hypothesis that thermal decompositionis responsible for the loss of crystalline structure in the three sugars.
A number of publications have implicated that thermal decom-position accompanies (along with or right after) sugar melting insucrose, glucose, and fructose (1, 21, 25, 30, 37, 45, 48-50, 58).The critical difference between our conclusion regarding the roleof thermal decomposition in sugar melting and others is that wepropose that thermal decomposition is the kinetic process that isresponsible for the loss of crystalline structure in sucrose, glucose,and fructose; not that thermal decomposition occurs in additionto thermodynamic melting. Thermal decomposition, through theinput of heat energy (enthalpy), gives rise to alterations in thechemistry of the molecules (i.e., intramolecular bond breaking,for example, the glycosidic bond between glucose and fructose inthe sucrose molecule) that compose the crystalline matrix. Oncethese intramolecular bonds begin to break, the molecules can nolongermaintain their original crystalline structure, resulting in theloss of crystalline structure (matrix is now amorphous) and acommensurate increase in enthalpy equal to the absolute differ-ence in enthalpy (ΔH, J/g) between the crystalline and amorphousphases (as previously discussed in association with Figure 2).However, in the case of thermal decomposition as the kineticprocess this enthalpy value is not a constant, as it is in
thermodynamic melting (i.e., heating rate independent), butrather increases as the temperature at which thermal decom-position occurs increases (i.e., heating rate dependent). There-fore, the enthalpy of the endothermic “melting” peaks for sucrose,glucose, and fructose in Figure 4 includes both the enthalpyrequired for bond breaking due to thermal decomposition andthe enthalpy (ΔH, J/g) required for amorphization (loss ofcrystalline structure) at the temperature at which thermaldecomposition begins. A possible apparent paradox that mayconcern some readers (mentioned by one of the reviewers) is “ifsucrose crystals can be grown in the midst of impuritiescontained in the mother liquor (at levels far greater than shownin Part II) why then should chemical conversion on a relativelyminor scale result in destruction of the crystalline structure?”Animportant point to consider in answering this question is thedifference between the ability of sucrose molecules in a super-saturated liquid environment (e.g., mother liquor) to developorder in the presence of impurities and the ability of sucrosemolecules in a solid crystalline array to retain order once thesucrose molecules holding the crystal lattice together begin tobreak down, forming impurities. In the first case, the impuritiesare present in the mother liquor naturally or due to the refiningprocess (e.g., residual glucose and fructose, salt, and insolublesubstances) and serve to slow down crystal growth, but do notprevent it. However, in the second case, the impurities (e.g.,glucose, fructose, 5-HMF, oligosaccharides, and organic acids)are formed as a consequence of the decomposition of the sucrosemolecules holding the crystal lattice together, resulting in thefalling apart of the crystalline structure. Once a sufficientquantity of the crystalline structure is eliminated throughdecomposition, it may be possible for the amorphousmolecules,including sucrose and the decomposition components, to re-crystallize. However, due to the heterogeneity of the resultantamorphous mix, it would require significant molecular mobilityfor recrystallization to occur, which is one of the importantfactors in determining the time frame (minutes to years) of therecrystallization process. We do know that the time frame ismuch slower than that allowed during the stepwise quasi-isothermal MDSC experiment, due to the absence of the collec-tions of exothermic and endothermic peaks.
Finally, because of the fundamental differences between the lossof crystalline structure caused by a kinetic process, such as thermaldecomposition proposed herein, and the loss of crystallinestructure caused by thermodynamic melting, we propose imple-mentation of a new term, “apparent melting”, to describe the lossof crystalline structure caused by a kinetic process. Apparentmelting is the amorphization of a material at temperatures belowthe thermodynamic melting temperature caused by a kineticprocess. Kinetic processes that can cause apparent meltinginclude decomposition (studied herein), dehydration (59-63),and chemical interactions/reactions (64-69).Table 4 summarizes
Table 4. Similarities and Differences between Thermodynamic Melting and Apparent Melting
thermodynamic melting apparent melting (caused by thermal decomposition)
similarities loss of crystalline structure
produces an endothermic peak
differences a single temperature temperature depending on heating rate
time-independent time-dependent (kinetics)
constant ΔH (amorphization enthalpy at constant T) variable ΔH (amorphization enthalpy dependent
on heating rate plus decomposition)
no chemical alteration in material’s molecules
(pure crystalline material = pure liquid material)
chemical alteration in material’s molecules
(pure crystalline material 6¼ chemically altered liquid)
cause: phases have equal Gibbs energy (ΔG = 0) cause: kinetic process, e.g., thermal decomposition
Article J. Agric. Food Chem., Vol. 59, No. 2, 2011 695
the similarities and differences between thermodynamic meltingand apparent melting specifically caused via thermal decomposi-tion. In general, the enthalpy associated with apparent meltingmay be larger or smaller than that associated with thermo-dynamicmelting, since although amorphization is always an endo-thermic process (increase in entropy), the kinetic process maycontain both endothermic (making ΔH larger) and exothermic(making ΔH smaller) events.
TGA Experiments. TGA experiments were performed andcompared to the SDSC experiments (previously discussed) inan attempt to further investigate our hypothesis that thermaldecomposition is the kinetic process causing the loss of crystallinestructure in the three sugars, regardless of the heating rateemployed. Although TGA is generally utilized for investigatingkinetic processes, it cannot uniquely identify the specific type ofkinetic process.
A comparison was made between the SDSC measured tem-perature (Tmonset), at which the phase transition (the loss ofcrystalline structure) occurs, and the TGAmeasured temperature(Ti), at which weight loss occurs, hypothesized to be due tothermal decomposition, for the three sugars at the three differentheating rates (2, 5, and 10 �C/min). The SDSC and TGA thermaldata for the sugars were also compared to that for mannitol, as acomparison thermodynamic melting material. In addition tocomparing Tmonset and Ti, SDSC and TGA derivative tempera-ture signals (in units of �C/min) were used to monitor changes inthe heating rate of the sugars during the phase transition to moreaccurately compare the SDSC and TGA thermal data.
It is difficult to ensure the accurate comparison of SDSC andTGA thermal data. Thus, it would be helpful to have an internalindicator (i.e., within the TGA experiment) of the temperature atwhich the sample undergoes its crystalline to amorphous phasetransition (provided also by the external SDSC experiment). Thederivative temperature signal provides this internal indicator,since when a sample undergoes a crystalline to amorphous phasetransition the heating rate of the sample exhibits an abruptdecrease. This abrupt decrease in the derivative temperaturesignal results from the fact that during the phase transition thesample cannot keep up with the predetermined heating rate, dueto the large amount of energy required for the phase transition.Thus, the abrupt decrease in the derivative temperature signal
indicates the temperature at which the loss of crystalline structurein the sugars begins within the TGA experiment. This same phasetransition temperature is also obtained via the SDSC experiment(both as the heat flow signal and the SDSC derivative tempera-ture signal), but is an external indicator (is from a separateinstrument) used for comparisonwith the TGAexperimental data.
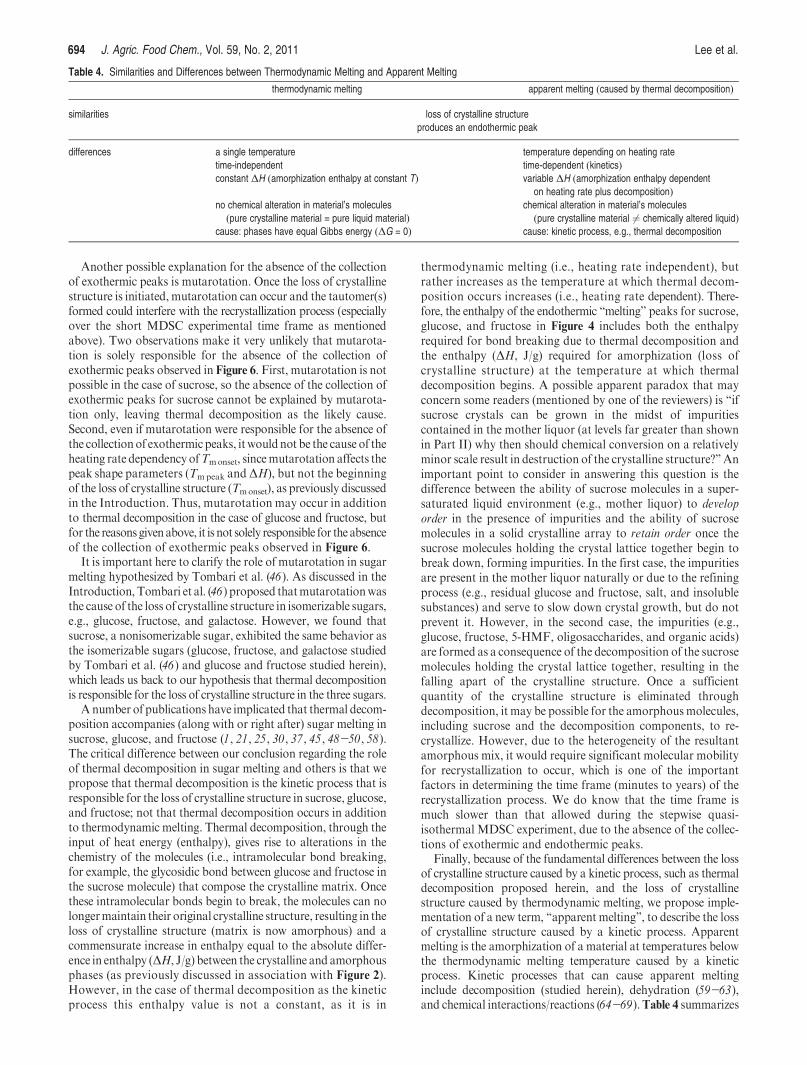
Figure 7 shows the SDSCandTGA thermograms for indiumata heating rate of 10 �C/min. An abrupt decrease in the TGAderivative temperature signal was observed at the same tempera-ture (as measured using the extrapolated onset point) as thethermodynamic melting temperature of indium (156.6 �C), and,as expected, no weight loss in the TGA weight loss signalwas observed, since, based on literature findings, indium doesnot experience any weight loss events until its boiling point at2080 �C (70).
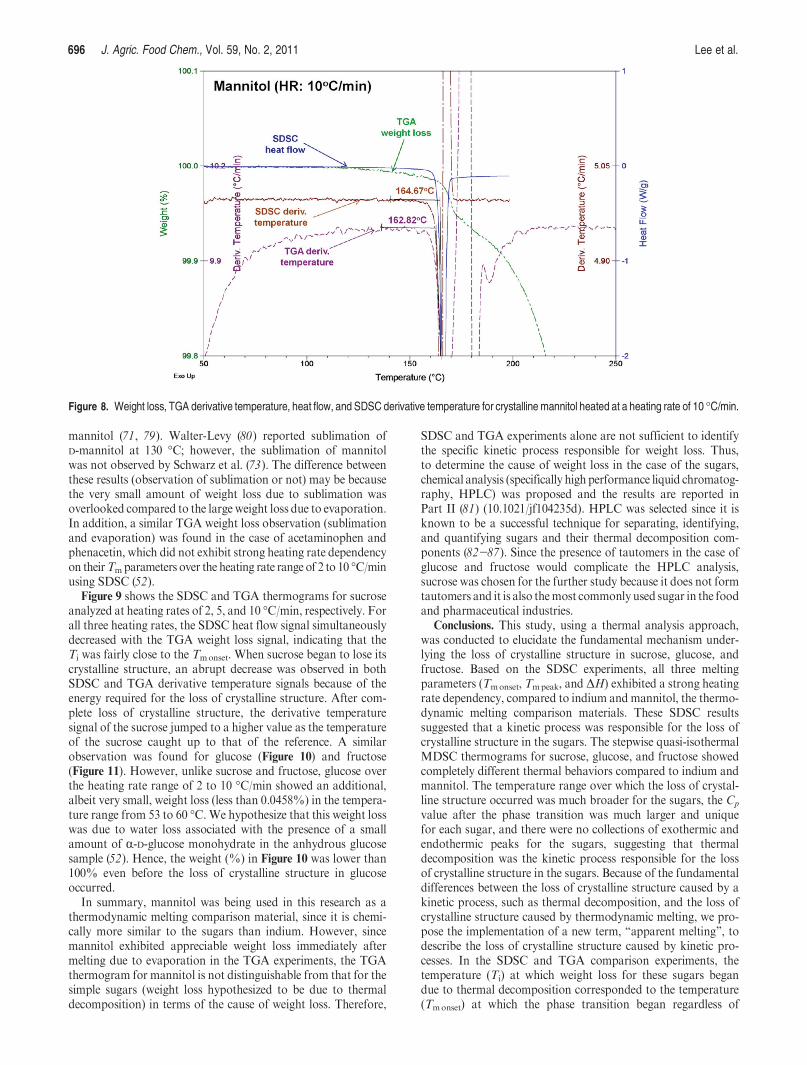
Figure 8 shows the SDSC and TGA thermograms formannitolat a heating rate of 10 �C/min. Originally, no weight loss wasexpected for mannitol, because it exhibited similar thermalbehavior to indium in the SDCS and stepwise quasi-isothermalMDSC experiments discussed above. However, as can be seen inFigure 8, a large weight loss is observed for mannitol beginning atits melting temperature (Tmonset= 165 �C). This large weight lossis attributed to evaporation of liquid mannitol. Additional infor-mation on the vapor pressure and evaporation of sugar alcoholsis given by Barone et al. (71) and Yan and Suppes (72). Unlikein SDSC, the TGA sample pan is open, allowing evaporation ofvolatile materials. All the mannitol in the sample pan completelyevaporated, without a trace of decomposition (sample pan wasempty and clean), during the TGA experiments (TGA experi-mental end temperature was 290 �C). A number of otherresearchers also observed weight loss after melting for mannitolusing a TGA; however, the temperature at which appreciableweight loss began varied among these studies, ranging fromapproximately 190 to 250 �C (240 �C (73); 230 �C (74);250 �C (75); 190 �C (76)). Two additional studies (77,78) reportedno appreciable weight loss for mannitol after melting using TGA;however, the end temperatures used in these studies were muchlower (200 and 180 �C, respectively) than in the studies thatreported appreciable weight loss.
The small, but gradual, weight loss observed for mannitolbeginning around 120 �C is attributed to the slow sublimation of
Figure 7. Weight loss, TGA derivative temperature, heat flow, and SDSC derivative temperature for indium heated at a heating rate of 10 �C/min.
696 J. Agric. Food Chem., Vol. 59, No. 2, 2011 Lee et al.
mannitol (71, 79). Walter-Levy (80) reported sublimation ofD-mannitol at 130 �C; however, the sublimation of mannitolwas not observed by Schwarz et al. (73). The difference betweenthese results (observation of sublimation or not) may be becausethe very small amount of weight loss due to sublimation wasoverlooked compared to the large weight loss due to evaporation.In addition, a similar TGA weight loss observation (sublimationand evaporation) was found in the case of acetaminophen andphenacetin, which did not exhibit strong heating rate dependencyon theirTmparameters over the heating rate range of 2 to 10 �C/minusing SDSC (52).
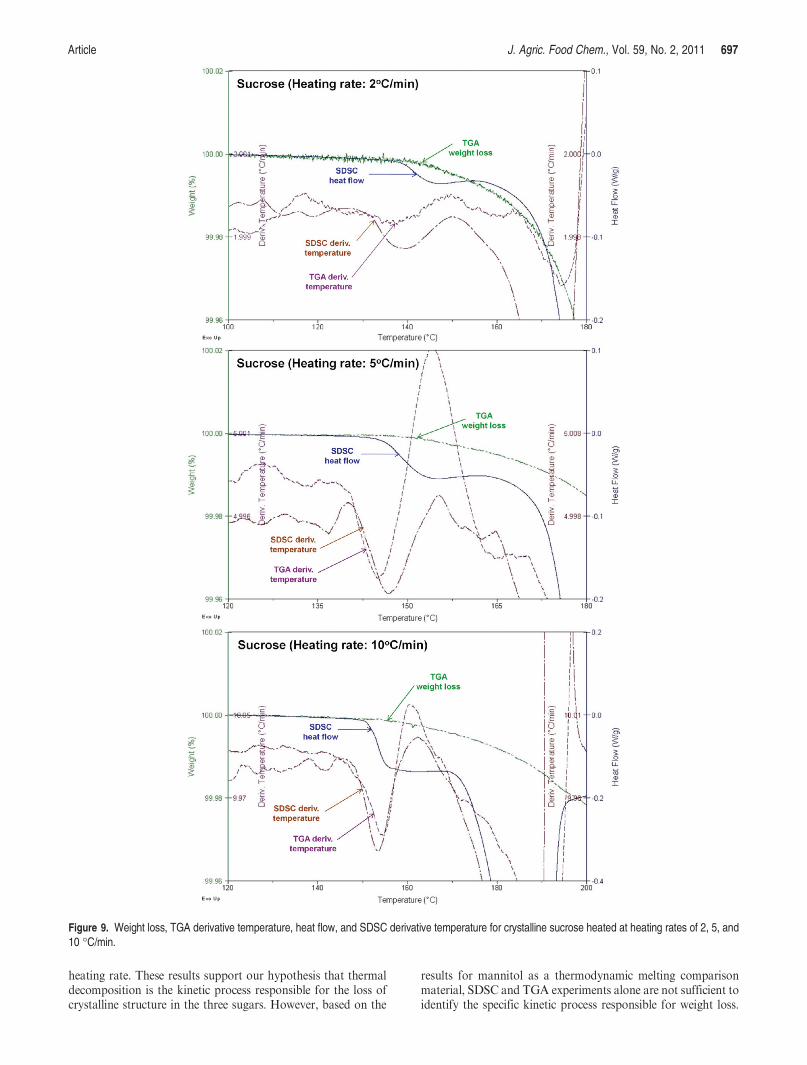
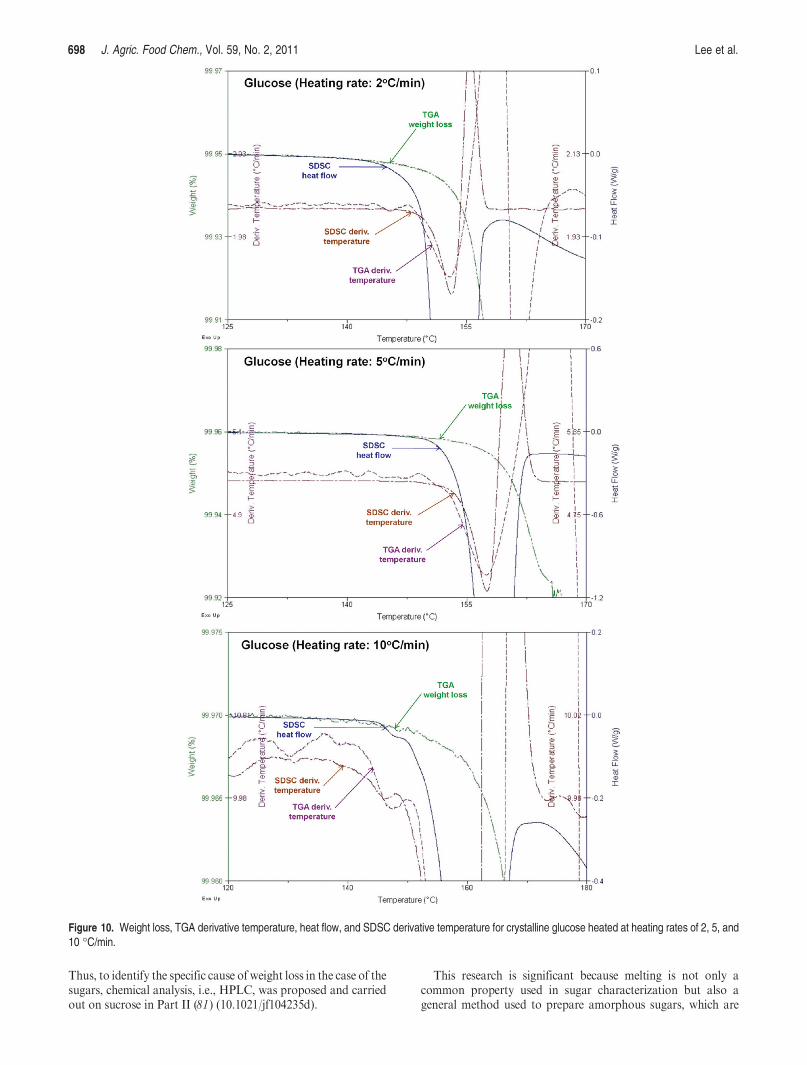
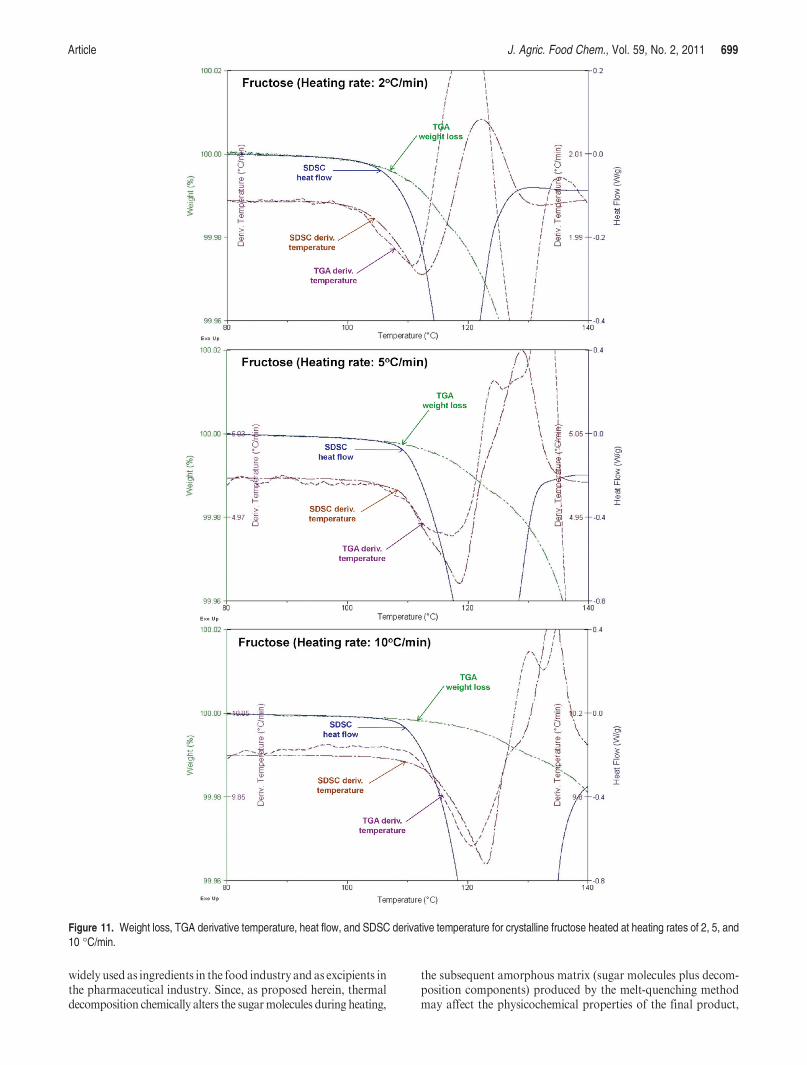
Figure 9 shows the SDSC and TGA thermograms for sucroseanalyzed at heating rates of 2, 5, and 10 �C/min, respectively. Forall three heating rates, the SDSC heat flow signal simultaneouslydecreased with the TGA weight loss signal, indicating that theTi was fairly close to the Tmonset. When sucrose began to lose itscrystalline structure, an abrupt decrease was observed in bothSDSC and TGA derivative temperature signals because of theenergy required for the loss of crystalline structure. After com-plete loss of crystalline structure, the derivative temperaturesignal of the sucrose jumped to a higher value as the temperatureof the sucrose caught up to that of the reference. A similarobservation was found for glucose (Figure 10) and fructose(Figure 11). However, unlike sucrose and fructose, glucose overthe heating rate range of 2 to 10 �C/min showed an additional,albeit very small, weight loss (less than 0.0458%) in the tempera-ture range from 53 to 60 �C.We hypothesize that this weight losswas due to water loss associated with the presence of a smallamount of R-D-glucose monohydrate in the anhydrous glucosesample (52). Hence, the weight (%) in Figure 10 was lower than100% even before the loss of crystalline structure in glucoseoccurred.
In summary, mannitol was being used in this research as athermodynamic melting comparison material, since it is chemi-cally more similar to the sugars than indium. However, sincemannitol exhibited appreciable weight loss immediately aftermelting due to evaporation in the TGA experiments, the TGAthermogram for mannitol is not distinguishable from that for thesimple sugars (weight loss hypothesized to be due to thermaldecomposition) in terms of the cause of weight loss. Therefore,
SDSC and TGA experiments alone are not sufficient to identifythe specific kinetic process responsible for weight loss. Thus,to determine the cause of weight loss in the case of the sugars,chemical analysis (specifically high performance liquid chromatog-raphy, HPLC) was proposed and the results are reported inPart II (81) (10.1021/jf104235d). HPLC was selected since it isknown to be a successful technique for separating, identifying,and quantifying sugars and their thermal decomposition com-ponents (82-87). Since the presence of tautomers in the case ofglucose and fructose would complicate the HPLC analysis,sucrose was chosen for the further study because it does not formtautomers and it is also themost commonly used sugar in the foodand pharmaceutical industries.
Conclusions. This study, using a thermal analysis approach,was conducted to elucidate the fundamental mechanism under-lying the loss of crystalline structure in sucrose, glucose, andfructose. Based on the SDSC experiments, all three meltingparameters (Tmonset, Tmpeak, and ΔH) exhibited a strong heatingrate dependency, compared to indium and mannitol, the thermo-dynamic melting comparison materials. These SDSC resultssuggested that a kinetic process was responsible for the loss ofcrystalline structure in the sugars. The stepwise quasi-isothermalMDSC thermograms for sucrose, glucose, and fructose showedcompletely different thermal behaviors compared to indium andmannitol. The temperature range over which the loss of crystal-line structure occurred was much broader for the sugars, the Cp
value after the phase transition was much larger and uniquefor each sugar, and there were no collections of exothermic andendothermic peaks for the sugars, suggesting that thermaldecomposition was the kinetic process responsible for the lossof crystalline structure in the sugars. Because of the fundamentaldifferences between the loss of crystalline structure caused by akinetic process, such as thermal decomposition, and the loss ofcrystalline structure caused by thermodynamic melting, we pro-pose the implementation of a new term, “apparent melting”, todescribe the loss of crystalline structure caused by kinetic pro-cesses. In the SDSC and TGA comparison experiments, thetemperature (Ti) at which weight loss for these sugars begandue to thermal decomposition corresponded to the temperature(Tmonset) at which the phase transition began regardless of
Figure 8. Weight loss, TGA derivative temperature, heat flow, and SDSCderivative temperature for crystallinemannitol heated at a heating rate of 10 �C/min.
Article J. Agric. Food Chem., Vol. 59, No. 2, 2011 697
heating rate. These results support our hypothesis that thermaldecomposition is the kinetic process responsible for the loss ofcrystalline structure in the three sugars. However, based on the
results for mannitol as a thermodynamic melting comparisonmaterial, SDSC and TGA experiments alone are not sufficient toidentify the specific kinetic process responsible for weight loss.
Figure 9. Weight loss, TGA derivative temperature, heat flow, and SDSC derivative temperature for crystalline sucrose heated at heating rates of 2, 5, and10 �C/min.
698 J. Agric. Food Chem., Vol. 59, No. 2, 2011 Lee et al.
Thus, to identify the specific cause of weight loss in the case of thesugars, chemical analysis, i.e., HPLC, was proposed and carriedout on sucrose in Part II (81) (10.1021/jf104235d).
This research is significant because melting is not only acommon property used in sugar characterization but also ageneral method used to prepare amorphous sugars, which are
Figure 10. Weight loss, TGA derivative temperature, heat flow, and SDSC derivative temperature for crystalline glucose heated at heating rates of 2, 5, and10 �C/min.
Article J. Agric. Food Chem., Vol. 59, No. 2, 2011 699
widely used as ingredients in the food industry and as excipients inthe pharmaceutical industry. Since, as proposed herein, thermaldecomposition chemically alters the sugarmolecules during heating,
the subsequent amorphous matrix (sugar molecules plus decom-position components) produced by the melt-quenching methodmay affect the physicochemical properties of the final product,
Figure 11. Weight loss, TGA derivative temperature, heat flow, and SDSC derivative temperature for crystalline fructose heated at heating rates of 2, 5, and10 �C/min.
700 J. Agric. Food Chem., Vol. 59, No. 2, 2011 Lee et al.
such as glass transition temperature, textural attributes, flavorprofile and ability to protect active pharmaceutical components,as well as the product’s shelf life.
ACKNOWLEDGMENT
The authors acknowledge with thanks the technical support ofTA Instruments in New Castle, DE, the analytical supportof Tate & Lyle in Decatur, IL, and Rudiger Laufhutte, Directorof theMicroanalysis Laboratory, School of Chemical Sciences atthe University of Illinois at Urbana-Champaign.
Supporting Information Available:Material information for
sucrose and mannitol obtained from the Sigma-Aldrich Co. and
analyzed by the authors of this study. This material is available
free of charge via the Internet at http://pubs.acs.org.
LITERATURE CITED
(1) Roos, Y. H. Food components and polymers. InPhase Transitions inFoods, 1st ed.; Taylor, S. L., Ed.; Academic Press: San Diego, CA, 1995;Chapter 5, pp 109-156.
(2) Wunderlich, B. Thermometry. InThermal Analysis, 1st ed.; AcademicPress: San Diego, CA, 1990; Chapter 3, pp 79-121.
(3) Raemy, A.; Schweizer, T. F. Thermal behaviour of carbohydratesstudied by heat flow calorimetry. J. Therm. Anal. 1983, 28, 95-108.
(4) Bonelli, P.; Schebor, C.; Cukierman, A. L.; Buera, M. P.; Chirife, J.Residual moisture content as related to collapse of freeze-dried sugarmatrices. J. Food Sci. 1997, 62 (4), 693-695.
(5) Roos, Y. H.; Karel, M. Differential scanning calorimetry study ofphase transitions affecting the quality of dehydrated materials.Biotechnol. Prog. 1990, 6, 159-163.
(6) Roos, Y. H.; Karel, M. Plasticizing effect of water on thermalbehavior and crystallization of amorphous food models. J. FoodSci. 1991, 56 (1), 38-43.
(7) Weitz, A.; Wunderlich, B. Thermal analysis and dilatometry ofglasses formed under elevated pressure. J. Polym. Sci., Part B:Polym. Phys. 1974, 12, 2473.
(8) Slade, L.; Levine, H. Non-equilibrium behavior of small carbohydrate-water systems. Pure Appl. Chem. 1988, 60 (12), 1841-1864.
(9) Levine, H.; Slade, L. Chapter 3. Interpreting the behavior oflow-moisture foods. In Water and Food Quality, 1st ed.; Hardman,T. M., Ed.; Elsevier Science: London, U.K., 1989; pp 71-134.
(10) Slade, L.; Levine, H. Beyond water activity: Recent advances basedon an alternative approach to the assessment of food quality andsafety. Crit. Rev. Food Sci. Nutr. 1991, 30 (2-3), 115-360.
(11) Gloria, H.; Sievert, D. Changes in the physical state of sucrose duringdark chocolate processing. J. Agric. Food. Chem. 2001, 49, 2433-2436.
(12) Saleki-Gerhardt, A.; Zografi, G. Non-isothermal and isothermalcrystallization of sucrose from the amorphous state. Pharm. Res.1994, 11 (8), 1166-1173.
(13) Vanhal, I.; Blond,G. Impact ofmelting conditions of sucrose on its glasstransition temperature. J. Agric. Food. Chem. 1999, 47, 4285-4290.
(14) Smidova, I.; Copikova, J.; Maryska,M.; Coimbra, M. A. Crystals inhard candies. Czech. J. Food Sci. 2003, 21, 185-191.
(15) Wungtanagorn, R.; Schmidt, S. J. Phenomenological study ofenthalpy relaxation of amorphous glucose, fructose, and theirmixture. Thermochim. Acta 2001, 369, 95-116.
(16) Wungtanagorn, R.; Schmidt, S. J. Thermodynamic properties andkinetics of the physical aging of amorphous glucose, fructose, andtheir mixture. J. Therm. Anal. Calorim. 2001, 65, 9-35.
(17) Fan, J.; Angell, C. A. Relaxational transitions and ergodicity breakingwithin the fluid state: the sugars fructose and galactose. Thermochim.Acta 1995, 266, 9-30.
(18) Truong, V.; Bandari, B. R.; Howes, T.; Adhikari, B. Physical agingof amorphous fructose. J. Food Sci. 2002, 67 (8), 3011-3018.
(19) Truong, V.; Bandari, B. R.; Howes, T.; Adhikari, B. Glass transi-tion behaviour of fructose. Int. J. Food Sci. Technol. 2004, 39,569-578.
(20) Wunderlich, B. Differential thermal analysis. In Thermal Analysis,1st ed.; Academic Press: San Diego, CA, 1990; Chapter 4, pp 123-218.
(21) Hurtta, M.; Pitkanen, I.; Knuutinen, J. Melting behaviour ofD-sucrose, D-glucose and D-fructose. Carbohydr. Res. 2004, 339,2267-2273.
(22) Cassel, R. B. TA283. How TzeroTM technology improves DSCperformance. Part V: Reducing thermal lag. TA instruments homepage: Applications library search. TA instruments: New Castle, DE,2008. http://www.tainstruments.com/main.aspx?n=2&id=179&siteid=11&searchType=byLibraryType&type=0&fAction=y (AccessedAug 20, 2008).
(23) Richards, G. N.; Shafizadeh., F. Mechanism of thermal degradationof sucrose: A preliminary study.Aust. J. Chem. 1978, 31, 1825-1832.
(24) Kelly, F. H. C.; Brown, D. W. Thermal decomposition and colourformation in aqueous sucrose solutions. Sugar Technol. Rev. 1978/79, 6, 1-48.
(25) Eggleston, G.; Trask-Morrell, B. J.; Vercellotti, J. R. Use ofdifferential scanning calorimetry and thermogravimetric analysis tocharacterize the thermal degradation of crystalline sucrose and driedsucrose-salt residues. J. Agric. Food. Chem. 1996, 44, 3319-3325.
(26) Kishihara, S.; Okuno, M.; Fujii, S.; Kawasaki, K.; Nishiura, T. Anopinion on structure of sucrose crystal. Proc. Res. Soc. Jpn. SugarRefin. Technol. 2001, 49, 1-8.
(27) Okuno, M.; Kishihara, S.; Fujii, S.; Kawasaki, K. Analysis ofstructure of sucrose crystal by differential scanning calorimetry.Proc. Res. Soc. Jpn. Sugar Refin. Technol. 2002a, 50, 11-18.
(28) Okuno, M.; Kishihara, S.; Fujii, S.; Kawasaki, K. Melting point ofsucrose crystal prepared in sucrose solution containing variousimpurities. Proc. Res. Soc. Jpn. Sugar Refin. Technol. 2002b, 50,19-27.
(29) Okuno, M.; Kishihara, S.; Otsuka, M.; Fujii, S.; Kawasaki, K.Variability of melting behavior of commercial granulated sugarmeasured by differential scanning calorimetry. Int. Sugar J. 2003,105, 29-35.
(30) Kishihara, S.; Sakuda, H.; Miura, K.; Sakamoto, K.; Tachibana, Y.;Koizumi, Y.; Tatara, T. Transfiguration of the properties of granu-lated sugar on heating. Proc. Res. Soc. Jpn. Sugar Refin. Technol.2004, 52, 1-5.
(31) Beckett, S. T.; Francesconi, M. G.; Geary, P. M.; Mackenzie, G.;Maulny, A. P. E. DSC study of sucrose melting. Carbohydr. Res.2006, 341, 2591-2599.
(32) Lee, T.; Chang, G. D. Sucrose conformational polymorphism: AJigsaw puzzle with multiple routes to a unique solution. Cryst.Growth Des. 2009, 9 (8), 3551-3561.
(33) Widmann, G.; Scherrer, O. A new program for DSC purity analysis.J. Therm. Anal. 1991, 37, 1957-1964.
(34) Cassel, R. B. TA295. Purity determination and DSC TzeroTM
technology. TA instruments home page: Applications library search.TA instruments: New Castle, DE, 2008. http://www.tainstruments.com/main.aspx?n=2&id=179&siteid=11&searchType=byLibraryType&type=0&fAction=y (Accessed Aug 20, 2008).
(35) Shah, S. V.; Chakradeo, Y. M. A note on the melting point of canesugar. Curr. Sci. 1936, 4, 652-653.
(36) Hirschm€uller, H. Chemical properties of sucrose. In Principles ofSugar Technology, 1st ed.; Honig, P., Ed.; Elsevier Publishing Company:New York, NY, 1953; pp 1-17.
(37) Kamoda, M. Studies on the properties of sucrose crystal. Proc. Res.Soc. Jpn. Sugar Refin. Technol. 1960, 27, 258-238.
(38) Lee, T.; Lin, Y. S. Dimorphs of sucrose. Int. Sugar J. 2007, 109(1303), 440-445.
(39) Saska, M. Precipitation, melting and solubility of sucrose re-crystal-lized from methanol. Int. Sugar J. 2008, 110 (1312), 230-231.
(40) Shallenberger, R. S.; Birch, G. G. Chapter 3. Occurrence andproperties of sugars. In Sugar chemistry, 1st ed.; AVI publishingcompany: Westport, CT, 1975; pp 46-88.
(41) Tammann, G. 1910. Zur::Uberhitzung von Kristallen. Z. Phys.
Chem. 1910, 68, 251-257.
(42) Hellmuth, E.; Wunderlich, B. Superheating of linear high-polymerpolyethylene crystals. J. Appl. Phys. 1965, 36 (10), 3039-3044.
(43) Wunderlich, B. One hundred years research on supercooling andsuperheating. Thermochim. Acta 2007, 461, 4-13.
(44) Lappalainen, M.; Pitkanen, I.; Heikkila, H.; Nurmi, J. Meltingbehaviour and evolved gas analysis of xylose. J. Therm. Anal.Calorim. 2006, 84, 367-376.
Article J. Agric. Food Chem., Vol. 59, No. 2, 2011 701
(45) Mago�n, A.; Pyda, M. The melting and glass transitions of carbo-hydrates by advanced thermal analysis.NATASNotes 2009, 41 (2, 3),17-25.
(46) Tombari, E.; Ferrari, C.; Salvetti, G.; Johari, G. P. Spontaneousliquefaction of isomerizable molecular crystals. J. Chem. Phys. 2007,126, 0211071-4.
(47) Wlodarczyk, P.; Kaminski, K.; Paluch,M.; Ziolo, J.Mutarotation inD-fructose melt monitored by dielectric spectroscopy. J. Phys.Chem. 2009, 113, 4379-7383.
(48) €Orsi, F. Kinetic studies on the thermal decomposition of glucose andfructose. J. Therm. Anal. 1973, 5, 329-335.
(49) Sakamoto, K.; Kishihara, S.; Miura, K.; Sakuda, H.; Koizumi, Y.;Tachibana, Y.; Kataoka-Shirasugi, N. Browning of granulatedsugar on heating below melting point. Proc. Res. Soc. Jpn. SugarRefin. Technol. 2006, 54, 15-21.
(50) Liu, Y.; Bhandari, B.; Zhou, W. Glass transition and enthalpyrelaxation of amorphous food saccharides: a review. J. Agric. Food.Chem. 2006, 54, 5701-5717.
(51) Gombas, A.; Szabo-Revesz, P.; Regdon, G., Jr.; Eros, I. Study ofthermal behavior of sugar alcohols. J. Therm. Anal. Calorim. 2003,73, 615-621.
(52) Lee, J.W. Investigation of thermal decomposition as the cause of theloss of crystalline structure in sucrose, glucose, and fructose. Ph.D.Dissertation, University of Illinois Urbana-Champaign, Urbana, IL,May 2010.
(53) Kelly, F. H. C.; Brown, D. W. Thermal decomposition and colourformation in aqueous sucrose solutions. Sugar Technol. Rev. 1978/79,6, 1-48.
(54) Richards, G. N. Initial steps in thermal degradation of sucrose. Int.Sugar J. 1986, 88, 145-148.
(55) Eggleston, G.; Vercellotti, J. R.; Edye, L. A.; Clarke,M.A. Effects ofsalts on the initial thermal degradation of concentrated aqueoussolutions of sucrose. J. Carbohydr. Chem. 1996, 15, 81-94.
(56) Clarke, M. A.; Edye, L. A.; Eggleston, G. Sucrose decomposition inaqueous solution, and losses in sugar manufacture and refining.Adv.Carbohydr. Chem. Biochem. 1997, 52, 441-470.
(57) Thomas, L. C. Modulated DSC technology manual. TA instrument:New Castle, DE, 2006; pp 7-83.
(58) Mauch, W.; Asseily, S. Sorption characteristics of fructose, glucose,and sucrose melts subjected to various degrees of heat treatment.Forschungsber.-Inst. Zuckerind. Berlin 1975, 1, 127.
(59) Ding, S. P.; Fan, J.; Green, J. L.; Lu, Q.; Sanchez, E.; Angell, C. A.Vitrification of trehalose by water loss from its crystalline dehydrate.J. Therm. Anal. 1996, 47, 1391-1405.
(60) Kajiwara, K.; Franks, F. Crystalline and amorphous phases in thebinary system water-raffinose. J. Chem. Soc., Faraday Trans. 1997,93, 1779-1783.
(61) Cheng,W. T.; Lin, S. Y. Processes of dehydration and rehydration ofraffinose pentahydrate investigated by thermal analysis and FT-IF/DSC microscopic system. Carbohydr. Polym. 2006, 64, 212-217.
(62) Bates, S.; Kelly, R. C.; Ivanisevic, I.; Schields, P.; Zografi, G.;Newman, A. W. Assessment of defects and amorphous structureproduced in raffinose pentahydrate upon dehydration. J. Pharm.Sci. 2007, 96, 1418-1433.
(63) Franks, F. Physical properties of crystalline and amorphous solids.In Freeze-drying of pharmaceuticals and biopharmaceuticals: princi-ples and practice, 1st ed.; Royal Society of Chemistry: Cambridge, U.K.,2007; Chapter 6, pp 78-88.
(64) Miller, T. A.; York, P. Pharmaceutical tablet lubrication. Int. J.Pharm. 1988, 41, 1-19.
(65) Ker�c, J.; Sr�ci�c, S.; Urleb, U.; Kanalec, A.; Kofler, B.; �Smid-Korbar,J. Compatibility study between acetylcysteine and some commonlyused tablet excipients. J. Pharm. Pharmacol. 1992, 44 (6), 515-518.
(66) Venkataram, S.; Khohlokwane, M.; Wallis, S. H. Differentialscanning calorimetry as a quick scanning technique for solid statestability studies. Drug Dev. Ind. Pharm. 1995, 21 (7), 847-855.
(67) Wissing, S.; Craig, D. Q. M.; Barker, S. A.; Moore, W. D. Aninvestigation into the use of stepwise isothermal high sensitivity DSCas ameans of detecting drug-excipient incompatibility. Int. J. Pharm.2000, 199, 141-150.
(68) Desai, S. R.; Shaikh, M. M.; Dharwadkar, S. R. Preformulationcompatibility studies of etamsylate and fluconazole drugs withlactose by DSC. J. Therm. Anal. Calorim. 2003, 71, 651-658.
(69) Cides, L. C. S.; Araujo, A. A. S.; Santos-Filho, M.; Matos, J. R.Thermal behaviour, compatibility and decomposition kineticsof glimepiride under isothermal and non-isothermal conditions.J. Therm. Anal. Calorim. 2006, 84 (2), 441-445.
(70) Mehdipour, N.; Boushehri, A.; Eslami, H. Prediction of the densityof molten metals. J. Non-Cryst. Solids 2005, 351, 1333-1337.
(71) Barone, G.; Gatta, G. D.; Ferro, D.; Piacente, V. Enthalpies andentropies of sublimations, vaporization and fusion of nine poly-hydric alcohols. J. Chem. Soc., Faraday Trans. 1990, 86, 75-79.
(72) Yan, W.; Suppes, G. J. Vapor pressures and evaporation studies ofsugars and sugar alcohols. J. Chem. Eng. Data 2008, 53, 2033-2040.
(73) Schwarz, E. M.; Grundstein, V. V.; Ievins, A. F. Thermal Investiga-tion of polyols. I. Hexitols and pentitols. J. Therm. Anal. 1972, 4,331-337.
(74) Landın, M.; Fontao, M. J.; Martınez-Pacheco, R. A comparison oftrehalose dihydrate and mannitol as stabilizing agents for dicalciumphosphate dihydrate based tablets. Drug Dev. Ind. Pharm. 2005, 31,249-256.
(75) Tomassetti, M.; Catalani, A.; Rossim, V.; Vecchio, S. Thermalanalysis study of the interactions between acetaminophen andexcipients in solid dosage forms and in some binary mixtures.J. Pharm. Biomed. Anal. 2005, 37, 949-955.
(76) Hulse, W. L.; Forbes, R. T.; Bonner, M. C.; Getrost, M. Thecharacterization and comparison of spray-dried mannitol samples.Drug Dev. Ind. Pharm. 2009, 35 (6), 712-718.
(77) Naini, V.; Byon, P. R.; Phillips, E. M. Physicochemical stability ofcrystalline sugars and their spray-dried forms: Dependence uponrelative humidity and suitability for use in powder inhalers. DrugDev. Ind. Pharm. 1998, 24 (10), 895-909.
(78) Bruni, G.; Berbenni, V.; Milanese, C.; Girella, A.; Cofrancesco, P.;Bellazzi, G.; Marini, A. Physico-chemical characterization of anhydrousD-mannitol. J. Therm. Anal. Calorim. 2009, 95 (3), 871-876.
(79) Chickos, J. S.; Acree, W. E., Jr. Enthalpies of sublimation of organicand organometallic compounds. J. Phys. Chem. Ref. Data 2002,31 (2), 572.
(80) Walter-Levy, L. C. R. Acad. Sci. Paris Ser. C 1968, 267, 1779-1782.
(81) Lee, J. W.; Thomas, L. C.; Jerrell, J.; Feng, H.; Cadwallader, K. R.;Schmidt, S. J. Investigation of thermal decomposition as the kineticprocess that causes the loss of crystalline structure in sucrose using achemical analysis approach (Part II). J. Agric. Food. Chem. 2010.DOI: 10.1021/jf104235d.
(82) Bonn, G. High-performance liquid chromatographic elution behav-ior of oligosaccharides, monosaccharides and sugar degradationproducts on series-connected ion-exchange resin columns usingwater as the mobile phase. J. Chromatogr. 1985, 332, 411-424.
(83) Gomis, D. B.; Alvarez, M. D. G.; Naredo, L. S.; Alonso, J. J. M.High-performance liquid chromatographic determination of furfuraland hydroxymethylfurfural in apple juices and concentrates.Chromatog-raphia 1991, 32, 45-48.
(84) Porretta, S. Chromatographic analysis of maillard reaction products.J. Chromatogr. 1992, 624, 211-219.
(85) LoCoco, F.; Valentini, C.; Novelli, V.; Ceccon, L.High performanceliquid chromatographic determination of 2-furaldehyde and 5-hyroxy-methyl-2-furaldehyde in processed citrus juices. J. Liq. Chromatogr.1994, 17 (3), 603-617.
(86) Yuan, J. P.; Guo, S. Y.; Li, L. Simultaneous determination of sugarsand their degradation products 5-HMF by HPLC. Chin. J. Anal.Chem. 1996, 24, 57-60.
(87) Yuan, J. P.; Chen, F. Simultaneous separation and determinationof sugars, ascorbic acid and furanic compounds by HPLC-dualdetection. Food Chem. 1999, 64, 423-427.
Received for review June 22, 2010. Accepted November 8, 2010. The
generous support of the Cargill Women in Science Advanced Degree
Scholarship is gratefully acknowledged.