investigation of the mesoscale structure and volumetric features of biofilms using optical coherence...
TRANSCRIPT

ARTICLE
Investigation of the Mesoscale Structure andVolumetric Features of Biofilms Using OpticalCoherence Tomography
Michael Wagner,1 Danial Taherzadeh,1 Christoph Haisch,2 Harald Horn1
1Institute of Water Quality Control, Technische Universitat Munchen, Am Coulombwall,
D-85748 Garching, Germany; telephone: þ49-89-289-13700; fax: þ49-89-289-13718;
e-mail: [email protected] of Hydrochemistry, Chair for Analytical Chemistry, Technische Universitat
Munchen, Munich, Germany
Received 12 April 2010; revision received 15 June 2010; accepted 17 June 2010
Published online 17 August 2010 in Wiley Online Library (wileyonlinelibrary.com). DOI
10.1002/bit.22864ABSTRACT: Optical coherence tomography (OCT) wassuccessfully applied to visualize the mesoscale structure ofthree different heterotrophic biofilms. For this purpose,biofilm volumes of 4� 4� 1.6mm3 were scanned withspatial resolutions lower than 20mm within an acquisitiontime of 2min. A heterogeneous structure was detected forbiofilms cultivated in laminar as well as transient flowconditions. The structure was found to be more homoge-neous for the biofilm grown in turbulent flow. This biofilmstructure was characterized by a volumetric porosity of 0.36,whereas the porosity calculated for biofilms grown in lami-nar and transient conditions was 0.65. These results weredirectly generated from the distribution of porosity calcu-lated from the OCT images acquired and can be linked tostructural properties. Up to now, the mesoscale biofilmstructure was only observable with time-consuming andexpensive studies, for example, magnetic resonance micro-scopy. OCT will most certainly be helpful for improvedunderstanding and prediction of biofilm physics withrespect to macroscale processes, for example, mass transferand detachment as the information about mesoscale is easilyaccessible using this method. In the context of this study, weshow that CLSM images do not necessarily provide anaccurate representation of the biofilm structure at themesoscale. Additionally, the typical characteristic para-meters obtained from CLSM image stacks differ largely fromthose calculated from OCT images. Nevertheless, to deter-mine the local distribution of biofilm constituents, micro-scopic methods such as confocal laser scanning microscopyare required.
Biotechnol. Bioeng. 2010;107: 844–853.
� 2010 Wiley Periodicals, Inc.
KEYWORDS: optical coherence tomography; confocal laserscanning microscopy; biofilms; porosity; mesoscale; meso-scopic structure
Correspondence to: M. Wagner
Additional Supporting Information may be found in the online version of this article.
844 Biotechnology and Bioengineering, Vol. 107, No. 5, December 1, 2010
Introduction
Biofilms are communities of microorganisms that liveattached to surfaces and house themselves in a matrix ofextracellular polymeric substances (EPS). Life in biofilmsis beneficial for the embedded microorganisms. Thus,biofilms are the dominant form of microbial life on Earth(Bryers, 2000; Ghannoum and O’Toole, 2004; Wuertz et al.,2008). In the last decades, confocal laser scanningmicroscopy (CLSM) has widely been used to investigatebiofilm constituents and their distribution at the microscale(Chen et al., 2006; Lawrence et al., 1991, 2007; Neu et al.,2001). Although CLSM suffers from limited specificity andpenetration depth, it is used to characterize the three-dimensional microscopic structure of biofilms (Staudt et al.,2004). Lawrence et al. (2003) applied scanning transmissionX-ray microscopy (STXM) and transmission electronmicroscopy (TEM) in addition to CLSM to investigatethe elemental composition of a biofilm. Since STXM andTEM need an evacuated environment, the sample can onlybe analyzed when dried. Hence, results reveal high-resolution information about sub-micron structure andcomposition of biofilms, but at the expense of destroyingthe sample. Recently, Raman microscopy (RM) was appliedfor nondestructive in situ characterization of the biofilmmatrix (Ivleva et al., 2008, 2009; Patzold et al., 2006).However, the techniques mentioned above are microscopicmethods detecting rather local than global structuralproperties of biofilms.
To investigate the mesoscale biofilm structure, othermethods need to be applied. Magnetic resonance micro-scopy (MRM) and magnetic resonance imaging (MRI) aretechniques that resolve the biofilm structure in the mm-range while allowing for simultaneous imaging of largesample volumes of up to several mm3 (Manz et al., 2003,
� 2010 Wiley Periodicals, Inc.
2005; Seymour et al., 2004). The main disadvantages ofMRM/MRI systems are their complexity, high instrumentaland administrative demand, and the apparatus size.Another technique that images comparable sample volumesis optical coherence tomography (Huang et al., 1991). Xiet al. (2006) and Haisch and Niessner (2007) showed theapplicability of OCT to study biofilms. Compared to MRM/MRI systems, OCT devices are characterized by theircompactness, mobility, and ease of use. Furthermore, OCTnondestructively visualizes the biofilm mesoscale structurewith high axial and spatial resolutions in the lower mm-range (<20mm).
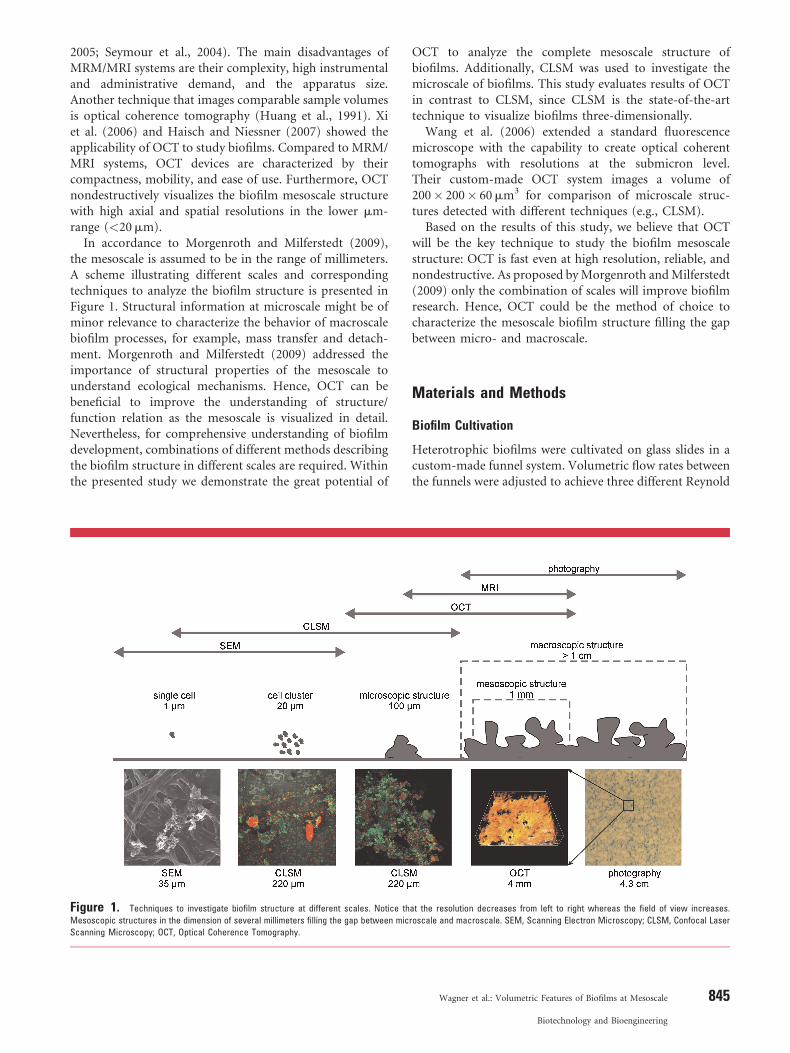
In accordance to Morgenroth and Milferstedt (2009),the mesoscale is assumed to be in the range of millimeters.A scheme illustrating different scales and correspondingtechniques to analyze the biofilm structure is presented inFigure 1. Structural information at microscale might be ofminor relevance to characterize the behavior of macroscalebiofilm processes, for example, mass transfer and detach-ment. Morgenroth and Milferstedt (2009) addressed theimportance of structural properties of the mesoscale tounderstand ecological mechanisms. Hence, OCT can bebeneficial to improve the understanding of structure/function relation as the mesoscale is visualized in detail.Nevertheless, for comprehensive understanding of biofilmdevelopment, combinations of different methods describingthe biofilm structure in different scales are required. Withinthe presented study we demonstrate the great potential of
Figure 1. Techniques to investigate biofilm structure at different scales. Notice th
Mesoscopic structures in the dimension of several millimeters filling the gap between mic
Scanning Microscopy; OCT, Optical Coherence Tomography.
OCT to analyze the complete mesoscale structure ofbiofilms. Additionally, CLSM was used to investigate themicroscale of biofilms. This study evaluates results of OCTin contrast to CLSM, since CLSM is the state-of-the-arttechnique to visualize biofilms three-dimensionally.
Wang et al. (2006) extended a standard fluorescencemicroscope with the capability to create optical coherenttomographs with resolutions at the submicron level.Their custom-made OCT system images a volume of200� 200� 60mm3 for comparison of microscale struc-tures detected with different techniques (e.g., CLSM).
Based on the results of this study, we believe that OCTwill be the key technique to study the biofilm mesoscalestructure: OCT is fast even at high resolution, reliable, andnondestructive. As proposed byMorgenroth andMilferstedt(2009) only the combination of scales will improve biofilmresearch. Hence, OCT could be the method of choice tocharacterize the mesoscale biofilm structure filling the gapbetween micro- and macroscale.
Materials and Methods
Biofilm Cultivation
Heterotrophic biofilms were cultivated on glass slides in acustom-made funnel system. Volumetric flow rates betweenthe funnels were adjusted to achieve three different Reynold
at the resolution decreases from left to right whereas the field of view increases.
roscale and macroscale. SEM, Scanning Electron Microscopy; CLSM, Confocal Laser
Wagner et al.: Volumetric Features of Biofilms at Mesoscale 845
Biotechnology and Bioengineering

numbers of 1,000 (Q¼ 4.5 Lmin�1), 2,500 (Q¼12 Lmin�1), and 4,000 (Q¼ 18 Lmin�1), respectively. Adetailed description of the experimental setup is publishedin Wagner et al. (2009). The exchange rate of the bulk phasewas set to 5 day�1 to reduce submerse microbiologicalactivity. The cultivation medium was refreshed dailyand consisted of 3mg L�1 methanol (substrate, surfaceloading rate¼ 2 gmethanolm�2 day�1), nutrients (8mg L�1
(NH4)2SO4, 2.8mg L�1 CaCl2, 7mg L�1 MgSO4�7H2O,6mg L�1 NaNO3, 5mg L�1 FeSO4�7H2O, 0.2mg L�1
K2HPO4), and trace elements (300mg L�1 H3BO3,130mg L�1 CoSO4�7H2O, 8mg L�1 CuCl, 20mg L�1
MnSO4�H2O, 26mg L�1 Na2MoO4�2H2O, 10mg L�1
NiCl2�2H2O, and 56mg L�1 ZnSO4�7H2O).
Confocal Laser Scanning Microscopy
Confocal laser scanning microscopy (CLSM) was employedto determine the overall presence of biofilm constituentswithin the matrix of EPS. Staining protocols introduced byNeu and Lawrence (1999) and Staudt et al. (2003) wereapplied to analyze the biofilm samples for EPS glycoconju-gates and nucleic acids. EPS glycoconjugates were labeledusing the lectin isolated from Aleuria aurantia (LINARISBiologische Produkte GmbH, Wertheim-Bettingen,Germany), fluorescence labeled with the fluorochromeAlexaFluor4881 (Invitrogen/Molecular Probes, Eugene,OR). Nucleic acids were stained by application ofSYTO601 (Invitrogen/Molecular Probes). CLSM imagestacks were acquired using a Zeiss LSM510 META confocallaser scanning microscope controlled by means of theAIM software (version 3.2, Carl Zeiss MicroImagingGmbH, Jena, Germany). The microscope was equippedwith lasers providing excitation wavelengths of 488 nm(lectin, AAL488) and 633 nm (SYTO601). To allow forinvestigation of the biofilm structure, a water immersiblelens (40� magnification, NA¼ 0.8) was used to acquire theimage stacks. The pinhole size was individually adjusted toensure a constant optical slice thickness for all channelsacquired (North, 2006). The distance between two adjacentoptical slices was software-based optimized to 0.78mm.Biofilm analyses were performed 1 week after OCTmeasurements.
Optical Coherence Tomography
A Spectral Radar OCT (OCP930SR, Thorlabs GmbH,Dachau, Germany) was used to investigate the mesoscopicstructure of cultivated biofilms (biofilm age of 134 days).The central wavelength of light source was 930 nm with abandwidth of 100 nm. Superposition of source light andreflected light (Michelson interferometer) reveals informa-tion about the distribution of scattering structures in thefield of view. Via Fourier transformation, frequenciesbecome converted to the depth information, while
846 Biotechnology and Bioengineering, Vol. 107, No. 5, December 1, 2010
amplitudes represent the intensity of detected reflection(Bouman and Tearney, 2001; Huang et al., 1991).
Generally, OCT instruments scan in vertical xz-planes, so-called ‘‘A-scans.’’ Further, a ‘‘B-scan’’ is a series of A-scansrepresenting a volume data set in xyz. The acquisition speedis inversely proportional to the number of A-scans. Weacquired volumes of 4� 4� 3mm3 at a resolution of8mm� 16mm� 4mm (xyz) within a scan time of 2min(series of 250 A-scans). Biofilm samples were analyzed insitu immersed into tap water inside a box made of acrylicglass. As the design of the OCT device is similar to amicroscope stand, the box was positioned on the OCTtable below the scan head orthogonal to the optical axis.Effects of the immersion medium—tap water instead ofcultivation medium—on the biofilm structure were notobvious.
Image Analysis
Structural parameters were calculated to compare theacquired data sets. Based on the image acquisitiontechniques different image postprocessing procedureswere applied.
CLSM Image Stacks
The in-house tool JImageAnalyzer (version 1.1, TechnischeUniversitat Munchen, Institute of Water Quality Control)was used to quantify the CLSM image stacks. For bothchannels acquired threshold was set manually to create astack of binary images where values of 1 represent theforeground (signal) and 0 the background. Foregroundpixels representing EPS glycoconjugates and nucleic acidswere counted to calculate structural parameters. Manualthresholding is influenced by both the operator and thesystem serving for image analysis (contrast and brightnessof the monitor). Thus, the operator and the conditions ofthe analysis system were unchanged for all CLSM imagestacks analyzed. In contrast to automated thresholdingmethods, for example, the one introduced by Otsu (1979), amanual thresholding is able to find the optimal thresholdfor the complete image stack to avoid significant over- orunderestimation of signals.
Postprocessing of OCT B-Scans
The three-dimensional OCT data sets (B-scans composed ofa series of 250 A-scans) were acquired in 32-bit mode. TheB-scans were converted into 8-bit TIFF image stacksemploying Matlab (R14, The MathWorks, Inc., Nattick,MA). ImageJ (version 1.43k, National Institutes of Health,Bethesda, USA) was used to crop, optimize (brightness andcontrast; for presentation purpose only), and downscaleTIFF image stacks in order to reduce the file size and therebythe postprocessing time (see Fig. 2).

Figure 2. Scheme of the image segmentation procedure of OCT data sets used
to trace the biomass correlated signals from the background noise. Raw background
noise is drawn in gray. The intensity distribution within the biomass is illustrated as
gradual grayscale filling. Following steps were performed: (a) downscaling of original
B-scan to reduce the file size. After downscaling x0 ¼ 0.5x and z0 ¼ 0.5z. (b) Segmenta-
tion/binarization of raw data into biomass-related signals (intensity¼ 1) and back-
ground noise (intensity¼ 0) using the level-set method described by Li et al. (2008). (c)
Drawing of a continuous white line (intensity¼ 1, for better visualization shown as
dashed line in this scheme) to trace the concave shape of the substratum used as
boundary condition for the baseline correction. (d) Baseline correction which removes
background pixels below the substratum, until the white line (boundary) is reached.
Removed background pixels were added on top of the data set to keep the z-
dimension. In a further step (not drawn separately) the baseline-corrected binarized
OCT data set is cropped to calculate hstack (see Eq. 3). Structural parameters are
calculated based on the data set after step (d). (e) Upscaling of binarized OCT data
sets to original size. (f) Separation of biomass correlated raw signals from background
by multiplication of the binarized OCT data set with gray scale OCT imaging data. The
original raw gray scale distribution within the biomass is unchanged and is used for
visualization (Figs. 3 and 4).
Segmentation Procedure
In contrast to the postprocessing of the CLSM image stacks,simple thresholding was not possible for B-scans due tothe limited signal-to-noise ratio of the B-scans (Imax� 80).Simple thresholding eliminates too much valuable informa-tion from the data sets. Milferstedt et al. (2008b) discussedthe importance of an adapted binarization method for datasets of ‘‘low’’ resolution that are observed when largebiofilm structures (i.e., >1mm) are investigated. Thus, the
level-set method described by Li et al. (2008) was used todistinguish between relevant structure-related signals and thebackground (see Fig. 2, step (b)). Their variables were modifiedto fit our requirements as follows: the number of iterationsper A-scan was set to 300, scale factor s of the Gaussian kernelwas set to 15, and the script was fully automated to handle TIFFimage stacks. The level-set segmentation results were stored asa binary image stack where the background equaled 0 and thebiomass equaled 1. Matlab was used to project the level-setinformation of the binary image stack on the original B-scan tocreate B-scans where the biofilm structures were separatedfrom the background (masking, see Fig. 2, steps (e) and (f)).Visualizations were created from these masked B-scans. Forthe calculation of structural parameters, the concave deforma-tion of OCT B-scans was corrected with an in-house madeMatlab code (baseline correction). For this purpose, a whiteline (intensity¼ 1) was drawn following the shape of thesubstratum (intense reflection signal, see Fig. 2, step (c)). Thiscontinuous white line (drawn as dashed line in the scheme)was used as boundary condition for baseline correctionremoving black pixels below the substratum that the signal ofthe substratum equaled a horizontal line (see Fig. 2, step (d)).Removed background pixels were added on top of the binarizeddata set to keep the z-dimension. Finally, the baseline correctedbinarized OCT B-scan was cropped minimizing the numberof background voxels/pixels due to the requirements of thestructural parameter calculations (see Fig. 2, step (d)).
Biofilm Parameters
Several parameters were calculated based on gravimetry,CLSM image data, and OCT B-scans to describe thestructural properties of the investigated biofilms. Theseparameters are:
� b
iofilm density r:r ¼ mdryrH2O
mwet
(1Þ
The biofilm density r was calculated after draining(Dt¼ 10min), drying, and weighing of one slidecovered with biofilm according to the description ofCharacklis (1989).
� g
ravimetric biofilm thickness LF,gravimetry:LF;gravimetry ¼mwet
AsliderH2O
(2Þ
� b
iofilm thickness LF:LF ¼ hstack (3Þherein hstack is the thickness/height of the CLSM image
stack or OCT B-scan (B-scan after step (d) in Fig. 2).
� v
olumetric porosity F:F ¼P
voxelsð0ÞP
voxelsð0;1Þ(4Þ
Wagner et al.: Volumetric Features of Biofilms at Mesoscale 847
Biotechnology and Bioengineering

where 0 represents an empty voxel (background) and 1 a
filled one (signal). The porosity derived from the CLSM
image stacks was calculated on the combined signals of
nucleic acids and EPS glycoconjugates. Porosity calcu-
lated from OCT B-scans is based on the baseline-
corrected segmented data (Fig. 2, step (d)). Logically, for
both CLSM and OCT the termP
voxelsð0;1Þ equals thetotal number of voxels within the cubical volume. Thus,
‘‘global’’ porosity is calculated including background
voxels of the biofilm–bulk liquid interface as well as the
pores.
Results and Discussion
Comparison of Biofilm Structures Revealed by CLSMand OCT
Three heterotrophic biofilms cultivated in laminar(Re¼ 1,000), transient (Re¼ 2,500), and turbulent(Re¼ 4,000) flow regimes were investigated to comparethe capability of CLSM and OCT in visualizing themesoscale biofilm structure. The samples were firstinvestigated with OCT at a biofilm age of 134 days. Theseslides were stored in tap water at 48C to avoid structuralchanges due to additional growth. Then, they were analyzedwith CLSM a week later. Changes of the structure causedby the storage of the samples prior to the CLSM analyseswere not obvious (data not shown). In Figure 3, isosurfaceprojections of the acquired data are presented. A CLSMimage stack of 230mm�230mm� 250mm in Figure 3equals a volume of only 30� 15� 62 voxels in an OCT B-scan; a volume roughly 1,800 times smaller.
The microscopic structures detected by CLSM werevisually similar independent of the hydrodynamic cultiva-tion conditions. Fluorescence imaging information of EPSglycoconjugates and nucleic acids was detected within theupper 250mm of the biofilm (see Fig. 3a, c, and e).Structures of biofilms grown at Re¼ 1,000 and 2,500 werecharacterized by elongated biomass present on a series ofadjacent optical slices. No fluorescence signals for volumesof various size were detected between the connected biomassregions. On the other hand, a continuous connectedstructure of 200mm thickness composed of EPS glycocon-jugates and nucleic acids was detected for the biofilm grownat turbulent flow conditions (see Fig. 3e). However, themaximum intensity projections (MIP) located in the upperright corner of Figure 3a, c, and e, respectively, do notreveal significant differences in the distribution of thedetected signals. Considering the limitations of CLSM (e.g.,penetration depth) no-signal volumes do not necessarilyrepresent empty space. The presence of black voxelsindicates the absence of fluorescent signals only. Thisissue has been discussed in detail elsewhere (Staudt et al.,2004; Wagner et al., 2009). An effective approach to stainall constituents of the biofilm matrix has not been proposedup to now. Combinations of several lectins and nucleic
848 Biotechnology and Bioengineering, Vol. 107, No. 5, December 1, 2010
acid stains improve the understanding of the compositionof the biofilm matrix but do not present a completevisualization (Chen et al., 2007; Neu and Lawrence, 1999).Furthermore, microscale structures cannot be correlated tomacroscale processes of mass transfer and detachment(Milferstedt et al., 2008a). Hence, we applied OCT toidentify the complete mesoscopic biofilm structure in anondestructive and in situ way. Measured reflection wasallocated to biomass and particulate materials within thebiofilm matrix. Thus, in contrast to CLSM, detected spaceswithin the biofilm were real voids as these voids cause noreflection of source light. The OCT isosurface projectionsin Figure 3b, d, and f represent the biofilm structures at themesoscale. The porous structure of a biofilm is underlinedby the slices orthogonal to the biofilm support that indicatevoids as red areas within the biomass (white isosurface).Biofilms were characterized by connected structures in thedimension of several 100mm (see Fig. 3d near z-axis). Thebiofilm grown under turbulent flow was compact with asmoother surface structure compared to the biofilmscultivated at Re¼ 1,000 and 2,500, respectively. A roughand open structured surface was determined to becharacteristic of the biofilms grown in laminar and transientflow conditions. However, none of the analyzed biofilmscovered the substratum completely, which is indicated byshiny white areas on the bottom of the box (see left cornerin Fig. 3f). For detailed views of Fig. 3b, d, and f, seeanimations added as Supplementary Materials Re1000,Re2500, and Re4000, respectively.
The porous structure of biofilms cultivated at Re¼ 1,000and 2,500 is illustrated in Figure 4. For those biofilms, voidsof various size, ranging from mm2 to mm2, were detectedbetween aggregates of different sizes and different levelsof connectivity (see Fig. 4, compare y¼ 300 and 1,900mm ofRe¼ 1,000 and 2,500, respectively). Furthermore, OCTrevealed a layered structure of the biofilms grown in laminarand transient flow (see Fig. 4, Re¼ 1,000 and 2,500,y¼ 1,100mm). On top of these layers, an open structuredbiofilm developed. A significant different mesoscalestructure was detected for the biofilm cultivated in turbulenthydrodynamic conditions (see Fig. 4, Re¼ 4,000). Cleftstructures were present within the upper 600mm of thebiofilm, whereas the biomass between 800 and 1,000mmabove the substratum was dense without significantporosity. The results clearly underline the applicability ofOCT to investigate the mesoscopic biofilm structure.
Structural Parameters
Image processing is widely applied to obtain structuralproperties of two- or three-dimensional data sets. For CLSMimage stacks, numerous programs have been developedcalculating several parameters (Heydorn et al., 2000; Merodet al., 2007). Specific relevant parameters have to be selectedto describe the structural properties (Beyenal et al., 2004a,b;Chinga et al., 2007). In this work, we focused on the

Figure 3. Isosurface projections of CLSM and OCT data sets. Images (a), (c), and (e) represent the reconstructed CLSM image stacks. In upper right corner corresponding
maximum intensity projection (MIP) is added. The xy-plane of 3D and MIP is in the dimension of 230mm� 230mm. Color allocation: red¼ nucleic acids, green¼ EPS
glycoconjugates. Images (b), (d), and (f) represent the reconstructed OCT B-scans (white). The xy-plane is in the dimension of 4 mm� 4mm. Red orthogonal slices are added to
underline porous biofilm structure.
structural parameters listed in Table I, which highlight thedifferences between micro- and mesoscopic characteristicsof biofilms. In addition, these parameters are chosen as theyare observable visually as well.
The biofilm densities were similar for all analyzed biofilmsamples (see Table I). Due to the limited precision of thegravimetric method, the differences between calculated
densities cannot necessarily be correlated to local structuralvariations of investigated biofilms.
Also, biofilm thickness LF,gravimetry cannot be estimatedaccurately by gravimetry, which is an ex situ method.LF,gravimetry represents a mean value over the complete slidearea Aslide covered with biofilm (see Eq. 2), and depends onthe amount of water which remains in the biofilm matrix
Wagner et al.: Volumetric Features of Biofilms at Mesoscale 849
Biotechnology and Bioengineering

Figure 4. Series of equidistant OCT A-scans (Dy¼ 800mm, one A-scan represents one xz-plane within the series of 250 A-scans named B-scan). Presented are the results
after level-set procedure. The gray scale intensity is proportional to the intensity of detected reflection (raw signal). An A-scan is in the dimension of 4 mm� 1.6 mm.
after draining. Hence, LF,gravimetry tends to underestimatethe biofilm thickness due to extend draining, resulting in adeformation of the biofilm structure. Thickness calculatedfrom CLSM measurements LF was also found to be too lowdue to the limited penetration depth of CLSM (see Eq. 3).Furthermore, inhomogeneities in the microscale raised thestandard deviation of LF derived from CLSM image stacks.Biofilm thickness LF based on OCT B-scans was severaltimes higher compared to the thicknesses derived frompreviously mentioned methods. As we did not observe anyindication for a limited penetration for the OCT measure-ments (see Fig. 4), it can be assumed that biofilm thicknessbased on OCT B-scans is highly reliable. Standard deviationsbetween LF values of analyzed OCT B-scans were below 8%,indicating the reliability of the processed biofilm volumes.Again, LF of OCT B-scans equaled the mean maximumthickness of all three B-scans analyzed for each Reynolds
Table I. Biofilm characterizing parameters derived from gravimetry, CLSM,
Re¼ 1,000
CLSM OCT CL
Biofilm age (days) 141 134 14
Density, r (kgm�3)a 16.2 — 16
LF,gravimetry (mm)a 347 — 45
LF (mm)b 270� 66 (n¼ 5) 1,383� 97 (n¼ 3) 207� 45
Volumetric porosity, F 0.987� 0.0035
(n¼ 5)
0.627� 0.016
(n¼ 3)
0.985�(n¼
CLSM measurements were carried out on the slide investigated with OCTaParameters estimated from slide used for CLSM.bAveraged values of five CLSM image stacks and three OCT B-scans, respe
850 Biotechnology and Bioengineering, Vol. 107, No. 5, December 1, 2010
number (see Eq. 3). Consequently, LF calculated from OCTB-scans does not represent an average thickness value asLF,gravimetry does, since OCT measurements were notperformed on the complete biofilm covering the slide.Nevertheless, the direct detection way of OCT suggest thatthis approach is most reliable for the calculation of the realbiofilm thickness LF (see Fig. 4).
Beyenal et al. (2004b) mentioned a series of parameters todescribe the biofilm structure by evaluation of the grayscaledistribution of biofilm images. Volumetric porosity F waschosen as dimensionless key parameter to describe andcompare the biofilm structures as seen by CLSM and OCT.The method to calculate the porosity depends directly onwhere the boundaries of the biofilm are defined (region ofinterest), whether considering only pores within biomass(‘‘internal’’ porosity), or additionally taking the biofilm–bulk fluid interface into account (‘‘global’’ porosity).
and OCT data sets.
Re¼ 2,500 Re¼ 4,000
SM OCT CLSM OCT
1 134 141 134
.6 — 16.5 —
6 — 574 —
(n¼ 5) 1,479� 110 (n¼ 3) 197� 39 (n¼ 5) 1,602� 55 (n¼ 3)
0.0058
5)
0.674� 0.0040
(n¼ 3)
0.980� 0.0058
(n¼ 5)
0.358� 0.15
(n¼ 3)
first.
ctively.

External mass transfer (Eberl et al., 2000) and fluid–structure interaction Taherzadeh are examples of twophenomena acting at mesoscale affecting both the biofilmand the surrounding bulk fluid. Hence, we focused on themesoscale parameter, for example, ‘‘global’’ porosity whichincludes the biofilm–bulk fluid interface.
With respect to Equation (4), theP
voxelsð0;1Þ equals allvoxels within the cubical data set of a B-scan and CLSMimage stack, respectively. In addition, the background voxelsabove the biomass interface were treated in the samemanneras the background voxels of pores. Total background voxelsequal
Pvoxelsð0Þ.
Calculated porosity was >0.98 for CLSM image stacks(see Table I). The calculated porosities did not differsignificantly (see Fig. 3a, c, and e), even though thestructures of biofilms cultivated at Re¼ 1,000 and 2,500represented by CLSM image stacks seemed to differ frombiofilm of Re¼ 4,000.
In case of the OCT B-scans that capture a representativebiofilm area/volume (Milferstedt et al., 2008a), calculatedporosities can be considered reliable and correlated well withthe detected structures. The porosities varied between OCTB-scans of different flow conditions approximately from0.36 to 0.67 (see Table I). Thus, the mesoscale porosity of thebiofilm structure observed by OCT was 40–70% lower thanthe value found for the microscale structure observed withCLSM.
The volumetric porosity of one OCT B-scan was averagedover the local porosities of all 250 A-scans (see Eq. 4).The distribution of these local porosities is presented inFigure 5. It can be seen that the structure of the biofilmcultivated at Re¼ 1,000 consisted of aggregates and poresof varying sizes. For example, the A-scan for y¼ 1,900mm(Re¼ 1,000) represents a low porosity due to to presence oflarge aggregates (see Fig. 4). This low porosity is reflected bythe region with the lowest porosity in Figure 5 (A-scannumbers 100–120, dark gray curve). On the other hand, the
Figure 5. Porosity distribution inside an OCT B-scan of biofilms cultivated at Reynold
(gray curves). The porosity of one A-scan is expressed as one data point of the correspond
indicates the standard deviation (n¼ 3). Distance between adjacent A-scans is 16mm.
maximum in the dark gray curve in Figure 5a is linked tothe A-scan at y¼ 3,500mm in Figure 4, which had a higherporosity.
Biomass was more evenly distributed within the biofilmcultivated in turbulent flow, which is also presented by theA-scans (compare Fig. 4 Re¼ 2,500 and 4,000). Thestandard deviation of the biofilm porosity distribution forthe biofilm of Re¼ 2,500 was only 0.6% compared to 2.6%for Re¼ 1,000 (see Fig. 5b). The high voidless biomasscontent of biofilm cultivated in turbulent flow (see Fig. 4,Re¼ 4,000) showed low homogeneous local porosities (seeFig. 5c). As shown in Figure 4 the variations in porositiesbetween different Reynolds numbers can be related directlyto distribution of biomass and surface structure. Thebiofilms cultivated in laminar and transient flow conditions(see Fig. 4, Re¼ 1,000 and 2,500) are visually heterogeneousand porous in volume. On the other hand, the biofilmgrown in turbulent flow is visually homogeneous in volume,but with variations in surface structure.
The sharp drop of local porosities in the dark gray curvebetween A-scans 150 and 170 in Figure 5c can be ascribedto restrictions of image acquisition and segmentation. Thehigh biomass content of the biofilm cultivated in turbulentflow limited the sensitivity of OCT, resulting in a low signal-to-noise ratio. Due to this low signal-to-noise ratio, thesegmentation procedure occasionally could not trace thebiomass effectively. Incomplete tracing resulted in eitheran overestimation or underestimation of structure (bio-mass). Nevertheless, results of the level-set method weremore accurate compared to thresholding.
OCT reliably described the real biofilm structure ofrepresentative volumes acquired in the mesoscale. Hence,porosity is introduced as quantitative structural parameterthat improves the understanding of mass transfer effectsinside porous biomass. Due to the dependency of CLSMon the fluorescence efficiency, calculated structural para-meters (e.g., porosity) are less reliable than those of OCT
s numbers (a) 1000, (b) 2500 and (c) 4000. Three different OCT B-scans were analyzed
ing gray curve. Mean porosity is printed as dashed line on top of the light gray bar that
Wagner et al.: Volumetric Features of Biofilms at Mesoscale 851
Biotechnology and Bioengineering
data sets. The requirement of methods to characterizelarge sample areas/volumes was addressed by Milferstedtet al. (2008a). Their results revealed that the precision ofstructural descriptors increases proportional to the areaanalyzed. They proposed that to describe a biofilm structurerepresentatively, an area of 3.4mm2 needs to be analyzed.Thus, the area of 16mm2 imaged by OCT containedrepresentative biofilm structures in terms of a mesoscopiccharacterization. Furthermore, it should be noted thatthis area is imaged within a single OCT B-scan and notwithin consecutive measurements. The sufficiency of theimaged biofilm volumes to describe the mesoscale biofilmstructure was validated by the calculation of the porosity ofsubvolumes Vsub within the original OCT B-scans (data notshown, Vsub=Vmax ¼ Vsub=ð16mm2 � LFÞ ¼ 0:0019; 0:0077;0:031; 0:12; 0:50; 1:00). The results reveal that even smallerimaging volumes (OCT B-scans) can describe the presentbiofilm structure reliably.
Outlook
Within this work we focused only on a limited number ofparameters to characterize the mesoscopic biofilm structure.In addition to these parametres, OCT can be a reliable toolto provide raw data, for example, three-dimensionalstructural displacement for the use in recent mechanicalbiofilm models (Taherzadeh et al., 2010), which requirethe experimental assessment of the mesoscopic biofilmstructure. For example, Bol et al. (2009) created theirdetachment model based on structures extracted fromCLSM image stacks. We suggest that the application oftheir model could be extended to include larger, mesoscaledetachment phenomena in addition to erosion. Thus, futuredetachment models could benefit from the detailedstructural information provided by OCT. Streamers andripples (Stoodley et al., 1999) are examples of mesoscalestructures where the usage of OCT is indispensable. Masstransfer processes in models can also benefit from OCTas it reveals possible mesoscopic fluid pathways throughthe biofilm and detailed information about the biofilmstructure.
Connectivity is commonly used to quantify the spatialheterogeneity of porous media (e.g., soil, Vogel, 1997; Vogelet al., 2002). With respect to biofilms, the calculation ofconnectivity could reveal and visualize possible pathwaysof fluid through biofilm pores and along the biofilm–bulkfluid interface. In future, connectivity should be introducedas a structural parameter to further characterize the biofilmstructure at the mesoscale. A combination of mesoscopicstructural parameters extracted from OCT and numericalmodels can also improve the current methods (Gjaltemaet al., 1994; de Beer et al., 1996) to get closer to therepresentative biofilm scales (Morgenroth and Milferstedt,2009).
The use of OCT to characterize the mesoscale structureof biofilms is relatively new and improvements are to come.
852 Biotechnology and Bioengineering, Vol. 107, No. 5, December 1, 2010
Despite the capability of OCT to visualize mesoscopicsample volumes, there have been limitations due to lowsignal-to-noise ratios. Based on our experience, the futurefocus has to be put on enhanced image acquisition andraw data quality with higher signal-to-noise ratios. Forinstance, the polarization fiber of the OCT device shouldbe adjusted in a way to enhance the signal-to-noise ratioleading to a more efficient image segmentation process.
Conclusion
In this study OCT was used as an investigation methodfor biofilms in addition to CLSM to compare their capabilityto capture mesoscale structure and properties. Samplevolumes of 4� 4� 3mm3, large enough to represent themesoscale biofilm structure, were acquired within 2min atresolutions <20mm. Heterotrophic biofilms grown inlaminar, transient, and turbulent flow conditions werecharacterized by a porous structure composed of connectedbiomass and pores of various sizes. Low structural variationsbetween OCT B-scans of each biofilm indicate theoccurrence of repeating units. OCT visualized the completesample volume, including the substratum, the base biofilm(LF< 100mm), the pores, and connected structuressimultaneously.
Independent from flow conditions, porosities calculatedfrom CLSM image stacks were approximately 0.98. Thecalculated porosities of OCT data sets of biofilms cultivatedin laminar and transient flow were close to each other inthe range of 0.63–0.67. However, the porosity of the biofilmgrown in turbulent flow was approximately 50% lowercompared to the other flow conditions. These values ofcalculated porosity differed significantly from those calcu-lated from CLSM image stacks. Hence, the microscopicvisualization of biofilms with CLSM does not correlate wellwith the mesoscopic examinations by OCT.
Based on the acquired data, we propose a cave-likemesoscopic biofilm structure where advective transportthrough the pores and along the open-structured biofilm–bulk fluid interface is possible. OCT has the potential toimprove the understanding of nutrient and substrate supplyof internal biofilm regions. In addition, flow and structuralsimulations could benefit from the structural propertiesrevealed by OCT since structural properties derived fromCLSM imaging data suffer from, for example, laserpenetration depth and staining specificity limitations.
We believe that OCT will be the key technique toinvestigate in situ and nondestructively the biofilm structureat the mesoscale. Nevertheless, a combination of OCT withother techniques, for example, CLSM and RM, is necessaryto estimate the distribution of biofilm constituents.
Thorlabs Germany is gratefully acknowledged for generously provid-
ing the OCT device. We thank Mr. Krah from Thorlabs Germany for
his great support and many valuable discussions.

References
Beyenal H, Donovan C, Lewandowski Z, Harkin G. 2004a. Three-dimen-
sional biofilm structure quantification. J Microbiol Methods 59:
395–413.
Beyenal H, Lewandowski Z, Harkin G. 2004b. Quantifying biofilm struc-
ture: Facts and fiction. Biofouling 20(1):1–23.
Bol M, Mohle RB, Haesner M, Neu TR, Horn H, Krull R. 2009. 3D finite
element model of biofilm detachment using real biofilm structures
from CLSM data. Biotechnol Bioeng 103(1):177–186.
Bouman EB, Tearney JG. 2001. Handbook of optical coherence tomogra-
phy. New York: Marcel Dekker.
Bryers JD. 2000. Biofilms II—Process analysis and applications. Wiley
Series in Ecological and Applied Microbiology. New York, Chichester,
Weinheim, Brisbane, Singapore, Toronto: John Wiley and Sons.
Characklis WG. 1989. Laboratory biofilm reactors. New York: John Wiley
and Sons.
Chen MY, Lee D, Tay J. 2006. Distribution of extracellular polymeric
substances in aerobic granules. Appl Environ Biotechnol 73:1463–1469.
ChenMY, Lee D, Tay J, Show K-Y. 2007. Staining of extracellular polymeric
substances and cells in bioaggregates. Appl Microbiol Biotechnol
75:467–474.
Chinga G, Johnsen PO, Dougherty R, Berli EL, Walter J. 2007. Quantifica-
tion of the 3d microstructure of SC surfaces. J Microsc 227:254–265.
de Beer D, Stoodley P, Lewandowski Z. 1996. Liquid flow and mass
transport in heterogeneous biofilms. Water Res 30(11):2761–2765.
Eberl HJ, Picioreanu C, Heijnen JJ, van Loosdrecht MCM. 2000. A three-
dimensional numerical study on the correlation of spatial structure,
hydrodynamic conditions, and mass transfer and conversion in bio-
films. Chem Eng Sci 55(24):6209–6222.
Ghannoum M, O’Toole G. 2004. Microbial biofilms, Vol. 1. New York,
Chichester, Weinheim, Brisbane, Singapore, Toronto: John Wiley and
Sons.
Gjaltema A, Arts PAM, van Loosdrecht MCM, Kuenen JG, Heijnen JJ. 1994.
Heterogeneity of biofilms in rotating annular reactors: Occurrence,
structure, and consequences. Biotechnol Bioeng 44(2):194–204.
Haisch C, Niessner R. 2007. Visualisation of transient processes in biofilms
by optical coherence tomography. Water Res 41(11):2467–2472.
Heydorn A, Nielsen AT, Hentzer M, Sternberg C, Givskov M, Ersboll BK,
Molin S. 2000. Quantification of biofilm structures by the novel
computer program comstat. Microbiology 146:2395–2407.
Huang D, Swanson EA, Lin CP, Schuman JS, Stinson WG, Chang W,
Hee MR, Flotte T, Gregory K, Puliafito CA, Fujimoto JG. 1991. Optical
coherence tomography. Science 254(5035):1178–1181.
Ivleva NP, Wagner M, Horn H, Niessner R, Haisch C. 2008. In situ surface-
enhanced Raman scattering analysis of biofilm. Anal Chem 80(22):
8538–8544.
Ivleva NP, Wagner M, Horn H, Niessner R, Haisch C. 2009. Towards a
nondestructive chemical characterization of biofilm matrix by Raman
microscopy. Anal Bioanal Chem 393(1):197–206.
Lawrence JR, Korber D, Hoyle B, Costerton JW, Caldwell D. 1991. Optical
sectioning of microbial biofilms. J Bacteriol 173:6558–6567.
Lawrence JR, Swerhone GDW, Leppard GG, Araki T, Zhang X, West MM,
Hitchcock AP. 2003. Scanning transmission X-ray, laser scanning, and
transmission electron microscopy mapping of exopolymeric matrix of
microbial biofilms. Appl Environ Microbiol 69(9):5543–5554.
Lawrence JR, Swerhone GD, Kuhlicke U, Neu TR. 2007. In situ evidence for
microdomains in the polymer matrix of bacterial microcolonies. Can J
Microbiol 53(3):450–458.
Li C, Kao CY, Gore JC, Ding Z. 2008. Minimization of region scalable fitting
energy for image segmentation. IEEE Trans Image Process 17(10):
1940–1949.
Manz B, Volke F, Goll D, Horn H. 2003. Measuring local flow velocities and
biofilm structure in biofilm systems with magnetic resonance imaging
(MRI). Biotechnol Bioeng 84(4):424–432.
Manz B, Volke F, Goll D, Horn H. 2005. Investigation of biofilm structure,
flow patterns and detachment with magnetic resonance imaging. Water
Sci Technol 52(7):1–6.
Merod RT, Warren JE, McCaslin H, Wuertz S. 2007. Toward automated
analysis of biofilm architecture: Bias caused by extraneous confocal
laser scanning microscopy images. Appl Environ Microbiol 73(15):
4922–4930.
Milferstedt K, Pons MN, Morgenroth E. 2008a. Analyzing characteristic
length scales in biofilm structures. Biotechnol Bioeng 102(2):368–379.
Milferstedt K, Pons MN, Morgenroth E. 2008b. Textural fingerprints: A
comprehensive descriptor for biofilm structure development. Biotech-
nol Bioeng 100(5):889–901.
Morgenroth E, Milferstedt K. 2009. Biofilm engineering: Linking biofilm
development at different length and time scales. Rev Environ Sci
Biotechnol 8(3):203–208.
Neu TR, Lawrence JR. 1999. Lectin-binding analysis in biofilm systems.
Methods Enzymol 310:145–152.
Neu TR, Swerhone GDW, Lawrence JR. 2001. Assessment of lectin-binding
analysis for in situ detection of glycoconjugates in biofilm systems.
Microbiology 147:299–313.
North AJ. 2006. Seeing is believing? A beginners’ guide to practical pitfalls
in image acquisition. J Cell Biol 172(1):9–18.
Otsu N. 1979. A threshold selection method from gray-level histograms.
IEEE Trans Syst Man Cybern 9(1):62–69.
Patzold R, KeuntjeM, von Anders-Ahlften A. 2006. A new approach to non-
destructive analysis of biofilms by confocal Raman microscopy. Anal
Bioanal Chem 386(2):286–292.
Seymour JD, Codd SL, Gjersing EL, Stewart PS. 2004. Magnetic resonance
microscopy of biofilm structure and impact on transport in a capillary
bioreactor. J Magn Reson 167(2):322–327.
Staudt C, Horn H, Hempel DC, Neu TR. 2003. Screening of lectins for
staining lectin-specific glycoconjugates in the EPS of biofilms. In:
O’Flaherty V, Moran P, Lens P, Stoodley P, editors. Biofilms in
industry, medicine & environmental biotechnology. London: IWA
Publishing, p 308–327.
Staudt C, Horn H, Hempel DC, Neu TR. 2004. Volumetric measurements
of bacterial cells and extracellular polymeric substance glycoconjugates
in biofilms. Biotechnol Bioeng 88(5):585–592.
Stoodley P, Dodds I, Boyle JD, Lappin-Scott HM. 1999. Influence of
hydrodynamics and nutrients on biofilm structure. J Appl Microbiol
Symp Suppl 85:19S–28S.
Taherzadeh D, Picioreanu C, Kuttler U, Simone A,Wall WA, Horn H. 2010.
Computational study of the drag and oscillatory movement of biofilm
streamers in fast flows. Biotechnol Bioeng 105(3):600–610.
Vogel HJ. 1997. Morphological determination of pore connectivity as a
function of pore size using serial sections. Eur J Soil Sci 48(3):365–
377.
Vogel HJ, Cousin I, Roth K. 2002. Quantification of pore structure and gas
diffusion as a function of scale. Eur J Soil Sci 53(3):465–473.
Wagner M, Ivleva NP, Haisch C, Niessner R, Horn H. 2009. Combined
useof confocal laser scanning microscopy (CLSM) and Raman micro-
scopy (RM): Investigations on EPS–matrix. Water Res 43:63–76.
Wang R, Liu X, Xiong GL, Xue P, ChenDY. 2006. Full-fieldOCT combining
with fluorescent microscopy—Art. no. 60470n. In: Xu K, Luo Q, Xing
D, Priezzhev AV, Tuchin VV, editors. Fourth International Conference
on Photonics and Imaging in Biology and Medicine, Pts 1 and 2,
Proceedings of the Society of Photo-Optical Instrumentation Engineers
(SPIE), Vol. 6047. SPIE-Int Soc Optical Engineering, Bellingham, p.
N470.
Wuertz S, Bishop P, Wilderer PA. 2008. Biofilms in wastewater treatment:
An interdisciplinary approach.Water &Wastewater Practitioner Series:
STOWA Report. London, Great Britain: IWA Publishing.
Xi C, Marks D, Schlachter S, Luo W, Boppart S. 2006. High-resolution
three-dimensional imaging of biofilm development using optical
coherence tomography. J Biomed Opt 11:1–6.
Wagner et al.: Volumetric Features of Biofilms at Mesoscale 853
Biotechnology and Bioengineering