investigation of the primary-secondary metabolism ... · investigation of the primary-secondary...
TRANSCRIPT
By Sergey Malitsky
Advisor: Dr. Asaph Aharoni
July, 2011
Investigation of the Primary-Secondary Metabolism Interface in Plants Using
Metabolomics Technologies
מאת מליצקי סרגי
תשע"א,תמוז
אסף אהרוני .דר :המנח
Thesis for the degree Doctor of Philosophy
Submitted to the Scientific Council of the Weizmann Institute of Science
Rehovot, Israel
לתוארעבודת גמר (תזה) דוקטור לפילוסופיה
מוגשת למועצה המדעית של מכון ויצמן למדע רחובות, ישראל
2
Contents
Contents ..............................................................................................................................................................2
Abbreviations ......................................................................................................................................................4
Abstract ...............................................................................................................................................................6
Introduction: .......................................................................................................................................................8
Primary and Secondary Metabolism ..............................................................................................................8
Secondary Metabolism in Plants ....................................................................................................................8
The Shikimate Pathway and Tryptophan, Tyrosine and Phenylalanine Biosynthesis in Plants ....................9
Indole and Aliphatic Glucosinolates and their Precursors ...........................................................................11
Metabolomics Technologies ........................................................................................................................11
Methods for Metabolomics Analysis ...........................................................................................................12
The major goal of the thesis research: ..............................................................................................................14
Specific goals of the research: .....................................................................................................................14
Materials and methods ......................................................................................................................................15
Main findings and achievements: .....................................................................................................................22
Development of Metabolomics tools and their combination with biological research ...............................22
Development of an advanced technological infrastructure for conducting state of the art metabolomics in
plants using GC-MS and LC-MS. ................................................................................................................24
LC-MS in Metabolomics .............................................................................................................................24
GC and GC-MS in Metabolomics ................................................................................................................25
Setup and Optimization of Sample Preparation Methods for Metabolomics Analysis ...............................25
Chromatographic methods for the GC-MS instrument ................................................................................25
Generation of a reference spectral library of compounds ............................................................................26
Development of targeted metabolite analyses protocols .............................................................................27
Published papers (Malitsky et al. 2008; Tzin and Malitsky et al. 2009): ....................................................28
Further investigation of the relationship between primary and secondary metabolism associated with
aromatic amino acid biosynthesis in Arabidopsis ........................................................................................72
Discussion .........................................................................................................................................................76
Development of Metabolomics tools and their combination with biological research ...............................76
3
Understanding the relationship between primary metabolites involved in Tryptophan and Methionine
metabolism, precursors pathways and secondary metabolism in Arabidopsis ............................................77
Understanding the relationship between primary and secondary metabolism associated with aromatic
amino acid biosyntehsis in Arabidopsis .......................................................................................................78
Further investigation of relationship between primary and secondary metabolism associated with aromatic
amino acid biosyntehsis in Arabidopsis .......................................................................................................79
The bacterial DAHPS is feedback inhibited in planta by Phenylalanine .....................................................79
Overexpression of AroG reveals novel regulatory bottlenecks within the shikimate pathway and between
primary and secondary metabolism .............................................................................................................80
Transcriptional and post translational regulatory effects on the primary and secondary metabolic
networks. ......................................................................................................................................................81
List of publications ...........................................................................................................................................83
Manuscript near submission .............................................................................................................................84
Patent applications ............................................................................................................................................84
References ........................................................................................................................................................85
4
Abbreviations
5MT 5-methyl-tryptophan
AAAAT aromatic amino acid aminotransferase
AAAs aromatic amino acids
ADT arogenate dehydratase
ANOVA analysis of variance
AS anthranilate synthase
CDRP phosphoribosylanthranilate into l-(O-carboxyphenylamino)-l-deoxyribulose-5-phosphate
CM chorismate mutase
CM/PDT chorismate mutase/prephenate dehydratase
CS chorismate synthase
DAHPS 3-deoxy-d-arabino-heptulosonate-7-phosphate synthase
DHQ/SDH 3-dehydroquinate dehydratase/shikimate 5-dehydrogenase
DHQS 3-dehydroquinate synthase
E-4P erythrose 4-phosphate
EPSPS 5-enolpyruvylshikimate-3-phospate synthase
FDR false discovery rate
GC-MS gas chromatograph mass spectrometry
IAA indole-3-acetic acid
IAOx indole-3-acetaldoxime
IGPS indole-3-glycerol phosphate synthase
LC-MS liquid chromatograph mass spectrometry
PAI phosphoribosylanthranilate isomerase
PAL phenylalanine ammonia lyase
PAT or PPA-AT prephenate aminotransferase
PCA - principal component analysis
PDH - prephenate dehydrogenase
PDT prephenate dehydratase
PEP phosphoenolpyruvate
Phe phenylalanine
p-hydroxyPPY p-hydroxyphenylpyruvate
PPY phenylpyruvate
TAL tyrosine ammonia lyase
TAT tyrosine aminotransferase
TF transcription factors

5
Trp tryptophan
TRX thioredoxin
Tyr tyrosine
UPLC ultra performance liquid chromatography
WT wild type
6
Abstract
Plants produce an amazing diversity of low molecular weight compounds; the structure of nearly 200,000
of them has already been elucidated. A small fraction of the so-called Metabolome is represented by
primary metabolites while the majority are secondary or specialized metabolites produced in particular
plant species or families. Secondary metabolites are derived from primary metabolites such as amino
acids and lipids and play a role in the interaction between plants and the environment. In recent years a
new approach termed Metabolomics emerged that allows extensive and unbiased (non-targeted) analysis
of the Metabolome. The first objective of my Ph.D project was to develop an advanced technological
infrastructure for conducting state of the art Metabolomics. The system largely utilizes high-end
analytical instruments based on Mass Spectrometry (MS) namely, Gas-Chromatography (GC)-MS and
high resolution Liquid Chromatography (LC)-MS. A second aim of my PhD research was to understand
the cross-talk (or interface) between primary and secondary metabolism in plants. I have used two model
biological processes for this study. The first model was the primary metabolism of tryptophan and
methionine (and its precursors) and the associated secondary metabolic pathways (e.g. glucosinolates that
are derived from these two amino acids). Transgenic Arabidopsis lines overexpressing MYB type
transcription factors that activate either pathway were used in the course of the project. The second model
process was the primary metabolism of phenylalanine and its associated downstream phenylpropanoids
secondary metabolites. Arabidopsis plants overexpressing two bacterial genes encoding key-enzymes
involved in aromatic amino acid biosynthesis pathways, namely, DAHPS (i.e. AroG) and PheA were used
in this section of my PhD study. Detailed metabolomics analysis using tools developed in the course of
the thesis work was performed on transgenic plants that are altered in these pair of metabolic model
processes. In case of the glucosinolates model I provided evidence and concluded that activity of the
MYB transcription factors that regulate glucosinolates biosynthesis is not restricted to the metabolic
space surrounding the glucosinolates but is tightly linked to more distal metabolic networks of primary
metabolism. Moreover, the negative cross talk between the methionine and tryptophan pathways that
generate glucosinolates in Arabidopsis includes additional metabolites, as for example the phytoalexin
camalexin. Finally, we showed for the first time that transcription factors regulating biosynthesis of
secondary metabolites (glucosinolates) most probably directly activate genes corresponding to the
biosynthesis of primary metabolite pathways (e.g. the TCA cycle). In the second model process (aromatic
amino acids biosynthesis and downstream secondary metabolites), except phenylanine and tryptophan, no
significant effect was observed on primary metabolites, including metabolites of the shikimate pathway
upstream to chorismate in plant expressing the PheA gene. These results indicated that the metabolic
pathways leading to the synthesis of aromatic amino acids from chorismate possess a minimal network

7
interaction with their upstream shikimate pathway as well as with other networks of primary metabolism.
Plants that overexpressed the DAHPS gene triggered significantly higher accumulation of two
intermediate metabolites of the shikimate pathway, shikimate and prephenate. The observed results
suggest that that the enzymatic steps following these two metabolites represent regulatory bottlenecks that
enable balanced synthesis of aromatic amino acids.
All together, the study of these 2 model processes with relation to the primary and secondary
metabolism revealed a tight and likely direct regulatory association between them. This relation should be
further investigated in future studies and might be of great value for designing metabolic engineering
strategies.
8
Introduction
Primary and Secondary Metabolism
Metabolism is the term used to describe all chemical reactions and interactions that take place in a
biological system. Primary metabolism encompasses reactions involving those compounds which are
formed in the normal anabolic and catabolic processes. These processes take place in most, if not all
organisms. Common examples of primary compounds are sugars, amino acids and nucleotides. The
definition of secondary metabolites relates to organic compounds that are not directly involved in the
normal growth or reproduction of organisms. Unlike primary metabolites, the absence of secondary
metabolities does not result in an immediate death of the organism. Flower pigments and scents are
examples of plant secondary metabolites.
Secondary Metabolism in Plants
Plants produce an amazing diversity of low molecular weight compounds. Although the structure of
nearly 200,000 has already been elucidated, there are many more such compounds1. Only a small fraction
of these are part of the primary metabolic pathways (those common to most organisms), the rest are
secondary metabolites. Their biosynthesis is restricted to selected plant groups and they often accumulate
in specialized cells2. Secondary metabolites have multiple functions in plants. They participate in a
plethora of plant-environment relationships such as plant-insect, plant-microorganism or plant-plant
interactions.
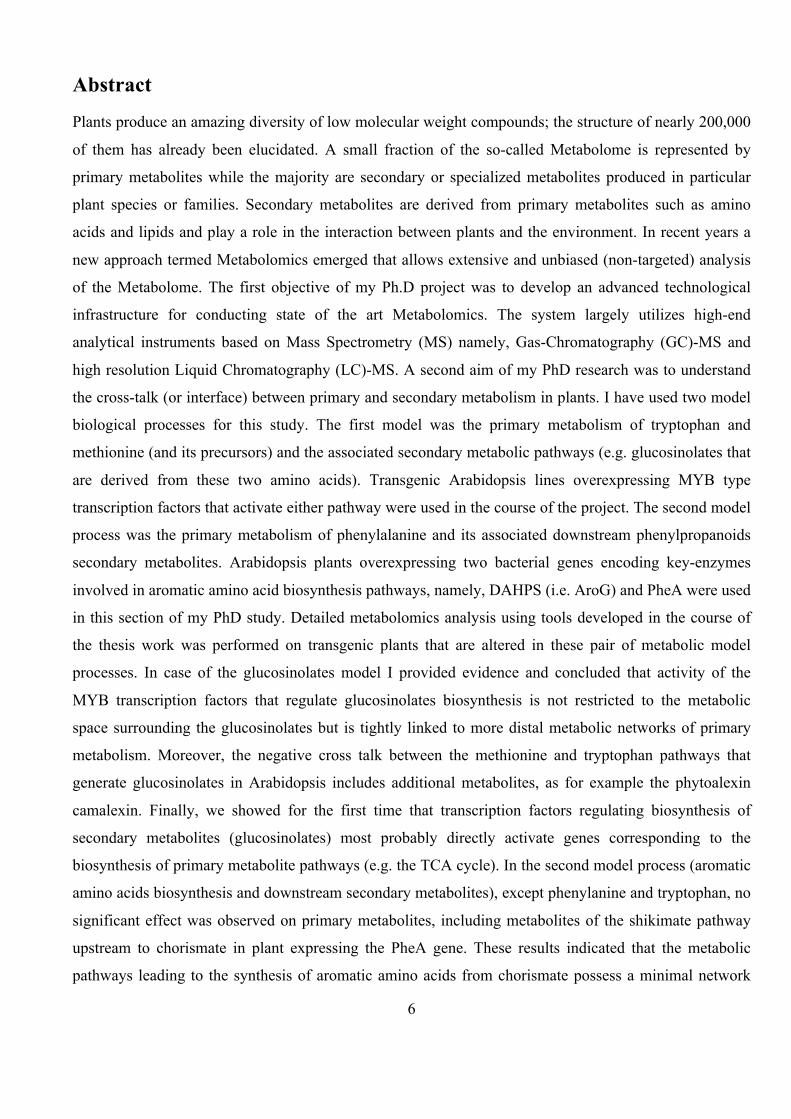
Plant secondary metabolites can be divided into three major chemically distinct groups: terpenes,
phenols, and nitrogen containing compounds (Figure 1). Examples of plant secondary compounds
according to their group include - Terpenoids: monoterpenes, diterpenes, triterpenes, Phenolics:
phenylpropanoids, flavonoids, polyacetylens and polyketides, Nitrogen containing: alkaloids, amines,
cyanogenic glycosides and glucosinolates.
9
Figure 1. A simplified view of the major pathways of secondary metabolite biosynthesis and their
interrelationships with primary metabolism. Terpenes include monoterpene, diterpenes, triterpenes,
steroids, saponines. Phenolics compounds imclude: flavonoids, polyacetylens, polyketides,
phenylpropanoids. Nitrogen containing secondary products include: alkaloids, non protein amino acids,
amines, cyanogenic glycosides, glucosinolates
The Shikimate Pathway and Tryptophan, Tyrosine and Phenylalanine Biosynthesis in Plants Conversion of phosphoenolpyruvate and erythrose-4 phosphate into the aromatic amino acids
Tryptophan, Tyrosine and Phenylalanine, by the shikimate pathway is the initiating point for the
production of a huge number of secondary metabolites. This pathway is therefore considered as one of the
key pathways connecting between primary and secondary metabolism3.
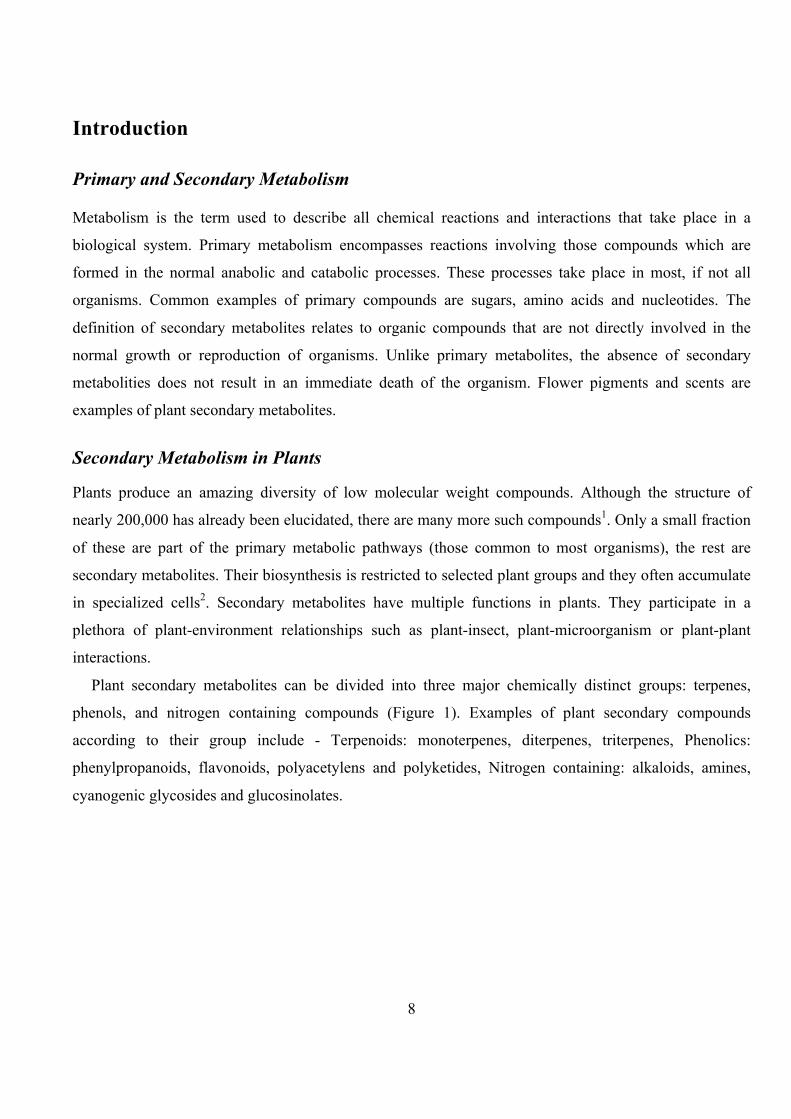
Chorismate serves as a precursor in the synthesis of the essential aromatic amino acids Tryptophan,
Tyrosine and Phenylalanine. The Tryptophan biosynthetic pathway (Figure 2) starts with chorismate,
which is transformed by anthranilate syntase (AS) into anthranilate. This is the first reaction leading from
the common aromatic amino acid pathway (the shikimate pathway) towards the biosynthesis of
tryptophan4. The last two steps in the pathway are catalyzed by the two subunits of tryptophan synthase5.
Biosynthesis of tyrosine and phenylalanine starts from prephenate and arogenate. Removal of water
results in the formation of the third double bond and phenylalanine is formed by decarboxylation.
10
Oxidation of arogenate by NAD, which is accompanied by a decarboxylation, results in the formation of
tyrosine. Prephenate is converted to phenylalanine via either phenylpyruvate (PPY) The PPY route
involves conversion of prephenate into PPY by the enzyme prephenate dehydratase (PDT), and the
subsequent conversion of PPY into Phe by the enzyme aromatic amino acid aminotransferase.
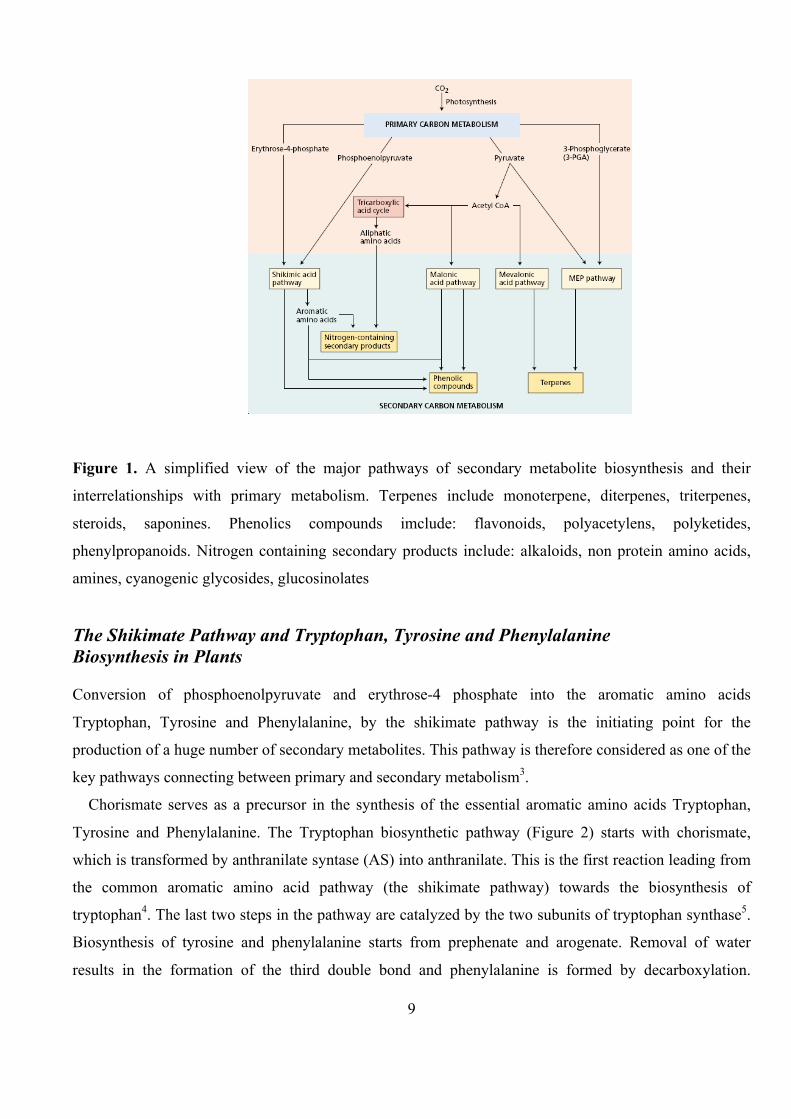
In addition to its primary role in providing an amino acid for protein synthesis, the tryptophan
biosynthetic pathway of higher plants also produces precursors for the synthesis of a variety of important
metabolites (Figure 3). These include the phytohormone Indole-3-acetic acid (IAA)6, the antimicrobial
phytoalexins7, and indole glucosinolates that influence plant-pathogen interactions.
Figure 2. The tryptophan biosynthetic pathway.
Figure 3. lndolic compounds produced by the tryptophan biosynthetic pathway. A-Tryptophan, B-Indole-3-acetic acid (auxin), C- 3-thiazol-P’-yl-indole (camalexin, a phytoalexin), and D- Indol-3ylmethylglucosinolate (an indole glucosinolate).
A
B
C
D
11
Indole and Aliphatic Glucosinolates and their Precursors
Glucosinolates (β-thioglucoside-N-hydroxysulfates; GSs) are nitrogen- and sulfur-containing plant
specialized metabolites. Approximately 120 different GSs have been described up to date, almost all of
them in the Brassicaceae family which includes cruciferous crops such as oilseed rape, cabbage and
broccoli. The occurrence of GSs in the model plant Arabidopsis thaliana promoted extensive studies on
GSs biosynthesis, degradation and pathway regulation upon herbivory and other stress conditions. In A.
thaliana, there are at least 37 different GSs8, with side chains derived mainly from methionine (Aliphatic
Glucosinolates; AGs) and tryptophan (Indole Glucosinolates; IGs). The biosynthetic pathways of AGs
and IGs is shown in Figure 5 and 6, respectively. The biosynthesis of GSs starts with amino acids side
chain elongation that forms a chain-elongated α-keto acid that can either be subjected to further
elongation cycles or used in the generation of the GSs-defining core structure (or glucone). Glucone
formation is a five steps pathway that starts with the formation of an aldoxime through oxidation of the
precursor amino acids by cytochrome P450 monooxygenases (cytochrome P450s), members of the
CYP79 family. In the last step of the pathway sulfation of desulfoglucosinolates occurs and thereafter
secondary modification of the side chain takes place (various kinds of oxidations, eliminations,
alkylations and esterfications). Formation of GSs is interconnected with the metabolism of key plant
metabolites. For example, a recent work showed that the tryptophan-derived Indole Aldoxime (IAOx) is a
key branching point between the biosynthesis of IGs, Indole-3-acetic acid (IAA) and the phytoalexin
Camalexin9,10.
Metabolomics Technologies Living organisms, besides macromolecules (nucleic acids, proteins and other polymers), consist of many
low molecular weight metabolites. All metabolites together make up the metabolome and ideally
metbolomics analysis will cover the entire metabolome.11 The central dogma of molecular biology,
introduced by Francis Crick, defines the information flow in cells from DNA to RNA to protein. In an
"omics" perspective; information from the genome makes the transcriptome makes the proteome. Finally
proteome effects the metabolome which varies greatly between organisms. While yeast has around 550
metabolites, the number grows rapidly in higher organisms, especially in plants in which more than
200,000 metabolites have been estimated to be produced by the entire plant kingdom 1. Metabolomics is
a relatively new discipline and techniques for high-throughput metabolic profiling are still under
development. No single technique is suitable for the analysis of all different types of molecules, therefore
a mixture of techniques is used.
12
Metabolome analysis could be divided to two categories Targeted analysis or Non-Targeted metabolite
profiling.
Targeted analysis is used to accurately measure the concentration of selected metabolites in the
sample. To perform targeted analysis, one must know the structure of the target metabolite and have an
analytical method developed to properly measure its concentration in the sample. Targeted analysis is a
truly quantitative approach and provides very low limits of detection for known metabolites. It can also be
used in a high-throughput mode, depending on the compounds of interest.
Non-Targeted metabolic analysis is the unbiased measurement of as much as possible of different
metabolites or classes of metabolites with the objective to identify a specific metabolite profile that
characterizes a given sample. Such analysis is used routinely as an supplementary tool in characterization
of different plant genotypes since it may aid in the identification of the function of genes, especially when
mutants have no visible phenotype and unexpected chemical changes occur.
Methods for Metabolomics Analysis The methods used in metabolomics typically consist the separation of the sample to different fractions
and subsequent detection and identification. Three major techniques are often employed in order to
analyze the samples with chromatographic separation:
Gas Chromatography - Mass Spectrometry (GC-MS) – GC-MS allows the detection and
identification of volatile metabolites. Samples are vaporized, separated in a column and subsequently
analyzed by a mass detector. Since biological samples often contain many non-volatile compounds, a
chemical derivatization procedure is needed in order to render them volatile. An often used procedure for
such treatment is oximation followed by silylation where an active hydrogen is replaced by an alkylsilyl
group like trimethylsilyl (TMS), thus providing more stability to the samples and increasing volatility
through reduction of dipole–dipole interactions. Utilization of this approach enables simultaneous
profiling of several hundred chemically diverse compounds including organic acids, amino acids, sugars,
sugar alcohols, aromatic amines and fatty acids.
Liquid Chromatography - Mass Spectrometry (LC-MS) – LC-MS is composed of a high-pressure
liquid chromatography (HPLC) column through which samples are passed and thus separated. The
detection is carried out by mass detection, the same as in GC-MS. A recently developed ultra
performance – liquid chromatography (UPLC) technology has been used in my work. It utilizes 2µm
particles in the chromatographic column along with high linear solvent velocities in order to increase the
resolution, and the speed of analysis compared to traditional HPLC methods. This technique allows a
very rapid (up to ten fold faster than that of conventional HPLC) chromatographic separation of samples
13
and mass detection. This permits the analysis of many samples within short time periods. When coupled
to a Quadrupole-Time of Flight (Q-ToF) mass detector, the system provides mass spectra with high mass
resolution and MS/MS-capabilities for metabolite identification and high sensitivity and dynamic range
for metabolite quantification. High mass resolution (accurate mass) makes it possible to generate
empirical formulae of unknown compounds. This technique enables us to assess a wide range of
metabolites including unknown compounds which may be affected by the genetic background. This is in
contrast to classical LC-MS, which only allows detection of specific metabolites that need to be identified
prior to method development.
UPLC-MS also allows a high precision in the quantitation of specific materials in the sample, which
makes it possible to observe even the most subtle differences between samples. Another advantage of
liquid chromatography over gas chromatography is that LC-MS does not require prior derivatization of
the samples as in GC-MS. LC-MS directly measures the metabolites in their native form. Thus, the data
acquired is more indicative of the existing amounts of the metabolites. LC-MS is a robust analytical
approach, which allows researchers to perform high-throughput identification of a wide range of plant
metabolites including flavonoids, amino acids, glucosinolates and aromatic amines.
Nuclear magnetic resonance (NMR) is a method of detection for metabolites, which utilizes the
nuclear magnetic resonance spectra of atoms (usually 1H and 13C) in analyzed compounds. It can identify
and quantify a wide spectrum of organic compounds in the micro-molar concentration range12,13. Samples
analyzed by NMR can be saved and further analyzed with other methods. The sample preparation for
NMR analysis is simple and does not require derivatization of the samples. However, complex mixtures
are hard to analyze with NMR without good separation. The major caveat of the NMR technique is its
relatively low sensitivity, therefore, making it inappropriate for the analysis of samples with a large
number of low-abundance metabolites.
14
The major goal of the thesis research:
The major goal of my PhD thesis was to understand how plants control the primary-secondary
metabolism interface.
Specific goals of the research:
- Development of an advanced technological infrastructure for conducting state of the art
metabolomics in plants using GC-MS and LC-MS.
- Understanding the relationship between primary metabolites involved in tryptophan and
methionine metabolism, precursors pathways and secondary metabolism.
- Understanding the relationship between primary and secondary metabolism associated with
aromatic amino acids in Arabidopsis.
15
Materials and methods
Biological samples generation
Biological models and samples used in my PhD work were generated in collaboration with Eyal Blum
worked in prof. Yval Eshed group and Vered Tzin worked in prof. Gad Galili. More detailed protocols for
generation of the biological sample are described in the attached articles (Results Section).
Non-targeted metabolic analysis of semi-polar compounds by UPLC-qTOF-MS
Non-targeted metabolic analysis approach was developed for Arabidopsis leaves and seedlings. This
method can be also successfully applied with minor modifications to other plant tissues. Plant tissues
(approximately 100 mg) were harvested. Frozen and ground tissues were extracted by the addition of 450
µl of MeOH-H2O (80:20) and sonicated for 25 min. After centrifugation for 5 min at 10000 rpm, the
supernatant was filtered through a Millex-GV MF (PDV) 0.22 µm filter and the filtrate was analyzed by
liquid chromatography–mass spectrometry (LC-MS). Mass spectra analyses were carried out by the
UPLC-qTOF instrument (Waters Premier QTOF, Milford, MA, USA), with the UPLC column connected
on-line to a UV detector (Waters, Acquity), and then to the MS detector. The sample (5 µl) was applied to
an Acquity UPLC system (Waters) and separated on a BEH C18 Acquity column (100x2.1-mm, 1.7µm;
Waters) under a linear gradient elution program with solvent A (0.1% formic acid in 5% acetonitrile /
95% water) and solvent B (0.1% formic acid in acetonitrile): 0 to 28% solvent B (22 min), 28 to 40%
solvent B (till 22.5 min), 40 to 100% solvent B (till 23 min), 100% solvent B (till 24.5 min), and 100%
solvent A (till 26 min). Elution was performed at 0.3 mL/min flow and the column temperature of 35°C.
The electrospray probe was operated at 3 kV. The source and desolvation temperatures were 125°C and
275°C, respectively. A mixture of 15 standard compounds, injected after each 10 sample was used as the
quality control samples. The MassLynx software version 4.1 (Waters) was used to control the instrument
and calculate accurate masses.
Analysis of LC-qTOF-MS metabolomics data
For analysis of the metabolomics data obtained from the LC-qTOF-MS instrument two methods were
used. In the first project; “The transcript and metabolite networks effected by the two clades of
Arabidopsis glucosinolate biosynthesis” was analyzed by method described below. The markers (mass
signals) obtained from the MarkerLynx software were processed using a custom-made filtering statistical
script written in MATLAB 7.0.4 (The MathWorks Inc.). The MarkerLynx peak peaking algorithm often
misses the true value of mass signals in the data and marks them as zeros. Therefore, the first stage of the
analysis was to distinguish between erroneously marked zero values and true “absent” calls. Three
16
scenarios were considered, when examining the replicates for each of the markers: In (a), the mean
intensity of the marker is in the highest 90% of the overall data and there is one zero value out of five
replicates. The zero value is removed from further analysis; b), the intensity is in the highest 90% and
there are two or more zero values. A confident assignment of the marker levels for that group cannot be
made. Therefore, the marker is excluded completely from the analysis; the mean intensity of non-zero
values for the marker in the group is low. Therefore, the zeros are true calls and the zero values are
replaced by the detection threshold of the instrument calculated from the overall distribution of the lowest
values in the data. To assess whether the different genotypes in the analysis vary in the composition of
metabolites Kruskal-Wallis nonparametric one-way analysis of variance was performed on each of the
markers. The resulting p-values were controlled for multiple hypotheses testing using a 5% false
discovery rate (FDR) cutoff14. For each of the significantly different markers a series of Mann-Whitney's
ranksum tests were carried out to find which of the over expression lines differs from the wild type in the
marker's abundance. To control for multiple hypotheses testing (5 genotypes vs. WT tests), once again a
5% FDR cutoff was taken for each of the markers. Statistically different markers were clustered
according to the similarity in their abundance profiles across different samples and according to the
proximity in their retention time. For metabolite identification we continued only with clusters containing
more than one mass signal. Metabolites were identified using standard compounds by comparison of their
retention times, UV spectra, MS/MS fragments and dual energy fragments.
Non-targeted metabolic analysis of the additional two projects “Expression of a bacterial bi-
functional chorismate mutase/prephenate dehydratase modulates primary and secondary metabolism
associated with aromatic amino acids in Arabidopsis” and “Expression of a bacterial feedback-insensitive
DAHP synthase of the shikimate pathway in arabidopsis exposes novel regulatory bottlenecks between
primary and secondary metabolism” was performed using the XCMS software - improved algorithm for
peak peaking of the raw data. XCMS software from the Bioconductor package (version 2.1) for the R
statistical language (version 2.6.1) performs chromatogram alignment, mass signal detection and peak
integration15. XCMS was used with the following parameters: fwhm = 10.8, step = 0.05, steps = 4, mzdiff
= 0.07, snthresh = 8, max = 1000. Injections of samples in the positive and negative ionization modes and
pre-processing was performed independently for each ionization mode. A Student’s t-test analysis was
performed for metabolites with significant level changes in all genotypes using the JMP software.
17
Metabolites for all three projects were identified using standard compounds by comparison of their
retention times, UV spectra and MS/MS fragments. When the corresponding standards were not
available, compounds were putatively identified applying several steps. First, the elemental composition
was selected according to the accurate masses and the isotopic pattern using the MassLynx software.
Then the elemental composition obtained was searched against the KNApSAcK metabolite database
(http://prime.psc.riken.jp/KNApSAcK) and the Dictionary of Natural Products (Chapman & Hall/CRC).
When a suitable candidate was not found, more comprehensive chemical databases were searched using
the SciFinder tool (SciFinderScholar 2007). Predicted Log D values for pH 3 (pH of the UPLC mobile
phase), found using the SciFinder tool, were utilized for the retention time prediction in order to narrow
the number of proposed structures. The interpretation of the observed UV and MS/MS spectra in
comparison with those found in the literature (when possible) was the main tool for putative identification
of metabolites.
GC–MS profiling of derivatized extracts
The GC-MS analysis was developed for Arabidopsis leaves and seedlings. For every sample, we pooled
leaves of approximately four-six plants that showed a clear morphological phenotype (progeny of a single
transformation event line). For analysis of polar compounds, frozen ground tissue powder (100 mg) was
extracted in 700 µl of methanol with 30µl of internal standard (ribitol, 0.2 mg in 1 ml of water). After
mixing vigorously, the extract was sonicated in a bath sonicator for 20 min., centrifuged at 20,000 g.
Chloroform (375 µl) and water (750 µl) were added to the supernatant and the mixture was vortexed and
centrifuged. Aliquots of the upper methanol/water phase (500 µl) were taken and lyophilized. The freeze
dried samples were methoxymated by addition of 40 µl methoxyamine (20mg/ml) in pyridine and
incubated for 90 minutes at 37 ºC. Methoximated samples were derivatizated by addition 70 µl of
deritiztion agent MSTFA and incubated for 30 minutes at 37 ºC. Sample volumes of 1 µl were injected
into the GC column. A retention time standard mixture (14 µg/ml in pyridine: n-dodecane, n-pentadecane,
n-nonadecane, n-docosane, n-octacosane, n-dotracontane, and n-hexatriacontane) was injected after each
set of six samples. The GC-MS system was comprised of a COMBI PAL autosampler (CTC analytics
AG), a Trace GC Ultra gas chromatograph equipped with a PTV injector, and a DSQ quadrupole mass
spectrometer (ThermoElectron Cooperation, Austin, USA). GC was performed on a 30 m x 0.25 mm x
0.25 µm Zebron ZB-5ms MS column (Phenomenex, USA). The PTV split technique was carried out as
follows: samples were analyzed in the PTV solvent split mode. PTV inlet temperature was set at 45 °C,
followed by a temperature program: hold at 45 °C for 0.05 min, raise to 70 °C with a ramp rate of 10
°C/sec, hold at this temperature for 0.25 min, transfer-to-column stage (raising to 270 °C with a ramp rate
of 14.5 °C/sec; hold at 270 °C for 0.8 min.), and finish by a cleaning stage (raising to 330 °C with a ramp
18
rate of 10 °C/sec; hold at 330 °C for 10 min). For separation of the metabolites we used the following GC
conditions: the initial oven temperature of 40°C was increased at a rate of 15°C / min to 300°C
(maintained for 4.5 min). Helium was used as carrier gas and flow rate was 1.2 mL / min, the interface
temperature was 250°C and the source temperature was 280°C.
Analysis of the GC-MS data
The reconstructed ion chromatograms and mass spectra were evaluated using the Xcalibur software v.1.4
(ThermoFinnigan, Manchester, UK). Compounds were identified by comparison of their retention index
(RI) and mass spectrum to those generated for authentic standards analyzed on our instrument. When the
corresponding standards were not available, compounds were putatively identified by comparison of their
RI and mass spectrum to those present in the mass spectra library of Max-Planck-Institute for Plant
Physiology, Golm, Germany (Q_MSRI_ID, http://csbdb.mpimp-
golm.mpg.de/csbdb/gmd/msri/gmd_msri.html) and the commercial mass spectra library NIST
(www.nist.gov). The response values for metabolites resulting from the Xcalibur processing method were
normalized to the ribitol internal standard. This was carried out by dividing the peak area of the
metabolite by the peak area of ribitol. For PCA, the XCMS software was first applied to the GC-MS
dataset with the following parameters: fwhm = 4, step = 0.05, steps = 4, mzdiff = 0.5, snthresh = 4, max =
1000 (Smith et al., 2006). Then, PCA plots were generated using tmev4 software16,17. In order to test if
the level of each metabolite in the transgenic over expression line was significantly different from its
levels in the wild type plants we used a standard t-test. In cases where the metabolite was above the
detection level in both lines (transgenic and wild type) a two-samples version of the t-test was used and in
cases where the metabolite was above the detection level in only one of the lines (transgenic or wild type)
a one-sample version of the t-test was used.
Analysis of glucosinolates and camalexin by UPLC-qTOF-MS
For glucosinolates and camalexin analyses we used the same chromatographic conditions and instrument
parameters as described for the non-targeted profiling by UPLC–qTOF–MS (see above).
Methylsulfinylalkyl, methylthioalkyl type GSs and IGs were identified by their m/z values, and mass
fragmentation patterns. Camalexin was analyzed using the same extraction and chromatographic
condition and quantified against a calibration curve prepared from a camalexin standard (kind gift from
Jane Glazebrook). For camalexin induction, a thin film of 5mM AgNO3 and 0.02% Silwet L-77 was
created on two weeks-old rosette leaves by spraying. The tissue was harvested 12 hours after spraying for
LC-MS analysis.
19
Analysis of free auxin (IAA)
Analysis of free auxin (IAA) was performed on data set derived from plants over expressing MYB51
(n=4), MYB28 (n=3) and wild-type (n=4). For every sample we pooled leaves of approximately six plants
that showed a clear morphological phenotype (progeny of a single transformation event line). We
followed a protocol kindly provided by Dr Jennifer Normanly that was partially described earlier
(Normanly et al., 1993). In brief, frozen plant tissue (100 mg of 14 days old leaves) was extracted with a
solution containing 35% of 0.2 M imidazole at pH 7.0 and 65% of isopropanol. The 13C labeled indole
acetic acid (l3C-IAA, Cambridge Isotope Laboratories, Andover, MA) was added as an internal standard
(40 ng per gr of fresh weight tissue) and the samples equilibrated for one hour in the dark at 4°C.
Subsequently, 50,000 dpm of 3H-labelled IAA (3H-IAA, Amersham, Arlington Heights) was added as a
radiotracer. After centrifugation, the extracted solution was diluted ten fold with water, and loaded on the
pre-equilibrated amino anion exchange SPE cartridge. After washing, the samples were eluted using 5
portions of 600 µl 0.25% phosphoric acid (PA). Most radioactive fractions were combined and passed
through the SPE cartridge, loaded with 200 mg of epoxide resin (Biorad 156-0000 Macroprep Epoxide
support). Free IAA was eluted with five portions of 300 µL methanol and radioactive fractions were
combined. For GC-MS analysis, 900 µL aliquot of the sample was methylated with 1.5 mL of ethereal
diazomethane. Solvents were evaporated under N2 stream and the residue was resuspended in 50 µL of
ethyl acetate for injection to the GC-MS. Auxin analysis was performed with a Trace GC ultra system
coupled to a DSQ mass spectrometer (Thermo Finnigan), used in the electron ionization mode. The
analytes were separated on a Phenomenex, Zebron ZB-5MS capillary column [30 m x 0.25 mm (i.d.);
film thickness, 0.25 µm]. Samples were injected in the PTV splitless mode, and the oven temperature
program was the following: initial temperature of 40°C was increased at a rate of 15°C / min to 300°C
(maintained for 4.5 min). Helium was used as carrier gas and flow rate was 1.2 mL / min, the interface
temperature was 250°C and the source temperature was 280°C. Ions with m/z 130, 136, 189 and 195 were
monitored. The analytes were quantified by measuring the area ratios of analyte to the internal standard
and comparing these ratios with the ratios of the calibration curve of IAA standards that under went the
same process as the samples.
20
Analysis of tocochromanols
Tocopherol and tocotrienol extraction was performed essentially as previously described (Fraser et al.,
2000; Bino et al., 2005) with several modifications: aerial tissues of 10-day-old Arabidopsis seedlings
(100 mg frozen powder) were extracted with 0.5 ml methanol containing 0.1% butylated hydroxytoluene.
The samples were shaken for 5 min at 4°C, and then 0.5 ml of 50 mm Tris/HCl pH 7.5 was added, and
the samples were shaken for 10 min at 4°C. Subsequently, 0.4 ml of cold chloroform (4°C) was added,
samples were shaken for 10 min (4°C), centrifuged at 10000 g (4°C) for 10 min, and the supernatant was
collected in a new tube. The supernatant was re-extracted with 0.2 ml cold chloroform, and samples were
shaken for 10 min (4°C) and centrifuged at 10000 g (4°C) for 10 min. The chloroform fractions were
combined, dried under a stream of nitrogen gas, and re-suspended in 0.1 ml ethylacetate. Extracts were
shielded from strong light during the entire preparation. The separation system consisted of an HPLC
(Waters 2690; Waters Chromatography; http://www.waters.com/) coupled to a photo diode array detector
(Waters 2996), and a YMC-Pack C30 column (250 × 4.6 mm; 5 µm), coupled to a 4 × 3 mm C18 guard
(Phenomenex; http://www.phenomenex.com/), maintained at 30°C. The mobile-phase composition,
gradient and flow rate were as described by Fraser et al. (2000). The UV spectra were monitored between
200 and 750 nm. Data were collected and analyzed using waters millennium32 software. The absorbance
spectra and retention times of eluting peaks were compared with those of commercially available
standards [δ-tocopherol and γ-tocopherol (Sigma-Aldrich; http://www.sigmaaldrich.com/), α-tocopherol
(Sigma-Aldrich), α-tocotrienol, γ-tocotrienol and δ-tocotrienol (Cayman Chemical;
http://www.caymanchem.com) and to the spectra reported by Fraser et al. (2000). Peak areas of the
compounds were determined at the wavelength providing maximum absorbance.
HPLC analysis of thiamin derivatives
Samples (100mg) were harvested from three weeks old plants grown in short day conditions at the end of
the light period, and immediately frozen in liquid nitrogen. The plant samples were then grinded followed
by the addition of 400µl of 0.1M HCl, and sonicated in a water bath for 30min. The resulting extracts
were centrifuged at 14,000rpm (in a regular bench centrifuge) for 10 min. Samples of 300µl of the
supernatant, were supplemented consecutively with 50µl of freshly made 10mM K4Fe(CN)6, which was
dissolved in 3.7N NaOH, and 100µl of MeOH (HPLC grade). The samples were vigorously shaken,
sonicated for 5min, and centrifuged at 14,000rpm (on a regular bench centrifuge) for 10 min. For
measurements of dry seeds, 30mg seeds were grinded and the following ratios were used: 250µl HCl,
150µl of the supernatant was supplemented with 25µl K4Fe(CN)6 and 50µl MeOH. Following
centrifugation, supernatants were then fractionated with a Capcell Pak NH2 column (150 mm × 4.6 mm
21
i.d.) (Shiseido, Tokyo) using a 4:6 (v/v) solution of 100mM potassium phosphate buffer pH=8.4 and
acetonitrile as mobile phase. The HPLC analyses were performed using a Merck L7200 autosampler, a
Merck L7360 column oven set at 25°C, a Merck pump Model L7100, and a Merck FL-detector L7480. A
Merck D7000 interface module was used and the chromatograms were integrated using the HSM
software. The flow rate was 0.5 ml/min, and the volume injected was 5µl for all samples. Thiochrome
derivatives of thiamin, TMP, and TPP were detected by fluorescence at excitation 370 nm and emission
430 nm. Different concentrations of thiamin, thiamin monophosphate (TMP) and thiamin pyrophosphate
(TPP) standards were analyzed using the same extraction procedure and chromatographic conditions.
Calibration curves were generated for each of the standards. For quantification of the samples, the peak
areas of the samples were compared to the corresponding standard curve.
22
Main findings and achievements:
Development of Metabolomics tools and their combination with biological research In the last few years metabolomics became a high throughput approach for determination and quantitation
of the large amount of metabolites produced by different organisms. A broad range of analytical
instruments has been used by this approach, which makes possible the analyses of hundreds of
metabolites. The data obtained from such analytical instruments is huge (hundreds of chromatographic
peaks, i.e. thousands of mass fragments produced in one chromatographic run). Data analysis is currently
the bottleneck in metabolomics assays. As part of my thesis and work of others in our laboratory a
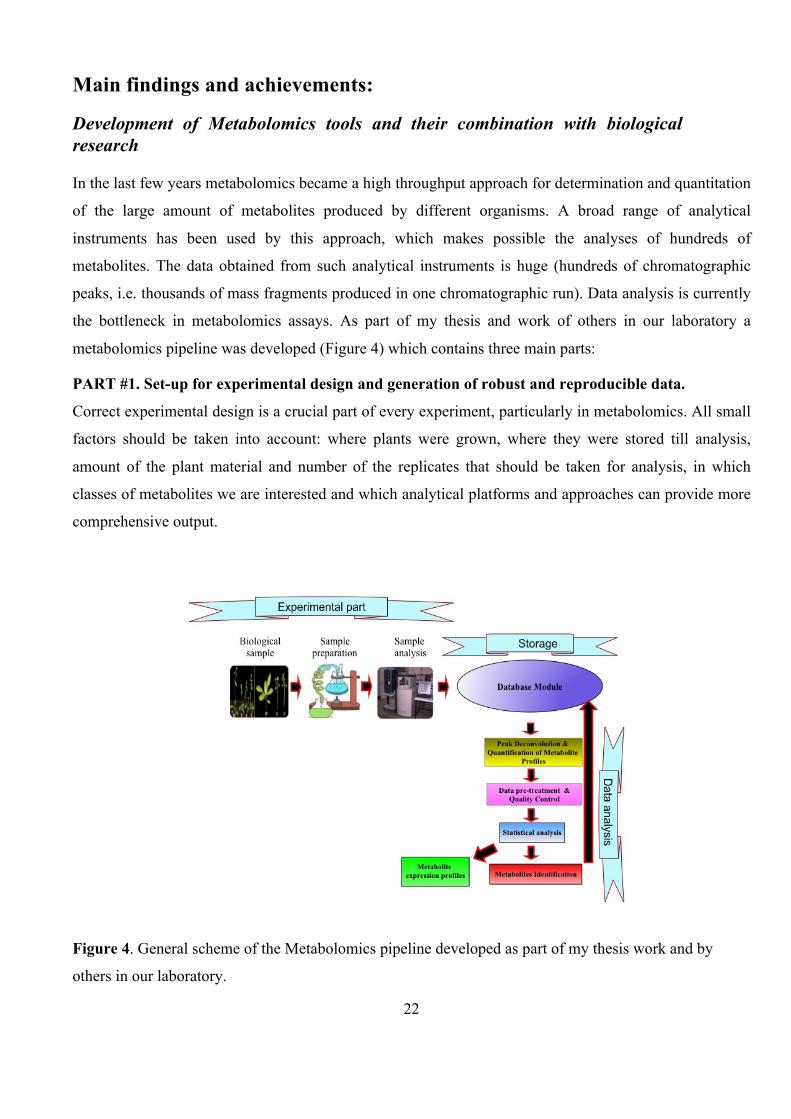
metabolomics pipeline was developed (Figure 4) which contains three main parts:
PART #1. Set-up for experimental design and generation of robust and reproducible data.
Correct experimental design is a crucial part of every experiment, particularly in metabolomics. All small
factors should be taken into account: where plants were grown, where they were stored till analysis,
amount of the plant material and number of the replicates that should be taken for analysis, in which
classes of metabolites we are interested and which analytical platforms and approaches can provide more
comprehensive output.
Figure 4. General scheme of the Metabolomics pipeline developed as part of my thesis work and by
others in our laboratory.
23
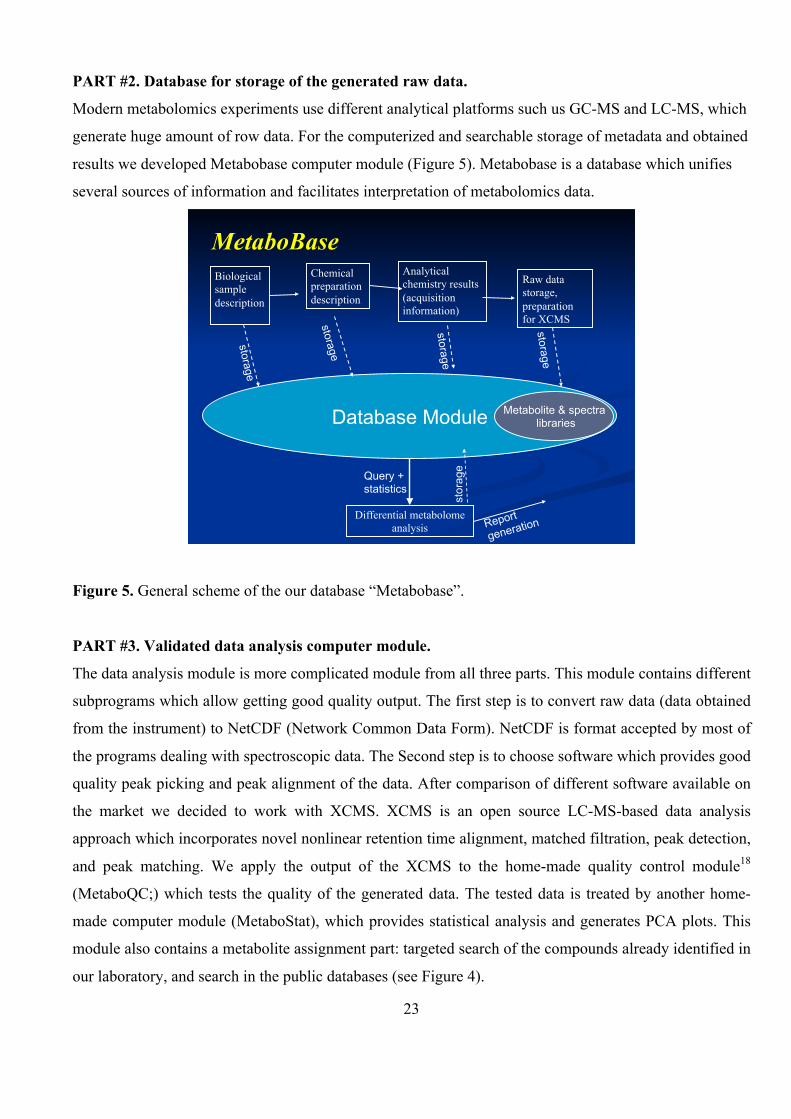
PART #2. Database for storage of the generated raw data.
Modern metabolomics experiments use different analytical platforms such us GC-MS and LC-MS, which
generate huge amount of row data. For the computerized and searchable storage of metadata and obtained
results we developed Metabobase computer module (Figure 5). Metabobase is a database which unifies
several sources of information and facilitates interpretation of metabolomics data.
Figure 5. General scheme of the our database “Metabobase”.
PART #3. Validated data analysis computer module.
The data analysis module is more complicated module from all three parts. This module contains different
subprograms which allow getting good quality output. The first step is to convert raw data (data obtained
from the instrument) to NetCDF (Network Common Data Form). NetCDF is format accepted by most of
the programs dealing with spectroscopic data. The Second step is to choose software which provides good
quality peak picking and peak alignment of the data. After comparison of different software available on
the market we decided to work with XCMS. XCMS is an open source LC-MS-based data analysis
approach which incorporates novel nonlinear retention time alignment, matched filtration, peak detection,
and peak matching. We apply the output of the XCMS to the home-made quality control module18
(MetaboQC;) which tests the quality of the generated data. The tested data is treated by another home-
made computer module (MetaboStat), which provides statistical analysis and generates PCA plots. This
module also contains a metabolite assignment part: targeted search of the compounds already identified in
our laboratory, and search in the public databases (see Figure 4).
Biological sample description
Database Module
Chemical preparation description
Metabolite & spectra libraries
storage
storage
storage
Differential metabolome analysis
Query + statistics
Report
generation
stor
age
MetaboBase Raw data storage, preparation for XCMS
storage
Analytical chemistry results (acquisition information)
24
Development of an advanced technological infrastructure for conducting state of the
art metabolomics in plants using GC-MS and LC-MS.
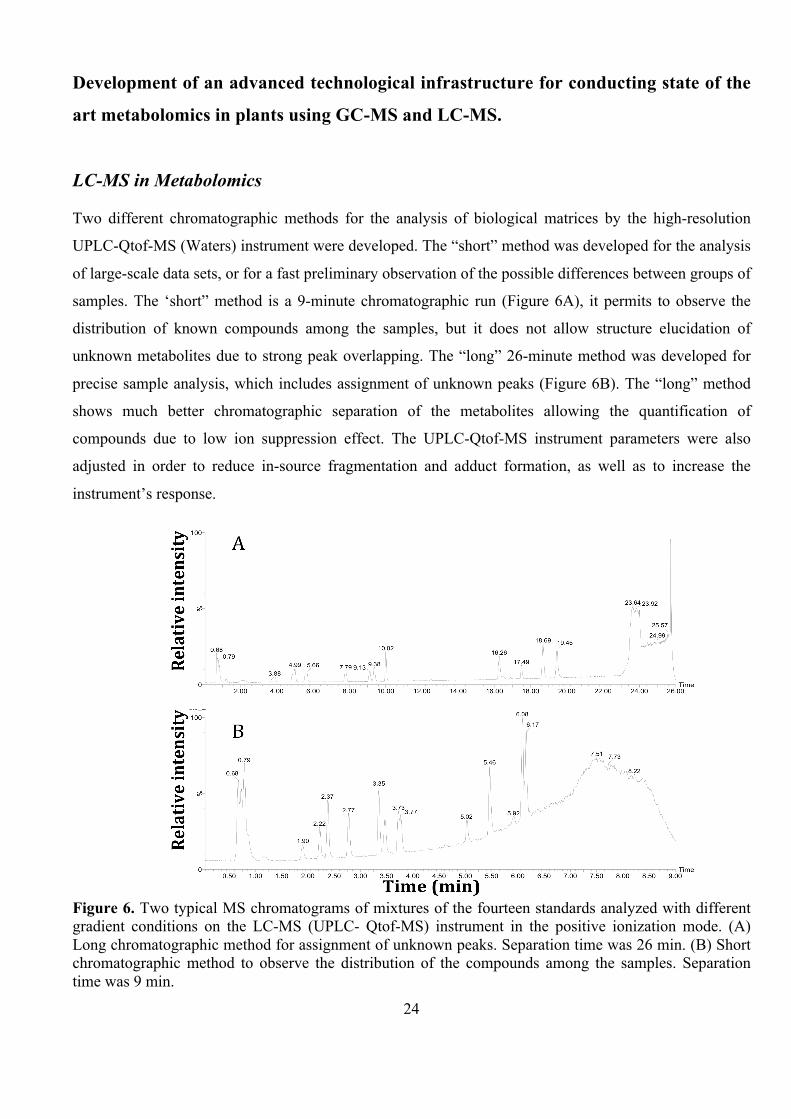
LC-MS in Metabolomics Two different chromatographic methods for the analysis of biological matrices by the high-resolution
UPLC-Qtof-MS (Waters) instrument were developed. The “short” method was developed for the analysis
of large-scale data sets, or for a fast preliminary observation of the possible differences between groups of
samples. The ‘short” method is a 9-minute chromatographic run (Figure 6A), it permits to observe the
distribution of known compounds among the samples, but it does not allow structure elucidation of
unknown metabolites due to strong peak overlapping. The “long” 26-minute method was developed for
precise sample analysis, which includes assignment of unknown peaks (Figure 6B). The “long” method
shows much better chromatographic separation of the metabolites allowing the quantification of
compounds due to low ion suppression effect. The UPLC-Qtof-MS instrument parameters were also
adjusted in order to reduce in-source fragmentation and adduct formation, as well as to increase the
instrument’s response.
Figure 6. Two typical MS chromatograms of mixtures of the fourteen standards analyzed with different gradient conditions on the LC-MS (UPLC- Qtof-MS) instrument in the positive ionization mode. (A) Long chromatographic method for assignment of unknown peaks. Separation time was 26 min. (B) Short chromatographic method to observe the distribution of the compounds among the samples. Separation time was 9 min.
25
GC and GC-MS in Metabolomics Setup and Optimization of Sample Preparation Methods for Metabolomics Analysis
The common procedure of GC-MS sample preparation consists of metabolites extraction from frozen
freeze-dried tissue in a water-methanol solution, which is followed by evaporation of the solvent and
derivatization of the extracted compounds. 19,20 I tried to shorten this procedure by avoiding the extraction
part of the sample preparation and perform derivatization directly with the freeze-dried plant tissue.
Chromatograms, acquired after application of this short sample preparation technique were very similar to
those obtained after the traditional sample preparation. The use of this new procedure, significantly
shortens the time for the GC-MS sample preparation in comparison to our current sample preparation
method.
Chromatographic methods for the GC-MS instrument
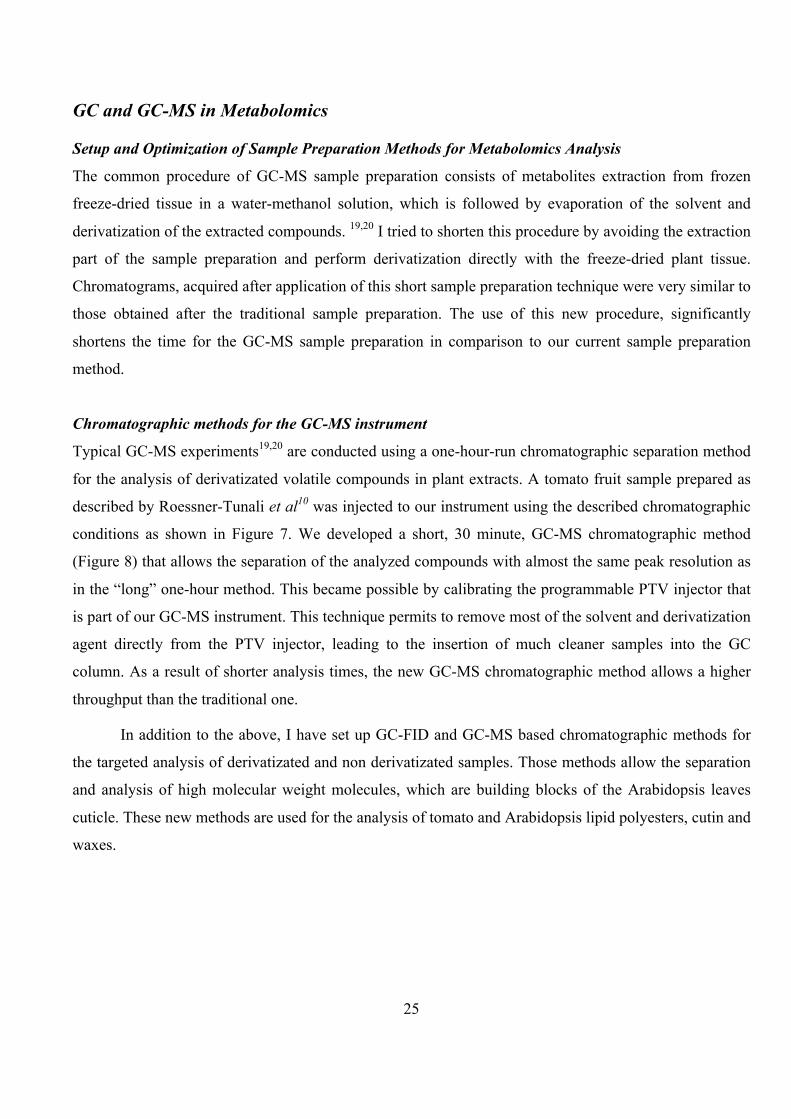
Typical GC-MS experiments19,20 are conducted using a one-hour-run chromatographic separation method
for the analysis of derivatizated volatile compounds in plant extracts. A tomato fruit sample prepared as
described by Roessner-Tunali et al10 was injected to our instrument using the described chromatographic
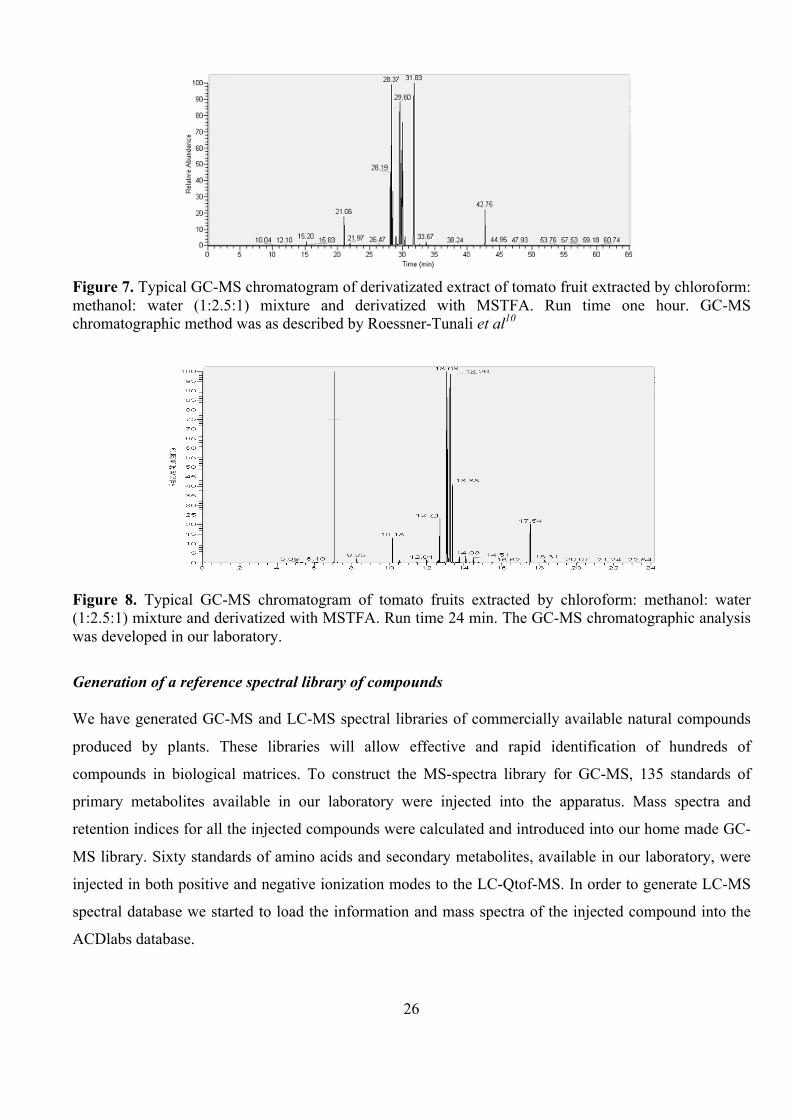
conditions as shown in Figure 7. We developed a short, 30 minute, GC-MS chromatographic method
(Figure 8) that allows the separation of the analyzed compounds with almost the same peak resolution as
in the “long” one-hour method. This became possible by calibrating the programmable PTV injector that
is part of our GC-MS instrument. This technique permits to remove most of the solvent and derivatization
agent directly from the PTV injector, leading to the insertion of much cleaner samples into the GC
column. As a result of shorter analysis times, the new GC-MS chromatographic method allows a higher
throughput than the traditional one.
In addition to the above, I have set up GC-FID and GC-MS based chromatographic methods for
the targeted analysis of derivatizated and non derivatizated samples. Those methods allow the separation
and analysis of high molecular weight molecules, which are building blocks of the Arabidopsis leaves
cuticle. These new methods are used for the analysis of tomato and Arabidopsis lipid polyesters, cutin and
waxes.
26
Figure 7. Typical GC-MS chromatogram of derivatizated extract of tomato fruit extracted by chloroform: methanol: water (1:2.5:1) mixture and derivatized with MSTFA. Run time one hour. GC-MS chromatographic method was as described by Roessner-Tunali et al10
Figure 8. Typical GC-MS chromatogram of tomato fruits extracted by chloroform: methanol: water (1:2.5:1) mixture and derivatized with MSTFA. Run time 24 min. The GC-MS chromatographic analysis was developed in our laboratory.
Generation of a reference spectral library of compounds We have generated GC-MS and LC-MS spectral libraries of commercially available natural compounds
produced by plants. These libraries will allow effective and rapid identification of hundreds of
compounds in biological matrices. To construct the MS-spectra library for GC-MS, 135 standards of
primary metabolites available in our laboratory were injected into the apparatus. Mass spectra and
retention indices for all the injected compounds were calculated and introduced into our home made GC-
MS library. Sixty standards of amino acids and secondary metabolites, available in our laboratory, were
injected in both positive and negative ionization modes to the LC-Qtof-MS. In order to generate LC-MS
spectral database we started to load the information and mass spectra of the injected compound into the
ACDlabs database.
27
Development of targeted metabolite analyses protocols Monitoring thiamine and its derivatives using HPLC- Fluorescent detector.
This method was developed in collaboration with Samuel Bocobza (Asaph Aharoni lab) who is studying
the thiamine pyrophosphate (TPP) riboswitch in plants. I have established a system for measurement of
thiamine and its phosphate esters in Arabidopsis plants using HPLC-Fluorescent detector. For this
purpose I have developed a 12 minutes HPLC method, which allows precise determination of thiamine
levels in plant tissues.

28
Published paper #1: The Transcript and Metabolite Networks Affected by the Two Clades of Arabidopsis Glucosinolate Biosynthesis Regulators. Malitsky S, Blum E, Less H, Venger I, Elbaz M, Morin S , Eshed Y, and Aharoni A. Plant physiology(2008); 148(4): 2021-2049
This paper constitutes one chapter of the research work performed during my studies and equally
performed by Eyal Blum (Yuval Eshed’s lab) and Hadar Less (from Gad Galili’s lab).
29
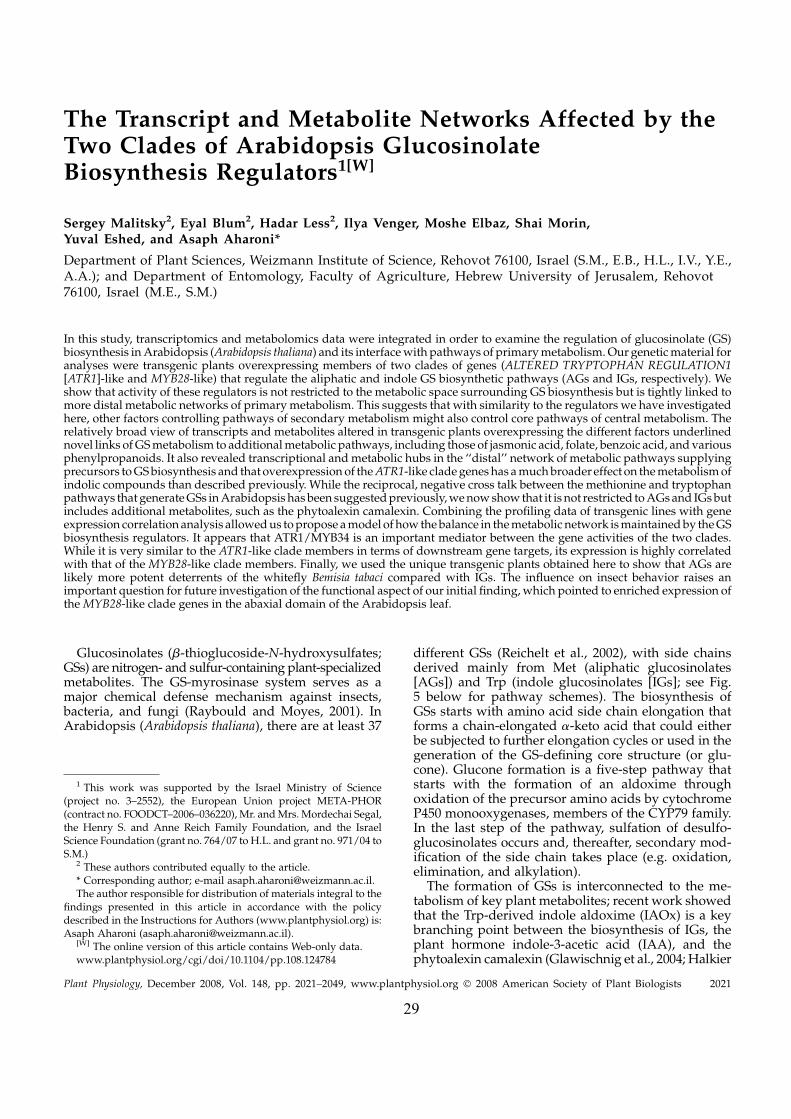
The Transcript and Metabolite Networks Affected by theTwo Clades of Arabidopsis GlucosinolateBiosynthesis Regulators1[W]
Sergey Malitsky2, Eyal Blum2, Hadar Less2, Ilya Venger, Moshe Elbaz, Shai Morin,Yuval Eshed, and Asaph Aharoni*
Department of Plant Sciences, Weizmann Institute of Science, Rehovot 76100, Israel (S.M., E.B., H.L., I.V., Y.E.,A.A.); and Department of Entomology, Faculty of Agriculture, Hebrew University of Jerusalem, Rehovot76100, Israel (M.E., S.M.)
In this study, transcriptomics and metabolomics data were integrated in order to examine the regulation of glucosinolate (GS)biosynthesis in Arabidopsis (Arabidopsis thaliana) and its interface with pathways of primary metabolism. Our genetic material foranalyses were transgenic plants overexpressing members of two clades of genes (ALTERED TRYPTOPHAN REGULATION1[ATR1]-like and MYB28-like) that regulate the aliphatic and indole GS biosynthetic pathways (AGs and IGs, respectively). Weshow that activity of these regulators is not restricted to the metabolic space surrounding GS biosynthesis but is tightly linked tomore distal metabolic networks of primary metabolism. This suggests that with similarity to the regulators we have investigatedhere, other factors controlling pathways of secondary metabolism might also control core pathways of central metabolism. Therelatively broad view of transcripts and metabolites altered in transgenic plants overexpressing the different factors underlinednovel links of GS metabolism to additional metabolic pathways, including those of jasmonic acid, folate, benzoic acid, and variousphenylpropanoids. It also revealed transcriptional and metabolic hubs in the ‘‘distal’’ network of metabolic pathways supplyingprecursors to GS biosynthesis and that overexpression of the ATR1-like clade genes has a much broader effect on the metabolism ofindolic compounds than described previously. While the reciprocal, negative cross talk between the methionine and tryptophanpathways that generate GSs in Arabidopsis has been suggested previously, we now show that it is not restricted to AGs and IGs butincludes additional metabolites, such as the phytoalexin camalexin. Combining the profiling data of transgenic lines with geneexpression correlation analysis allowed us to propose a model of how the balance in the metabolic network is maintained by the GSbiosynthesis regulators. It appears that ATR1/MYB34 is an important mediator between the gene activities of the two clades.While it is very similar to the ATR1-like clade members in terms of downstream gene targets, its expression is highly correlatedwith that of the MYB28-like clade members. Finally, we used the unique transgenic plants obtained here to show that AGs arelikely more potent deterrents of the whitefly Bemisia tabaci compared with IGs. The influence on insect behavior raises animportant question for future investigation of the functional aspect of our initial finding, which pointed to enriched expression ofthe MYB28-like clade genes in the abaxial domain of the Arabidopsis leaf.
Glucosinolates (b-thioglucoside-N-hydroxysulfates;GSs) are nitrogen- and sulfur-containing plant-specializedmetabolites. The GS-myrosinase system serves as amajor chemical defense mechanism against insects,bacteria, and fungi (Raybould and Moyes, 2001). InArabidopsis (Arabidopsis thaliana), there are at least 37
different GSs (Reichelt et al., 2002), with side chainsderived mainly from Met (aliphatic glucosinolates[AGs]) and Trp (indole glucosinolates [IGs]; see Fig.5 below for pathway schemes). The biosynthesis ofGSs starts with amino acid side chain elongation thatforms a chain-elongated a-keto acid that could eitherbe subjected to further elongation cycles or used in thegeneration of the GS-defining core structure (or glu-cone). Glucone formation is a five-step pathway thatstarts with the formation of an aldoxime throughoxidation of the precursor amino acids by cytochromeP450 monooxygenases, members of the CYP79 family.In the last step of the pathway, sulfation of desulfo-glucosinolates occurs and, thereafter, secondary mod-ification of the side chain takes place (e.g. oxidation,elimination, and alkylation).
The formation of GSs is interconnected to the me-tabolism of key plant metabolites; recent work showedthat the Trp-derived indole aldoxime (IAOx) is a keybranching point between the biosynthesis of IGs, theplant hormone indole-3-acetic acid (IAA), and thephytoalexin camalexin (Glawischnig et al., 2004; Halkier
1 This work was supported by the Israel Ministry of Science(project no. 3–2552), the European Union project META-PHOR(contract no. FOODCT–2006–036220), Mr. and Mrs. Mordechai Segal,the Henry S. and Anne Reich Family Foundation, and the IsraelScience Foundation (grant no. 764/07 to H.L. and grant no. 971/04 toS.M.)
2 These authors contributed equally to the article.* Corresponding author; e-mail [email protected] author responsible for distribution of materials integral to the
findings presented in this article in accordance with the policydescribed in the Instructions for Authors (www.plantphysiol.org) is:Asaph Aharoni ([email protected]).
[W] The online version of this article contains Web-only data.www.plantphysiol.org/cgi/doi/10.1104/pp.108.124784
Plant Physiology, December 2008, Vol. 148, pp. 2021–2049, www.plantphysiol.org � 2008 American Society of Plant Biologists 2021
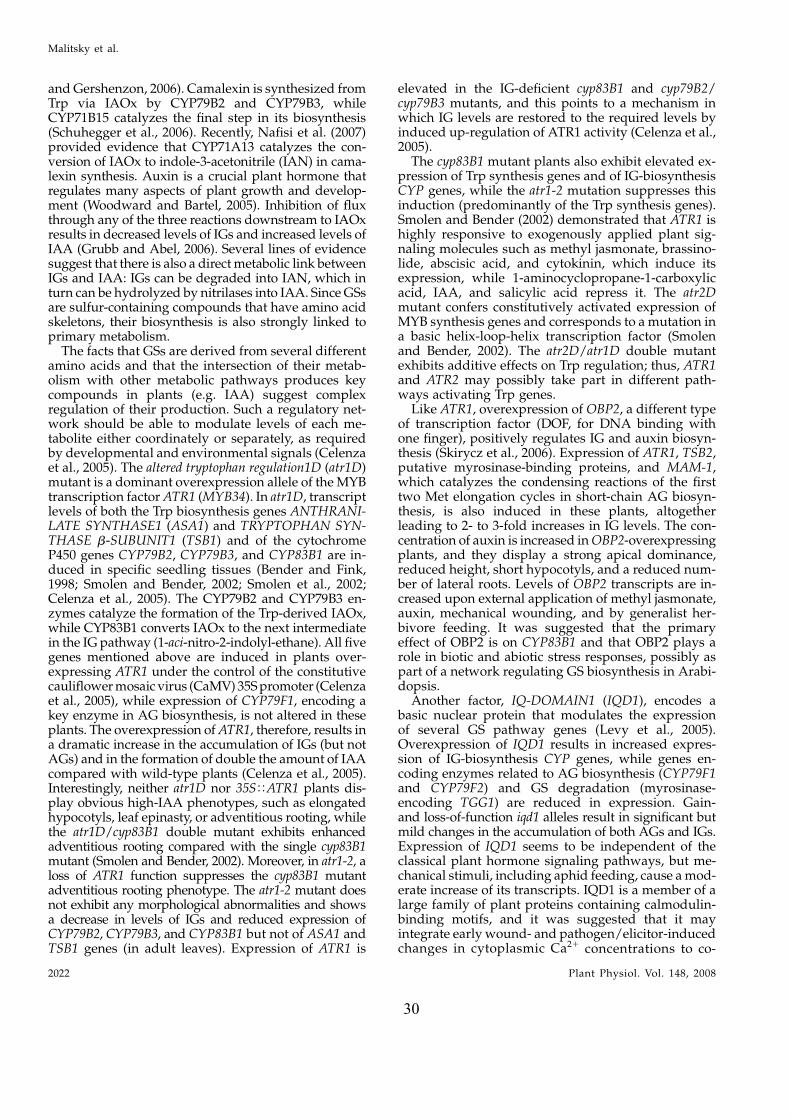
30
and Gershenzon, 2006). Camalexin is synthesized fromTrp via IAOx by CYP79B2 and CYP79B3, whileCYP71B15 catalyzes the final step in its biosynthesis(Schuhegger et al., 2006). Recently, Nafisi et al. (2007)provided evidence that CYP71A13 catalyzes the con-version of IAOx to indole-3-acetonitrile (IAN) in cama-lexin synthesis. Auxin is a crucial plant hormone thatregulates many aspects of plant growth and develop-ment (Woodward and Bartel, 2005). Inhibition of fluxthrough any of the three reactions downstream to IAOxresults in decreased levels of IGs and increased levels ofIAA (Grubb and Abel, 2006). Several lines of evidencesuggest that there is also a direct metabolic link betweenIGs and IAA: IGs can be degraded into IAN, which inturn can be hydrolyzed by nitrilases into IAA. Since GSsare sulfur-containing compounds that have amino acidskeletons, their biosynthesis is also strongly linked toprimary metabolism.
The facts that GSs are derived from several differentamino acids and that the intersection of their metab-olism with other metabolic pathways produces keycompounds in plants (e.g. IAA) suggest complexregulation of their production. Such a regulatory net-work should be able to modulate levels of each me-tabolite either coordinately or separately, as requiredby developmental and environmental signals (Celenzaet al., 2005). The altered tryptophan regulation1D (atr1D)mutant is a dominant overexpression allele of the MYBtranscription factor ATR1 (MYB34). In atr1D, transcriptlevels of both the Trp biosynthesis genes ANTHRANI-LATE SYNTHASE1 (ASA1) and TRYPTOPHAN SYN-THASE b-SUBUNIT1 (TSB1) and of the cytochromeP450 genes CYP79B2, CYP79B3, and CYP83B1 are in-duced in specific seedling tissues (Bender and Fink,1998; Smolen and Bender, 2002; Smolen et al., 2002;Celenza et al., 2005). The CYP79B2 and CYP79B3 en-zymes catalyze the formation of the Trp-derived IAOx,while CYP83B1 converts IAOx to the next intermediatein the IG pathway (1-aci-nitro-2-indolyl-ethane). All fivegenes mentioned above are induced in plants over-expressing ATR1 under the control of the constitutivecauliflower mosaic virus (CaMV) 35S promoter (Celenzaet al., 2005), while expression of CYP79F1, encoding akey enzyme in AG biosynthesis, is not altered in theseplants. The overexpression of ATR1, therefore, results ina dramatic increase in the accumulation of IGs (but notAGs) and in the formation of double the amount of IAAcompared with wild-type plants (Celenza et al., 2005).Interestingly, neither atr1D nor 35STATR1 plants dis-play obvious high-IAA phenotypes, such as elongatedhypocotyls, leaf epinasty, or adventitious rooting, whilethe atr1D/cyp83B1 double mutant exhibits enhancedadventitious rooting compared with the single cyp83B1mutant (Smolen and Bender, 2002). Moreover, in atr1-2, aloss of ATR1 function suppresses the cyp83B1 mutantadventitious rooting phenotype. The atr1-2 mutant doesnot exhibit any morphological abnormalities and showsa decrease in levels of IGs and reduced expression ofCYP79B2, CYP79B3, and CYP83B1 but not of ASA1 andTSB1 genes (in adult leaves). Expression of ATR1 is
elevated in the IG-deficient cyp83B1 and cyp79B2/cyp79B3 mutants, and this points to a mechanism inwhich IG levels are restored to the required levels byinduced up-regulation of ATR1 activity (Celenza et al.,2005).
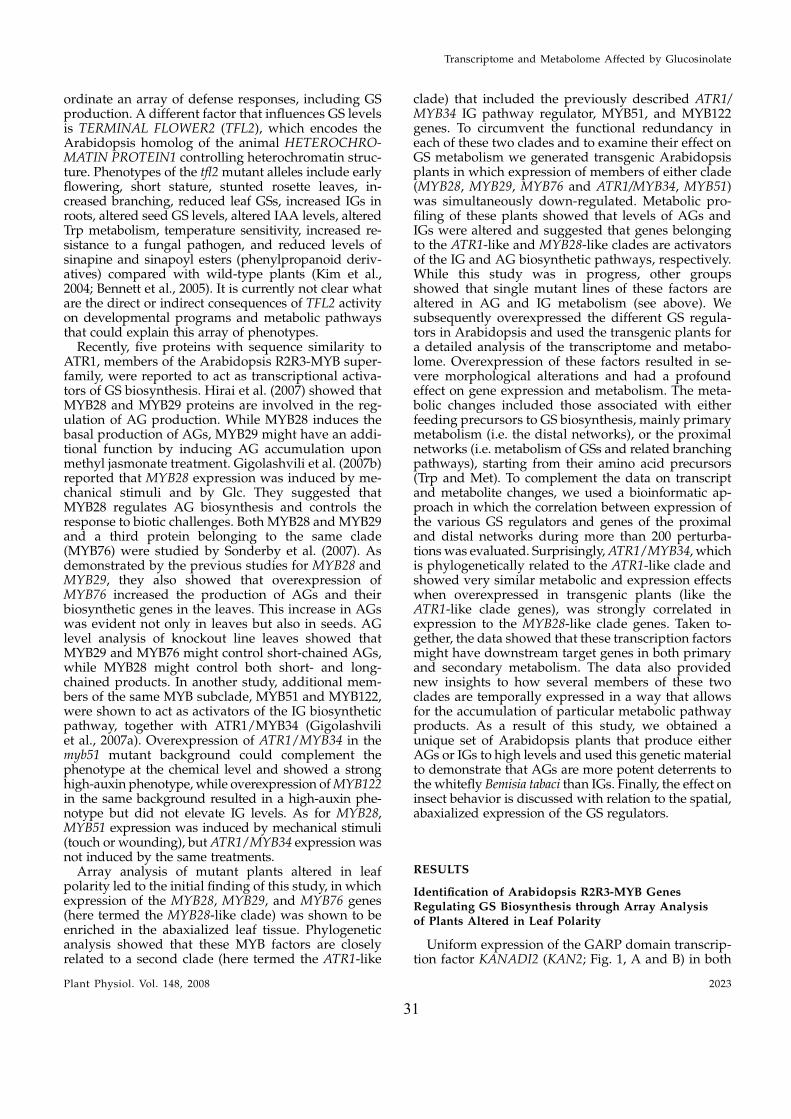
The cyp83B1 mutant plants also exhibit elevated ex-pression of Trp synthesis genes and of IG-biosynthesisCYP genes, while the atr1-2 mutation suppresses thisinduction (predominantly of the Trp synthesis genes).Smolen and Bender (2002) demonstrated that ATR1 ishighly responsive to exogenously applied plant sig-naling molecules such as methyl jasmonate, brassino-lide, abscisic acid, and cytokinin, which induce itsexpression, while 1-aminocyclopropane-1-carboxylicacid, IAA, and salicylic acid repress it. The atr2Dmutant confers constitutively activated expression ofMYB synthesis genes and corresponds to a mutation ina basic helix-loop-helix transcription factor (Smolenand Bender, 2002). The atr2D/atr1D double mutantexhibits additive effects on Trp regulation; thus, ATR1and ATR2 may possibly take part in different path-ways activating Trp genes.
Like ATR1, overexpression of OBP2, a different typeof transcription factor (DOF, for DNA binding withone finger), positively regulates IG and auxin biosyn-thesis (Skirycz et al., 2006). Expression of ATR1, TSB2,putative myrosinase-binding proteins, and MAM-1,which catalyzes the condensing reactions of the firsttwo Met elongation cycles in short-chain AG biosyn-thesis, is also induced in these plants, altogetherleading to 2- to 3-fold increases in IG levels. The con-centration of auxin is increased in OBP2-overexpressingplants, and they display a strong apical dominance,reduced height, short hypocotyls, and a reduced num-ber of lateral roots. Levels of OBP2 transcripts are in-creased upon external application of methyl jasmonate,auxin, mechanical wounding, and by generalist her-bivore feeding. It was suggested that the primaryeffect of OBP2 is on CYP83B1 and that OBP2 plays arole in biotic and abiotic stress responses, possibly aspart of a network regulating GS biosynthesis in Arabi-dopsis.
Another factor, IQ-DOMAIN1 (IQD1), encodes abasic nuclear protein that modulates the expressionof several GS pathway genes (Levy et al., 2005).Overexpression of IQD1 results in increased expres-sion of IG-biosynthesis CYP genes, while genes en-coding enzymes related to AG biosynthesis (CYP79F1and CYP79F2) and GS degradation (myrosinase-encoding TGG1) are reduced in expression. Gain-and loss-of-function iqd1 alleles result in significant butmild changes in the accumulation of both AGs and IGs.Expression of IQD1 seems to be independent of theclassical plant hormone signaling pathways, but me-chanical stimuli, including aphid feeding, cause a mod-erate increase of its transcripts. IQD1 is a member of alarge family of plant proteins containing calmodulin-binding motifs, and it was suggested that it mayintegrate early wound- and pathogen/elicitor-inducedchanges in cytoplasmic Ca21 concentrations to co-
Malitsky et al.
2022 Plant Physiol. Vol. 148, 2008
31
ordinate an array of defense responses, including GSproduction. A different factor that influences GS levelsis TERMINAL FLOWER2 (TFL2), which encodes theArabidopsis homolog of the animal HETEROCHRO-MATIN PROTEIN1 controlling heterochromatin struc-ture. Phenotypes of the tfl2 mutant alleles include earlyflowering, short stature, stunted rosette leaves, in-creased branching, reduced leaf GSs, increased IGs inroots, altered seed GS levels, altered IAA levels, alteredTrp metabolism, temperature sensitivity, increased re-sistance to a fungal pathogen, and reduced levels ofsinapine and sinapoyl esters (phenylpropanoid deriv-atives) compared with wild-type plants (Kim et al.,2004; Bennett et al., 2005). It is currently not clear whatare the direct or indirect consequences of TFL2 activityon developmental programs and metabolic pathwaysthat could explain this array of phenotypes.
Recently, five proteins with sequence similarity toATR1, members of the Arabidopsis R2R3-MYB super-family, were reported to act as transcriptional activa-tors of GS biosynthesis. Hirai et al. (2007) showed thatMYB28 and MYB29 proteins are involved in the reg-ulation of AG production. While MYB28 induces thebasal production of AGs, MYB29 might have an addi-tional function by inducing AG accumulation uponmethyl jasmonate treatment. Gigolashvili et al. (2007b)reported that MYB28 expression was induced by me-chanical stimuli and by Glc. They suggested thatMYB28 regulates AG biosynthesis and controls theresponse to biotic challenges. Both MYB28 and MYB29and a third protein belonging to the same clade(MYB76) were studied by Sonderby et al. (2007). Asdemonstrated by the previous studies for MYB28 andMYB29, they also showed that overexpression ofMYB76 increased the production of AGs and theirbiosynthetic genes in the leaves. This increase in AGswas evident not only in leaves but also in seeds. AGlevel analysis of knockout line leaves showed thatMYB29 and MYB76 might control short-chained AGs,while MYB28 might control both short- and long-chained products. In another study, additional mem-bers of the same MYB subclade, MYB51 and MYB122,were shown to act as activators of the IG biosyntheticpathway, together with ATR1/MYB34 (Gigolashviliet al., 2007a). Overexpression of ATR1/MYB34 in themyb51 mutant background could complement thephenotype at the chemical level and showed a stronghigh-auxin phenotype, while overexpression of MYB122in the same background resulted in a high-auxin phe-notype but did not elevate IG levels. As for MYB28,MYB51 expression was induced by mechanical stimuli(touch or wounding), but ATR1/MYB34 expression wasnot induced by the same treatments.
Array analysis of mutant plants altered in leafpolarity led to the initial finding of this study, in whichexpression of the MYB28, MYB29, and MYB76 genes(here termed the MYB28-like clade) was shown to beenriched in the abaxialized leaf tissue. Phylogeneticanalysis showed that these MYB factors are closelyrelated to a second clade (here termed the ATR1-like
clade) that included the previously described ATR1/MYB34 IG pathway regulator, MYB51, and MYB122genes. To circumvent the functional redundancy ineach of these two clades and to examine their effect onGS metabolism we generated transgenic Arabidopsisplants in which expression of members of either clade(MYB28, MYB29, MYB76 and ATR1/MYB34, MYB51)was simultaneously down-regulated. Metabolic pro-filing of these plants showed that levels of AGs andIGs were altered and suggested that genes belongingto the ATR1-like and MYB28-like clades are activatorsof the IG and AG biosynthetic pathways, respectively.While this study was in progress, other groupsshowed that single mutant lines of these factors arealtered in AG and IG metabolism (see above). Wesubsequently overexpressed the different GS regula-tors in Arabidopsis and used the transgenic plants fora detailed analysis of the transcriptome and metabo-lome. Overexpression of these factors resulted in se-vere morphological alterations and had a profoundeffect on gene expression and metabolism. The meta-bolic changes included those associated with eitherfeeding precursors to GS biosynthesis, mainly primarymetabolism (i.e. the distal networks), or the proximalnetworks (i.e. metabolism of GSs and related branchingpathways), starting from their amino acid precursors(Trp and Met). To complement the data on transcriptand metabolite changes, we used a bioinformatic ap-proach in which the correlation between expression ofthe various GS regulators and genes of the proximaland distal networks during more than 200 perturba-tions was evaluated. Surprisingly, ATR1/MYB34, whichis phylogenetically related to the ATR1-like clade andshowed very similar metabolic and expression effectswhen overexpressed in transgenic plants (like theATR1-like clade genes), was strongly correlated inexpression to the MYB28-like clade genes. Taken to-gether, the data showed that these transcription factorsmight have downstream target genes in both primaryand secondary metabolism. The data also providednew insights to how several members of these twoclades are temporally expressed in a way that allowsfor the accumulation of particular metabolic pathwayproducts. As a result of this study, we obtained aunique set of Arabidopsis plants that produce eitherAGs or IGs to high levels and used this genetic materialto demonstrate that AGs are more potent deterrents tothe whitefly Bemisia tabaci than IGs. Finally, the effect oninsect behavior is discussed with relation to the spatial,abaxialized expression of the GS regulators.
RESULTS
Identification of Arabidopsis R2R3-MYB GenesRegulating GS Biosynthesis through Array Analysisof Plants Altered in Leaf Polarity
Uniform expression of the GARP domain transcrip-tion factor KANADI2 (KAN2; Fig. 1, A and B) in both
Transcriptome and Metabolome Affected by Glucosinolate
Plant Physiol. Vol. 148, 2008 2023
32
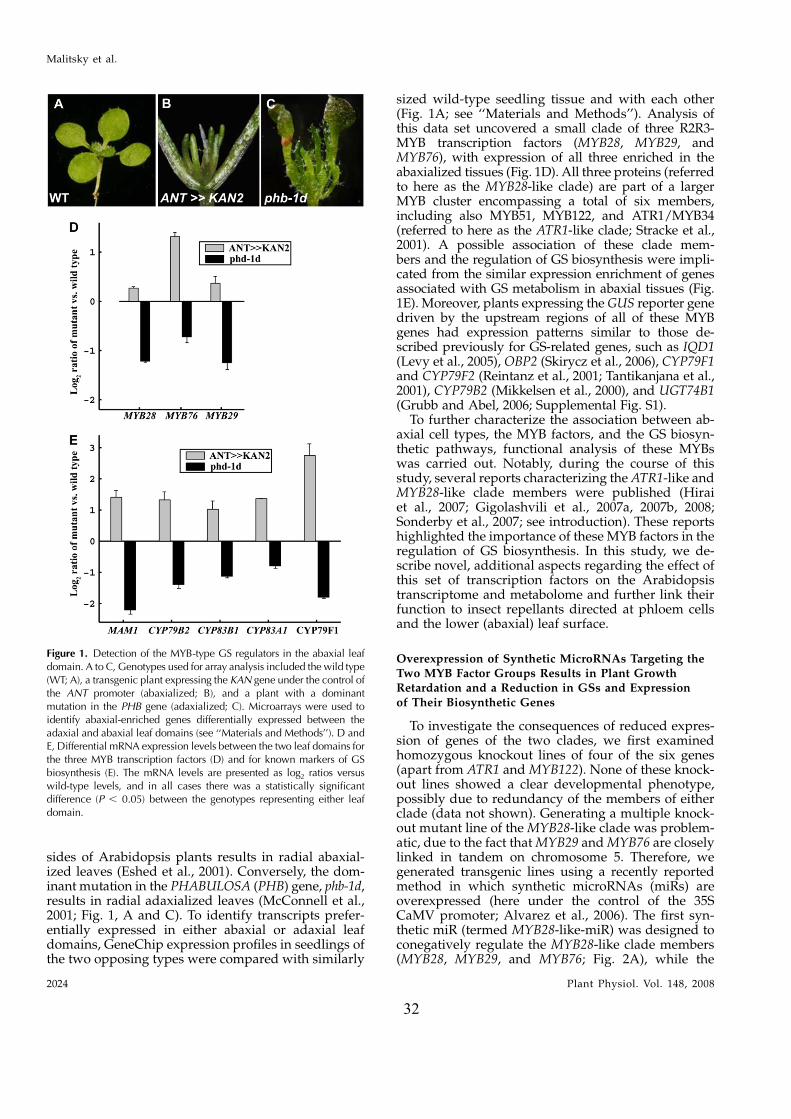
sides of Arabidopsis plants results in radial abaxial-ized leaves (Eshed et al., 2001). Conversely, the dom-inant mutation in the PHABULOSA (PHB) gene, phb-1d,results in radial adaxialized leaves (McConnell et al.,2001; Fig. 1, A and C). To identify transcripts prefer-entially expressed in either abaxial or adaxial leafdomains, GeneChip expression profiles in seedlings ofthe two opposing types were compared with similarly
sized wild-type seedling tissue and with each other(Fig. 1A; see ‘‘Materials and Methods’’). Analysis ofthis data set uncovered a small clade of three R2R3-MYB transcription factors (MYB28, MYB29, andMYB76), with expression of all three enriched in theabaxialized tissues (Fig. 1D). All three proteins (referredto here as the MYB28-like clade) are part of a largerMYB cluster encompassing a total of six members,including also MYB51, MYB122, and ATR1/MYB34(referred to here as the ATR1-like clade; Stracke et al.,2001). A possible association of these clade mem-bers and the regulation of GS biosynthesis were impli-cated from the similar expression enrichment of genesassociated with GS metabolism in abaxial tissues (Fig.1E). Moreover, plants expressing the GUS reporter genedriven by the upstream regions of all of these MYBgenes had expression patterns similar to those de-scribed previously for GS-related genes, such as IQD1(Levy et al., 2005), OBP2 (Skirycz et al., 2006), CYP79F1and CYP79F2 (Reintanz et al., 2001; Tantikanjana et al.,2001), CYP79B2 (Mikkelsen et al., 2000), and UGT74B1(Grubb and Abel, 2006; Supplemental Fig. S1).
To further characterize the association between ab-axial cell types, the MYB factors, and the GS biosyn-thetic pathways, functional analysis of these MYBswas carried out. Notably, during the course of thisstudy, several reports characterizing the ATR1-like andMYB28-like clade members were published (Hiraiet al., 2007; Gigolashvili et al., 2007a, 2007b, 2008;Sonderby et al., 2007; see introduction). These reportshighlighted the importance of these MYB factors in theregulation of GS biosynthesis. In this study, we de-scribe novel, additional aspects regarding the effect ofthis set of transcription factors on the Arabidopsistranscriptome and metabolome and further link theirfunction to insect repellants directed at phloem cellsand the lower (abaxial) leaf surface.
Overexpression of Synthetic MicroRNAs Targeting theTwo MYB Factor Groups Results in Plant GrowthRetardation and a Reduction in GSs and Expression
of Their Biosynthetic Genes
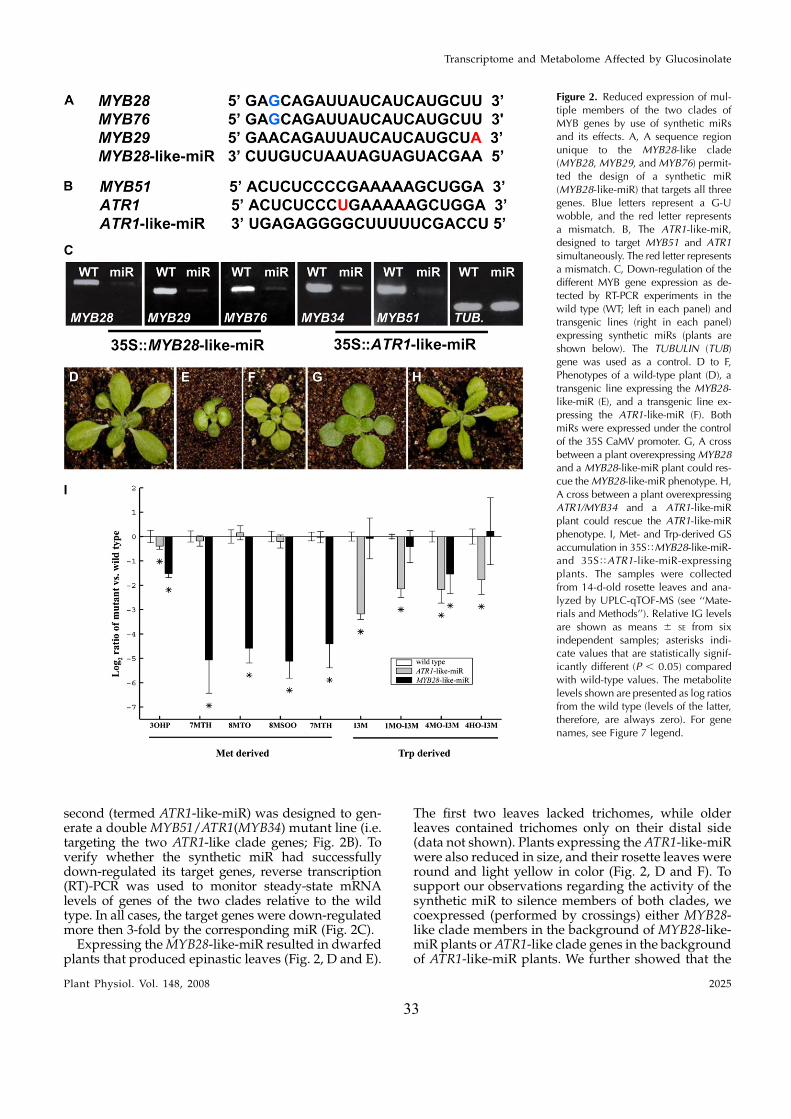
To investigate the consequences of reduced expres-sion of genes of the two clades, we first examinedhomozygous knockout lines of four of the six genes(apart from ATR1 and MYB122). None of these knock-out lines showed a clear developmental phenotype,possibly due to redundancy of the members of eitherclade (data not shown). Generating a multiple knock-out mutant line of the MYB28-like clade was problem-atic, due to the fact that MYB29 and MYB76 are closelylinked in tandem on chromosome 5. Therefore, wegenerated transgenic lines using a recently reportedmethod in which synthetic microRNAs (miRs) areoverexpressed (here under the control of the 35SCaMV promoter; Alvarez et al., 2006). The first syn-thetic miR (termed MYB28-like-miR) was designed toconegatively regulate the MYB28-like clade members(MYB28, MYB29, and MYB76; Fig. 2A), while the
Figure 1. Detection of the MYB-type GS regulators in the abaxial leafdomain. A to C, Genotypes used for array analysis included the wild type(WT; A), a transgenic plant expressing the KAN gene under the control ofthe ANT promoter (abaxialized; B), and a plant with a dominantmutation in the PHB gene (adaxialized; C). Microarrays were used toidentify abaxial-enriched genes differentially expressed between theadaxial and abaxial leaf domains (see ‘‘Materials and Methods’’). D andE, Differential mRNA expression levels between the two leaf domains forthe three MYB transcription factors (D) and for known markers of GSbiosynthesis (E). The mRNA levels are presented as log2 ratios versuswild-type levels, and in all cases there was a statistically significantdifference (P , 0.05) between the genotypes representing either leafdomain.
Malitsky et al.
2024 Plant Physiol. Vol. 148, 2008
33
second (termed ATR1-like-miR) was designed to gen-erate a double MYB51/ATR1(MYB34) mutant line (i.e.targeting the two ATR1-like clade genes; Fig. 2B). Toverify whether the synthetic miR had successfullydown-regulated its target genes, reverse transcription(RT)-PCR was used to monitor steady-state mRNAlevels of genes of the two clades relative to the wildtype. In all cases, the target genes were down-regulatedmore then 3-fold by the corresponding miR (Fig. 2C).
Expressing the MYB28-like-miR resulted in dwarfedplants that produced epinastic leaves (Fig. 2, D and E).
The first two leaves lacked trichomes, while olderleaves contained trichomes only on their distal side(data not shown). Plants expressing the ATR1-like-miRwere also reduced in size, and their rosette leaves wereround and light yellow in color (Fig. 2, D and F). Tosupport our observations regarding the activity of thesynthetic miR to silence members of both clades, wecoexpressed (performed by crossings) either MYB28-like clade members in the background of MYB28-like-miR plants or ATR1-like clade genes in the backgroundof ATR1-like-miR plants. We further showed that the
Figure 2. Reduced expression of mul-tiple members of the two clades ofMYB genes by use of synthetic miRsand its effects. A, A sequence regionunique to the MYB28-like clade(MYB28, MYB29, and MYB76) permit-ted the design of a synthetic miR(MYB28-like-miR) that targets all threegenes. Blue letters represent a G-Uwobble, and the red letter representsa mismatch. B, The ATR1-like-miR,designed to target MYB51 and ATR1simultaneously. The red letter representsa mismatch. C, Down-regulation of thedifferent MYB gene expression as de-tected by RT-PCR experiments in thewild type (WT; left in each panel) andtransgenic lines (right in each panel)expressing synthetic miRs (plants areshown below). The TUBULIN (TUB)gene was used as a control. D to F,Phenotypes of a wild-type plant (D), atransgenic line expressing the MYB28-like-miR (E), and a transgenic line ex-pressing the ATR1-like-miR (F). BothmiRs were expressed under the controlof the 35S CaMV promoter. G, A crossbetween a plant overexpressing MYB28and a MYB28-like-miR plant could res-cue the MYB28-like-miR phenotype. H,A cross between a plant overexpressingATR1/MYB34 and a ATR1-like-miRplant could rescue the ATR1-like-miRphenotype. I, Met- and Trp-derived GSaccumulation in 35STMYB28-like-miR-and 35STATR1-like-miR-expressingplants. The samples were collectedfrom 14-d-old rosette leaves and ana-lyzed by UPLC-qTOF-MS (see ‘‘Mate-rials and Methods’’). Relative IG levelsare shown as means 6 SE from sixindependent samples; asterisks indi-cate values that are statistically signif-icantly different (P , 0.05) comparedwith wild-type values. The metabolitelevels shown are presented as log ratiosfrom the wild type (levels of the latter,therefore, are always zero). For genenames, see Figure 7 legend.
Transcriptome and Metabolome Affected by Glucosinolate
Plant Physiol. Vol. 148, 2008 2025
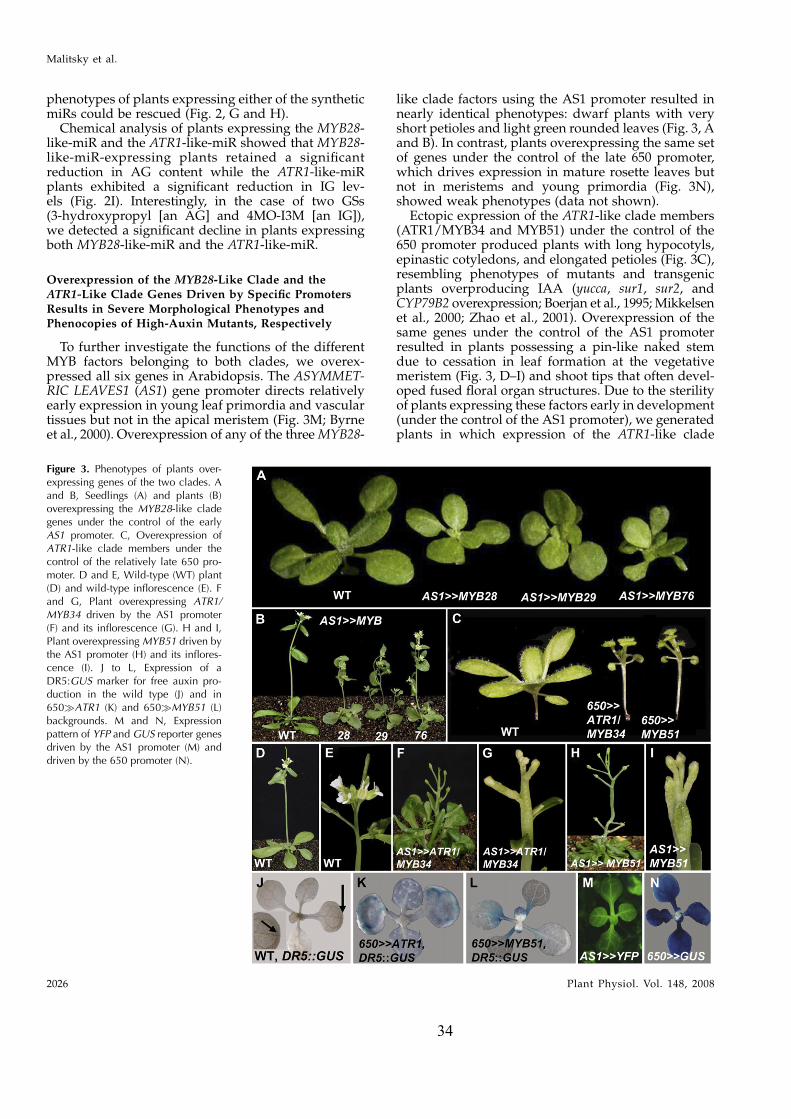
phenotypes of plants expressing either of the syntheticmiRs could be rescued (Fig. 2, G and H).
Chemical analysis of plants expressing the MYB28-like-miR and the ATR1-like-miR showed that MYB28-like-miR-expressing plants retained a significantreduction in AG content while the ATR1-like-miRplants exhibited a significant reduction in IG lev-els (Fig. 2I). Interestingly, in the case of two GSs(3-hydroxypropyl [an AG] and 4MO-I3M [an IG]),we detected a significant decline in plants expressingboth MYB28-like-miR and the ATR1-like-miR.
Overexpression of the MYB28-Like Clade and theATR1-Like Clade Genes Driven by Specific Promoters
Results in Severe Morphological Phenotypes andPhenocopies of High-Auxin Mutants, Respectively
To further investigate the functions of the differentMYB factors belonging to both clades, we overex-pressed all six genes in Arabidopsis. The ASYMMET-RIC LEAVES1 (AS1) gene promoter directs relativelyearly expression in young leaf primordia and vasculartissues but not in the apical meristem (Fig. 3M; Byrneet al., 2000). Overexpression of any of the three MYB28-
like clade factors using the AS1 promoter resulted innearly identical phenotypes: dwarf plants with veryshort petioles and light green rounded leaves (Fig. 3, Aand B). In contrast, plants overexpressing the same setof genes under the control of the late 650 promoter,which drives expression in mature rosette leaves butnot in meristems and young primordia (Fig. 3N),showed weak phenotypes (data not shown).
Ectopic expression of the ATR1-like clade members(ATR1/MYB34 and MYB51) under the control of the650 promoter produced plants with long hypocotyls,epinastic cotyledons, and elongated petioles (Fig. 3C),resembling phenotypes of mutants and transgenicplants overproducing IAA (yucca, sur1, sur2, andCYP79B2 overexpression; Boerjan et al., 1995; Mikkelsenet al., 2000; Zhao et al., 2001). Overexpression of thesame genes under the control of the AS1 promoterresulted in plants possessing a pin-like naked stemdue to cessation in leaf formation at the vegetativemeristem (Fig. 3, D–I) and shoot tips that often devel-oped fused floral organ structures. Due to the sterilityof plants expressing these factors early in development(under the control of the AS1 promoter), we generatedplants in which expression of the ATR1-like clade
Figure 3. Phenotypes of plants over-expressing genes of the two clades. Aand B, Seedlings (A) and plants (B)overexpressing the MYB28-like cladegenes under the control of the earlyAS1 promoter. C, Overexpression ofATR1-like clade members under thecontrol of the relatively late 650 pro-moter. D and E, Wild-type (WT) plant(D) and wild-type inflorescence (E). Fand G, Plant overexpressing ATR1/MYB34 driven by the AS1 promoter(F) and its inflorescence (G). H and I,Plant overexpressing MYB51 driven bythe AS1 promoter (H) and its inflores-cence (I). J to L, Expression of aDR5:GUS marker for free auxin pro-duction in the wild type (J) and in650�ATR1 (K) and 650�MYB51 (L)backgrounds. M and N, Expressionpattern of YFP and GUS reporter genesdriven by the AS1 promoter (M) anddriven by the 650 promoter (N).
Malitsky et al.
2026 Plant Physiol. Vol. 148, 2008
34
members was driven by the 650 promoter that directsexpression at later stages of development. The thirdATR1-like clade member, MYB122, was also expressedin the same way, but no morphological changes couldbe detected in transgenic plants (data not shown).
To corroborate our observation on alterations inauxin (IAA) metabolism phenotypes of ATR1/MYB34-and MYB51-overexpressing plants, we introduced theDR5TGUS construct into the 650�ATR1/MYB34 and650�MYB51 transgenic backgrounds. DR5TGUS wasused as a marker to visualize patterns of free auxinproduction by analyzing the expression of the GUSgene fused to the highly active synthetic auxin re-sponse element, which enables a rapid detection ofelevated free auxin concentration, movement, and ac-cumulation (Ulmasov et al., 1997). While expression ofDR5TGUS in wild-type seedlings is restricted to thehydathodes of either cotyledons or true leaves (Aloniet al., 2003; Fig. 3J), in the 650�ATR1/MYB34 seed-lings, DR5TGUS expression was broadened to the firstand secondary veins of cotyledons and did not changein true leaves (Fig. 3K). Expression of DR5TGUS in650�MYB51 was also altered compared with thewild type, and it appeared in petioles (in both cotyle-dons and leaves) and leaf blades (Fig. 3L). Expressionof the DR5TGUS in MYB28-like-expressing plantswas similar to that detected in the wild-type back-ground (data not shown). Altogether, these resultssuggest that both ATR1-like clade members overpro-duce IAA.
Transcriptome and Metabolome Changes in PlantsOverexpressing the ATR1-Like and MYB28-LikeClade Genes
We used Affymetrix GeneChips and nontargetedmetabolomics to carry out a detailed examination ofthe consequences of overexpressing members of bothclades in Arabidopsis. The transcriptomes and met-abolomes of lines ectopically expressing MYB76 orMYB29 (MYB28-like clade gene expression driven bythe AS1 promoter; see above) and ATR1/MYB34 orMYB51 (ATR1-like clade gene expression driven by the650 promoter; see above) were compared with thosedetected in wild-type plants. Two, mass spectrometry-based analytical methods were employed in order tocover a wide range of compound classes present inArabidopsis. In the first method, ultra-performanceliquid chromatography coupled to a quadrupole time-of-flight mass spectrometer (UPLC-qTOF-MS) wasused to detect mainly semipolar components (in bothelectrospray ionization (ESI)-positive and ESI-negativemodes). The high resolution and high mass accuracyof the UPLC-qTOF-MS system and tandem mass spec-trometry (MS/MS) analysis allows structural elucida-tion of unknown peaks, although in a large number ofcases the identification might be ambiguous (e.g. in thecase of isomers). Using this technology for Arabidopsisleaves allowed us to putatively identify and monitorthe relative levels of 72 metabolites, mainly secondary
metabolites (Supplemental Table S1). In order to profilepolar compounds, in particular primary metabolites,we used the previously established gas chromatography-mass spectrometry (GC-MS) analysis of derivatized ex-tracts (Fernie et al., 2004). In Arabidopsis rosette leaves,this technology allowed us to identify and monitor thelevels of 63 metabolites, including amino acids, organicacids, sugar alcohols, tricarboxylic acid (TCA) cycleintermediates, soluble sugars, sugar phosphates, and afew secondary metabolites (Supplemental Table S2).
To obtain a broad view of the differences in thetranscript and metabolite profiles of the various geno-types, we conducted principal component analysis(PCA) on the data sets derived from the gene expres-sion analysis and metabolite profiling (UPLC-qTOF-MS [operated in the ESI-negative mode] and GC-MS;Fig. 4). Gene and metabolite expression profiles couldbe clearly distinguished between the genotypes. Thetranscription profiles of lines ectopically expressingMYB76 or MYB29 (MYB28-like clade) and ATR1/MYB34 or MYB51 (ATR1-like clade) were clearly dis-similar to their corresponding wild-type samples andalso showed a clear difference between each other (Fig.4A). The whole UPLC-qTOF-MS data set was projectedon the first two principal components resulting fromthe PCA. Samples derived from plants overexpressingthe ATR1-like clade (MYB51 and ATR1/MYB34) couldbe clearly differentiated from the profiles of plantsoverexpressing the MYB28-like factors (MYB28,MYB29, and MYB76) and from the wild type. PCAon the data obtained with GC-MS showed a separationbetween the two clades of transcription factors and thewild type as good as the separation obtained in theUPLC-qTOF-MS data (Fig. 4, B and C).
In the course of this study, we recognized that tran-scriptional regulators of metabolic pathways mighthave a broad influence not only on committed stepsin a specific metabolic pathway but also on the morecentral, primary metabolism, which supplies path-ways of secondary metabolism its backbone precur-sors. Therefore, we evaluated the results obtainedfrom the transcriptome and metabolome analyses inthe case of both the ‘‘proximal’’ network pathways(defined here as downstream from Trp and Met,including GSs and linked pathways) and the ‘‘distal’’network pathways (defined here as providing precur-sors to Trp and Met biosynthesis and additional met-abolic pathways currently not known to be directlyrelated to the GS pathway).
The Transcriptomes of Plants Overexpressing Genesof Both Clades
Due to the very high similarity in transcriptomechanges between samples derived from overexpres-sion of the same clade members (see ‘‘Materials andMethods’’; Fig. 4), particularly in genes of the proximaland distal networks, we combined the results of theoverexpression of the same clade members in com-parison with wild-type plants (ATR1/MYB34 and
Transcriptome and Metabolome Affected by Glucosinolate
Plant Physiol. Vol. 148, 2008 2027
35
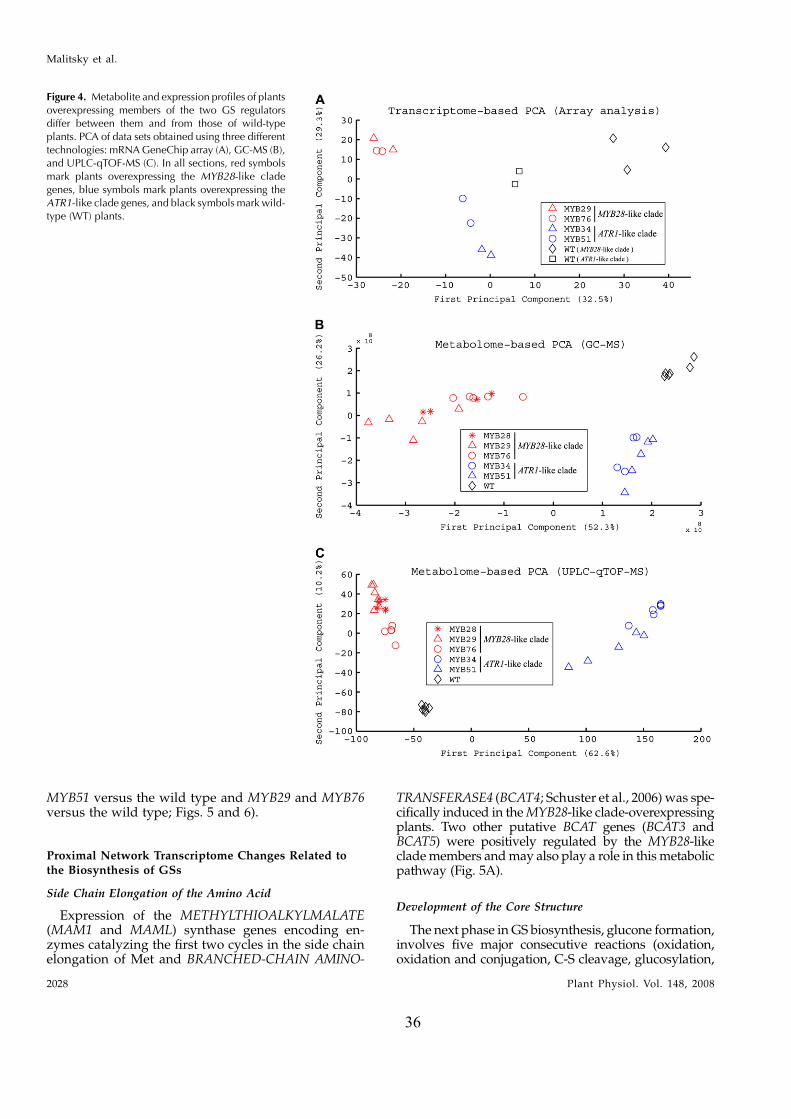
MYB51 versus the wild type and MYB29 and MYB76versus the wild type; Figs. 5 and 6).
Proximal Network Transcriptome Changes Related tothe Biosynthesis of GSs
Side Chain Elongation of the Amino Acid
Expression of the METHYLTHIOALKYLMALATE(MAM1 and MAML) synthase genes encoding en-zymes catalyzing the first two cycles in the side chainelongation of Met and BRANCHED-CHAIN AMINO-
TRANSFERASE4 (BCAT4; Schuster et al., 2006) was spe-cifically induced in the MYB28-like clade-overexpressingplants. Two other putative BCAT genes (BCAT3 andBCAT5) were positively regulated by the MYB28-likeclade members and may also play a role in this metabolicpathway (Fig. 5A).
Development of the Core Structure
The next phase in GS biosynthesis, glucone formation,involves five major consecutive reactions (oxidation,oxidation and conjugation, C-S cleavage, glucosylation,
Figure 4. Metabolite and expression profiles of plantsoverexpressing members of the two GS regulatorsdiffer between them and from those of wild-typeplants. PCA of data sets obtained using three differenttechnologies: mRNA GeneChip array (A), GC-MS (B),and UPLC-qTOF-MS (C). In all sections, red symbolsmark plants overexpressing the MYB28-like cladegenes, blue symbols mark plants overexpressing theATR1-like clade genes, and black symbols mark wild-type (WT) plants.
Malitsky et al.
2028 Plant Physiol. Vol. 148, 2008
36
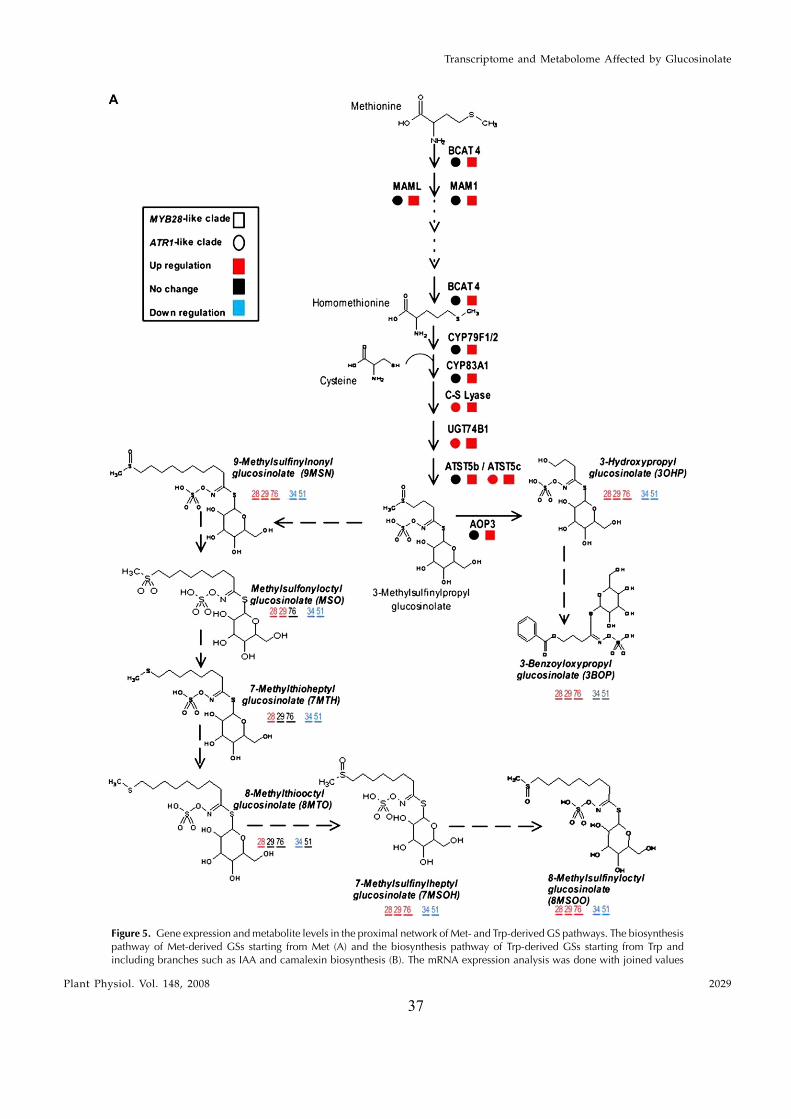
Figure 5. Gene expression and metabolite levels in the proximal network of Met- and Trp-derived GS pathways. The biosynthesispathway of Met-derived GSs starting from Met (A) and the biosynthesis pathway of Trp-derived GSs starting from Trp andincluding branches such as IAA and camalexin biosynthesis (B). The mRNA expression analysis was done with joined values
Transcriptome and Metabolome Affected by Glucosinolate
Plant Physiol. Vol. 148, 2008 2029
37
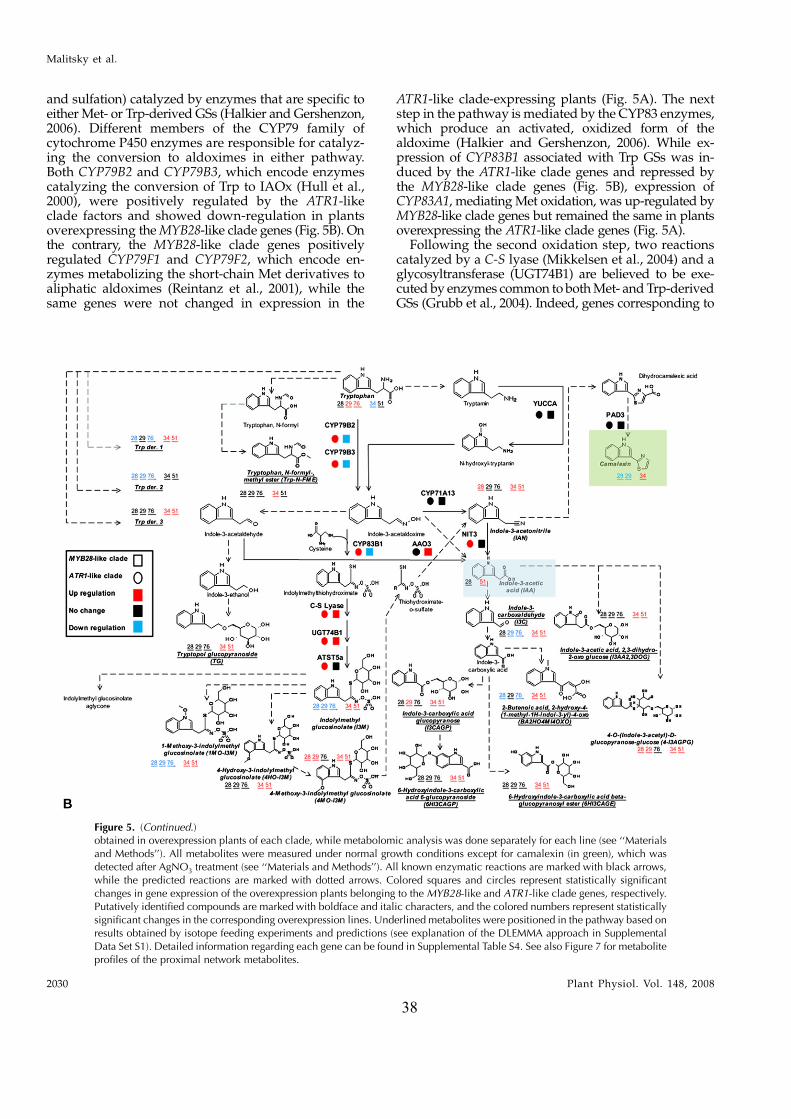
and sulfation) catalyzed by enzymes that are specific toeither Met- or Trp-derived GSs (Halkier and Gershenzon,2006). Different members of the CYP79 family ofcytochrome P450 enzymes are responsible for catalyz-ing the conversion to aldoximes in either pathway.Both CYP79B2 and CYP79B3, which encode enzymescatalyzing the conversion of Trp to IAOx (Hull et al.,2000), were positively regulated by the ATR1-likeclade factors and showed down-regulation in plantsoverexpressing the MYB28-like clade genes (Fig. 5B). Onthe contrary, the MYB28-like clade genes positivelyregulated CYP79F1 and CYP79F2, which encode en-zymes metabolizing the short-chain Met derivatives toaliphatic aldoximes (Reintanz et al., 2001), while thesame genes were not changed in expression in the
ATR1-like clade-expressing plants (Fig. 5A). The nextstep in the pathway is mediated by the CYP83 enzymes,which produce an activated, oxidized form of thealdoxime (Halkier and Gershenzon, 2006). While ex-pression of CYP83B1 associated with Trp GSs was in-duced by the ATR1-like clade genes and repressed bythe MYB28-like clade genes (Fig. 5B), expression ofCYP83A1, mediating Met oxidation, was up-regulated byMYB28-like clade genes but remained the same in plantsoverexpressing the ATR1-like clade genes (Fig. 5A).
Following the second oxidation step, two reactionscatalyzed by a C-S lyase (Mikkelsen et al., 2004) and aglycosyltransferase (UGT74B1) are believed to be exe-cuted by enzymes common to both Met- and Trp-derivedGSs (Grubb et al., 2004). Indeed, genes corresponding to
Figure 5. (Continued.)obtained in overexpression plants of each clade, while metabolomic analysis was done separately for each line (see ‘‘Materialsand Methods’’). All metabolites were measured under normal growth conditions except for camalexin (in green), which wasdetected after AgNO3 treatment (see ‘‘Materials and Methods’’). All known enzymatic reactions are marked with black arrows,while the predicted reactions are marked with dotted arrows. Colored squares and circles represent statistically significantchanges in gene expression of the overexpression plants belonging to the MYB28-like and ATR1-like clade genes, respectively.Putatively identified compounds are marked with boldface and italic characters, and the colored numbers represent statisticallysignificant changes in the corresponding overexpression lines. Underlined metabolites were positioned in the pathway based onresults obtained by isotope feeding experiments and predictions (see explanation of the DLEMMA approach in SupplementalData Set S1). Detailed information regarding each gene can be found in Supplemental Table S4. See also Figure 7 for metaboliteprofiles of the proximal network metabolites.
Malitsky et al.
2030 Plant Physiol. Vol. 148, 2008
38
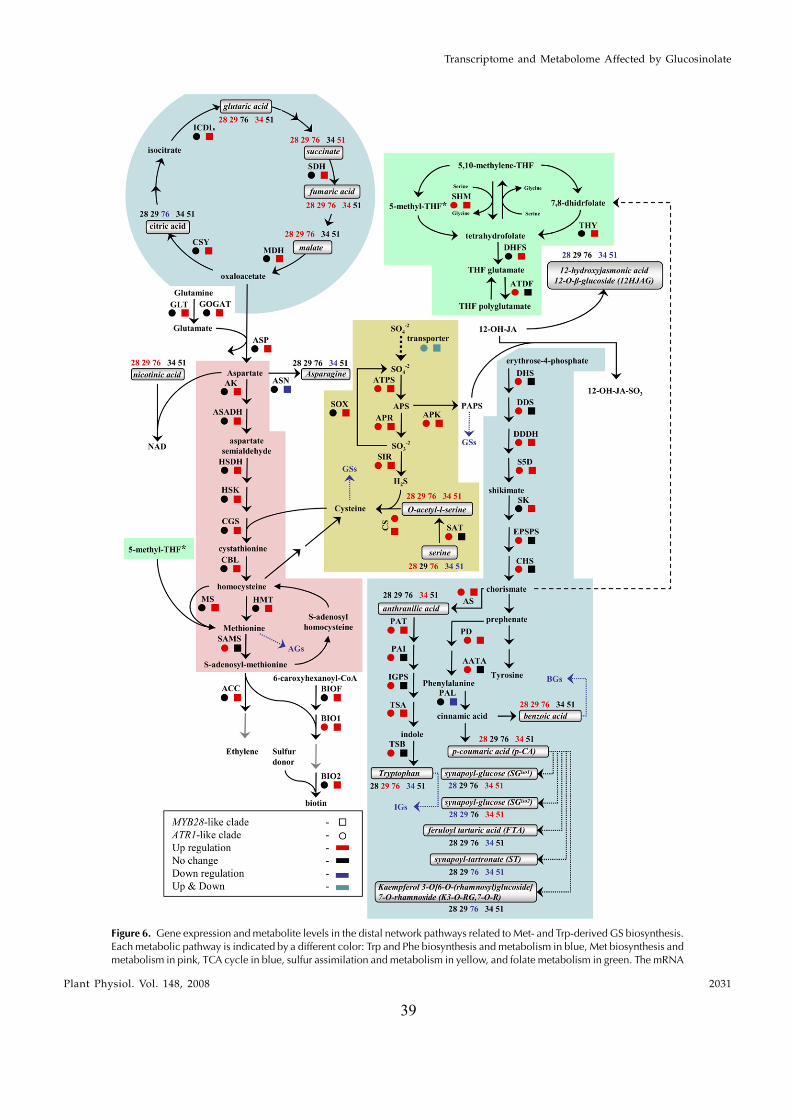
Figure 6. Gene expression and metabolite levels in the distal network pathways related to Met- and Trp-derived GS biosynthesis.Each metabolic pathway is indicated by a different color: Trp and Phe biosynthesis and metabolism in blue, Met biosynthesis andmetabolism in pink, TCA cycle in blue, sulfur assimilation and metabolism in yellow, and folate metabolism in green. The mRNA
Transcriptome and Metabolome Affected by Glucosinolate
Plant Physiol. Vol. 148, 2008 2031
39
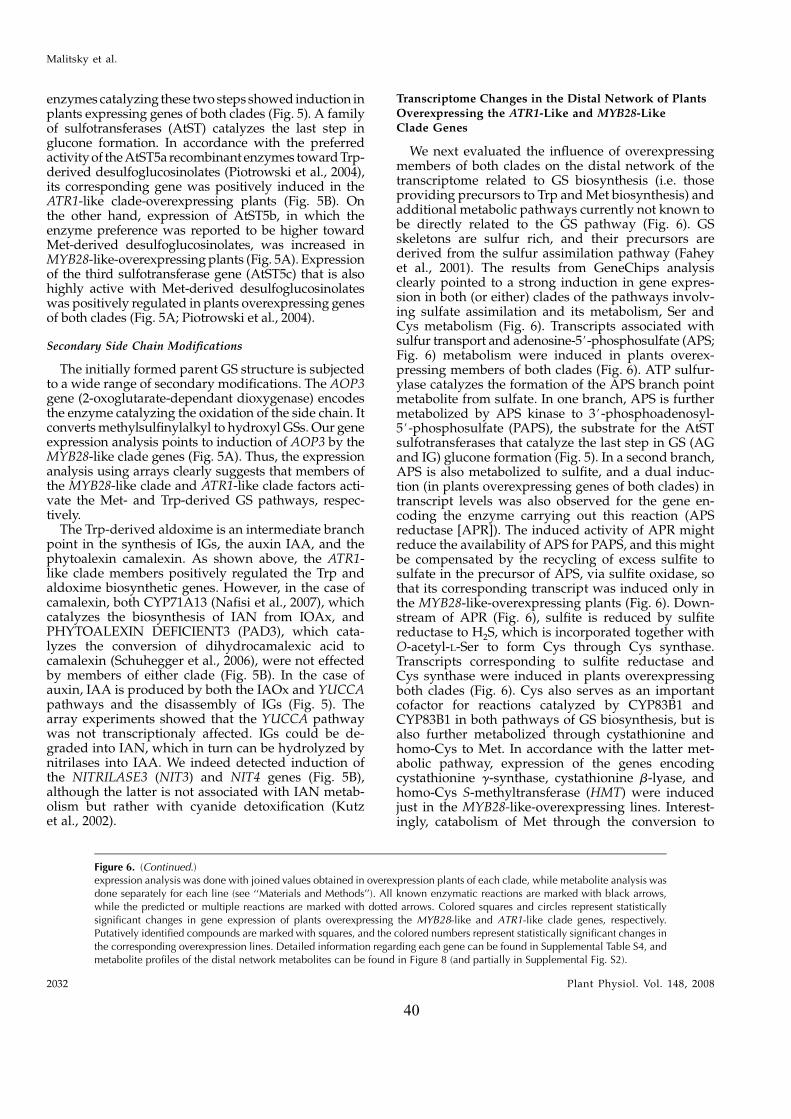
enzymes catalyzing these two steps showed induction inplants expressing genes of both clades (Fig. 5). A familyof sulfotransferases (AtST) catalyzes the last step inglucone formation. In accordance with the preferredactivity of the AtST5a recombinant enzymes toward Trp-derived desulfoglucosinolates (Piotrowski et al., 2004),its corresponding gene was positively induced in theATR1-like clade-overexpressing plants (Fig. 5B). Onthe other hand, expression of AtST5b, in which theenzyme preference was reported to be higher towardMet-derived desulfoglucosinolates, was increased inMYB28-like-overexpressing plants (Fig. 5A). Expressionof the third sulfotransferase gene (AtST5c) that is alsohighly active with Met-derived desulfoglucosinolateswas positively regulated in plants overexpressing genesof both clades (Fig. 5A; Piotrowski et al., 2004).
Secondary Side Chain Modifications
The initially formed parent GS structure is subjectedto a wide range of secondary modifications. The AOP3gene (2-oxoglutarate-dependant dioxygenase) encodesthe enzyme catalyzing the oxidation of the side chain. Itconverts methylsulfinylalkyl to hydroxyl GSs. Our geneexpression analysis points to induction of AOP3 by theMYB28-like clade genes (Fig. 5A). Thus, the expressionanalysis using arrays clearly suggests that members ofthe MYB28-like clade and ATR1-like clade factors acti-vate the Met- and Trp-derived GS pathways, respec-tively.
The Trp-derived aldoxime is an intermediate branchpoint in the synthesis of IGs, the auxin IAA, and thephytoalexin camalexin. As shown above, the ATR1-like clade members positively regulated the Trp andaldoxime biosynthetic genes. However, in the case ofcamalexin, both CYP71A13 (Nafisi et al., 2007), whichcatalyzes the biosynthesis of IAN from IOAx, andPHYTOALEXIN DEFICIENT3 (PAD3), which cata-lyzes the conversion of dihydrocamalexic acid tocamalexin (Schuhegger et al., 2006), were not effectedby members of either clade (Fig. 5B). In the case ofauxin, IAA is produced by both the IAOx and YUCCApathways and the disassembly of IGs (Fig. 5). Thearray experiments showed that the YUCCA pathwaywas not transcriptionaly affected. IGs could be de-graded into IAN, which in turn can be hydrolyzed bynitrilases into IAA. We indeed detected induction ofthe NITRILASE3 (NIT3) and NIT4 genes (Fig. 5B),although the latter is not associated with IAN metab-olism but rather with cyanide detoxification (Kutzet al., 2002).
Transcriptome Changes in the Distal Network of Plants
Overexpressing the ATR1-Like and MYB28-LikeClade Genes
We next evaluated the influence of overexpressingmembers of both clades on the distal network of thetranscriptome related to GS biosynthesis (i.e. thoseproviding precursors to Trp and Met biosynthesis) andadditional metabolic pathways currently not known tobe directly related to the GS pathway (Fig. 6). GSskeletons are sulfur rich, and their precursors arederived from the sulfur assimilation pathway (Faheyet al., 2001). The results from GeneChips analysisclearly pointed to a strong induction in gene expres-sion in both (or either) clades of the pathways involv-ing sulfate assimilation and its metabolism, Ser andCys metabolism (Fig. 6). Transcripts associated withsulfur transport and adenosine-5#-phosphosulfate (APS;Fig. 6) metabolism were induced in plants overex-pressing members of both clades (Fig. 6). ATP sulfur-ylase catalyzes the formation of the APS branch pointmetabolite from sulfate. In one branch, APS is furthermetabolized by APS kinase to 3#-phosphoadenosyl-5#-phosphosulfate (PAPS), the substrate for the AtSTsulfotransferases that catalyze the last step in GS (AGand IG) glucone formation (Fig. 5). In a second branch,APS is also metabolized to sulfite, and a dual induc-tion (in plants overexpressing genes of both clades) intranscript levels was also observed for the gene en-coding the enzyme carrying out this reaction (APSreductase [APR]). The induced activity of APR mightreduce the availability of APS for PAPS, and this mightbe compensated by the recycling of excess sulfite tosulfate in the precursor of APS, via sulfite oxidase, sothat its corresponding transcript was induced only inthe MYB28-like-overexpressing plants (Fig. 6). Down-stream of APR (Fig. 6), sulfite is reduced by sulfitereductase to H2S, which is incorporated together withO-acetyl-L-Ser to form Cys through Cys synthase.Transcripts corresponding to sulfite reductase andCys synthase were induced in plants overexpressingboth clades (Fig. 6). Cys also serves as an importantcofactor for reactions catalyzed by CYP83B1 andCYP83B1 in both pathways of GS biosynthesis, but isalso further metabolized through cystathionine andhomo-Cys to Met. In accordance with the latter met-abolic pathway, expression of the genes encodingcystathionine g-synthase, cystathionine b-lyase, andhomo-Cys S-methyltransferase (HMT) were inducedjust in the MYB28-like-overexpressing lines. Interest-ingly, catabolism of Met through the conversion to
Figure 6. (Continued.)expression analysis was done with joined values obtained in overexpression plants of each clade, while metabolite analysis wasdone separately for each line (see ‘‘Materials and Methods’’). All known enzymatic reactions are marked with black arrows,while the predicted or multiple reactions are marked with dotted arrows. Colored squares and circles represent statisticallysignificant changes in gene expression of plants overexpressing the MYB28-like and ATR1-like clade genes, respectively.Putatively identified compounds are marked with squares, and the colored numbers represent statistically significant changes inthe corresponding overexpression lines. Detailed information regarding each gene can be found in Supplemental Table S4, andmetabolite profiles of the distal network metabolites can be found in Figure 8 (and partially in Supplemental Fig. S2).
Malitsky et al.
2032 Plant Physiol. Vol. 148, 2008
40
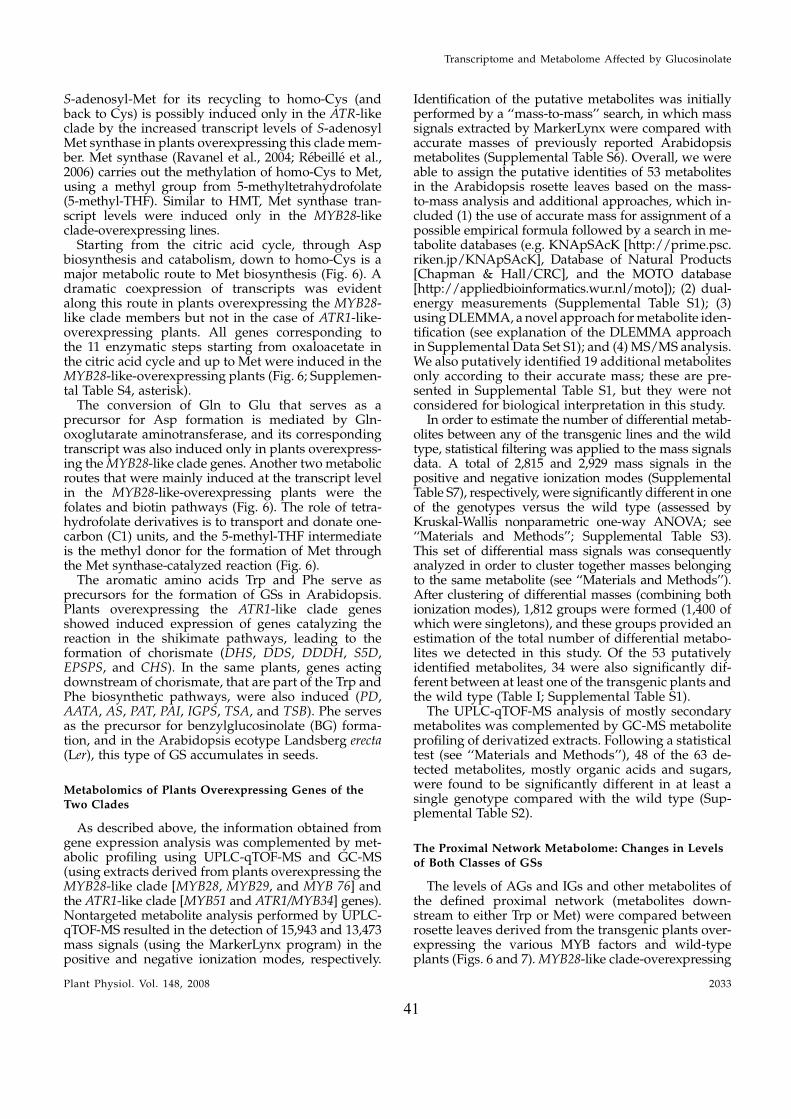
S-adenosyl-Met for its recycling to homo-Cys (andback to Cys) is possibly induced only in the ATR-likeclade by the increased transcript levels of S-adenosylMet synthase in plants overexpressing this clade mem-ber. Met synthase (Ravanel et al., 2004; Rebeille et al.,2006) carries out the methylation of homo-Cys to Met,using a methyl group from 5-methyltetrahydrofolate(5-methyl-THF). Similar to HMT, Met synthase tran-script levels were induced only in the MYB28-likeclade-overexpressing lines.
Starting from the citric acid cycle, through Aspbiosynthesis and catabolism, down to homo-Cys is amajor metabolic route to Met biosynthesis (Fig. 6). Adramatic coexpression of transcripts was evidentalong this route in plants overexpressing the MYB28-like clade members but not in the case of ATR1-like-overexpressing plants. All genes corresponding tothe 11 enzymatic steps starting from oxaloacetate inthe citric acid cycle and up to Met were induced in theMYB28-like-overexpressing plants (Fig. 6; Supplemen-tal Table S4, asterisk).
The conversion of Gln to Glu that serves as aprecursor for Asp formation is mediated by Gln-oxoglutarate aminotransferase, and its correspondingtranscript was also induced only in plants overexpress-ing the MYB28-like clade genes. Another two metabolicroutes that were mainly induced at the transcript levelin the MYB28-like-overexpressing plants were thefolates and biotin pathways (Fig. 6). The role of tetra-hydrofolate derivatives is to transport and donate one-carbon (C1) units, and the 5-methyl-THF intermediateis the methyl donor for the formation of Met throughthe Met synthase-catalyzed reaction (Fig. 6).
The aromatic amino acids Trp and Phe serve asprecursors for the formation of GSs in Arabidopsis.Plants overexpressing the ATR1-like clade genesshowed induced expression of genes catalyzing thereaction in the shikimate pathways, leading to theformation of chorismate (DHS, DDS, DDDH, S5D,EPSPS, and CHS). In the same plants, genes actingdownstream of chorismate, that are part of the Trp andPhe biosynthetic pathways, were also induced (PD,AATA, AS, PAT, PAI, IGPS, TSA, and TSB). Phe servesas the precursor for benzylglucosinolate (BG) forma-tion, and in the Arabidopsis ecotype Landsberg erecta(Ler), this type of GS accumulates in seeds.
Metabolomics of Plants Overexpressing Genes of theTwo Clades
As described above, the information obtained fromgene expression analysis was complemented by met-abolic profiling using UPLC-qTOF-MS and GC-MS(using extracts derived from plants overexpressing theMYB28-like clade [MYB28, MYB29, and MYB 76] andthe ATR1-like clade [MYB51 and ATR1/MYB34] genes).Nontargeted metabolite analysis performed by UPLC-qTOF-MS resulted in the detection of 15,943 and 13,473mass signals (using the MarkerLynx program) in thepositive and negative ionization modes, respectively.
Identification of the putative metabolites was initiallyperformed by a ‘‘mass-to-mass’’ search, in which masssignals extracted by MarkerLynx were compared withaccurate masses of previously reported Arabidopsismetabolites (Supplemental Table S6). Overall, we wereable to assign the putative identities of 53 metabolitesin the Arabidopsis rosette leaves based on the mass-to-mass analysis and additional approaches, which in-cluded (1) the use of accurate mass for assignment of apossible empirical formula followed by a search in me-tabolite databases (e.g. KNApSAcK [http://prime.psc.riken.jp/KNApSAcK], Database of Natural Products[Chapman & Hall/CRC], and the MOTO database[http://appliedbioinformatics.wur.nl/moto]); (2) dual-energy measurements (Supplemental Table S1); (3)using DLEMMA, a novel approach for metabolite iden-tification (see explanation of the DLEMMA approachin Supplemental Data Set S1); and (4) MS/MS analysis.We also putatively identified 19 additional metabolitesonly according to their accurate mass; these are pre-sented in Supplemental Table S1, but they were notconsidered for biological interpretation in this study.
In order to estimate the number of differential metab-olites between any of the transgenic lines and the wildtype, statistical filtering was applied to the mass signalsdata. A total of 2,815 and 2,929 mass signals in thepositive and negative ionization modes (SupplementalTable S7), respectively, were significantly different in oneof the genotypes versus the wild type (assessed byKruskal-Wallis nonparametric one-way ANOVA; see‘‘Materials and Methods’’; Supplemental Table S3).This set of differential mass signals was consequentlyanalyzed in order to cluster together masses belongingto the same metabolite (see ‘‘Materials and Methods’’).After clustering of differential masses (combining bothionization modes), 1,812 groups were formed (1,400 ofwhich were singletons), and these groups provided anestimation of the total number of differential metabo-lites we detected in this study. Of the 53 putativelyidentified metabolites, 34 were also significantly dif-ferent between at least one of the transgenic plants andthe wild type (Table I; Supplemental Table S1).
The UPLC-qTOF-MS analysis of mostly secondarymetabolites was complemented by GC-MS metaboliteprofiling of derivatized extracts. Following a statisticaltest (see ‘‘Materials and Methods’’), 48 of the 63 de-tected metabolites, mostly organic acids and sugars,were found to be significantly different in at least asingle genotype compared with the wild type (Sup-plemental Table S2).
The Proximal Network Metabolome: Changes in Levelsof Both Classes of GSs
The levels of AGs and IGs and other metabolites ofthe defined proximal network (metabolites down-stream to either Trp or Met) were compared betweenrosette leaves derived from the transgenic plants over-expressing the various MYB factors and wild-typeplants (Figs. 6 and 7). MYB28-like clade-overexpressing
Transcriptome and Metabolome Affected by Glucosinolate
Plant Physiol. Vol. 148, 2008 2033
41
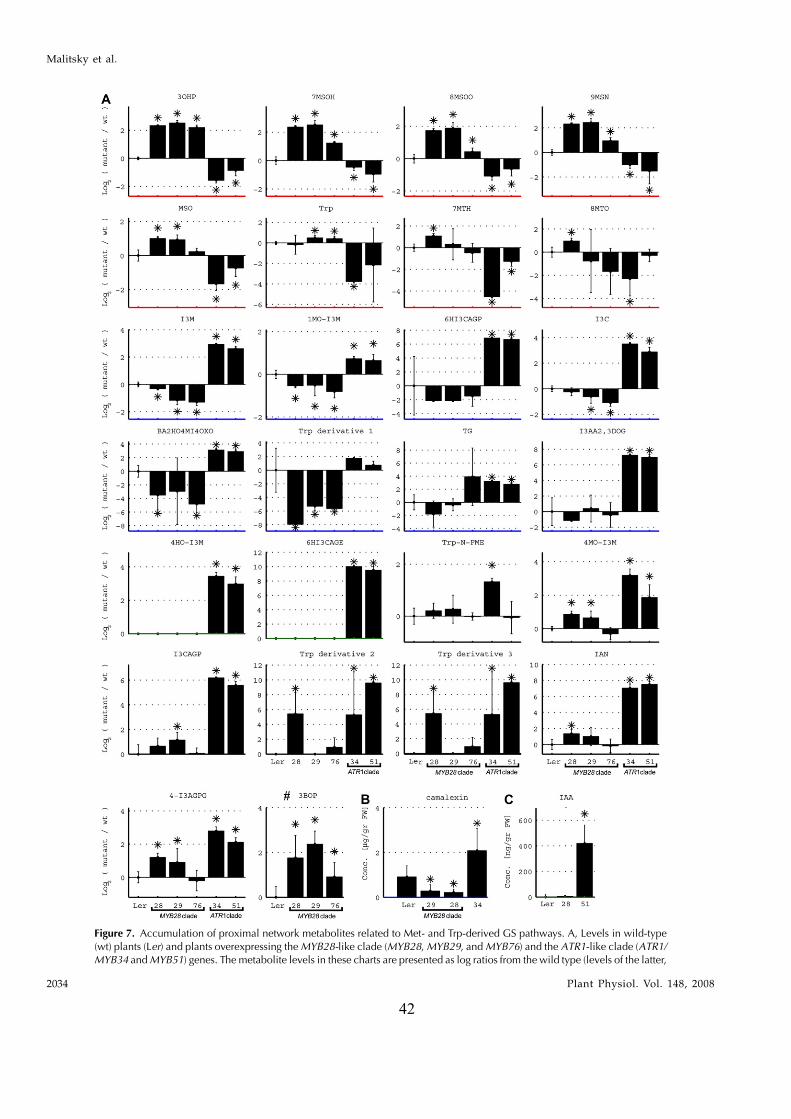
Figure 7. Accumulation of proximal network metabolites related to Met- and Trp-derived GS pathways. A, Levels in wild-type(wt) plants (Ler) and plants overexpressing the MYB28-like clade (MYB28, MYB29, and MYB76) and the ATR1-like clade (ATR1/MYB34 and MYB51) genes. The metabolite levels in these charts are presented as log ratios from the wild type (levels of the latter,
Malitsky et al.
2034 Plant Physiol. Vol. 148, 2008
42
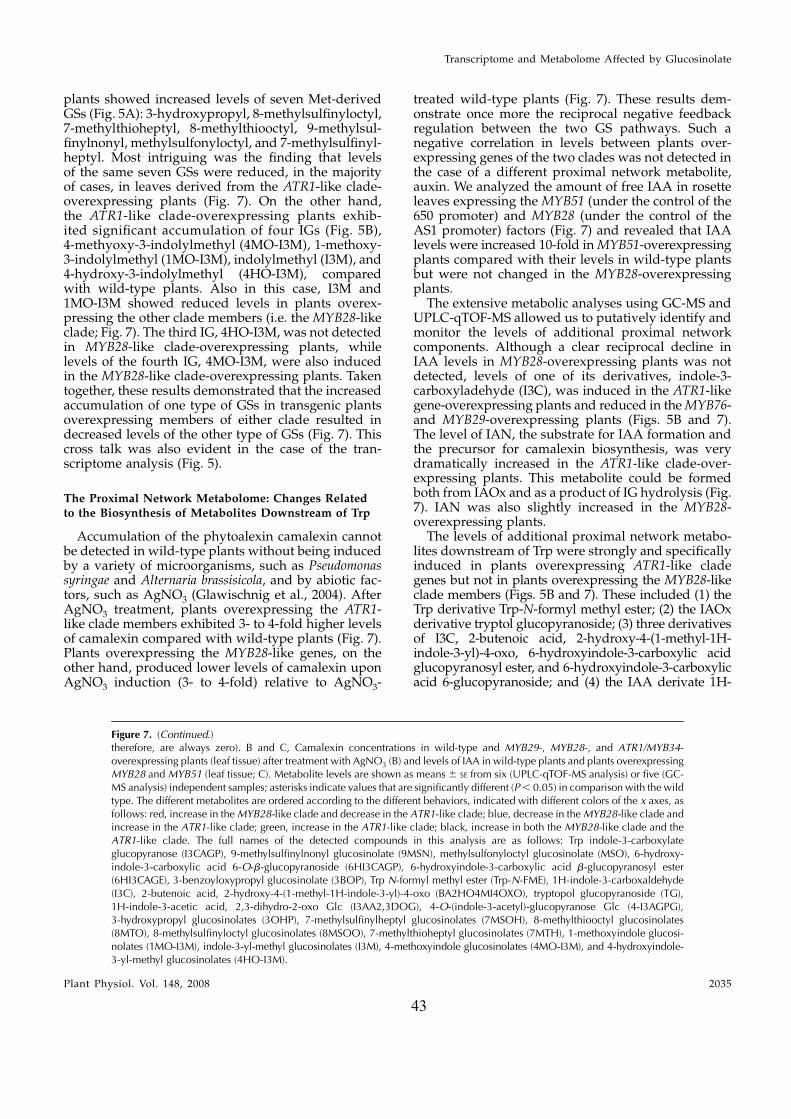
plants showed increased levels of seven Met-derivedGSs (Fig. 5A): 3-hydroxypropyl, 8-methylsulfinyloctyl,7-methylthioheptyl, 8-methylthiooctyl, 9-methylsul-finylnonyl, methylsulfonyloctyl, and 7-methylsulfinyl-heptyl. Most intriguing was the finding that levelsof the same seven GSs were reduced, in the majorityof cases, in leaves derived from the ATR1-like clade-overexpressing plants (Fig. 7). On the other hand,the ATR1-like clade-overexpressing plants exhib-ited significant accumulation of four IGs (Fig. 5B),4-methyoxy-3-indolylmethyl (4MO-I3M), 1-methoxy-3-indolylmethyl (1MO-I3M), indolylmethyl (I3M), and4-hydroxy-3-indolylmethyl (4HO-I3M), comparedwith wild-type plants. Also in this case, I3M and1MO-I3M showed reduced levels in plants overex-pressing the other clade members (i.e. the MYB28-likeclade; Fig. 7). The third IG, 4HO-I3M, was not detectedin MYB28-like clade-overexpressing plants, whilelevels of the fourth IG, 4MO-I3M, were also inducedin the MYB28-like clade-overexpressing plants. Takentogether, these results demonstrated that the increasedaccumulation of one type of GSs in transgenic plantsoverexpressing members of either clade resulted indecreased levels of the other type of GSs (Fig. 7). Thiscross talk was also evident in the case of the tran-scriptome analysis (Fig. 5).
The Proximal Network Metabolome: Changes Relatedto the Biosynthesis of Metabolites Downstream of Trp
Accumulation of the phytoalexin camalexin cannotbe detected in wild-type plants without being inducedby a variety of microorganisms, such as Pseudomonassyringae and Alternaria brassisicola, and by abiotic fac-tors, such as AgNO3 (Glawischnig et al., 2004). AfterAgNO3 treatment, plants overexpressing the ATR1-like clade members exhibited 3- to 4-fold higher levelsof camalexin compared with wild-type plants (Fig. 7).Plants overexpressing the MYB28-like genes, on theother hand, produced lower levels of camalexin uponAgNO3 induction (3- to 4-fold) relative to AgNO3-
treated wild-type plants (Fig. 7). These results dem-onstrate once more the reciprocal negative feedbackregulation between the two GS pathways. Such anegative correlation in levels between plants over-expressing genes of the two clades was not detected inthe case of a different proximal network metabolite,auxin. We analyzed the amount of free IAA in rosetteleaves expressing the MYB51 (under the control of the650 promoter) and MYB28 (under the control of theAS1 promoter) factors (Fig. 7) and revealed that IAAlevels were increased 10-fold in MYB51-overexpressingplants compared with their levels in wild-type plantsbut were not changed in the MYB28-overexpressingplants.
The extensive metabolic analyses using GC-MS andUPLC-qTOF-MS allowed us to putatively identify andmonitor the levels of additional proximal networkcomponents. Although a clear reciprocal decline inIAA levels in MYB28-overexpressing plants was notdetected, levels of one of its derivatives, indole-3-carboxyladehyde (I3C), was induced in the ATR1-likegene-overexpressing plants and reduced in the MYB76-and MYB29-overexpressing plants (Figs. 5B and 7).The level of IAN, the substrate for IAA formation andthe precursor for camalexin biosynthesis, was verydramatically increased in the ATR1-like clade-over-expressing plants. This metabolite could be formedboth from IAOx and as a product of IG hydrolysis (Fig.7). IAN was also slightly increased in the MYB28-overexpressing plants.
The levels of additional proximal network metabo-lites downstream of Trp were strongly and specificallyinduced in plants overexpressing ATR1-like cladegenes but not in plants overexpressing the MYB28-likeclade members (Figs. 5B and 7). These included (1) theTrp derivative Trp-N-formyl methyl ester; (2) the IAOxderivative tryptol glucopyranoside; (3) three derivativesof I3C, 2-butenoic acid, 2-hydroxy-4-(1-methyl-1H-indole-3-yl)-4-oxo, 6-hydroxyindole-3-carboxylic acidglucopyranosyl ester, and 6-hydroxyindole-3-carboxylicacid 6-glucopyranoside; and (4) the IAA derivate 1H-
Figure 7. (Continued.)therefore, are always zero). B and C, Camalexin concentrations in wild-type and MYB29-, MYB28-, and ATR1/MYB34-overexpressing plants (leaf tissue) after treatment with AgNO3 (B) and levels of IAA in wild-type plants and plants overexpressingMYB28 and MYB51 (leaf tissue; C). Metabolite levels are shown as means 6 SE from six (UPLC-qTOF-MS analysis) or five (GC-MS analysis) independent samples; asterisks indicate values that are significantly different (P , 0.05) in comparison with the wildtype. The different metabolites are ordered according to the different behaviors, indicated with different colors of the x axes, asfollows: red, increase in the MYB28-like clade and decrease in the ATR1-like clade; blue, decrease in the MYB28-like clade andincrease in the ATR1-like clade; green, increase in the ATR1-like clade; black, increase in both the MYB28-like clade and theATR1-like clade. The full names of the detected compounds in this analysis are as follows: Trp indole-3-carboxylateglucopyranose (I3CAGP), 9-methylsulfinylnonyl glucosinolate (9MSN), methylsulfonyloctyl glucosinolate (MSO), 6-hydroxy-indole-3-carboxylic acid 6-O-b-glucopyranoside (6HI3CAGP), 6-hydroxyindole-3-carboxylic acid b-glucopyranosyl ester(6HI3CAGE), 3-benzoyloxypropyl glucosinolate (3BOP), Trp N-formyl methyl ester (Trp-N-FME), 1H-indole-3-carboxaldehyde(I3C), 2-butenoic acid, 2-hydroxy-4-(1-methyl-1H-indole-3-yl)-4-oxo (BA2HO4MI4OXO), tryptopol glucopyranoside (TG),1H-indole-3-acetic acid, 2,3-dihydro-2-oxo Glc (I3AA2,3DOG), 4-O-(indole-3-acetyl)-glucopyranose Glc (4-I3AGPG),3-hydroxypropyl glucosinolates (3OHP), 7-methylsulfinylheptyl glucosinolates (7MSOH), 8-methylthiooctyl glucosinolates(8MTO), 8-methylsulfinyloctyl glucosinolates (8MSOO), 7-methylthioheptyl glucosinolates (7MTH), 1-methoxyindole glucosi-nolates (1MO-I3M), indole-3-yl-methyl glucosinolates (I3M), 4-methoxyindole glucosinolates (4MO-I3M), and 4-hydroxyindole-3-yl-methyl glucosinolates (4HO-I3M).
Transcriptome and Metabolome Affected by Glucosinolate
Plant Physiol. Vol. 148, 2008 2035
43
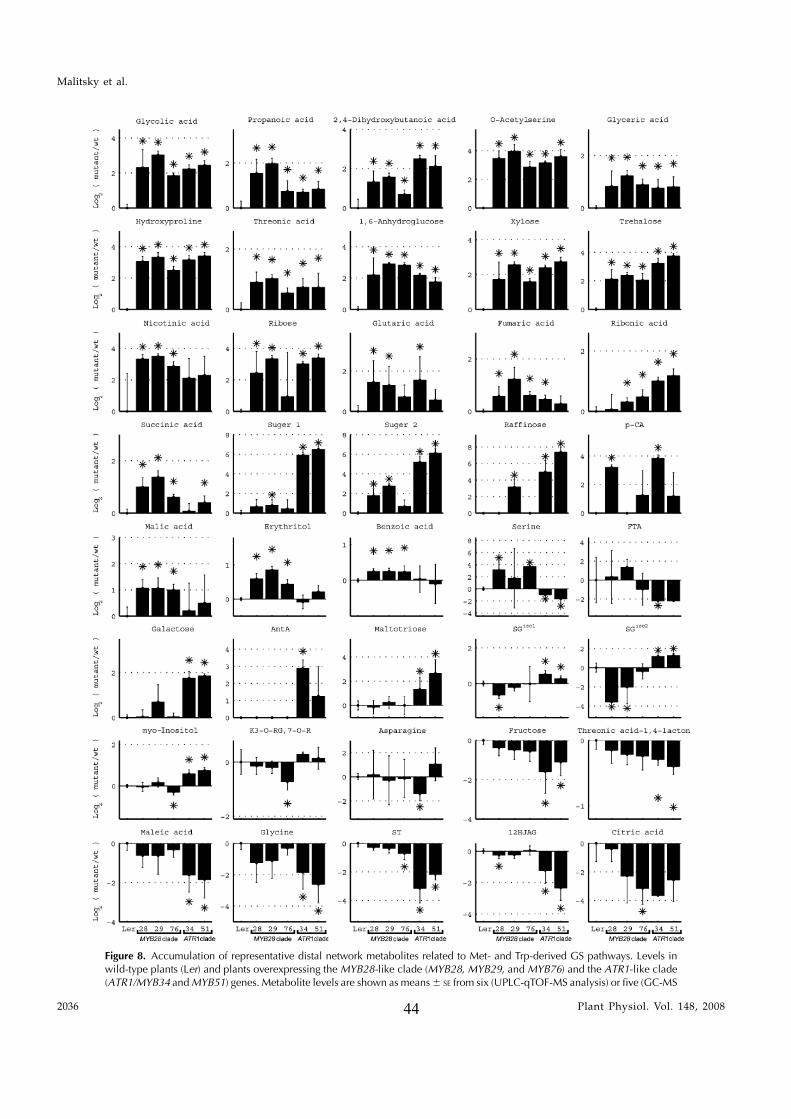
Figure 8. Accumulation of representative distal network metabolites related to Met- and Trp-derived GS pathways. Levels inwild-type plants (Ler) and plants overexpressing the MYB28-like clade (MYB28, MYB29, and MYB76) and the ATR1-like clade(ATR1/MYB34 and MYB51) genes. Metabolite levels are shown as means 6 SE from six (UPLC-qTOF-MS analysis) or five (GC-MS
Malitsky et al.
2036 Plant Physiol. Vol. 148, 200844
indole-3-acetic acid, 2,3-dihydro-2-oxo hexose (Figs. 5Band 7). Another derivative of I3C, indole-3-carboxylicacid 6-glucopyranose, the putative precursor of 6-hy-droxyindole-3-carboxylic acid 6-glucopyranoside, wasinduced in plants overexpressing both ATR1-like mem-bers but was also increased in MYB29-overexpressingplants (Figs. 5B and 7).
Two unknown Trp derivatives (Trp derivatives 2 and 3;Fig. 7) were induced in the ATR1-like-overexpressingplants and in the MYB28-expressing plants. A thirdTrp derivative (Trp derivative 1) was reduced in levelsin all three MYB28-like clade-overexpressing plantsbut did not change in the ATR1-clade-overexpressingplants. Finally, levels of Trp itself were strongly down-regulated in the ATR1/MYB34-overexpressing plants,while they were slightly increased in plants over-expressing the MYB29 and MYB76 members of theMYB28-like clade (Figs. 5B and 7). Another indoliccompound, a derivative of IAA, 4-O-(indole-3-acetyl)-D-glucopyranose Glc, showed a significant increase inlevels in plants overexpressing the two ATR1-likeclade members but also, albeit more moderately, inplants overexpressing MYB28 and MYB29 (Fig. 7).
Metabolome Changes in the Distal Network of PlantsOverexpressing the ATR1-Like and MYB28-Like
Clade Genes
We next evaluated the influence of overexpressingboth clade members on the distal network of themetabolome related to GS biosynthesis. Overall, atotal of 53 distal network metabolites were detectedas differentially produced in at least a single trans-genic plant compared with the wild type (from bothGC-MS and LC-MS analyses; Fig. 8; Supplemental Fig.S2). The levels of 40 of these metabolites in the differ-ent genotypes are depicted in Figure 8. A relativelylarge set of metabolites were increased in levels in allfive overexpression lines. They included several acids(glycolic acid, propanoic acid, 2,4-dihydroxybutanoicacid, glyceric acid, Hyp, and threonic acid), sugars(Xyl, 1,6-anhydroglucose, and trehalose), and O-acetyl-Ser. The latter metabolite is a major precursor for Cysthat is utilized in the biosynthesis of both classes ofGSs (Fig. 6). On the other hand, Ser, the precursor forO-acetyl-Ser, was down-regulated in the ATR1-likeclade-overexpressing plants but up-regulated in plantsoverexpressing MYB28 and MYB76 from the MYB28-like clade (Fig. 8).
The TCA cycle supplies precursors to Met biosyn-thesis, and components of this pathway were inducedin plants overexpressing genes of both clades (but not
all), including fumaric acid, glutaric acid, and succinicacid (Figs. 6 and 8). Malic acid, another component ofthe TCA cycle, as well as nicotinic acid, benzoic acid,and erythritol were only induced in the MYB28-likeclade-overexpressing plants. The phenylpropanoidderivative benzoic acid is a precursor for the formationof BGs (produced typically by Arabidopsis seeds; Fig. 6),among them 3-benzoyloxypropyl glucosinolate (3BOP),which was induced in leaves of plants overexpressingthe MYB28-like clade members (Figs. 5A and 7).
Interestingly, metabolites derived from Phe weredifferentially expressed in the transgenic lines, albeitnot in the same manner among the various genotypes(Figs. 6 and 8). These included p-coumaric acid, sinapicacid derivatives (two sinapoyl Glc isomers [SGiso1 andSGiso2] and sinapoyl tartronate), feruloyl tartaric acid,and a derivative of the flavonol kaempferol. Among themetabolites that were specifically induced in plantsoverexpressing the ATR1-like clade members (and notchanged in the overexpression of the other clade), wedetected several sugars (maltotriose, galactinol, andD-Gal) and anthranilic acid, which is the precursor forTrp biosynthesis (Figs. 6 and 8; Supplemental Fig. S2).
The compound PAPS is required not only for GSbiosynthesis but also for various other sulfation reac-tions. In one such reaction, the jasmonic acid deriva-tive 12-hydroxyjasmonic acid is either sulfonated (Giddaet al., 2003) by a sulfotransferase (and PAPS) or gly-cosylated (Liechti and Farmer, 2006). Supporting thecompetition for PAPS between glycosylation and sul-fonation of 12-hydroxyjasmonic acid in Arabidop-sis leaves, we detected a decrease in the levels of12-hydroxyjasmonic acid 12-O-b-glucoside in plantsoverexpressing members of the two clades, particu-larly those of the ATR1-like clade (Figs. 6 and 8).
Expression Correlation Analysis between the TwoClade Members and the Proximal and Distal NetworkGenes in Response to Various Biological Perturbations
From the results obtained above, it was evident thatthe five GS regulators we examined act directly orindirectly to activate or repress multiple branches ofthe metabolome while controlling the balance betweenthem. In order to examine how the expression of thesix GS regulators is coordinated with the variousmetabolic processes and how these processes are co-ordinated with each other, we collected publicly avail-able Arabidopsis gene expression data that are derivedfrom hundreds of experiments and that represent 211different biological perturbations. Next, we calculatedthe correlation matrix for the six MYB transcription
Figure 8. (Continued.)analysis) independent samples; asterisks indicate values that are significantly different (P , 0.05) in comparison with the wildtype. The metabolite levels in these charts are presented as log ratios from the wild type (levels of the latter, therefore, are alwayszero). The full names of the detected compounds in this analysis are as follows: anthranilic acid (AntA), p-coumaric acid (p-CA),synapoyl-Glc (SG; isomers [iso] 1 and 2), 12-hydroxyjasmonic acid 12-O glucoside (12HJAG), feruloyl tartaric acid (FTA),kaempferol 3-O[6-O-(rhamnosyl)glucoside] 7-O-rhamnoside (K3-O-RG,7-O-R).
Transcriptome and Metabolome Affected by Glucosinolate
Plant Physiol. Vol. 148, 2008 2037
45
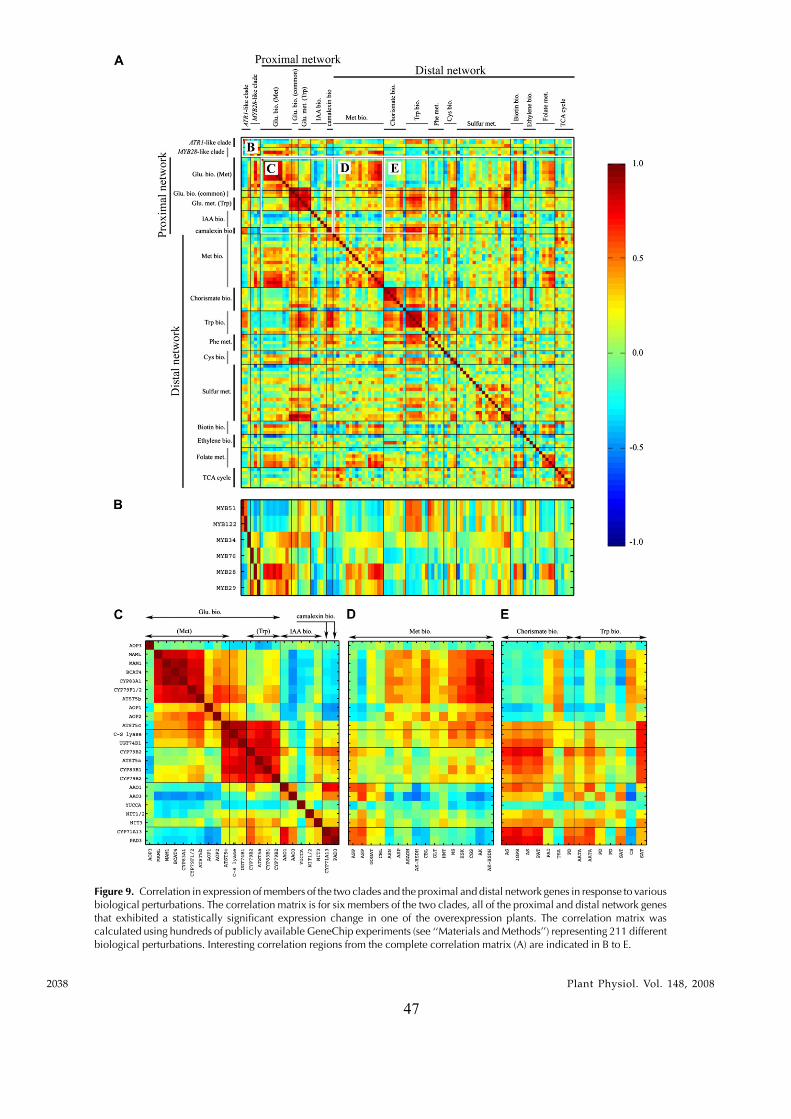
47
Figure 9. Correlation in expression of members of the two clades and the proximal and distal network genes in response to variousbiological perturbations. The correlation matrix is for six members of the two clades, all of the proximal and distal network genesthat exhibited a statistically significant expression change in one of the overexpression plants. The correlation matrix wascalculated using hundreds of publicly available GeneChip experiments (see ‘‘Materials and Methods’’) representing 211 differentbiological perturbations. Interesting correlation regions from the complete correlation matrix (A) are indicated in B to E.
2038 Plant Physiol. Vol. 148, 2008
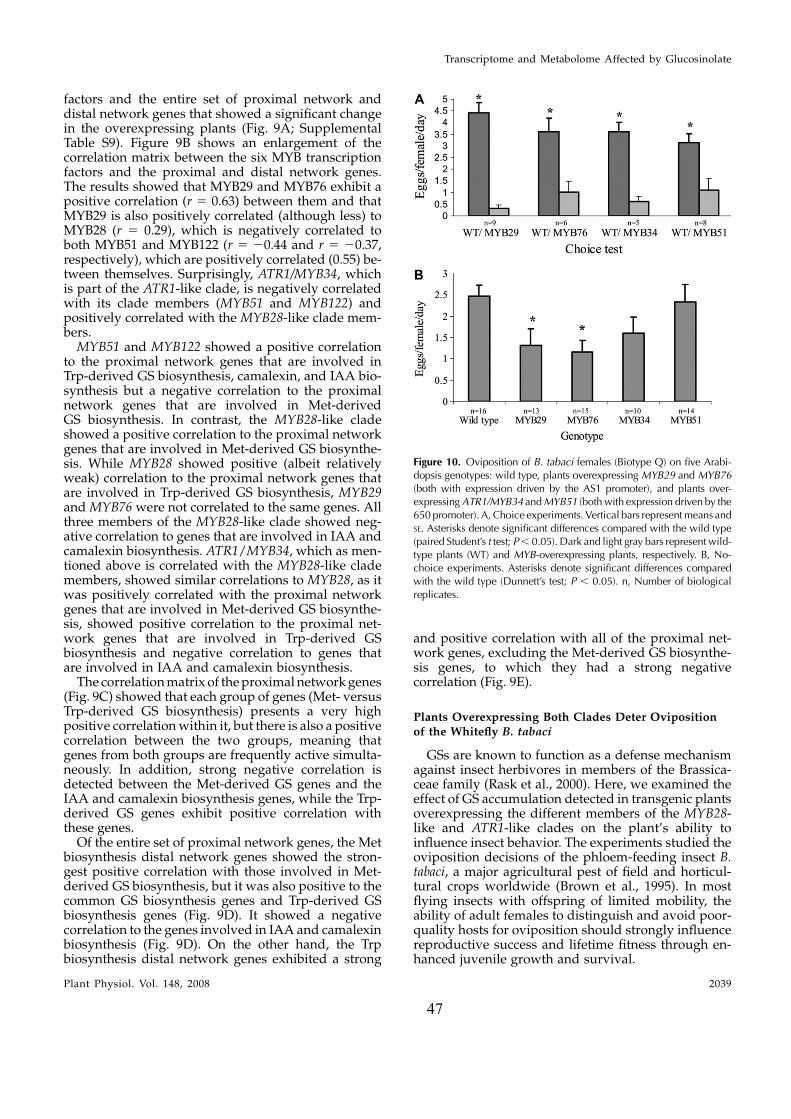
factors and the entire set of proximal network anddistal network genes that showed a significant changein the overexpressing plants (Fig. 9A; SupplementalTable S9). Figure 9B shows an enlargement of thecorrelation matrix between the six MYB transcriptionfactors and the proximal and distal network genes.The results showed that MYB29 and MYB76 exhibit apositive correlation (r 5 0.63) between them and thatMYB29 is also positively correlated (although less) toMYB28 (r 5 0.29), which is negatively correlated toboth MYB51 and MYB122 (r 5 20.44 and r 5 20.37,respectively), which are positively correlated (0.55) be-tween themselves. Surprisingly, ATR1/MYB34, whichis part of the ATR1-like clade, is negatively correlatedwith its clade members (MYB51 and MYB122) andpositively correlated with the MYB28-like clade mem-bers.
MYB51 and MYB122 showed a positive correlationto the proximal network genes that are involved inTrp-derived GS biosynthesis, camalexin, and IAA bio-synthesis but a negative correlation to the proximalnetwork genes that are involved in Met-derivedGS biosynthesis. In contrast, the MYB28-like cladeshowed a positive correlation to the proximal networkgenes that are involved in Met-derived GS biosynthe-sis. While MYB28 showed positive (albeit relativelyweak) correlation to the proximal network genes thatare involved in Trp-derived GS biosynthesis, MYB29and MYB76 were not correlated to the same genes. Allthree members of the MYB28-like clade showed neg-ative correlation to genes that are involved in IAA andcamalexin biosynthesis. ATR1/MYB34, which as men-tioned above is correlated with the MYB28-like clademembers, showed similar correlations to MYB28, as itwas positively correlated with the proximal networkgenes that are involved in Met-derived GS biosynthe-sis, showed positive correlation to the proximal net-work genes that are involved in Trp-derived GSbiosynthesis and negative correlation to genes thatare involved in IAA and camalexin biosynthesis.
The correlation matrix of the proximal network genes(Fig. 9C) showed that each group of genes (Met- versusTrp-derived GS biosynthesis) presents a very highpositive correlation within it, but there is also a positivecorrelation between the two groups, meaning thatgenes from both groups are frequently active simulta-neously. In addition, strong negative correlation isdetected between the Met-derived GS genes and theIAA and camalexin biosynthesis genes, while the Trp-derived GS genes exhibit positive correlation withthese genes.
Of the entire set of proximal network genes, the Metbiosynthesis distal network genes showed the stron-gest positive correlation with those involved in Met-derived GS biosynthesis, but it was also positive to thecommon GS biosynthesis genes and Trp-derived GSbiosynthesis genes (Fig. 9D). It showed a negativecorrelation to the genes involved in IAA and camalexinbiosynthesis (Fig. 9D). On the other hand, the Trpbiosynthesis distal network genes exhibited a strong
and positive correlation with all of the proximal net-work genes, excluding the Met-derived GS biosynthe-sis genes, to which they had a strong negativecorrelation (Fig. 9E).
Plants Overexpressing Both Clades Deter Ovipositionof the Whitefly B. tabaci
GSs are known to function as a defense mechanismagainst insect herbivores in members of the Brassica-ceae family (Rask et al., 2000). Here, we examined theeffect of GS accumulation detected in transgenic plantsoverexpressing the different members of the MYB28-like and ATR1-like clades on the plant’s ability toinfluence insect behavior. The experiments studied theoviposition decisions of the phloem-feeding insect B.tabaci, a major agricultural pest of field and horticul-tural crops worldwide (Brown et al., 1995). In mostflying insects with offspring of limited mobility, theability of adult females to distinguish and avoid poor-quality hosts for oviposition should strongly influencereproductive success and lifetime fitness through en-hanced juvenile growth and survival.
Figure 10. Oviposition of B. tabaci females (Biotype Q) on five Arabi-dopsis genotypes: wild type, plants overexpressing MYB29 and MYB76(both with expression driven by the AS1 promoter), and plants over-expressing ATR1/MYB34 and MYB51 (both with expression driven by the650 promoter). A, Choice experiments. Vertical bars represent means andSE. Asterisks denote significant differences compared with the wild type(paired Student’s t test; P , 0.05). Dark and light gray bars represent wild-type plants (WT) and MYB-overexpressing plants, respectively. B, No-choice experiments. Asterisks denote significant differences comparedwith the wild type (Dunnett’s test; P , 0.05). n, Number of biologicalreplicates.
Transcriptome and Metabolome Affected by Glucosinolate
Plant Physiol. Vol. 148, 2008 2039
47
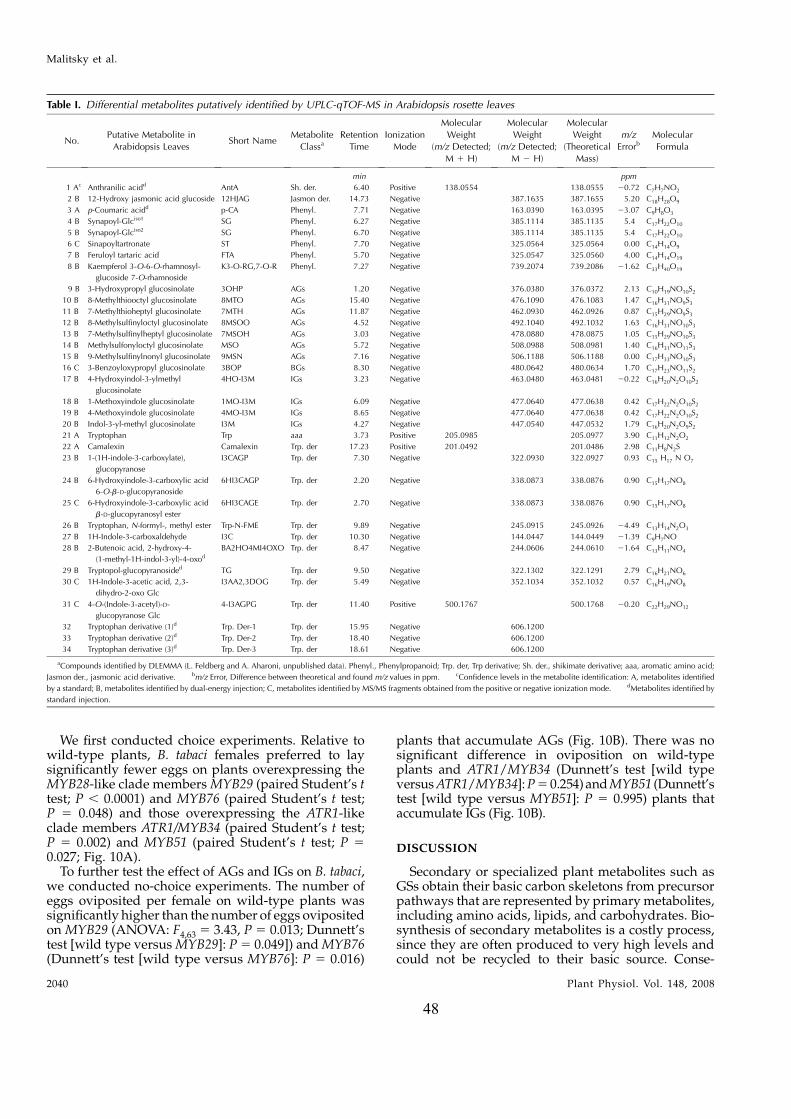
We first conducted choice experiments. Relative towild-type plants, B. tabaci females preferred to laysignificantly fewer eggs on plants overexpressing theMYB28-like clade members MYB29 (paired Student’s ttest; P , 0.0001) and MYB76 (paired Student’s t test;P 5 0.048) and those overexpressing the ATR1-likeclade members ATR1/MYB34 (paired Student’s t test;P 5 0.002) and MYB51 (paired Student’s t test; P 50.027; Fig. 10A).
To further test the effect of AGs and IGs on B. tabaci,we conducted no-choice experiments. The number ofeggs oviposited per female on wild-type plants wassignificantly higher than the number of eggs ovipositedon MYB29 (ANOVA: F4,63 5 3.43, P 5 0.013; Dunnett’stest [wild type versus MYB29]: P 5 0.049]) and MYB76(Dunnett’s test [wild type versus MYB76]: P 5 0.016)
plants that accumulate AGs (Fig. 10B). There was nosignificant difference in oviposition on wild-typeplants and ATR1/MYB34 (Dunnett’s test [wild typeversus ATR1/MYB34]: P 5 0.254) and MYB51 (Dunnett’stest [wild type versus MYB51]: P 5 0.995) plants thataccumulate IGs (Fig. 10B).
DISCUSSION
Secondary or specialized plant metabolites such asGSs obtain their basic carbon skeletons from precursorpathways that are represented by primary metabolites,including amino acids, lipids, and carbohydrates. Bio-synthesis of secondary metabolites is a costly process,since they are often produced to very high levels andcould not be recycled to their basic source. Conse-
Table I. Differential metabolites putatively identified by UPLC-qTOF-MS in Arabidopsis rosette leaves
No.Putative Metabolite in
Arabidopsis LeavesShort Name
Metabolite
ClassaRetention
Time
Ionization
Mode
Molecular
Weight
(m/z Detected;
M 1 H)
Molecular
Weight
(m/z Detected;
M 2 H)
Molecular
Weight
(Theoretical
Mass)
m/z
ErrorbMolecular
Formula
min ppm
1 Ac Anthranilic acidd AntA Sh. der. 6.40 Positive 138.0554 138.0555 20.72 C7H7NO2
2 B 12-Hydroxy jasmonic acid glucoside 12HJAG Jasmon der. 14.73 Negative 387.1635 387.1655 5.20 C18H28O9
3 A p-Coumaric acidd p-CA Phenyl. 7.71 Negative 163.0390 163.0395 23.07 C9H8O3
4 B Synapoyl-Glciso1 SG Phenyl. 6.27 Negative 385.1114 385.1135 5.4 C17H22O10
5 B Synapoyl-Glciso2 SG Phenyl. 6.70 Negative 385.1114 385.1135 5.4 C17H22O10
6 C Sinapoyltartronate ST Phenyl. 7.70 Negative 325.0564 325.0564 0.00 C14H14O9
7 B Feruloyl tartaric acid FTA Phenyl. 5.70 Negative 325.0547 325.0560 4.00 C14H14O19
8 B Kaempferol 3-O-6-O-rhamnosyl-
glucoside 7-O-rhamnoside
K3-O-RG,7-O-R Phenyl. 7.27 Negative 739.2074 739.2086 21.62 C33H40O19
9 B 3-Hydroxypropyl glucosinolate 3OHP AGs 1.20 Negative 376.0380 376.0372 2.13 C10H19NO10S2
10 B 8-Methylthiooctyl glucosinolate 8MTO AGs 15.40 Negative 476.1090 476.1083 1.47 C16H31NO9S3
11 B 7-Methylthioheptyl glucosinolate 7MTH AGs 11.87 Negative 462.0930 462.0926 0.87 C15H29NO9S3
12 B 8-Methylsulfinyloctyl glucosinolate 8MSOO AGs 4.52 Negative 492.1040 492.1032 1.63 C16H31NO10S3
13 B 7-Methylsulfinylheptyl glucosinolate 7MSOH AGs 3.03 Negative 478.0880 478.0875 1.05 C15H29NO10S3
14 B Methylsulfonyloctyl glucosinolate MSO AGs 5.72 Negative 508.0988 508.0981 1.40 C16H31NO11S3
15 B 9-Methylsulfinylnonyl glucosinolate 9MSN AGs 7.16 Negative 506.1188 506.1188 0.00 C17H33NO10S3
16 C 3-Benzoyloxypropyl glucosinolate 3BOP BGs 8.30 Negative 480.0642 480.0634 1.70 C17H23NO11S2
17 B 4-Hydroxyindol-3-ylmethyl
glucosinolate
4HO-I3M IGs 3.23 Negative 463.0480 463.0481 20.22 C16H20N2O10S2
18 B 1-Methoxyindole glucosinolate 1MO-I3M IGs 6.09 Negative 477.0640 477.0638 0.42 C17H22N2O10S2
19 B 4-Methoxyindole glucosinolate 4MO-I3M IGs 8.65 Negative 477.0640 477.0638 0.42 C17H22N2O10S2
20 B Indol-3-yl-methyl glucosinolate I3M IGs 4.27 Negative 447.0540 447.0532 1.79 C16H20N2O9S2
21 A Tryptophan Trp aaa 3.73 Positive 205.0985 205.0977 3.90 C11H12N2O2
22 A Camalexin Camalexin Trp. der 17.23 Positive 201.0492 201.0486 2.98 C11H8N2S
23 B 1-(1H-indole-3-carboxylate),
glucopyranose
I3CAGP Trp. der 7.30 Negative 322.0930 322.0927 0.93 C15 H17 N O7
24 B 6-Hydroxyindole-3-carboxylic acid
6-O-b-D-glucopyranoside
6HI3CAGP Trp. der 2.20 Negative 338.0873 338.0876 0.90 C15H17NO8
25 C 6-Hydroxyindole-3-carboxylic acid
b-D-glucopyranosyl ester
6HI3CAGE Trp. der 2.70 Negative 338.0873 338.0876 0.90 C15H17NO8
26 B Tryptophan, N-formyl-, methyl ester Trp-N-FME Trp. der 9.89 Negative 245.0915 245.0926 24.49 C13H14N2O3
27 B 1H-Indole-3-carboxaldehyde I3C Trp. der 10.30 Negative 144.0447 144.0449 21.39 C9H7NO
28 B 2-Butenoic acid, 2-hydroxy-4-
(1-methyl-1H-indol-3-yl)-4-oxod
BA2HO4MI4OXO Trp. der 8.47 Negative 244.0606 244.0610 21.64 C13H11NO4
29 B Tryptopol-glucopyranosided TG Trp. der 9.50 Negative 322.1302 322.1291 2.79 C16H21NO6
30 C 1H-Indole-3-acetic acid, 2,3-
dihydro-2-oxo Glc
I3AA2,3DOG Trp. der 5.49 Negative 352.1034 352.1032 0.57 C16H19NO8
31 C 4-O-(Indole-3-acetyl)-D-
glucopyranose Glc
4-I3AGPG Trp. der 11.40 Positive 500.1767 500.1768 20.20 C22H29NO12
32 Tryptophan derivative (1)d Trp. Der-1 Trp. der 15.95 Negative 606.1200
33 Tryptophan derivative (2)d Trp. Der-2 Trp. der 18.40 Negative 606.1200
34 Tryptophan derivative (3)d Trp. Der-3 Trp. der 18.61 Negative 606.1200
aCompounds identified by DLEMMA (L. Feldberg and A. Aharoni, unpublished data). Phenyl., Phenylpropanoid; Trp. der, Trp derivative; Sh. der., shikimate derivative; aaa, aromatic amino acid;
Jasmon der., jasmonic acid derivative. bm/z Error, Difference between theoretical and found m/z values in ppm. cConfidence levels in the metabolite identification: A, metabolites identified
by a standard; B, metabolites identified by dual-energy injection; C, metabolites identified by MS/MS fragments obtained from the positive or negative ionization mode. dMetabolites identified by
standard injection.
Malitsky et al.
2040 Plant Physiol. Vol. 148, 2008
48
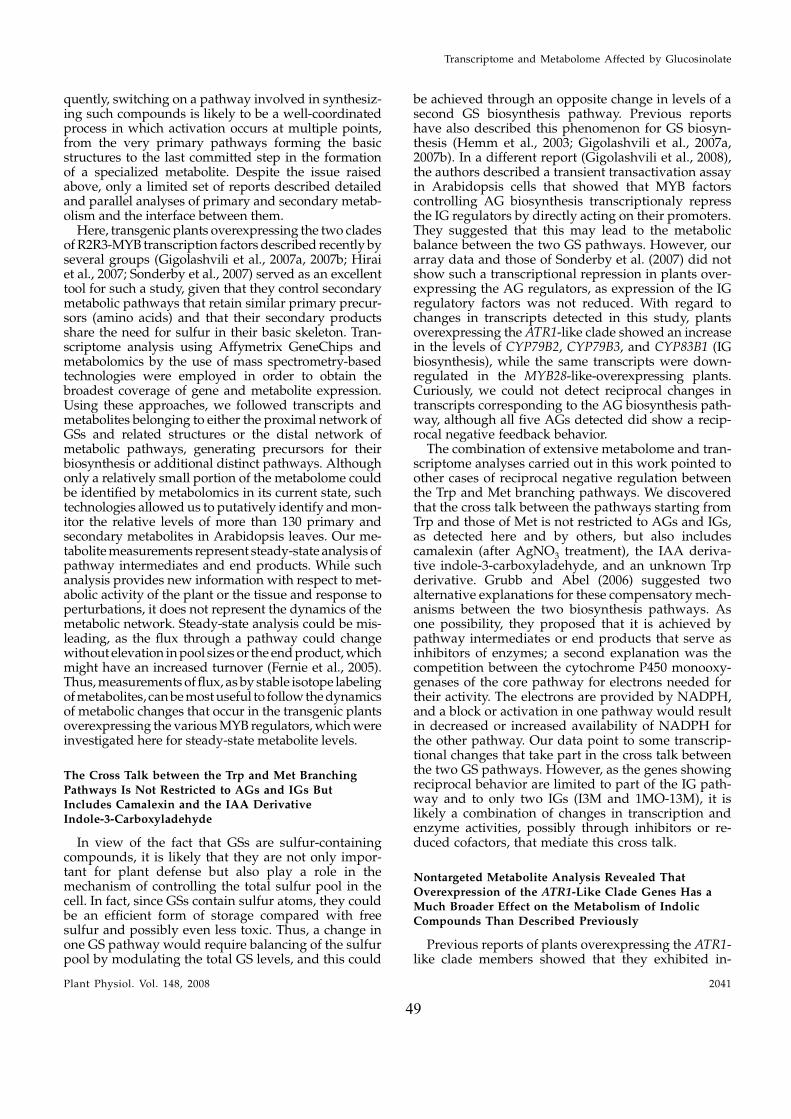
quently, switching on a pathway involved in synthesiz-ing such compounds is likely to be a well-coordinatedprocess in which activation occurs at multiple points,from the very primary pathways forming the basicstructures to the last committed step in the formationof a specialized metabolite. Despite the issue raisedabove, only a limited set of reports described detailedand parallel analyses of primary and secondary metab-olism and the interface between them.
Here, transgenic plants overexpressing the two cladesof R2R3-MYB transcription factors described recently byseveral groups (Gigolashvili et al., 2007a, 2007b; Hiraiet al., 2007; Sonderby et al., 2007) served as an excellenttool for such a study, given that they control secondarymetabolic pathways that retain similar primary precur-sors (amino acids) and that their secondary productsshare the need for sulfur in their basic skeleton. Tran-scriptome analysis using Affymetrix GeneChips andmetabolomics by the use of mass spectrometry-basedtechnologies were employed in order to obtain thebroadest coverage of gene and metabolite expression.Using these approaches, we followed transcripts andmetabolites belonging to either the proximal network ofGSs and related structures or the distal network ofmetabolic pathways, generating precursors for theirbiosynthesis or additional distinct pathways. Althoughonly a relatively small portion of the metabolome couldbe identified by metabolomics in its current state, suchtechnologies allowed us to putatively identify and mon-itor the relative levels of more than 130 primary andsecondary metabolites in Arabidopsis leaves. Our me-tabolite measurements represent steady-state analysis ofpathway intermediates and end products. While suchanalysis provides new information with respect to met-abolic activity of the plant or the tissue and response toperturbations, it does not represent the dynamics of themetabolic network. Steady-state analysis could be mis-leading, as the flux through a pathway could changewithout elevation in pool sizes or the end product, whichmight have an increased turnover (Fernie et al., 2005).Thus, measurements of flux, as by stable isotope labelingof metabolites, can be most useful to follow the dynamicsof metabolic changes that occur in the transgenic plantsoverexpressing the various MYB regulators, which wereinvestigated here for steady-state metabolite levels.
The Cross Talk between the Trp and Met Branching
Pathways Is Not Restricted to AGs and IGs ButIncludes Camalexin and the IAA DerivativeIndole-3-Carboxyladehyde
In view of the fact that GSs are sulfur-containingcompounds, it is likely that they are not only impor-tant for plant defense but also play a role in themechanism of controlling the total sulfur pool in thecell. In fact, since GSs contain sulfur atoms, they couldbe an efficient form of storage compared with freesulfur and possibly even less toxic. Thus, a change inone GS pathway would require balancing of the sulfurpool by modulating the total GS levels, and this could
be achieved through an opposite change in levels of asecond GS biosynthesis pathway. Previous reportshave also described this phenomenon for GS biosyn-thesis (Hemm et al., 2003; Gigolashvili et al., 2007a,2007b). In a different report (Gigolashvili et al., 2008),the authors described a transient transactivation assayin Arabidopsis cells that showed that MYB factorscontrolling AG biosynthesis transcriptionaly repressthe IG regulators by directly acting on their promoters.They suggested that this may lead to the metabolicbalance between the two GS pathways. However, ourarray data and those of Sonderby et al. (2007) did notshow such a transcriptional repression in plants over-expressing the AG regulators, as expression of the IGregulatory factors was not reduced. With regard tochanges in transcripts detected in this study, plantsoverexpressing the ATR1-like clade showed an increasein the levels of CYP79B2, CYP79B3, and CYP83B1 (IGbiosynthesis), while the same transcripts were down-regulated in the MYB28-like-overexpressing plants.Curiously, we could not detect reciprocal changes intranscripts corresponding to the AG biosynthesis path-way, although all five AGs detected did show a recip-rocal negative feedback behavior.
The combination of extensive metabolome and tran-scriptome analyses carried out in this work pointed toother cases of reciprocal negative regulation betweenthe Trp and Met branching pathways. We discoveredthat the cross talk between the pathways starting fromTrp and those of Met is not restricted to AGs and IGs,as detected here and by others, but also includescamalexin (after AgNO3 treatment), the IAA deriva-tive indole-3-carboxyladehyde, and an unknown Trpderivative. Grubb and Abel (2006) suggested twoalternative explanations for these compensatory mech-anisms between the two biosynthesis pathways. Asone possibility, they proposed that it is achieved bypathway intermediates or end products that serve asinhibitors of enzymes; a second explanation was thecompetition between the cytochrome P450 monooxy-genases of the core pathway for electrons needed fortheir activity. The electrons are provided by NADPH,and a block or activation in one pathway would resultin decreased or increased availability of NADPH forthe other pathway. Our data point to some transcrip-tional changes that take part in the cross talk betweenthe two GS pathways. However, as the genes showingreciprocal behavior are limited to part of the IG path-way and to only two IGs (I3M and 1MO-13M), it islikely a combination of changes in transcription andenzyme activities, possibly through inhibitors or re-duced cofactors, that mediate this cross talk.
Nontargeted Metabolite Analysis Revealed That
Overexpression of the ATR1-Like Clade Genes Has aMuch Broader Effect on the Metabolism of IndolicCompounds Than Described Previously
Previous reports of plants overexpressing the ATR1-like clade members showed that they exhibited in-
Transcriptome and Metabolome Affected by Glucosinolate
Plant Physiol. Vol. 148, 2008 2041
49
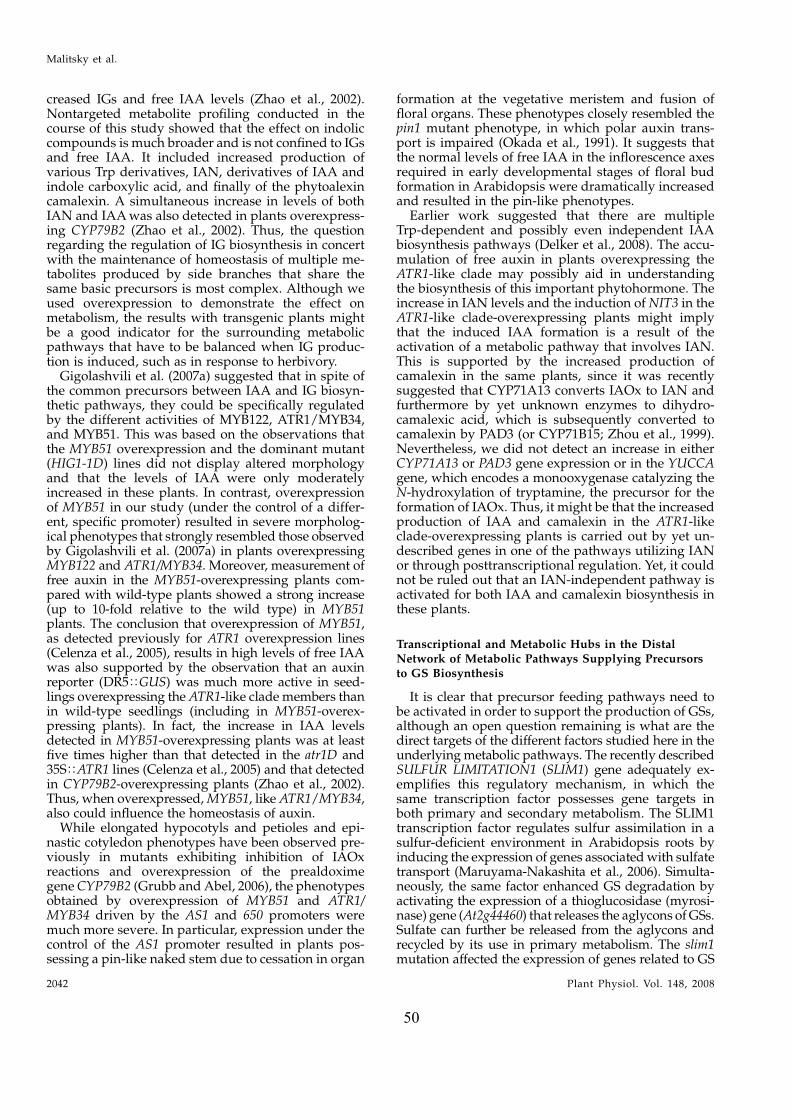
creased IGs and free IAA levels (Zhao et al., 2002).Nontargeted metabolite profiling conducted in thecourse of this study showed that the effect on indoliccompounds is much broader and is not confined to IGsand free IAA. It included increased production ofvarious Trp derivatives, IAN, derivatives of IAA andindole carboxylic acid, and finally of the phytoalexincamalexin. A simultaneous increase in levels of bothIAN and IAA was also detected in plants overexpress-ing CYP79B2 (Zhao et al., 2002). Thus, the questionregarding the regulation of IG biosynthesis in concertwith the maintenance of homeostasis of multiple me-tabolites produced by side branches that share thesame basic precursors is most complex. Although weused overexpression to demonstrate the effect onmetabolism, the results with transgenic plants mightbe a good indicator for the surrounding metabolicpathways that have to be balanced when IG produc-tion is induced, such as in response to herbivory.
Gigolashvili et al. (2007a) suggested that in spite ofthe common precursors between IAA and IG biosyn-thetic pathways, they could be specifically regulatedby the different activities of MYB122, ATR1/MYB34,and MYB51. This was based on the observations thatthe MYB51 overexpression and the dominant mutant(HIG1-1D) lines did not display altered morphologyand that the levels of IAA were only moderatelyincreased in these plants. In contrast, overexpressionof MYB51 in our study (under the control of a differ-ent, specific promoter) resulted in severe morpholog-ical phenotypes that strongly resembled those observedby Gigolashvili et al. (2007a) in plants overexpressingMYB122 and ATR1/MYB34. Moreover, measurement offree auxin in the MYB51-overexpressing plants com-pared with wild-type plants showed a strong increase(up to 10-fold relative to the wild type) in MYB51plants. The conclusion that overexpression of MYB51,as detected previously for ATR1 overexpression lines(Celenza et al., 2005), results in high levels of free IAAwas also supported by the observation that an auxinreporter (DR5TGUS) was much more active in seed-lings overexpressing the ATR1-like clade members thanin wild-type seedlings (including in MYB51-overex-pressing plants). In fact, the increase in IAA levelsdetected in MYB51-overexpressing plants was at leastfive times higher than that detected in the atr1D and35STATR1 lines (Celenza et al., 2005) and that detectedin CYP79B2-overexpressing plants (Zhao et al., 2002).Thus, when overexpressed, MYB51, like ATR1/MYB34,also could influence the homeostasis of auxin.
While elongated hypocotyls and petioles and epi-nastic cotyledon phenotypes have been observed pre-viously in mutants exhibiting inhibition of IAOxreactions and overexpression of the prealdoximegene CYP79B2 (Grubb and Abel, 2006), the phenotypesobtained by overexpression of MYB51 and ATR1/MYB34 driven by the AS1 and 650 promoters weremuch more severe. In particular, expression under thecontrol of the AS1 promoter resulted in plants pos-sessing a pin-like naked stem due to cessation in organ
formation at the vegetative meristem and fusion offloral organs. These phenotypes closely resembled thepin1 mutant phenotype, in which polar auxin trans-port is impaired (Okada et al., 1991). It suggests thatthe normal levels of free IAA in the inflorescence axesrequired in early developmental stages of floral budformation in Arabidopsis were dramatically increasedand resulted in the pin-like phenotypes.
Earlier work suggested that there are multipleTrp-dependent and possibly even independent IAAbiosynthesis pathways (Delker et al., 2008). The accu-mulation of free auxin in plants overexpressing theATR1-like clade may possibly aid in understandingthe biosynthesis of this important phytohormone. Theincrease in IAN levels and the induction of NIT3 in theATR1-like clade-overexpressing plants might implythat the induced IAA formation is a result of theactivation of a metabolic pathway that involves IAN.This is supported by the increased production ofcamalexin in the same plants, since it was recentlysuggested that CYP71A13 converts IAOx to IAN andfurthermore by yet unknown enzymes to dihydro-camalexic acid, which is subsequently converted tocamalexin by PAD3 (or CYP71B15; Zhou et al., 1999).Nevertheless, we did not detect an increase in eitherCYP71A13 or PAD3 gene expression or in the YUCCAgene, which encodes a monooxygenase catalyzing theN-hydroxylation of tryptamine, the precursor for theformation of IAOx. Thus, it might be that the increasedproduction of IAA and camalexin in the ATR1-likeclade-overexpressing plants is carried out by yet un-described genes in one of the pathways utilizing IANor through posttranscriptional regulation. Yet, it couldnot be ruled out that an IAN-independent pathway isactivated for both IAA and camalexin biosynthesis inthese plants.
Transcriptional and Metabolic Hubs in the DistalNetwork of Metabolic Pathways Supplying Precursorsto GS Biosynthesis
It is clear that precursor feeding pathways need tobe activated in order to support the production of GSs,although an open question remaining is what are thedirect targets of the different factors studied here in theunderlying metabolic pathways. The recently describedSULFUR LIMITATION1 (SLIM1) gene adequately ex-emplifies this regulatory mechanism, in which thesame transcription factor possesses gene targets inboth primary and secondary metabolism. The SLIM1transcription factor regulates sulfur assimilation in asulfur-deficient environment in Arabidopsis roots byinducing the expression of genes associated with sulfatetransport (Maruyama-Nakashita et al., 2006). Simulta-neously, the same factor enhanced GS degradation byactivating the expression of a thioglucosidase (myrosi-nase) gene (At2g44460) that releases the aglycons of GSs.Sulfate can further be released from the aglycons andrecycled by its use in primary metabolism. The slim1mutation affected the expression of genes related to GS
Malitsky et al.
2042 Plant Physiol. Vol. 148, 2008
50
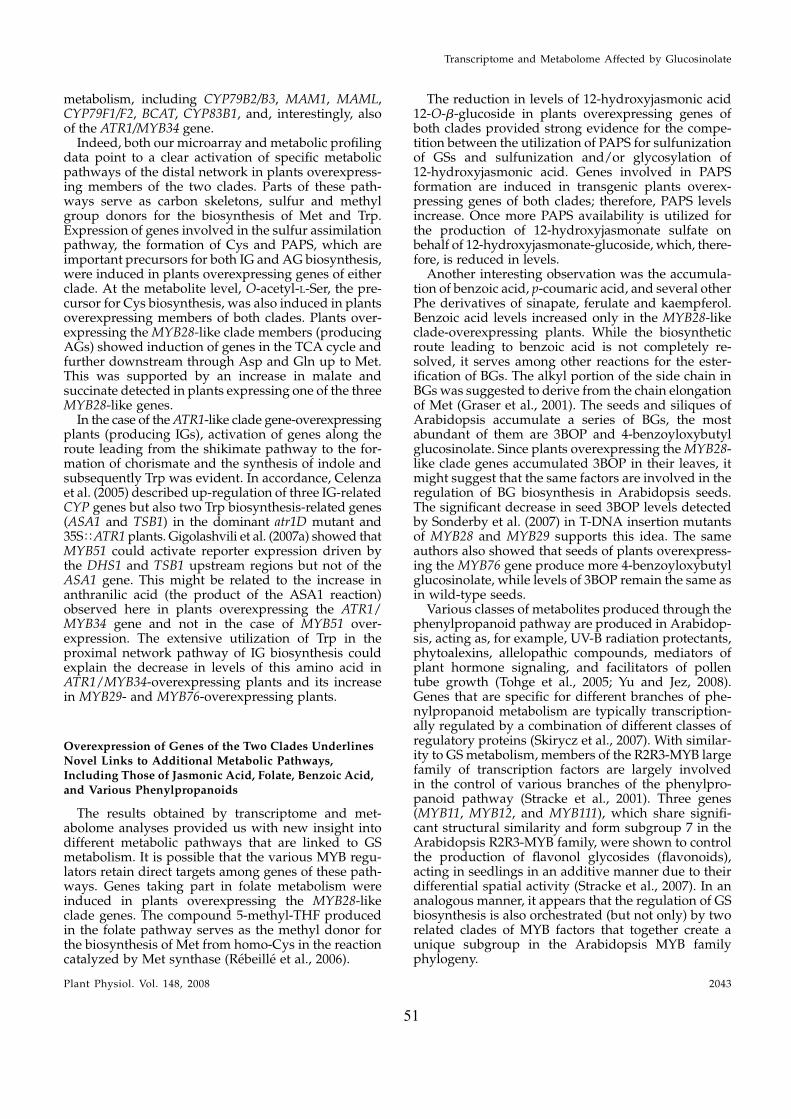
metabolism, including CYP79B2/B3, MAM1, MAML,CYP79F1/F2, BCAT, CYP83B1, and, interestingly, alsoof the ATR1/MYB34 gene.
Indeed, both our microarray and metabolic profilingdata point to a clear activation of specific metabolicpathways of the distal network in plants overexpress-ing members of the two clades. Parts of these path-ways serve as carbon skeletons, sulfur and methylgroup donors for the biosynthesis of Met and Trp.Expression of genes involved in the sulfur assimilationpathway, the formation of Cys and PAPS, which areimportant precursors for both IG and AG biosynthesis,were induced in plants overexpressing genes of eitherclade. At the metabolite level, O-acetyl-L-Ser, the pre-cursor for Cys biosynthesis, was also induced in plantsoverexpressing members of both clades. Plants over-expressing the MYB28-like clade members (producingAGs) showed induction of genes in the TCA cycle andfurther downstream through Asp and Gln up to Met.This was supported by an increase in malate andsuccinate detected in plants expressing one of the threeMYB28-like genes.
In the case of the ATR1-like clade gene-overexpressingplants (producing IGs), activation of genes along theroute leading from the shikimate pathway to the for-mation of chorismate and the synthesis of indole andsubsequently Trp was evident. In accordance, Celenzaet al. (2005) described up-regulation of three IG-relatedCYP genes but also two Trp biosynthesis-related genes(ASA1 and TSB1) in the dominant atr1D mutant and35STATR1 plants. Gigolashvili et al. (2007a) showed thatMYB51 could activate reporter expression driven bythe DHS1 and TSB1 upstream regions but not of theASA1 gene. This might be related to the increase inanthranilic acid (the product of the ASA1 reaction)observed here in plants overexpressing the ATR1/MYB34 gene and not in the case of MYB51 over-expression. The extensive utilization of Trp in theproximal network pathway of IG biosynthesis couldexplain the decrease in levels of this amino acid inATR1/MYB34-overexpressing plants and its increasein MYB29- and MYB76-overexpressing plants.
Overexpression of Genes of the Two Clades UnderlinesNovel Links to Additional Metabolic Pathways,Including Those of Jasmonic Acid, Folate, Benzoic Acid,
and Various Phenylpropanoids
The results obtained by transcriptome and met-abolome analyses provided us with new insight intodifferent metabolic pathways that are linked to GSmetabolism. It is possible that the various MYB regu-lators retain direct targets among genes of these path-ways. Genes taking part in folate metabolism wereinduced in plants overexpressing the MYB28-likeclade genes. The compound 5-methyl-THF producedin the folate pathway serves as the methyl donor forthe biosynthesis of Met from homo-Cys in the reactioncatalyzed by Met synthase (Rebeille et al., 2006).
The reduction in levels of 12-hydroxyjasmonic acid12-O-b-glucoside in plants overexpressing genes ofboth clades provided strong evidence for the compe-tition between the utilization of PAPS for sulfunizationof GSs and sulfunization and/or glycosylation of12-hydroxyjasmonic acid. Genes involved in PAPSformation are induced in transgenic plants overex-pressing genes of both clades; therefore, PAPS levelsincrease. Once more PAPS availability is utilized forthe production of 12-hydroxyjasmonate sulfate onbehalf of 12-hydroxyjasmonate-glucoside, which, there-fore, is reduced in levels.
Another interesting observation was the accumula-tion of benzoic acid, p-coumaric acid, and several otherPhe derivatives of sinapate, ferulate and kaempferol.Benzoic acid levels increased only in the MYB28-likeclade-overexpressing plants. While the biosyntheticroute leading to benzoic acid is not completely re-solved, it serves among other reactions for the ester-ification of BGs. The alkyl portion of the side chain inBGs was suggested to derive from the chain elongationof Met (Graser et al., 2001). The seeds and siliques ofArabidopsis accumulate a series of BGs, the mostabundant of them are 3BOP and 4-benzoyloxybutylglucosinolate. Since plants overexpressing the MYB28-like clade genes accumulated 3BOP in their leaves, itmight suggest that the same factors are involved in theregulation of BG biosynthesis in Arabidopsis seeds.The significant decrease in seed 3BOP levels detectedby Sonderby et al. (2007) in T-DNA insertion mutantsof MYB28 and MYB29 supports this idea. The sameauthors also showed that seeds of plants overexpress-ing the MYB76 gene produce more 4-benzoyloxybutylglucosinolate, while levels of 3BOP remain the same asin wild-type seeds.
Various classes of metabolites produced through thephenylpropanoid pathway are produced in Arabidop-sis, acting as, for example, UV-B radiation protectants,phytoalexins, allelopathic compounds, mediators ofplant hormone signaling, and facilitators of pollentube growth (Tohge et al., 2005; Yu and Jez, 2008).Genes that are specific for different branches of phe-nylpropanoid metabolism are typically transcription-ally regulated by a combination of different classes ofregulatory proteins (Skirycz et al., 2007). With similar-ity to GS metabolism, members of the R2R3-MYB largefamily of transcription factors are largely involvedin the control of various branches of the phenylpro-panoid pathway (Stracke et al., 2001). Three genes(MYB11, MYB12, and MYB111), which share signifi-cant structural similarity and form subgroup 7 in theArabidopsis R2R3-MYB family, were shown to controlthe production of flavonol glycosides (flavonoids),acting in seedlings in an additive manner due to theirdifferential spatial activity (Stracke et al., 2007). In ananalogous manner, it appears that the regulation of GSbiosynthesis is also orchestrated (but not only) by tworelated clades of MYB factors that together create aunique subgroup in the Arabidopsis MYB familyphylogeny.
Transcriptome and Metabolome Affected by Glucosinolate
Plant Physiol. Vol. 148, 2008 2043
51
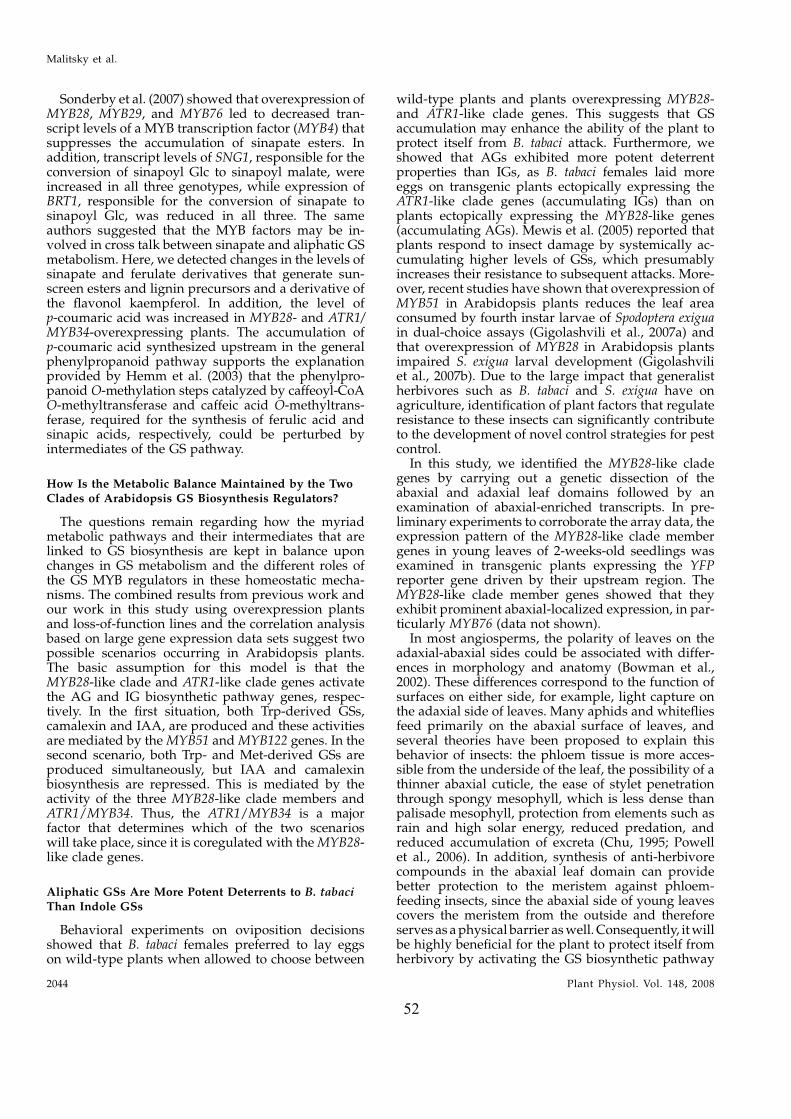
Sonderby et al. (2007) showed that overexpression ofMYB28, MYB29, and MYB76 led to decreased tran-script levels of a MYB transcription factor (MYB4) thatsuppresses the accumulation of sinapate esters. Inaddition, transcript levels of SNG1, responsible for theconversion of sinapoyl Glc to sinapoyl malate, wereincreased in all three genotypes, while expression ofBRT1, responsible for the conversion of sinapate tosinapoyl Glc, was reduced in all three. The sameauthors suggested that the MYB factors may be in-volved in cross talk between sinapate and aliphatic GSmetabolism. Here, we detected changes in the levels ofsinapate and ferulate derivatives that generate sun-screen esters and lignin precursors and a derivative ofthe flavonol kaempferol. In addition, the level ofp-coumaric acid was increased in MYB28- and ATR1/MYB34-overexpressing plants. The accumulation ofp-coumaric acid synthesized upstream in the generalphenylpropanoid pathway supports the explanationprovided by Hemm et al. (2003) that the phenylpro-panoid O-methylation steps catalyzed by caffeoyl-CoAO-methyltransferase and caffeic acid O-methyltrans-ferase, required for the synthesis of ferulic acid andsinapic acids, respectively, could be perturbed byintermediates of the GS pathway.
How Is the Metabolic Balance Maintained by the TwoClades of Arabidopsis GS Biosynthesis Regulators?
The questions remain regarding how the myriadmetabolic pathways and their intermediates that arelinked to GS biosynthesis are kept in balance uponchanges in GS metabolism and the different roles ofthe GS MYB regulators in these homeostatic mecha-nisms. The combined results from previous work andour work in this study using overexpression plantsand loss-of-function lines and the correlation analysisbased on large gene expression data sets suggest twopossible scenarios occurring in Arabidopsis plants.The basic assumption for this model is that theMYB28-like clade and ATR1-like clade genes activatethe AG and IG biosynthetic pathway genes, respec-tively. In the first situation, both Trp-derived GSs,camalexin and IAA, are produced and these activitiesare mediated by the MYB51 and MYB122 genes. In thesecond scenario, both Trp- and Met-derived GSs areproduced simultaneously, but IAA and camalexinbiosynthesis are repressed. This is mediated by theactivity of the three MYB28-like clade members andATR1/MYB34. Thus, the ATR1/MYB34 is a majorfactor that determines which of the two scenarioswill take place, since it is coregulated with the MYB28-like clade genes.
Aliphatic GSs Are More Potent Deterrents to B. tabaciThan Indole GSs
Behavioral experiments on oviposition decisionsshowed that B. tabaci females preferred to lay eggson wild-type plants when allowed to choose between
wild-type plants and plants overexpressing MYB28-and ATR1-like clade genes. This suggests that GSaccumulation may enhance the ability of the plant toprotect itself from B. tabaci attack. Furthermore, weshowed that AGs exhibited more potent deterrentproperties than IGs, as B. tabaci females laid moreeggs on transgenic plants ectopically expressing theATR1-like clade genes (accumulating IGs) than onplants ectopically expressing the MYB28-like genes(accumulating AGs). Mewis et al. (2005) reported thatplants respond to insect damage by systemically ac-cumulating higher levels of GSs, which presumablyincreases their resistance to subsequent attacks. More-over, recent studies have shown that overexpression ofMYB51 in Arabidopsis plants reduces the leaf areaconsumed by fourth instar larvae of Spodoptera exiguain dual-choice assays (Gigolashvili et al., 2007a) andthat overexpression of MYB28 in Arabidopsis plantsimpaired S. exigua larval development (Gigolashviliet al., 2007b). Due to the large impact that generalistherbivores such as B. tabaci and S. exigua have onagriculture, identification of plant factors that regulateresistance to these insects can significantly contributeto the development of novel control strategies for pestcontrol.
In this study, we identified the MYB28-like cladegenes by carrying out a genetic dissection of theabaxial and adaxial leaf domains followed by anexamination of abaxial-enriched transcripts. In pre-liminary experiments to corroborate the array data, theexpression pattern of the MYB28-like clade membergenes in young leaves of 2-weeks-old seedlings wasexamined in transgenic plants expressing the YFPreporter gene driven by their upstream region. TheMYB28-like clade member genes showed that theyexhibit prominent abaxial-localized expression, in par-ticularly MYB76 (data not shown).
In most angiosperms, the polarity of leaves on theadaxial-abaxial sides could be associated with differ-ences in morphology and anatomy (Bowman et al.,2002). These differences correspond to the function ofsurfaces on either side, for example, light capture onthe adaxial side of leaves. Many aphids and whitefliesfeed primarily on the abaxial surface of leaves, andseveral theories have been proposed to explain thisbehavior of insects: the phloem tissue is more acces-sible from the underside of the leaf, the possibility of athinner abaxial cuticle, the ease of stylet penetrationthrough spongy mesophyll, which is less dense thanpalisade mesophyll, protection from elements such asrain and high solar energy, reduced predation, andreduced accumulation of excreta (Chu, 1995; Powellet al., 2006). In addition, synthesis of anti-herbivorecompounds in the abaxial leaf domain can providebetter protection to the meristem against phloem-feeding insects, since the abaxial side of young leavescovers the meristem from the outside and thereforeserves as a physical barrier as well. Consequently, it willbe highly beneficial for the plant to protect itself fromherbivory by activating the GS biosynthetic pathway
Malitsky et al.
2044 Plant Physiol. Vol. 148, 2008
52
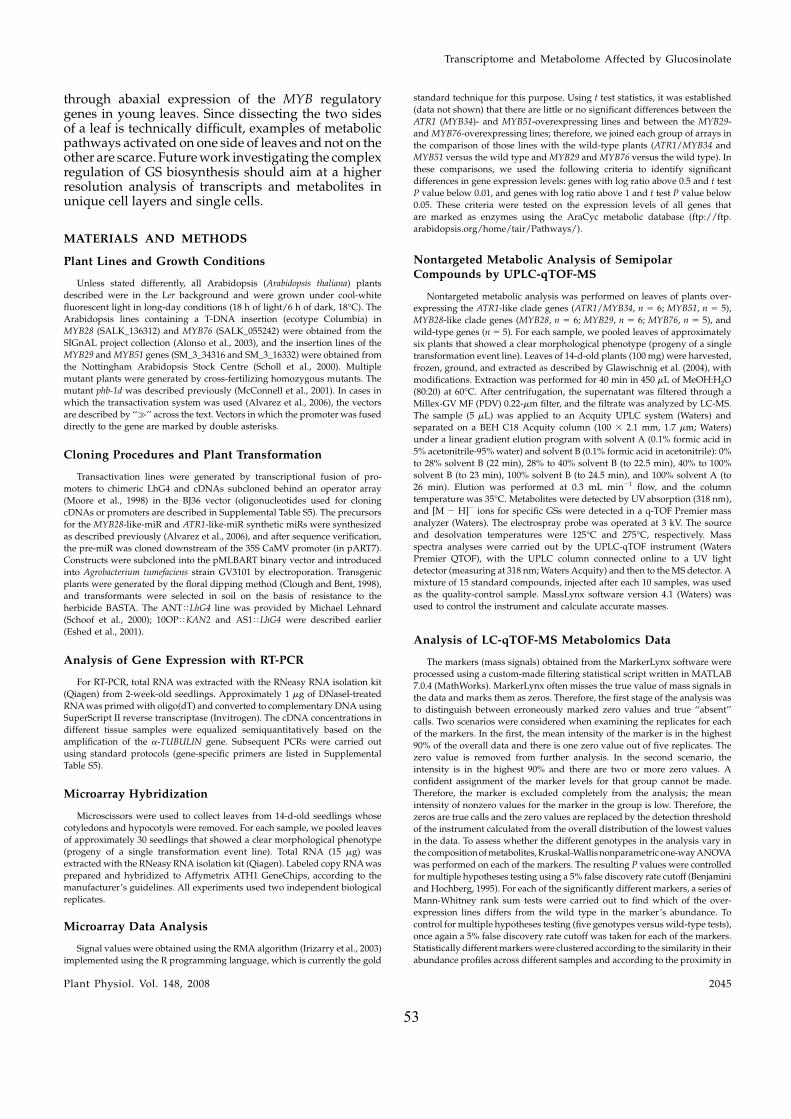
through abaxial expression of the MYB regulatorygenes in young leaves. Since dissecting the two sidesof a leaf is technically difficult, examples of metabolicpathways activated on one side of leaves and not on theother are scarce. Future work investigating the complexregulation of GS biosynthesis should aim at a higherresolution analysis of transcripts and metabolites inunique cell layers and single cells.
MATERIALS AND METHODS
Plant Lines and Growth Conditions
Unless stated differently, all Arabidopsis (Arabidopsis thaliana) plants
described were in the Ler background and were grown under cool-white
fluorescent light in long-day conditions (18 h of light/6 h of dark, 18�C). The
Arabidopsis lines containing a T-DNA insertion (ecotype Columbia) in
MYB28 (SALK_136312) and MYB76 (SALK_055242) were obtained from the
SIGnAL project collection (Alonso et al., 2003), and the insertion lines of the
MYB29 and MYB51 genes (SM_3_34316 and SM_3_16332) were obtained from
the Nottingham Arabidopsis Stock Centre (Scholl et al., 2000). Multiple
mutant plants were generated by cross-fertilizing homozygous mutants. The
mutant phb-1d was described previously (McConnell et al., 2001). In cases in
which the transactivation system was used (Alvarez et al., 2006), the vectors
are described by ‘‘�’’ across the text. Vectors in which the promoter was fused
directly to the gene are marked by double asterisks.
Cloning Procedures and Plant Transformation
Transactivation lines were generated by transcriptional fusion of pro-
moters to chimeric LhG4 and cDNAs subcloned behind an operator array
(Moore et al., 1998) in the BJ36 vector (oligonucleotides used for cloning
cDNAs or promoters are described in Supplemental Table S5). The precursors
for the MYB28-like-miR and ATR1-like-miR synthetic miRs were synthesized
as described previously (Alvarez et al., 2006), and after sequence verification,
the pre-miR was cloned downstream of the 35S CaMV promoter (in pART7).
Constructs were subcloned into the pMLBART binary vector and introduced
into Agrobacterium tumefaciens strain GV3101 by electroporation. Transgenic
plants were generated by the floral dipping method (Clough and Bent, 1998),
and transformants were selected in soil on the basis of resistance to the
herbicide BASTA. The ANTTLhG4 line was provided by Michael Lehnard
(Schoof et al., 2000); 10OPTKAN2 and AS1TLhG4 were described earlier
(Eshed et al., 2001).
Analysis of Gene Expression with RT-PCR
For RT-PCR, total RNA was extracted with the RNeasy RNA isolation kit
(Qiagen) from 2-week-old seedlings. Approximately 1 mg of DNaseI-treated
RNA was primed with oligo(dT) and converted to complementary DNA using
SuperScript II reverse transcriptase (Invitrogen). The cDNA concentrations in
different tissue samples were equalized semiquantitatively based on the
amplification of the a-TUBULIN gene. Subsequent PCRs were carried out
using standard protocols (gene-specific primers are listed in Supplemental
Table S5).
Microarray Hybridization
Microscissors were used to collect leaves from 14-d-old seedlings whose
cotyledons and hypocotyls were removed. For each sample, we pooled leaves
of approximately 30 seedlings that showed a clear morphological phenotype
(progeny of a single transformation event line). Total RNA (15 mg) was
extracted with the RNeasy RNA isolation kit (Qiagen). Labeled copy RNA was
prepared and hybridized to Affymetrix ATH1 GeneChips, according to the
manufacturer’s guidelines. All experiments used two independent biological
replicates.
Microarray Data Analysis
Signal values were obtained using the RMA algorithm (Irizarry et al., 2003)
implemented using the R programming language, which is currently the gold
standard technique for this purpose. Using t test statistics, it was established
(data not shown) that there are little or no significant differences between the
ATR1 (MYB34)- and MYB51-overexpressing lines and between the MYB29-
and MYB76-overexpressing lines; therefore, we joined each group of arrays in
the comparison of those lines with the wild-type plants (ATR1/MYB34 and
MYB51 versus the wild type and MYB29 and MYB76 versus the wild type). In
these comparisons, we used the following criteria to identify significant
differences in gene expression levels: genes with log ratio above 0.5 and t test
P value below 0.01, and genes with log ratio above 1 and t test P value below
0.05. These criteria were tested on the expression levels of all genes that
are marked as enzymes using the AraCyc metabolic database (ftp://ftp.
arabidopsis.org/home/tair/Pathways/).
Nontargeted Metabolic Analysis of SemipolarCompounds by UPLC-qTOF-MS
Nontargeted metabolic analysis was performed on leaves of plants over-
expressing the ATR1-like clade genes (ATR1/MYB34, n 5 6; MYB51, n 5 5),
MYB28-like clade genes (MYB28, n 5 6; MYB29, n 5 6; MYB76, n 5 5), and
wild-type genes (n 5 5). For each sample, we pooled leaves of approximately
six plants that showed a clear morphological phenotype (progeny of a single
transformation event line). Leaves of 14-d-old plants (100 mg) were harvested,
frozen, ground, and extracted as described by Glawischnig et al. (2004), with
modifications. Extraction was performed for 40 min in 450 mL of MeOH:H2O
(80:20) at 60�C. After centrifugation, the supernatant was filtered through a
Millex-GV MF (PDV) 0.22-mm filter, and the filtrate was analyzed by LC-MS.
The sample (5 mL) was applied to an Acquity UPLC system (Waters) and
separated on a BEH C18 Acquity column (100 3 2.1 mm, 1.7 mm; Waters)
under a linear gradient elution program with solvent A (0.1% formic acid in
5% acetonitrile-95% water) and solvent B (0.1% formic acid in acetonitrile): 0%
to 28% solvent B (22 min), 28% to 40% solvent B (to 22.5 min), 40% to 100%
solvent B (to 23 min), 100% solvent B (to 24.5 min), and 100% solvent A (to
26 min). Elution was performed at 0.3 mL min21 flow, and the column
temperature was 35�C. Metabolites were detected by UV absorption (318 nm),
and [M 2 H]2 ions for specific GSs were detected in a q-TOF Premier mass
analyzer (Waters). The electrospray probe was operated at 3 kV. The source
and desolvation temperatures were 125�C and 275�C, respectively. Mass
spectra analyses were carried out by the UPLC-qTOF instrument (Waters
Premier QTOF), with the UPLC column connected online to a UV light
detector (measuring at 318 nm; Waters Acquity) and then to the MS detector. A
mixture of 15 standard compounds, injected after each 10 samples, was used
as the quality-control sample. MassLynx software version 4.1 (Waters) was
used to control the instrument and calculate accurate masses.
Analysis of LC-qTOF-MS Metabolomics Data
The markers (mass signals) obtained from the MarkerLynx software were
processed using a custom-made filtering statistical script written in MATLAB
7.0.4 (MathWorks). MarkerLynx often misses the true value of mass signals in
the data and marks them as zeros. Therefore, the first stage of the analysis was
to distinguish between erroneously marked zero values and true ‘‘absent’’
calls. Two scenarios were considered when examining the replicates for each
of the markers. In the first, the mean intensity of the marker is in the highest
90% of the overall data and there is one zero value out of five replicates. The
zero value is removed from further analysis. In the second scenario, the
intensity is in the highest 90% and there are two or more zero values. A
confident assignment of the marker levels for that group cannot be made.
Therefore, the marker is excluded completely from the analysis; the mean
intensity of nonzero values for the marker in the group is low. Therefore, the
zeros are true calls and the zero values are replaced by the detection threshold
of the instrument calculated from the overall distribution of the lowest values
in the data. To assess whether the different genotypes in the analysis vary in
the composition of metabolites, Kruskal-Wallisnonparametric one-way ANOVA
was performed on each of the markers. The resulting P values were controlled
for multiple hypotheses testing using a 5% false discovery rate cutoff (Benjamini
and Hochberg, 1995). For each of the significantly different markers, a series of
Mann-Whitney rank sum tests were carried out to find which of the over-
expression lines differs from the wild type in the marker’s abundance. To
control for multiple hypotheses testing (five genotypes versus wild-type tests),
once again a 5% false discovery rate cutoff was taken for each of the markers.
Statistically different markers were clustered according to the similarity in their
abundance profiles across different samples and according to the proximity in
Transcriptome and Metabolome Affected by Glucosinolate
Plant Physiol. Vol. 148, 2008 2045
53
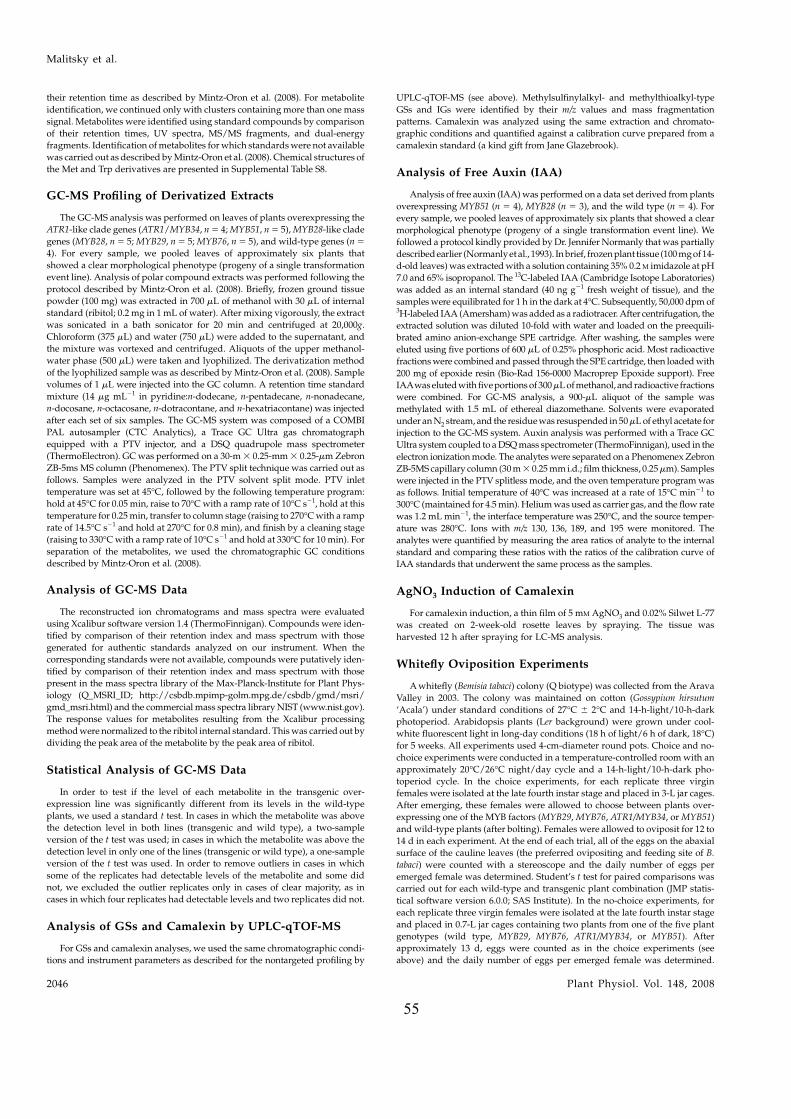
55
their retention time as described by Mintz-Oron et al. (2008). For metabolite
identification, we continued only with clusters containing more than one mass
signal. Metabolites were identified using standard compounds by comparison
of their retention times, UV spectra, MS/MS fragments, and dual-energy
fragments. Identification of metabolites for which standards were not available
was carried out as described by Mintz-Oron et al. (2008). Chemical structures of
the Met and Trp derivatives are presented in Supplemental Table S8.
GC-MS Profiling of Derivatized Extracts
The GC-MS analysis was performed on leaves of plants overexpressing the
ATR1-like clade genes (ATR1/MYB34, n 5 4; MYB51, n 5 5), MYB28-like clade
genes (MYB28, n 5 5; MYB29, n 5 5; MYB76, n 5 5), and wild-type genes (n 5
4). For every sample, we pooled leaves of approximately six plants that
showed a clear morphological phenotype (progeny of a single transformation
event line). Analysis of polar compound extracts was performed following the
protocol described by Mintz-Oron et al. (2008). Briefly, frozen ground tissue
powder (100 mg) was extracted in 700 mL of methanol with 30 mL of internal
standard (ribitol; 0.2 mg in 1 mL of water). After mixing vigorously, the extract
was sonicated in a bath sonicator for 20 min and centrifuged at 20,000g.
Chloroform (375 mL) and water (750 mL) were added to the supernatant, and
the mixture was vortexed and centrifuged. Aliquots of the upper methanol-
water phase (500 mL) were taken and lyophilized. The derivatization method
of the lyophilized sample was as described by Mintz-Oron et al. (2008). Sample
volumes of 1 mL were injected into the GC column. A retention time standard
mixture (14 mg mL21 in pyridine:n-dodecane, n-pentadecane, n-nonadecane,
n-docosane, n-octacosane, n-dotracontane, and n-hexatriacontane) was injected
after each set of six samples. The GC-MS system was composed of a COMBI
PAL autosampler (CTC Analytics), a Trace GC Ultra gas chromatograph
equipped with a PTV injector, and a DSQ quadrupole mass spectrometer
(ThermoElectron). GC was performed on a 30-m 3 0.25-mm 3 0.25-mm Zebron
ZB-5ms MS column (Phenomenex). The PTV split technique was carried out as
follows. Samples were analyzed in the PTV solvent split mode. PTV inlet
temperature was set at 45�C, followed by the following temperature program:
hold at 45�C for 0.05 min, raise to 70�C with a ramp rate of 10�C s21, hold at this
temperature for 0.25 min, transfer to column stage (raising to 270�C with a ramp
rate of 14.5�C s21 and hold at 270�C for 0.8 min), and finish by a cleaning stage
(raising to 330�C with a ramp rate of 10�C s21 and hold at 330�C for 10 min). For
separation of the metabolites, we used the chromatographic GC conditions
described by Mintz-Oron et al. (2008).
Analysis of GC-MS Data
The reconstructed ion chromatograms and mass spectra were evaluated
using Xcalibur software version 1.4 (ThermoFinnigan). Compounds were iden-
tified by comparison of their retention index and mass spectrum with those
generated for authentic standards analyzed on our instrument. When the
corresponding standards were not available, compounds were putatively iden-
tified by comparison of their retention index and mass spectrum with those
present in the mass spectra library of the Max-Planck-Institute for Plant Phys-
iology (Q_MSRI_ID; http://csbdb.mpimp-golm.mpg.de/csbdb/gmd/msri/
gmd_msri.html) and the commercial mass spectra library NIST (www.nist.gov).
The response values for metabolites resulting from the Xcalibur processing
method were normalized to the ribitol internal standard. This was carried out by
dividing the peak area of the metabolite by the peak area of ribitol.
Statistical Analysis of GC-MS Data
In order to test if the level of each metabolite in the transgenic over-
expression line was significantly different from its levels in the wild-type
plants, we used a standard t test. In cases in which the metabolite was above
the detection level in both lines (transgenic and wild type), a two-sample
version of the t test was used; in cases in which the metabolite was above the
detection level in only one of the lines (transgenic or wild type), a one-sample
version of the t test was used. In order to remove outliers in cases in which
some of the replicates had detectable levels of the metabolite and some did
not, we excluded the outlier replicates only in cases of clear majority, as in
cases in which four replicates had detectable levels and two replicates did not.
Analysis of GSs and Camalexin by UPLC-qTOF-MS
For GSs and camalexin analyses, we used the same chromatographic condi-
tions and instrument parameters as described for the nontargeted profiling by
UPLC-qTOF-MS (see above). Methylsulfinylalkyl- and methylthioalkyl-type
GSs and IGs were identified by their m/z values and mass fragmentation
patterns. Camalexin was analyzed using the same extraction and chromato-
graphic conditions and quantified against a calibration curve prepared from a
camalexin standard (a kind gift from Jane Glazebrook).
Analysis of Free Auxin (IAA)
Analysis of free auxin (IAA) was performed on a data set derived from plants
overexpressing MYB51 (n 5 4), MYB28 (n 5 3), and the wild type (n 5 4). For
every sample, we pooled leaves of approximately six plants that showed a clear
morphological phenotype (progeny of a single transformation event line). We
followed a protocol kindly provided by Dr. Jennifer Normanly that was partially
described earlier (Normanlyet al., 1993). In brief, frozen plant tissue (100 mg of 14-
d-old leaves) was extracted with a solution containing 35% 0.2 M imidazole at pH
7.0 and 65% isopropanol. The 13C-labeled IAA (Cambridge Isotope Laboratories)
was added as an internal standard (40 ng g21 fresh weight of tissue), and the
samples were equilibrated for 1 h in the dark at 4�C. Subsequently, 50,000 dpm of3H-labeled IAA (Amersham) was added as a radiotracer. After centrifugation, the
extracted solution was diluted 10-fold with water and loaded on the preequili-
brated amino anion-exchange SPE cartridge. After washing, the samples were
eluted using five portions of 600 mL of 0.25% phosphoric acid. Most radioactive
fractions were combined and passed through the SPE cartridge, then loaded with
200 mg of epoxide resin (Bio-Rad 156-0000 Macroprep Epoxide support). Free
IAAwas eluted with five portions of 300 mL of methanol, and radioactive fractions
were combined. For GC-MS analysis, a 900-mL aliquot of the sample was
methylated with 1.5 mL of ethereal diazomethane. Solvents were evaporated
under an N2 stream, and the residue was resuspended in 50 mL of ethyl acetate for
injection to the GC-MS system. Auxin analysis was performed with a Trace GC
Ultra system coupled to a DSQ mass spectrometer (ThermoFinnigan), used in the
electron ionization mode. The analytes were separated on a Phenomenex Zebron
ZB-5MS capillary column (30 m 3 0.25 mm i.d.; film thickness, 0.25 mm). Samples
were injected in the PTV splitless mode, and the oven temperature program was
as follows. Initial temperature of 40�C was increased at a rate of 15�C min21 to
300�C (maintained for 4.5 min). Helium was used as carrier gas, and the flow rate
was 1.2 mL min21, the interface temperature was 250�C, and the source temper-
ature was 280�C. Ions with m/z 130, 136, 189, and 195 were monitored. The
analytes were quantified by measuring the area ratios of analyte to the internal
standard and comparing these ratios with the ratios of the calibration curve of
IAA standards that underwent the same process as the samples.
AgNO3 Induction of Camalexin
For camalexin induction, a thin film of 5 mM AgNO3 and 0.02% Silwet L-77
was created on 2-week-old rosette leaves by spraying. The tissue was
harvested 12 h after spraying for LC-MS analysis.
Whitefly Oviposition Experiments
A whitefly (Bemisia tabaci) colony (Q biotype) was collected from the Arava
Valley in 2003. The colony was maintained on cotton (Gossypium hirsutum
‘Acala’) under standard conditions of 27�C 6 2�C and 14-h-light/10-h-dark
photoperiod. Arabidopsis plants (Ler background) were grown under cool-
white fluorescent light in long-day conditions (18 h of light/6 h of dark, 18�C)
for 5 weeks. All experiments used 4-cm-diameter round pots. Choice and no-
choice experiments were conducted in a temperature-controlled room with an
approximately 20�C/26�C night/day cycle and a 14-h-light/10-h-dark pho-
toperiod cycle. In the choice experiments, for each replicate three virgin
females were isolated at the late fourth instar stage and placed in 3-L jar cages.
After emerging, these females were allowed to choose between plants over-
expressing one of the MYB factors (MYB29, MYB76, ATR1/MYB34, or MYB51)
and wild-type plants (after bolting). Females were allowed to oviposit for 12 to
14 d in each experiment. At the end of each trial, all of the eggs on the abaxial
surface of the cauline leaves (the preferred ovipositing and feeding site of B.
tabaci) were counted with a stereoscope and the daily number of eggs per
emerged female was determined. Student’s t test for paired comparisons was
carried out for each wild-type and transgenic plant combination (JMP statis-
tical software version 6.0.0; SAS Institute). In the no-choice experiments, for
each replicate three virgin females were isolated at the late fourth instar stage
and placed in 0.7-L jar cages containing two plants from one of the five plant
genotypes (wild type, MYB29, MYB76, ATR1/MYB34, or MYB51). After
approximately 13 d, eggs were counted as in the choice experiments (see
above) and the daily number of eggs per emerged female was determined.
Malitsky et al.
2046 Plant Physiol. Vol. 148, 2008
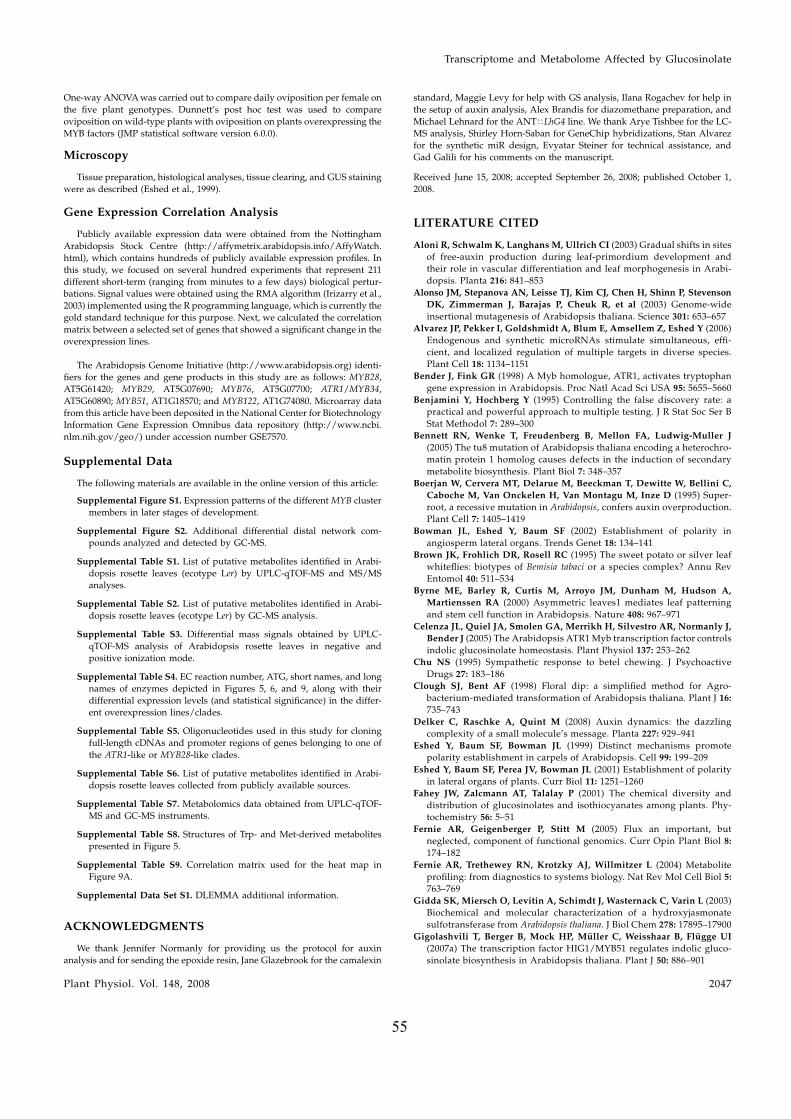
One-way ANOVA was carried out to compare daily oviposition per female on
the five plant genotypes. Dunnett’s post hoc test was used to compare
oviposition on wild-type plants with oviposition on plants overexpressing the
MYB factors (JMP statistical software version 6.0.0).
Microscopy
Tissue preparation, histological analyses, tissue clearing, and GUS staining
were as described (Eshed et al., 1999).
Gene Expression Correlation Analysis
Publicly available expression data were obtained from the Nottingham
Arabidopsis Stock Centre (http://affymetrix.arabidopsis.info/AffyWatch.
html), which contains hundreds of publicly available expression profiles. In
this study, we focused on several hundred experiments that represent 211
different short-term (ranging from minutes to a few days) biological pertur-
bations. Signal values were obtained using the RMA algorithm (Irizarry et al.,
2003) implemented using the R programming language, which is currently the
gold standard technique for this purpose. Next, we calculated the correlation
matrix between a selected set of genes that showed a significant change in the
overexpression lines.
The Arabidopsis Genome Initiative (http://www.arabidopsis.org) identi-
fiers for the genes and gene products in this study are as follows: MYB28,
AT5G61420; MYB29, AT5G07690; MYB76, AT5G07700; ATR1/MYB34,
AT5G60890; MYB51, AT1G18570; and MYB122, AT1G74080. Microarray data
from this article have been deposited in the National Center for Biotechnology
Information Gene Expression Omnibus data repository (http://www.ncbi.
nlm.nih.gov/geo/) under accession number GSE7570.
Supplemental Data
The following materials are available in the online version of this article:
Supplemental Figure S1. Expression patterns of the different MYB cluster
members in later stages of development.
Supplemental Figure S2. Additional differential distal network com-
pounds analyzed and detected by GC-MS.
Supplemental Table S1. List of putative metabolites identified in Arabi-
dopsis rosette leaves (ecotype Ler) by UPLC-qTOF-MS and MS/MS
analyses.
Supplemental Table S2. List of putative metabolites identified in Arabi-
dopsis rosette leaves (ecotype Ler) by GC-MS analysis.
Supplemental Table S3. Differential mass signals obtained by UPLC-
qTOF-MS analysis of Arabidopsis rosette leaves in negative and
positive ionization mode.
Supplemental Table S4. EC reaction number, ATG, short names, and long
names of enzymes depicted in Figures 5, 6, and 9, along with their
differential expression levels (and statistical significance) in the differ-
ent overexpression lines/clades.
Supplemental Table S5. Oligonucleotides used in this study for cloning
full-length cDNAs and promoter regions of genes belonging to one of
the ATR1-like or MYB28-like clades.
Supplemental Table S6. List of putative metabolites identified in Arabi-
dopsis rosette leaves collected from publicly available sources.
Supplemental Table S7. Metabolomics data obtained from UPLC-qTOF-
MS and GC-MS instruments.
Supplemental Table S8. Structures of Trp- and Met-derived metabolites
presented in Figure 5.
Supplemental Table S9. Correlation matrix used for the heat map in
Figure 9A.
Supplemental Data Set S1. DLEMMA additional information.
ACKNOWLEDGMENTS
We thank Jennifer Normanly for providing us the protocol for auxin
analysis and for sending the epoxide resin, Jane Glazebrook for the camalexin
standard, Maggie Levy for help with GS analysis, Ilana Rogachev for help in
the setup of auxin analysis, Alex Brandis for diazomethane preparation, and
Michael Lehnard for the ANTTLhG4 line. We thank Arye Tishbee for the LC-
MS analysis, Shirley Horn-Saban for GeneChip hybridizations, Stan Alvarez
for the synthetic miR design, Evyatar Steiner for technical assistance, and
Gad Galili for his comments on the manuscript.
Received June 15, 2008; accepted September 26, 2008; published October 1,
2008.
LITERATURE CITED
Aloni R, Schwalm K, Langhans M, Ullrich CI (2003) Gradual shifts in sites
of free-auxin production during leaf-primordium development and
their role in vascular differentiation and leaf morphogenesis in Arabi-
dopsis. Planta 216: 841–853
Alonso JM, Stepanova AN, Leisse TJ, Kim CJ, Chen H, Shinn P, Stevenson
DK, Zimmerman J, Barajas P, Cheuk R, et al (2003) Genome-wide
insertional mutagenesis of Arabidopsis thaliana. Science 301: 653–657
Alvarez JP, Pekker I, Goldshmidt A, Blum E, Amsellem Z, Eshed Y (2006)
Endogenous and synthetic microRNAs stimulate simultaneous, effi-
cient, and localized regulation of multiple targets in diverse species.
Plant Cell 18: 1134–1151
Bender J, Fink GR (1998) A Myb homologue, ATR1, activates tryptophan
gene expression in Arabidopsis. Proc Natl Acad Sci USA 95: 5655–5660
Benjamini Y, Hochberg Y (1995) Controlling the false discovery rate: a
practical and powerful approach to multiple testing. J R Stat Soc Ser B
Stat Methodol 7: 289–300
Bennett RN, Wenke T, Freudenberg B, Mellon FA, Ludwig-Muller J
(2005) The tu8 mutation of Arabidopsis thaliana encoding a heterochro-
matin protein 1 homolog causes defects in the induction of secondary
metabolite biosynthesis. Plant Biol 7: 348–357
Boerjan W, Cervera MT, Delarue M, Beeckman T, Dewitte W, Bellini C,
Caboche M, Van Onckelen H, Van Montagu M, Inze D (1995) Super-
root, a recessive mutation in Arabidopsis, confers auxin overproduction.
Plant Cell 7: 1405–1419
Bowman JL, Eshed Y, Baum SF (2002) Establishment of polarity in
angiosperm lateral organs. Trends Genet 18: 134–141
Brown JK, Frohlich DR, Rosell RC (1995) The sweet potato or silver leaf
whiteflies: biotypes of Bemisia tabaci or a species complex? Annu Rev
Entomol 40: 511–534
Byrne ME, Barley R, Curtis M, Arroyo JM, Dunham M, Hudson A,
Martienssen RA (2000) Asymmetric leaves1 mediates leaf patterning
and stem cell function in Arabidopsis. Nature 408: 967–971
Celenza JL, Quiel JA, Smolen GA, Merrikh H, Silvestro AR, Normanly J,
Bender J (2005) The Arabidopsis ATR1 Myb transcription factor controls
indolic glucosinolate homeostasis. Plant Physiol 137: 253–262
Chu NS (1995) Sympathetic response to betel chewing. J Psychoactive
Drugs 27: 183–186
Clough SJ, Bent AF (1998) Floral dip: a simplified method for Agro-
bacterium-mediated transformation of Arabidopsis thaliana. Plant J 16:
735–743
Delker C, Raschke A, Quint M (2008) Auxin dynamics: the dazzling
complexity of a small molecule’s message. Planta 227: 929–941
Eshed Y, Baum SF, Bowman JL (1999) Distinct mechanisms promote
polarity establishment in carpels of Arabidopsis. Cell 99: 199–209
Eshed Y, Baum SF, Perea JV, Bowman JL (2001) Establishment of polarity
in lateral organs of plants. Curr Biol 11: 1251–1260
Fahey JW, Zalcmann AT, Talalay P (2001) The chemical diversity and
distribution of glucosinolates and isothiocyanates among plants. Phy-
tochemistry 56: 5–51
Fernie AR, Geigenberger P, Stitt M (2005) Flux an important, but
neglected, component of functional genomics. Curr Opin Plant Biol 8:
174–182
Fernie AR, Trethewey RN, Krotzky AJ, Willmitzer L (2004) Metabolite
profiling: from diagnostics to systems biology. Nat Rev Mol Cell Biol 5:
763–769
Gidda SK, Miersch O, Levitin A, Schimdt J, Wasternack C, Varin L (2003)
Biochemical and molecular characterization of a hydroxyjasmonate
sulfotransferase from Arabidopsis thaliana. J Biol Chem 278: 17895–17900
Gigolashvili T, Berger B, Mock HP, Muller C, Weisshaar B, Flugge UI
(2007a) The transcription factor HIG1/MYB51 regulates indolic gluco-
sinolate biosynthesis in Arabidopsis thaliana. Plant J 50: 886–901
Transcriptome and Metabolome Affected by Glucosinolate
Plant Physiol. Vol. 148, 2008 2047
55
Gigolashvili T, Engqvist M, Yatusevich R, Muller C, Flugge UI (2008)
HAG2/MYB76 and HAG3/MYB29 exert a specific and coordinated
control on the regulation of aliphatic glucosinolate biosynthesis in
Arabidopsis thaliana. New Phytol 177: 627–642
Gigolashvili T, Yatusevich R, Berger B, Muller C, Flugge UI (2007b) The
R2R3-MYB transcription factor HAG1/MYB28 is a regulator of methionine-
derived glucosinolate biosynthesis in Arabidopsis thaliana. Plant J 51:
247–261
Glawischnig E, Hansen BG, Olsen CE, Halkier BA (2004) Camalexin is
synthesized from indole-3-acetaldoxime, a key branching point between
primary and secondary metabolism in Arabidopsis. Proc Natl Acad Sci
USA 101: 8245–8250
Graser G, Oldham NJ, Brown PD, Temp U, Gershenzon J (2001) The bio-
synthesis of benzoic acid glucosinolate esters in Arabidopsis thaliana.
Phytochemistry 57: 23–32
Grubb CD, Abel S (2006) Glucosinolate metabolism and its control. Trends
Plant Sci 11: 89–100
Grubb CD, Zipp BJ, Ludwig-Muller J, Masuno MN, Molinski TF, Abel S
(2004) Arabidopsis glucosyltransferase UGT74B1 functions in glucosi-
nolate biosynthesis and auxin homeostasis. Plant J 40: 893–908
Halkier BA, Gershenzon J (2006) Biology and biochemistry of glucosi-
nolates. Annu Rev Plant Biol 57: 303–333
Hemm MR, Ruegger MO, Chapple C (2003) The Arabidopsis ref2 mutant
is defective in the gene encoding CYP83A1 and shows both phenyl-
propanoid and glucosinolate phenotypes. Plant Cell 15: 179–194
Hirai MY, Sugiyama K, Sawada Y, Tohge T, Obayashi T, Suzuki A, Araki
R, Sakurai N, Suzuki H, Aoki K, et al (2007) Omics-based identification
of Arabidopsis Myb transcription factors regulating aliphatic glucosi-
nolate biosynthesis. Proc Natl Acad Sci USA 104: 6478–6483
Hull AK, Vij R, Celenza JL (2000) Arabidopsis cytochrome P450s that
catalyze the first step of tryptophan-dependent indole-3-acetic acid
biosynthesis. Proc Natl Acad Sci USA 97: 2379–2384
Irizarry RA, Hobbs B, Collin F, Beazer-Barclay YD, Antonellis KJ, Scherf
U, Speed TP (2003) Exploration, normalization, and summaries of high
density oligonucleotide array probe level data. Biostatistics 4: 249–264
Kim JH, Durrett TP, Last RL, Jander G (2004) Characterization of the
Arabidopsis TU8 glucosinolate mutation, an allele of TERMINAL
FLOWER2. Plant Mol Biol 54: 671–682
Kutz A, Muller A, Hennig P, Kaiser WM, Piotrowski M, Weiler EW (2002)
A role for nitrilase 3 in the regulation of root morphology in sulphur-
starving Arabidopsis thaliana. Plant J 30: 95–106
Levy M, Wang Q, Kaspi R, Parrella MP, Abel S (2005) Arabidopsis IQD1, a
novel calmodulin-binding nuclear protein, stimulates glucosinolate
accumulation and plant defense. Plant J 43: 79–96
Liechti R, Farmer EE (2006) Jasmonate biochemical pathway. Sci STKE
322: cm3
Maruyama-Nakashita A, Nakamura Y, Tohge T, Saito K, Takahashi H
(2006) Arabidopsis SLIM1 is a central transcriptional regulator of plant
sulfur response and metabolism. Plant Cell 18: 3235–3251
McConnell JR, Emery J, Eshed Y, Bao N, Bowman J, Barton MK (2001)
Role of PHABULOSA and PHAVOLUTA in determining radial pattern-
ing in shoots. Nature 411: 709–713
Mewis I, Appel HM, Hom A, Raina R, Schultz JC (2005) Major signaling
pathways modulate Arabidopsis glucosinolate accumulation and re-
sponse to both phloem-feeding and chewing insects. Plant Physiol 138:
1149–1162
Mikkelsen MD, Hansen CH, Wittstock U, Halkier BA (2000) Cytochrome
P450 CYP79B2 from Arabidopsis catalyzes the conversion of tryptophan
to indole-3-acetaldoxime, a precursor of indole glucosinolates and
indole-3-acetic acid. J Biol Chem 275: 33712–33717
Mikkelsen MD, Naur P, Halkier BA (2004) Arabidopsis mutants in the C-S
lyase of glucosinolate biosynthesis establish a critical role for indole-
3-acetaldoxime in auxin homeostasis. Plant J 37: 770–777
Mintz-Oron S, Mandel T, Rogachev I, Feldberg L, Lotan O, Yativ M, Wang
Z, Jetter R, Venger I, Adato A, et al (2008) Gene expression and
metabolism in tomato fruit surface tissues. Plant Physiol 147: 823–851
Moore I, Galweiler L, Grosskopf D, Schell J, Palme K (1998) A transcrip-
tion activation system for regulated gene expression in transgenic
plants. Proc Natl Acad Sci USA 95: 376–381
Nafisi M, Goregaoker S, Botanga CJ, Glawischnig E, Olsen CE, Halkier
BA, Glazebrook J (2007) Arabidopsis cytochrome P450 monooxygenase
71A13 catalyzes the conversion of indole-3-acetaldoxime in camalexin
synthesis. Plant Cell 19: 2039–2052
Normanly J, Cohen JD, Fink GR (1993) Arabidopsis thaliana auxotrophs
reveal a tryptophan-independent biosynthetic pathway for indole-3-
acetic acid. Proc Natl Acad Sci USA 90: 10355–10359
Okada K, Ueda J, Komaki MK, Bell CJ, Shimura Y (1991) Requirement of
the auxin polar transport system in early stages of Arabidopsis floral bud
formation. Plant Cell 3: 677–684
Piotrowski M, Schemenewitz A, Lopukhina A, Muller A, Janowitz T,
Weiler EW, Oecking C (2004) Desulfoglucosinolate sulfotransferases
from Arabidopsis thaliana catalyze the final step in the biosynthesis of
the glucosinolate core structure. J Biol Chem 279: 50717–50725
Powell G, Tosh CR, Hardie J (2006) Host plant selection by aphids:
behavioral, evolutionary, and applied perspectives. Annu Rev Entomol
51: 309–330
Rask L, Andreasson E, Ekbom B, Eriksson S, Pontoppidan B, Meijer J
(2000) Myrosinase: gene family evolution and herbivore defense in
Brassicaceae. Plant Mol Biol 42: 93–113
Ravanel S, Block MA, Rippert P, Jabrin S, Curien G, Rebeille F, Douce R
(2004) Methionine metabolism in plants: Chloroplasts are autonomous
for de novo methionine synthesis and can import S-adenosylmethionine
from the cytosol. J Biol Chem 279: 22548–22557
Raybould AF, Moyes CL (2001) The ecological genetics of aliphatic
glucosinolates. Heredity 87: 383–391
Rebeille F, Jabrin S, Bligny R, Loizeau K, Gambonnet B, Van Wilder V,
Douce R, Ravanel S (2006) Methionine catabolism in Arabidopsis cells
is initiated by a g-cleavage process and leads to S-methylcysteine and
isoleucine syntheses. Proc Natl Acad Sci USA 103: 15687–15692
Reichelt M, Brown PD, Schneider B, Oldham NJ, Stauber E, Tokuhisa J,
Kliebenstein DJ, Mitchell-Olds T, Gershenzon J (2002) Benzoic acid
glucosinolate esters and other glucosinolates from Arabidopsis thaliana.
Phytochemistry 59: 663–671
Reintanz B, Lehnen M, Reichelt M, Gershenzon J, Kowalczyk M,
Sandberg G, Godde M, Uhl R, Palme K (2001) Bus, a bushy Arabidopsis
CYP79F1 knockout mutant with abolished synthesis of short-chain
aliphatic glucosinolates. Plant Cell 13: 351–367
Scholl RL, May ST, Ware DH (2000) Seed and molecular resources for
Arabidopsis. Plant Physiol 124: 1477–1480
Schoof H, Lenhard M, Haecker A, Mayer KF, Jurgens G, Laux T (2000) The
stem cell population of Arabidopsis shoot meristems in maintained by a
regulatory loop between the CLAVATA and WUSCHEL genes. Cell 100:
635–644
Schuhegger R, Nafisi M, Mansourova M, Petersen BL, Olsen CE, Svatos A,
Halkier BA, Glawischnig E (2006) CYP71B15 (PAD3) catalyzes the final
step in camalexin biosynthesis. Plant Physiol 141: 1248–1254
Schuster J, Knill T, Reichelt M, Gershenzon J, Binder S (2006)
BRANCHED-CHAIN AMINOTRANSFERASE4 is part of the chain
elongation pathway in the biosynthesis of methionine-derived glucosi-
nolates in Arabidopsis. Plant Cell 18: 2664–2679
Skirycz A, Jozefczuk S, Stobiecki M, Muth D, Zanor MI, Witt I, Mueller-
Roeber B (2007) Transcription factor AtDOF4;2 affects phenylpropanoid
metabolism in Arabidopsis thaliana. New Phytol 175: 425–438
Skirycz A, Reichelt M, Burow M, Birkemeyer C, Rolcik J, Kopka J, Zanor
MI, Gershenzon J, Strnad M, Szopa J, et al (2006) DOF transcription
factor AtDof1.1 (OBP2) is part of a regulatory network controlling
glucosinolate biosynthesis in Arabidopsis. Plant J 47: 10–24
Smolen G, Bender J (2002) Arabidopsis cytochrome P450 cyp83B1
mutations activate the tryptophan biosynthetic pathway. Genetics 160:
323–332
Smolen GA, Pawlowski L, Wilensky SE, Bender J (2002) Dominant alleles
of the basic helix-loop-helix transcription factor ATR2 activate stress-
responsive genes in Arabidopsis. Genetics 161: 1235–1246
Sonderby IE, Hansen BG, Bjarnholt N, Ticconi C, Halkier BA,
Kliebenstein DJ (2007) A systems biology approach identifies a R2R3
MYB gene subfamily with distinct and overlapping functions in regu-
lation of aliphatic glucosinolates. PLoS ONE 2: e1322
Stracke R, Ishihara H, Huep G, Barsch A, Mehrtens F, Niehaus K,
Weisshaar B (2007) Differential regulation of closely related R2R3-
MYB transcription factors controls flavonol accumulation in different
parts of the Arabidopsis thaliana seedling. Plant J 50: 660–677
Stracke R, Werber M, Weisshaar B (2001) The R2R3-MYB gene family in
Arabidopsis thaliana. Curr Opin Plant Biol 4: 447–456
Tantikanjana T, Yong JW, Letham DS, Griffith M, Hussain M, Ljung K,
Sandberg G, Sundaresan V (2001) Control of axillary bud initiation and
Malitsky et al.
2048 Plant Physiol. Vol. 148, 2008
56
57
shoot architecture in Arabidopsis through the SUPERSHOOT gene.
Genes Dev 15: 1577–1588
Tohge T, Nishiyama Y, Hirai Y, Yano M, Nakajima J, Awazuhara M, Inoue
E, Takahashi H, Goodenowe D, Kitayama M, et al (2005) Functional
genomics by integrated analysis of metabolome and transcriptome of
Arabidopsis plants over-expressing an MYB transcription factor. Plant J
42: 218–235
Ulmasov T, Murfett J, Hagen G, Guilfoyle TJ (1997) Aux/IAA proteins
repress expression of reporter genes containing natural and highly
active synthetic auxin response elements. Plant Cell 9: 1963–1971
Woodward AW, Bartel B (2005) Auxin: regulation, action, and interaction.
Ann Bot (Lond) 95: 707–735
Yu O, Jez JM (2008) Nature’s assembly line: biosynthesis of simple
phenylpropanoids and polyketides. Plant J 54: 750–762
Zhao Y, Christensen SK, Fankhauser C, Cashman JR, Cohen JD, Weigel
D, Chory J (2001) A role for flavin monooxygenase-like enzymes in
auxin biosynthesis. Science 291: 306–309
Zhao Y, Hull AK, Gupta NR, Goss KA, Alonso J, Ecker JR, Normanly J,
Chory J, Celenza JL (2002) Trp-dependent auxin biosynthesis in
Arabidopsis: involvement of cytochrome P450s CYP79B2 and CYP79B3.
Genes Dev 16: 3100–3112
Zhou N, Tootle TL, Glazebrook J (1999) Arabidopsis PAD3, a gene required
for camalexin biosynthesis, encodes a putative cytochrome P450 mono-
oxygenase. Plant Cell 11: 2419–2428
Transcriptome and Metabolome Affected by Glucosinolate
Plant Physiol. Vol. 148, 2008 2049
58
Published paper #2:
Expression of a bacterial bi-functional chorismate mutase/prephenate dehydratase
modulates primary and secondary metabolism associated with aromatic amino acids
in Arabidopsis.
Tzin V, Malitsky S, Aharoni A, Galili G. Plant J (2009).60(1):156-167
This paper constitutes one chapter of the research work performed during my studies and equally
performed by Vered Tzin (from Gad Galili’s lab).
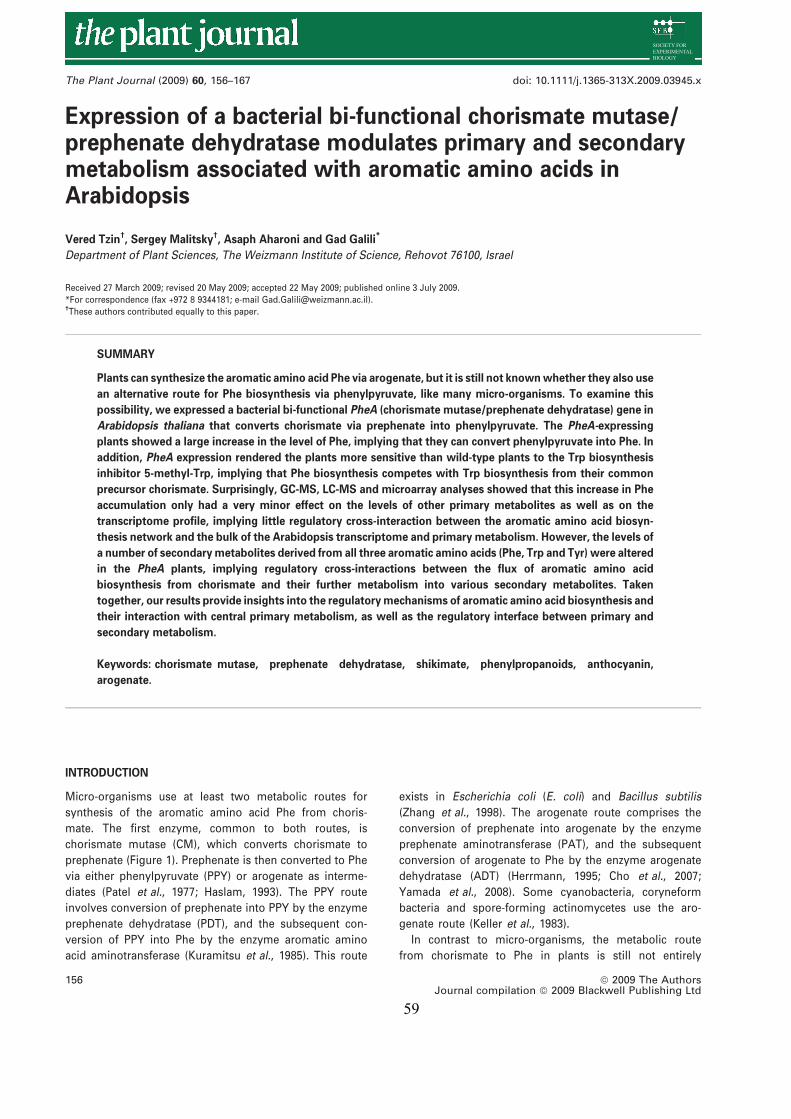
59
Expression of a bacterial bi-functional chorismate mutase/prephenate dehydratase modulates primary and secondarymetabolism associated with aromatic amino acids inArabidopsis
Vered Tzin†, Sergey Malitsky†, Asaph Aharoni and Gad Galili*
Department of Plant Sciences, The Weizmann Institute of Science, Rehovot 76100, Israel
Received 27 March 2009; revised 20 May 2009; accepted 22 May 2009; published online 3 July 2009.
*For correspondence (fax +972 8 9344181; e-mail [email protected]).†These authors contributed equally to this paper.
SUMMARY
Plants can synthesize the aromatic amino acid Phe via arogenate, but it is still not known whether they also use
an alternative route for Phe biosynthesis via phenylpyruvate, like many micro-organisms. To examine this
possibility, we expressed a bacterial bi-functional PheA (chorismate mutase/prephenate dehydratase) gene in
Arabidopsis thaliana that converts chorismate via prephenate into phenylpyruvate. The PheA-expressing
plants showed a large increase in the level of Phe, implying that they can convert phenylpyruvate into Phe. In
addition, PheA expression rendered the plants more sensitive than wild-type plants to the Trp biosynthesis
inhibitor 5-methyl-Trp, implying that Phe biosynthesis competes with Trp biosynthesis from their common
precursor chorismate. Surprisingly, GC-MS, LC-MS and microarray analyses showed that this increase in Phe
accumulation only had a very minor effect on the levels of other primary metabolites as well as on the
transcriptome profile, implying little regulatory cross-interaction between the aromatic amino acid biosyn-
thesis network and the bulk of the Arabidopsis transcriptome and primary metabolism. However, the levels of
a number of secondary metabolites derived from all three aromatic amino acids (Phe, Trp and Tyr) were altered
in the PheA plants, implying regulatory cross-interactions between the flux of aromatic amino acid
biosynthesis from chorismate and their further metabolism into various secondary metabolites. Taken
together, our results provide insights into the regulatory mechanisms of aromatic amino acid biosynthesis and
their interaction with central primary metabolism, as well as the regulatory interface between primary and
secondary metabolism.
Keywords: chorismate mutase, prephenate dehydratase, shikimate, phenylpropanoids, anthocyanin,
arogenate.
INTRODUCTION
Micro-organisms use at least two metabolic routes for
synthesis of the aromatic amino acid Phe from choris-
mate. The first enzyme, common to both routes, is
chorismate mutase (CM), which converts chorismate to
prephenate (Figure 1). Prephenate is then converted to Phe
via either phenylpyruvate (PPY) or arogenate as interme-
diates (Patel et al., 1977; Haslam, 1993). The PPY route
involves conversion of prephenate into PPY by the enzyme
prephenate dehydratase (PDT), and the subsequent con-
version of PPY into Phe by the enzyme aromatic amino
acid aminotransferase (Kuramitsu et al., 1985). This route
exists in Escherichia coli (E. coli) and Bacillus subtilis
(Zhang et al., 1998). The arogenate route comprises the
conversion of prephenate into arogenate by the enzyme
prephenate aminotransferase (PAT), and the subsequent
conversion of arogenate to Phe by the enzyme arogenate
dehydratase (ADT) (Herrmann, 1995; Cho et al., 2007;
Yamada et al., 2008). Some cyanobacteria, coryneform
bacteria and spore-forming actinomycetes use the aro-
genate route (Keller et al., 1983).
In contrast to micro-organisms, the metabolic route
from chorismate to Phe in plants is still not entirely
156 ª 2009 The AuthorsJournal compilation ª 2009 Blackwell Publishing Ltd
The Plant Journal (2009) 60, 156–167 doi: 10.1111/j.1365-313X.2009.03945.x
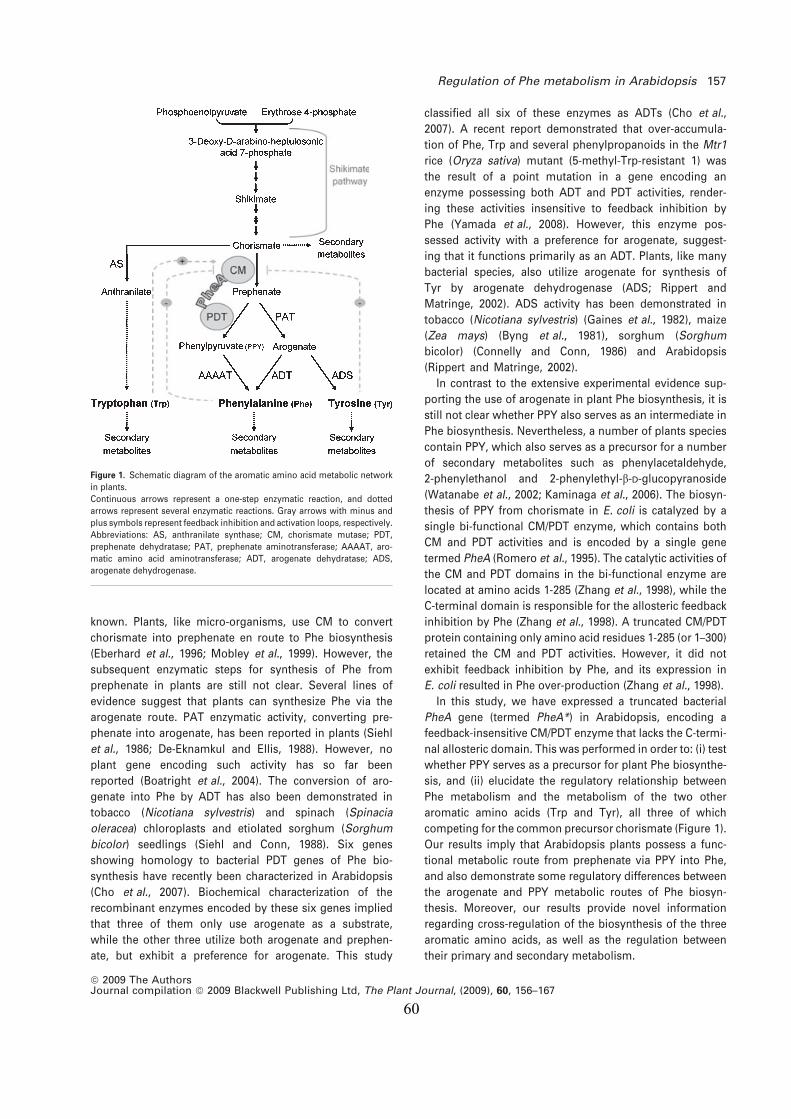
60
known. Plants, like micro-organisms, use CM to convert
chorismate into prephenate en route to Phe biosynthesis
(Eberhard et al., 1996; Mobley et al., 1999). However, the
subsequent enzymatic steps for synthesis of Phe from
prephenate in plants are still not clear. Several lines of
evidence suggest that plants can synthesize Phe via the
arogenate route. PAT enzymatic activity, converting pre-
phenate into arogenate, has been reported in plants (Siehl
et al., 1986; De-Eknamkul and Ellis, 1988). However, no
plant gene encoding such activity has so far been
reported (Boatright et al., 2004). The conversion of aro-
genate into Phe by ADT has also been demonstrated in
tobacco (Nicotiana sylvestris) and spinach (Spinacia
oleracea) chloroplasts and etiolated sorghum (Sorghum
bicolor) seedlings (Siehl and Conn, 1988). Six genes
showing homology to bacterial PDT genes of Phe bio-
synthesis have recently been characterized in Arabidopsis
(Cho et al., 2007). Biochemical characterization of the
recombinant enzymes encoded by these six genes implied
that three of them only use arogenate as a substrate,
while the other three utilize both arogenate and prephen-
ate, but exhibit a preference for arogenate. This study
classified all six of these enzymes as ADTs (Cho et al.,
2007). A recent report demonstrated that over-accumula-
tion of Phe, Trp and several phenylpropanoids in the Mtr1
rice (Oryza sativa) mutant (5-methyl-Trp-resistant 1) was
the result of a point mutation in a gene encoding an
enzyme possessing both ADT and PDT activities, render-
ing these activities insensitive to feedback inhibition by
Phe (Yamada et al., 2008). However, this enzyme pos-
sessed activity with a preference for arogenate, suggest-
ing that it functions primarily as an ADT. Plants, like many
bacterial species, also utilize arogenate for synthesis of
Tyr by arogenate dehydrogenase (ADS; Rippert and
Matringe, 2002). ADS activity has been demonstrated in
tobacco (Nicotiana sylvestris) (Gaines et al., 1982), maize
(Zea mays) (Byng et al., 1981), sorghum (Sorghum
bicolor) (Connelly and Conn, 1986) and Arabidopsis
(Rippert and Matringe, 2002).
In contrast to the extensive experimental evidence sup-
porting the use of arogenate in plant Phe biosynthesis, it is
still not clear whether PPY also serves as an intermediate in
Phe biosynthesis. Nevertheless, a number of plants species
contain PPY, which also serves as a precursor for a number
of secondary metabolites such as phenylacetaldehyde,
2-phenylethanol and 2-phenylethyl-b-D-glucopyranoside
(Watanabe et al., 2002; Kaminaga et al., 2006). The biosyn-
thesis of PPY from chorismate in E. coli is catalyzed by a
single bi-functional CM/PDT enzyme, which contains both
CM and PDT activities and is encoded by a single gene
termed PheA (Romero et al., 1995). The catalytic activities of
the CM and PDT domains in the bi-functional enzyme are
located at amino acids 1-285 (Zhang et al., 1998), while the
C-terminal domain is responsible for the allosteric feedback
inhibition by Phe (Zhang et al., 1998). A truncated CM/PDT
protein containing only amino acid residues 1-285 (or 1–300)
retained the CM and PDT activities. However, it did not
exhibit feedback inhibition by Phe, and its expression in
E. coli resulted in Phe over-production (Zhang et al., 1998).
In this study, we have expressed a truncated bacterial
PheA gene (termed PheA*) in Arabidopsis, encoding a
feedback-insensitive CM/PDT enzyme that lacks the C-termi-
nal allosteric domain. This was performed in order to: (i) test
whether PPY serves as a precursor for plant Phe biosynthe-
sis, and (ii) elucidate the regulatory relationship between
Phe metabolism and the metabolism of the two other
aromatic amino acids (Trp and Tyr), all three of which
competing for the common precursor chorismate (Figure 1).
Our results imply that Arabidopsis plants possess a func-
tional metabolic route from prephenate via PPY into Phe,
and also demonstrate some regulatory differences between
the arogenate and PPY metabolic routes of Phe biosyn-
thesis. Moreover, our results provide novel information
regarding cross-regulation of the biosynthesis of the three
aromatic amino acids, as well as the regulation between
their primary and secondary metabolism.
Figure 1. Schematic diagram of the aromatic amino acid metabolic network
in plants.
Continuous arrows represent a one-step enzymatic reaction, and dotted
arrows represent several enzymatic reactions. Gray arrows with minus and
plus symbols represent feedback inhibition and activation loops, respectively.
Abbreviations: AS, anthranilate synthase; CM, chorismate mutase; PDT,
prephenate dehydratase; PAT, prephenate aminotransferase; AAAAT, aro-
matic amino acid aminotransferase; ADT, arogenate dehydratase; ADS,
arogenate dehydrogenase.
Regulation of Phe metabolism in Arabidopsis 157
ª 2009 The AuthorsJournal compilation ª 2009 Blackwell Publishing Ltd, The Plant Journal, (2009), 60, 156–167
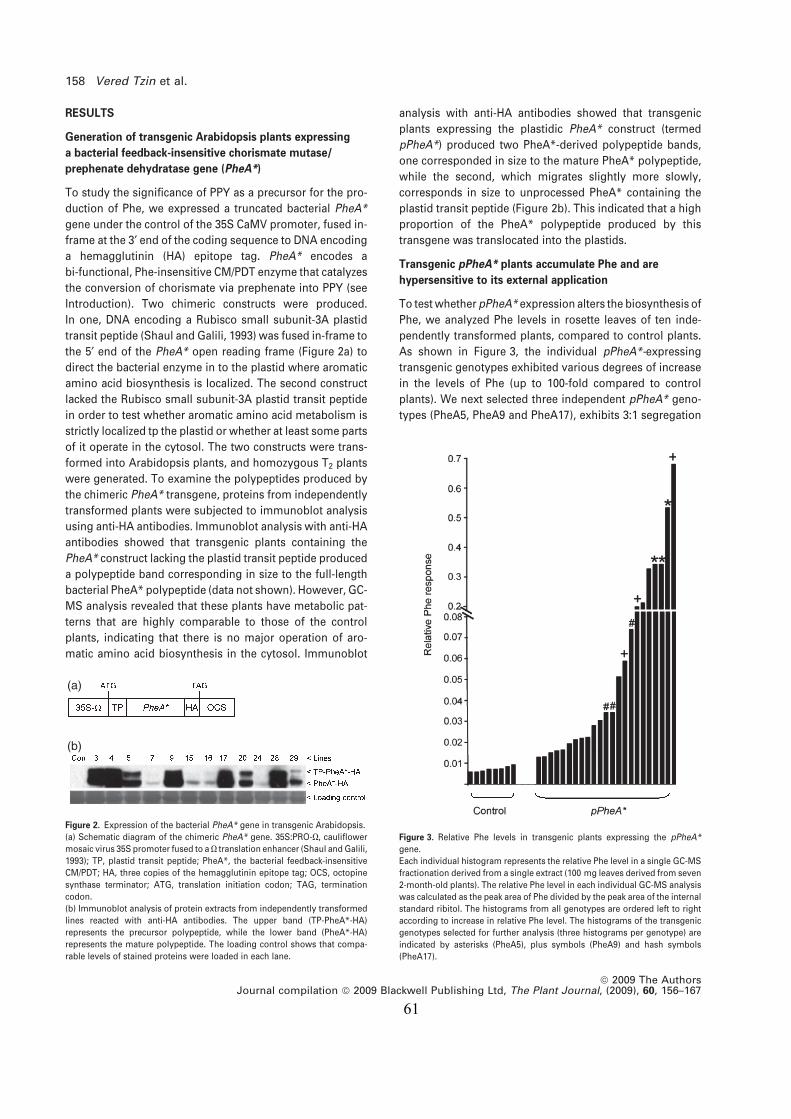
61
RESULTS
Generation of transgenic Arabidopsis plants expressing
a bacterial feedback-insensitive chorismate mutase/
prephenate dehydratase gene (PheA*)
To study the significance of PPY as a precursor for the pro-
duction of Phe, we expressed a truncated bacterial PheA*
gene under the control of the 35S CaMV promoter, fused in-
frame at the 3¢ end of the coding sequence to DNA encoding
a hemagglutinin (HA) epitope tag. PheA* encodes a
bi-functional, Phe-insensitive CM/PDT enzyme that catalyzes
the conversion of chorismate via prephenate into PPY (see
Introduction). Two chimeric constructs were produced.
In one, DNA encoding a Rubisco small subunit-3A plastid
transit peptide (Shaul and Galili, 1993) was fused in-frame to
the 5¢ end of the PheA* open reading frame (Figure 2a) to
direct the bacterial enzyme in to the plastid where aromatic
amino acid biosynthesis is localized. The second construct
lacked the Rubisco small subunit-3A plastid transit peptide
in order to test whether aromatic amino acid metabolism is
strictly localized tp the plastid or whether at least some parts
of it operate in the cytosol. The two constructs were trans-
formed into Arabidopsis plants, and homozygous T2 plants
were generated. To examine the polypeptides produced by
the chimeric PheA* transgene, proteins from independently
transformed plants were subjected to immunoblot analysis
using anti-HA antibodies. Immunoblot analysis with anti-HA
antibodies showed that transgenic plants containing the
PheA* construct lacking the plastid transit peptide produced
a polypeptide band corresponding in size to the full-length
bacterial PheA* polypeptide (data not shown). However, GC-
MS analysis revealed that these plants have metabolic pat-
terns that are highly comparable to those of the control
plants, indicating that there is no major operation of aro-
matic amino acid biosynthesis in the cytosol. Immunoblot
analysis with anti-HA antibodies showed that transgenic
plants expressing the plastidic PheA* construct (termed
pPheA*) produced two PheA*-derived polypeptide bands,
one corresponded in size to the mature PheA* polypeptide,
while the second, which migrates slightly more slowly,
corresponds in size to unprocessed PheA* containing the
plastid transit peptide (Figure 2b). This indicated that a high
proportion of the PheA* polypeptide produced by this
transgene was translocated into the plastids.
Transgenic pPheA* plants accumulate Phe and are
hypersensitive to its external application
To test whether pPheA* expression alters the biosynthesis of
Phe, we analyzed Phe levels in rosette leaves of ten inde-
pendently transformed plants, compared to control plants.
As shown in Figure 3, the individual pPheA*-expressing
transgenic genotypes exhibited various degrees of increase
in the levels of Phe (up to 100-fold compared to control
plants). We next selected three independent pPheA* geno-
types (PheA5, PheA9 and PheA17), exhibits 3:1 segregation
Figure 3. Relative Phe levels in transgenic plants expressing the pPheA*
gene.
Each individual histogram represents the relative Phe level in a single GC-MS
fractionation derived from a single extract (100 mg leaves derived from seven
2-month-old plants). The relative Phe level in each individual GC-MS analysis
was calculated as the peak area of Phe divided by the peak area of the internal
standard ribitol. The histograms from all genotypes are ordered left to right
according to increase in relative Phe level. The histograms of the transgenic
genotypes selected for further analysis (three histograms per genotype) are
indicated by asterisks (PheA5), plus symbols (PheA9) and hash symbols
(PheA17).
(a)
(b)
Figure 2. Expression of the bacterial PheA* gene in transgenic Arabidopsis.
(a) Schematic diagram of the chimeric PheA* gene. 35S:PRO-X, cauliflower
mosaic virus 35S promoter fused to a X translation enhancer (Shaul and Galili,
1993); TP, plastid transit peptide; PheA*, the bacterial feedback-insensitive
CM/PDT; HA, three copies of the hemagglutinin epitope tag; OCS, octopine
synthase terminator; ATG, translation initiation codon; TAG, termination
codon.
(b) Immunoblot analysis of protein extracts from independently transformed
lines reacted with anti-HA antibodies. The upper band (TP-PheA*-HA)
represents the precursor polypeptide, while the lower band (PheA*-HA)
represents the mature polypeptide. The loading control shows that compa-
rable levels of stained proteins were loaded in each lane.
158 Vered Tzin et al.
ª 2009 The AuthorsJournal compilation ª 2009 Blackwell Publishing Ltd, The Plant Journal, (2009), 60, 156–167
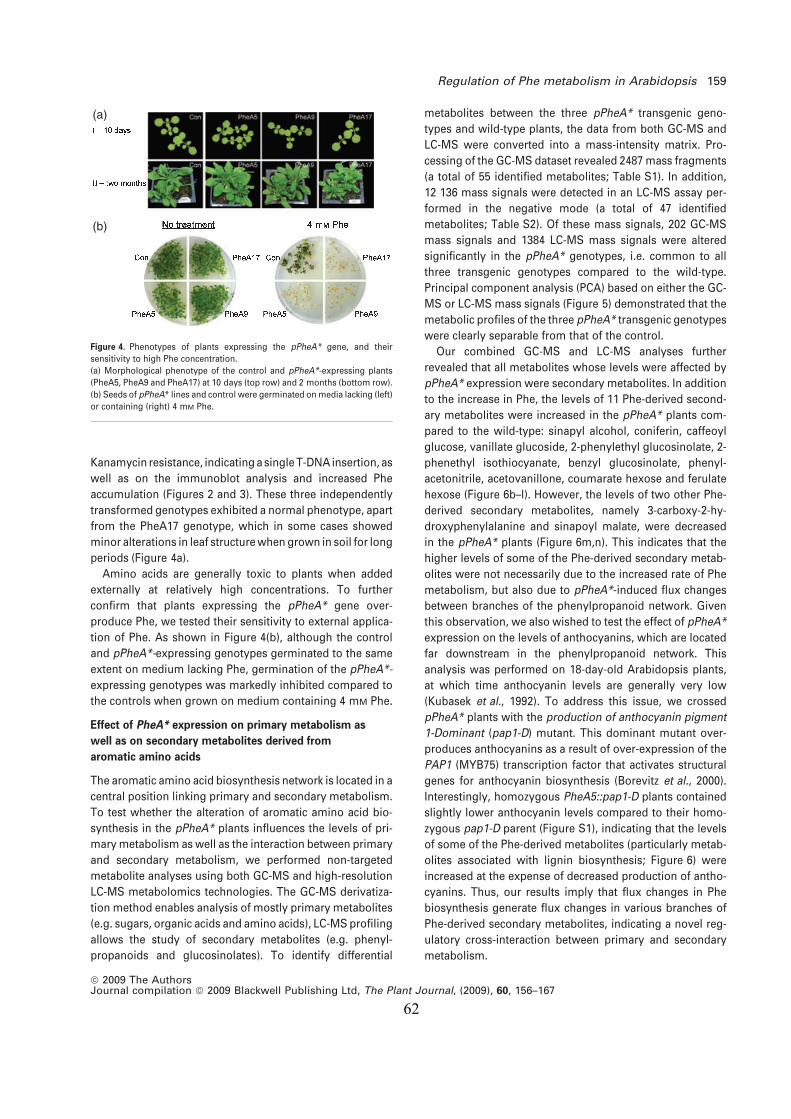
62
Kanamycin resistance, indicating a single T-DNA insertion, as
well as on the immunoblot analysis and increased Phe
accumulation (Figures 2 and 3). These three independently
transformed genotypes exhibited a normal phenotype, apart
from the PheA17 genotype, which in some cases showed
minor alterations in leaf structure when grown in soil for long
periods (Figure 4a).
Amino acids are generally toxic to plants when added
externally at relatively high concentrations. To further
confirm that plants expressing the pPheA* gene over-
produce Phe, we tested their sensitivity to external applica-
tion of Phe. As shown in Figure 4(b), although the control
and pPheA*-expressing genotypes germinated to the same
extent on medium lacking Phe, germination of the pPheA*-
expressing genotypes was markedly inhibited compared to
the controls when grown on medium containing 4 mM Phe.
Effect of PheA* expression on primary metabolism as
well as on secondary metabolites derived from
aromatic amino acids
The aromatic amino acid biosynthesis network is located in a
central position linking primary and secondary metabolism.
To test whether the alteration of aromatic amino acid bio-
synthesis in the pPheA* plants influences the levels of pri-
mary metabolism as well as the interaction between primary
and secondary metabolism, we performed non-targeted
metabolite analyses using both GC-MS and high-resolution
LC-MS metabolomics technologies. The GC-MS derivatiza-
tion method enables analysis of mostly primary metabolites
(e.g. sugars, organic acids and amino acids), LC-MS profiling
allows the study of secondary metabolites (e.g. phenyl-
propanoids and glucosinolates). To identify differential
metabolites between the three pPheA* transgenic geno-
types and wild-type plants, the data from both GC-MS and
LC-MS were converted into a mass-intensity matrix. Pro-
cessing of the GC-MS dataset revealed 2487 mass fragments
(a total of 55 identified metabolites; Table S1). In addition,
12 136 mass signals were detected in an LC-MS assay per-
formed in the negative mode (a total of 47 identified
metabolites; Table S2). Of these mass signals, 202 GC-MS
mass signals and 1384 LC-MS mass signals were altered
significantly in the pPheA* genotypes, i.e. common to all
three transgenic genotypes compared to the wild-type.
Principal component analysis (PCA) based on either the GC-
MS or LC-MS mass signals (Figure 5) demonstrated that the
metabolic profiles of the three pPheA* transgenic genotypes
were clearly separable from that of the control.
Our combined GC-MS and LC-MS analyses further
revealed that all metabolites whose levels were affected by
pPheA* expression were secondary metabolites. In addition
to the increase in Phe, the levels of 11 Phe-derived second-
ary metabolites were increased in the pPheA* plants com-
pared to the wild-type: sinapyl alcohol, coniferin, caffeoyl
glucose, vanillate glucoside, 2-phenylethyl glucosinolate, 2-
phenethyl isothiocyanate, benzyl glucosinolate, phenyl-
acetonitrile, acetovanillone, coumarate hexose and ferulate
hexose (Figure 6b–l). However, the levels of two other Phe-
derived secondary metabolites, namely 3-carboxy-2-hy-
droxyphenylalanine and sinapoyl malate, were decreased
in the pPheA* plants (Figure 6m,n). This indicates that the
higher levels of some of the Phe-derived secondary metab-
olites were not necessarily due to the increased rate of Phe
metabolism, but also due to pPheA*-induced flux changes
between branches of the phenylpropanoid network. Given
this observation, we also wished to test the effect of pPheA*
expression on the levels of anthocyanins, which are located
far downstream in the phenylpropanoid network. This
analysis was performed on 18-day-old Arabidopsis plants,
at which time anthocyanin levels are generally very low
(Kubasek et al., 1992). To address this issue, we crossed
pPheA* plants with the production of anthocyanin pigment
1-Dominant (pap1-D) mutant. This dominant mutant over-
produces anthocyanins as a result of over-expression of the
PAP1 (MYB75) transcription factor that activates structural
genes for anthocyanin biosynthesis (Borevitz et al., 2000).
Interestingly, homozygous PheA5::pap1-D plants contained
slightly lower anthocyanin levels compared to their homo-
zygous pap1-D parent (Figure S1), indicating that the levels
of some of the Phe-derived metabolites (particularly metab-
olites associated with lignin biosynthesis; Figure 6) were
increased at the expense of decreased production of antho-
cyanins. Thus, our results imply that flux changes in Phe
biosynthesis generate flux changes in various branches of
Phe-derived secondary metabolites, indicating a novel reg-
ulatory cross-interaction between primary and secondary
metabolism.
(a)
(b)
Figure 4. Phenotypes of plants expressing the pPheA* gene, and their
sensitivity to high Phe concentration.
(a) Morphological phenotype of the control and pPheA*-expressing plants
(PheA5, PheA9 and PheA17) at 10 days (top row) and 2 months (bottom row).
(b) Seeds of pPheA* lines and control were germinated on media lacking (left)
or containing (right) 4 mM Phe.
Regulation of Phe metabolism in Arabidopsis 159
ª 2009 The AuthorsJournal compilation ª 2009 Blackwell Publishing Ltd, The Plant Journal, (2009), 60, 156–167
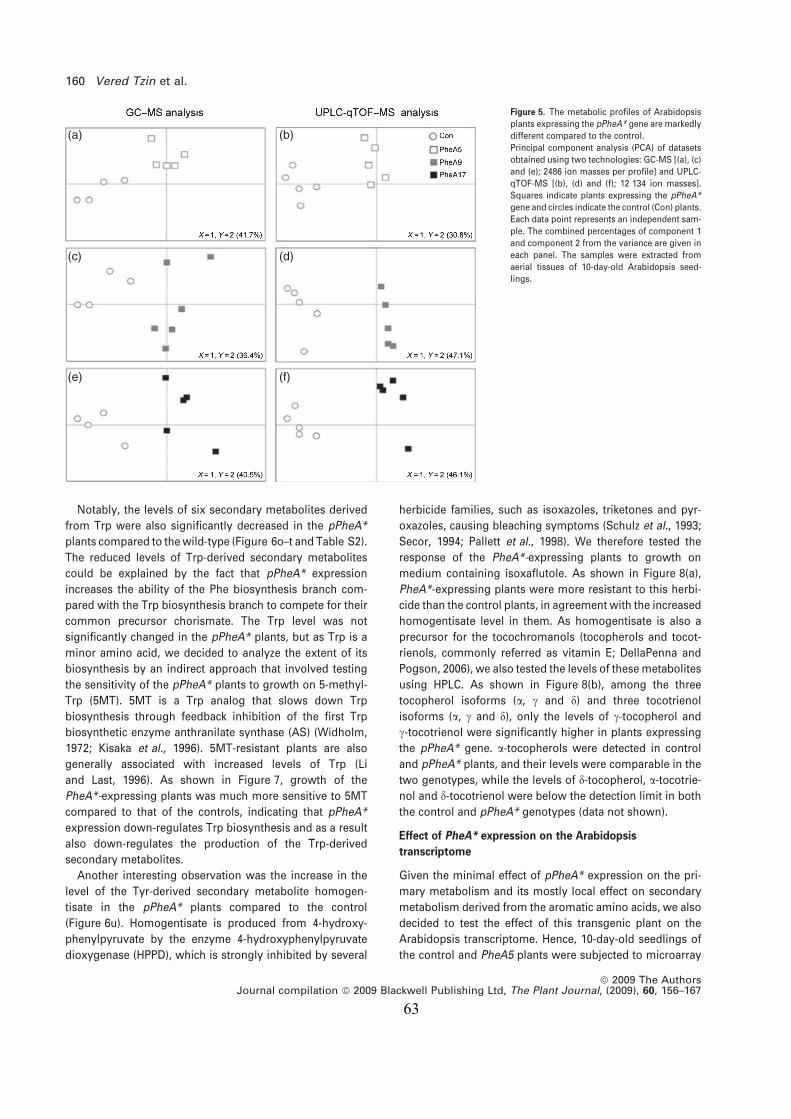
63
Notably, the levels of six secondary metabolites derived
from Trp were also significantly decreased in the pPheA*
plants compared to the wild-type (Figure 6o–t and Table S2).
The reduced levels of Trp-derived secondary metabolites
could be explained by the fact that pPheA* expression
increases the ability of the Phe biosynthesis branch com-
pared with the Trp biosynthesis branch to compete for their
common precursor chorismate. The Trp level was not
significantly changed in the pPheA* plants, but as Trp is a
minor amino acid, we decided to analyze the extent of its
biosynthesis by an indirect approach that involved testing
the sensitivity of the pPheA* plants to growth on 5-methyl-
Trp (5MT). 5MT is a Trp analog that slows down Trp
biosynthesis through feedback inhibition of the first Trp
biosynthetic enzyme anthranilate synthase (AS) (Widholm,
1972; Kisaka et al., 1996). 5MT-resistant plants are also
generally associated with increased levels of Trp (Li
and Last, 1996). As shown in Figure 7, growth of the
PheA*-expressing plants was much more sensitive to 5MT
compared to that of the controls, indicating that pPheA*
expression down-regulates Trp biosynthesis and as a result
also down-regulates the production of the Trp-derived
secondary metabolites.
Another interesting observation was the increase in the
level of the Tyr-derived secondary metabolite homogen-
tisate in the pPheA* plants compared to the control
(Figure 6u). Homogentisate is produced from 4-hydroxy-
phenylpyruvate by the enzyme 4-hydroxyphenylpyruvate
dioxygenase (HPPD), which is strongly inhibited by several
herbicide families, such as isoxazoles, triketones and pyr-
oxazoles, causing bleaching symptoms (Schulz et al., 1993;
Secor, 1994; Pallett et al., 1998). We therefore tested the
response of the PheA*-expressing plants to growth on
medium containing isoxaflutole. As shown in Figure 8(a),
PheA*-expressing plants were more resistant to this herbi-
cide than the control plants, in agreement with the increased
homogentisate level in them. As homogentisate is also a
precursor for the tocochromanols (tocopherols and tocot-
rienols, commonly referred as vitamin E; DellaPenna and
Pogson, 2006), we also tested the levels of these metabolites
using HPLC. As shown in Figure 8(b), among the three
tocopherol isoforms (a, c and d) and three tocotrienol
isoforms (a, c and d), only the levels of c-tocopherol and
c-tocotrienol were significantly higher in plants expressing
the pPheA* gene. a-tocopherols were detected in control
and pPheA* plants, and their levels were comparable in the
two genotypes, while the levels of d-tocopherol, a-tocotrie-
nol and d-tocotrienol were below the detection limit in both
the control and pPheA* genotypes (data not shown).
Effect of PheA* expression on the Arabidopsis
transcriptome
Given the minimal effect of pPheA* expression on the pri-
mary metabolism and its mostly local effect on secondary
metabolism derived from the aromatic amino acids, we also
decided to test the effect of this transgenic plant on the
Arabidopsis transcriptome. Hence, 10-day-old seedlings of
the control and PheA5 plants were subjected to microarray
(a) (b)
(c) (d)
(e) (f)
Figure 5. The metabolic profiles of Arabidopsis
plants expressing the pPheA* gene are markedly
different compared to the control.
Principal component analysis (PCA) of datasets
obtained using two technologies: GC-MS [(a), (c)
and (e); 2486 ion masses per profile] and UPLC-
qTOF-MS [(b), (d) and (f); 12 134 ion masses].
Squares indicate plants expressing the pPheA*
gene and circles indicate the control (Con) plants.
Each data point represents an independent sam-
ple. The combined percentages of component 1
and component 2 from the variance are given in
each panel. The samples were extracted from
aerial tissues of 10-day-old Arabidopsis seed-
lings.
160 Vered Tzin et al.
ª 2009 The AuthorsJournal compilation ª 2009 Blackwell Publishing Ltd, The Plant Journal, (2009), 60, 156–167
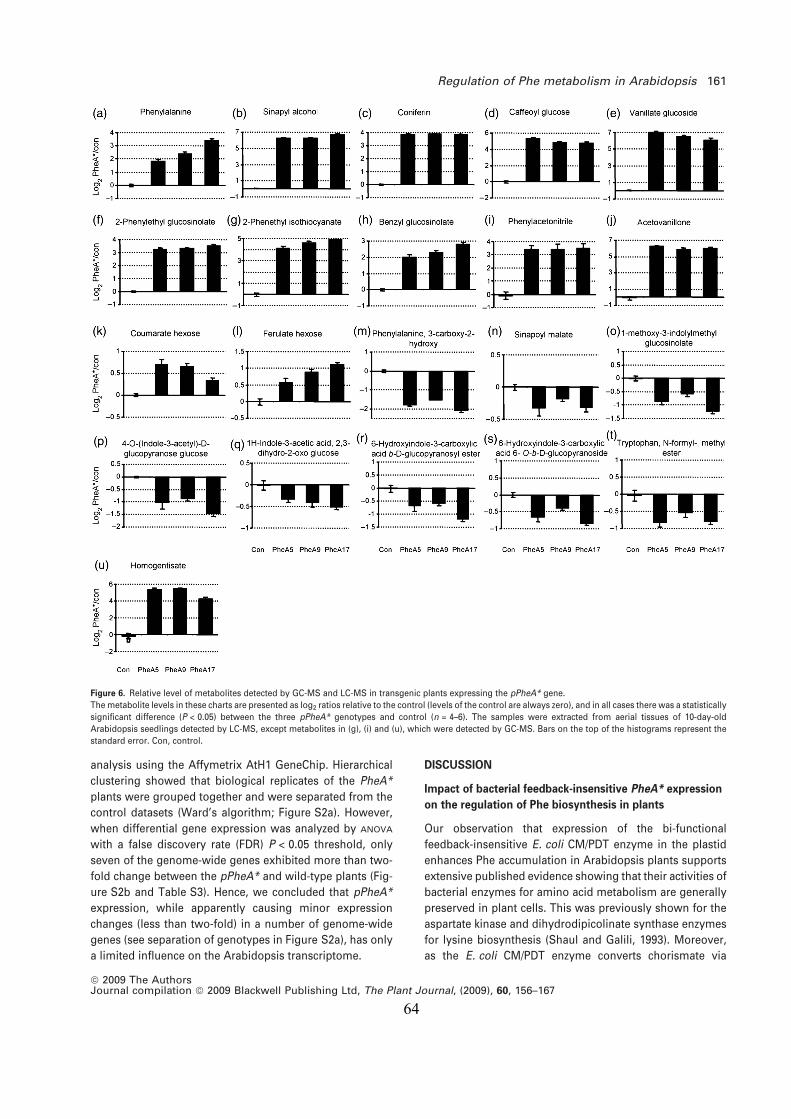
64
analysis using the Affymetrix AtH1 GeneChip. Hierarchical
clustering showed that biological replicates of the PheA*
plants were grouped together and were separated from the
control datasets (Ward’s algorithm; Figure S2a). However,
when differential gene expression was analyzed by ANOVA
with a false discovery rate (FDR) P < 0.05 threshold, only
seven of the genome-wide genes exhibited more than two-
fold change between the pPheA* and wild-type plants (Fig-
ure S2b and Table S3). Hence, we concluded that pPheA*
expression, while apparently causing minor expression
changes (less than two-fold) in a number of genome-wide
genes (see separation of genotypes in Figure S2a), has only
a limited influence on the Arabidopsis transcriptome.
DISCUSSION
Impact of bacterial feedback-insensitive PheA* expression
on the regulation of Phe biosynthesis in plants
Our observation that expression of the bi-functional
feedback-insensitive E. coli CM/PDT enzyme in the plastid
enhances Phe accumulation in Arabidopsis plants supports
extensive published evidence showing that their activities of
bacterial enzymes for amino acid metabolism are generally
preserved in plant cells. This was previously shown for the
aspartate kinase and dihydrodipicolinate synthase enzymes
for lysine biosynthesis (Shaul and Galili, 1993). Moreover,
as the E. coli CM/PDT enzyme converts chorismate via
Figure 6. Relative level of metabolites detected by GC-MS and LC-MS in transgenic plants expressing the pPheA* gene.
The metabolite levels in these charts are presented as log2 ratios relative to the control (levels of the control are always zero), and in all cases there was a statistically
significant difference (P < 0.05) between the three pPheA* genotypes and control (n = 4–6). The samples were extracted from aerial tissues of 10-day-old
Arabidopsis seedlings detected by LC-MS, except metabolites in (g), (i) and (u), which were detected by GC-MS. Bars on the top of the histograms represent the
standard error. Con, control.
Regulation of Phe metabolism in Arabidopsis 161
ª 2009 The AuthorsJournal compilation ª 2009 Blackwell Publishing Ltd, The Plant Journal, (2009), 60, 156–167
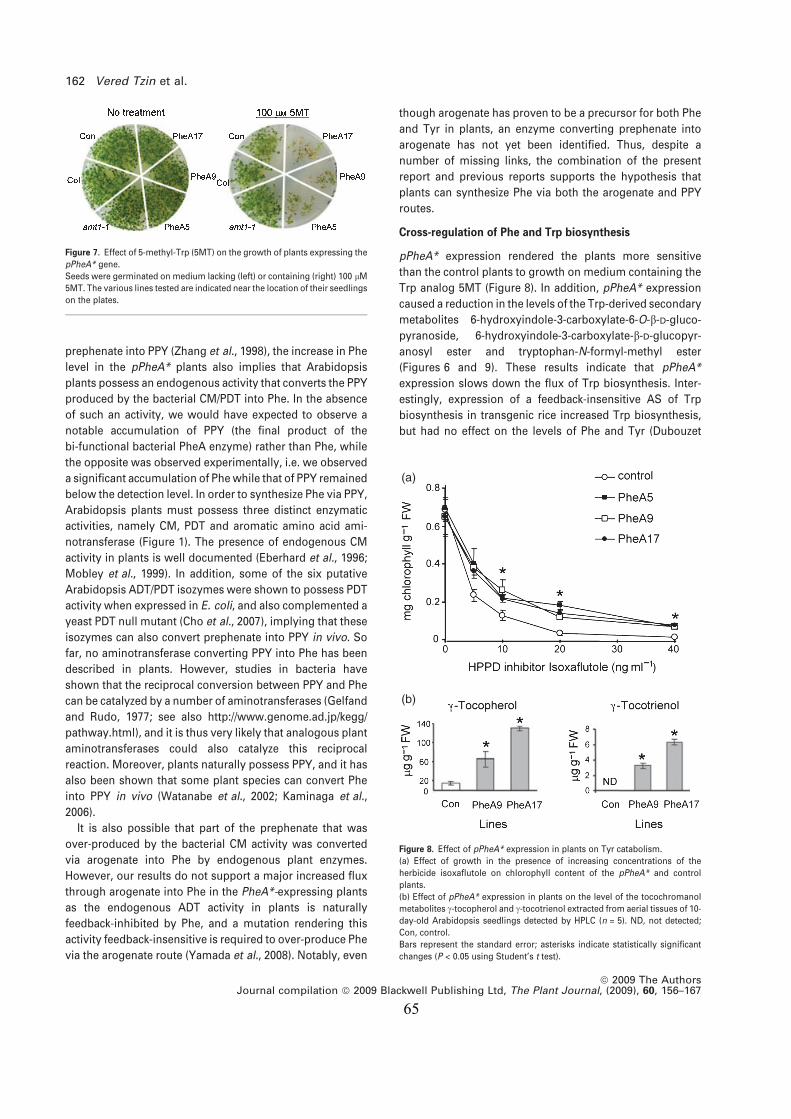
65
prephenate into PPY (Zhang et al., 1998), the increase in Phe
level in the pPheA* plants also implies that Arabidopsis
plants possess an endogenous activity that converts the PPY
produced by the bacterial CM/PDT into Phe. In the absence
of such an activity, we would have expected to observe a
notable accumulation of PPY (the final product of the
bi-functional bacterial PheA enzyme) rather than Phe, while
the opposite was observed experimentally, i.e. we observed
a significant accumulation of Phe while that of PPY remained
below the detection level. In order to synthesize Phe via PPY,
Arabidopsis plants must possess three distinct enzymatic
activities, namely CM, PDT and aromatic amino acid ami-
notransferase (Figure 1). The presence of endogenous CM
activity in plants is well documented (Eberhard et al., 1996;
Mobley et al., 1999). In addition, some of the six putative
Arabidopsis ADT/PDT isozymes were shown to possess PDT
activity when expressed in E. coli, and also complemented a
yeast PDT null mutant (Cho et al., 2007), implying that these
isozymes can also convert prephenate into PPY in vivo. So
far, no aminotransferase converting PPY into Phe has been
described in plants. However, studies in bacteria have
shown that the reciprocal conversion between PPY and Phe
can be catalyzed by a number of aminotransferases (Gelfand
and Rudo, 1977; see also http://www.genome.ad.jp/kegg/
pathway.html), and it is thus very likely that analogous plant
aminotransferases could also catalyze this reciprocal
reaction. Moreover, plants naturally possess PPY, and it has
also been shown that some plant species can convert Phe
into PPY in vivo (Watanabe et al., 2002; Kaminaga et al.,
2006).
It is also possible that part of the prephenate that was
over-produced by the bacterial CM activity was converted
via arogenate into Phe by endogenous plant enzymes.
However, our results do not support a major increased flux
through arogenate into Phe in the PheA*-expressing plants
as the endogenous ADT activity in plants is naturally
feedback-inhibited by Phe, and a mutation rendering this
activity feedback-insensitive is required to over-produce Phe
via the arogenate route (Yamada et al., 2008). Notably, even
though arogenate has proven to be a precursor for both Phe
and Tyr in plants, an enzyme converting prephenate into
arogenate has not yet been identified. Thus, despite a
number of missing links, the combination of the present
report and previous reports supports the hypothesis that
plants can synthesize Phe via both the arogenate and PPY
routes.
Cross-regulation of Phe and Trp biosynthesis
pPheA* expression rendered the plants more sensitive
than the control plants to growth on medium containing the
Trp analog 5MT (Figure 8). In addition, pPheA* expression
caused a reduction in the levels of the Trp-derived secondary
metabolites 6-hydroxyindole-3-carboxylate-6-O-b-D-gluco-
pyranoside, 6-hydroxyindole-3-carboxylate-b-D-glucopyr-
anosyl ester and tryptophan-N-formyl-methyl ester
(Figures 6 and 9). These results indicate that pPheA*
expression slows down the flux of Trp biosynthesis. Inter-
estingly, expression of a feedback-insensitive AS of Trp
biosynthesis in transgenic rice increased Trp biosynthesis,
but had no effect on the levels of Phe and Tyr (Dubouzet
(a)
(b)
Figure 8. Effect of pPheA* expression in plants on Tyr catabolism.
(a) Effect of growth in the presence of increasing concentrations of the
herbicide isoxaflutole on chlorophyll content of the pPheA* and control
plants.
(b) Effect of pPheA* expression in plants on the level of the tocochromanol
metabolites c-tocopherol and c-tocotrienol extracted from aerial tissues of 10-
day-old Arabidopsis seedlings detected by HPLC (n = 5). ND, not detected;
Con, control.
Bars represent the standard error; asterisks indicate statistically significant
changes (P < 0.05 using Student’s t test).
Figure 7. Effect of 5-methyl-Trp (5MT) on the growth of plants expressing the
pPheA* gene.
Seeds were germinated on medium lacking (left) or containing (right) 100 lM
5MT. The various lines tested are indicated near the location of their seedlings
on the plates.
162 Vered Tzin et al.
ª 2009 The AuthorsJournal compilation ª 2009 Blackwell Publishing Ltd, The Plant Journal, (2009), 60, 156–167
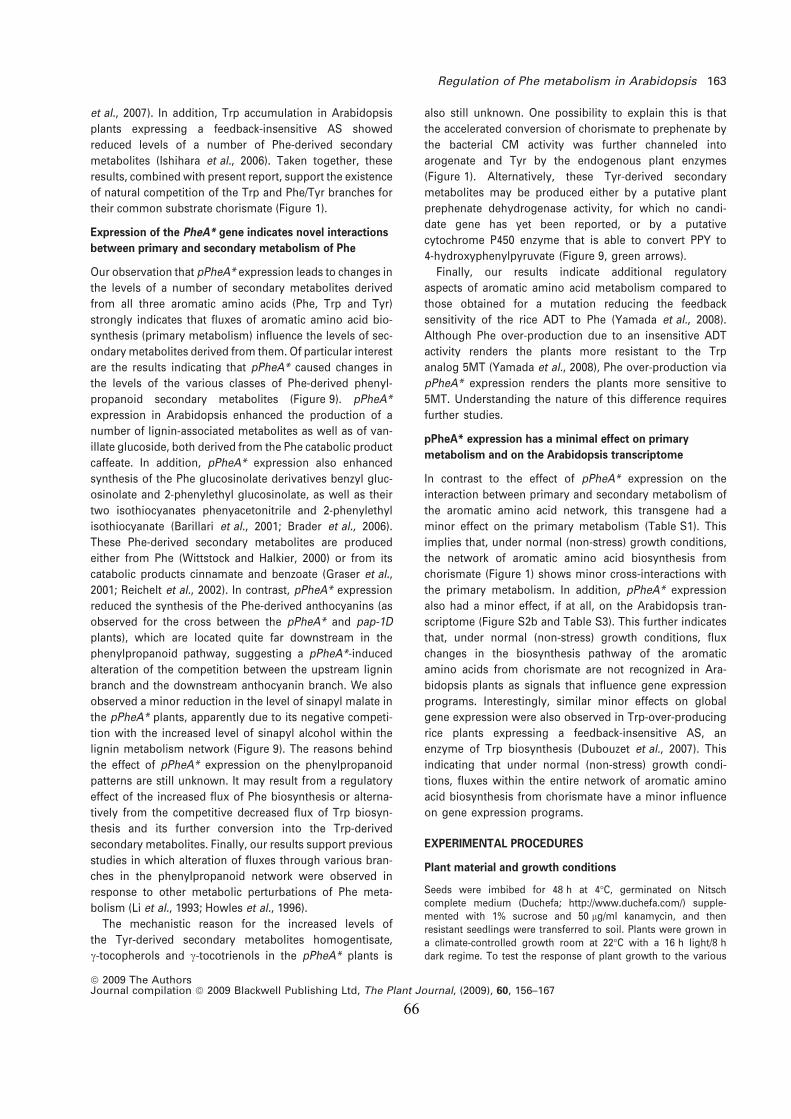
66
et al., 2007). In addition, Trp accumulation in Arabidopsis
plants expressing a feedback-insensitive AS showed
reduced levels of a number of Phe-derived secondary
metabolites (Ishihara et al., 2006). Taken together, these
results, combined with present report, support the existence
of natural competition of the Trp and Phe/Tyr branches for
their common substrate chorismate (Figure 1).
Expression of the PheA* gene indicates novel interactions
between primary and secondary metabolism of Phe
Our observation that pPheA* expression leads to changes in
the levels of a number of secondary metabolites derived
from all three aromatic amino acids (Phe, Trp and Tyr)
strongly indicates that fluxes of aromatic amino acid bio-
synthesis (primary metabolism) influence the levels of sec-
ondary metabolites derived from them. Of particular interest
are the results indicating that pPheA* caused changes in
the levels of the various classes of Phe-derived phenyl-
propanoid secondary metabolites (Figure 9). pPheA*
expression in Arabidopsis enhanced the production of a
number of lignin-associated metabolites as well as of van-
illate glucoside, both derived from the Phe catabolic product
caffeate. In addition, pPheA* expression also enhanced
synthesis of the Phe glucosinolate derivatives benzyl gluc-
osinolate and 2-phenylethyl glucosinolate, as well as their
two isothiocyanates phenyacetonitrile and 2-phenylethyl
isothiocyanate (Barillari et al., 2001; Brader et al., 2006).
These Phe-derived secondary metabolites are produced
either from Phe (Wittstock and Halkier, 2000) or from its
catabolic products cinnamate and benzoate (Graser et al.,
2001; Reichelt et al., 2002). In contrast, pPheA* expression
reduced the synthesis of the Phe-derived anthocyanins (as
observed for the cross between the pPheA* and pap-1D
plants), which are located quite far downstream in the
phenylpropanoid pathway, suggesting a pPheA*-induced
alteration of the competition between the upstream lignin
branch and the downstream anthocyanin branch. We also
observed a minor reduction in the level of sinapyl malate in
the pPheA* plants, apparently due to its negative competi-
tion with the increased level of sinapyl alcohol within the
lignin metabolism network (Figure 9). The reasons behind
the effect of pPheA* expression on the phenylpropanoid
patterns are still unknown. It may result from a regulatory
effect of the increased flux of Phe biosynthesis or alterna-
tively from the competitive decreased flux of Trp biosyn-
thesis and its further conversion into the Trp-derived
secondary metabolites. Finally, our results support previous
studies in which alteration of fluxes through various bran-
ches in the phenylpropanoid network were observed in
response to other metabolic perturbations of Phe meta-
bolism (Li et al., 1993; Howles et al., 1996).
The mechanistic reason for the increased levels of
the Tyr-derived secondary metabolites homogentisate,
c-tocopherols and c-tocotrienols in the pPheA* plants is
also still unknown. One possibility to explain this is that
the accelerated conversion of chorismate to prephenate by
the bacterial CM activity was further channeled into
arogenate and Tyr by the endogenous plant enzymes
(Figure 1). Alternatively, these Tyr-derived secondary
metabolites may be produced either by a putative plant
prephenate dehydrogenase activity, for which no candi-
date gene has yet been reported, or by a putative
cytochrome P450 enzyme that is able to convert PPY to
4-hydroxyphenylpyruvate (Figure 9, green arrows).
Finally, our results indicate additional regulatory
aspects of aromatic amino acid metabolism compared to
those obtained for a mutation reducing the feedback
sensitivity of the rice ADT to Phe (Yamada et al., 2008).
Although Phe over-production due to an insensitive ADT
activity renders the plants more resistant to the Trp
analog 5MT (Yamada et al., 2008), Phe over-production via
pPheA* expression renders the plants more sensitive to
5MT. Understanding the nature of this difference requires
further studies.
pPheA* expression has a minimal effect on primary
metabolism and on the Arabidopsis transcriptome
In contrast to the effect of pPheA* expression on the
interaction between primary and secondary metabolism of
the aromatic amino acid network, this transgene had a
minor effect on the primary metabolism (Table S1). This
implies that, under normal (non-stress) growth conditions,
the network of aromatic amino acid biosynthesis from
chorismate (Figure 1) shows minor cross-interactions with
the primary metabolism. In addition, pPheA* expression
also had a minor effect, if at all, on the Arabidopsis tran-
scriptome (Figure S2b and Table S3). This further indicates
that, under normal (non-stress) growth conditions, flux
changes in the biosynthesis pathway of the aromatic
amino acids from chorismate are not recognized in Ara-
bidopsis plants as signals that influence gene expression
programs. Interestingly, similar minor effects on global
gene expression were also observed in Trp-over-producing
rice plants expressing a feedback-insensitive AS, an
enzyme of Trp biosynthesis (Dubouzet et al., 2007). This
indicating that under normal (non-stress) growth condi-
tions, fluxes within the entire network of aromatic amino
acid biosynthesis from chorismate have a minor influence
on gene expression programs.
EXPERIMENTAL PROCEDURES
Plant material and growth conditions
Seeds were imbibed for 48 h at 4�C, germinated on Nitschcomplete medium (Duchefa; http://www.duchefa.com/) supple-mented with 1% sucrose and 50 lg/ml kanamycin, and thenresistant seedlings were transferred to soil. Plants were grown ina climate-controlled growth room at 22�C with a 16 h light/8 hdark regime. To test the response of plant growth to the various
Regulation of Phe metabolism in Arabidopsis 163
ª 2009 The AuthorsJournal compilation ª 2009 Blackwell Publishing Ltd, The Plant Journal, (2009), 60, 156–167
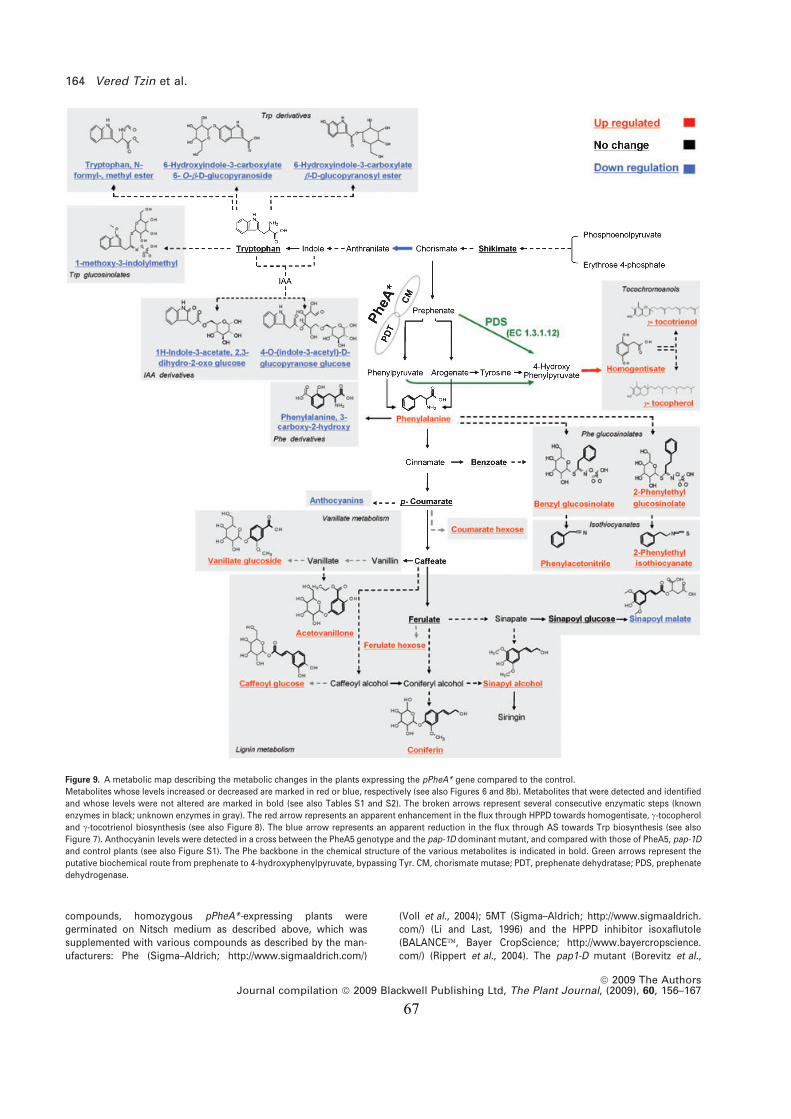
67
compounds, homozygous pPheA*-expressing plants weregerminated on Nitsch medium as described above, which wassupplemented with various compounds as described by the man-ufacturers: Phe (Sigma–Aldrich; http://www.sigmaaldrich.com/)
(Voll et al., 2004); 5MT (Sigma–Aldrich; http://www.sigmaaldrich.com/) (Li and Last, 1996) and the HPPD inhibitor isoxaflutole(BALANCE�, Bayer CropScience; http://www.bayercropscience.com/) (Rippert et al., 2004). The pap1-D mutant (Borevitz et al.,
Figure 9. A metabolic map describing the metabolic changes in the plants expressing the pPheA* gene compared to the control.
Metabolites whose levels increased or decreased are marked in red or blue, respectively (see also Figures 6 and 8b). Metabolites that were detected and identified
and whose levels were not altered are marked in bold (see also Tables S1 and S2). The broken arrows represent several consecutive enzymatic steps (known
enzymes in black; unknown enzymes in gray). The red arrow represents an apparent enhancement in the flux through HPPD towards homogentisate, c-tocopherol
and c-tocotrienol biosynthesis (see also Figure 8). The blue arrow represents an apparent reduction in the flux through AS towards Trp biosynthesis (see also
Figure 7). Anthocyanin levels were detected in a cross between the PheA5 genotype and the pap-1D dominant mutant, and compared with those of PheA5, pap-1D
and control plants (see also Figure S1). The Phe backbone in the chemical structure of the various metabolites is indicated in bold. Green arrows represent the
putative biochemical route from prephenate to 4-hydroxyphenylpyruvate, bypassing Tyr. CM, chorismate mutase; PDT, prephenate dehydratase; PDS, prephenate
dehydrogenase.
164 Vered Tzin et al.
ª 2009 The AuthorsJournal compilation ª 2009 Blackwell Publishing Ltd, The Plant Journal, (2009), 60, 156–167
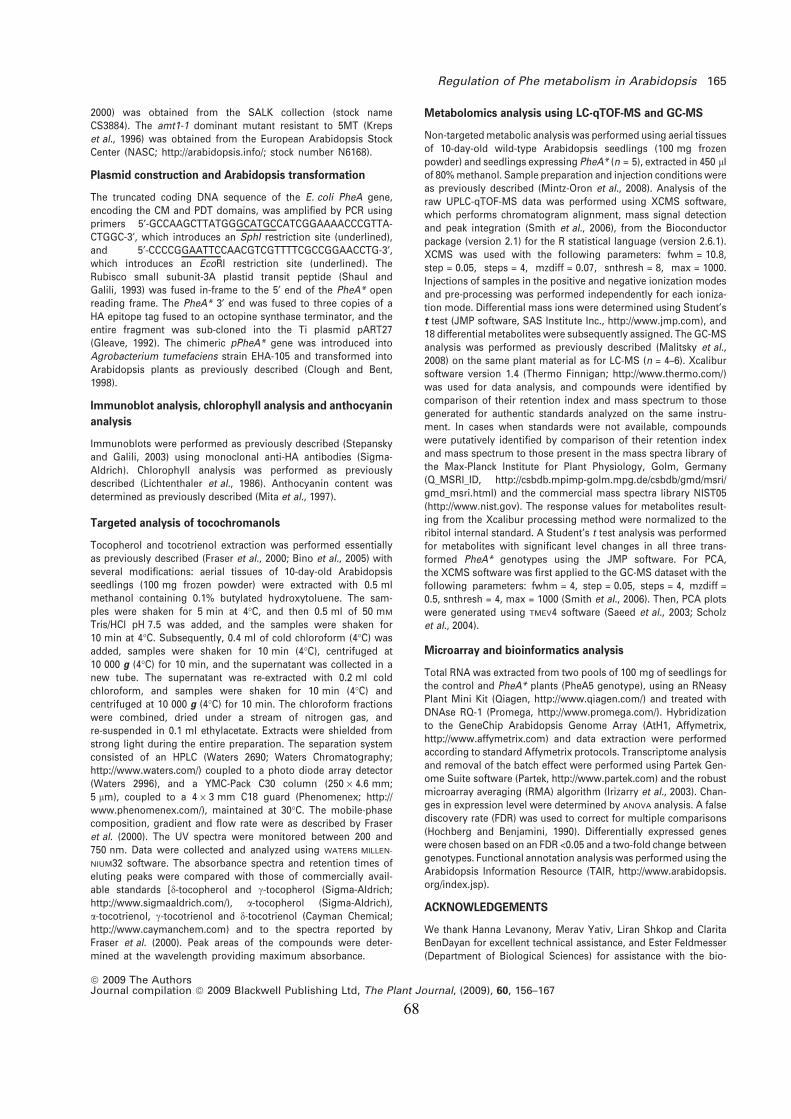
68
2000) was obtained from the SALK collection (stock nameCS3884). The amt1-1 dominant mutant resistant to 5MT (Krepset al., 1996) was obtained from the European Arabidopsis StockCenter (NASC; http://arabidopsis.info/; stock number N6168).
Plasmid construction and Arabidopsis transformation
The truncated coding DNA sequence of the E. coli PheA gene,encoding the CM and PDT domains, was amplified by PCR usingprimers 5¢-GCCAAGCTTATGGGCATGCCATCGGAAAACCCGTTA-CTGGC-3¢, which introduces an SphI restriction site (underlined),and 5¢-CCCCGGAATTCCAACGTCGTTTTCGCCGGAACCTG-3¢,which introduces an EcoRI restriction site (underlined). TheRubisco small subunit-3A plastid transit peptide (Shaul andGalili, 1993) was fused in-frame to the 5¢ end of the PheA* openreading frame. The PheA* 3¢ end was fused to three copies of aHA epitope tag fused to an octopine synthase terminator, and theentire fragment was sub-cloned into the Ti plasmid pART27(Gleave, 1992). The chimeric pPheA* gene was introduced intoAgrobacterium tumefaciens strain EHA-105 and transformed intoArabidopsis plants as previously described (Clough and Bent,1998).
Immunoblot analysis, chlorophyll analysis and anthocyanin
analysis
Immunoblots were performed as previously described (Stepanskyand Galili, 2003) using monoclonal anti-HA antibodies (Sigma-Aldrich). Chlorophyll analysis was performed as previouslydescribed (Lichtenthaler et al., 1986). Anthocyanin content wasdetermined as previously described (Mita et al., 1997).
Targeted analysis of tocochromanols
Tocopherol and tocotrienol extraction was performed essentiallyas previously described (Fraser et al., 2000; Bino et al., 2005) withseveral modifications: aerial tissues of 10-day-old Arabidopsisseedlings (100 mg frozen powder) were extracted with 0.5 mlmethanol containing 0.1% butylated hydroxytoluene. The sam-ples were shaken for 5 min at 4�C, and then 0.5 ml of 50 mM
Tris/HCl pH 7.5 was added, and the samples were shaken for10 min at 4�C. Subsequently, 0.4 ml of cold chloroform (4�C) wasadded, samples were shaken for 10 min (4�C), centrifuged at10 000 g (4�C) for 10 min, and the supernatant was collected in anew tube. The supernatant was re-extracted with 0.2 ml coldchloroform, and samples were shaken for 10 min (4�C) andcentrifuged at 10 000 g (4�C) for 10 min. The chloroform fractionswere combined, dried under a stream of nitrogen gas, andre-suspended in 0.1 ml ethylacetate. Extracts were shielded fromstrong light during the entire preparation. The separation systemconsisted of an HPLC (Waters 2690; Waters Chromatography;http://www.waters.com/) coupled to a photo diode array detector(Waters 2996), and a YMC-Pack C30 column (250 · 4.6 mm;5 lm), coupled to a 4 · 3 mm C18 guard (Phenomenex; http://www.phenomenex.com/), maintained at 30�C. The mobile-phasecomposition, gradient and flow rate were as described by Fraseret al. (2000). The UV spectra were monitored between 200 and750 nm. Data were collected and analyzed using WATERS MILLEN-
NIUM32 software. The absorbance spectra and retention times ofeluting peaks were compared with those of commercially avail-able standards [d-tocopherol and c-tocopherol (Sigma-Aldrich;http://www.sigmaaldrich.com/), a-tocopherol (Sigma-Aldrich),a-tocotrienol, c-tocotrienol and d-tocotrienol (Cayman Chemical;http://www.caymanchem.com) and to the spectra reported byFraser et al. (2000). Peak areas of the compounds were deter-mined at the wavelength providing maximum absorbance.
Metabolomics analysis using LC-qTOF-MS and GC-MS
Non-targeted metabolic analysis was performed using aerial tissuesof 10-day-old wild-type Arabidopsis seedlings (100 mg frozenpowder) and seedlings expressing PheA* (n = 5), extracted in 450 llof 80% methanol. Sample preparation and injection conditions wereas previously described (Mintz-Oron et al., 2008). Analysis of theraw UPLC-qTOF-MS data was performed using XCMS software,which performs chromatogram alignment, mass signal detectionand peak integration (Smith et al., 2006), from the Bioconductorpackage (version 2.1) for the R statistical language (version 2.6.1).XCMS was used with the following parameters: fwhm = 10.8,step = 0.05, steps = 4, mzdiff = 0.07, snthresh = 8, max = 1000.Injections of samples in the positive and negative ionization modesand pre-processing was performed independently for each ioniza-tion mode. Differential mass ions were determined using Student’st test (JMP software, SAS Institute Inc., http://www.jmp.com), and18 differential metabolites were subsequently assigned. The GC-MSanalysis was performed as previously described (Malitsky et al.,2008) on the same plant material as for LC-MS (n = 4–6). Xcalibursoftware version 1.4 (Thermo Finnigan; http://www.thermo.com/)was used for data analysis, and compounds were identified bycomparison of their retention index and mass spectrum to thosegenerated for authentic standards analyzed on the same instru-ment. In cases when standards were not available, compoundswere putatively identified by comparison of their retention indexand mass spectrum to those present in the mass spectra library ofthe Max-Planck Institute for Plant Physiology, Golm, Germany(Q_MSRI_ID, http://csbdb.mpimp-golm.mpg.de/csbdb/gmd/msri/gmd_msri.html) and the commercial mass spectra library NIST05(http://www.nist.gov). The response values for metabolites result-ing from the Xcalibur processing method were normalized to theribitol internal standard. A Student’s t test analysis was performedfor metabolites with significant level changes in all three trans-formed PheA* genotypes using the JMP software. For PCA,the XCMS software was first applied to the GC-MS dataset with thefollowing parameters: fwhm = 4, step = 0.05, steps = 4, mzdiff =0.5, snthresh = 4, max = 1000 (Smith et al., 2006). Then, PCA plotswere generated using TMEV4 software (Saeed et al., 2003; Scholzet al., 2004).
Microarray and bioinformatics analysis
Total RNA was extracted from two pools of 100 mg of seedlings forthe control and PheA* plants (PheA5 genotype), using an RNeasyPlant Mini Kit (Qiagen, http://www.qiagen.com/) and treated withDNAse RQ-1 (Promega, http://www.promega.com/). Hybridizationto the GeneChip Arabidopsis Genome Array (AtH1, Affymetrix,http://www.affymetrix.com) and data extraction were performedaccording to standard Affymetrix protocols. Transcriptome analysisand removal of the batch effect were performed using Partek Gen-ome Suite software (Partek, http://www.partek.com) and the robustmicroarray averaging (RMA) algorithm (Irizarry et al., 2003). Chan-ges in expression level were determined by ANOVA analysis. A falsediscovery rate (FDR) was used to correct for multiple comparisons(Hochberg and Benjamini, 1990). Differentially expressed geneswere chosen based on an FDR <0.05 and a two-fold change betweengenotypes. Functional annotation analysis was performed using theArabidopsis Information Resource (TAIR, http://www.arabidopsis.org/index.jsp).
ACKNOWLEDGEMENTS
We thank Hanna Levanony, Merav Yativ, Liran Shkop and ClaritaBenDayan for excellent technical assistance, and Ester Feldmesser(Department of Biological Sciences) for assistance with the bio-
Regulation of Phe metabolism in Arabidopsis 165
ª 2009 The AuthorsJournal compilation ª 2009 Blackwell Publishing Ltd, The Plant Journal, (2009), 60, 156–167
69
informatics analysis. We thank the Salk Institute Genomic AnalysisLaboratory for providing the sequence-indexed Arabidopsis T-DNAinsertion mutants. This study was supported by a Magnet Programof the Israeli Ministry of Industry, Trade and Labor and the IsraeliBio-TOV Consortium including Evogene Ltd, Frutarom Ltd, HazeraGenetics Ltd, Rahan Meristem (1998) Ltd and Zeraim Gedera Ltd.G.G. is the incumbent of the Bronfman Chair in Plant Sciences. A.A.is the incumbent of the Adolpho and Evelyn Blum Career Develop-ment Chair. The work in the Aharoni laboratory was supported byresearch grants from Sir Harry Djanogly CBE, Mrs Louise Gartner(Dallas, TX) and Mr and Mrs Mordechai Segal (Israel). Arye Tishbeeis thanked for operating the LC-MS instrument.
SUPPORTING INFORMATION
Additional Supporting Information may be found in the onlineversion of this article:Table S1. List of putative metabolites identified in aerial tissues of10-day-old Arabidopsis seedlings by GC-MS analyses.Table S2. List of putative metabolites identified in aerial tissues of10-day-old Arabidopsis seedlings by UPLC-qTOF-MS and MS-MSanalyses.Table S3. List of mRNA transcripts that were significantly induced orrepressed (fold change >2 or <)2) between the control and pPheA*plants.Figure S1. Effect of pPheA* expression on the shoot anthocyanincontent.Figure S2. Microarray data analysis for the PheA5 and controlgenotypes.Please note: Wiley-Blackwell are not responsible for the content orfunctionality of any supporting materials supplied by the authors.Any queries (other than missing material) should be directed to thecorresponding author for the article.
REFERENCES
Barillari, J., Gueyrard, D., Rollin, P. and Iori, R. (2001) Barbarea verna as a
source of 2-phenylethyl glucosinolate, precursor of cancer chemopreven-
tive phenylethyl isothiocyanate. Fitoterapia, 72, 760–764.
Bino, R.J., Ric de Vos, C.H., Lieberman, M., Hall, R.D., Bovy, A., Jonker, H.H.,
Tikunov, Y., Lommen, A., Moco, S. and Levin, I. (2005) The light-hyperre-
sponsive high pigment-2dg mutation of tomato: alterations in the fruit
metabolome. New Phytol. 166, 427–438.
Boatright, J., Negre, F., Chen, X., Kish, C.M., Wood, B., Peel, G., Orlova, I.,
Gang, D., Rhodes, D. and Dudareva, N. (2004) Understanding in vivo ben-
zenoid metabolism in petunia petal tissue. Plant Physiol. 135, 1993–2011.
Borevitz, J.O., Xia, Y., Blount, J., Dixon, R.A. and Lamb, C. (2000) Activation
tagging identifies a conserved MYB regulator of phenylpropanoid bio-
synthesis. Plant Cell, 12, 2383–2394.
Brader, G., Mikkelsen, M.D., Halkier, B.A. and Tapio Palva, E. (2006) Altering
glucosinolate profiles modulates disease resistance in plants. Plant J. 46,
758–767.
Byng, G., Whitaker, R., Flick, C. and Jensen, R.A. (1981) Enzymology of
L-tyrosine biosynthesis in corn (Zea mays). Phytochemistry, 6, 1289–1292.
Cho, M.-H., Corea, O.R., Yang, H. et al. (2007) Phenylalanine biosynthesis in
Arabidopsis thaliana. Identification and characterization of arogenate
dehydratases.. J. Biol. Chem. 282, 30827–30835.
Clough, S.J. and Bent, A.F. (1998) Floral dip: a simplified method for Agro-
bacterium-mediated transformation of Arabidopsis thaliana. Plant J. 16,
735–743.
Connelly, J.A. and Conn, E.E. (1986) Tyrosine biosynthesis in Sorghum
bicolor: isolation and regulatory properties of arogenate dehydrogenase.
Z. Naturforsch. [C], 41, 69–78.
De-Eknamkul, W. and Ellis, B.E. (1988) Purification and characterization of
prephenate aminotransferase from Anchusa officinalis cell cultures. Arch.
Biochem. Biophys. 267, 87–94.
DellaPenna, D. and Pogson, B. (2006) Vitamin synthesis in plants: tocopherols
and carotenoids. Annu. Rev. Plant Biol. 57, 711–738.
Dubouzet, J.G., Ishihara, A., Matsuda, F., Miyagawa, H., Iwata, H. and
Wakasa, K. (2007) Integrated metabolomic and transcriptomic analyses of
high-tryptophan rice expressing a mutant anthranilate synthase alpha
subunit. J. Exp. Bot. 58, 3309–3321.
Eberhard, J., Ehrler, T.T., Epple, P., Felix, G., Raesecke, H.R., Amrhein, N. and
Schmid, J. (1996) Cytosolic and plastidic chorismate mutase isozymes from
Arabidopsis thaliana: molecular characterization and enzymatic properties.
Plant J. 10, 815–821.
Fraser, P.D., Pinto, M.E., Holloway, D.E. and Bramley, P.M. (2000) Application
of high-performance liquid chromatography with photodiode array
detection to the metabolic profiling of plant isoprenoids. Plant J. 24, 551–
558.
Gaines, C.G., Gyng, G.S., Whitaker, R.J. and Jensen, R.A. (1982) L-tyrosine
regulation and biosynthesis via arogenate dehydrogenase in suspension-
cultured cells of Nicotiana sylvestris Speg. et Comes. Planta, 156, 233–240.
Gelfand,D.H. and Rudo,N. (1977) Mappingof the aspartateand aromaticamino
acid aminotransferase genes tyrB and aspC. J. Bacteriol. 130, 441–444.
Gleave, A.P. (1992) A versatile binary vector system with a T-DNA organisa-
tional structure conducive to efficient integration of cloned DNA into the
plant genome. Plant Mol. Biol. 20, 1203–1207.
Graser, G., Oldham, N.J., Brown, P.D., Temp, U. and Gershenzon, J. (2001)
The biosynthesis of benzoic acid glucosinolate esters in Arabidopsis tha-
liana. Phytochemistry, 57, 23–32.
Haslam, E. (1993) Shikimic Acid Metabolism and Metabolites. New York: John
Wiley.
Herrmann, K. (1995) The shikimate pathway as an entry to aromatic secondary
metabolism. Plant Physiol. 107, 7–12.
Hochberg, Y. and Benjamini, Y. (1990) More powerful procedures for multiple
significance testing. Stat. Med. 9, 811–818.
Howles, P.A., Sewalt, V., Paiva, N.L., Elkind, Y., Bate, N.J., Lamb, C. and
Dixon, R.A. (1996) Overexpression of L-phenylalanine ammonia-lyase in
transgenic tobacco plants reveals control points for flux into phenylprop-
anoid biosynthesis. Plant Physiol. 112, 1617–1624.
Irizarry, R.A., Hobbs, B., Collin, F., Beazer-Barclay, Y.D., Antonellis, K.J.,
Scherf, U. and Speed, T.P. (2003) Exploration, normalization, and sum-
maries of high density oligonucleotide array probe level data. Biostatistics,
4, 249–264.
Ishihara, A., Asada, Y., Takahashi, Y., Yabe, N., Komeda, Y., Nishioka, T.,
Miyagawa, H. and Wakasa, K. (2006) Metabolic changes in Arabidopsis
thaliana expressing the feedback-resistant anthranilate synthase alpha
subunit gene OASA1D. Phytochemistry, 67, 2349–2362.
Kaminaga, Y., Schnepp, J., Peel, G. et al. (2006) Plant phenylacetaldehyde
synthase is a bifunctional homotetrameric enzyme that catalyzes
phenylalanine decarboxylation and oxidation. J. Biol. Chem. 281, 23357–
23366.
Keller, B., Keller, E., Gorisch, H. and Lingens, F. (1983) Phenylalanine and
tyrosine biosynthesis in Streptomycetes. Hoppe Seylers Z. Physiol. Chem.
364, 455–459. (in German).
Kisaka, H., Kisaka, M. and Kameya, T. (1996) Characterization of interfamilial
somatic hybrids between 5-methyltryptophan resistant rice (Oryza sativa
L.) and 5MT-sensitive carrot (Daucus carota L.); expression of resistance to
5MT by the somatic hybrids. Breed. Sci. 46, 221–226.
Kreps, J.A., Ponappa, T., Dong, W.Q. and Town, C.D. (1996) Molecular basis of
a-methyltryptophan resistance in amt-1, a mutant of Arabidopsis thaliana
with altered tryptophan metabolism. Plant Physiol. 110, 1159–1165.
Kubasek, W.L., Shirley, B.W., McKillop, A., Goodman, H.M., Briggs, W. and
Ausubel, F.M. (1992) Regulation of flavonoid biosynthetic genes in ger-
minating Arabidopsis seedlings. Plant Cell, 4, 1229–1236.
Kuramitsu, S., Inoue, K., Ogawa, T., Ogawa, H. and Kagamiyama, H. (1985)
Aromatic amino acid aminotransferase of Escherichia coli: nucleotide
sequence of the tyrB gene. Biochem. Biophys. Res. Commun. 133, 134–139.
Li, J. and Last, R.L. (1996) The Arabidopsis thaliana trp5 mutant has a feed-
back-resistant anthranilate synthase and elevated soluble tryptophan.
Plant Physiol. 110, 51–59.
Li, J., Ou-Lee, T.M., Raba, R., Amundson, R.G. and Last, R.L. (1993) Arabid-
opsis flavonoid mutants are hypersensitive to UV-B irradiation. Plant Cell,
5, 171–179.
Lichtenthaler, H.K., Buschmann, C., Rinderle, U. and Schmuck, G. (1986)
Application of chlorophyll fluorescence in ecophysiology. Radiat. Environ.
Biophys. 25, 297–308.
166 Vered Tzin et al.
ª 2009 The AuthorsJournal compilation ª 2009 Blackwell Publishing Ltd, The Plant Journal, (2009), 60, 156–167
70
Malitsky, S., Blum, E., Less, H., Venger, I., Elbaz, M., Morin, S., Eshed, Y. and
Aharoni, A. (2008) The transcript and metabolite networks affected by the
two clades of Arabidopsis glucosinolate biosynthesis regulators. Plant
Physiol. 148, 2021–2049.
Mintz-Oron, S., Mandel, T., Rogachev, I. et al. (2008) Gene expression and
metabolism in tomato fruit surface tissues. Plant Physiol. 147, 823–851.
Mita, S., Murano, N., Akaike, M. and Nakamura, K. (1997) Mutants of Ara-
bidopsis thaliana with pleiotropic effects on the expression of the gene for
b-amylase and on the accumulation of anthocyanin that are inducible by
sugars. Plant J. 11, 841–851.
Mobley, E.M., Kunkel, B.N. and Keith, B. (1999) Identification, characterization
and comparative analysis of a novel chorismate mutase gene in Arabid-
opsis thaliana. Gene, 240, 115–123.
Pallett, K., Little, J., Sheekey, M. and Veerasekaran, P. (1998) The mode of
action of isoxaflutole: 1. Physiological effects, metabolism and selectivity.
Pestic. Biochem. Physiol. 62, 113–124.
Patel, N., Pierson, D.L. and Jensen, R.A. (1977) Dual enzymatic routes to
L-tyrosine and L-phenylalanine via pretyrosine in Pseudomonas aerugin-
osa. J. Biol. Chem. 252, 5839–5846.
Reichelt, M., Brown, P.D., Schneider, B., Oldham, N.J., Stauber, E., Tokuhisa,
J., Kliebenstein, D.J., Mitchell-Olds, T. and Gershenzon, J. (2002) Benzoic
acid glucosinolate esters and other glucosinolates from Arabidopsis tha-
liana. Phytochemistry, 59, 663–671.
Rippert, P. and Matringe, M. (2002) Molecular and biochemical characteriza-
tion of an Arabidopsis thaliana arogenate dehydrogenase with two highly
similar and active protein domains. Plant Mol. Biol. 48, 361–368.
Rippert, P., Scimemi, C., Dubald, M. and Matringe, M. (2004) Engineering
plant shikimate pathway for production of tocotrienol and improving her-
bicide resistance. Plant Physiol. 134, 92–100.
Romero, R., Roberts, M. and Phillipson, J. (1995) Chorismate mutase in
microorganisms and plants. Phytochemistry, 40, 1015–1025.
Saeed, A.I., Sharov, V., White, J. et al. (2003) TM4: a free, open-source system
for microarray data management and analysis. BioTechniques, 34, 374–378.
Scholz, M., Gatzek, S., Sterling, A., Fiehn, O. and Selbig, J. (2004) Metabolite
fingerprinting: detecting biological features by independent component
analysis. Bioinformatics, 20, 2447–2454.
Schulz, A., Ort, O., Beyer, P. and Klenig, H. (1993) A 2-benzoyl-cyclohexane-
1,3-dione bleaching herbicide, is a potent inhibitor of the enzyme p-hy-
droxyphenylpyruvate dioxygenase. FEBS Lett. 318, 162–166.
Secor, J. (1994) Inhibition of barnyardgrass 4-hydroxyphenylpyruvate dioxy-
genase by sulcotrione. Plant Physiol. 106, 1429–1433.
Shaul, O. and Galili, G. (1993) Concerted regulation of lysine and threonine
synthesis in tobacco plants expressing bacterial feedback-insensitive
aspartate kinase and dihydrodipicolinate synthase. Plant Mol. Biol. 23, 759–
768.
Siehl, D.L. and Conn, E.E. (1988) Kinetic and regulatory properties of aro-
genate dehydratase in seedlings of Sorghum bicolor (L.) Moench. Arch.
Biochem. Biophys. 260, 822–829.
Siehl, D.L., Connelly, J.A. and Conn, E.E. (1986) Tyrosine biosynthesis in
Sorghum bicolor: characteristics of prephenate aminotransferase. Z.
Naturforsch. [C], 41, 79–86.
Smith, C., Want, E., O’Maille, G., Abagyan, R. and Siuzdak, G. (2006)
XCMS: processing mass spectrometry data for metabolite profiling using
nonlinear peak alignment, matching, and identification. Anal. Chem. 78,
779–787.
Stepansky, A. and Galili, G. (2003) Synthesis of the Arabidopsis bifunctional
lysine-ketoglutarate reductase/saccharopine dehydrogenase enzyme of
lysine catabolism is concertedly regulated by metabolic and stress-asso-
ciated signals. Plant Physiol. 133, 1407–1415.
Voll, L.M., Allaire, E.E., Fiene, G. and Weber, A.P. (2004) The Arabidopsis
phenylalanine insensitive growth mutant exhibits a deregulated amino
acid metabolism. Plant Physiol. 136, 3058–3069.
Watanabe, S., Hayashi, K., Yagi, K., Asai, T., MacTavish, H., Picone, J., Turn-
bull, C. and Watanabe, N. (2002) Biogenesis of 2-phenylethanol in rose
flowers: incorporation of [2H8]L-phenylalanine into 2-phenylethanol and its
b-D-glucopyranoside during the flower opening of Rosa ‘Hoh-Jun’ and
Rosa damascena Mill. Biosci. Biotechnol. Biochem. 66, 943–947.
Widholm, J.M. (1972) Anthranilate synthetase from 5-methyltryptophan-
susceptible and -resistant cultured Daucus carota cells. Biochim. Biophys.
Acta, 279, 48–57.
Wittstock, U. and Halkier, B.A. (2000) Cytochrome P450 CYP79A2 from Ara-
bidopsis thaliana L. catalyzes the conversion of L-phenylalanine to phen-
ylacetaldoxime in the biosynthesis of benzylglucosinolate. J. Biol. Chem.
275, 14659–14666.
Yamada, T., Matsuda, F., Kasai, K., Fukuoka, S., Kitamura, K., Tozawa, Y.,
Miyagawa, H. and Wakasa, K. (2008) Mutation of a rice gene encoding a
phenylalanine biosynthetic enzyme results in accumulation of phenylala-
nine and tryptophan. Plant Cell, 20, 1316–1329.
Zhang, S., Pohnerts, G., Kongsaeree, P., Wilson, D.B., Clardy, J. and Ganem,
B. (1998) Chorismate mutase–prephenate dehydratase from Escherichia
coli. Study of catalytic and regulatory domains using genetically engi-
neered proteins. J. Biol. Chem. 273, 6248–6253.
Regulation of Phe metabolism in Arabidopsis 167
ª 2009 The AuthorsJournal compilation ª 2009 Blackwell Publishing Ltd, The Plant Journal, (2009), 60, 156–167
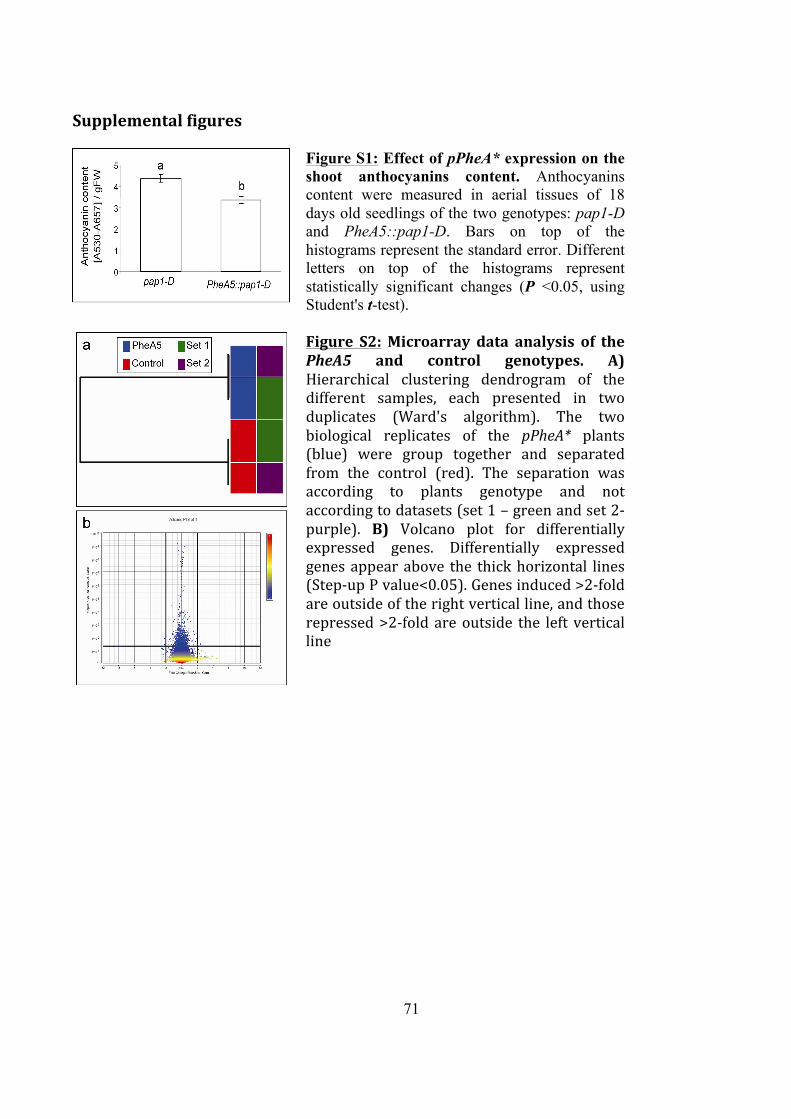
71
Supplemental figures
Figure S1: Effect of pPheA* expression on the shoot anthocyanins content. Anthocyanins content were measured in aerial tissues of 18 days old seedlings of the two genotypes: pap1-D and PheA5::pap1-D. Bars on top of the histograms represent the standard error. Different letters on top of the histograms represent statistically significant changes (P <0.05, using Student's t-test).
Figure S2: Microarray data analysis of the PheA5 and control genotypes. A) Hierarchical clustering dendrogram of the different samples, each presented in two duplicates (Ward's algorithm). The two biological replicates of the pPheA* plants (blue) were group together and separated from the control (red). The separation was according to plants genotype and not according to datasets (set 1 – green and set 2-‐ purple). B) Volcano plot for differentially expressed genes. Differentially expressed genes appear above the thick horizontal lines (Step-‐up P value<0.05). Genes induced >2-‐fold are outside of the right vertical line, and those repressed >2-‐fold are outside the left vertical line
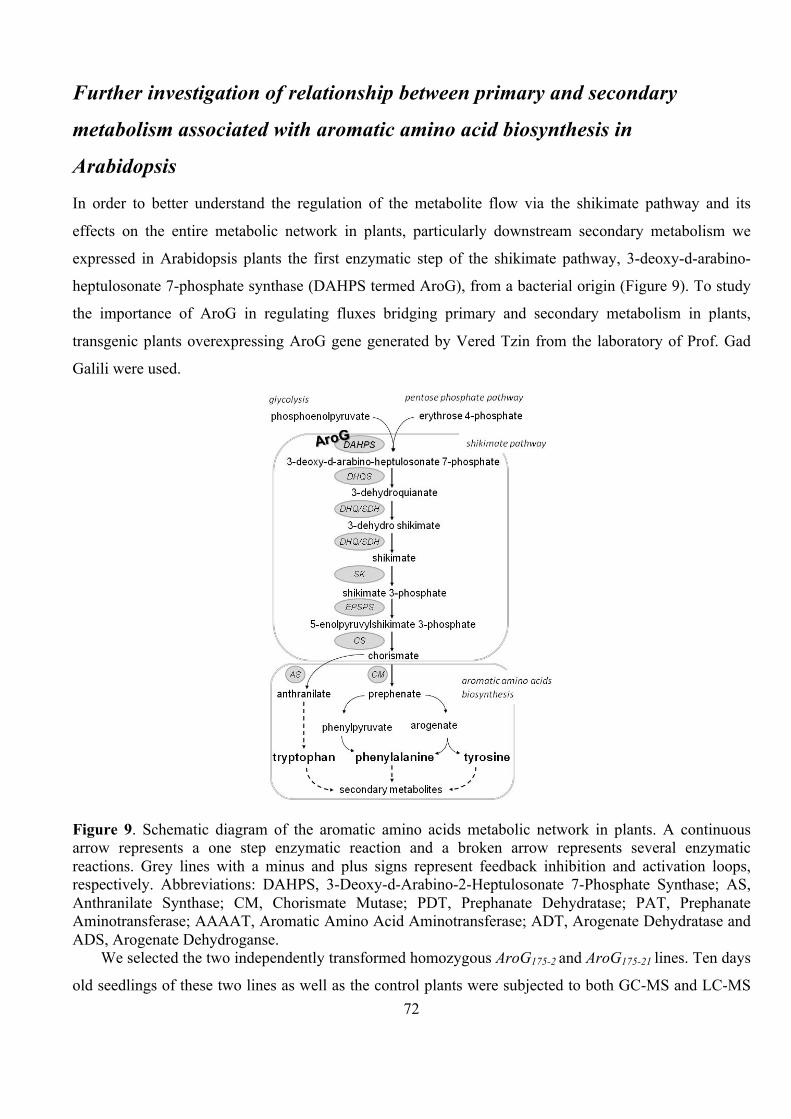
72
Further investigation of relationship between primary and secondary
metabolism associated with aromatic amino acid biosynthesis in
Arabidopsis
In order to better understand the regulation of the metabolite flow via the shikimate pathway and its
effects on the entire metabolic network in plants, particularly downstream secondary metabolism we
expressed in Arabidopsis plants the first enzymatic step of the shikimate pathway, 3-deoxy-d-arabino-
heptulosonate 7-phosphate synthase (DAHPS termed AroG), from a bacterial origin (Figure 9). To study
the importance of AroG in regulating fluxes bridging primary and secondary metabolism in plants,
transgenic plants overexpressing AroG gene generated by Vered Tzin from the laboratory of Prof. Gad
Galili were used.
Figure 9. Schematic diagram of the aromatic amino acids metabolic network in plants. A continuous arrow represents a one step enzymatic reaction and a broken arrow represents several enzymatic reactions. Grey lines with a minus and plus signs represent feedback inhibition and activation loops, respectively. Abbreviations: DAHPS, 3-Deoxy-d-Arabino-2-Heptulosonate 7-Phosphate Synthase; AS, Anthranilate Synthase; CM, Chorismate Mutase; PDT, Prephanate Dehydratase; PAT, Prephanate Aminotransferase; AAAAT, Aromatic Amino Acid Aminotransferase; ADT, Arogenate Dehydratase and ADS, Arogenate Dehydroganse.
We selected the two independently transformed homozygous AroG175-2 and AroG175-21 lines. Ten days
old seedlings of these two lines as well as the control plants were subjected to both GC-MS and LC-MS
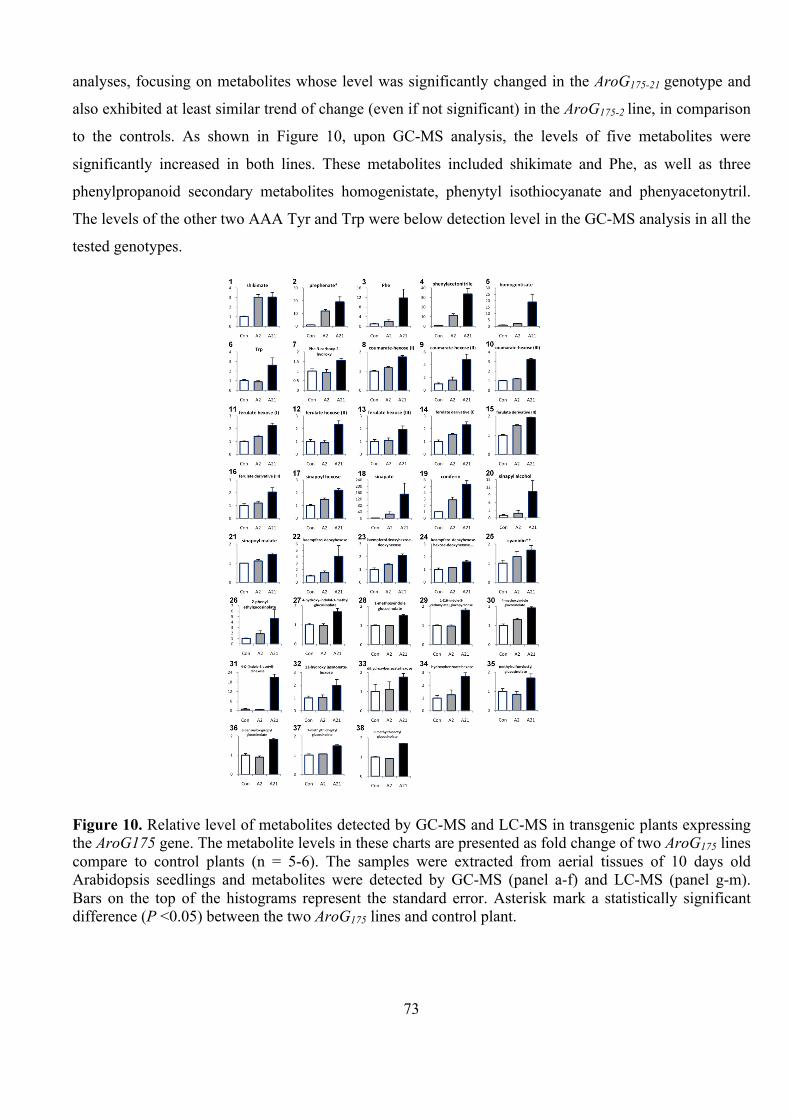
73
analyses, focusing on metabolites whose level was significantly changed in the AroG175-21 genotype and
also exhibited at least similar trend of change (even if not significant) in the AroG175-2 line, in comparison
to the controls. As shown in Figure 10, upon GC-MS analysis, the levels of five metabolites were
significantly increased in both lines. These metabolites included shikimate and Phe, as well as three
phenylpropanoid secondary metabolites homogenistate, phenytyl isothiocyanate and phenyacetonytril.
The levels of the other two AAA Tyr and Trp were below detection level in the GC-MS analysis in all the
tested genotypes.
Figure 10. Relative level of metabolites detected by GC-MS and LC-MS in transgenic plants expressing the AroG175 gene. The metabolite levels in these charts are presented as fold change of two AroG175 lines compare to control plants (n = 5-6). The samples were extracted from aerial tissues of 10 days old Arabidopsis seedlings and metabolites were detected by GC-MS (panel a-f) and LC-MS (panel g-m). Bars on the top of the histograms represent the standard error. Asterisk mark a statistically significant difference (P <0.05) between the two AroG175 lines and control plant.
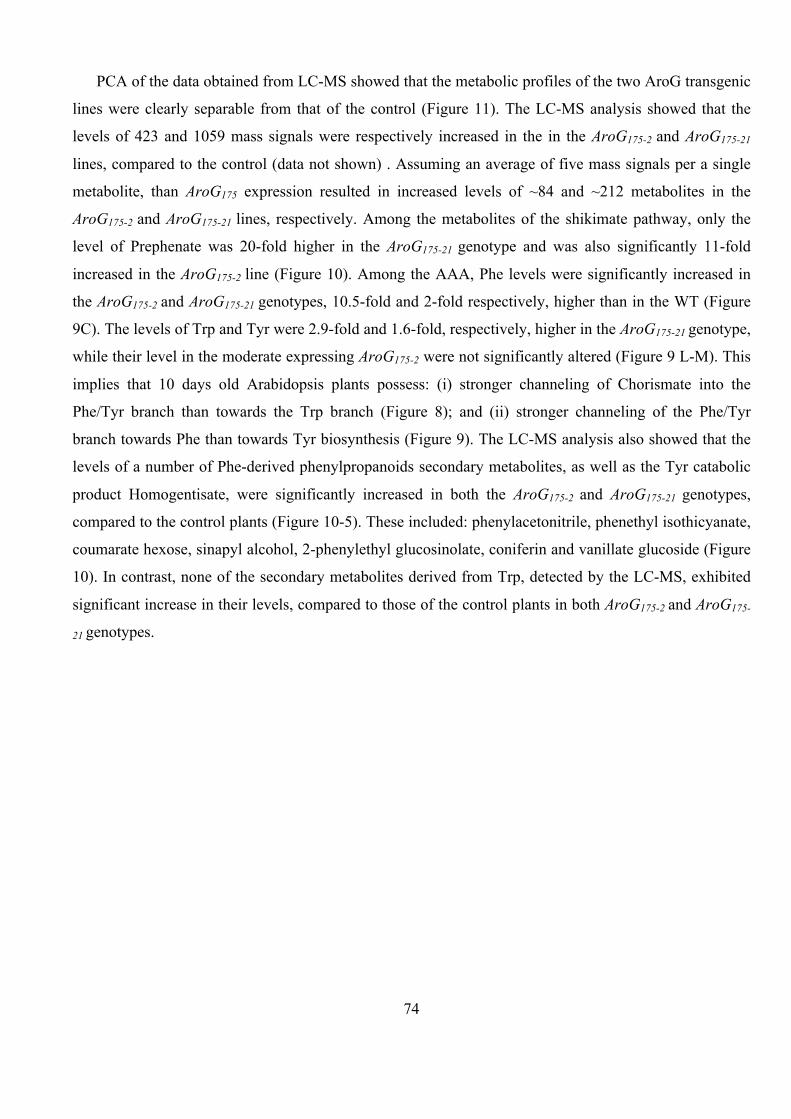
74
PCA of the data obtained from LC-MS showed that the metabolic profiles of the two AroG transgenic
lines were clearly separable from that of the control (Figure 11). The LC-MS analysis showed that the
levels of 423 and 1059 mass signals were respectively increased in the in the AroG175-2 and AroG175-21
lines, compared to the control (data not shown) . Assuming an average of five mass signals per a single
metabolite, than AroG175 expression resulted in increased levels of ~84 and ~212 metabolites in the
AroG175-2 and AroG175-21 lines, respectively. Among the metabolites of the shikimate pathway, only the
level of Prephenate was 20-fold higher in the AroG175-21 genotype and was also significantly 11-fold
increased in the AroG175-2 line (Figure 10). Among the AAA, Phe levels were significantly increased in
the AroG175-2 and AroG175-21 genotypes, 10.5-fold and 2-fold respectively, higher than in the WT (Figure
9C). The levels of Trp and Tyr were 2.9-fold and 1.6-fold, respectively, higher in the AroG175-21 genotype,
while their level in the moderate expressing AroG175-2 were not significantly altered (Figure 9 L-M). This
implies that 10 days old Arabidopsis plants possess: (i) stronger channeling of Chorismate into the
Phe/Tyr branch than towards the Trp branch (Figure 8); and (ii) stronger channeling of the Phe/Tyr
branch towards Phe than towards Tyr biosynthesis (Figure 9). The LC-MS analysis also showed that the
levels of a number of Phe-derived phenylpropanoids secondary metabolites, as well as the Tyr catabolic
product Homogentisate, were significantly increased in both the AroG175-2 and AroG175-21 genotypes,
compared to the control plants (Figure 10-5). These included: phenylacetonitrile, phenethyl isothicyanate,
coumarate hexose, sinapyl alcohol, 2-phenylethyl glucosinolate, coniferin and vanillate glucoside (Figure
10). In contrast, none of the secondary metabolites derived from Trp, detected by the LC-MS, exhibited
significant increase in their levels, compared to those of the control plants in both AroG175-2 and AroG175-
21 genotypes.
75
Figure 11. The Principal Component Analysis (PCA) of datasets obtained using UPLC-qTOF. Two independed lines of Arabidopsis plants expressing AroG175 gene are markedly different as compared to the control.
To conclude, So far, we found that AroG175 expression increases the levels of the three aromatic
amino acids as well as the levels of a number of Phe-derived secondary metabolites such as: lignin, phe
glucosinolate, isothiocyanate and vanillate metabolism (Figure. 9). PCA analysis shows clear separation
between the two transgenic lines and the controls (Figure 11). Increased production of Phe-derived
secondary metabolites was previously observed by us upon expression of a bacterial bifunctional PheA
gene, which converts chorismate via prephenate into phenylpyruvate16. Taken together, these results
imply the presence of regulatory cross interactions between the fluxes of the shikimate and aromatic
amino acids biosynthesis pathways, and their further metabolism into various secondary metabolites.
76
Discussion
Development of Metabolomics tools and their combination with biological research Metabolomics was introduced for the first time approximately a decade ago. In spite of its young age, this
technology has become more and more recognizable and stands at they same importance as his “older
omics brothers” - transcriptomics and proteomics. The combination of the all “omics” data provides a
broad view on processes that occur in the entire organism, single cell layer or single cell. The myriad of
small molecules represent a final step in the gene expression cascade. The huge amount of small
metabolites produced by plants can be analyzed by different modern analytical platforms such as NMR,
LC-MS and GC-MS.
The primary advantages of plant metabolomics are the ability to inspect a wide range of different
metabolite classes and pathways involved in their biosynthesis and catabolism. Metabolomics provides a
unique opportunity to understand the interaction between primary and secondary metabolic pathways and
phenotypic and dynamic profiling of different biological systems. Limiting factors of the current
metabolomics assays are the inadequate knowledge of metabolic pathways and the lack of commercially
available reference standards for identification of metabolites. In addition, optimal computational tools
for the treatment of metabolomics data have not been established yet. One of the main challenges in plant
metabolomics is the chemical diversity and different dynamic range of the plant metabolites. The analysis
of the metabolome is dramatically more complex than other “omics” analysis.
Metabolomics comprises several steps, each one of them may add to the variability of the
outcome. Therefore the whole procedure should be adjusted to specific tissue or organism before the main
experiment. The first phase after sample growth that should be controlled is sampling time during the day.
This is a very important parameter since in different day or night periods plants generate different
metabolites and change their levels in various tissues/organs. Accurate sample weight or area
measurements are also of great importance. In a non-targeted metabolomics approach hundreds
metabolites from different chemical classes are analyzed and thus it is very complicated to choose an
appropriate internal standard. The second step after sample collection is extraction that starts with proper
homogenization. In our lab we use an automatic mill instrument that provides good and reproducible
sample homogenization, a key point for good extraction. The specific choice of the extraction procedure
and extraction solvents will determine the class of analyzed metabolites. In our lab, 80 % methanol and
20 % water solution are often used for the non-targeted approach and metabolites obtained by this
extraction mostly belong to secondary metabolite group. There is no available sample preparation
77
technique for extracting all plant metabolites in a single extraction. The combination of various extraction
procedures and different sample preparation techniques with different analytical platforms will allow the
investigation of a broad range of different metabolites.
To summarize, during my PhD study a metabolomics system has been established that has the
capability to analyze a large number of metabolites belonging to various chemical classes and derived
from several plant species and tissues using both high-resolution LC-MS and GC-MS. Additionally,
approach for analysis of the polar metabolites such as organic acids, sugars, amino acids etc. was
developed using GC-MS. I have also set-up analytical methods for targeted analysis of plant produced
metabolites. Wax and cutin, produced by Arabidopsis leaves and tomato fruits, can be analyzed by
combining two analytical platforms, in which the GC-MS is used for identification of plant components
and GC-FID for their quantification. Moreover, targeted analysis system, thiamine and its phosphate
esters can be detected in Arabidopsis using HPLC combined with fluorescent detector.
Understanding the relationship between primary metabolites involved in
Tryptophan and Methionine metabolism, precursors pathways and
secondary metabolism in Arabidopsis
Plants control their primary and secondary metabolic networks using different regulatory systems. In the
second part of my thesis work I examined the effect of transcription factor regulation on the primary and
secondary metabolic interface. Biosynthesis of secondary metabolites is a costly process since they are
often produced to very high levels and could not be recycled to their basic source. Consequently, switching
on a pathway involved in synthesizing such compounds is ought to be a well-coordinated process in which
activation occurs at multiple points, from the very primary pathways forming the basic structures to the last
committed step in the formation of a specialized metabolite. To date, only a limited set of reports21
presented detailed and parallel analyses of primary and secondary metabolism and the interface between
them.
We used transgenic plants overexpressing the two recently described clades of R2R3 MYB
transcription factors 22,23,24,25 as a model to examine the interaction between primary and secondary
metabolism. These plants served as an excellent tool for such a study given that these factors control
secondary metabolic pathways that retain similar primary precursors (i.e. amino acids) and their secondary
products share the need for sulfur in their basic skeleton. Transcriptome analyses using GeneChips and
metabolomics by the use of hyphenated mass spectrometry-based technologies were employed in order to
obtain the broadest coverage of gene and metabolite expression. Using these approaches we followed
78
transcripts and metabolites belonging to either the "proximal" network of glucosinolates and related
structures or the "distal" network of metabolic pathways generating precursors for their biosynthesis or
additional distinct pathways. Albeit the relatively small portion of the metabolome that could be identified
by metabolomics in its current state, such technologies allowed us to putatively identify and monitor the
relative levels of more than 130 primary and secondary metabolites in Arabidopsis leaves. The results
obtained from transcriptome and metabolome revealed that overexpression of these transcription factors had
broad effects on both primary and secondary metabolism. We found increased levels of tryptophan derived
compounds in MYB34 and MYB51 overexpressing plants. The increased levels of aliphatic glucosinolates
were also observed in MYB28, MYB29 and MYB76 overexpressing plants. This suggested that MYB34
and MYB51 are involved in the production of tryptophan derived secondary metabolites, while MYB28,
MYB29 and MYB76, on the other hand, regulate the production of methionine-derived glucosinolates. In
addition, overexpression of the MYB34 and MYB51 transcription factors has a much broader effect on
metabolism of indolic compounds than described by others25. Moreover, we show that the activity of these
regulators is not restricted to the metabolic space surrounding glucosinolates biosynthesis but is tightly
linked to more distal metabolic networks of primary metabolism including the TCA cycle, sulfur
assimilation, the aspartate pathway and the shikimate pathway. My work suggests that similarly to the
regulators investigated here, other transcription factors that are currently considered to be specifically
controlling pathways of secondary metabolism might also control core pathways of central metabolism. For
more detailed discussion of this part see Malitsky et al. (2008).
Understanding the relationship between primary and secondary
metabolism associated with aromatic amino acid biosynthesis in
Arabidopsis
Plants can synthesize Phenylalanine (Phe) via Arogenate, but it is still unknown whether an alternative
route, via phenylpyruvate, exists, as in many microorganisms (Figure 11). The pathway leading to the
synthesis of Phe is located on the branch point between primary metabolism (chorismate biosynthesis via
the shikimate pathway and glycolysis) and secondary metabolism (the phenylpropanoid pathway) (Figure
11). In order to examine the possibility that Phe biosynthesis via phenylpyruvate exists in plants we have
expressed a truncated bacterial PheA gene (termed PheA*) in Arabidopsis. This gene encodes a feedback-
insensitive CM/PDT enzyme that lacks the C-terminal allosteric domain. In order to evaluate the
metabolic changes that occur in Arabidopsis plants expressing the PheA* gene we performed non-
targeted metabolite analyses of seedlings expressing the PheA* and wild-type plants, using both high-
79
resolution LC-MS and GC-MS metabolomics technologies. We showed that plants expressing PheA
displayed a significant overproduction of Phe as well as a number of Phe-derived metabolites. This
implied that plants can convert Phenylpyruvate into Phe and also that the level of Phe influences the
pattern of its catabolism into various classes of secondary metabolites. Besides Phe and Trp, we observed
no significant effect on other primary metabolites, including those of the shikimate pathway upstream to
chorismate in PheA* expressing plants. These results indicated that the metabolic pathways leading to the
synthesis of aromatic amino acids from chorismate possess a minimal network interaction with their
upstream shikimate pathway as well as with other networks of primary metabolism. It also suggests that
flux changes downstream of chorismate are not recognized by the plant (i.e. Arabidopsis) as signals for
re-direction of primary metabolism into the shikimate pathway on route to the biosynthesis of the
aromatic amino acids. For a more detailed discussion regarding this part of the work please see Tzin*,
Malitsky* et al. (2009).
Further investigation of relationship between primary and secondary metabolism associated with aromatic amino acid biosynthesis in Arabidopsis The bacterial DAHPS is feedback inhibited in planta by Phenylalanine
Bacterial DAHPS enzymes that lead to the biosynthesis of AAAs are naturally feedback inhibited by
these amino acids 26,27. Yet, it is still not entirely clear whether this feedback inhibition holds true for the
plant DAHPS enzymes 28-33. The activity of the Vigna radiate (mung bean) DAHPS is weakly inhibited
by prephenate and arogenate, the precursor metabolites of Phe and Tyr biosynthesis, 30, but whether this
is due to inhibition of the enzyme level or activity is also still unknown 34. Hence, the results obtained so
far imply that the shikimate pathway in plants is mostly regulated at the gene expression level rather than
by post-translational regulation 35. We obserevd that expression of the native bacterial AroG-encoded
DAHPS (AroGWT) has no significant effect, while expression of the feedback insensitive bacterial
DAHPS (AroG175) has a significantly stronger effect on the Arabidopsis metabolome. This suggests that
Arabidopsis wild type plants accumulate sufficient amounts of Phe to feedback inhibit the native bacterial
DAHPS. In vitro biochemical data suggest that the endogenous plant DAHPS enzymes are potentially
feedback-inhibited by the AAAs or even by arogenate 30,32,33,36, but whether this is also true in vivo is still
unknown.
Phe and Trp accumulate in Arabidopsis plant overexpressing the bacterial DAHPS
80
The aromatic amino acids and their role in the formation of secondary metabolites were extensively
studied34. However, the regulation of the conversion of primary carbon and nitrogen metabolism via the
shikimate pathway into the biosynthesis of the three aromatic amino acids remains unclear. Our results
showed elevated levels of Phe and Trp in Arabidopsis plants overexpressing a feedback insensitive
bacterial DAHPS. This suggested that the DAHPS enzyme plays an important role in regulating the
conversion of primary carbon metabolism into the biosynthesis of chorismate on route to the production
of these amino acids. Previous studies describing carbon consumption in Arabidopsis plants suggested
that 30% of the carbon fixed in photosynthesis courses down the Phe branch en route to lignin and the
flux down the Tyr branch being far smaller 37,38. In the present study we show that accumulation of Phe
was stimulated to a much higher degree than Trp in the AroG175 expressing plants (Figure. 10). This fact
suggested that under non-stress growth conditions, the Phe biosynthesis pathway efficiently competes
with the Trp biosynthesis pathway on their common precursor metabolite chorismate (Figure. 9). This can
be explained by the existence of either elevated expression and/or superior enzymatic properties of
Chorismate Mutase of Phe/Tyr biosynthesis over Anthranilate Synthase of Trp biosynthesis (Figure. 9).
Overexpression of AroG reveals novel regulatory bottlenecks within the shikimate pathway and between primary and secondary metabolism
In the present study I found significant accumulation levels of the Phe precursors shikimate as well as
prephenate (Figure 9 and Figure 10). A possible explanation for this might be that enzymes converting
shikimate and prephenate to their respective downstream metabolites shikimate-3-phosphate and
arogenate/phenylpyruvate (Figure 9) represent novel regulatory bottlenecks of the shikimate and aromatic
amino acid biosynthesis pathways. Accumulation of shikimate in different plants was reported in several
recent studies39-41. Accumulation of AAAs, shikimate and several phenylpropanoids were detected in
Lolium perenne under fungal endophite infection. Additionally, in herbicide resistant plants the
acumulation of the shikimate were observed39-41.
81
Thus, I suggest that shikimate may indicate a regulatory intermediate of the shikimate pathway. In
addition to elevated levels of Phe and Trp, increased levels of Phe derived secondary metabolites such as:
lignin precursors and their derivatives, anthocyanins, flavonoids, Phe-glucosinolates and isothiocyanate
(Figure 10 and 7) were detected in the AroG175 overexpressing Arabidopsis plants. These plants also
accumulated salicylate derivatives. The source for salicylate was suggested primarily to be chorismate,
however, recent studies suggested cinnamate and benzoate as additional sources for the biosynthesis of
salicylate and its derivatives such as salicyloyl glucose ester and salicyloyl glucoside 42,43.
Elevated levels of Phe-derived secondary metabolites was observed upon expression of a bacterial
bi-functional PheA gene, which converts chorismate via prephenate into phenylpyruvate 44. Combined
results obtained from the PheA and the AroG studies suggest the presence of a regulatory cross
interaction between the fluxes of the shikimate and AAAs biosynthesis pathways, and their further
metabolism into various secondary metabolites. The results also indicate that DAHPS and CM activities
represent important regulatory steps in the conversion of primary to secondary metabolism in plants. Yet,
even though plants are apparently able to convert a significant amount of the primary metabolism into
secondary metabolism under certain conditions 45, the metabolic profiling analysis showed that both
PheA* expression 44 as well as AroG175 expression had essentially no major reductive effect on primary
metabolites including glycolysis associated metabolites (Figure. 5). This implies that the conversion of
primary metabolism via the shikimate pathway into secondary metabolism is regulated by additional
bottlenecks that operate in concert with DAHPS.
Transcriptional and post translational regulatory effects on primary and secondary metabolic networks. In this study two approaches were taken in order to develop changes in flux from primary to secordary
metabolism: (i) over-expression of transcription factors genes and (ii) over-expression of key-enzymes of
a primary metabolism pathway. In the case of the overexpressed transcription factors clades, the results
obtained by transcriptome and metabolom analyses provided us with new insight to different metabolic
pathways that are linked to GSs metabolism and its precursors. Microarray and metabolic profiling data
point to a clear activation of specific metabolic pathways of primary metabolism. Parts of these pathways
serve as carbon skeletons, sulfur and methyl group donors for the biosynthesis of Met and Trp.
Expression of genes involved in the sulfur assimilation pathway, the formation of cysteine that is an
important precursors for both IGs and AGs biosynthesis were induced in plants over expressing either
clades genes. At the metabolite level, O-acetyl-l-serine the precursor for cysteine biosynthesis was also
induced in plants over expressing both clades members. Plants over expressing the MYB28-like clade

82
members (producing AGs Met derived) showed induction of genes in the TCA cycle and further
downstream through Asp and Gln up to Met. This was supported by an increase in malate and succinate
detected in plants expressing either one of the three MYB28-like genes. In the case of the ATR1-like clade
genes over expressing plants (producing IGs Trp derived), activation of genes along the route leading
from the shikimate pathway to the formation of chorismate and the synthesis of indole and subsequently
Trp was evident, followed by changes in metabolites pathways.
In this work I provided important evidence that transcription factors regulating pathways of
secondary metabolism activate genes controlling primary metabolic pathways. However, perturbation of
key-enzymes also revealed transcriptome changes. Approximately 109 genes which can be associated
with biotic stresses, hormone metabolism (cytokinin, absicisic acid and jasmonate), transcriptional
regulation, signaling (calcium and cytokinin AAR-genes), pathogenesis-related (PR) proteins, electron
carrier and redox state regulation showed altered expression in these plants. It is very difficult to associate
detected genes with one logic network. Although the main changes of gene expression occurred,
metabolic analysis of this plants showed that the most significant changes occurred in Phe derived. More
over, in case of primary secondary metabolism interaction in the plant expressing the AroG gene, apart
from the amino acids phenylalanine, tyrosine and tryptophan, no significant effect was observed on
primary metabolites upstream to shikimate.
Since of that as continiuasly work it seems that investigation of the kinetics of metabolic pathways
activation or repression after induction can be done. An inducible system for activation of one of the five
MYB transcriptional factors which activates GSs pathway can be constructed. Data obtained after
induction can be followed using Metabolomics in order to get a dynamic view of primary and secondary
metabolic pathways activity and crosstalk.
83
Publications:
1 Vered Tzin*, Sergey Malitsky*, Asaph Aharoni and Gad Galili. (2009). Expression of a bacterial bifunctional chorismate mutase/prephenate dehydratase modulates primary and secondary metabolism associated with aromatic amino acids in Arabidopsis. The Plant Journal 60: 156-167.
2 Liron Feldberg, Ilya Venger, Sergey Malitsky, Ilana Rogachev, Asaph Aharoni. (2009). Dual labeling of metabolites for metabolome analysis (DLEMMA): A new approach for the identification and relative quantification of metabolites by means of dual isotope labeling and liquid chromatography-mass spectrometry. Analytical Chemistry 81: 9257-9266.
3 Sergey Malitsky*, Eyal Blum*, Hadar Less, Venger Ilya, Elbaz Moshe, Shay Morin, Yuval Eshed, Asaph Aharoni. (2008). The transcript and metabolite networks affected by the two clades of Arabidopsis glucosinolate biosynthesis regulators. Plant Physiology 148: 2021-2049.
4 Jian Xin Shi, Sergey Malitsky, Rochus Franke, Lukas Schreiber, Asaph Aharoni. (2011). SHINE Transcription Factors Act Redundantly to Pattern the Archetypal Surface of Arabidopsis Flower Organs. PLoS Genet. 7(5):e1001388.
5 Olga Khersonsky, Sergey Malitsky, Ilana Rogachev, Asaph Aharoni, Dan S. Tawfik. (2010) Role of chemistry versus substrate-binding in recruiting promiscuous enzyme functions. Biochemistry 50 (13): 2683-90.
6 Vered Tzin*, Sergey Malitsky*, Michal Moyal Ben Zvi, Alexander Vainstein, Asaph Aharoni and Gad Galili. De-regulation of DAHP synthase activity of the shikimate pathway in Arabidopsis exposes novel regulatory aspects bridging primary and secondary metabolism. Submitted to The New Phytologist.
7 Maxim Itkin, Ilana Rogachev, Noam Alkan, Tally Rosenberg, Sergey Malitsky, Laura Masini, Yoko Iijima, Koh Aoki, Ric de-Vos, Dov Prusky, Saul Burdman, Jules Beekwilder and Asaph Aharoni. The Glycosylation Activity of GLYCOALKLOID METABOLISM 1 is Crucial for Preventing the Phytotoxic Effect of Tomato Steroidal Alkaloids. Submitted to The Plant Cell.
8 Samuel Bocobza, Sergey Malitsky, Adriano Nunes-Nesi, Wagner Luis-Araujo, Sagit Meir, Michal Shapira, Alisdair Fernie, and Asaph Aharoni. Examination of the TPP riboswitch reveals the key role of Vitamin B1 in the regulation of central metabolism. Submitted to Nature Chemical Biology. * The authors contributed equally to this paper
84
Manuscript close to submission:
1 Moussaieff A, Brady SM, Rogachev I, Brodsky L, Malitsky S, Belcher H, Sozzani R, Yativ M, Benfey PN and Aharoni A. High resolution metabolic mapping of cell layers in plant roots. In preparation.
2 Asa Eitan, et al. The Transcription Factor MYB99 Regulates Phenylpropanoids Biosynthesis in Arabidopsis Anthers During Pollen Development Through the Coordination of Primary and Secondary Metabolism. In preparation.
3 Jianxin Shi*, Avital Adato*, Noam Alkan, Sagit Meir, Ilana Rogachev, Sergey Malitsky, Dov Prusky, Lukas Schreiber, Antonio R Granell, Christophe Rothan and Asaph Aharoni. At early stages of tomato fruit development cutin surface biosynthesis is regulated by SlSHIN3 and several cytochrome P450 genes. In preparation.
4 Oshry Marcovich, Sergey Malitsky, Moshe Elbaz, Shai Morin and Asaph Aharoni. Behavioral response of Bemisia tabaci to variation in glucosinolates level in Arabidopsis thaliana. In preparation.
Patent Applications
1 Sergey Malitsky, Ilana Rogachev and Asaph Aharoni. (2010). A closure for capillary columns.
Provisional patent application, 2010 serial number P-74274-USP.
2 Vered Tzin, Gad Galili, Sergey Malitsky and Asaph Aharoni. Transgenic Plants Having Altered levels of Aromatic Amino Acids and Metabolites Derivatives. Provisional patent application with the USA patent office September, 2008 serial number 61/095638.
3 Vered Tzin, Gad Galili, Sergey Malitsky, Ilana Rogachev and Asaph Aharoni. (2010). Transgenic plants having altered DAHP synthase activity. In preparation.
85
References
1 Pichersky, E. & Gang, D. R. Genetics and biochemistry of secondary metabolites in plants: an evolutionary perspective. Trends Plant Sci 5, 439-445 (2000).
2 Fridman, E. & Pichersky, E. Metabolomics, genomics, proteomics, and the identification of enzymes and their substrates and products. Curr Opin Plant Biol 8, 242-248 (2005).
3 Herrmann, K. M. & Weaver, L. M. The Shikimate Pathway. Annu Rev Plant Physiol Plant Mol Biol 50, 473-503 (1999).
4 Li, J. & Last, R. L. The Arabidopsis thaliana trp5 mutant has a feedback-resistant anthranilate synthase and elevated soluble tryptophan. Plant Physiol 110, 51-59 (1996).
5 Radwanski, E. R., Zhao, J. & Last, R. L. Arabidopsis thaliana tryptophan synthase alpha: gene cloning, expression, and subunit interaction. Mol Gen Genet 248, 657-667 (1995).
6 Normanly J, S. J., Cohen JD. Rethinking auxin biosynthesis and metabolism. Plant physiology 107, 323-329 (1995).
7 Tsuji J, Z. M., Somerville SC, Last RL, Hammerschmidt R. Evidence that tryptophan is not a direct biosynthetic intermediate of camalexin in Arabidopsis thaliana. Physiol Mol Plant Pathol 43, 221-229 (1993).
8 Reichelt, M. et al. Benzoic acid glucosinolate esters and other glucosinolates from Arabidopsis thaliana. Phytochemistry 59, 663-671 (2002).
9 Halkier, B. A. & Gershenzon, J. Biology and biochemistry of glucosinolates. Annu Rev Plant Biol 57, 303-333 (2006).
10 Glawischnig, E., Hansen, B. G., Olsen, C. E. & Halkier, B. A. Camalexin is synthesized from indole-3-acetaldoxime, a key branching point between primary and secondary metabolism in Arabidopsis. Proc Natl Acad Sci U S A 101, 8245-8250 (2004).
11 Fiehn, O. Metabolomics – the link between genotypes and phenotypes. Plant Molecular Biology 48, 155-171 (2002).
12 Ratcliffe, R. G. & Shachar-Hill, Y. Probing Plant Metabolism with Nmr. Annu Rev Plant Physiol Plant Mol Biol 52, 499-526 (2001).
13 Krishnan P, Kruger NJ & RG., R. Metabolite fingerprinting and profiling in plants using NMR. J Exp Bot 56, 255–265 (2005).
14 Benjamini, Y. & Hochberg, Y. Controlling the false discovery rate: a practical and powerful approach to multiple testing. J R Stat Soc Ser B Stat Methodol 7, 289-300 (1995).
86
15 Smith, C. A., Want, E. J., O'Maille, G., Abagyan, R. & Siuzdak, G. XCMS: processing mass spectrometry data for metabolite profiling using nonlinear peak alignment, matching, and identification. Anal Chem 78, 779-787 (2006).
16 Saeed, A. I. et al. TM4: a free, open-source system for microarray data management and analysis. Biotechniques 34, 374-378 (2003).
17 Scholz, M., Gatzek, S., Sterling, A., Fiehn, O. & Selbig, J. Metabolite fingerprinting: detecting biological features by independent component analysis. Bioinformatics 20, 2447-2454 (2004).
18 Brodsky, L., Moussaieff, A., Shahaf, N., Aharoni, A. & Rogachev, I. Evaluation of Peak Picking Quality in LC- MS Metabolomics Data. Analytical chemistry (2010).
19 Schauer, N., Zamir, D. & Fernie, A. R. Metabolic profiling of leaves and fruit of wild species tomato: a survey of the Solanum lycopersicum complex. J Exp Bot 56, 297-307 (2005).
20 Roessner-Tunali, U. et al. Metabolic profiling of transgenic tomato plants overexpressing hexokinase reveals that the influence of hexose phosphorylation diminishes during fruit development. Plant Physiol 133, 84-99 (2003).
21 Drew, S. W. & Demain, A. L. Effect of primary metabolites on secondary metabolism. Annual Reviews in Microbiology 31, 343-356 (1977).
22 Hirai, M. Y. et al. Omics-based identification of Arabidopsis Myb transcription factors regulating aliphatic glucosinolate biosynthesis. Proceedings of the National Academy of Sciences 104, 6478 (2007).
23 Sonderby, I. E. et al. A systems biology approach identifies a R2R3 MYB gene subfamily with distinct and overlapping functions in regulation of aliphatic glucosinolates. PLoS One 2, e1322 (2007).
24 Gigolashvili, T., Yatusevich, R., Berger, B., Müller, C. & Flügge, U. I. The R2R3 MYB transcription factor HAG1/MYB28 is a regulator of methionine derived glucosinolate biosynthesis in Arabidopsis thaliana. The Plant Journal 51, 247-261 (2007).
25 Gigolashvili, T. et al. The transcription factor HIG1/MYB51 regulates indolic glucosinolate biosynthesis in Arabidopsis thaliana. Plant J 50, 886-901 (2007).
26 Wallace, B. & Pittard, J. Genetic and biochemical analysis of the isoenzymes concerned in the first reaction of aromatic amino acids biosynthesis in E. coli. J. Bacteriol 93, 237-244 (1967).
27 Jensen, R. A. & Nester, E. W. Regulatory enzymes of aromatic amino acid biosynthesis in Bacillus subtilis. II. The enzymology of feedback inhibition of 3-deoxy-d-arabino-heptulosonate 7-phosphate synthetase. J. Biol. Chem 241, 3373-3380 (1966).
87
28 Gilchrist, D. & Kosuge, T. Aromatic amino acid biosynthesis and its regulation. In BN Miflin, ed, the Biochemistry of Plants, Academic Press, New York 5, 507-531 (1980).
29 Yoshida, S. Biosynthesis and conversion of aromatic amino acids in plants. Annu Rev Plant Physiol 20, 41-62 (1969).
30 Rubin, J. L. & Jensen, R. A. Differentially Regulated Isozymes of 3-Deoxy-d-arabino-Heptulosonate-7-Phosphate Synthase from Seedlings of Vigna radiata [L.] Wilczek. Plant Physiol 79, 711-718 (1985).
31 Reinink, M. & Borstap, A. 3-Deoxy-D-arabino-heptulosonate 7-phosphate synthase from pea leaves: inhibition by L-tyrosine. Plant Sci Lett 26, 167-171 (1982).
32 Suzich, J., Ranjeva, R., Hasegawa, P. & Herrmann, K. Regulation of the shikimate pathway of carrot cells in suspension culture. Plant Physiol 75, 369-371 (1984).
33 Pinto, J. E., Suzich, J. A. & Herrmann, K. M. 3-Deoxy-d-arabino-Heptulosonate 7-Phosphate Synthase from Potato Tuber (Solanum tuberosum L.). Plant Physiol 82, 1040-1044 (1986).
34 Herrmann, K. M. The shikimate pathway as an entry to aromatic secondary metabolism. Plant Physiol 107, 7-12 (1995).
35 Tzin, V. & Galili, G. New Insights into the Shikimate and Aromatic Amino Acids Biosynthesis Pathways in Plants. Mol Plant 3, 956-972 (2010).
36 Graziana, A. & Boudet, A. 3-Deoxy-D-arabino-heptulosonate 7-phosphate synthase from Zea mays: general properties and regulation by tryptophan. Plant Cell Physiol 21, 793-802 (1980).
37 Rippert, P. & Matringe, M. Molecular and biochemical characterization of an Arabidopsis thaliana arogenate dehydrogenase with two highly similar and active protein domains. Plant Mol Biol 48, 361-368 (2002).
38 Pribat, A. et al. Nonflowering Plants Possess a Unique Folate-Dependent Phenylalanine Hydroxylase That Is Localized in Chloroplasts. Plant Cell (2010).
39 Mueller, T. C., Massey, J. H., Hayes, R. M., Main, C. L. & Stewart, C. N., Jr. Shikimate accumulates in both glyphosate-sensitive and glyphosate-resistant horseweed (Conyza canadensis L. Cronq.). J Agric Food Chem 51, 680-684 (2003).
40 Buehring, N. W., Massey, J. H. & Reynolds, D. B. Shikimic acid accumulation in field-grown corn (Zea mays) following simulated glyphosate drift. J Agric Food Chem 55, 819-824 (2007).
41 Pline, W. A., Wilcut, J. W., Duke, S. O., Edmisten, K. L. & Wells, R. Tolerance and accumulation of shikimic acid in response to glyphosate applications in glyphosate-resistant and nonglyphosate-resistant cotton (Gossypium hirsutum L.). J Agric Food Chem 50, 506-512 (2002).
88
42 Chen, Z., Zheng, Z., Huang, J., Lai, Z. & Fan, B. Biosynthesis of salicylic acid in plants. Plant Signal Behav 4, 493-496 (2009).
43 Erb, M. & Glauser, G. Family business: multiple members of major phytohormone classes orchestrate plant stress responses. Chem. Eur. J. 16, 10280 – 10289 (2010).
44 Tzin, V., Malitsky, S., Aharoni, A. & Galili, G. Expression of a bacterial bi-functional chorismate mutase/prephenate dehydratase modulates primary and secondary metabolism associated with aromatic amino acids in Arabidopsis. Plant J 60, 156-167 (2009).
45 Haslam, E. Shikimic Acid Metabolism and Metabolites. John Wiley and Sons, New York, 157-168 (1993).

89
Acknowledgments I am deeply grateful to my advisor, Professor Asaph Aharoni, for his constant support. Without his help, this work would not have been possible. Many thanks to my friends and colleagues for the great time I had in our AA team. I enjoyed their friendship, their support and the atmosphere in the laboratory.
I would like to thank Dr. Ilana Rogachev for the interesting and fruitful discussions and for her help.
My special thanks to my wife Irina and two my boys Ariel and Maxim for their love, patience and for providing a loving environment for me.
I also want to thank my brother for his support in this long-term project.
Lastly, and most importantly, I wish to thank my parents, Marina and Gregory Malitsky. They bore me, raised me, supported me, taught me, and loved me. To them I dedicate this thesis.