investigation of the weldability of austanitic stainless...
TRANSCRIPT
Investigation of The Weldability of Austanitic Stainless Steel
E. M. Anawa, M. F. Bograrah and S. B . Salem
Industrial and Manufacturing Department, Faculty of Engineering, University Benghazi, Libya
ezzeddin.anawa @uob.edu.ly.
Abstract
This work concerns with the study of weldability of austenitic stainless steel 316 by using
automatic tungsten gas shielded arc welding under various welding conditions under which designed
to weld the samples.
Results have been studied using impact and tensile strength tastings of the prepared welding joints
using statistical approach.
Results obtained showed that as gas flow rate of (CO2) increased the impact energy is increased,
while increasing of welding current caused increasing of impact energy up to (120 ampere) then
decreased.
The tensile strength test results showed that as welding current is increased the tensile fracture load
is decreased while increasing of gas flow rate caused an increase in tensile fracture load up to 12 L /
min then reduced.
Microstructure examination of the weld zones did support the explanation of the
variation of weld joint mechanical properties.
Keywords: weldability, austenitic stainless, impact energy, and tensile strength.
1. Introduction
The austenitic stainless steels, because of their high chromium and nickel content, are the most
corrosion resistant of the stainless group providing unusually fine mechanical properties. Austenitic is
the most widely used type of stainless steel. It has a nickel content of at least of 7%, which makes the
steel structure fully austenitic and gives it ductility, a large scale of service temperature, non-magnetic
properties and good weld ability. The range of applications of austenitic stainless steel includes house
wares, containers, industrial piping and vessels, architectural facades and constructional structures [1].
Murat et al. [2] have studied on the resistance spot weldability of galvanized interstitial free steel
sheets with austenitic stainless steel sheets. In microhardness measurements, the maximum hardness
values were in the middle of the weld nugget. Emin Bayraktar et al. [3] have contributed their
research on the selection of optimal welding conditions and developed new grade steels for
automotive applications. The study based on impact tensile testing to spot welded sheets. The effect
of nucleus size on mechanical properties in electrical resistance spot welding of chromide micro
alloyed steel sheets was investigated by Aslanlar [4]. Effects of Laser Welding Conditions on
Toughness of Dissimilar ( austenitic stainless steel 316 with low carbon steel F/A) Welded
Components was investigated by E. M. Anawa and A.G. Olabi [5] using Taguchi approach to
optimize the dissimilar F/A joints in terms of its mechanical properties.
Bouyousfi et al. [6] have studied the effect of process parameters (arc intensity, welding
duration and applied load) on the mechanical characteristics of the weld joint of austenitic stainless
steel 304L. The results showed that the applied load seems to be the control factor of the mechanical
characteristics of weld joint compared to the welding duration and the current intensity. Nizamettin K
[7] has focused his study on the influence of welding parameters on the joint strength of resistance
spot-welded titanium sheets. The results indicated that increasing current time and electrode force
increased the tensile shear strength and the joint obtained under the argon atmosphere gave better
strength. Hardness measurement results showed that welding nugget gave the highest hardness. L.
Suresh Kumar et. Al [1] were experimental investigated welding aspects of AISI 304 and 316 by
taguchi technique for the process of TIG & MIG welding. they used the TIG and MIG process to find
out the characteristics of the metal after it is welded .The voltage is taken constant and various
characteristics such as strength, hardness, ductility, grain structure, modulus of elasticity, tensile
strength breaking point, HAZ are observed in two processes and analyzed and finally concluded. V
Shankar et, al. [8], were investigated the solidification cracking which s a significant problem during
the welding of austenitic stainless steels, particularly in fully austenitic and stabilized compositions.
They were study the solidification cracking in austenitic stainless steels with particular emphasis on
nitrogen-alloyed and stabilized stainless steels. A statistical design of experiment (DOE) was used to
optimise selected laser beam welding parameters (laser power, welding speed, and focus length).
Optimization of tensile strength of ferritic / austenitic laser welded components was studied by E.M.
Anawa and A.G. Olabi [9]. The experimental results indicate that the F/A laser welded joints are
improved effectively by optimizing the input parameters using the Taguchi approach. The aim was to
optimize the maximum ultimate tensile strength of F/A welded components, by minimizing the laser
power and maximizing welding speed in order to optimize the cost and increase the production rate.
This work concerns with the study of weldability of austenitic stainless steel 316 by using
automatic tungsten gas shielded arc welding under various welding conditions under which designed

to welded the samples. The mechanical properties such tensile strength and notch impact strength are
tested and investigated.
2. Experimental Work
2.1 Base Metal Selection
The base metal used in the present work was stainless steel type ( Austenitic 316 ) the dimensions
are: (1250 x 1000 x 2 mm (l x w x h)), the chemical compositions and the mechanical properties are
shown in Tables 1 and 2 respectively.
Table 1 Chemical Composition of Base Metal
Fe Ti Nb N C Si Mn Ni Cr Element
balance < 0.2 < 0.2 0 – 0.015 0.02 – 0.08 0.08 1 - 2 10 - 14 16 - 18 Weight %
Table 2 Mechanical Properties of Base Metal
Mechanical Properties
7.8 Density ( x 1000 Kg / m )
0.27 – 0.30 Poisson's Ratio
200 Elastic Modulus ( GPa )
515 Tensile Strength ( MPa )
505 Yield Strength ( MPa )
00 Elongation (%)
50 Reduction in Area (%)
2.2 Welding Process
The welding process was carried out in (General Pipe Company) by using TIG technique for
welding process, this technique is widely used for different kinds of welding processes. The welding
machine type is (PHOENIX 500) this machine can be used for multi welding processes such as: (TIG,
MIG) technique, TIG welding technique was selected for this study to produce the joint for selected
welding parameters. The welding process was carried out without filler metal.
2.3 Samples Preparation
The selected material was cut by using an electrical shear to (20) samples, which are exhibited
in Fig 1. Than the welding process was applied to join samples at different welding conditions which
are presented in Table 3, using butt joint design, exhibited in Fig 2.

Fig 1: Material after cutting process Fig 2: The Welded sample
Table 3. Experimental welding conditions
Sample No. 1 2 3 4 5 6 7 8 9 10
Welding
Conditions
GFR, ( L / min ) 10 10 10 10 10 7 8 10 12 14
C, ( A ) 80 100 120 160 180 120 120 120 120 120
*GFR : Gas Flow Rate, C: Current
2.4 Weld Joints Testing
2.4.1 Non Destructive Testing (visual inspection)
In an attempt to find any flout in the welded joints such as (cracks, pores …etc) and the welding
penetration. The applied visual inspection was shows that acceptable quality of joints.
2.4.2 Destructive Testing:
Tensile Test
Tensile tests were carried out in (General Pipe Company) at room temperature (25ºC), for all the
prepared tensile samples. The machine test, and the diagram for tensile samples are shown in Fig 3
and Fig 4.
Tensile Samples Preparations
After finished the welding process the samples intended to be used for the tensile test were
prepared, they were cut by using a hacksaw and no high temperature was generated that keeps the
metal properties away from phase transformations, then the (Shaping Machine) was used to obtain a
(V Groove) at the welded area, to prepare a Notched Tensile Strength (NTS) as shown in Fig. 4,
[10] . For each welding condition five samples were prepared for tensile test
Fig 4: schematic diagram for notched tensile strength (NTS)
Impact Test
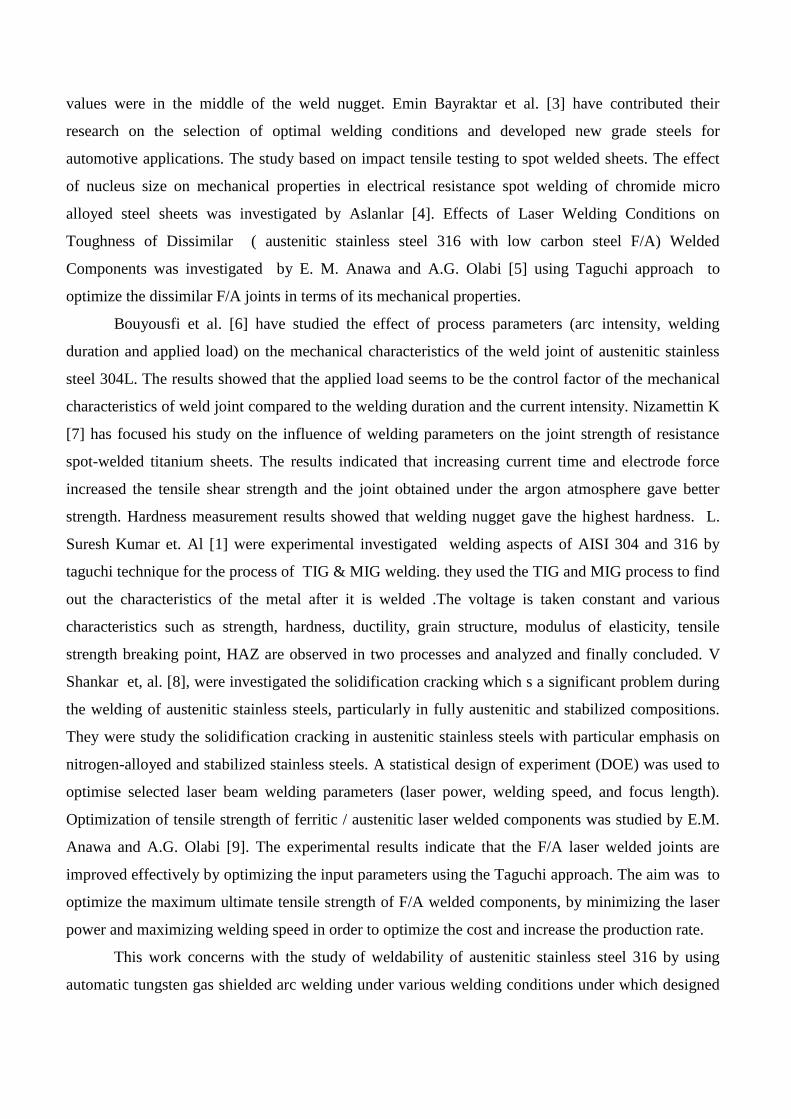
This test was carried out in (Mechanical Engineering Department) at room temperature (25ºC),
for all the impact samples. The impact testing machine diagram and the impact samples are shown in
Fig 5 and Fig 6. For each welding condition five samples were prepared for impact test.
Fig 3: Tensile testing machine Fig 5: Impact Testing Machine
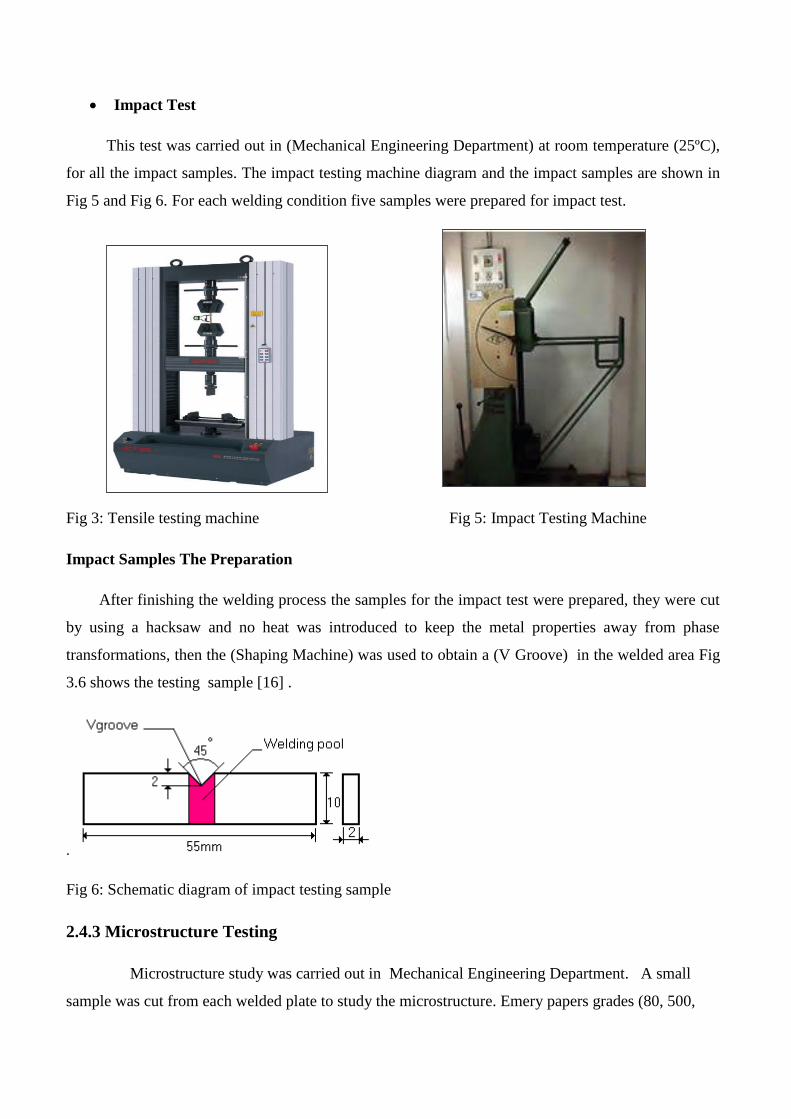
Impact Samples The Preparation
After finishing the welding process the samples for the impact test were prepared, they were cut
by using a hacksaw and no heat was introduced to keep the metal properties away from phase
transformations, then the (Shaping Machine) was used to obtain a (V Groove) in the welded area Fig
3.6 shows the testing sample [16] .
.
Fig 6: Schematic diagram of impact testing sample
2.4.3 Microstructure Testing
Microstructure study was carried out in Mechanical Engineering Department. A small
sample was cut from each welded plate to study the microstructure. Emery papers grades (80, 500,
and 800) were used for grinding the samples before polishing . For etching stainless steel, a (1g) meta
sulphate by meta sodium and (20 ml) of HCL and (100 ml) of distilled water was applied as an
etchant. Microscopic examination was carried out using the ZIESS type optical microscope in
Mechanical Department at Material laboratory at Benghazi University.
3. Results and Analysis
following welding process and preparing of samples, the testing process were performed and
the results obtained are exhibited in Tables 4- 7 and represents in Fig 7-10.
The result analysis for the effect of gas flow and welding current on the mechanical properties
are as follows:
3.1 Impact Test
Analysis of Impact Energy Results for Fixed Gas Flow Rate and variable Electrical Welding
Current. The welded samples were tested by charpy impact. An average of five impact specimens
values were determined and tabulated in Table 4. These results are represented in a plot of impact
energy with the variable welding current as shown in Fig. 7.
Table 4 shows that the maximum value of absorbed energy achieved was 26.8J at 120 A and the
minimum value was 19 J at 80 A. The range between the maximum and minimum absorbed energy
was 7.8 J. The results represented in Fig 7 shows that the effect of changing of welding current at a
fixed gas flow rate, it is clear that increasing of welding current results to increasing in absorbed
impact energy and toughness of the welded joint of 316 austenitic stainless steel.
Table 4 Results of Impact Test
Gas Flow (10 L / min ) Current (A) Average 5 4 3 2 1
11 52 10 12 11 55 08
26.6 50 50 52 00 51 188
26.8 52 50 55 00 00 128
26.4 52 50 50 00 05 168
25.2 50 52 55 00 50 108
3.1.2 Analysis Result of the Fixed Welding Current and Changing of Gas Flow Rate
The effect of gas flow rate on the impact energy of the welded joints of studied stainless steel
was also investigated. Table 5 presents the results for the impact tests for the various shielding gas
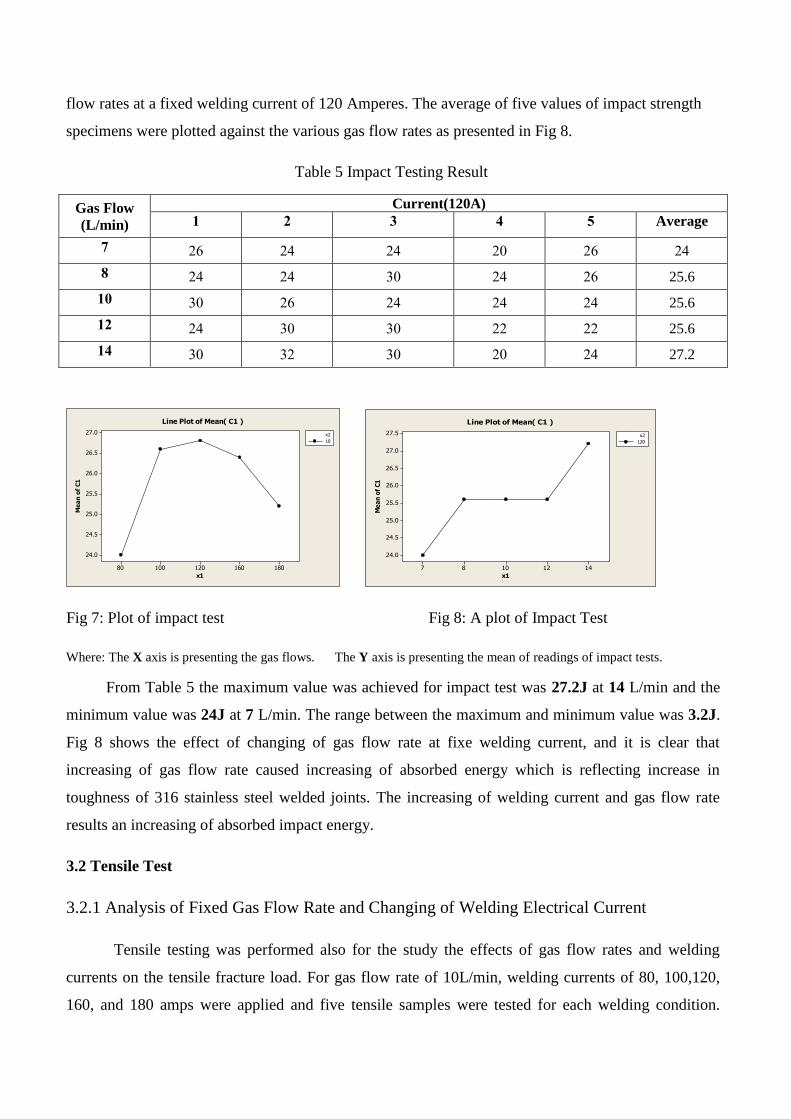
flow rates at a fixed welding current of 120 Amperes. The average of five values of impact strength
specimens were plotted against the various gas flow rates as presented in Fig 8.
Table 5 Impact Testing Result
Current(120A) Gas Flow
(L/min) Average 5 4 3 2 1
50 52 50 50 50 52 7
25.6 52 50 00 50 50 0
25.6 50 50 50 52 00 18
25.6 55 55 00 00 50 12
27.2 50 50 00 05 00 14
18016012010080
27.0
26.5
26.0
25.5
25.0
24.5
24.0
x1
Me
an
of
C1
10
x2
Line Plot of Mean( C1 )
14121087
27.5
27.0
26.5
26.0
25.5
25.0
24.5
24.0
x1
Me
an
of
C1
120
x2
Line Plot of Mean( C1 )
Fig 8: A plot of Impact Test Fig 7: Plot of impact test
Where: The X axis is presenting the gas flows. The Y axis is presenting the mean of readings of impact tests.
From Table 5 the maximum value was achieved for impact test was 27.2J at 14 L/min and the
minimum value was 24J at 7 L/min. The range between the maximum and minimum value was 3.2J.
Fig 8 shows the effect of changing of gas flow rate at fixe welding current, and it is clear that
increasing of gas flow rate caused increasing of absorbed energy which is reflecting increase in
toughness of 316 stainless steel welded joints. The increasing of welding current and gas flow rate
results an increasing of absorbed impact energy.
3.2 Tensile Test
3.2.1 Analysis of Fixed Gas Flow Rate and Changing of Welding Electrical Current
Tensile testing was performed also for the study the effects of gas flow rates and welding
currents on the tensile fracture load. For gas flow rate of 10L/min, welding currents of 80, 100,120,
160, and 180 amps were applied and five tensile samples were tested for each welding condition.

Table 6 presents the received testing results. To demonstrate the tensile strength behavior, the results
were plotted as shown in Fig 9.
Table 6 Readings of Tensile Test
Gas Flow (x 10 L / min ) Current (A) Average 5 4 3 2 1
210 250 100 100 200 100 08
920 100 100 100 1000 100 188
858 250 250 200 150 100 128
864 250 100 250 200 150 168
820 200 200 100 200 200 108
Table 6 exhibits that the maximum tensile strength value was 920 MPa achieved at 100 A and
the minimum value was 820 MPa achieved at 180 A. The range between the maximum and minimum
tensile strength is 100 MPa. Fig 9 represents the effect of changing of welding current on tensile
strength. It is clear that increasing of electrical current caused decreasing tensile strength and hence
the ductility of the welded joints.
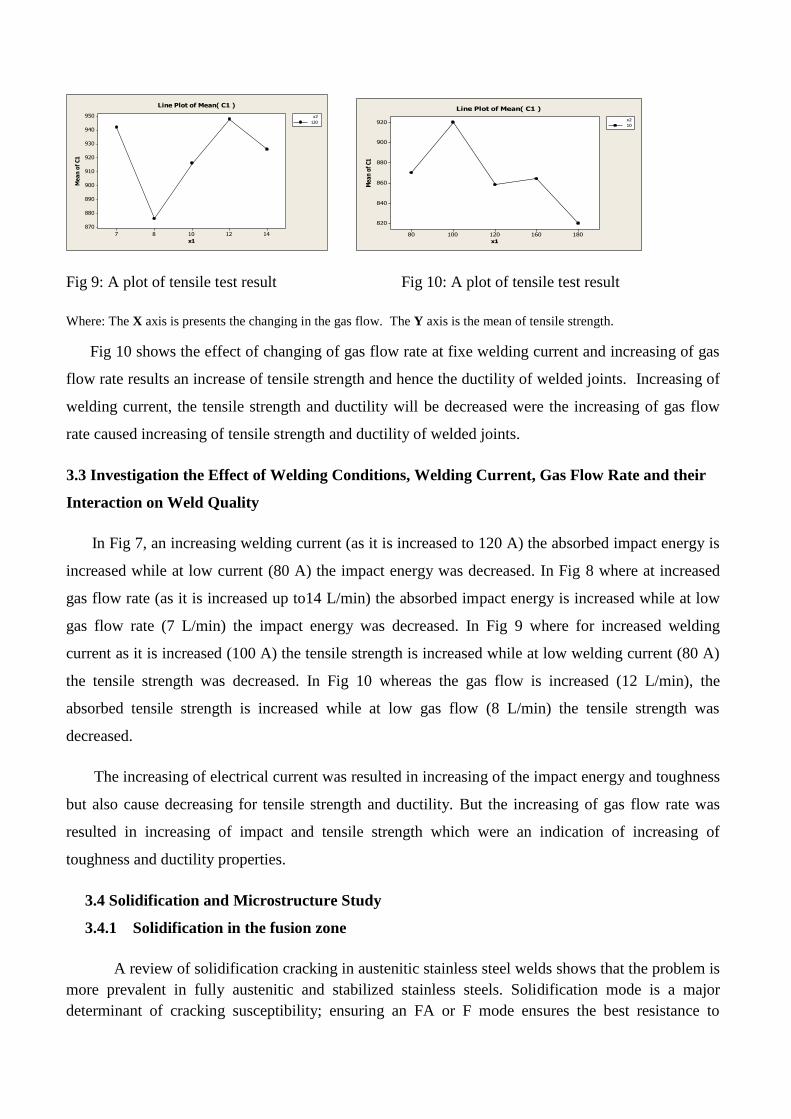
3.2.2 Analysis of the Fixed Electrical Current and Changing of Gas Flow Rate
The effect of gas flow rate was also studied on the tensile strength behavior of stainless steel.
Table 7 presents the results for tensile strength at a fixed welding current of 120 A but for various
shielding gas flow rates. The average of five tensile testing samples was plotted against the shielding
gas flow rate in Fig10.
Table 7 Readings of Tensile Test
Current(120A) Gas Flow
(L/min) Average 5 4 3 2 1
105 110 100 100 1000 100 7
876 250 250 100 120 200 0
916 110 100 150 100 220 18
948 100 100 150 1000 150 12
926 150 120 100 110 100 14
From the Table 7 the maximum tensile strength test value achieved was 948 MPa at 12 L/min and
the minimum value was 876 MPa at 8 L/min, the range between the maximum and minimum tensile
strength value is 72 MPa.
14121087
950
940
930
920
910
900
890
880
870
x1
Me
an
of
C1
120
x2
Line Plot of Mean( C1 )
18016012010080
920
900
880
860
840
820
x1
Me
an
of
C1
10
x2
Line Plot of Mean( C1 )
Fig 9: A plot of tensile test result Fig 10: A plot of tensile test result
Where: The X axis is presents the changing in the gas flow. The Y axis is the mean of tensile strength.
Fig 10 shows the effect of changing of gas flow rate at fixe welding current and increasing of gas
flow rate results an increase of tensile strength and hence the ductility of welded joints. Increasing of
welding current, the tensile strength and ductility will be decreased were the increasing of gas flow
rate caused increasing of tensile strength and ductility of welded joints.
3.3 Investigation the Effect of Welding Conditions, Welding Current, Gas Flow Rate and their
Interaction on Weld Quality
In Fig 7, an increasing welding current (as it is increased to 120 A) the absorbed impact energy is
increased while at low current (80 A) the impact energy was decreased. In Fig 8 where at increased
gas flow rate (as it is increased up to14 L/min) the absorbed impact energy is increased while at low
gas flow rate (7 L/min) the impact energy was decreased. In Fig 9 where for increased welding
current as it is increased (100 A) the tensile strength is increased while at low welding current (80 A)
the tensile strength was decreased. In Fig 10 whereas the gas flow is increased (12 L/min), the
absorbed tensile strength is increased while at low gas flow (8 L/min) the tensile strength was
decreased.
The increasing of electrical current was resulted in increasing of the impact energy and toughness
but also cause decreasing for tensile strength and ductility. But the increasing of gas flow rate was
resulted in increasing of impact and tensile strength which were an indication of increasing of
toughness and ductility properties.
3.4 Solidification and Microstructure Study
3.4.1 Solidification in the fusion zone
A review of solidification cracking in austenitic stainless steel welds shows that the problem is
more prevalent in fully austenitic and stabilized stainless steels. Solidification mode is a major
determinant of cracking susceptibility; ensuring an FA or F mode ensures the best resistance to
cracking. An important aspect of weld solidification is the effect of solidification kinetics on the
phases formed. The eutectic reaction L ↔ ϭ + γ in stainless steels is not typical of the classical
eutectic in the sense that the composition difference between ϭ and γ phases is minor. The relatively
minor difference in thermodynamic stability of the two phases in the vicinity of the eutectic permits
non-equilibrium solidification to a metastable phase obtained by extrapolation of the equilibrium
phase boundaries [11]. Thus, the weld microstructure in stainless steels depends significantly on
kinetic factors such as cooling rate and epitaxy, apart from equilibirum stability considerations. Under
the rapid cooling and fast growth rates aided by epitaxy, the weld structure could solidify far away
from equilibrium [12].
As Pb is insoluble in molten steel, and austenite / ferrite have a low capacity for dissolving S
and P, all of these elements are vigorously segregated in the liquid during solidification. The resulting
high impurity concentrations in the last liquid to solidify in the interdendritic regions have much
lower melting points than those of the primary solidifying phase. The melting point of Pb is only 327–
502°C and the melting point of the sulphides (MnS, FeS, CrS) is about 1100 –1200°C, i.e. much
lower than that of Fe (1538°C). If sufficiently high stresses are generated before final solidification,
the boundaries with segregated Pb and sulfides may separate to form solidification cracks in the
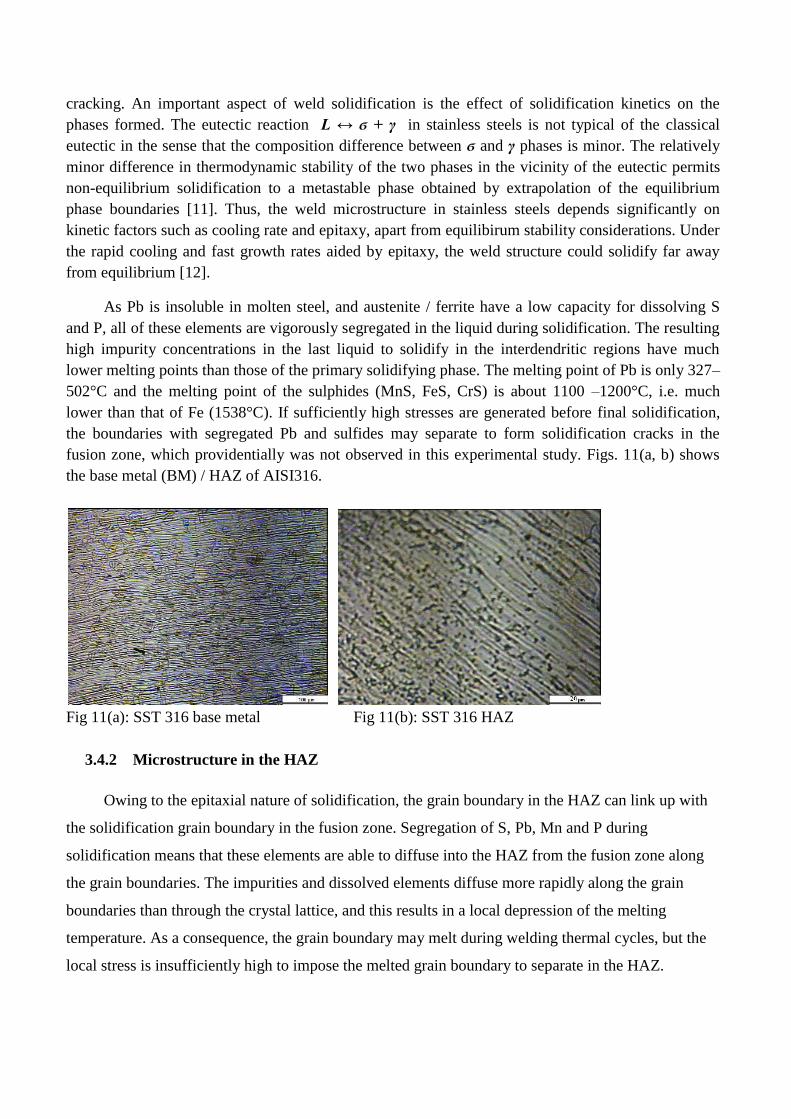
fusion zone, which providentially was not observed in this experimental study. Figs. 11(a, b) shows
the base metal (BM) / HAZ of AISI316.
Fig 11(a): SST 316 base metal Fig 11(b): SST 316 HAZ
3.4.2 Microstructure in the HAZ
Owing to the epitaxial nature of solidification, the grain boundary in the HAZ can link up with
the solidification grain boundary in the fusion zone. Segregation of S, Pb, Mn and P during
solidification means that these elements are able to diffuse into the HAZ from the fusion zone along
the grain boundaries. The impurities and dissolved elements diffuse more rapidly along the grain
boundaries than through the crystal lattice, and this results in a local depression of the melting
temperature. As a consequence, the grain boundary may melt during welding thermal cycles, but the
local stress is insufficiently high to impose the melted grain boundary to separate in the HAZ.

Fig.12: The redistribution of elements in the fusion zone of a butt weld joining AISI316.
4. Conclusions
Referring to the previous discussion and the results obtained the following are concluded:
1. The welding parameters which studied in this manuscript were had high effect in the quality of
welding and mechanical properties of the joints.
2. The electrical current welding parameter had a great effect in the weld quality. It is inversely
proportional with tensile strength and directly proportional with impact strength.
3. The gas flow rate had strong effective on weld quality of (austenitic stainless steel 316). It is
directly proportional with impact and tensile strength.
Acknowledgements
Benghazi University, Faculty of Engineering ( Industrial and Mechanical Departments) are
gratefully acknowledged for the support of this research. Technical support from General Pipe
Company are also gratefully acknowledged.
References
[1] L.Suresh Kumar, Dr.S.M.Verma, P.Radhakrishna Prasad, P.Kiran kumar Dr.T.Siva Shanker, (2011) “Experimental
Investigation for Welding Aspects of AISI 304 & 316 by Taguchi Technique for the Process of TIG & MIG Welding”
International Journal of Engineering Trends and Technology- 2, 2, ISSN: 2231-5381: 28-33.
[2] V. Murat, and A. Ahmet, (2004).On the resistance spot weldability of galvanized interstitial free steel sheets with
austenitic stainless steel sheets, J of Materials Processing Technology,: 153-154.
[3] B.Emin, K. Dominique, G. Marc, 2004) Application of impact tensile testing to spot welded sheets, Journal of
Materials Processing Technology, 153-154: 80-86.
[4] S. Aslanlar, 92006) The effect of nucleus size on mechanical properties in electrical resitance spot welding of sheets
used in automotive industry, Materials and Design, 27: 125-131.
[5] E. M. Anawa and A.G. Olabi,(2006) “Effects of Laser Welding Conditions on Toughness of Dissimilar Welded
Components”, Applied Mechanics and Materials 5-6; 375-380.
[6] B. Bouyousfi, T. Sahraoui, S. Guessasma, K. Tahar Chaouch, (2007)‘ Effect of process parameters on the physical
characteristics of spot weld joints’, J.Materials and Design, 28: 414-419.

[7]K. Nizamettin, ‘ The influence of welding parameters on the joint strength of resistance spot-welded titanium sheets’, J
Materials and Design, 28: 420-427.
[8] V. Shankar, T. Gill, S. Mannan and S. Sundaresan, (2003) ‘Solidification cracking in austenitic stainless steel welds’, J
S¯adhan¯a 28, 3 & 4: 359–382.
[9] E. M. Anawa and A. G. Olabi, Anawa EM, Olabi AG. (2008) ‘Optimization of tensile strength of ferritic / austenitic
laser-welded components’, Jof Optics and Lasers in Engineering, 46, 8:571-577.
[10] Ezzeddin A nawa . (2008) ’Feasibility and Optimization of Dissimilar Laser Welding Components’ . PHD . Thesis:
97 and 100.
[11] Kelly T F, Cohen M. Vandersande J B (1984) Rapid solidification of a droplet-processed stainless steel. Met. Trans.
A15: 819–833
[12] R. Balluffi, (1982) ‘Grain boundary diffusion mechanism in metal’s, Met. Trans. A 13A :2069–2095