investigation of urea deposit formation in vehicles with...
TRANSCRIPT

Investigation of urea deposit formation in
vehicles with Selective Catalytic
Reduction system Master’s Thesis in Automotive Engineering
TOBIAS HOLMSTRÖM
LARS WALLIN
Department of Applied Mechanics
Division of Combustion
CHALMERS UNIVERSITY OF TECHNOLOGY
Göteborg, Sweden 2014
Master’s thesis 2014:30


MASTER’S THESIS IN AUTOMOTIVE ENGINEERING
Investigation of urea deposit formation in vehicles with
Selective Catalytic Reduction system
Tobias Holmström
Lars Wallin
Department of Applied Mechanics
Division of Combustion
CHALMERS UNIVERSITY OF TECHNOLOGY
Göteborg, Sweden 2014

Investigation of urea deposit formation in vehicles with Selective Catalytic Reduction
system
TOBIAS HOLMSTRÖM. LARS WALLIN
© TOBIAS HOLMSTRÖM, LARS WALLIN 2014
Master’s Thesis 2014:
ISSN 1652-8557
Department of Applied Mechanics
Division of Combustion
Chalmers University of Technology
SE-412 96 Göteborg
Sweden
Telephone: + 46 (0)31-772 1000
Chalmers Reposervice
Göteborg, Sweden 2014
I
Investigation of urea deposit formation in vehicles with Selective Catalytic Reduction
system
Master’s Thesis in the Automotive Engineering
TOBIAS HOLMSTRÖM, LARS WALLIN
Department of Applied Mechanics
Division of Combustion
Chalmers University of Technology
ABSTRACT
In order to reduce NOX emissions from a diesel engine a urea-water solution called AdBlue is injected into the exhaust system. Risk of deposit formation is high due to unwanted side reactions that may occur during the decomposition of AdBlue during transient engine operation.
The objective of the thesis is to increase the knowledge about the formation and
decomposition of urea deposits and to develop an experimental method for studying
these phenomena. The knowledge will form a base for a kinetic model for deposit
formation and decomposition.
A literature review was performed to identify unwanted side-reactions that may occur
when urea is injected and what parameters influence the formation of deposits. In
order to test how these parameters influence the rate of deposit formation, a test set-up
was designed for engine bench tests rig at Volvo Cars. The tests were carried out with
consideration to critical parameters and limitations of the test rig.
Urea deposits were detected at all operation points, even at temperatures as high as
450˚C. All deposits formed during the tests could be decomposed when dosing was
stopped and the temperature was increased above 450˚C. A correlation between
theoretical calculations, i.e. a heat balance over the wetted area, and experimental
results could be seen. The effect of energy transfer can be seen in the experiments as a
temperature drop on the surface where the spray hits. The build-up and break-down
have been captured on film and shows a non-linear rate.
It is to some extent possible to predict if there will be deposits in the system by
a theoretical comparison of the available energy in the exhaust gases to the
energy required to decompose the urea-water solution. One parameter that has a
great influence on the energy calculations is the area that the liquid spray hits, i.e.
the area were the main heat transfer occurs. If this surface can be increased the
amount of urea-water solution that can be decomposed into ammonia will
increase. A better surface distribution and spray dispersion will provide better
control of the amount of liquid that will reach the surface and a better base for
predicting deposit formation with energy calculations.
Key words: Urea deposits, urea injection, selective catalytic reduction, diesel exhaust
aftertreatment, heat transfer model, AdBlue

II

III
Preface
This master thesis has been performed at Volvo Car Corporation in Gothenburg
completing a Master of Science degree in Automotive Engineering at Chalmers
University of Technology. The project has been done at Exhaust After Treatment
department 97621 at Volvo Car Corporation from January to June 2014.
Acknowledgments
We would like to express our most sincere appreciation to the people who made this
thesis possible and helped us during our work.
To our supervisors at Volvo Per Gustafson and Carolin Wang-Hansen for your
support and assistance, guiding us through the organization and providing valuable
input on our work and ideas. To our examiner at Chalmers assistant professor Jonas
Sjöblom for your support and ideas.
Last but not least, a special thanks goes to all employees at Volvo Car Corporation
who provided valuable help in all our endeavors.

IV

V
Table of Figures
Figure 2.1 Metal and ceramic substrate ......................................................................... 5
Figure 2.2 Wall flow in a diesel particulate filter .......................................................... 5
Figure 2.3 Typical SCR-system layout .......................................................................... 6
Figure 3.1 Schematic view of spray angle from the injector ....................................... 12
Figure 3.2 Inspection glass on the substrate side ......................................................... 15
Figure 4.1 Footprint of spray on substrate surface ...................................................... 21
Figure 4.2 Total concentration of NH3 and HNCO at low point with 3-hole injector 23
Figure 4.3 Temperature drop on substrate surface at low point with 3-hole injector .. 24
Figure 4.4 Differential pressure of the substrate at low point with 3-hole injector ..... 24
Figure 4.5 Deposits covering the cells on the substrate at low point with 3-hole
injector ......................................................................................................................... 25
Figure 4.6 NH3 and HNCO concentration at medium point with 3-hole injector ....... 26
Figure 4.7 Surface temperature on substrate at medium point with 3-hole injector .... 27
Figure 4.8 Differential pressure over substrate at medium point with 3-hole injector 28
Figure 4.9 Deposit on the substrate surface at medium point with 3-hole injector ..... 28
Figure 4.10 Spray foot-print for 6 holes injector ......................................................... 29
Figure 4.11 Total concentration of NH3 and HNCO at low point with 6-hole injector
...................................................................................................................................... 31
Figure 4.12 Temperature drop on substrate surface at low point with 6-hole injector 32
Figure 4.13 Differential pressure of the substrate at low point with 6-hole injector ... 32
Figure 4.14 Deposits on substrate on low point with 6-hole injector .......................... 33
Figure 4.15 Total concentration of NH3 and HNCO at medium point with 6-hole
injector ......................................................................................................................... 34
Figure 4.16 Temperature drop on substrate surface at medium point with 6-hole
injector ......................................................................................................................... 34
Figure 4.17 Differential pressure of the substrate at medium point with 6-hole injector
...................................................................................................................................... 35
Figure 4.18 Differential pressure comparison at medium point with 6-hole injector .. 36
Figure 4.19 Deposits on substrate ................................................................................ 36
Figure 4.20 Total concentration of NH3 and HNCO at high point with 6-hole injector
...................................................................................................................................... 37
Figure 4.21 Temperature drop on substrate surface at high point with 6-hole injector
...................................................................................................................................... 38
Figure 4.22 Differential pressure of the substrate at high point with 6-hole injector .. 38
Figure 4.23 Deposits on substrate on high point with 6-hole injector ......................... 39
Figure 4.24 Pulsating dosing ........................................................................................ 39

VI
Figure 4.25 Surface temperature drop when dosing 15 mg/s at different operation
points ............................................................................................................................ 40
Figure 4.26 Surface temperature drop with different dosing on low point .................. 41
Figure 4.27 Deposit amount before decomposition ..................................................... 43
Figure 4.28 Deposit decomposition ............................................................................. 44
Figure 4.29 Deposit decomposition ............................................................................. 45
Figure 4.30 Possible amount to decompose with the available energy for three hole
injector ......................................................................................................................... 46
Figure 4.31 Possible amount to decompose with the available energy for six hole
injector ......................................................................................................................... 46
Figure 4.32 Mass flow dependency with injected amount .......................................... 47
Figure 4.33 Temperature influence on injected amount .............................................. 48
Figure 4.34 Area influence on injected amount ........................................................... 49
Figure 4.35 View from camera in the beginning of sampling and after some time .... 50

VII
Table of abbreviations
CAD Computer aided design
CFD Computational fluid dynamics
CO Carbon monoxide
CO2 Carbon dioxide
DOE Design of experiments
DPF Diesel particulate filter
ECU Engine control unit
EGR Exhaust gas recirculation
FPD1 Funktions provning dynamisk 1
FTIR Fourier transformations infrared spectroscopy
GSA Geometric surface area
H2O Water
HC Hydrocarbons
HNCO Isocyanic acid
ICE Internal combustion engine
kg kilogram
kPa kilo Pascal
mg milligram
min Minute
NH3 Ammonia
Nm Newton meter
NO Nitric oxide
NO2 Nitrogen dioxide
NOx Nitrogen oxides
OEM Original equipment manufacturer
rpm Rounds per minute
s Second
SCR Selective catalytic reduction
SCRF Selective catalytic reduction on filter
TP5 Tramissions provning 5
VED4 MP Volvo environmental diesel 4 cylinder medium power
VCC Volvo Car Corporation

VIII

IXI
Contents
ABSTRACT I
PREFACE III
ACKNOWLEDGMENTS III
TABLE OF FIGURES V
TABLE OF ABBREVIATIONS VII
CONTENTS I
1 INTRODUCTION 1
1.1 Background 1
1.2 Purpose 1
1.3 Scope 2
1.4 Limitations 2
2 THEORY 3
2.1 Diesel Combustion 3
2.2 Environmental impact 3
2.3 Emission regulation 4
2.4 Catalyst substrates and washcoat 5
2.5 SCR-System layout 6
2.6 Selective catalytic reduction (SCR) chemistry 6
2.7 Urea decomposition 7
2.8 Urea deposits 8
2.8.1 Temperature dependence of formation and decomposition 8 2.8.2 Cooling effects when impingement hot surface 9 2.8.3 Geometry dependence of formation and decomposition 9
2.9 Heat transfer 10
2.9.1 Conduction 10 2.9.2 Convection 10 2.9.3 Radiation 11
3 METHOD 12
3.1 System set-up 12 3.1.1 AdBlue injectors and delivering system 12 3.1.2 Catalyst substrates 13
3.2 Engine test rig 13
3.3 Measurement equipment 14 3.3.1 Temperature Sensors 14
3.3.2 Gas measurement 14

X
3.3.3 Optical measurement 14
3.3.4 Pressure sensors 15
3.4 Energy calculations 16 3.4.1 Thermal conductivity calculations 16
3.5 Testing 18 3.5.1 Operating points 18 3.5.2 Design of experiments 19 3.5.3 Test procedure 19 3.5.4 First session 20
3.5.5 Second Session 20 3.5.6 Decomposition 20
4 RESULTS 21
4.1 Tests with Injector 1: 3-hole type 21 4.1.1 Low energy point 21 4.1.2 Medium energy point 25 4.1.3 High energy point 28
4.2 Tests with Injector 2: 6-hole type 29 4.2.1 Low energy point 29
4.2.2 Medium energy point 33 4.2.3 High energy point 36
4.3 Pulsating dosing strategy 39
4.4 Initial temperature drop 40
4.5 Mass balance errors 41 4.5.1 Low Point 41
4.5.2 Medium Point 42 4.5.3 High Point 42
4.6 Deposit decomposition 42
4.6.1 60 min 7 mg/s 43 4.6.2 180 min 15 mg/s 44
4.7 Mass flow, temperature and area influences 45 4.7.1 Mass flow influence 47 4.7.2 Temperature influence 47
4.7.3 Area influence 48
4.8 Filming 49
5 DISCUSSION 51
5.1 Mass Balance and concentrations 51
5.2 Energy and heat balance calculations 51
5.3 Deposits formation and decomposition 52
5.4 Temperature drop 53
5.5 Differential pressure 53
5.6 Filming into the exhaust system 54

IXI
6 CONCLUSIONS 55
7 FUTURE WORK 56
7.1 Testing improvement 56
7.2 Theory improvement 56
8 REFERENCES 57


CHALMERS, Applied Mechanics, Master’s Thesis 2014:
1
1 Introduction
In this chapter a background for the project is described along with the scope, purpose
and limitations.
1.1 Background
Internal combustion engines (ICE) are the far most common power source for road
vehicles in the world, in combination with good infrastructure of fuel supply and
high
energy density makes it a very attractive propulsion technology. However, well
known is the problem with the increasing number of vehicles in the world and
therefore the need to decrease the emissions such as nitrogen oxides (NOX), carbon
dioxide (CO2), hydrocarbons (HC), soot and carbon monoxide (CO) from the
combustion of fossil fuels.
The amount of emissions that a vehicle is allowed to emit is regulated by international
law and emission regulations are becoming more stringent. Vehicles produced later
than 2017 must fulfill Euro 6c legal demands where the lowered limits for NOx
emissions will, for most OEMs, require the use of an active reduction system.
Introduction of selective catalytic reduction (SCR) systems that actively reduce NOx
is a solution for fulfilling Euro 6c standards. Ammonia (NH3) is added to the exhaust
gases and reacts with NOx to form CO2 and water (H2O). Since ammonia in pure
form
is toxic and caustic it has been decided to use a solution of water and Urea
(CO(NH2)2) called AdBlue. Urea decomposes into ammonia at high enough
temperature and with the help of a catalytic surface.
The decomposition of urea-water solution is thermally activated; it starts with
evaporating the water from the fluid, leaving the urea molecules. Urea molecules are
decomposed in two stages and the reactions release one ammonia molecule in each
stage.
If the decomposing of urea is not completed the intermediate phases in the
decomposition can react with urea and form different unwanted by-products. These
by-products are solid polymers (deposits) that might stick onto pipe walls, injectors
and SCR surfaces and cause NOX conversion efficiency to go down, making the
system less effective and may lower the performance of the engine. These deposits
can be decomposed if the temperature is high enough. However raising the exhaust
gas temperature might have a negative impact on fuel consumption. Therefore it is of
interest to get a good understanding on how deposits are formed and broken-down
in order to reach an efficient dosing strategy avoiding deposit formation.
1.2 Purpose
The general purpose of this study is to increase the knowledge and understanding
about formation and breakdown of urea deposits in exhaust after-treatment systems
for light duty diesel vehicles. Specifically an experimental method for detection of
urea deposits is developed. Experiments were performed on a closed-coupled catalyst
system in order to gather data on deposit formation. The experimental data was used

CHALMERS, Applied Mechanics, Master’s Thesis 2014:30
2
to develop and validate a heat transfer model for deposit formation. The study is
carried out in collaboration with Volvo Car Corporation (VCC).
1.3 Scope
In order to fulfill the purpose of the project a number of questions will have to be
answered with theoretical and experimental studies
Evaluate methods for detecting deposits
Where in the system are deposits formed at different operating points?
How much urea can be injected before deposits are formed
What is the thermal limit, i.e. temperature and mass flow of exhaust gas, for
injection of a given amount of Urea into the exhaust system?
How does the distribution of liquid, i.e. the wetted area, influence the formation of
deposits?
What are the temperature and exhaust mass flow dependences of the formation
and decomposition rates respectively?
1.4 Limitations
The project focuses on a theoretical and experimental investigation on formation and
decomposition of urea deposits in a close coupled after treatment system and the
following limits of the work apply:
Experiments are performed on VCC exhaust aftertreatment design including lay-
out, substrate type and washcoat formula.
Experiments performed at VCC facilities with equipment supplied by VCC.
The project does not cover any calculation/simulations on spray quality, droplet
size or spray penetration.
The physical testing will be carried out in an engine test rig with a four cylinder
inline diesel engine.
Experiments will be conducted with two types of injectors provided by VCC.
The study will try to replicate the real conditions in the exhaust system.
The study will not will not focus on dosing strategies for Urea-SCR systems.

CHALMERS, Applied Mechanics, Master’s Thesis 2014:
3
2 Theory
In this chapter the theory supporting the outcome of this project is presented. Starting
with describing why there is a need for an active SCR-system because of upcoming
legal demands on emissions from combustion powered vehicles. The chapter
continues with a description of the chemical reactions that occur. Finally heat
transfer mechanisms are introduced and the theory behind design of experiments
(DOE).
2.1 Diesel Combustion
Combustion in a diesel engine is initialized by compression of a lean fuel and air
mixture until the charge has absorbed necessary amount of energy for combustion to
start. The combination of excess air and high temperatures enables atmospheric
nitrogen to react according to the extended Zeldovich mechanism seen in equation
(2.1), (2.2) and (2.3) the reactions are as follows with the addition of Lavoie et al [1]
𝑶 + 𝑵𝟐 = 𝑵𝑶 + 𝑵 (2.1) 𝑵 + 𝑶𝟐 = 𝑵𝑶 + 𝑶 (2.2) 𝑵 + 𝑶𝑯 = 𝑵𝑶 + 𝑯 (2.3)
NOx formation depends on the characteristics of the combustion; typical flame
temperatures suggest that the predominant source of NOx is nitric oxide. However in
engine out emission measurements the concentration of NO2 could range from 5-30
percent of the total NOx emissions due to the possibility of NO oxidizing to NO2
when there is a surplus of oxygen.
Since high temperature is causing high levels of NOX formations it is desired to
lower the combustion temperature to a level with lower NOX formation. One
common and efficient way of lowering the in-cylinder temperature is to dilute the
fresh intake air with gases that have lower oxygen content, often cooled exhaust
gases. This is called exhaust gas recirculation (EGR) when part of the exhaust mass
flow is taken from the main gas flow after the exhaust port and transported through
a cooler and then fed back into the intake system [1]. A controlled valve changes the
amount of exhaust that is fed back to the intake.
2.2 Environmental impact
NO and NO2 are toxic for humans and have a negative impact on the environment.
NO2 is considered more toxic for humans and animals than NO and can cause
breathing problems and severe lung diseases. A high concentration of NO2 decreases
the immune system’s ability to fight of bacterial and viral infections and if exposed to
concentrations above 200 ppm it might be fatal [2].
The toxicity of NOX is not the most significant concern why it should be decreased
the environmental impact from this emissions are even worse. NOX can produce acid
rain, photochemical smog and ground level ozone when it reacts with different
components in the atmosphere. Acid rain is produced when NOX reacts with oxygen

CHALMERS, Applied Mechanics, Master’s Thesis 2014:30
4
and water to produce nitric acid. Acid rain can cause acidification of water and death
of forests [3].
Photochemical smog is a combination of several pollutants like CO, sulfur oxides,
fine particles and volatile organic compounds. Smog normally appears in city areas
where the concentration of these emissions is higher since there are more vehicles
operating in the same premises. Smog can be seen as gray haze, which forms a thick
lid on many cities around the world. From photochemical smog ground level ozone
can be formed. This happens when NOX and HC reacts and form ozone. Ozone can
cause damage to lungs, the respiratory system and also to damage crops and other
vegetated areas [3]. Since the number of internal combustion engines are increasing
rapidly it is of big interest to decrease the emitted levels of NOX.
2.3 Emission regulation
The negative health and environmental effects have led to the introduction of
emission legislation that state he allowed emission levels. European emission
standards have been in use since the beginning of 1990’s. The current standard for
new registered passenger and light duty vehicles is called Euro 5b (a summary of the
Euro5b level can be seen in Table 2.1) which stretches up until September 2014
when Euro 6 is introduced. From the current Euro 5 standard to Euro 6 the
permitted nitrogen oxides emissions will be lowered by 55 % [4] which is a
technical challenge for light duty vehicle manufacturers.
Table 2.1 European emission legislation development over time
Date CO [g/km]
NOX [g/km]
Particulate matters [g/km]
HC+NOx [g/km]
Particulate number [#/km]
Euro 3 2000.01 0.64 0.50 0.05 0.56 -
Euro 4 2005.01 0.50 0.25 0.025 0.30 -
Euro 5b 2011.09 0.50 0.18 0.005 0.23 6.0x10¹¹
Euro 6 2014.09 0.50 0.08 0.005 0.17 6.0x10¹¹
In 2017 a new test method for determining a vehicle emission levels in daily driving
will be introduced. This new test method is called real driving emission (RDE). RDE
will replace the current European test method, New European Driving Cycle (NEDC)
that is in use today. The idea of RDE is that the vehicle will be tested on a much
bigger part of the performance map. Instead of having a pre-defined driving cycle, as
in the case for NEDC, RDE will be performed in real traffic with a random driving
route.

CHALMERS, Applied Mechanics, Master’s Thesis 2014:
5
2.4 Catalyst substrates and washcoat
A catalyst is made of a substrate that works as a support for the washcoat. The two
most common types of substrates are a metal type and a ceramic type. The metal type
consists of thin steel sheets that are corrugated in a specific way to form a cell
structure that can be seen in Figure 2.1 and then rolled into a cylindrical shape. The
walls in the ceramic substrate are built up by a matrix extruded into a specific shape,
see Figure 2.1. The washcoat works as the carrier of the catalytic substance and is
often made of metal oxides such as Al2O3, TiO2, SiO2 and zeolites. The catalytic
substance is normally a precious metal and is blended into the washcoat. The
washcoat is used to create as big surface area as possible, where the reactants can
come into contact with the catalytic substance, and therefore increase the performance
of the catalyst [5].
Figure 2.1 Metal and ceramic substrate1
A substrate for a diesel particular filter (DPF) is often of ceramic type with porous
walls. The main difference for a filter substrate as compared to a flow-trough
substrate is that each channel is blocked in one end to force the gas flow through the
walls. The pores in the walls are big enough to let the gas through without causing a
significant pressure drop, but small enough to capture the soot as illustrated in Figure
2.2 [5].
Figure 2.2 Wall flow in a diesel particulate filter2
1 https://www.dieselnet.com/tech/cat_substrat.php
2 https://www.diselnet.com/tech/dpf_wall-flow.phh

CHALMERS, Applied Mechanics, Master’s Thesis 2014:30
6
2.5 SCR-System layout
Exhaust gases evacuated from the combustion is flowing through the headers down to
the first stage of the exhaust aftertreatment system. AdBlue is injected into the
exhaust system before the SCR so that the AdBlue and exhaust gases can mix. The
urea is then decomposed into ammonia that will travel down to the SCR coated
DPF(SCRF) where NOx is reduced with ammonia. After the SCRF an SCR is placed
to increase the NOx conversion efficiency and take care of ammonia slip from the
SCRF seen in Figure 2.3. The amount of AdBlue is controlled by the engine
control unit (ECU) and the injector is often cooled with water from the engine
cooling system. A tank houses a pump that pressurizes the AdBlue for the injector,
see Figure 2.3.
Figure 2.3 Typical SCR-system layout3
2.6 Selective catalytic reduction (SCR) chemistry
Selective catalyst reduction of NOx has been frequently used in stationary
applications
for around 30 years. The most common type of SCR uses ammonia as a reductant to
reduce NO and NO2 to harmless components [6]. The ammonia that is used in the
system is either pure ammonia gas or generated from a nitrogen and hydrogen rich
substance. The most common way in automotive applications is to use an aqueous
urea solution that goes under the brand name AdBlue. There are several reasons that
make AdBlue the preferred reductant instead of ammonia gas. One reason being that
pure ammonia in gas form is difficult to manage and if released is highly toxic and
caustic [7].
These are the normal SCR reactions that can occur when using ammonia as a
reductant in an automotive application [8]:
3 www.hybridcars.com/technolgies-greener-gasoline-disel-and-hybrid-delphi-53674/

CHALMERS, Applied Mechanics, Master’s Thesis 2014:
7
𝟐 𝑵𝑯𝟑 + 𝑵𝑶 + 𝑵𝑶𝟐 → 𝟐 𝑵𝟐 + 𝟑 𝑯𝟐𝑶 ( 2.4 )
𝟒 𝑵𝑯𝟑 + 𝟒 𝑵𝑶 + 𝑶𝟐 → 𝟒 𝑵𝟐 + 𝟔 𝑯𝟐𝑶 ( 2.5 )
𝟖 𝑵𝑯𝟑 + 𝟔 𝑵𝑶𝟐 → 𝟕 𝑵𝟐 + 𝟏𝟐 𝑯𝟐𝑶 ( 2.6 )
𝟒 𝑵𝑯𝟑 + 𝟔 𝑵𝑶 → 𝟓 𝑵𝟐 + 𝟔 𝑯𝟐𝑶 ( 2.7 )
Considering the low temperature range reaction (2.4) is the fastest reaction and
therefore it is favorable to have a ratio of 50 % 𝑁𝑂2
𝑁𝑂𝑥 , this means that there is equal
amount of moles of NO2 and NO, for good low temperature performance. Reaction
(2.5) is the standard SCR reaction, mainly since diesel exhausts has a high content of
NO. This reaction is slower than reaction (2.4), reaction (2.7) is even slower than
reaction (2.5) and therefore less ammonia is consumed by these chemical reactions in
automotive applications. If the 𝑁𝑂2
𝑁𝑂𝑋 is biased towards excess NO2 reaction (2.6) can
occur but it is also considered as a slow reaction. If the temperature is high the
following undesirable reactions can occur [8].
𝟒 𝑵𝑯𝟑 + 𝟒 𝑵𝑶 + 𝟑 𝑶𝟐 → 𝟒 𝑵𝟐𝑶 + 𝟔 𝑯𝟐𝑶 ( 2.8 )
𝟒 𝑵𝑯𝟑 + 𝟓 𝑶𝟐 → 𝟒 𝑵𝑶 + 𝟔 𝑯𝟐𝑶 ( 2.9 )
Reaction (2.8) produces nitrous oxide (N2O) that has a severe impact on the
greenhouse effect [9]. Reaction (2.9) shows that ammonia can oxidize to NO and
therefore it is undesirable since it will increase the NO concentration.
2.7 Urea decomposition
AdBlue is an aqueous urea solution with 32.5 % urea and 67.5 % water by weight.
The chemical formula for urea is CO(NH2)2 and it is chosen for its ability
decompose into ammonia. The aqueous urea solution is injected into the exhaust
gases where the water is evaporated and the remaining urea melts at 133˚C and starts
to decompose. The decomposition of urea is a two-stage reaction that starts with
thermolysis of urea to ammonia (NH3) and isocyanic acid (HNCO) seen in reaction
(2.10).
𝑪𝑶(𝑵𝑯𝟐)𝟐 + 𝒉𝒆𝒂𝒕 → 𝑵𝑯𝟑 + 𝑯𝑵𝑪𝑶 ( 2.10 )
After the thermolysis the isocyanic acid undergoes hydrolysis to ammonia and carbon
dioxide with following reaction [8].
𝑯𝑵𝑪𝑶 + 𝑯𝟐𝑶 → 𝑵𝑯𝟑 + 𝑪𝑶𝟐 ( 2.11 )

CHALMERS, Applied Mechanics, Master’s Thesis 2014:30
8
Reaction (2.10) and (2.11) shows that for each mole urea that decompose results in
two moles ammonia. The thermolysis is an endothermic reaction and the hydrolysis is
an exothermic reaction but the total reaction from one urea molecule to two ammonia
molecules is endothermic. The second stage of the decomposition has shown to be
stable in gas phase, which means that reaction (2.11) will not occur in gas phase.
To make the hydrolysis reaction occur a catalyst is needed, this catalyst is normally of
the same type as for the SCR catalyst [10].
2.8 Urea deposits
The reactions explained above in Section 2.7 Urea decomposition, are the desired
reaction paths for urea but the decomposition of urea is complex and can take several
different undesired pathways. Since the hydrolysis reaction is slow and needs a
catalyst to happen, it gives opportunity for isocyanic acid to react with undecomposed
urea. The products that are formed when isocyanic acid reacts with urea are complex
polymer chains such as biuret, triuret, melamine, ammeline, ammelide and cyanuric
acid [11]. Below the typical reactions can be seen [13].
𝑪𝑶(𝑵𝑯𝟐)𝟐 + 𝑯𝑵𝑪𝑶 → 𝑵𝑯(𝑪𝑶𝑵𝑯𝟐)𝟐 ( 2.12)
𝑵𝑯(𝑪𝑶𝑵𝑯𝟐)𝟐 + 𝑯𝑵𝑪𝑶 → 𝑻𝒓𝒊𝒖𝒓𝒆𝒕 ( 2.13)
𝟑𝑯𝑵𝑪𝑶 → 𝑪𝟑𝑵𝟑(𝑶𝑯)𝟑 ( 2.14)
𝑵𝑯(𝑪𝑶𝑵𝑯𝟐)𝟐 + 𝑪𝟑𝑵𝟑(𝑶𝑯)𝟑 → 𝑨𝒎𝒎𝒆𝒍𝒊𝒏𝒆 + 𝟐𝑯𝟐𝑶 ( 2.15)
𝑵𝑯(𝑪𝑶𝑵𝑯𝟐)𝟐 + 𝑪𝟑𝑵𝟑(𝑶𝑯)𝟑 → 𝑨𝒎𝒎𝒆𝒍𝒊𝒅𝒆 + 𝑯𝟐𝑶 ( 2.16)
2.8.1 Temperature dependence of formation and decomposition
Studies on urea decomposition have mainly been done in laboratory environment
where a solid urea sample has been placed in a gas chamber and gradually heated. The
weight of the remaining urea has been under close monitoring to see how much urea
that has decomposed into gas phase (thermogravimetric). The gas that is formed
during the decomposition is then analyzed with different methods to evaluate what
different gas components that are formed during different temperatures [12]. In
studies it has been seen that the different polymers are formed and decomposed at
slightly different temperatures. The first polymer that is formed is Biuret from the
reaction between isocyanic acid and undecomposed urea. The formation of Biuret
takes place between 150-190 ˚C and starts to melt and decompose at around 193-
250˚C [13].
Cyanuric acid is formed from either a reaction of Biuret and isocyanic acid or from
just polymerization of isocyanic acid [13] [15]. These reactions start from around
175˚C and continue up to around 250˚C. The decomposition of Cyanuric acid takes
place of a wide temperature range from 250˚C all the way up to 400 ˚C [13].

CHALMERS, Applied Mechanics, Master’s Thesis 2014:
9
Ammeline and Ammelide are observed as reactions happening parallel with both
Biuret and Cyanuric acid formation. These polymers are formed from Biuret and
Isocyanic acid in different combinations [13].
2.8.2 Cooling effects when impingement hot surface
Since the first part of the urea decomposition, equation (2.10), is endothermic it will
cause the temperature to drop in the system. This temperature drop will be significant
if a droplet of AdBlue hits a hot surface in the exhaust system. If another droplet hits
the same spot on the surface before the surface has been given the time heat up to
equilibrium temperature the new droplet will cool down the surface further [14]. [14].
Since the temperature plays a big role when the urea deposits are formed this
cooling effect of a surface can increase the risk of deposit formation on surfaces
where the liquid impinges. In the study performed by Xo et al [14] it could be
seen that the temperature of the surface where the droplet hits was cooled down with
5-30 ˚C but the temperature recovered within 5 seconds. These tests were performed
with a long time elapsed between the droplets reaching the surface. In real operating
conditions a continuous spray hitting the surface will sustain the cooling effects rather
than letting the surface heat up in between. The resulting temperature drop on a
surface when impinged by the spray can be seen in the study from Strots et al
[15]. The temperature on the wall dropped about 20 ˚C when dosing started and
stayed at a fairly constant level as long as the dosing was active.
2.8.3 Geometry dependence of formation and decomposition
The geometry of the exhaust system around the place where the injector is positioned
has to be optimized to decrease the risk of deposit formations. It is advised to place
the injector in a way that avoids spray impingement on the walls. As far as possible it
is suggested that the spray should be sprayed into the gas stream so that the droplets
can follow the gas flow easily. This can be done by mounting the injector in an S-
shaped pipe where the spray is injected into a straight pipe. [16].
An important aspect when designing the piping around the injector is how much the
exhaust gases will recirculate back into the mounting boss of the injector. An area
with high recirculation is a low pressure zone where the temperature quickly drops
which increases the risk of formation of urea deposits in that area. Computational
fluid dynamics can be used as a help to avoid recirculation where the behavior of the
gas flow can be calculated and visualized.
The distribution of ammonia on a cross-section of the SCR catalyst should be as even
as possible to utilize as much of the catalysts capacity as possible. Therefore it might
be of interest to use a mixer to help mixing urea with exhaust gases. A mixer is a
device that is mounted in the exhaust system to make the flow turbulent so that the
vortices in the turbulent flow mix the gas and urea better. The mixer can in some
cases be used to break up the urea spray into smaller droplets by letting the AdBlue
spray hit the mixer [16]. Instead of using a mixer the spray could be directed towards
a substrate, which is then acting as a mixer. The surface temperature of the mixer will
experience the same cooling effects explained in Section 2.8.2. when there is

CHALMERS, Applied Mechanics, Master’s Thesis 2014:30
10
impingement on a hot surface, introducing a mixer can increase the risk of deposit
formation in the system.
2.9 Heat transfer
By transferring thermal energy from the exhaust gasses to the injected AdBlue,
evaporation of the water and decomposition of urea is made possible. Increasing the
liquid dispersion over the substrate enhances the ability to transfer sufficient amount
of heat to the liquid from the gas. The energy needed to decompose a certain amount
of fluid is determining the amount that can be injected in the system.
2.9.1 Conduction
Conductive heat transfer describes energy transfer through motion and interaction
between molecules in a substance. The energy is transferred from more energetic
particles to less energetic neighboring ones, these atomic particles which transfer
energy could be atoms, molecules, electrons etc. Conduction of heat can occur in
solids, gas and liquids with differences in how the energy is transferred within the
state of the material. Thermal conductivity is material specific, depending on the
properties of the material.
Heat transfer per unit area through conduction is proportional to the temperature
gradient. The proportionality constant depending on material properties is the material
thermal conductivity denoted k in equation (2.17) is used to define the equation for
different materials, as seen in equation (2.17) [17].
�̇�𝒄𝒐𝒏𝒅 = −𝒌𝑨𝒅𝑻
𝒅𝒙 ( 2.17 )
2.9.2 Convection
Convection of heat is a combination of conduction and fluid motion. Motion of one
fluid past another fluid or surface with a thermal gradient will initialize an energy
transfer.
Convection is a complicated phenomenon to describe due to the combined effects of
conduction and fluid motion. When a fluid is flowing past a surface or another fluid of
different temperature the heat is conducted through the boundary layer by random
motion of gas molecules near the surface of the medium being flowed past due to the
thermal boundary layer build up near the surface. The heat is then transported towards
or against the boundary layer [17].
When a fluid is forced to flow over a surface by an external device it is called forced
convection. When a phase change occurs the heat transfer taking place is also
considered convection such as vapor bubbles rising or condensation droplets falling.
The rate of convection heat transfer is proportional to the temperature difference and
could be expressed with Newton’s law of cooling as in equation (2.18). Where h is the
system dependent heat transfer coefficient [17].

CHALMERS, Applied Mechanics, Master’s Thesis 2014:
11
�̇�𝒄𝒐𝒏𝒗 = 𝒉𝑨𝒔(𝑻𝒔 − 𝑻) ( 2.18 )
2.9.3 Radiation
Whenever there is a temperature above the absolute zero, matter will transfer heat by
emitting energy in forms of electromagnetic waves or photons. Heat from radiation
can be emitted without any media transferring the energy and may therefore be
transferred in vacuum as well.
Heat transfer by radiation is proportional to the fourth power of the Stefan Boltzman
constant and the equation of heat flux is then computed as in equation (2.19), 𝜎 is the
Stefan Boltzman constant, 𝜀 is a non-dimensional coefficient of thermal emissivity
ranging from 0 < 𝜀 < 1, 𝑇𝑠 is the temperature of the surface and 𝑇∞ is the
temperature of the surroundings [17].
�̇�𝒓𝒂𝒅 = 𝜺𝝈(𝑻𝒔𝟒 − 𝑻∞
𝟒 ) (2.19 )

CHALMERS, Applied Mechanics, Master’s Thesis 2014:30
12
3 Method
In this chapter the experimental methodology is described including setup and
measurement equipment. Theoretical calculations for heat transfer and urea
decomposition is also presented.
3.1 System set-up
The system used in the experiments utilized back-ward dosing, meaning that AdBlue
is injected towards the exhaust flow and onto a substrate surface. The injector is
positioned so that the injected liquid is spread over as big area of the substrate as
possible. After the wetted substrate a second substrate is positioned. This substrate
was used to create the correct backpressure in the system. After the two substrates a
production muffler was placed also with the intention to create a correct backpressure.
3.1.1 AdBlue injectors and delivering system
During the tests two different injectors were used with the same injection pressure.
The difference between the two injectors was the spray pattern, both regarding
number of holes and the spray angle. The first one that was used had 3-hole and a
spray angle of 16˚. The spray angle is defined as the angle between the outermost
visible edges of the spray if seen from the side, shown in Figure 3.1. The second
injector that was used had 6-hole and had a spray angle of 53˚. To be able to compare
the real value of the area on the substrate where the spray hit to the area seen in the
CAD model the number of wetted cells by the spray were calculated by visual
inspection.
Figure 3.1 Schematic view of spray angle from the injector
Both injectors used a fixed injection frequency and to control the injected amount, the
opening time of each pulse could be altered by the control algorithm. Since the

CHALMERS, Applied Mechanics, Master’s Thesis 2014:
13
minimum opening time of the injectors gave too high dosing amount when requesting
low dosing. This was compensated by keeping the injector closed for a longer period
of time in between the pulses. This strategy makes the integral of injected AdBlue
over time correct but the instantaneous amount will be greater.
The supply pump pressurizes AdBlue liquid from the storage tank through plastic
lines to the injectors. The supply pump and the dosing control unit that was used were
the same for both injectors. The dosing control unit used the same software interface,
INCA PC, as the engine control unit.
3.1.2 Catalyst substrates
The substrate, which was sprayed upon, was coated with SCR type washcoat that may
catalyze the hydrolyze reactions of urea break down and thereby reduce the risk of
deposit formation.
The following downstream substrate was coated with inert washcoat to obtain a
representative backpressure, but did not contain any active components so no SCR
reaction could take place. The intention was to increase the measurement accuracy by
measuring the concentration of ammonia and isocyanic acid after this substrate since
the concentration is more uniform than before. For a more in-depth description of the
measurement of ammonia and isocyanic acid see Section 3.3 Measurement
equipment.
3.2 Engine test rig
All experiments were performed in an engine test rig at VCC and the same engine, a
Medium Power (MP) - VED4, were used for all tests. Two different engine test cells
were used, the first rig was Funktions Proving Dynamisk 1 (FPD1) where the engine
was run without the gearbox and the dynamometer was connected directly to the
crankshaft of the engine. The second rig was Transmissions Provning 5 (TP5) where
the engine was connected to a manual gearbox and one dynamometer where
connected to each output driveshaft from the differential. With the dynamometers it
was possible to control the engine speed and load to get the desired operating point in
the engine performance map. In TP5 the dynamometers measure the torque and speed
on the wheels. The torque and speed on the crankshaft were calculated with the gear
ratio and the known driveline losses. Before the tests were started on each engine a
complete part load mapping was performed to make sure that the engines where
functioning well and running according to specification.
The engine was controlled through engine control unit via an interface in the
computer software INCA where all engine parameters could be viewed and changed
in real time. INCA was also used to communicate with auxiliary measurement
equipment such as modules for thermocouples, pressure sensors and gas analysis
equipment. INCA worked as data logger so all the parameters that were monitored
during a test were also logged and saved for data analysis later.

CHALMERS, Applied Mechanics, Master’s Thesis 2014:30
14
3.3 Measurement equipment
In order to collect data during experimental testing a number of sensors was installed
to the system. The measuring devices are described in the following chapters
alongside with the function of them and how they were implemented into the setup.
3.3.1 Temperature Sensors
Temperature sensors were installed on several places in the system but the most
important ones where positioned on the surface of the substrate. By approximating
where the spray would hit and calculating the possible hit area from spray simulations
and injector positions it was possible to place thermocouples in the wetted area.
Temperature sensors which measured exhaust gas temperature in several places on the
system were installed in order to measure the temperature at the different load points
at different locations. A temperature sensor was also installed on the camera used for
filming in order to avoid overheating of the camera tip.
3.3.2 Gas measurement
Exhaust components were measured with an FTIR (Fourier transformation infrared
spectroscopy). The measurement probe was placed downstream the second substrate
in order to have sufficient mixing off the emission that was desired to measure in the
experiment. The FTIR was used to measure concentrations of NOx, NH3 and HNCO
in the exhaust gas. It is possible to calculate and compare the amount of produced
NH3 and HNCO from the injected urea compare it with the measured amount in order
to see if there are any losses in the system. The mass balance set-up for the system
was used to calculate if NH3 and HNCO concentrations were less than theoretically
injected.
In addition to the FTIR, a sensor to measure engine out NOx emissions was placed
before the substrate by doing so the needed amount of AdBlue for 1:1 conversion of
NOx could be calculated. This was done to compare the dosing used in the
experiments with the dosing that was likely to be used in the production dosing
strategy.
3.3.3 Optical measurement
In order to sample data about growth and gradients of deposit, an optical way of
measuring the formation was needed. In order to look into the exhaust system when
dosing an inspection glass was installed onto the back of the substrate-surface. The
glass was installed by constructing a stainless steel collet which was welded onto the
canning. For glass a fused quartz-glass was chosen which can withstand temperatures
up to 1720oC.
Fused quartz has a near zero thermal expansion coefficient of 0.55*10-6/ oC which
makes it very suitable for applications such as an engine where a lot of fast
temperature changes is made when going up and down in load and speed, the low
thermal expansion makes the fused silica resistant against cracking due to thermal
shock. The glass is not thermally expanding in the same way as the metal collet in
which it was fitted into does. The glass was fitted into the collet with at clamping

CHALMERS, Applied Mechanics, Master’s Thesis 2014:
15
mechanisms which enabled the collet to thermally expand without putting tension on
the glass.
The collet in which the glass was fitted into was made to fit flush with the original
canning inside of the substrate so that minimal effect was made on the original
performance of the system. With the glass installed, filming was made possible during
injection of AdBlue onto the substrate surface.
The substrate with the glass installed can be seen in Figure 3.2 is circular and has a
diameter of55 mm
Figure 3.2 Inspection glass on the substrate side
The camera used for filming the injection of AdBlue into the system was a fiber optic
camera from which some fibers was used for illumination and others for filming. The
camera tip had to be cooled when running at high load and rpm because of the
accumulation of heat. The camera was cooled with compressed air which was blown
onto the camera tip in order to cool it during longer runs at medium and high point.
By installing a temperature sensor adjacent to the camera, the temperature was
monitored from the control room and made sure not to rise above the specifications
for the camera.
The need for good illumination was crucial when filming longer events. Due to delays
in the manufacturing process and limitations in testing time a second method to
provide light on the filmed surface was not possible to manufacture and assemble to
the system.
3.3.4 Pressure sensors
Pressure sensors were installed before the inlet to the substrate and after it in order to
measure the pressure difference over the catalyst, the sensors used were CAN-BUS-

CHALMERS, Applied Mechanics, Master’s Thesis 2014:30
16
compatible sensors. The pressure difference between the sensors was then sampled
during all the experiments in order to find out if the build-up of deposits
eventuallywould increase the pressure drop over the catalyst and therefore give a
correlation between the pressure and deposit formation.
3.4 Energy calculations
The ability to transfer energy from the exhaust gas to the injected fluid is crucial in
order to have a functional NOx reduction system. Knowing how large the area is
which the spray is covering, temperature of the flow and the mass flow of exhaust gas
determines how much AdBlue that is possible to inject for different engine loads. A
script for calculating the possible amount of injected AdBlue was developed using
Matlab.
3.4.1 Thermal conductivity calculations
Thermal conductivity was calculated using Prandtl number correlation experimentally
derived, also using dynamic viscosity calculated with Sutherland formula. The Prandtl
number is a dimensionless number which, describes the ratio between kinematic
viscosity and thermal diffusivity. Prandtl number was calculated with an
experimentally derived equation.
Dynamic viscosity with Sutherland’s formula is calculated as in equation (3.1) with Ts
as the Sutherland-constant, 𝜂0 is the dynamic viscosity at a reference temperature of
25oC and 𝑇𝑒𝑥ℎis the exhaust gas temperature
𝜼 = 𝜼𝟎 (𝑻𝟎+𝑻𝒔
𝑻𝒆𝒙𝒉+𝑻𝒔∗ (
𝑻𝒆𝒙𝒉
𝟐𝟕𝟑)
𝟐
𝟑) ( 3.1 )
Specific heat is calculated with an experimentally derived polynom which together
with dynamic viscosity and Prandtl number is used to calculate thermal conductivity
as seen in equation (3.3).
𝒌 =𝜼∗𝑪𝒑
𝑷𝒓 ( 3.2 )

CHALMERS, Applied Mechanics, Master’s Thesis 2014:
17
Channel size of the substrate is known as well as the mass flow over the catalyst this
enables us to first calculate the density of the exhaust gases at different temperatures
using the ideal gas law. Using this channel speed is calculated using equation (3.5)
where �̇�𝑒𝑥ℎ denotes the mass flow of exhaust gasses, 𝜌 is the density of the
gasses, 𝑛𝑟𝑐𝑒𝑙𝑙𝑠 is the number of cells in the substrate and 𝐴𝑜𝑓𝑎is the open frontal area
of the channels. This meaning the area available for exhaust mass flow is 𝐴𝑜𝑓𝑎.
𝒗𝒄 =
�̇�𝒆𝒙𝒉𝒏𝒓𝒄𝒆𝒍𝒍𝒔
(𝝆∗𝑨𝒐𝒇𝒂) ( 3.3 )
Reynolds number is calculated for laminar channel flow as seen in equation (3.6)
where dh is the hydraulic diameter of the channels.
𝑹𝒆 =𝝆∗𝒗𝒄∗𝒅𝒉
𝜼 ( 3.4 )
An experimentally derived Graetz number is used for determining the Nusselt number
correlation for the specific substrate used. Graetz number is a dimensionless number,
which characterizes laminar flow in a duct and provides a measurement on the flow
thermal development.
𝑮𝒛 =𝒅𝑯
𝑳∗ 𝑹𝒆 ∗ 𝑷𝒓 ( 3.5)
Using the experimentally derived Nusselt number the heat transfer coefficient can be
calculated with equation (3.7), where d is the depth of spray penetration.
𝒉 =𝒌
𝒅∗ 𝑵𝒖 ( 3.6 )
Using these equations, the energy need for heating up the AdBlue to a specified
temperature when dispersed over an area can be calculated as in equation (3.8).
Geometric surface area GSA is a measurement which describes the surface per liter of
catalyst combined with the penetration depth of the injected AdBlue.
�̇�𝒆𝒙𝒉 = 𝒉 ∗ 𝑨𝒉𝒊𝒕 𝒂𝒓𝒆𝒂 ∗ 𝒅 ∗ 𝑮𝑺𝑨 ∗ (𝑻𝒆𝒙𝒉 − 𝑻𝑨𝒅𝑩𝒍𝒖𝒆) ( 3.7 )
Total amount of dosing is then calculated with equation (3.9), where hwater and hurea is
the evaporation enthalpy of water and thermolysis temperature of urea, fwater and furea
is the fraction of the species.

CHALMERS, Applied Mechanics, Master’s Thesis 2014:30
18
�̇�𝑨𝒅𝑩𝒍𝒖𝒆 =�̇�𝒆𝒙𝒉
(𝒉𝒘𝒂𝒕𝒆𝒓∗𝒇𝒘𝒂𝒕𝒆𝒓+𝒉𝒖𝒓𝒆𝒂∗𝒇𝒖𝒓𝒆𝒂) ( 3.8 )
The results from the heat transfer equations are possible mass flow of AdBlue which
could be injected into the system. Provided that the area which the spray hits is large
enough, and that the energy provided from the exhaust gasses is high enough to
decompose the injected AdBlue. A crucial input to the calculations is the area
estimation of where the spray hits, for a more detailed description of this see Results
section and Discussion
3.5 Testing
A test plan was developed at the early stages in the project order to have a baseline for
experiments throughout the project period. At first the experiments was planned out to
three different sessions with the intention of trying out three different injectors and
compare the performance of them. This section will describe how the operating points
where chosen, how design of experiment was used in some sense to conduct non
biased evaluation and how it was executed.
3.5.1 Operating points
The studied engine operation points were selected with consideration to customer
usage, i.e. representing frequent load/speed lifetime duration to typical operating
conditions, and simultaneously a broad span in exhaust mass-flow and temperature.
Studies being made on breakdown and formation of deposit where used as a start
when choosing from the frequent operating points of the engine. The reason for doing
this was that the data from the testing would be representative for actual operation of
the engine and the data sampled could be used for further investigations within the
subject.
The operating points can be seen in Table 3.1, the points will from now on be referred
to as low, medium and high point.
Table 3.1: Operating points for testing
Low Medium High
Exhaust temp [°C] 228 340 455
Mass flow [kg/h] 53 162 306
Load [Nm] 57 150 300
Speed [rpm] 1376 2000 2300
An alternative testing point was developed when filming deposit formation running on
the low and medium point due to that in the original engine calibration there is a
significant amount of soot emissions at lower load and speeds. The reason for this was
CHALMERS, Applied Mechanics, Master’s Thesis 2014:
19
that EGR is used to lower the combustion temperatures and the amount of fresh air
charge therefore lowering the engine out emissions of NOx.
The higher amount of soot in the emissions made the visibility through the glass
worse and disabled the possibility to film through the glass during an extended time
period. The solution to this was to alter the operating point by turning of the EGR and
tune the engine so that the same flow and temperature was achieved as in the Low
point.
3.5.2 Design of experiments
Deciding which parameters might have most significant influence on the formation of
deposits and which ones to vary in the experiments was evaluated using design of
experiments as a starting point where the parameters which was believed to influence
the formation was evaluated by studying previous research done within the area [5].
First draft of a DOE for testing was made with a six factor trial where the factors were
exhaust temp, exhaust flow, injected AdBlue, time, ambient temperature and AdBlue
temperature with three levels; low, medium and high.
The first setup of the DOE was however revised after initial testing and further
investigations of which factors would be possible to change within the desired levels
of the DOE setup. From calculations and testing of the actual system, some of the
factors were ruled out due to them not changing the response when being altered or
because the possibility to change the factor enough for making a difference both in the
actual system and in testing response was not significant.
From this a new DOE was designed with a three factor trial instead of the original six
factors. The new factors evaluated were; exhaust gas energy, AdBlue injected and
time with three levels, low, medium and high. Exhaust temperature and exhaust mass
flow proved to be difficult to alter significantly when conducting the experiments. At
first this was done with altering fuel injection timing and percentage of EGR. By
changing injection timing the amount of residual fuel burnt outside the cylinder or late
in the cycle did not produce the wanted temperature change. Altering the EGR
percentage managed to change the mass flow since exhaust gas was not recirculated to
the cylinders and therefore increased the mass flow over the substrate.
The DOE was used for setting up the initial test plan with a fractional factorial test
plan where the dependency of temperature and mass flow was to be evaluated. After
initial testing and development of calculations a de-coupling of mass flow and
temperature was not possible when conducting the experiments
3.5.3 Test procedure
All tests were performed in the same way in order to have comparable results between
the tests. The test started with running the engine without any dosing active to get it
up to working temperature. When working temperature of 90˚C in the cooling water
was reached and the exhaust temperature had stabilized the dosing was started.
Around 40 seconds before the dosing started the data recorder was set to sample in
order to capture the initial changes for the dosing.
After the experiments were finished, dosing was switched off and the recorder was
kept on to capture the end of the run. In the first test session the engine was motored

CHALMERS, Applied Mechanics, Master’s Thesis 2014:30
20
with no combustion to cool down the system faster. That was not done in the second
test session since the energy in the flow during motoring could cause deposits to
decompose before the system was inspected. In the second session the engine was
stopped just after the dosing was stopped and then the system was cooled down by
itself.
3.5.4 First session
Testing was started up in Volvo Car Corporations engine testing facilities in a rig
named FPD1. The beginning of testing was spent on learning the system and setting
up the equipment needed for data acquisition during testing. The testing in FPD1 was
done using the 3-hole injector previously mentioned. During testing in FPD1 there
was no glass installed due to delays in manufacturing. In the initial testing phase there
was no FTIR installed and time was spent developing the experimental plan. The plan
was not completely done prior to beginning experiments since some of the factors and
responses were not sure to influence the results.
3.5.5 Second Session
Due to the need for Volvo Car Corporation to do other testing in FPD1, the second
session was moved to another testing facility called TP5. The second session of
testing was done using a 6-hole injector with the rest of the system mounted onto
another engine of the same type.
Installation of the inspection glass was done approximately after half of the available
time in TP5. With the glass installed, filming was made possible during injection of
AdBlue. In the end of the second session longer experiments were done in order to see
if there was deposits build up over a longer period of time and if this could be
monitored. The dosing was set to the limit on what the system was supposed to be
able to handle. After a trial run it was decided to decrease the amount to 85 % of what
was possible to decompose. This was done due to uncertainties in the area
approximations and calculations.
3.5.6 Decomposition
After running test where deposits had been detected, a method for making sure the
system was clean before conducting the next test was developed. From literature [13]
studies about deposit formation and decomposition it was concluded that above 400
oC all of the possible deposits formed should be decomposed with enough time, this
was confirmed with test results.
The method used was to increase load and rpm and conduct a diesel particle filter
(DPF) regeneration for 5 minutes. DPF regeneration adjusts engine calibration
parameters so that temperature is increased in the exhaust system and over the catalyst
stones.
The decomposition method was used so that repetitive trials were conducted every
time, meaning that the engine was started and heated to working temperature in the
same way before starting the regeneration.

CHALMERS, Applied Mechanics, Master’s Thesis 2014:
21
4 Results
In this section the result of testing and calculations will be presented.
4.1 Tests with Injector 1: 3-hole type
First session of experiments was conducted with the 3 hole injector in engine test cells
at VCC. The footprint of the injector can be seen in Figure 4.1 where the total wetted
area on the substrate was measured to be 1.1 cm2.
Figure 4.1 Footprint of spray on substrate surface
The amount of AdBlue that is possible to decompose depends on several parameters.
Combined they determine how much AdBlue that can be injected with the energy
content in the exhausts without initiating deposit formation. For the measured hit-area
of the 3-hole type injector the maximum decomposable amount of AdBlue was
calculated for each experiment with corresponding temperature and mass flow, see
equation (3.9).
4.1.1 Low energy point
The operating point defined to have the lowest available energy in the experiments
was conducted with an engine speed of 1376 rpm and produced torque of 57 Nm. This
resulted in an exhaust mass flow of 54 kg/h and exhaust temperature of 225˚C.
Calculated amount of AdBlue that could be decomposed with the energy in the system
was 1.97 mg/s, as seen in Table 4.1.

CHALMERS, Applied Mechanics, Master’s Thesis 2014:30
22
Table 4.1 Operating parameters for low point
Parameter Value
Engine speed [rpm] 1376 rpm
Engine torque [Nm] 57 Nm
Exhaust mass flow [kg/h] 54 kg/h
Exhaust temperature [˚C] 225˚C
Maximum decomposable amount of AdBlue [mg/s] 1.97 mg/s
Initial testing started with a dosing quantity of 1.1 mg/s which corresponds to a 𝑁𝐻3
𝑁𝑂𝑥
ratio of 0.5. No deposits could be seen after a run-time of 30 min. Dosing was then
increased in increments, first to a total of 5mg/s and later 15mg/s. Both of the
experiments with increased dosing did not result in any deposits after 30 min run-
time. Since no deposits were seen, the amount was again increased, at this time to 30
mg/s. After 30 min a small amount of deposits could be seen on the substrate surface.
The inspection was carried out after the engine had cooled down and not in real time.
As previously mentioned in Section 3.5.4, no glass was installed during these
experiments.
Complete decomposition of 30 mg/s injected AdBlue would have resulted in a
measured concentration of 655 ppm NH3 and HNCO. The combined concentration of
NH3 and HNCO was measured using FTIR during the experiments and the results can
be seen in Figure 4.2.
The total concentration of NH3 and HNCO stays fairly constant at 375 ppm when
dosing, when dosing stopped a peak of 550 ppm in concentrations could be seen. This
increase indicates that decomposition is taking place when the engine is motored to
cool it down. Compared to the calculated value there was a loss of 45 % in
concentration over the 30 min test.

CHALMERS, Applied Mechanics, Master’s Thesis 2014:
23
Figure 4.2 Total concentration of NH3 and HNCO at low point with 3-hole injector
When AdBlue is injected onto the system a drop in temperature is measured at the
substrate surface. Thermocouples were placed so that measurements where the spray
hit could be sampled, comparing it to where the spray did not hit. What could be seen
was a significant drop in temperature upon the surface where the spray hit as shown in
Figure 4.3. The blue line in the plot is representing the moving average of compared
to the raw data. When dosing is started the temperature drops from 225˚C to
approximately 80˚C and fluctuates with the injection of AdBlue. The temperature
that the surface experience when dosing is lower than the melting temperature of
urea, which can increase the risk of deposits. When the dosing is stopped the
temperature starts increasing until it reaches the temperature before dosing was
initialized. The sudden change of the temperature after 1000 seconds cannot be
explained at the time of writing.

CHALMERS, Applied Mechanics, Master’s Thesis 2014:30
24
Figure 4.3 Temperature drop on substrate surface at low point with 3-hole injector
The differential pressure over the substrate was measured in order to see any change
in pressure when deposits were formed. In Figure 4.4 the recorded differential
pressure can be seen and it is obvious that the measurement is not correct. The data
shows that the pressure after the substrate is higher than before and that is not the
reality. From looking at the raw data it has been concluded that the pressure sensor
mounted after the substrate was wrongly calibrated.
Figure 4.4 Differential pressure of the substrate at low point with 3-hole injector
After the test the injector was dismounted and an endoscope camera was used to take
pictures of the of the substrate surface. The picture, seen in Figure 4.5 in spite of the
poor quality displays small amount of deposits that has been formed at the substrate

CHALMERS, Applied Mechanics, Master’s Thesis 2014:
25
surface. The amount is not significant and during this experiment there was not
possible to see any larger formations of deposits where the spray had hit.
Figure 4.5 Deposits covering the cells on the substrate at low point with 3-hole injector
4.1.2 Medium energy point
The second point of interest was defined as the medium energy point. At this point
engine speed and load was set to be, 2000 rpm and 150 Nm. This resulted in an
exhaust mass flow of 162 kg/h and exhaust temperature of 332˚C.
With the calculated area that the spray actively hit at these conditions the amount of
AdBlue that is possible to decompose is 8.92 mg/s. The operation parameters can be
seen in Table 4.2
Table 4.2 Operation parameters for medium energy point
Parameter Value
Engine speed [rpm] 2000 rpm
Engine torque [Nm] 150 Nm
Exhaust mass flow [kg/h] 162 kg/h
Exhaust temperature [˚C] 332˚C
Maximum decomposable amount of AdBlue [mg/s] 8.92 mg/s
Deposits could be noticed after 30 minutes into the experiment while dosing 15 mg/s.
The injected amount exceeded the theoretical maximum and deposits were formed as
expected. At these conditions with dosing active, a theoretical concentration of NH3
and HNCO should be measured to 108 ppm. The actual concentration measured using

CHALMERS, Applied Mechanics, Master’s Thesis 2014:30
26
FTIR fluctuated during but had an consistent average around 90 ppm, as can be seen
in Figure 4.6. The fluctuations have a periodic appearance and it shows no tendency
to decay over time. The loss of mass over the test compared to the theoretical
concentration is 13.5%.
Figure 4.6 NH3 and HNCO concentration at medium point with 3-hole injector
The measured temperature on the substrate during dosing is decreasing and fluctuates
around 10-15˚C corresponding with the injection pulsation when dosing. The
temperature graph can be seen in Figure 4.7 there is a drop in mean value temperature
550 seconds into the experiment. This drop might be explained by deposits formed
during the experiment covers the tip of the thermocouple on the substrate making it
isolated from surrounding exhaust gas. Since no glass was installed it is not possible
to say for sure how the formation took place during that time.

CHALMERS, Applied Mechanics, Master’s Thesis 2014:
27
Figure 4.7 Surface temperature on substrate at medium point with 3-hole injector
The differential pressure measurement at this operating point did display a pressure
drop over the substrate. There is an increasing difference in pressure during the test
but since the amount of deposits was not substantial the increase in pressure was
deemed to other causes. The data can be seen in Figure 4.8 where the black line is the
raw data; the blue line is a moving average over time and the red line shows when
AdBlue dosing was active.
The average differential pressure increases over time with 0.07 kPa. Since the deposit
is not substantial which can be seen in Figure 4.9, it is not likely that the deposit
causes the increase in differential pressure over the test. Due to the characteristics of
the exhaust flow from the engine a pulsating pressure is read out due to the exhaust
valve opening and closing in the cylinder head.

CHALMERS, Applied Mechanics, Master’s Thesis 2014:30
28
Figure 4.8 Differential pressure over substrate at medium point with 3-hole injector
The deposits are formed where one of the spray beams hit the substrate. It covers the
cells as can be seen in Figure 4.9. The deposit continues to grow out from the
substrate putting layer to layer onto the initial sample which enables growth in the
flow direction to a thickness of approximately 1 mm. This amount of deposit is not
considered severe but it can grow to become a problem if the dosing continues over a
longer time period. Since there is not enough energy to decompose the injected
amount of urea, the deposits will create a isolating layer between the liquid and the
substrate which might increase deposit formation.
Figure 4.9 Deposit on the substrate surface at medium point with 3-hole injector
4.1.3 High energy point
This operating point an engine speed of 2300 rpm and a torque of 300 Nm was
chosen, giving a mass flow of 306 kg/h and a temperature of 465˚C. With the
available energy calculated, the system could decompose 23.78 mg/s of AdBlue. The
experiment was conducted for 30 minutes while injecting 15 mg/s. After the test there
was no deposit present. Operation parameters can be seen in Table 4.3.

CHALMERS, Applied Mechanics, Master’s Thesis 2014:
29
Table 4.3 Operation parameters for high energy point
Parameter Value
Engine speed [rpm] 2300 rpm
Engine torque [Nm] 300 Nm
Exhaust mass flow [kg/h] 306 kg/h
Exhaust temperature [˚C] 465˚C
Maximum decomposable amount of AdBlue [mg/s] 23.78mg/s
4.2 Tests with Injector 2: 6-hole type
The second test session was conducted using injector number 2, which is a 6-hole type
injector. The injector featured a spray angle of 53˚, compared to 16˚ of the 3-hole
injector; see Section 3.1.1 for more data on the injectors.
Due to the injector spray angle and position of the injector beams, the footprint on the
substrate looked very different from the 3-hole injector. Four of the beams were
hitting the top of the substrate but only two of them were hitting the substrate fully as
can be seen highlighted in Figure 4.10.
Figure 4.10 Spray foot-print for 6 holes injector
The red rings indicate the footprint from the 6-hole injector, the three spots in the
middle at the right hand side marks where the previous 3-hole injector beams hit. The
two beams on the top were only hitting the substrate partially. The left one of the two
top beams did not hit the substrate. The last two beams were hitting the mounting boss
for the injector and did not reach the substrate surface. This lead to a calculated area
of 3.27 cm2 for the six hole injector with 2.5 of the six beams hitting the substrate
surface.
4.2.1 Low energy point
For this test session another engine was used, still a VED4 MP, which made for
some differences in load and speed mapping in order to get the same testing
conditions. The same engine speed and torque was used for the experiments, which

CHALMERS, Applied Mechanics, Master’s Thesis 2014:30
30
for the low point meant a speed of 1376 rpm and a load of 57 Nm. The mass flow
and temperature differed slightly from the first engine. This engine provided
slightly different values, with a mass flow of 50 kg/s and temperature of240˚C.
With the hit area of 3.27 cm2
(as compared to a hit area of 1.1 cm3 for the 3-hole
injector) the available energy made for a maximum AdBlue dosing of 6.91 mg/s.
Operating parameters can be seen in Table 4.4.
Table 4.4 Operating parameters
Parameter Value
Engine speed [rpm] 1376 rpm
Engine torque [Nm] 57 Nm
Exhaust mass flow [kg/h] 50 kg/h
Exhaust temperature [˚C] 240˚C
Maximum decomposable amount of AdBlue [mg/s] 6.91 mg/s
Experiments started with dosing 30 mg/s for 30 min with no deposits seen on the
substrate, the run time was increased to 60 min, which resulted in deposits on
substrate. Dosing was decreased to 15 mg/s while running for 60 min, which resulted
in deposits. During the 15 mg/s test the filming worked so it was possible to follow
the formation live.
The data presented in this section of the report will be from the 60 min test with 30
mg/s dosing since that test showed the most deposits. With 30 mg/s dosing the
theoretical concentration of NH3 and HNCO in the exhaust gases are 722 ppm.
Figure 4.11 shows the recorded concentration measurement where the black line is the
raw data, blue line is the moving average over time and the red when dosing was
active.

CHALMERS, Applied Mechanics, Master’s Thesis 2014:
31
Figure 4.11 Total concentration of NH3 and HNCO at low point with 6-hole injector
A seen the average concentration stays around 500 ppm but is increasing slightly
during the test. The difference to the theoretical concentration was 29.5%. It is not
possible to see any trends of decreasing concentration as the theory suggests when
deposits are formed. During these tests the engine was stopped directly after dosing
was shut off to make sure that there was no hot air flow that could decompose the
deposits before they were inspected.
The surface temperature where one of the spray beams hit decreases constantly during
the experiment and the average temperature drop with 10˚C from start to stop of
dosing; see Figure 4.12. This indicates that the deposit gradually isolates the
thermocouple during the test as the deposit builds up in size and thickness. The initial
drop in temperature when the dosing is started is around 50˚ C and the temperature is
above the melting and decomposing temperature for urea. At the end of the test the
temperature did not recover to the starting temperature due to that the engine was
switched of just after the dosing was stopped.

CHALMERS, Applied Mechanics, Master’s Thesis 2014:30
32
Figure 4.12 Temperature drop on substrate surface at low point with 6-hole injector
Examining the differential pressure data, in Figure 4.13, it can be seen that the moving
average is close to constant over the whole test with just a small increase, of less than
0.1 kPa. The increase has a linear appearance and no sudden change can be seen. It
was not possible to say if this increase was due to the deposit formation.
Figure 4.13 Differential pressure of the substrate at low point with 6-hole injector

CHALMERS, Applied Mechanics, Master’s Thesis 2014:
33
When inspecting the substrate after the test it could be seen that both the spots on the
substrate were covered with deposits as can be seen in Figure 4.14. Deposits were also
formed on the spot where the beam partially hit the substrate, both on the substrate
surface and the sheet metal cylinder around it. The thickness of the deposits was
approximately 1 mm.
Figure 4.14 Deposits on substrate on low point with 6-hole injector
4.2.2 Medium energy point
The running condition for the medium point was set to 2000 rpm and 150 Nm which
rendered a mass flow of 162 kg/h and temperature of 342˚C. With the energy content
available in the exhaust, possible dosing was calculated to 28.18 mg/s.
A dosing of 15 mg/s and a run time of 30 min was first tested, this resulted in no
deposits. The dosing was then increased to 30 mg/s with the same run time, which
gave deposits on substrate. The run time was then increased further to 60 min to see
how the deposits growth was developed. Operations parameters can be seen in Table
4.5.
Table 4.5 Operation parameters
Parameter Value
Engine speed [rpm] 2000 rpm
Engine torque [Nm] 150 Nm
Exhaust mass flow [kg/h] 162 kg/h
Exhaust temperature [˚C] 342˚C
Maximum decomposable amount of AdBlue [mg/s] 28.18 mg/s
The theoretical concentration of ammonia and isocyanic acid under these conditions is
216 ppm. Figure 4.15 displays the recorded concentration during the experiment.
There is no visible decreasing trend of the concentration and it is stable at around 185
ppm. Compared to the theoretical concentration there is a difference of 13.1% over
the experiment.

CHALMERS, Applied Mechanics, Master’s Thesis 2014:30
34
Figure 4.15 Total concentration of NH3 and HNCO at medium point with 6-hole injector
In Figure 4.16 there is a drop in temperature shown after 1500 seconds, at 2100 the
rate at which the temperature drops increases even further. Comparing this to pictures
taken at these time events it is clearly seen that deposit growth has begun to cover the
thermocouples which in the end triggers the significant drop of 50˚C.
Figure 4.16 Temperature drop on substrate surface at medium point with 6-hole injector
During the experiment the average differential pressure increases slightly but it is
similar to the increase that has been noticed previously. The data for this experiment
can be seen in Figure 4.17.

CHALMERS, Applied Mechanics, Master’s Thesis 2014:
35
Figure 4.17 Differential pressure of the substrate at medium point with 6-hole injector
To verify that the increase in differential pressure is not caused by deposits a 30 min
test was done without any dosing. The results from that comparison can be seen in
Figure 4.18. . The graph shows the moving average of both differential pressures, the
blue line is representing differential pressure when dosing is active, the black line
displays differential pressure when not dosing which acts as a reference experiment.
The red line is amount of AdBlue dosed into the system during the experiment. The
graph shows a small offset between the experiments with no dosing and the run with
30 mg/s dosing, but the offset is constant which leads to believe that there is difficult
to make any conclusions about deposit formation dependent on differential pressure
measurement.

CHALMERS, Applied Mechanics, Master’s Thesis 2014:30
36
Figure 4.18 Differential pressure comparison at medium point with 6-hole injector
Figure 4.19 is showing that the deposits do not cover an extensive amount of cells and
have a thickness of 1mm.
Figure 4.19 Deposits on substrate
4.2.3 High energy point
Experiments at high point were conducted with an engine speed of 2300 rpm and
torque of 300 Nm resulting in an exhaust mass flow of 334 kg/h and a temperature of
453˚C. The amount of AdBlue that can be decomposed with the available energy was
calculated to be 70.98 mg/s. The dosing was initially set to 73.5 mg/s with a run time
of 30 min however this did not render deposits, dosing was then increased to 80 mg/s
with the same run time. Deposits were not present when inspecting therefore, an
experiment running with dosing amount corresponding to 𝑁𝐻3
𝑁𝑂𝑥 ratio of 1 in this
operation point was conducted. Since this point is outside the area where EGR is used
the NOX output from the engine is high so the needed AdBlue amount was 255 mg/s.
The dosing was injected during 30 min, experiment was captured on film. Operation
parameters can be seen in in Table 4.6.

CHALMERS, Applied Mechanics, Master’s Thesis 2014:
37
Table 4.6 Operation parameters
Parameter Value
Engine speed [rpm] 2300 rpm
Engine torque [Nm] 300 Nm
Exhaust mass flow [kg/h] 334 kg/h
Exhaust temperature [˚C] 453˚C
Maximum decomposable amount of AdBlue [mg/s] 70.98 mg/s
Theoretical concentration of NH3 and HNCO when dosing 255 mg/s at the high point
is 893 ppm and the recorded concentration can be seen in Figure 4.20 For the first
1000 seconds the concentration stays constant at 850 ppm, after that a decrease of 50
ppm in concentration can be seen which renders a drop in total concentration of 7.4%
over the experiment. Deposits are seen on footage before the drop in concentration
could be detected with the FTIR.
Figure 4.20 Total concentration of NH3 and HNCO at high point with 6-hole injector
The temperature drop of 350˚C is the largest drop recorded during all tests, see Figure
4.21. As seen the fluctuating behavior decreases at around 800 seconds and
stabilizes at a temperature around 100 degrees which is not sufficient for urea
thermolysis.

CHALMERS, Applied Mechanics, Master’s Thesis 2014:30
38
Figure 4.21 Temperature drop on substrate surface at high point with 6-hole injector
The differential pressure can be seen in Figure 4.22 with no significant change of
pressure as the deposit build up on the substrate surface. The drop in floating average
at the end of the sampling period is due to the engine being shut of making the
calculation showing a larger value.
Figure 4.22 Differential pressure of the substrate at high point with 6-hole injector
The deposits formed during this test had a thickness of 7-8 mm and was shaped as
ring with a somewhat hollowed out center as seen in Figure 4.23 from filming of the
build-up it can be seen that the formation of the deposits is not a linear sequence but
rather exponential. Initial build-up takes longer time but continuous dosing after

CHALMERS, Applied Mechanics, Master’s Thesis 2014:
39
initiation shows that speed of growth increases over time, making deposits formation
at a higher rate.
Figure 4.23 Deposits on substrate on high point with 6-hole injector
4.3 Pulsating dosing strategy
Since the injector has a fixed opening frequency and a minimum opening time which
limits the amount of AdBlue that can be dosed,. When the amount of AdBlue dosing
requested is low the control algorithm for the injector will inject one bigger dose and
then keep the injector closed longer. This behavior can be seen on the temperature
where the spray hits, the temperature drops when the liquid hit the surface and starts
to recover until the next pulse is cooling it again. In Figure 4.24 the temperature is
shown for different amount of dosing, each line corresponds to one dosing quantity.
Figure 4.24 Pulsating dosing
It can be seen that the red line representing the temperature corresponding to 1.1 mg/s
has a 10 seconds interval between each injection while the blue 5 mg/s and green 15
mg/s have roughly 3 seconds between each injection. As expected the largest dosing
of 255 mg/s utilized the highest frequency as it has 0.3 seconds between the

CHALMERS, Applied Mechanics, Master’s Thesis 2014:30
40
injections. When there is no liquid hitting the surface there is enough time to
decompose both the liquid and deposits if they are formed, when dosing is close to
what the system can handle. This might increase the possibility for the system to
decompose slightly more than calculated and or at least prolong the time before
lasting deposits can be seen.
4.4 Initial temperature drop
The initial temperature drop on the surface when the liquid reaches the surface varies
depending on the temperature of the surface. When same amount of liquid was
injected into the system at different temperatures the drop onto the substrate was
lower at higher temperatures. This was confirmed by the data from experiments; in
in Figure 4.25 the average surface temperature for the first 150 seconds of one
experiment on each operation point is shown. The dosing in all three experiments
was 15 mg/s. At the low point the temperature drops with almost 90˚C but on the high
point the drop is only 6˚C and in between the drop at the middle point is 15˚C.
Figure 4.25 Surface temperature drop when dosing 15 mg/s at different operation points
If the starting temperature is kept constant and the amount of liquid reaching the
surface is altered the temperature drop will change, larger amount injected
corresponds to a bigger drop in temperature. This result can be seen in Figure 4.26
where the temperature during the first 500 seconds of test at the low point is shown.
The start of injection for 5 mg/s started 130 s later that the rest of the tests. The dosing
amount is varied from 1.1 mg/s to 30 mg/s and the difference in temperature drop is a
couple of degrees for the 1.1 mg/s and 140˚C for 30 mg/s.

CHALMERS, Applied Mechanics, Master’s Thesis 2014:
41
Figure 4.26 Surface temperature drop with different dosing on low point
4.5 Mass balance errors
NH3 and HNCO concentrations were sampled in order to calculate mass-balance
differences between measured and theoretical value. The results from testing showed
different behavior between the operating points.
In all of the measurements done with the FTIR there was a difference between the
theoretical value and sampled one. The data is presented for low, medium and high
point for cases both with and without deposits.
4.5.1 Low Point
The result from testing was divided into two categories; one where there were
deposits detected and one where there were not. The mean deviation from
theoretical value for those two categories along with the standard deviation of this
value can be seen Table 4.7.
Table 4.7 Concentration deviation on low point
Deposits No deposits
Mean value [%] 44.933 30.665
Standard deviation [%]
12.574 0.8305

CHALMERS, Applied Mechanics, Master’s Thesis 2014:30
42
4.5.2 Medium Point
Deviation from theoretical concentration values at medium point can be seen at in
Table 4.8.
Table 4.8 Concentration deviation on medium point
Deposits No deposits
Mean value [%] 11.888 21.745
Standard deviation [%]
1.555 2.8991
4.5.3 High Point
Deviation from theoretical concentration at high point can be seen in Table 4.9, there
is no standard deviation for the high point when seeing deposits due to insufficient
testing at this operating point, only one test was performed.
Table 4.9 Concentration deviation on high point
Deposits No deposits
Mean value [%] 7.4 26.1
Standard deviation [%]
0 2.7955
4.6 Deposit decomposition
Deposit decomposition was studied after testing when deposits had been formed
during the experiments. The decomposition was done using the method described in
Section 3.5 Testing. The decomposition of deposits was studied for two cases after
running on the low point with two different dosing amounts and running times. The
two cases can be seen in Table 4.10
Table 4.10 Operation parameter for deposit decomposition
Running Time Dosing
Low Point 180 min 7 mg/s
Low Point 60 min 15 mg/s

CHALMERS, Applied Mechanics, Master’s Thesis 2014:
43
The amount of deposits collected can be seen in Figure 4.27 for 60 and 180 min
respectively, the amount was during visual inspection deemed to be approximately the
same for both cases. The sequence of decomposition was filmed with the fiber-optic
camera and is available for VCC.
Figure 4.27 Deposit amount before decomposition
4.6.1 60 min 7 mg/s
Decomposition sequence was initialized by starting the warm-up of the engine at 2300
rpm and 300 Nm. In Figure 4.28 28 the sequence of decomposition is shown with a
spacing of one minute, going from start to completely disposed. The exception being
the last picture in the sequence where there is spacing with 2.5 minutes in between
since decomposition of the very last traces is slower.
This is showing start of engine warm-up sequence where particle filter regeneration
started after approximately 4 minutes. Following the time sequence in Figure 4.28 it
can be seen that almost all of the deposits are decomposed after 4 minutes. After 7.5
minutes all is gone after just having to run 2.5 minutes of regeneration. The test was
performed with no dosing active, going a step further would have been with dosing
still active. The focus however was on finding a method for decomposition of deposits
and to find the required time for doing so.

CHALMERS, Applied Mechanics, Master’s Thesis 2014:30
44
Figure 4.28 Deposit decomposition
4.6.2 180 min 15 mg/s
The method utilized for the decomposition was the same as for previous case and the
evolution is displayed with one minute intervals except for the last picture in the
sequence which has a two minute gap. Most of the decomposition is done when the
regeneration starts at the four minute mark. The sequence of decomposition can be
seen in Figure 4.29
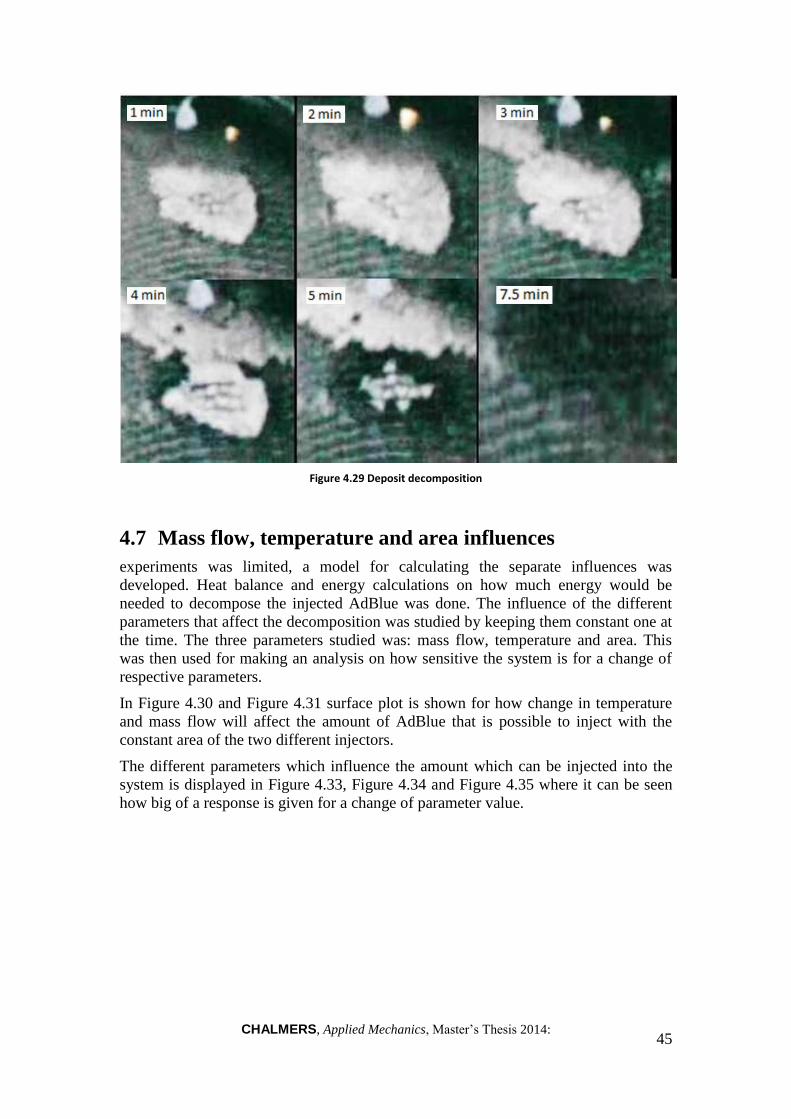
CHALMERS, Applied Mechanics, Master’s Thesis 2014:
45
Figure 4.29 Deposit decomposition
4.7 Mass flow, temperature and area influences
experiments was limited, a model for calculating the separate influences was
developed. Heat balance and energy calculations on how much energy would be
needed to decompose the injected AdBlue was done. The influence of the different
parameters that affect the decomposition was studied by keeping them constant one at
the time. The three parameters studied was: mass flow, temperature and area. This
was then used for making an analysis on how sensitive the system is for a change of
respective parameters.
In Figure 4.30 and Figure 4.31 surface plot is shown for how change in temperature
and mass flow will affect the amount of AdBlue that is possible to inject with the
constant area of the two different injectors.
The different parameters which influence the amount which can be injected into the
system is displayed in Figure 4.33, Figure 4.34 and Figure 4.35 where it can be seen
how big of a response is given for a change of parameter value.

CHALMERS, Applied Mechanics, Master’s Thesis 2014:30
46
Figure 4.30 Possible amount to decompose with the available energy for three hole injector
Figure 4.31 Possible amount to decompose with the available energy for six hole injector

CHALMERS, Applied Mechanics, Master’s Thesis 2014:
47
4.7.1 Mass flow influence
In a plot for how change in exhaust mass flow affect the possible amount
to inject when temperature and hit area is kept constant. A temperature of 340 ℃ was kept constant with a hit-area of 1.1 cm2. In Figure 4.32 the mass flow of the operating points previously mention in the study are displayed as vertical lines.
Figure 4.32 Mass flow dependency with injected amount
4.7.2 Temperature influence
In Figure 4.33 temperature influence on dosing is displayed when mass flow and hit
area is kept constant. Mass flow was kept constant at 155 kg/h and the area was kept
constant at 1.1 cm2. In Figure 4.33 the temperature of the operating points is displayed as vertical lines.

CHALMERS, Applied Mechanics, Master’s Thesis 2014:30
48
Figure 4.33 Temperature influence on injected amount
4.7.3 Area influence
Figure 4.34 displays how change in area affects the dosing amount for constant
temperature and mass flow. Temperature and mass flow was kept constant at 340 ℃
and 155 kg/h respectively. Figure 4.34 the lines is representing the different hit-areas
for the 3-hole and 6-hole injector.

CHALMERS, Applied Mechanics, Master’s Thesis 2014:
49
Figure 4.34 Area influence on injected amount
4.8 Filming
Filming onto the substrate with a fiber optic camera worked well for some of the
operating points and for shorter test runs. The reason for this being that the injector
mounting design was not optimized for the injector utilized in the second testing
session. This was when the inspection glass had been installed.
For filming at low points the EGR valve had to be shut off completely and an
operating point with the same exhaust flow and temperature as when having the valve
open was calibrated. By doing this the view from the glass became less obstructed by
soot during the longer experiments.
When running for longer time with the 6-hole injector a problem with the vision
became evident, two of the spray jets were hitting the injector boss closest to the wall
of the catalyst canning. This meant that AdBlue eventually started to run down the
inside of the canning reaching the glass where it got stuck onto the glass, obstructing
the view Figure 4.35 displays the view from early in the test and later after some time
when the accumulated AdBlue had disrupted the view, disabling the possibility to get
clear footage of injection sequence.

CHALMERS, Applied Mechanics, Master’s Thesis 2014:30
50
Figure 4.35 View from camera in the beginning of sampling and after some time
CHALMERS, Applied Mechanics, Master’s Thesis 2014:
51
5 Discussion
5.1 Mass Balance and concentrations
The initial plan with measuring concentrations of primary NH3 and HNCO was that a
mass balance could be calculated over the catalyst giving a measurement of how
much of the injected AdBlue was lost in the system. If there was a drop in
concentration it could mean that deposits were formed and that the difference in
concentrations between theoretical and the measured value was seen because of this.
In all experiments an offset between the theoretical value and the measured one was
seen even when there were no deposits detected during the test or when inspecting
afterwards. The expected drop in concentration over time was not seen when deposits
was formed and the response. One trend was that the difference between the
theoretical and the measured value was lower when deposits were formed but kept a
constant offset. This was seen for all points except the low point where the difference
from theoretical concentration was higher when deposits were formed.
A reason for this could be that the NH3 that is formed when decomposing the urea is
oxidizing on the substrate surface which would mean that the offset seen is due to
NH3 and HNCO being decomposed into other species and not forming deposits.
Another explanation could be that the NH3 is reacting with NOX and is reduced that
way but the measured concentrations of NOX in and out showed that there was little
reduction of NOX from engine out, to tailpipe measurement. For the low point, if
NH3 is not oxidizing due to the low temperature. The drop in concentration could be
explained by more of the urea tied up in deposits.
The exception from the constant offset in concentration was when dosing alpha value
of one at high point when a drop in concentration could be seen after 1000 seconds,
see Figure 4.20. The drop in concentration that is seen does not correspond to when
deposits are formed. On the footage from this experiment deposits is seen before the
drop occurs which indicates that the FTIR could not detect changes that indicated start
of deposit formation.
Difference in theoretical concentration and the measured one was less when detecting
deposits at medium and high point. An explanation for this might be that when
deposits are built-up there is less risk of NH3 oxidation due to the lower surface
temperature on the deposit surface itself. The loss seen might then better correspond
to the loss in concentration from the theoretical value. At the low point however the
temperature relationship is as expected, the concentration drop is higher when
deposits are present. The temperature in the system is maybe low enough avoid an
eventual oxidization of NH3.
5.2 Energy and heat balance calculations
Equations for heat balance were validated with experiments. Possible amount to inject
with the specific hit area, temperature and mass flow was evaluated by seeing if the
equations matched tested values.
three hours and with 85% of maximal possible dosing showed that there still was
deposits on the low point and the medium point. The system is very sensitive for a
change in area and this could be a possible explanation for having deposits when
conducting these experiments. The hit area might be smaller and therefore the ability

CHALMERS, Applied Mechanics, Master’s Thesis 2014:30
52
of decomposing urea is less. The dosing amount of 85% was chosen since the
calculations and measurements for hit-area were difficult to measure accurately. The
injector boss was not positioned in the exact way as designed after manufacturing of
the system, which made the calculations of spray hit area inaccurate. Instead visual
inspection of the wetted spray area was utilized to approximate the hit-area. In the
calculations a uniform concentration was assumed where the spray hit. This might be
a source for error since hit area and concentration probably changes with mass flow
due to higher gas momentum compared to spray droplet momentum.
The experiments when running three hours and dosing the possible decomposable
amount according to calculations still initialized deposit build-up at the low point. The
reason for this might be that there are some parameters which provide an inaccurate
input to the calculations, the area is typically one of those. Since a small change in hit
area has a large response on possible injection amount, a small error will drastically
change what is possible to inject.
Accurate input on hit-area for calculations is needed in order to make a better
prediction on deposit formation. In order to provide this an accurate way of measuring
the area by either spray simulations or testing could be done. A possible way of
testing hit-area could be that an injector is positioned according to the same
parameters as on the real system. Then sprayed upon a surface which absorbs the
liquid and afterwards measure the wetted area. To capture the influence of different
mass flows, the experiment could be set-up in a tube with an added flow for
simulating the exhaust flow of the engine.
A good estimation of wetted area this would provide a better input for the calculations
and prediction of deposit formation. Other parameters that are material specific were
not evaluated but might improve the accuracy of the predictions.
5.3 Deposits formation and decomposition
During the first test session the engine was motored by the dynamometer after the
experiments was completed in order to cool the system down quicker. By doing this
the engine was pumping air through the system without any combustion. Even if the
temperature of the gasses were lowered, it will probably have been enough energy in
the gasses to decompose some of the deposits that might have been built up during the
experiment. When the glass was not installed it was not possible to see if there were
any deposits formed during the run that decomposed when motoring. This can be one
explanation to why it was possible to inject 30 mg/s at the low point with the 3 holes
injector without seeing any deposits.
The laboratory studies that were performed on decomposition of urea showed that the
decomposition of deposits was finished at around 400˚C. At the high point the
temperature was 453˚C when injecting urea, still it was quite a sustainable amount of
deposits formed the operating point. This indicates that even if the temperature of the
gas is high, the cooling effect from the liquid hitting the surface can be enough to start
deposit formation. As an example, in Figure 4.21, the recorded temperature drop
during test on the high point with 255 mg/s dosing was around 350˚C, lowering the
surface temperature to 100˚C which leads to an increased risk of deposit formation.

CHALMERS, Applied Mechanics, Master’s Thesis 2014:
53
5.4 Temperature drop
Results recoded from experiments shows a significant drop in surface temperature
when AdBlue is injected onto the surface. The total energy consumption for
performing hydrolysis and thermolysis of urea and water results in a temperature drop
of the surroundings due to the need of energy to perform these operations. This could
be seen in the experiments where a drop in temperature was measured when injecting
into the system. When deposits began to cover the tip of the thermocouple an isolating
effect could be studied where the lowered temperature suggested that once deposits
had started to grow the formation accelerated. The samples from the thermocouples
can be used as measurement of deposit growth, but it is restricted to measure the
propagation over a certain area. From that data a map could be created where it is
possible to track when the temperature drops, to see how the deposit is propagating
over the area. This method has limitations since it needs several thermocouples and
they have to be placed quite close to each other to give good enough resolution.
Since the drop in temperature seen in some tests can be as high as 350˚C, a
consequence could be that the surface is cooled down to such an extent that it is lower
than evaporation temperature of water and urea thermolysis temperature. When the
next droplet hit the cold surface it might not be able to decompose and instead
initialize a starting point for deposits growth. If the same amount of spray is
distributed over a bigger area the temperature drop will be smaller and the risk of
deposit build-up will decrease.
The large effect a change in area had on possible amount to decompose was shown
with energy and heat balance calculations but not fully confirmed with the
experiments conducted. Since there was possible sources for error in area estimation,
which has been discussed previously there is not for sure possible to say if a larger
spray distribution over the surface would decrease the risk of forming deposits
however better knowledge of how the spray actually hit the surface would better
confirm the findings in this study.
5.5 Differential pressure
From experiments it was not possible to see any correlation between the deposit
formation and change in differential pressure over the substrate. Even if the number of
plugged cells increased the differential pressure experienced the same behavior. One
explanation for this might be that the amount of deposits was not enough to cover as
many cells needed for the differential pressure to change. The fluctuating pressure
from the engine made it hard to distinguish changes in the pressure. It can be easier
to detect a change in differential pressure if the mass flow was even higher than the
one in the experiments. Before it can be ruled out as a response measurement for
deposit formation, reference test should be performed to see how the differential
pressure varies without any AdBlue injection. The reference tests should be
performed for all operating points taking into consideration the pressure raise caused
by the particulate filter when it is filled up with soot. Since normal driving mostly
consists of transient operations it will be difficult to measure a change in differential
pressure in real driving conditions.

CHALMERS, Applied Mechanics, Master’s Thesis 2014:30
54
5.6 Filming into the exhaust system
Using a glass to make it possible to record the formation and decomposition live
proved to be a very useful tool to detect deposits.This makes it possible to see what is
happening while running and there is no risk of not seeing eventual deposits being
decomposed after the experiment was finished. The glass is sensitive to contamination
that may ruin the visibility. At low and medium operating point where there is a high
percentage of EGR used, soot particles stuck onto the glass surface obstructing the
view. Two of the injectors beams did partially hit the injector boss making AdBlue
run down onto to the glass making visibility worse as the experiment was conducted.
By switching off the EGR this was solved, and to get the correct temperature and
mass flow, new engine operating parameters was calibrated. This solution works well
when just looking at deposit formation and decomposition but is not suitable if
emissions are measured since without EGR the engine produces significantly more
NOX. By not having the beams hitting the injector mounting boss the glass will be
much clearer since there will not be any liquid on the glass attracting particles.
When particles are stuck onto the glass reflections from the external light source could
be seen. It is very likely that the camera will capture the reflection from the glass
instead of what is happening on the other side. It was seen that the more light used to
illuminate the substrate improved visibility on the recordings. It is therefore preferable
to have several lights sources in the system. It is not possible to package another glass
where a second light source can be housed but it is possible to mount a glass rod
through the canning. This glass rod will then work as a fiber optic light which can
feed light into the system without reflections on the glass used for filming. The end of
the glass rod can be grinded to an angle that suits the mounting position so that the
light is fed to the area of interest.
The camera used for filming had to be cooled during running since the radiation heat
from the exhaust system heated it above its operating range. It was cooled by using
compressed air blowing over the tip of the camera and therefore also on the glass. It
would have been better to use a water cooled coil around the camera tip so that
cooling down the glass could have been avoided.

CHALMERS, Applied Mechanics, Master’s Thesis 2014:
55
6 Conclusions
A kinetic model for deposit formation has been started where prediction of deposit
formation have been evaluated and confirmed for parts of the operating points tested.
A method for continuing testing of the kinetics for deposit formation and
decomposition have been developed which can be applied for testing system
performance in different aspects; this can be applied for future testing.
Influence of parameters such as temperature, exhaust mass flow and distribution of
liquid has been evaluated by constructing a script where calculations on possible
dosing amount are compiled. With the right inputs provided this can be used to
evaluate how much AdBlue could be injected into the system.
From this several conclusions can be made:
Deposit formation can be predicted by heat balance equations when the right
input is provided.
By distributing the spray over a larger area the risk of deposit formation will
decrease for temperatures over 180 degrees
Manufacturing tolerances for injector position is extremely important in order
to get the desired spray pattern.
Deposit formation is not linear.
Alfa values of 1 will most probably be achievable if right spray properties and
system design is applied.
An Alfa value of 1 should be theoretically achievable if the spray is distributed
over the substrate surface.

CHALMERS, Applied Mechanics, Master’s Thesis 2014:30
56
7 Future work
To improve and make the studying of deposit formation and decomposition more
efficient in the future the following areas have been identified
7.1 Testing improvement
Install a second light source that illuminates the substrate surface, preferable a
fiber optic glass rod for small packaging. This will increase the quality of the
films that capture the formation and decomposition.
Mount the camera on the engine or the gearbox to minimize disturbances in
the image quality.
Since the glass was installed in the system quite late into the experiments, not
too many good quality films were made. Continuation of this work is
important since the films are a good tool for studying kinetics of deposit
formation.
Improve manufacturing tolerances for injector position.’
7.2 Theory improvement
In order to see if it is possible to use differential pressure as measurement of
when deposits are formed, reference data must be collected where the engine
is operated without any dosing active. It should also be included how the
pressure is affected by the particulate filter filling up.
Improve the energy balance calculation by getting better data of the hit area,
the actual concentration of AdBlue reaching the substrate and take into
account the pulsating injection.
Take into account gas momentum of AdBlue droplets vs the exhaust flow.

CHALMERS, Applied Mechanics, Master’s Thesis 2014:
57
8 References
[1] Haywood, John B. (1988): Internal Combustion Engine Fundamentals.
McGraw-Hill Book Company. New York, 572-578 pp.
[2] Health Effects of Gas Phase Components. [Online]. 1999 [cited 2014-06-24].
Available from: https://www.dieselnet.com/tech/health_gas.php
[3] Environmental Effects of Emissions. [Online]. 2004 [cited 2014-06-24].
Available from: https://www.dieselnet.com/tech/env_effect.php
[4] REGULATION (EC) No 715/2007 OF THE EUROPEAN PARLIAMENT AND
OF THE COUNCIL of 20 June 2007 on type approval of motor vehicles with
respect to emissions from light passenger and commercial vehicles (Euro 5
and Euro 6) and on access to vehicle repair and maintenance information.
[Online]. 2007 [cited 2014-04-29]. Available from: http://eur-
lex.europa.eu/legal-content/EN/ALL/?uri=CELEX:32007R0715
[5] Heck R. M., Farrauto R. J., Gulati S. T., (2009): Catalytic air pollution control
commercial technology Third Edition. 24-28, 295-310
[6] Selective catalytic reduction. [Online]. 2009 [cited 2014-04-29]. Available
from: http://www.dieselnet.com/tech/cat_scr.php
[7] Material safety data sheet ammonia. [Online]. 2013[cited 2014-04-29].
Available from: http://www.airgas.com/documents/pdf/001003.pdf
[8] Koebel M, Elsener M, Kleemann M. Urea-SCR: a promising technique to
reduce NOx emissions from automotive diesel engines. Catalysis Today. 2000:
p. 335-345.
[9] Overview of greenhouse gases. [Online]. 2014[cited 2014-04-29]. Available
from: http://epa.gov/climatechange/ghgemissions/gases/n2o.html
[10] Koebel M., Strutz E. O., Thermal and Hydrolytic Decomposition of Urea for
Automotive Selective Catalytic Reduction Systems: Thermochemical and
Practical Aspects. Industrial & Engineering Chemistry Research, 2003 , 42, :
p. 2093-2100.
[11] Dong H., Shaui S., Wang J., Effect of urea thermal decomposition on diesel
NOx-SCR aftertreatment systems. SAE Technical Paper, 2008 , 2008-01-1544
[12] Brack W., Heine B., Birkhold F., Kruse M., Schoch G., Tischer S.,
Deuschmannn O., Kinetic modeling of urea decomposition based on
systematic thermogavimeter analyses of urea and its most important by-
products, Chemical Engineering Sicence 106, 2014, Page 1-8
[13] Lundström A., (2010) Urea decomposition for urea-SCR application:
Experimental and Computational Fluid Dynamics Studies, Department of
Chemical and Biological Engineering, Division of Chemical Engineering
Chalmers University of Thechology, Göteborg Sweden, 2010, p 5-11
[14] Xu L., Watkins W., Snow R., Graham G., McCabe R., Lambert C., Carter III
R.O., Laboratory and Engine Study of Urea-Related Deposits in diesel Urea-
SCR After-Treatment Systems. SAE Technical Paper, 2007, 2007-01-1582

CHALMERS, Applied Mechanics, Master’s Thesis 2014:30
58
[15] Strots, Vadim O. Santhanam, Shyam. Adelman, Brad J. Griffin, Gregory A.
Derybowski, Edward M (2009): Deposit Formation in Urea-SCR Systems.SAE
Technical paper.2009.2009-01-2780
[16] Zheng G., Fila A., Kotrba A., Floyd R., Investegation of urea deposits in urea
SCR systems for medium and heavy duty trucks, SAE Technical Paper, 2010,
2010-01-1941
[17] Cengel, Yunus A. (2007): Heat and Mass Transfer a Practical Approach.
McGraw-Hill Book Company. New York, 23-30 pp.