investigation of vortex response of a twin box bridge section at high and low reynolds numbers
TRANSCRIPT

ARTICLE IN PRESS
Journal of Wind Engineering
and Industrial Aerodynamics 96 (2008) 934–944
0167-6105/$ -
doi:10.1016/j
�CorrespoE-mail ad
www.elsevier.com/locate/jweia
Investigation of vortex response of a twin box bridgesection at high and low Reynolds numbers
Allan Larsena,�, Mike Savageb, Andreane Lafreniereb,Michael C.H. Huic, Søren V. Larsend
aCOWI A/S, Lyngby, DenmarkbAerodynamics Laboratory, National Research Council Canada, Ottawa, Canada
cHighways Department, Hong Kong Special Administrative Region, ChinadFORCE Technology, Lyngby, Denmark
Available online 8 August 2007
Abstract
The vortex shedding response of a twin box bridge girder deck with and without guide vanes has
been investigated at three different Reynolds numbers with the objective of identifying the mode of
vortex excitation and suitable conditions for testing that will allow faithful evaluation of guide vane
mitigation efficiency. It has been established that the displacement thickness must be at the order of
10% of the guide vane offset in order to allow sufficient flow rate to render the guide vane efficient.
Conventional section model scales ranging from 1:50 to 1:100 are not likely to be capable of
fulfilling such conditions. Measurement of the fluctuating pressure field around the twin girder deck
indicates that vortices shed from the upwind box will impinge on the downwind box resulting in
higher fluctuating pressures here than on the upwind box from where the vortices are shed. This
process is likely to render the twin deck more susceptible to vortex shedding excitation than the mono
box deck.
r 2007 Published by Elsevier Ltd.
Keywords: Bridge deck aerodynamics; Vortex shedding excitation and mitigation; Reynolds number effects
see front matter r 2007 Published by Elsevier Ltd.
.jweia.2007.06.020
nding author. Tel.: +45 45 972211; fax: +4545 972212.
dress: [email protected] (A. Larsen).

ARTICLE IN PRESSA. Larsen et al. / J. Wind Eng. Ind. Aerodyn. 96 (2008) 934–944 935
1. Introduction
Recent wind engineering investigations (Larose et al., 2003; Hui and Larsen, 2002) haveconsidered the vortex induced oscillations of twin girder bridge decks and mitigation bymeans of guide vanes, exemplified by the deck of the cabled stayed Stonecutters Bridge,Hong Kong. For this bridge, mitigation of vortex shedding response is considered animportant design issue because if allowed to occur, vortex excitation of the lowest verticaldeck modes may lead to resonant and thus high amplitude excitation of the longest cablestays. Vortex shedding lock-in with the lowest vertical modes of 1000m main span classcable stayed bridges is expected at low wind speeds in the range 5–8m/s. At such low windspeeds and for SW wind directions, turbulence levels at the Stonecutters Bridge site havebeen demonstrated to be very low. Thus turbulence cannot in general be relied upon formitigation of vortex shedding excitation.
2. Vortex excitation of twin decks
The 53.3m wide Stonecutters Bridge deck is composed of two 19.5m wide wedge shapedbox girders carried by a system of heavy transverse cross beams. This arrangement leaves a14.3m open air gap between the girders carrying roadways for opposite bound traffic, Fig.1. As on any trapezoidal box shape, von Karman type vortices are expected to form and tobe shed at regular time intervals in the near wake of the upwind girder as illustrated in thesnapshot taken from a discrete vortex simulation of the flow, Fig. 2. The vortex sheddingprocess may, if allowed to occur, lock-in with a vertical eigenmode, and thus excite verticaldeck oscillations. However, in case of a twin deck, this action may be amplified as the shedvortices drift across the air gap and impinge on the downwind girder as sketched (Fig. 3top). By mounting guide vanes at the knuckle lines between the individual box bottomplates and the inclined side panels facing the air gap (Fig. 3 bottom), it is hoped to create aflow which will prevent or diminish rhythmic vortex formation at the upwind knuckle lineand in turn reduce vortex induced forces on the upwind box as well as reduce vorteximpingement on the downwind box.
Fig. 1. General arrangement of the Stonecutters Bridge deck cross section. The guide vanes which carry rails for
the inspection gantry were fitted as a result of the present study.

ARTICLE IN PRESS
Guide vanes at bottom plate
Flow
Fig. 3. Anticipated flow pattern without guide vanes (top) and with guide vanes (bottom). The guide vane on the
upwind box injects a high speed flow into the wake thus preventing formation, shedding and drifting of von
Karman vortices to impinge on the downwind box.
Flow
Vortex formation
Fig. 2. Discrete vortex simulation of the flow about the Stonecutters Bridge deck cross section displaying
formation of a vortex under the inclined panel in the wake of the upwind girder.
A. Larsen et al. / J. Wind Eng. Ind. Aerodyn. 96 (2008) 934–944936
3. Vortex shedding tests
3.1. Response tests
The need to establish some sort of mitigation of vertical vortex shedding excitationbecame apparent during standard 1:80 scale section model wind tunnel tests carried outearly in the design process. Tests on a spring suspended model of the bare section (i.e.without guide vanes) revealed a vertical response peak of 10% root mean square (rms)amplitude of the section depth H at a non-dimensional wind speed U/fBE0.35, Fig. 4. U iswind speed, f is vertical frequency and B is the overall deck width. Based on the success ofsimilar guide vanes to mitigate vertical vortex induced oscillations of the Storebælt Bridgein the spring of 1998 (Larsen et al., 2000), a set of similar guide vanes, as indicated inFig. 1, were drafted and tested. However, as shown in Fig. 4, the Stonecutters Bridge guidevanes could not be demonstrated to be satisfactory. The peak at U/fBE0.35 wasdiminished by 40%, but a new and stronger response peak appeared at U/fBE0.41.At first glance the result was difficult to understand, but calculation of the Reynolds
number based on the chord length C ¼ 19.5m/80 ¼ 0.24m of the individual box sectionsyielded Re ¼ UC/nE18 000, indicating laminar flow conditions and thus a thick boundarylayer at the position of the upwind guide vane. Under such conditions the upwind guidevane would be well immersed in the boundary layer growing on the curved soffit plate, thuspreventing sufficient flow through the guide vane to inhibit vortex formation in the near

ARTICLE IN PRESS
0.2 0.3 0.4 0.5 0.60
0.005
0.01
0.015
Bare section, 1:80 scale, Re = 18000
Guide vane, 1:80 scale, Re = 18000
U/fB
rms
resp
onse
/H
Fig. 4. Vortex response of 1:80 scale spring suspended section model. 1:80 scale tests.
0.2 0.3 0.4 0.5 0.60
0.005
0.01
0.015
Bare section, 1:20 scale, Re = 362000Guide vane, 1:20 scale, Re = 362000Guide vane, 1:20 scale, Re = 70000
U/fB
rms
resp
onse
/H
Fig. 5. Vortex response of 1:20 scale spring suspended section model. Detailed design tests, 1:20 scale.
A. Larsen et al. / J. Wind Eng. Ind. Aerodyn. 96 (2008) 934–944 937
wake of the upwind box section. The large scale (1:20) high Re section model tests reportedin Larose et al. (2003) were devised partly to clarify this aspect. The guide vane designwhich had failed in the 1:80 scale tests proved to be very efficient in the 1:20 scale tests,completely eliminating vortex shedding response.
During detailed design of the bridge deck it became of interest to minimize the amountof structural steel consumed by the guide vanes and to device a more firm support for themaintenance gantry rails which were designed to be an integral part of the guide vanes.Detailing of the guide vanes initiated a new round of tests using the 1:20 scale sectionmodel supported by a 5.9Hz spring suspension having a nominal structural dampingz ¼ 0.2% relative-to-critical. Besides optimizing the guide vanes, these large scale tests alsoserved to shed more light into the scale effects related to the guide vanes. The measured
ARTICLE IN PRESSA. Larsen et al. / J. Wind Eng. Ind. Aerodyn. 96 (2008) 934–944938
response diagram, Fig. 5, reveals a similar vortex shedding peak to Fig. 4 at U/fBE0.35 forthe bare deck, tested at ReE362 000. However, the response peak is completely eliminatedwhen the guide vanes are present. Lowering the test Re five-fold by changing to a softerspring suspension (ReE70 000), makes the vortex shedding peak reappear in presence ofthe guide vanes as was the case in the 1:80 scale tests, Fig. 5.
3.2. Boundary layer measurements
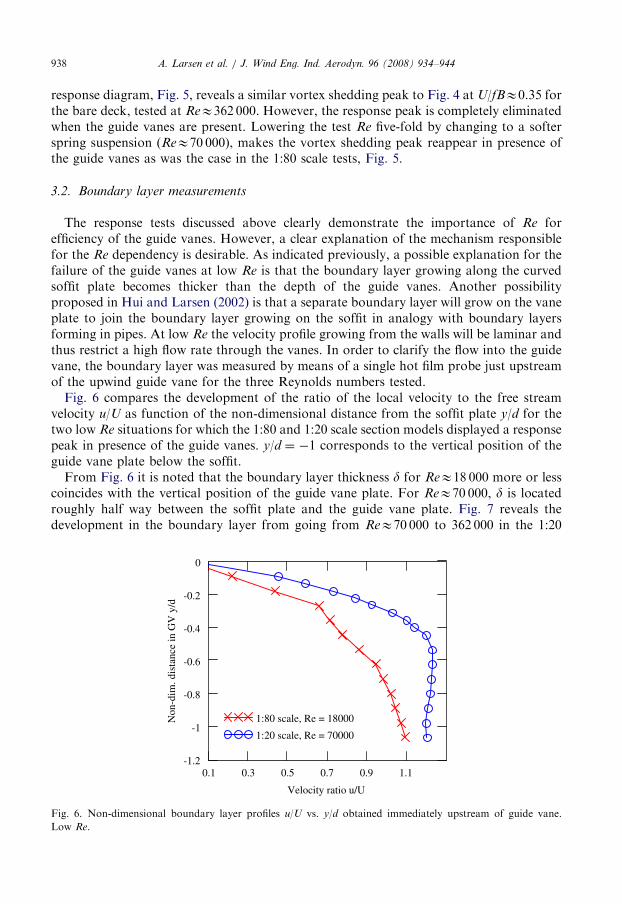
The response tests discussed above clearly demonstrate the importance of Re forefficiency of the guide vanes. However, a clear explanation of the mechanism responsiblefor the Re dependency is desirable. As indicated previously, a possible explanation for thefailure of the guide vanes at low Re is that the boundary layer growing along the curvedsoffit plate becomes thicker than the depth of the guide vanes. Another possibilityproposed in Hui and Larsen (2002) is that a separate boundary layer will grow on the vaneplate to join the boundary layer growing on the soffit in analogy with boundary layersforming in pipes. At low Re the velocity profile growing from the walls will be laminar andthus restrict a high flow rate through the vanes. In order to clarify the flow into the guidevane, the boundary layer was measured by means of a single hot film probe just upstreamof the upwind guide vane for the three Reynolds numbers tested.Fig. 6 compares the development of the ratio of the local velocity to the free stream
velocity u/U as function of the non-dimensional distance from the soffit plate y/d for thetwo low Re situations for which the 1:80 and 1:20 scale section models displayed a responsepeak in presence of the guide vanes. y/d ¼ �1 corresponds to the vertical position of theguide vane plate below the soffit.From Fig. 6 it is noted that the boundary layer thickness d for ReE18 000 more or less
coincides with the vertical position of the guide vane plate. For ReE70 000, d is locatedroughly half way between the soffit plate and the guide vane plate. Fig. 7 reveals thedevelopment in the boundary layer from going from ReE70 000 to 362 000 in the 1:20
0.1 0.3 0.5 0.7 0.9 1.1-1.2
-1
-0.8
-0.6
0
1:80 scale, Re = 18000
1:20 scale, Re = 70000
Non
-dim
. dis
tanc
e in
GV
y/d
-0.2
-0.4
Velocity ratio u/U
Fig. 6. Non-dimensional boundary layer profiles u/U vs. y/d obtained immediately upstream of guide vane.
Low Re.

ARTICLE IN PRESS
0.1 0.3 0.5 0.7 0.9 1.1-1.2
-1
-0.8
-0.6
-0.4
-0.2
0
1:20 scale, Re = 70000
1:20 scale, Re = 362000
Velocity ratio u/U
Non
-dim
. dis
tanc
e in
GV
y/d
Fig. 7. Non-dimensional boundary layer profiles u/U vs. y/d obtained immediately upstream of guide vane. 1:20
scale model.
Table 1
Displacement thickness D normalized by guide vane offset d as function of Reynolds number
Reynolds number Re 18 000 70 000 362 000
Relative displacement thickness D/d 0.33 0.20 0.10
A. Larsen et al. / J. Wind Eng. Ind. Aerodyn. 96 (2008) 934–944 939
scale model. It is noted that d now decreases to about 20% of the guide vane offsetallowing a larger volume flow through the vane. A more direct way of assessing the flowrate in the guide vane is by comparing the displacement thicknesses made non-dimensionalby guide vane offset D/d. This parameter indicates how far, in relative terms, theundisturbed flow is displaced from the soffit because of the reduced velocities within theboundary layer:
Dd¼
Z 1
0
1�u
U
� �d
y
d
� �. (1)
The non-dimensional displacement thickness D/d is given in Table 1 for the three Reynoldsnumbers investigated. It is apparent that the thick boundary layers present at thelow Re effectively blocks 33% and 20% of the flow into the upwind guide vane. To thiseffect we shall probably add the blockage of a separate boundary layer growing on theguide vane plate which, in low Re cases, probably will merge with the boundary layergrowing on the soffit.
4. Vortex shedding tests with modified cross section
During the final phases of the detailed design of the Stonecutters Bridge detailing of thedeck furniture was made. The cable anchorages were changed from square cross section tocircular tubes and a small gantry rail running along the outer edges of the roadways was

ARTICLE IN PRESSA. Larsen et al. / J. Wind Eng. Ind. Aerodyn. 96 (2008) 934–944940
added. In order to investigate the implications of these design changes on the vortexshedding excitation and the effect of the guide vanes, the 1:20 scale tests were repeatedintroducing the above design features. The new test series also gave an opportunity to lookfurther into the vortex dynamics through high frequency pressure measurements made at53 taps mounted flush with the section circumference of each box girder.
4.1. Response measurements
The last round of 1:20 scale tests at Re ¼ 362 000 (5.9Hz suspension system) started outby measuring the vertical responses of the spring supported model as was done previously.The response diagram in Fig. 8 (middle) demonstrates that the design changes did onlyhave marginal influence on the vortex response for the bare deck in that the peak response
Flow Bare deckFilter: 5.5 Hz - 6.5 HzU/fB≈ 0.41
Bare deckFilter: 4.0 Hz - 8.0 HzU/fB≈ 0.41
0
B=53.3m;H=3.914m Baredeck
With guide vanes
Response diagram Tests with modified stayanchor tubes
With guide vanes Filter: 4.0 Hz - 8.0 HzU/fB≈ 0.36
Flow With guide vanes Filter: 5.5 Hz - 6.5 HzU/fB ≈ 0.36
Cp = 0.5
Rm
s v
ert
ical re
sponse/H 0.03
0.02
0.01
0.2
Reduced wind velocity(U/fheaveB)
0.3 0.4 0.70.60.5
Fig. 8. Vortex response of 1:20 scale spring suspended section model obtained for modified cable anchor tubes
(middle) and rms pressure distributions for bare deck (top) and deck with guide vanes (bottom) obtained for
different filter band-widths of 1 and 4Hz.

ARTICLE IN PRESSA. Larsen et al. / J. Wind Eng. Ind. Aerodyn. 96 (2008) 934–944 941
grows to about 15% of the deck depth. A comparison with the 1:80 scale section modeltests for the bare deck shows very good agreement. The guide vanes still performmitigating the vortex shedding response completely.
4.2. Vortex dynamics
The high frequency pressure fluctuation measurements obtained during the last round oftests were helpful in shedding some light into the vortex dynamics and facilitated anunderstanding of the function of the guide vanes. Fig. 3 proposed two mechanisms forvortex shedding excitation of a twin girder bridge deck:
�
Excitation of the upwind box by fluctuating pressures caused by vortices shed of thesoffit plate at the knuckle line. � Excitation of the downwind box by fluctuating pressures caused by impinging vorticesshed from the upwind box.
With reference to the response diagram in Fig. 8 (middle), corresponding normalized rmspressure coefficient distributions obtained for the bare deck and the deck with guide vaneswere obtained using 1 and 4Hz band-pass filters around the lock-in frequency of 6Hz. Forthe bare deck at U/fBE0.41 (run 76) the maximum lock-in has decreased, but the rmspressure distribution remains fairly coherent over the entire deck section. In particular,fairly large rms pressures are observed on the inclined panels facing the gap changing littlewith filter band-width. This behaviour is consistent with a very narrow band process as isexpected for vortex shedding. When introducing the guide vanes it is noted that thepressures on the inclined panels are markedly reduced. Observing the difference betweenthe 1 and 4Hz band-pass filtered rms pressures, it is noted that the pressures on the panelsfacing the gap are almost doubled when going from 1 to 4Hz band-width, a behaviourconsistent with a wide banded process different from vortex shedding excitation.Comparing the 1Hz band-width pressure distributions for the bare deck and deck withguide vanes, it is evident that the presence of the guide vanes has reduced the fluctuatingpressures significantly, giving evidence that vortex formation at the upwind inclined paneland impinging on the downwind inclined panel is partly destroyed by injection of highspeed flow in the guide vane as anticipated in Fig. 3.
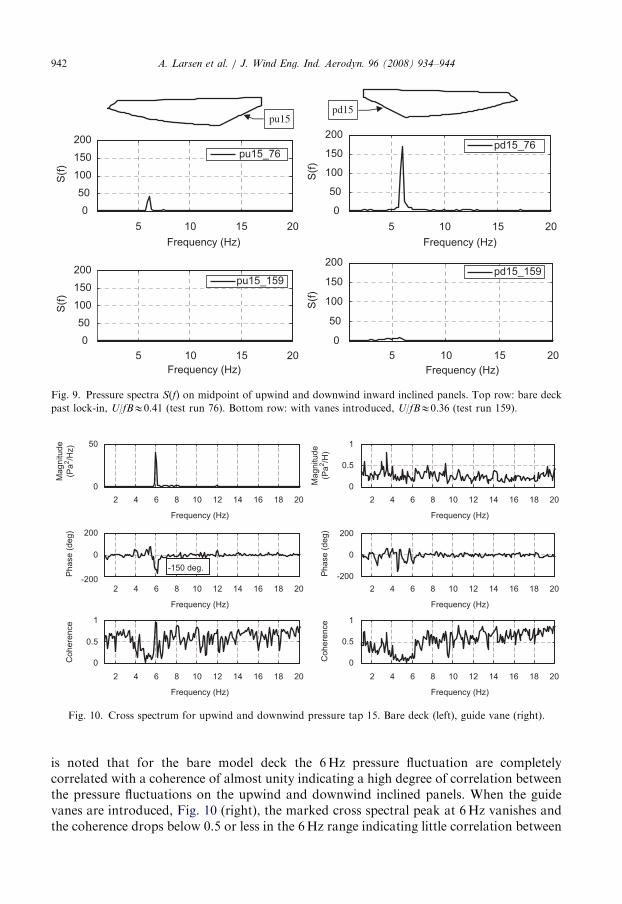
A more detailed impression of the fluctuating pressures in the gap is obtained fromspectral analysis of the recorded pressure signals. Figs. 9 and 10 compare pressure spectraobtained on the inclined panels approximately half way between the soffit plate knuckleline and the top vertical panel of the gap (tap 15). For the bare section, Fig. 9, a 6Hzharmonically fluctuating pressure of a magnitude of 45 Pa is noted on the upwind inclinedpanel. At the identical position on the downwind panel, the pressure is still fluctuatingharmonically at 6Hz, but the magnitude has almost quadrupled to a magnitude of 170 Pa.When the guide vanes are introduced, Fig. 9 (bottom), the distinct harmonic pressurefluctuations altogether disappear, again bearing evidence that the vortex shedding actionhas been mitigated by the presence of the guide vanes.
A remaining question is to what extent the pressure fluctuation on the inclined panelfacing the gap on the downwind box is caused by impinging vortices shed from the inclinedpanel of the upwind box. Observing the cross spectrum, Fig. 10, between the two tapsobtained for the bare section at U/fBE0.41 sheds light into this issue. From Fig. 10 (left) it
ARTICLE IN PRESS
5 10 15 20
0
50
100
150
200
S(f
)
5 10 15 20
0
50
100
150
200
S(f
)
5 10 15 20
0
50
100
150
200
S(f
)
5 10 15 20
0
50
100
150
200
S(f
)
pu15pd15
Frequency (Hz) Frequency (Hz)
Frequency (Hz) Frequency (Hz)
pd15_159pu15_159
pu15_76pd15_76
Fig. 9. Pressure spectra S(f) on midpoint of upwind and downwind inward inclined panels. Top row: bare deck
past lock-in, U/fBE0.41 (test run 76). Bottom row: with vanes introduced, U/fBE0.36 (test run 159).
2 4 6 8 10 12 14 16 18 20
0
1
Magnitude
(Pa
2/H
)
-200
0
200
Phase (
deg)
0
1
Cohere
nce
2 4 6 8 10 12 14 16 18 20
0
50
Magnitude
(Pa
2/H
z)
0
Phase (
deg)
0
1
Cohere
nce
-150 deg.
0.5
-200
200
Frequency (Hz) Frequency (Hz)
2 4 6 8 10 12 14 16 18 202 4 6 8 10 12 14 16 18 20
Frequency (Hz) Frequency (Hz)
2 4 6 8 10 12 14 16 18 202 4 6 8 10 12 14 16 18 20
Frequency (Hz) Frequency (Hz)
0.5
0.5
Fig. 10. Cross spectrum for upwind and downwind pressure tap 15. Bare deck (left), guide vane (right).
A. Larsen et al. / J. Wind Eng. Ind. Aerodyn. 96 (2008) 934–944942
is noted that for the bare model deck the 6Hz pressure fluctuation are completelycorrelated with a coherence of almost unity indicating a high degree of correlation betweenthe pressure fluctuations on the upwind and downwind inclined panels. When the guidevanes are introduced, Fig. 10 (right), the marked cross spectral peak at 6Hz vanishes andthe coherence drops below 0.5 or less in the 6Hz range indicating little correlation between

ARTICLE IN PRESS
18
-10
0
10
20
Pres
sure
(Pa
)
Tap15,ds
Tap15,us τ≈ 0.1 sec
17.6 17.7 17.8 17.9
Time (s)
18.1 18.2 18.3 18.4 18.5
Fig. 11. Excerpt of pressure time traces recorded at the upwind (dashed) and downwind (full) no. 15 pressure taps
identifying model scale vortex drift time t.
A. Larsen et al. / J. Wind Eng. Ind. Aerodyn. 96 (2008) 934–944 943
the pressure fluctuations on the upwind and downwind panels facing the gap. The phaseinformation contained in the cross spectrum for the bare deck case allows estimation of thetravel time t of a vortex structure from being shed at the upwind panel to impinging on thedownwind panel:
t �1
f�f360
, (2)
where f is the frequency and f is the phase lag in degrees. Taking from Fig. 10 (left)f ¼ 6Hz and fE1501 indicates a model scale vortex drift time tE0.07 s. This can becompared to the time it will take fluid particles in the free flow to travel a horizontaldistance s similar to the gap tEs/U ¼ 14.3m/20/6.2m/s ¼ 0.11 s. Thus it is likely that thelarge pressure fluctuations at the downwind inclined panel of the gap are caused byimpinging vortices shed from the upwind panel and convected by the flow across the gap.The drift time analysis is supported by inspection of the time traces recorded at the upwindand downwind pressure tap 15, Fig. 11. Here it is noted that a trace shape recorded at theupwind tap is recovered in a somewhat modified form at the downwind tap approximately0.1 s later.
5. Conclusion
The present paper has examined vertical vortex shedding excitation of a twin girderbridge deck with a view to unveil the details of the excitation mechanism and investigatesoffit mounted guide vanes as a means for mitigation of the response. It is concluded thatvortex excitation of twin girders are likely to be stronger than vortex excitation of monogirders as the fluctuating pressure originating from the vortex impinging on the downwindbox is 3 to 4 times larger than the fluctuating pressure exerted on the upwind box in whichwake the vortex originally is formed. Guide vanes are efficient devices for introducing highspeed fluid in the wake region of the upwind box and thus preventing vortex formation.The design and efficiency of guide vanes can be investigated with good results in modelwind tunnel tests. However, it is important to ensure sufficiently high test Reynoldsnumbers to avoid thick boundary layers growing on the model and thus preventsufficiently high flow rates into the guide vane. Typically, conventional model scales of1:50–1:80 commonly employed in bridge aerodynamics testing will be subject to scale

ARTICLE IN PRESSA. Larsen et al. / J. Wind Eng. Ind. Aerodyn. 96 (2008) 934–944944
effects related to boundary layer thickness and thus not be adequate for evaluation ofguide vane designs.Twin box bridge decks are desirable for very long span cable supported bridges as the
wind speed for onset of aerodynamic instability can be controlled by means of the gapwidth. A statement supported by fact that the flutter wind speed for the stonecutter bridgewas estimated to be above 200m/s while a mono box deck for the same span length andcable arrangement would have a critical wind speed of about 100m/s. The down side oftwin box bridge decks is clearly vortex shedding action and interaction which must becarefully considered and controlled before an aerodynamically satisfactory design results.
Acknowledgements
The authors would like to acknowledge the kind permission of the bridge owner,Highways Department SAR Hong Kong, to publish the results of the work. Also thededication of the NRC and FORCE Technology wind tunnel staffs is highly appreciated.
References
Hui, M.C.H., Larsen, A., 2002. Aerodynamic investigations for the deck of Stonecutters Bridge emphasising
Reynolds number. In: Choi, C.-K., et al. (Eds.), Proceedings of the International Symposium on Wind and
Structures, 2nd ed. Busan, Korea, pp. 649–656.
Larose, G., Larsen, S.V., Larsen, A., Hui, M., Jensen, A.G., 2003. Sectional model experiments at high Reynolds
number for the deck of a 1018m span cable-stayed bridge. Proceedings of the 11th International Conference
on Wind Engineering, Lubbock, Texas, 2003.
Larsen, A., Esdahl, S., Andersen, J.E., Vejrum, T., 2000. Storebælt suspension bridge-vortex shedding excitation
and mitigation by guide vanes. J. Wind Eng. Ind. Aerodyn. 88, 283–296.