investigation of water droplet dynamics in pem cell gas
TRANSCRIPT
Rochester Institute of TechnologyRIT Scholar Works
Theses Thesis/Dissertation Collections
11-13-2013
Investigation of Water Droplet Dynamics in PEMCell Gas ChannelsPreethi Gopalan
Follow this and additional works at: http://scholarworks.rit.edu/theses
This Dissertation is brought to you for free and open access by the Thesis/Dissertation Collections at RIT Scholar Works. It has been accepted forinclusion in Theses by an authorized administrator of RIT Scholar Works. For more information, please contact [email protected].
Recommended CitationGopalan, Preethi, "Investigation of Water Droplet Dynamics in PEM Cell Gas Channels" (2013). Thesis. Rochester Institute ofTechnology. Accessed from
- i -
R·I·T
INVESTIGATION OF WATER DROPLET DYNAMICS
IN PEM FUEL CELL GAS CHANNELS
by
Preethi Gopalan
A dissertation submitted in partial fulfillment of the requirements
for the degree of Doctorate of Philosophy in Microsystems Engineering
Microsystems Engineering Program
Kate Gleason College of Engineering
Rochester Institute of Technology
Rochester, New York
November 13, 2013
- ii -
INVESTIGATION OF WATER DROPLET DYNAMICS IN
PEM FUEL CELL GAS CHANNELS
by
Preethi Gopalan
Committee Approval:
We, the undersigned committee members, certify that we have advised and/or supervised the candidate on
the work described in this dissertation. We further certify that we have reviewed the dissertation manuscript
and approve it in partial fulfillment of the requirements of the degree of Doctor of Philosophy in
Microsystems Engineering.
_________________________________________
Dr. Satish G. Kandlikar Date
James E. Gleason Professor, Mechanical Engineering (Advisor)
__________________________________________
Dr. Steven J. Weinstein Date
Department Head, Biomedical and Chemical Engineering
__________________________________________
Dr. Denis Cormier Date
Earl W. Brinkman Professor, Industrial and Systems Engineering
__________________________________________
Dr. Steven W. Day Date
Professor, Mechanical Engineering
Certified by:
__________________________________________
Dr. Bruce W. Smith Date
Director, Microsystems Engineering Program
__________________________________________
Dr. Harvey J. Palmer Date
Dean, Kate Gleason College of Engineering
- iii -
ABSTRACT
Kate Gleason College of Engineering
Rochester Institute of Technology
Degree: Doctor of Philosophy Program: Microsystems Engineering
Authors Name: Preethi Gopalan
Advisors Name: Satish G. Kandlikar
Dissertation Title: Investigation of Water Droplet Dynamics in PEM Fuel Cell Gas
Channels
Water management in Proton Exchange Membrane Fuel Cell (PEMFC) has
remained one of the most important issues that need to be addressed before its
commercialization in automotive applications. Accumulation of water on the gas
diffusion layer (GDL) surface in a PEMFC introduces a barrier for transport of reactant
gases through the GDL to the catalyst layer. Despite the fact that the channel geometry is
one of the key design parameters of a fluidic system, very limited research is available to
study the effect of microchannel geometry on the two–phase flow structure. In this study,
the droplet–wall dynamics and two–phase pressure drop across the water droplet present
in a typical PEMFC channel, were examined in auto–competitive gas channel designs
(0.4 x 0.7 mm channel cross section). The liquid water flow pattern inside the gas channel
was analyzed for different air velocities. Experimental data was analyzed using the
Concus–Finn condition to determine the wettability characteristics in the corner region. It
was confirmed that the channel angle along with the air velocity and the channel material
influences the water distribution and holdup within the channel. Dynamic contact angle
emerged as an important parameter in controlling the droplet–wall interaction.
Experiments were also performed to understand how the inlet location of the liquid
droplet on the GDL surface affects the droplet dynamic behavior in the system. It was
found that droplets emerging near the channel wall or under the land lead to corner filling
of the channel. Improvements in the channel design has been proposed based on the
artificial channel roughness created to act as capillary grooves to transport the liquid
water away from the land area. For droplets emerging near the center of the channel,
beside the filling and no-filling behavior reported in the literature, a new droplet jumping
behavior was observed. As droplets grew and touched the sidewalls, they jumped off to
the sidewall leaving the whole GDL exposed for gases to diffuse to the catalyst layer. A
theoretical model was developed and a criterion was proposed to predict the droplet
jumping behavior in the gas channel. A theoretical force balance model was proposed to
predict the pressure force and air velocity required to remove the droplet from the
channel to avoid complete channel blockage. The overall goal of this work was to
identify the gas channel configuration that provides efficient water removal with a lower
pressure drop in the system efficiency while meeting the US Department of Energy’s
specifications for a PEMFC for automotive application.
- iv -
ACKNOWLEDGMENTS
First and foremost, I would like to express my gratitude to my advisor, Dr. Satish
G. Kandlikar for providing me with this wonderful opportunity to conduct research and
for his generous support, guidance and constant encouragement throughout my graduate
studies at RIT. I thank him for providing me the wonderful opportunity of being a part of
Thermal Analysis, Microfluidics and Fuel Cell Laboratory (TAµFL), which actually
became my second home in the due course. His wholehearted, enthusiastic personality
along with interminable patience has made it an immense pleasure for me to conduct
research with him. His distinguished ability to envision complex problems from an
elegant and intuitive touch has shaped the way I approach any problem.
I am very much grateful to Dr. Steven Weinstein, Dr. Denis Cormier, Dr. Steven
W. Day and Professor Bruce W. Smith for being a part of my dissertation committee and
for their generous support in sharing their ideas and all sorts of facility resources for the
maximum good of my research. I would also like to thank Lisa Zimmerman for taking
care of all my administrative responsibilities and keeping me on track with my progress.
I would like to acknowledge the support received from the US Department of
Energy under contract number DE-EE0000470. I would also like to thank Jon Owejan
and Jeffery Gagliardo of the General Motors Electrochemical Energy Research
Laboratory for providing guidance and materials for the research. This work could not
have been completed without their support.
I would like to acknowledge the staff at the Mechanical Engineering Machine
Shop for their unrestrained help and willingness to teach me every time I go there. In
particular, I would like to thank Mr. Dave Hathaway, Mr. Robert Kraynik and Mr. Jan
Maneti for their knowledge, willingness and readiness to help on almost everything
related to microfabrications at any time. I would also like to thank Sean O’Brien and John
Nash at Semiconductor and Microsystems Fabrication Laboratory (SMFL) for training
and helping me with the tools. I also want to acknowledge the staff at the Mechanical
Engineering Department Office for all their support and willingness to go an extra mile to
help me every time I go there for anything.
I am indebted to former group members especially Dr. Guangsheng Zhang, Mr.
Cody Rath and Dr. Carlos Rubio for guiding me in conducting simulations, experiments
and taking measurements. I am extremely grateful to all my lab members especially
Rupak Banerjee, Mihir Shah, Zhonghua Yao, Ankit Kalani and Chinmay Patil for the
- v -
support and help they provided me throughout my doctoral studies. I would like to thank
Mustafa Koz, Valentina Mejia Jeet Mehta and for all the technical discussions we had
and for making my stay in Rochester a very pleasant and treasured one. I also want to
express my greatest gratitude to Dr. Madusudanan Sathianarayanan for his valuable
support and encouragement, which made my doctoral studies enjoyable and successful. I
would also like to thank Tarun Mudgal, Amanpreet Kaur and Mihir Bohra who were the
ones who really made my journey throughout my PhD the most memorable one. I cherish
all the memories during the innumerable fun trips and late night chats we had together. I
wish all of them the best of luck all the way with their studies, careers and personal lives.
Finally, I would like to acknowledge and thank the source of life and my eternal
support – my family. I would like to dedicate this work to my parents, Mr. Vedagiri
Gopalan and Mrs. Vidya Gopalan, and my sister, Nanditha Gopalan. Without their love,
dedication and sacrifice I would not be where I am now. They constantly motivated and
supported me from the beginning, and cherished my growth and achievements, especially
while I was away from home. Thank you for everything.
- vi -
TABLE OF CONTENTS
LIST OF FIGURES ........................................................................................................... xi
LIST OF TABLES ......................................................................................................... xxiii
NOMENCLATURE ....................................................................................................... xxv
Chapter 1 Introduction ........................................................................................................ 1
1.1 Proton Exchange Membrane Fuel Cells ................................................................ 4
1.1.1 Catalyst Layer ................................................................................................ 6
1.1.2 Gas Diffusion Media (GDM) ......................................................................... 7
1.1.3 Bipolar Plates ................................................................................................. 9
1.1.4 PEMFC Performance ................................................................................... 10
1.2 Water Management in PEMFC ........................................................................... 12
1.3 Document Overview ............................................................................................ 14
Chapter 2 Literature Review and Motivation ................................................................... 16
2.1 Contact Angle ...................................................................................................... 18
2.2 Contact Angle Hysteresis .................................................................................... 19
2.3 Roughness Effect on Contact Angle .................................................................... 21
- vii -
2.4 Droplet Behavior Touching Two Surfaces .......................................................... 26
2.5 Ex situ and In situ Water Visualization Techniques ............................................ 29
2.6 Different Phenomena Affecting the Water Removal from Gas Channels .......... 34
2.6.1 Forces Affecting Droplet Removal .............................................................. 34
Chapter 3 Experimental Setup .......................................................................................... 49
3.1 Designing of Ex Situ Setup .................................................................................. 49
3.2 Experimentation .................................................................................................. 51
Chapter 4 Experimental Results........................................................................................ 62
4.1 Effect of Channel Wall Angle ............................................................................. 62
4.2 Effect of Superficial Air Velocities ..................................................................... 67
4.3 Pressure Drop across the Droplet ........................................................................ 75
4.4 Effect of Channel Wall Material ......................................................................... 78
4.4.1 Stainless Steel Sidewall ............................................................................... 79
4.4.2 Copper Sidewall ........................................................................................... 81
4.4.3 Graphite Sidewall......................................................................................... 81
4.4.4 Pressure Drop in the Channel ...................................................................... 83
- viii -
4.5 Effect of GDL Material ....................................................................................... 86
4.5.1 Toray (TGP–H–060) GDL ........................................................................... 87
4.5.2 SGL–25BC GDL ......................................................................................... 88
4.5.3 Pressure Drop in the Channel ...................................................................... 90
4.6 Effects of GDL Degradation ............................................................................... 92
4.6.1 Pressure Drop in the Channel ...................................................................... 94
4.7 Scaling of the System .......................................................................................... 96
4.8 Effect of Droplet Inlet Location ........................................................................ 102
4.8.1 Groove Capillary Channels for Removing Water Emerging Under the Land
105
Chapter 5 Theoretical Results ......................................................................................... 115
5.1 Geometric Analysis of Droplet Dynamics ........................................................ 116
5.1.1 Condition 1: Droplet Sitting on the Base Wall before Jumping to the
Sidewall ................................................................................................................. 118
5.1.2 Condition 2: Droplet Hanging from the Sidewall After the Jump ............. 120
5.1.3 Droplet Jumping Criterion Analysis from Geometrical Considerations.... 121
5.1.4 Experimental Results ................................................................................. 124
- ix -
5.1.5 Explanation of Droplet Jumping Through Energy Considerations............ 136
5.1.6 Pressure Drop and Force Analysis ............................................................. 140
Chapter 6 Conclusions .................................................................................................... 156
Chapter 7 Future Work ................................................................................................... 160
7.1 Capillary Grooves – Prevent Spreading of Liquid on the GDL ........................ 160
7.2 Compression of the GDL and its Effect on Droplet Dynamics ......................... 161
7.3 Study the Effect of the Different Droplet Dynamics Observed on Mass Transport
Resistance inside the Gas Channel ................................................................................. 161
7.4 Study the Effect of Temperature, Pressure and Humidity on Droplet Behavior 162
7.5 Analysis of the Oscillations Produced in the Droplet Due to the Airflow ........ 162
Appendix I ...................................................................................................................... 163
1. Water Flow Rate Calculation ............................................................................... 163
2. Superficial Airflow Rate Calculation ................................................................... 164
Appendix II ..................................................................................................................... 167
a. Geometrical Relationships ................................................................................... 167
i. To Find the Maximum Radius 𝑅𝐶1 Right Before it Jumps .............................. 168
- x -
ii. To Find the Distance of the Point of Contact of the Droplet on the Sidewall
(x) from the Channel Corner Before it Jumps. ...................................................... 169
iii. To Find the Volume (V1) of the Droplet Sitting on the GDL ................. 169
iv. To Find the Volume (V2) of the Droplet Hanging from the Sidewall ........ 171
v. To Find the Maximum Radius RC2 While Hanging from the Sidewall Before
Bridging ................................................................................................................. 171
b. Uncertainty Analysis ............................................................................................ 172
References ....................................................................................................................... 179
- xi -
LIST OF FIGURES
Figure 1.1: Environmental pollution caused by an IC engine vehicle during operation [6]1
Figure 1.2: Different types of energy losses associated with the drive cycle of a vehicle
with IC engine [5]. .............................................................................................................. 2
Figure 1.3: (a) PEM fuel cell stack and auxiliary unit configuration of previous
generation and (b) an improved fuel cell system that still needs further improvement in
terms of size and efficiency. Image courtesy to General Motors. ...................................... 3
Figure 1.4: Schematic of a proton exchange membrane fuel cell (PEMFC). Adapted from
[12]. ..................................................................................................................................... 5
Figure 1.5: Different GDL sample material a) Carbon paper (Toray), b) Carbon fiber
(SGL), c) Carbon cloth. Adapted from [15] ....................................................................... 8
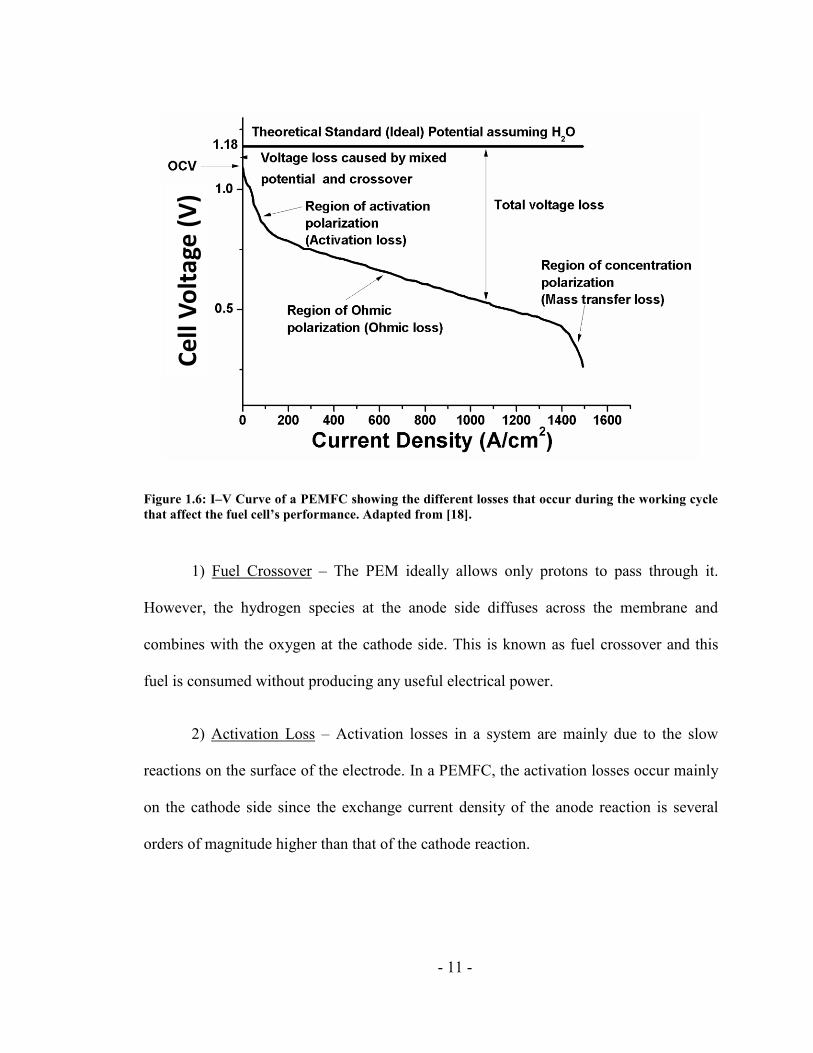
Figure 1.6: I–V Curve of a PEMFC showing the different losses that occur during the
working cycle that affect the fuel cell’s performance. Adapted from [18]. ...................... 11
Figure 2.1: Water accumulation on the GDL and leading to flooding of the channel,
which hinders the reactant gas diffusion to the catalyst layer. Adapted from [12]. ......... 17
Figure 2.2: Graphical representation of a droplet on a smooth surface and the different
forces acting on it .............................................................................................................. 18
Figure 2.3: Graphical representation of a droplet on different surfaces (a) Hydrophilic
surface and (b) Hydrophobic surface ................................................................................ 19
- xii -
Figure 2.4: Different contact angles made by the droplet just before it moves on a surface.
Advancing and receding contact angles are shown by θA and θR ..................................... 20
Figure 2.5: Discrepancy in the contact angle measurement due to the roughness features
on a rough surface. ............................................................................................................ 21
Figure 2.6: Different wetting behaviors of the droplet on smooth and rough surfaces. a)
Droplet on a smooth surface b) Wenzel type droplet wetting on rough surface c) Cassie–
Baxter type droplet wetting on a rough surface. Adapted from [35]. ............................... 23
Figure 2.7: (a) Model showing the angles made by the liquid with the wedge surface (b)
Plot representing the Concus-Finn condition for wedge surface where the plot represents
the contact angle made by the liquid on the wedge surfaces. Points that fall in the shaded
region R have solution for the Concus–Finn condition. For the points falling in the D1+,
D1–, D2
+and D2– no solution exists. Adapted from [86]. ................................................... 27
Figure 2.8: (a) Model showing the angles made by the droplet near the channel corner
wedge and (b) 2D plot representing the Concus-Finn condition for wedge surface. When
the contact angle of the wedge material falls in the shaded region, then the corner of the
channel would be filled. If the contact angle point falls in the non–shaded region then the
channel corners would remain non–filled. This is also known as enclosure effect.
Adapted from [94]............................................................................................................. 28
Figure 2.9: Different theories proposed for understanding the droplet movement from the
catalyst layer to the channel region. (a) Droplet movement from the catalyst layer to a

- xiii -
channel through the GDL by fingering and channeling pathway. Adapted from [106], (b)
The upside down tree model for water removal from the catalyst layer to GDL surface.
Adapted from [107]. (c) Liquid water generated in the catalyst layer travels through the
GDL layer from under the rib region and erupts or drains into the channel region.
Adapted from [100]........................................................................................................... 30
Figure 2.10: Water emergence from the GDL into the gas channel follows Haines Jump
Mechanism. Adapted from [118]. ..................................................................................... 33
Figure 2.11: Different forces acting on a droplet in the PEMFC gas channel. ................. 35
Figure 2.12: Different water flow pattern observed in the PEMFC gas channels in terms
of increasing flow resistance a) Droplet b) Mist c) Film d) Slug ..................................... 41
Figure 2.13: Flow pattern map for polycarbonate sidewall and MRC–105 GDL for
different water (UL) and airflow (UG) rates. Adapted from [119]. ................................... 42
Figure 2.14: (a) Comparison of the normalized friction factor for different channel
geometry as a function of time. Adapted from {Zhu, 2010 #150} (b) Comparison of the
pressure drop factor in different reactant channel geometries at air velocity of 1.5 x 10⁻³
m/s. Adapted from [119]. .................................................................................................. 45
Figure 3.1: Experimental test set up used for visualization of the droplet dynamics inside
the gas channel. ................................................................................................................. 49
- xiv -
Figure 3.2: Confocal laser scanning microscope (CLSM) images of different GDL and
channel wall materials (a) MRC–105 (b) SGL–25BC (c) TGP–H–060 (d) Cu-110 (e)
Graphite Composite (f) SS-2205 ...................................................................................... 50
Figure 3.3: Experimental test setup with different control units ...................................... 52
Figure 3.4: (a) Image of the LabVIEW connection diagram used for the pressure drop
measurement (b) Front panel view of the pressure drop measurement. ........................... 57
Figure 3.5: Image of a droplet touching the base GDL and the sidewall of a channel. This
shows the different contact lines the droplet makes with the different surfaces. Adapted
from [90] ........................................................................................................................... 60
Figure 4.1: Sequence image of a single droplet behavior inside a 30° open angle channel
made of polycarbonate sidewall and GDL base with 0.4 m/s air velocity introduced into
the channel from the air manifold. The red circle in the image shows that the droplet does
not fill the corner of the channel as the droplet makes its exit from the channel. ............ 64
Figure 4.2: Sequence image for the droplet dynamics in a 60° open angle channel made
of a polycarbonate sidewall and GDL base with 0.4 m/s air velocity introduced into the
channel from the air manifold. The red circle in the image shows that the corner of the
channel is completely filled. ............................................................................................. 65
Figure 4.3: Dynamic contact angles made by the droplet at an air velocity of 0.4 m/s with
the sidewall and the base GDL plotted against each other along with the theoretical CFL
line shown by solid line. The solid boxes in the plot show the angles that lead to the
- xv -
droplet filling the corner of the channel and the open box shows the angle showing
pinning of the droplet. For channel angle 30° and 45° the corner of the channel is not
filled and for channel angles 60° and 90° the corner of the channel is filled. .................. 67
Figure 4.4: Sequence image of the droplet interaction with the polycarbonate sidewall
and GDL base in a 50° open angle channel with 0.4 m/s air velocity introduced into the
channel. Red circle in the image shows the corner filling of the channel by the droplet. 69
Figure 4.5: Sequence image of the droplet interaction with the polycarbonate sidewall
and GDL base in a 50° open angle channel with 1.6 m/s air velocity introduced into the
channel. Red circle in the image shows that the droplet does not fill the corner of the
channel. ............................................................................................................................. 69
Figure 4.6: Dynamic contact angles made by the droplet in a 50° open angle channel
made up of polycarbonate sidewall and the base GDL plotted against each other along
with the theoretical CFL line shown by solid line at different air velocities a) 0.2 m/s and
b) 1.6 m/s .......................................................................................................................... 71
Figure 4.7: Length of the sidewall (Lexan length) and the length of the GDL (GDL
length) from the corner of the channel which was left non–wetted by the droplet at a
given instant of time.......................................................................................................... 71
Figure 4.8: Plot of non–wetted length of GDL and sidewall from the corner of the
channel for different channel angles as a function of air velocity. (a) 45° channel where
the droplet is pinned to the channel sidewall and does not fill the corner of the channel for
- xvi -
any air velocity (b) 60° channel where the droplet does not pin to the channel sidewall
and fills the corner of the channel for all air flow rates (c) 50° channel where for lower air
flow rates the droplet fills the corner of the channel (shown by red box) and for higher
flow rate the droplet remains pinned to the sidewall and doesn’t fill the channel corner
(shown by blue boxes). ..................................................................................................... 73
Figure 4.9: IDCA plot of a droplet on the MRC–105 GDL and polycarbonate sidewall in
a 50° channel at air velocities of (a) 0.2 m/s (b) 1.6 m/s. it is seen from the plot that the
IDCA of the base wall are within the Δθ range however, the IDCA of sidewall is above
the Δθ value. This shows that the air velocity in the channel produces oscillations in the
droplet, which changes the contact angle the droplet makes with the wall. ..................... 74
Figure 4.10: Plot of the peak differential pressure drop values across the droplet for
different channel angles as a function of air velocity. The dotted line shows the transition
in the flow pattern inside the gas channel from slug to film flow and the dot-dash line
shows the transition from the film to droplet flow observed in the channel through the
experimental data. ............................................................................................................. 77
Figure 4.11: Image sequence of the droplet interaction with the Stainless Steel (SS 2205)
sidewall and MRC–105 base in the 45° open angle channel with 1.6 m/s air velocity
inside the channel. The red circle in the image shows that the droplet does not fill the
channel corners. ................................................................................................................ 79
- xvii -
Figure 4.12. Plot of IDCA made by the droplet at different air velocities with the
Stainless Steel (SS-2205) sidewall and the MRC–105 GDL base for (a) a 45° open angle
channel and (b) a 50° open angle channel. ....................................................................... 80
Figure 4.13. Image sequence of the droplet interaction with the Stainless Steel (SS-2205)
sidewall and MRC–105 base in a 50° open angle channel with 1.6 m/s air velocity inside
the channel. The red circle in the image shows that the droplet did not fill the channel
corner. ............................................................................................................................... 81
Figure 4.14: Plot of IDCA made by the droplet with the graphite sidewall and the MRC-
105 GDL base for (a) 45° channel open angle and (b) 50° channel open angle at different
air velocities. Contact angle points fall above the CFL line showing that the corner should
not be filled for any air velocities. .................................................................................... 82
Figure 4.15: Peak pressure drop plot in the trapezoidal channel with different sidewall
materials (Cu-110, SS-2205 and graphite composite) and MRC–105 GDL base for (a) a
45° channel (b) a 50° channel ........................................................................................... 84
Figure 4.16: Water flow pattern in a 50° channel at different air velocities (a) 0.4 m/s –
slug flow (b) 1.6 m/s – film flow (c) 2.0 m/s – droplet flow ............................................ 85
Figure 4.17: Plot of IDCA made by the droplet with the polycarbonate sidewall and the
TGP–H–060 base for (a) a 45° channel and (b) a 50° channel at different air velocities . 87
Figure 4.18: Image sequence of the droplet interaction with the polycarbonate sidewall
and SGL–25BC base in the 50° open angle channel with 1.6 m/s air velocity. It was seen
- xviii -
from the images that the fiber entanglement pattern of the GDL has a significant impact
on the droplet dynamics in the gas channel. ..................................................................... 88
Figure 4.19: Plot of IDCA points made by the droplet for 50° open angle channel with the
polycarbonate sidewall and (a) SGL–25BC base at 0.2 m/s (b) SGL–25BC base at 1.6
m/s (c) MRC–105 base at 0.2 m/s and (d) MRC-105 base at 1.6 m/s. ............................. 90
Figure 4.20 Plot of peak differential pressure drop values across the droplet for different
GDL materials (SGL-25BC and TGP-H-060) in 45° and 50° open angle channels as a
function of air velocities. .................................................................................................. 91
Figure 4.21: Plot of IDCA made by the droplet in a 50° open angle channel at different
air velocities with the polycarbonate sidewall and (a) 40 hours run MRC–105 GDL and
(b) 125 hours run MRC–105 GDL ................................................................................... 94
Figure 4.22: Plot of peak differential pressure drop across a droplet in a 50° channel for
0, 40 and 125 hours run MRC-105 GDL .......................................................................... 95
Figure 4.23: Corner filling and non–filling behavior in different channel open angles
(90°, 50° and 45°) at different air velocities (a) 0.72 m/s (b) 3.85 m/s. For all air
velocities, droplet fills the channel corner in a 90° channel and does not fill the corner in
a 45° channel. In 50° channel, the droplet fills the channel corner at lower air velocities
and does not fill at higher air velocities. ........................................................................... 98
Figure 4.24: Image of a film and a slug flow from top view at air velocities of 0.72 m/s
and 3.85 m/s respectively in a (a) 90° channel and (b) 50° channel. ................................ 99
- xix -
Figure 4.25: Peak differential pressure drop in the 0.4 x 0.7 mm channel of different
channel open angle at different air velocities. The dotted line shows the transition in the
flow pattern from slug to film flow and the dot-dash line shows the transition in the flow
pattern from film to droplet flow through visual observation from the experimental data.
......................................................................................................................................... 102
Figure 4.26: : Sequence image of the droplet interaction with the polycarbonate sidewall
and GDL base in a 45° channel when the droplet is introduced near the sidewall (1 mm
away from the channel corner) at an air velocity of 0.4 m/s introduced in the channel. 103
Figure 4.27: Plot of the IDCA made by the droplet with the polycarbonate sidewall and
GDL base in a 45° channel when the droplet emerges near the channel corner. Here the
contact angle points fall below the CFL line and show corner filling behavior in the gas
channel. ........................................................................................................................... 104
Figure 4.28: Liquid wetting behavior on a groove chip (a) Droplet sitting on the air in the
channel area (Cassie-Baxter type wetting) (b) Droplet fills the channel area (Wenzel type
wetting) (c) Droplet transitions from Cassie to Wenzel wetting (Metastable state) ....... 106
Figure 4.29: Wettability transition from Wenzel to Cassie regime on a groove patterned
roughness as a function of scaling factor ........................................................................ 110
Figure 4.30: Contact angle measured on the groove chip surface as a function of scaling
factor. Wenzel wetting shows lower contact angle values compared to the chips showing
- xx -
Cassie wetting. Metastable state wetting chips shows the highest contact angle value. The
line shows the transition line between Wenzel and Cassie state contact angles. ............ 111
Figure 4.31 (a) Groove pattern design on the sidewalls of the PEMFC gas channel (b)
Experimental image of the grooves on the channel sidewall used for experiments. ...... 112
Figure 4.32: Image sequence showing the liquid water growth on the groove pattern in
the PEMFC gas channel .................................................................................................. 113
Figure 5.1: Image sequence of the droplet jumping to the sidewall in a 50° channel made
of a polycarbonate sidewall and SGL–25BC GDL. ........................................................ 116
Figure 5.2: Description of the different contact lengths and contact angles made by the
droplet with the base wall just before it jumped to the sidewall. .................................... 117
Figure 5.3: (a) Image of a droplet right before it jumps to the sidewall (b) Image of a
droplet hanging from the sidewall right after it jumped. Point D is the midpoint of where
the droplet hangs after it jumps to the sidewall .............................................................. 120
Figure 5.4: Representation of a droplet having the maximum radius (𝑅𝐶2) while hanging
from the sidewall such that the droplet just touches the base of the channel. It is assumed
that the droplet is a part of a sphere and also neglecting the gravitational effect on the
droplet since the droplet sizes used are very small. ........................................................ 122
Figure 5.5: Graphical representation of the proposed criterion to predict the droplet
jumping behavior in a PEMFC gas channel. The experimental points falling below the
proposed criterion shown by a dashed line, led to droplet jumping. Droplet transition
- xxi -
from non–filling to filling of the channel corner based on the Concus–Finn condition is
plotted by the dot–dash line. Any points falling on the right side of the dot–dash line
showed corner filling of the channel and points falling on the left side of the dot–dash
line showed no corner filling behavior by the droplet. 96% of the experimental data
matched the theoretically predicted behavior. ................................................................ 134
Figure 5.6: Image sequence for a SGL–25BC base and aluminum sidewall showing
droplet jumping behavior in a 45° channel. The droplet radius 𝑅2 while hanging from the
sidewall is greater than maximum radius that droplet could have while hanging from
sidewall (𝑅𝐶2) which leads to bridging between the base and sidewall. ........................ 136
Figure 5.7: Pressure drop surface curve in the gas channel as a function of channel open
angle and air velocities for corner filling cases .............................................................. 141
Figure 5.8: Pressure drop surface curve in the gas channel as a function of channel open
angle and air velocities for corner non–filling cases ...................................................... 142
Figure 5.9: Image of a droplet sliding on the GDL and getting removed from the 50°
channel without touching the walls of the channel ......................................................... 144
Figure 5.10: Representation of different forces acting on a droplet inside a PEMFC gas
channel ............................................................................................................................ 145
Figure 5.11: Representation of a droplet seen from the front view used for calculating the
area on which the drag force is being applied ................................................................. 147
- xxii -
Figure 5.12: Surface plot of K value as a function of superficial air velocity and sin (2α)
for different GDL material (a) MRC-105 (b) SGL-25BC (c) TGP-H-060. .................... 152
Figure 5.13: K values plotted for different GDL materials as a function of (a) air velocity
and (b) channel angle ...................................................................................................... 153
Figure 5.14: K values found for different GDL materials based on experimental data and
from theoretical prediction. The black line in the plot indicates the 12% error boundary.
The data points fall within the 12% error boundary between the experimental and
theoretical prediction. ..................................................................................................... 154
- xxiii -
LIST OF TABLES
Table I: Surface roughness measured for the different sidewall materials used. .............. 51
Table II: Air velocities with corresponding current densities calculated for a channel
active area of 18.4 cm2 ...................................................................................................... 54
Table III: Static advancing, receding contact angles and contact angle hysteresis of
sidewall and GDL materials.............................................................................................. 58
Table IV: Transition angles from non–filling to filling for a given material pair ............ 61
Table V: Contact angle measurements on GDLs that were run for longer hours ............. 93
Table VI: Air velocities corresponding to the current densities and stoich with their
respective Re ..................................................................................................................... 97
Table VII: Liquid flow pattern and channel blockage percentage in the PEMFC gas
channel as a function of air velocity ............................................................................... 100
Table VIII: Dimensions of different groove roughness patterns on the silicon chip ...... 108
Table IX: Effect of scaling factor (S) on wettability transition and the contact angle on
grooved roughness surface .............................................................................................. 109
Table X: Transition angles calculated using Concus–Finn condition for different material
pairs used for the base and sidewall of the channel ........................................................ 125
- xxiv -
Table XI: Comparison of the experimental results for corner filling and non–filling with
the Concus–Finn condition ............................................................................................. 126
Table XII: Different energies associated with the droplet while jumping to the sidewall
......................................................................................................................................... 139
- xxv -
NOMENCLATURE
English
PWheel Power delivered to the wheel of the vehicle
PCell Power generated by the fuel cell stack
PAuxiliary Power required for powering the auxiliary units
r Roughness factor
fi Area fraction of material ‘i’
Bo Bond number
D Diameter of a pipe
g Gravity
Re Reynolds number
v Air velocity
i Current density
S Scaling factor
H Height of the grooves
W Width of the grooves
𝑅𝐶1 Maximum radius of the droplet before touching the
sidewall
- xxvi -
𝑅𝐶2 Maximum radius of the droplet before touching the base
while hanging from the sidewall
R2 Actual droplet radius as it hangs from the sidewall
a Droplet emergence location from the channel corner
x Distance from the channel corner where droplet contacts
the sidewall
V1 Volume of the droplet before jumping to the sidewall
V2 Volume of the droplet right after it jumps to the sidewall
Go Gibbs free energy when droplet sits on the base
EGravity Energy required by the droplet to move against gravity
(Potential energy)
ΔP Pressure drop
M Mach number
FD Drag force
FS Surface tension force
A Area of the droplet
CD Drag coefficient
2d Width of the contact line of the droplet
K Rectification factor
- xxvii -
RH Relative humidity
n Number of moles of a molecule
F Faraday’s constant
Qg Water generation rate
𝑀𝑊 Molecular weight of a substance
𝑄 ̇ Airflow rate
U Uncertainty
Lw Land width
Cw Channel width
LC Channel length
Greek
σ Surface tension
θ Equilibrium contact angle
Δθ Contact angle hysteresis
2α Channel open angle or corner angle
ρ Fluid density
- xxviii -
Subscripts
L Liquid phase of a droplet
S Solid phase of substrate
V Vapor/gas phase of a substrate
LV Liquid-vapor interface
SV Solid-vapor interface
SL Solid-liquid interface
B Channel Base
W Channel sidewall
A Advancing
R Receding
r Rough surface
c Composite surface
C Channel
- xxix -
Abbreviations
OECD Organization for economic co–operation and development
PEMFC Proton exchange membrane fuel cell
IC Internal combustion
NMR Nuclear magnetic resonance
MRI Magnetic resonance imaging
GDL Gas diffusion layer
SGL Sigracet
MRC Mitsubishi rayon corporation carbon paper
TGP Toray paper (Teflon coated carbon fiber)
GDM Gas diffusion media
CL Contact line
CF Carbon fiber
MEA Membrane electrode assembly
MPL Microporous layer
CB Cassie–Baxter
CW Cassie–Wenzel transition
NIST National institute of standards and technology
- xxx -
PTFE Polytetrafluoroethylene
CFD Computational fluid dynamics
CLSM Confocal laser scanning microscope
LCL Lower contact line
ICL Inner contact line
UCL Upper contact line
IDCA Instantaneous dynamic contact angle
CFL Concus–Finn limit
- 1 -
Chapter 1 Introduction
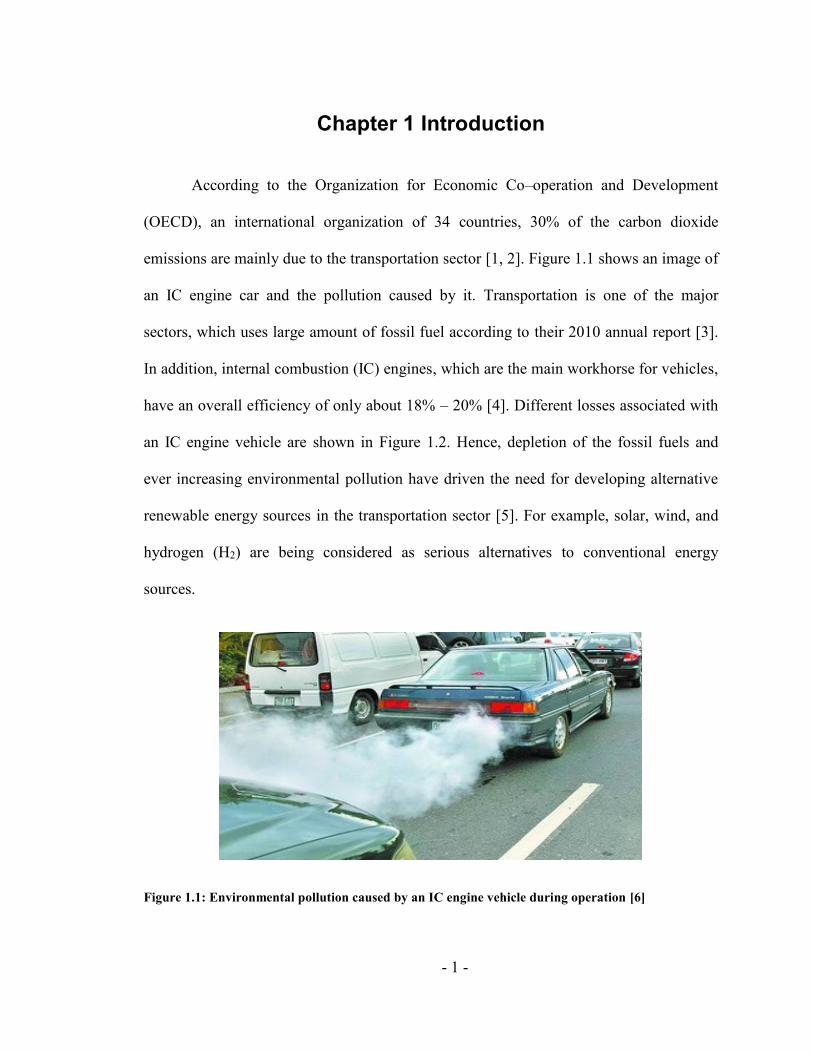
According to the Organization for Economic Co–operation and Development
(OECD), an international organization of 34 countries, 30% of the carbon dioxide
emissions are mainly due to the transportation sector [1, 2]. Figure 1.1 shows an image of
an IC engine car and the pollution caused by it. Transportation is one of the major
sectors, which uses large amount of fossil fuel according to their 2010 annual report [3].
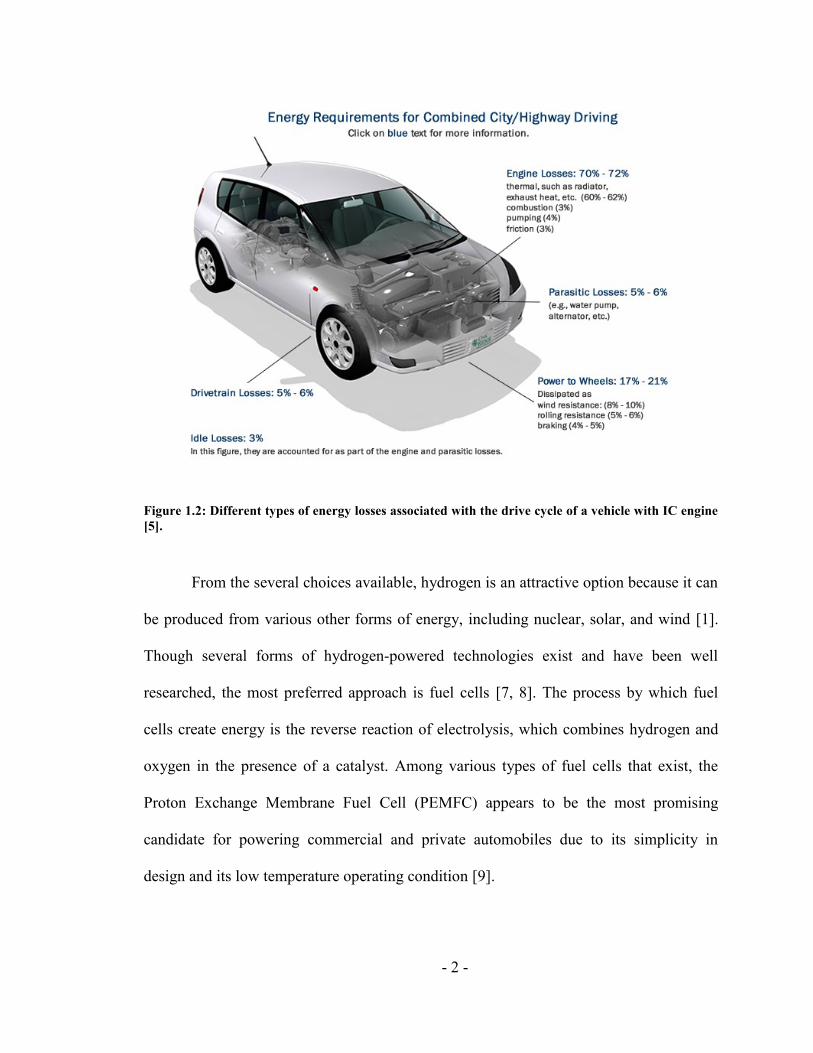
In addition, internal combustion (IC) engines, which are the main workhorse for vehicles,
have an overall efficiency of only about 18% – 20% [4]. Different losses associated with
an IC engine vehicle are shown in Figure 1.2. Hence, depletion of the fossil fuels and
ever increasing environmental pollution have driven the need for developing alternative
renewable energy sources in the transportation sector [5]. For example, solar, wind, and
hydrogen (H2) are being considered as serious alternatives to conventional energy
sources.
Figure 1.1: Environmental pollution caused by an IC engine vehicle during operation [6]
- 2 -
Figure 1.2: Different types of energy losses associated with the drive cycle of a vehicle with IC engine
[5].
From the several choices available, hydrogen is an attractive option because it can
be produced from various other forms of energy, including nuclear, solar, and wind [1].
Though several forms of hydrogen-powered technologies exist and have been well
researched, the most preferred approach is fuel cells [7, 8]. The process by which fuel
cells create energy is the reverse reaction of electrolysis, which combines hydrogen and
oxygen in the presence of a catalyst. Among various types of fuel cells that exist, the
Proton Exchange Membrane Fuel Cell (PEMFC) appears to be the most promising
candidate for powering commercial and private automobiles due to its simplicity in
design and its low temperature operating condition [9].
- 3 -
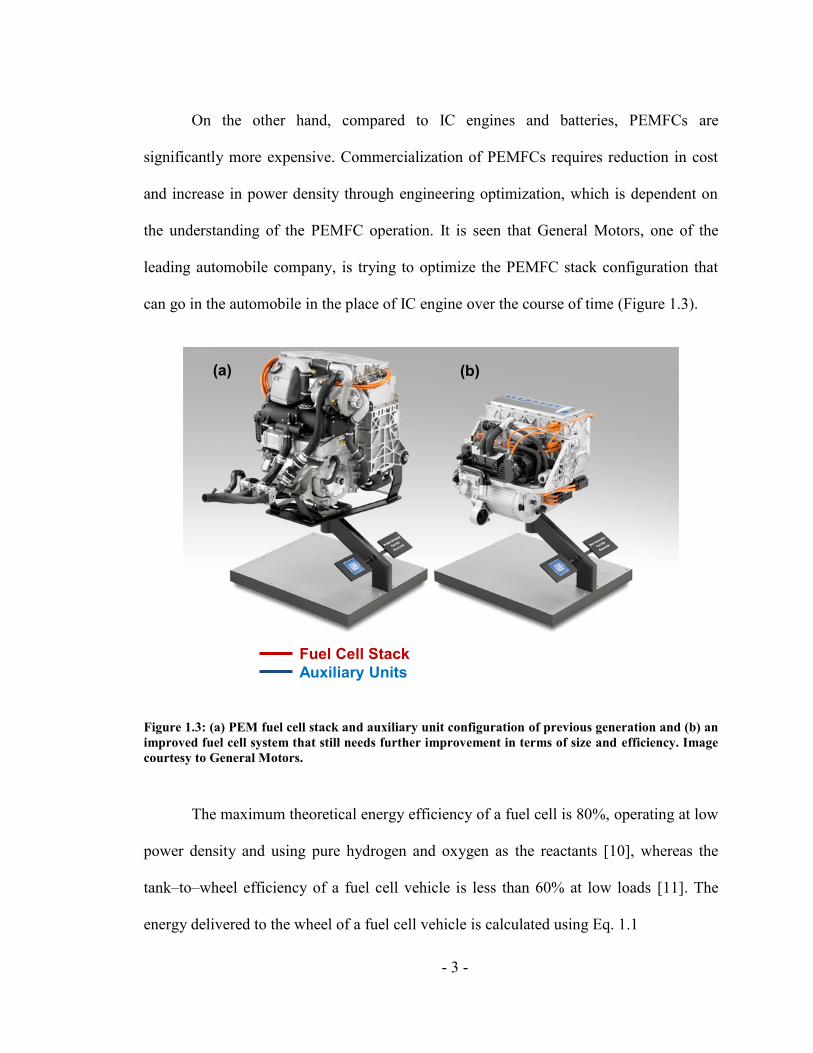
On the other hand, compared to IC engines and batteries, PEMFCs are
significantly more expensive. Commercialization of PEMFCs requires reduction in cost
and increase in power density through engineering optimization, which is dependent on
the understanding of the PEMFC operation. It is seen that General Motors, one of the
leading automobile company, is trying to optimize the PEMFC stack configuration that
can go in the automobile in the place of IC engine over the course of time (Figure 1.3).
Figure 1.3: (a) PEM fuel cell stack and auxiliary unit configuration of previous generation and (b) an
improved fuel cell system that still needs further improvement in terms of size and efficiency. Image
courtesy to General Motors.
The maximum theoretical energy efficiency of a fuel cell is 80%, operating at low
power density and using pure hydrogen and oxygen as the reactants [10], whereas the
tank–to–wheel efficiency of a fuel cell vehicle is less than 60% at low loads [11]. The
energy delivered to the wheel of a fuel cell vehicle is calculated using Eq. 1.1
Fuel Cell Stack
Auxiliary Units
(a) (b)
- 4 -
𝑃𝑊ℎ𝑒𝑒𝑙 = 𝑃𝐶𝑒𝑙𝑙 − 𝑃 𝐴𝑢𝑥𝑖𝑙𝑖𝑎𝑟𝑦 [1.1]
where, 𝑃𝑊ℎ𝑒𝑒𝑙— Power delivered to the wheel of the vehicle
𝑃𝐶𝑒𝑙𝑙— Power generated by the fuel cell stack
𝑃 𝐴𝑢𝑥𝑖𝑙𝑖𝑎𝑟𝑦 — Power required for powering the auxiliary units
A fuel cell auxiliary unit is comprised of pumps, blowers, controllers, and
compressors. Therefore, to design fuel cells with high efficiency, the internal processes
must be optimized. Some of the key parameters include the fluid flow distribution, the
local current density, reduction in the excess air required to remove the liquid water in the
gas channel and so forth. To get into more detail, one needs to first understand the basic
functioning of the PEMFC.
1.1 Proton Exchange Membrane Fuel Cells
A fuel cell in general consists of three main parts – anode, cathode and membrane
– as shown in Figure 1.4. The anode, where the electrons are produced, is mainly
responsible for the oxidation reaction of the hydrogen molecules and release of protons
and electrons. The humidified hydrogen gas (H2 and water vapor) enters the anode
channel and the hydrogen diffuses through the porous anode Gas Diffusion Layer (GDL)
to the catalyst layer where it splits into protons and electrons. At the anode catalyst layer,
the following electrochemical reaction takes place:
𝐻2 → 2𝐻+ + 2𝑒− [1.2]
- 5 -
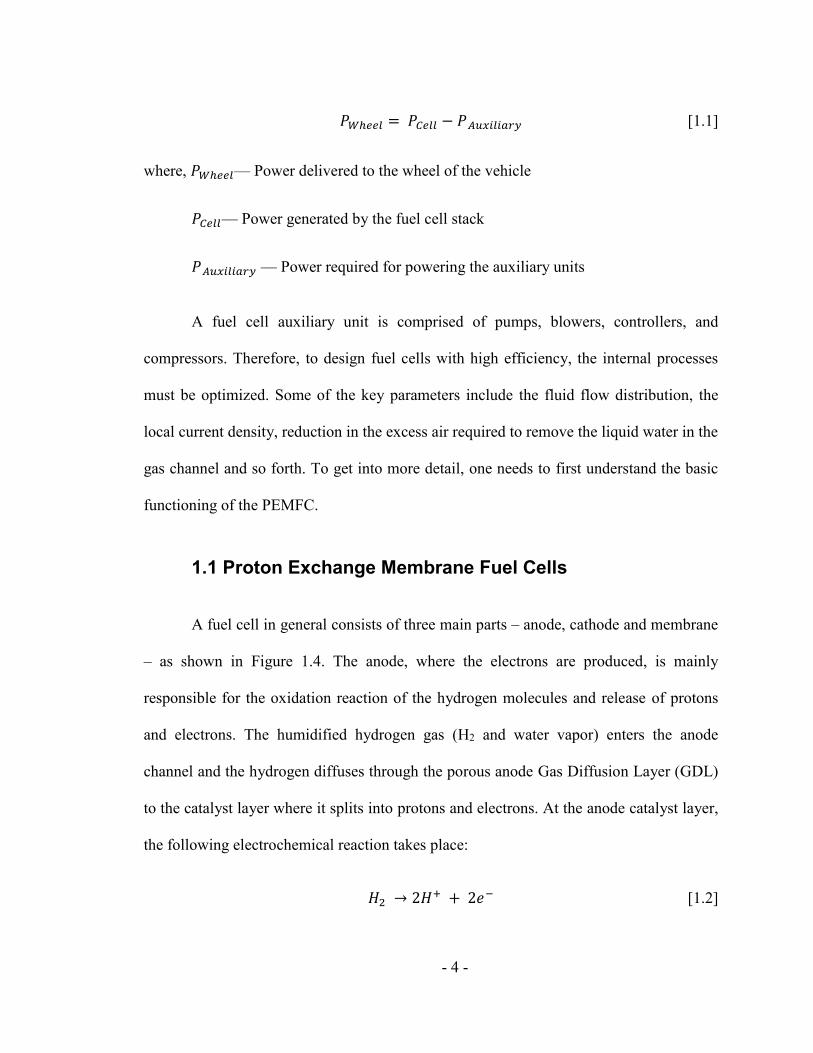
Figure 1.4: Schematic of a proton exchange membrane fuel cell (PEMFC). Adapted from [12].
The membrane located between the cathode and the anode allows only proton
conduction to occur, while the electrons are blocked from crossing over, and hence it is
called a Proton Exchange Membrane (PEM). The protons move through the membrane to
the cathode side while the electrons move through the outer circuit to generate power.
The cathode end also has a bipolar plate that has gas channels etched on it for effective
distribution of oxygen molecules over the catalyst surface. At this end, humidified air
enters the cathode channel and the oxygen diffuses through the porous cathode GDL to
- 6 -
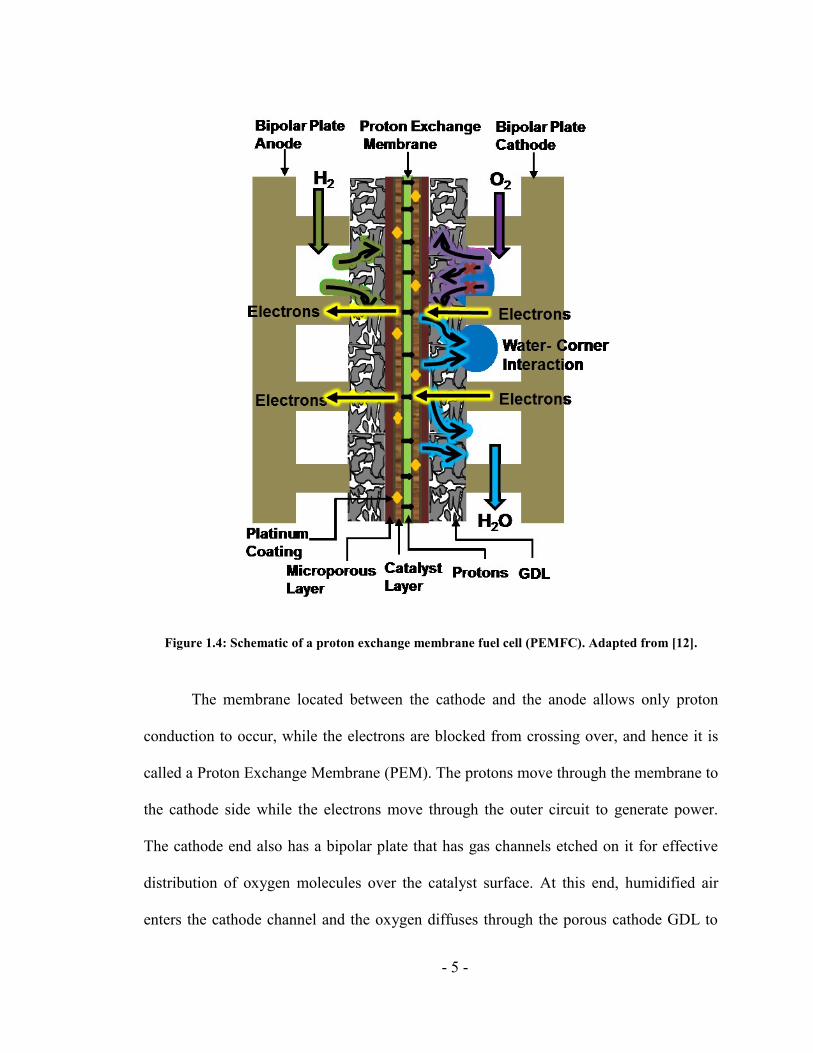
the reaction sites (cathode catalyst layer). A reduction reaction takes place at the cathode
catalyst layer producing water and heat as a byproduct that needs to be removed. Eq. 1.3
gives the reduction reaction.
1
2𝑂2 + 2𝐻+ + 2𝑒− → 𝐻2 𝑂 + 𝐻𝑒𝑎𝑡 [1.3]
The PEM needs to be hydrated for the conduction of positively charged ions, in
this case the protons to the cathode. In addition, the special membrane is coated with a
catalyst which allows the oxygen and hydrogen reaction to take place in the fuel cell. The
catalyst layer contains platinum nanoparticles lightly coated onto the carbon membrane
and is rough and porous so that the maximum surface area of the platinum can be
exposed to the hydrogen or oxygen [11, 13, 14].
A detailed description of each component of the PEMFC is given in the following
sections to understand the system better. The innermost layer of the PEMFC is a proton
exchange membrane. Next to the membrane where all the reduction and oxidation
reactions occur is the catalyst layer.
1.1.1 Catalyst Layer
Although the catalyst layer is the thinnest part of a PEMFC, it is the key
component for the fuel cell energy conversion. This is the layer where the fuel and the
oxidant react electrochemically to produce electrical work. The electrochemical reactions
in PEMFCs occur slowly, especially on the cathode side. In order to increase the reaction
rates, the catalyst, usually consisting of small particles of platinum supported on larger
- 7 -
carbon particles, must be coated either on the surfaces of the carbon support media or
directly on the surfaces of the membrane [14]. These carbon particles have to be mixed
with some electrolyte material to ensure that the proton can migrate towards the reaction
site. The composition, morphology, and thickness of catalyst layer are key parameters in
optimizing the fuel cell performance and reducing the cost. The next layer adjacent to the
catalyst is the gas diffusion media.
1.1.2 Gas Diffusion Media (GDM)
The GDM consists of the gas transport substrate that serves the purposes of
current collection and gas transport medium. It is most commonly known as the Gas
Diffusion Layer (GDL). GDLs are characterized mainly by their thickness (between 100
μm and 300 μm) and their porosity. A microporous layer (MPL) is added to one side of
the GDL (facing the catalyst layer, to achieve better water management. The assembly of
the membrane, the catalyst layer and the GDL is termed as the Membrane Electrode
Assembly (MEA).
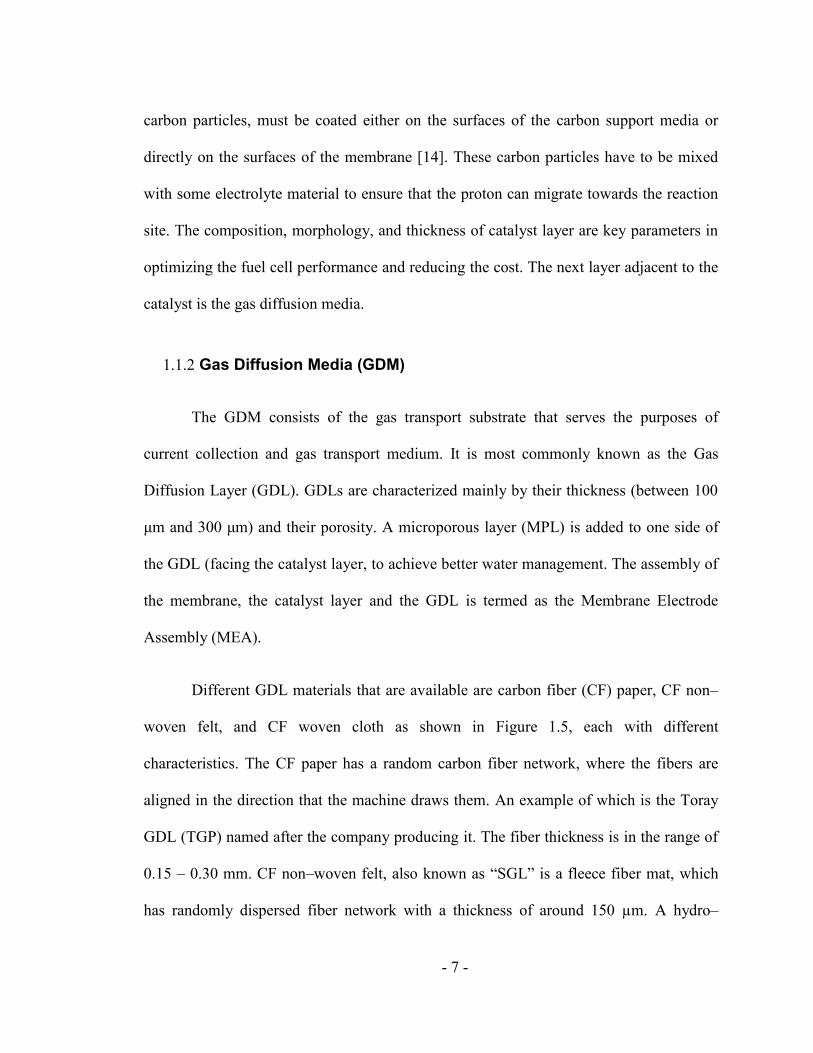
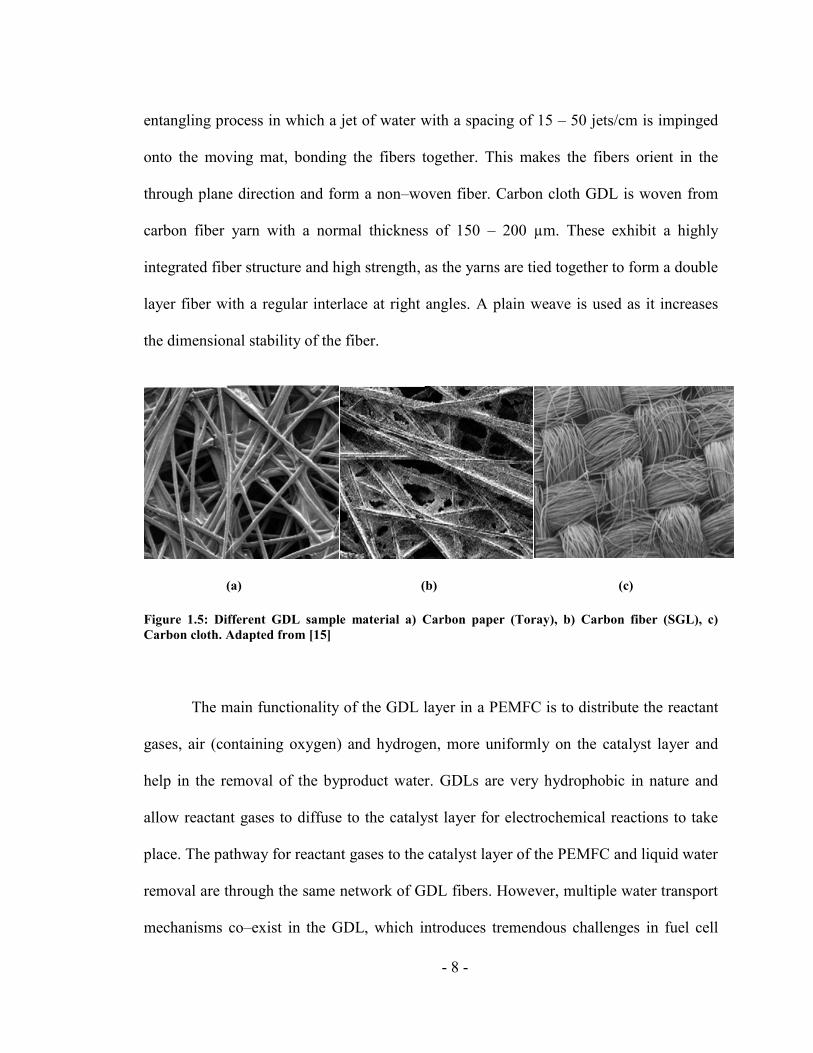
Different GDL materials that are available are carbon fiber (CF) paper, CF non–
woven felt, and CF woven cloth as shown in Figure 1.5, each with different
characteristics. The CF paper has a random carbon fiber network, where the fibers are
aligned in the direction that the machine draws them. An example of which is the Toray
GDL (TGP) named after the company producing it. The fiber thickness is in the range of
0.15 – 0.30 mm. CF non–woven felt, also known as “SGL” is a fleece fiber mat, which
has randomly dispersed fiber network with a thickness of around 150 µm. A hydro–
- 8 -
entangling process in which a jet of water with a spacing of 15 – 50 jets/cm is impinged
onto the moving mat, bonding the fibers together. This makes the fibers orient in the
through plane direction and form a non–woven fiber. Carbon cloth GDL is woven from
carbon fiber yarn with a normal thickness of 150 – 200 µm. These exhibit a highly
integrated fiber structure and high strength, as the yarns are tied together to form a double
layer fiber with a regular interlace at right angles. A plain weave is used as it increases
the dimensional stability of the fiber.
(a) (b) (c)
Figure 1.5: Different GDL sample material a) Carbon paper (Toray), b) Carbon fiber (SGL), c)
Carbon cloth. Adapted from [15]
The main functionality of the GDL layer in a PEMFC is to distribute the reactant
gases, air (containing oxygen) and hydrogen, more uniformly on the catalyst layer and
help in the removal of the byproduct water. GDLs are very hydrophobic in nature and
allow reactant gases to diffuse to the catalyst layer for electrochemical reactions to take
place. The pathway for reactant gases to the catalyst layer of the PEMFC and liquid water
removal are through the same network of GDL fibers. However, multiple water transport
mechanisms co–exist in the GDL, which introduces tremendous challenges in fuel cell
- 9 -
engineering, since a proper water balance must be maintained under complicated
operating conditions. Accumulation of liquid water on the GDL surface in a channel
hinders reactant flow toward the reaction sites. Inefficient removal of liquid water leads
to flooding of the catalyst layer. This causes localized fuel starvation, which in turn
adversely affects the efficiency of the system [15]. Under freezing conditions, the
accumulated liquid water leads to channel blockage and GDL degradation, which lowers
the system output. However, the PEM also needs to be hydrated to conduct protons from
the anode to the cathode side. Starvation of water in the system also leads to loss of
performance [16]. Hence, efficient water management in fuel cells is one of the major
requirements to ensure proper operation and improved performance of the system, which
forms the major motivation for our work.
The component that comes after the GDL is the bipolar plate. This plate acts as a
compression plate over the GDL.
1.1.3 Bipolar Plates
The purpose of the bipolar plate is to provide electrical connectivity between
neighboring cells and to feed reactant gases to the gas diffusion electrodes. It also acts as
a layer that separates different cells in a fuel cell stack. It is called a unipolar plate for a
single cell [16]. Besides maintaining a good electrical contact between the bipolar plates
and the GDL, a very important parameter to improve the fuel cell performance is to
minimize the electrical contact resistance, which leads to the ohmic losses. As the fuel
cell industry is growing, the materials used for the bipolar plates are progressively
- 10 -
changing according to the need desired. Different materials used for bipolar plates are
gold plated copper, graphite and more recently, stainless steel.
As we have discussed the different components of a PEMFC and its working, the
next section will highlight the PEMFC performance when all the above components are
packaged together and run as an electricity generating device. This section will discuss
some of the major losses that occur during PEMFC operation.
1.1.4 PEMFC Performance
The I–V curve, or polarization curve, as shown in Figure 1.6 gives the performance of a
low temperature PEMFC. The electric potential of the PEMFC at open circuit (no load
connected) is termed as the reversible cell potential. This is the maximum theoretical
electrical potential that could be achieved for the PEMFC. Reversible cell potential is
mathematically described by the Nernst Eq. under the condition of thermodynamic
equilibrium [17]. However, the electric potential achieved when the load is connected is
always less than the reversible cell potential. This reduction in the potential can be
attributed to the different losses that occur during the operation. These losses are
explained in detail below.
- 11 -
Figure 1.6: I–V Curve of a PEMFC showing the different losses that occur during the working cycle
that affect the fuel cell’s performance. Adapted from [18].
1) Fuel Crossover – The PEM ideally allows only protons to pass through it.
However, the hydrogen species at the anode side diffuses across the membrane and
combines with the oxygen at the cathode side. This is known as fuel crossover and this
fuel is consumed without producing any useful electrical power.
2) Activation Loss – Activation losses in a system are mainly due to the slow
reactions on the surface of the electrode. In a PEMFC, the activation losses occur mainly
on the cathode side since the exchange current density of the anode reaction is several
orders of magnitude higher than that of the cathode reaction.
Ce
ll V
olt
age
(V
)
- 12 -
3) Ohmic Loss – Resistance posed by the membrane to proton transport and
sometimes the electrical resistances of the assembly are termed as ohmic losses.
4) Mass Transport Loss – Mass transport or concentration losses are caused by the
reduction of the reactant concentration at the electrode surface due to consumption of the
reactants. Usually, these losses are significant when the cell is working at a relatively
high current density.
Some of these losses in the cell are due to poor water and heat management in the
fuel cell. In order to increase the fuel cell’s performance, an in depth understanding of
these aspects is required. As this dissertation mainly deals with the water management
aspect of the fuel cell, issues in the water management of PEMFC are described in detail
in the next section.
1.2 Water Management in PEMFC
Intertwined with each of the challenges mentioned above is the issue of water
management in PEMFCs. The presence of water inside the fuel cell is necessary to
hydrate the PEM. Various alternatives to Nafion that may be cheaper, more durable, or
thinner still require hydration to operate well [19]. Working of the fuel cell is by the
conduction of protons through the membrane from the anode side to the cathode while
driving electrons through the external circuit. Useful work done by the cell depends on
the amount of electron flow in the system. The flow of electrons around the circuit is
equivalent to the conduction of protons through the membrane. However, the conduction
of protons is dependent on the water activity in the membrane. A highly hydrated
- 13 -
membrane causes too much water generation at the cathode side that leads to the gas
channel flooding if not removed efficiently. To achieve efficient removal of the liquid
from the gas channel, more power is supplied to the blowers to provide excess gas flow
in the cathode channel. In contrast, when a fuel cell is designed to run at operating
conditions that remove too much water from the system, external humidification feed is
necessary to keep the membrane hydrated, which increases the cost and complexity of the
system [20]. With more careful system designs, the membrane can absorb the water
produced by the electrochemical reaction and extra humidification may not be needed.
However, under normal operating conditions, water production can be substantial
enough to saturate the fuel cell and cause accumulation of liquid water. The liquid water
is problematic, as it can block the reactants from reaching the catalyst and hurt the fuel
cells performance. Furthermore, very high potential gradients can be created with areas of
local reactant starvation caused by liquid water blockages, and the degradation of the
catalyst material can also be accelerated.
The most common solution for removing the excess water is to increase the flow
rates of the gas and simply blow the liquid out of the channels. In order to do this, the
reactant supply needs to be increased, which complicates the problem, as it requires extra
pumping, fuel recycling, and humidification. This increases the system cost and
complexity along with the consumption of extra power for the auxiliary systems and the
overall size of the cell.
- 14 -
Engineering the fuel cell for effective removal of liquid from the gas channels is a
much better approach to resolve these issues. Lower gas flow could be used to eliminate
the need for excess gas flow in the channel and the external humidification and recycling
unit. The ability to make significant improvements over the conventional fuel cell gas
channel designs requires (1) a thorough understanding of the fundamental physics of
liquid behavior on the GDL and the channel surface at different operating conditions and
(2) understanding the effect of channel geometry on the water removal from the gas
channel. This forms the major motivation of this dissertation.
1.3 Document Overview
The remainder of the dissertation is organized as follows. Chapter 2 provides a
detailed literature review of past research that relates to the water management aspects of
a fuel cell. This section also describes the physical theories involved in the liquid water
behavior on a given surface. In addition, some of the designs for different gas channel
geometry and their effect on fuel cell efficiency are presented in this chapter. Chapter 3
defines the objectives of this dissertation along with the description of the experimental
setup and the equipment used to conduct the experiments. This section also describes the
manufacturing process and the different test conditions used to perform the experiments.
Subsequently, Chapter 4 presents the experimental results to illustrate the effect of
different parameters analyzed on the liquid water behavior in the PEMFC gas channels.
Chapter 5 describes the theoretical models explaining the results obtained with the
experiments in Chapter 4 and provides a correlation to understand the droplet dynamics
- 15 -
in the absence and presence of airflow in the gas channels. Chapter 6 provides a
conclusion and key points of the research work performed for this dissertation. Finally,
Chapter 7 brings out the different areas this research work can be extended to help in
understanding fuel cell performance and improves it.
- 16 -
Chapter 2 Literature Review and Motivation
Water management is an important performance limiting concern for the
operation and optimization of the PEMFCs. Efficiency of the PEMFC system depends
upon various factors that affect the cathodic reaction rate [12, 21-25] such as
(a) The proton permeation from anode to cathode
(b) Liquid water presence in the GDL and the gas channels
(c) Blockage of the reactant gas flow to the catalyst sites by liquid water.
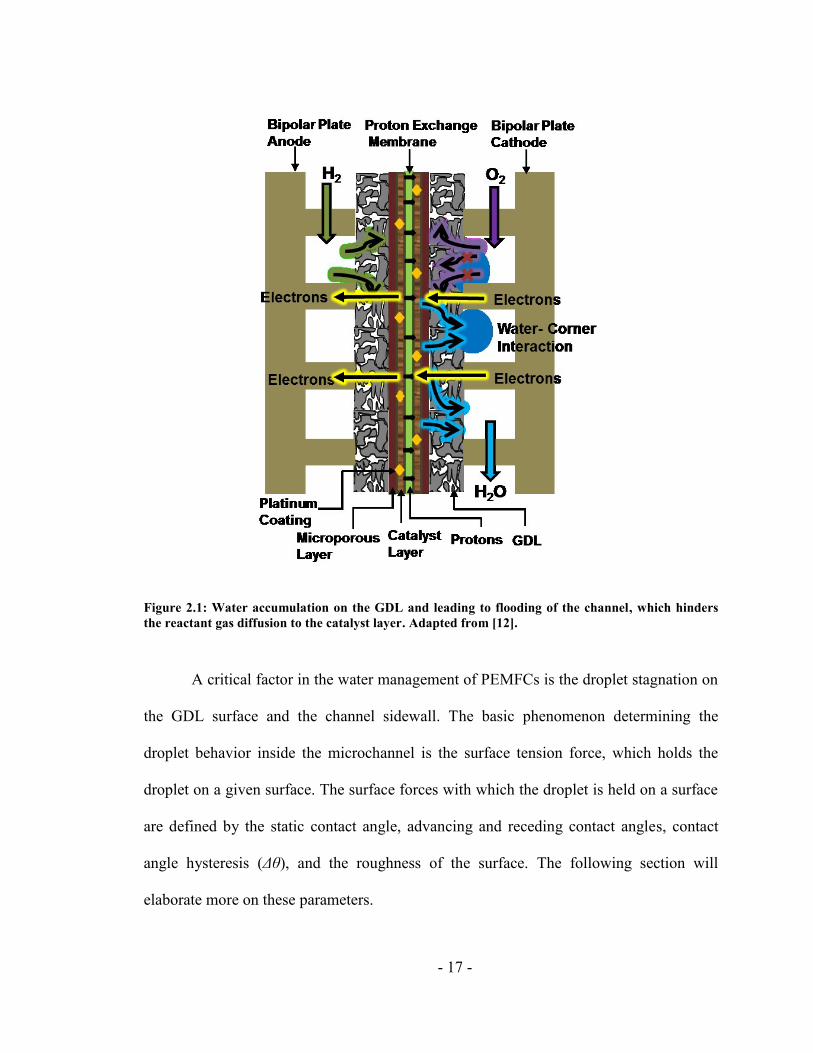
Figure 2.1 shows the blockage of a gas channel by water and its effect on the
PEMFC’s efficiency. One of the main reasons for liquid flooding in the gas channel and
high pressure drop in the system are the surface tension forces acting in the channel [26].
Apart from this, liquid water hold up in the gas channel is also dependent on the gas
channel geometry and the material used for the gas channel and the GDL. Previously,
many researchers have worked on the water management issue in the gas channel of
PEMFC in both in situ and ex situ to understand the main reasons for channel flooding
and high pressure drop in the cell. Yet the optimal design of the gas channel needs further
understanding in terms of the effect of surface tension forces on liquid water, channel
geometry’s effect on gas transport resistance, and the water interaction pattern with the
channel walls in the presence of gas flow. Therefore, the work presented in this
dissertation uses experimental and theoretical methods to study the physics of droplet
behavior in geometries common to practical fuel cells, which is critical to their
performance.
- 17 -
Figure 2.1: Water accumulation on the GDL and leading to flooding of the channel, which hinders
the reactant gas diffusion to the catalyst layer. Adapted from [12].
A critical factor in the water management of PEMFCs is the droplet stagnation on
the GDL surface and the channel sidewall. The basic phenomenon determining the
droplet behavior inside the microchannel is the surface tension force, which holds the
droplet on a given surface. The surface forces with which the droplet is held on a surface
are defined by the static contact angle, advancing and receding contact angles, contact
angle hysteresis (Δθ), and the roughness of the surface. The following section will
elaborate more on these parameters.
- 18 -
2.1 Contact Angle
Contact angle is a quantitative measure of the wetting of a solid surface by a liquid.
The theoretical prediction of the contact angle arises from the consideration of
a thermodynamic equilibrium between the three phases: the liquid phase of the droplet
(L), the solid phase of the substrate (S), and the gas/vapor phase of the atmosphere (V).
The gas phase could also be another (immiscible) liquid phase. At equilibrium, the net
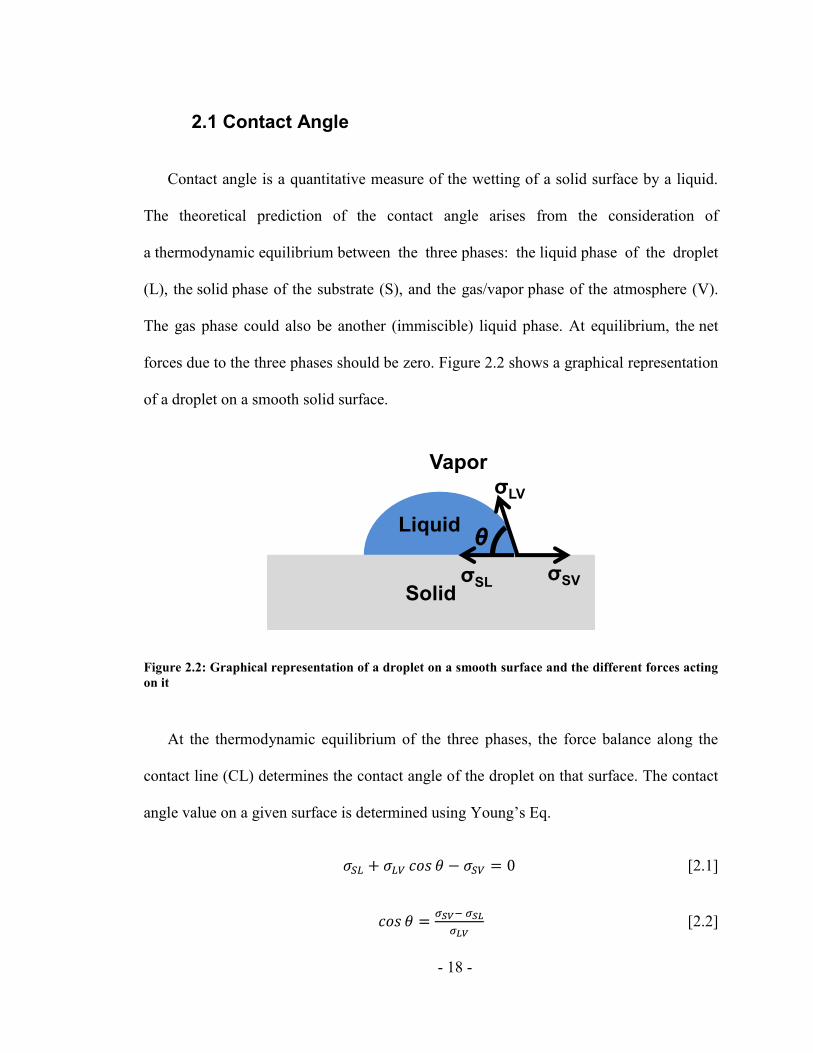
forces due to the three phases should be zero. Figure 2.2 shows a graphical representation
of a droplet on a smooth solid surface.
Figure 2.2: Graphical representation of a droplet on a smooth surface and the different forces acting
on it
At the thermodynamic equilibrium of the three phases, the force balance along the
contact line (CL) determines the contact angle of the droplet on that surface. The contact
angle value on a given surface is determined using Young’s Eq.
𝜎𝑆𝐿 + 𝜎𝐿𝑉 𝑐𝑜𝑠 𝜃 − 𝜎𝑆𝑉 = 0 [2.1]
𝑐𝑜𝑠 𝜃 =𝜎𝑆𝑉− 𝜎𝑆𝐿
𝜎𝐿𝑉 [2.2]
Solid
σLV
σSVσSL
θ
Vapor
Liquid
- 19 -
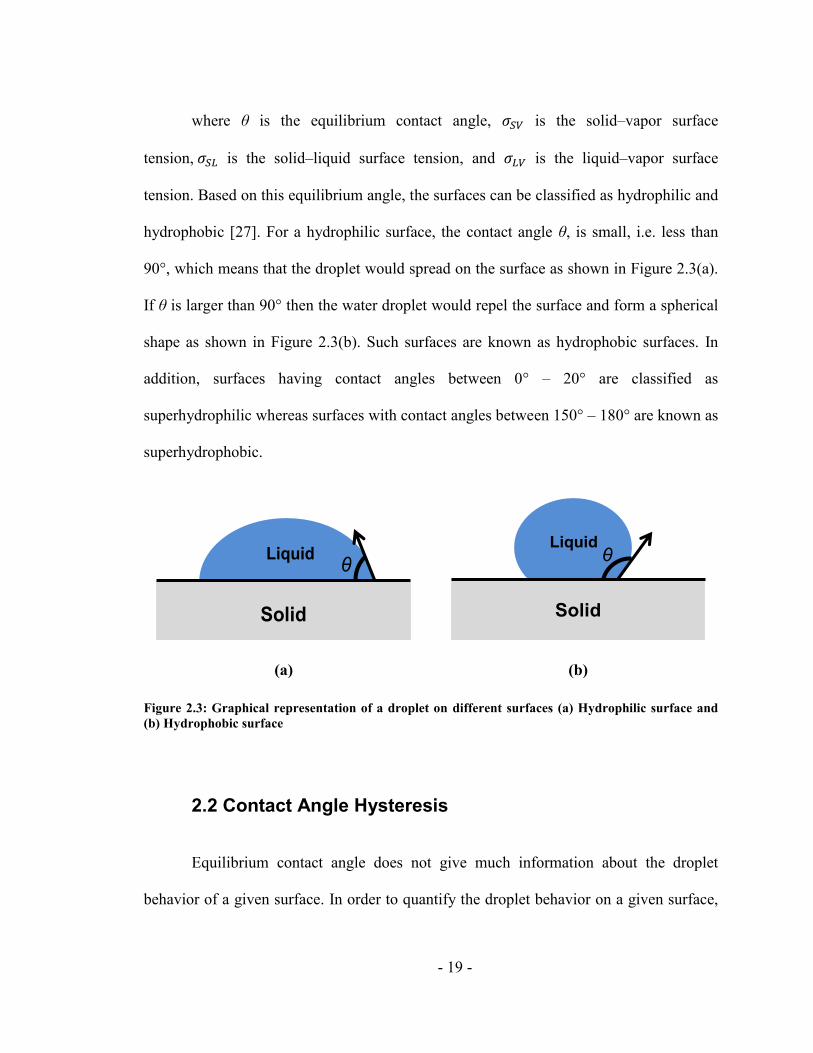
where θ is the equilibrium contact angle, 𝜎𝑆𝑉 is the solid–vapor surface
tension, 𝜎𝑆𝐿 is the solid–liquid surface tension, and 𝜎𝐿𝑉 is the liquid–vapor surface
tension. Based on this equilibrium angle, the surfaces can be classified as hydrophilic and
hydrophobic [27]. For a hydrophilic surface, the contact angle θ, is small, i.e. less than
90°, which means that the droplet would spread on the surface as shown in Figure 2.3(a).
If θ is larger than 90° then the water droplet would repel the surface and form a spherical
shape as shown in Figure 2.3(b). Such surfaces are known as hydrophobic surfaces. In
addition, surfaces having contact angles between 0° – 20° are classified as
superhydrophilic whereas surfaces with contact angles between 150° – 180° are known as
superhydrophobic.
(a) (b)
Figure 2.3: Graphical representation of a droplet on different surfaces (a) Hydrophilic surface and
(b) Hydrophobic surface
2.2 Contact Angle Hysteresis
Equilibrium contact angle does not give much information about the droplet
behavior of a given surface. In order to quantify the droplet behavior on a given surface,
Solid
θLiquid
Solid
θLiquid
- 20 -
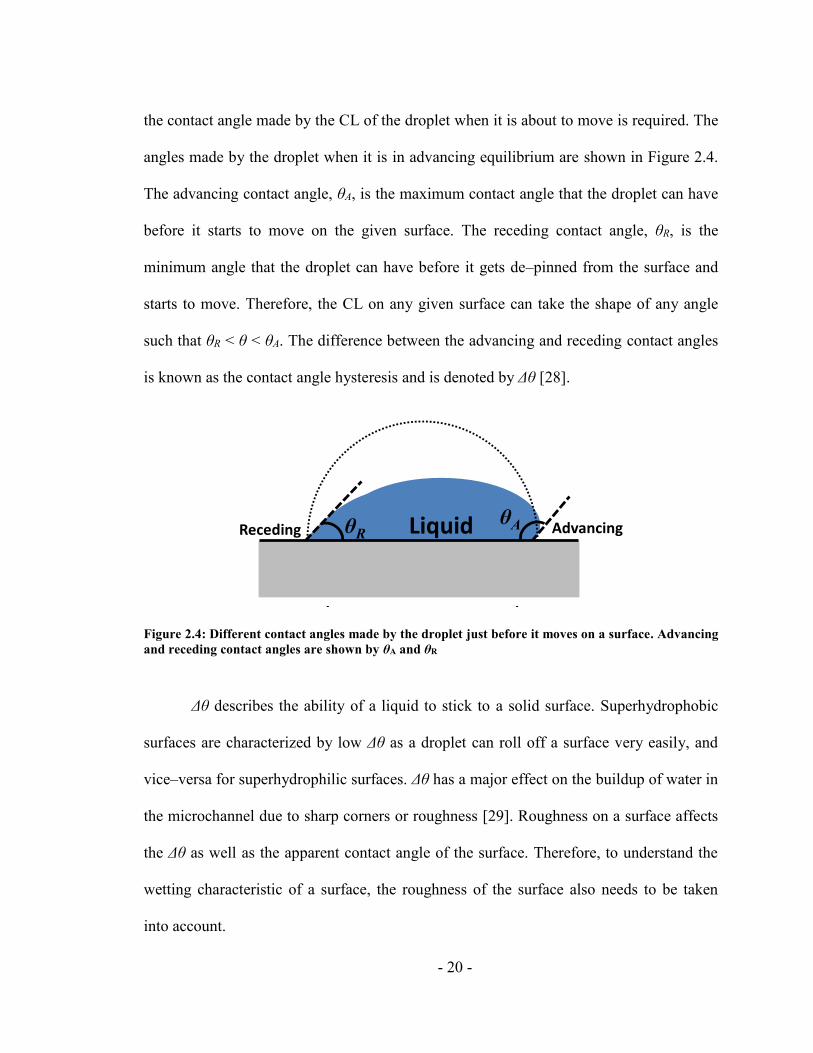
the contact angle made by the CL of the droplet when it is about to move is required. The
angles made by the droplet when it is in advancing equilibrium are shown in Figure 2.4.
The advancing contact angle, θA, is the maximum contact angle that the droplet can have
before it starts to move on the given surface. The receding contact angle, θR, is the
minimum angle that the droplet can have before it gets de–pinned from the surface and
starts to move. Therefore, the CL on any given surface can take the shape of any angle
such that θR < θ < θA. The difference between the advancing and receding contact angles
is known as the contact angle hysteresis and is denoted by Δθ [28].
Figure 2.4: Different contact angles made by the droplet just before it moves on a surface. Advancing
and receding contact angles are shown by θA and θR
Δθ describes the ability of a liquid to stick to a solid surface. Superhydrophobic
surfaces are characterized by low Δθ as a droplet can roll off a surface very easily, and
vice–versa for superhydrophilic surfaces. Δθ has a major effect on the buildup of water in
the microchannel due to sharp corners or roughness [29]. Roughness on a surface affects
the Δθ as well as the apparent contact angle of the surface. Therefore, to understand the
wetting characteristic of a surface, the roughness of the surface also needs to be taken
into account.
LiquidθRθA AdvancingReceding
- 21 -
2.3 Roughness Effect on Contact Angle
The hydrophobicity and the hydrophilicity of the surface are also affected by the
surface roughness. In the case of a PEMFC, the GDL is made up of entangled carbon
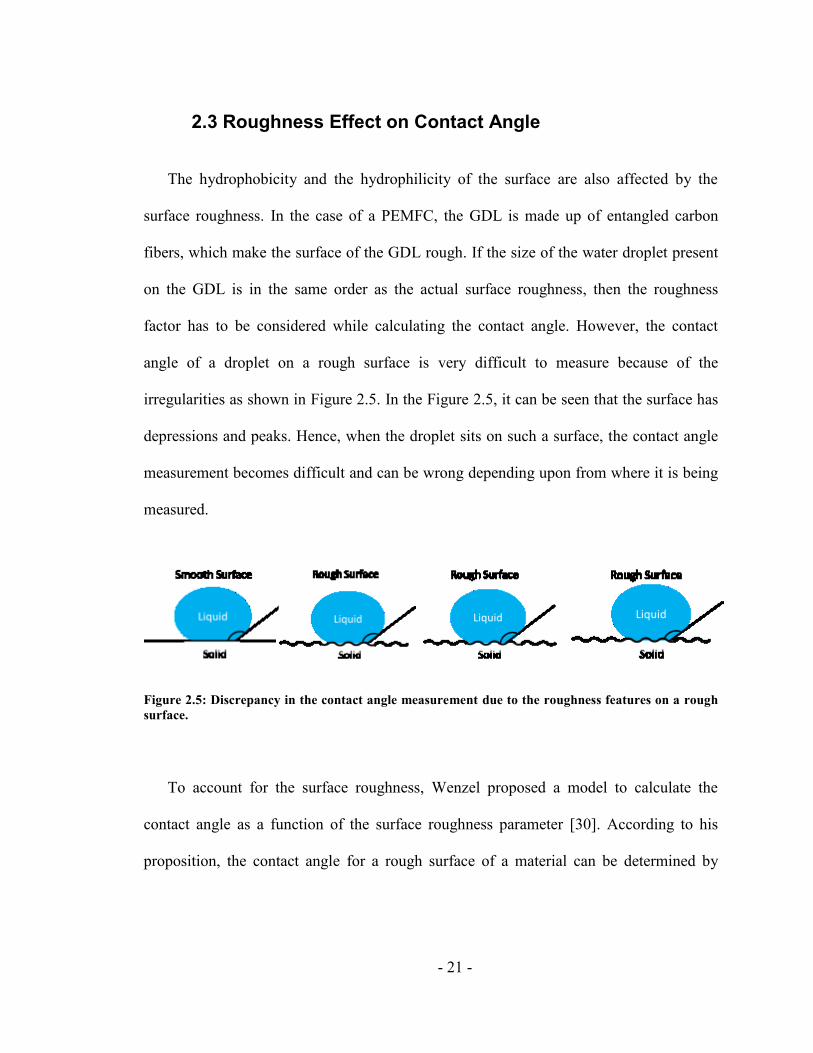
fibers, which make the surface of the GDL rough. If the size of the water droplet present
on the GDL is in the same order as the actual surface roughness, then the roughness
factor has to be considered while calculating the contact angle. However, the contact
angle of a droplet on a rough surface is very difficult to measure because of the
irregularities as shown in Figure 2.5. In the Figure 2.5, it can be seen that the surface has
depressions and peaks. Hence, when the droplet sits on such a surface, the contact angle
measurement becomes difficult and can be wrong depending upon from where it is being
measured.
To account for the surface roughness, Wenzel proposed a model to calculate the
contact angle as a function of the surface roughness parameter [30]. According to his
proposition, the contact angle for a rough surface of a material can be determined by
Figure 2.5: Discrepancy in the contact angle measurement due to the roughness features on a rough
surface.
- 22 -
knowing the contact angle of a liquid droplet on the same material but with a smooth
surface by using Eq. 2.3
cos 𝜃𝑟 = 𝑟 𝑐𝑜𝑠 𝜃 [2.3]
where, 𝜃𝑟 – contact angle on a rough surface, 𝜃 – equilibrium contact angle on a smooth
surface, r – roughness factor; r is always greater than 1 for a rough surface.
According to this model, a droplet placed on a rough surface would spread until it
finds an equilibrium position given by the contact angle θr. It also predicts that the
roughness on a surface enhances its wettability if a surface is hydrophilic, and the
roughness causes it to become more hydrophilic (or more hydrophobic if the surface is
initially hydrophobic) [31-33].
For porous surfaces, Cassie–Baxter (CB) developed a model which includes the
material heterogeneity, fi , for calculating the apparent contact angle, given by Eq. 2.4
[34].
cos 𝜃𝑟 = ∑𝑓𝑖 𝑐𝑜𝑠 𝜃𝑖 = f1 cos 𝜃1 + f2 cos 𝜃2 [2.4]
where f1 and f2 are the area fractions of the material 1 and 2 respectively and θ1 and θ2 are
the static contact angles for material 1 and 2 respectively.
Similarly, the CB Eq. was modified further considering that the droplet is formed
on a peak of the roughened surface and there is an air gap in between the material and the
liquid. An illustration for such a condition is shown in Figure 2.6. In this case, the Eq. 2.4
is modified and is described by Eq. 2.5
- 23 -
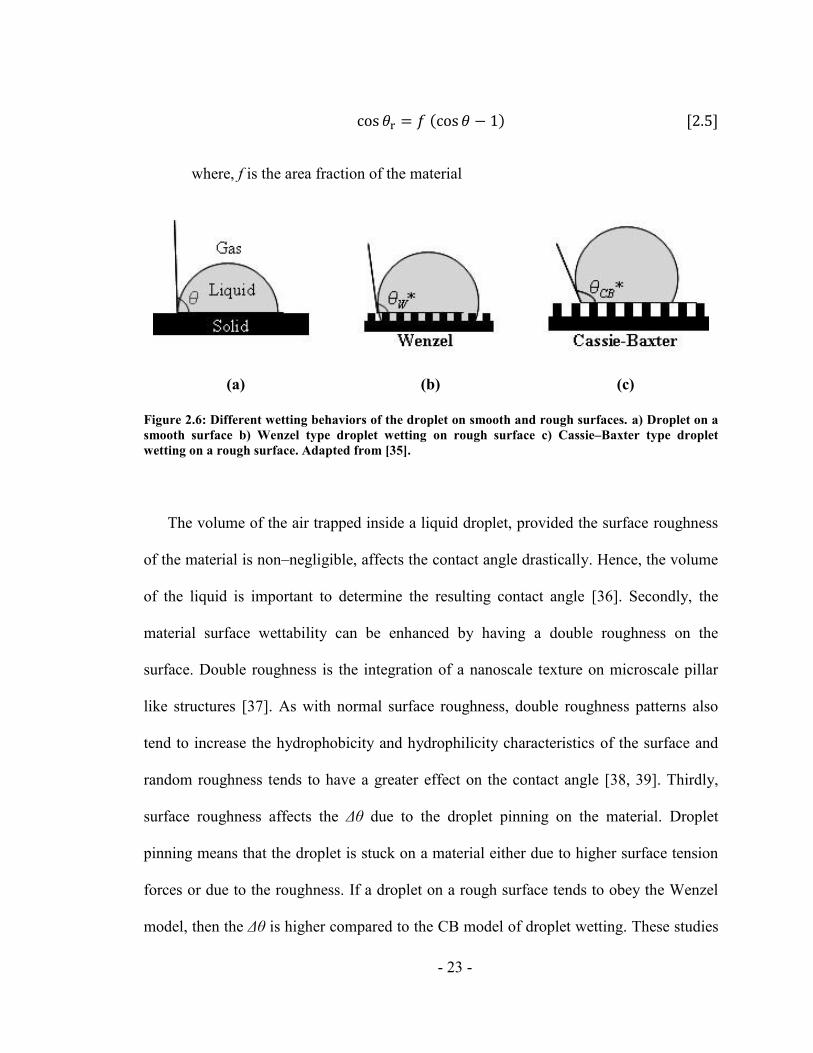
cos 𝜃r = 𝑓 (cos 𝜃 − 1) [2.5]
where, f is the area fraction of the material
(a) (b) (c)
Figure 2.6: Different wetting behaviors of the droplet on smooth and rough surfaces. a) Droplet on a
smooth surface b) Wenzel type droplet wetting on rough surface c) Cassie–Baxter type droplet
wetting on a rough surface. Adapted from [35].
The volume of the air trapped inside a liquid droplet, provided the surface roughness
of the material is non–negligible, affects the contact angle drastically. Hence, the volume
of the liquid is important to determine the resulting contact angle [36]. Secondly, the
material surface wettability can be enhanced by having a double roughness on the
surface. Double roughness is the integration of a nanoscale texture on microscale pillar
like structures [37]. As with normal surface roughness, double roughness patterns also
tend to increase the hydrophobicity and hydrophilicity characteristics of the surface and
random roughness tends to have a greater effect on the contact angle [38, 39]. Thirdly,
surface roughness affects the Δθ due to the droplet pinning on the material. Droplet
pinning means that the droplet is stuck on a material either due to higher surface tension
forces or due to the roughness. If a droplet on a rough surface tends to obey the Wenzel
model, then the Δθ is higher compared to the CB model of droplet wetting. These studies
- 24 -
aid in realizing the significance of the roughness on the material behavior and act as a
building block for complete understanding of the droplet pinning phenomenon – a critical
factor in the water stagnation inside the gas channels of a PEMFC.
The CB model also suggests that a textured surface enhances the hydrophobicity of a
given surface. In literature, it has been shown that textured surfaces of different sizes (10
– 100 nm) act as superhydrophobic surfaces that are very useful in manufacturing and
chemical industries [40-45]. Some recent experiments have also shown that surfaces with
texture sizes in the range 1 – 20 nm can exhibit superhydrophobicity [43, 44, 46]. Both
the Wenzel and CB models are extensively used to predict the apparent contact angle on
rough and porous surfaces respectively. However, the fact that these models take into
account the total contact area of the droplet on the surface is still a controversial and
much debated topic by various groups [40, 46-48]. Consequently, modification of the
classical model based on the contact line length has been proposed [40, 46-50]. It was
also shown that both the Wenzel and CB models are not valid when the droplet size is
comparable to the roughness height [32, 51-54]. In 2007, Nosonovsky derived the
following Eq. 2.6 to determine the contact angle on a rough surface at the triple line.
cos θr = r(x,y) cos θ [2.6]
and for a composite surface, the CB Eq. was modified to use the contact line of the
droplet as shown in Eq. 2.7.
cos θC = f1(x,y) cos θ1 + f2(x,y) cos θ2 [2.7]
- 25 -
There have also been further studies to understand the effect of apparent contact angle
for a given surface on the wetting characteristics as well as analyzing the Cassie–Wenzel
(CW) wetting regimes transition which is critical[38, 40-42, 47, 50, 55-75].
Understanding the mechanism of wetting transitions is very essential for designing highly
stable superhydrophobic surfaces. Different microstructure surfaces have been developed
to achieve a superhydrophobic state. It has been observed that the droplets on these
surfaces are in a Cassie state rather than in a Wenzel state [76]. This is mainly because
the droplets in the Wenzel state are pinned more strongly on the textured surface than in
the Cassie state and lead to a larger Δθ. Therefore, the Cassie state is preferred over the
Wenzel state to obtain superhydrophobicity. It has also been established that for highly
rough surfaces, the Cassie state is more prevalent than the Wenzel state. Accordingly,
various mechanisms used previously to promote the wetting transitions such as
depositing the droplet from a higher position [77, 78], applying external pressure [79],
application of voltage – electrowetting [80], and vibrating the substrate in the horizontal
and vertical directions [81-84], corroborate with this fact. But on the basis of very few
attempts that were made to understand the wetting transition on a pillar structure [32, 76],
it was confirmed that smaller and more densely packed structures lead to better stability
of the droplet which acts as a Cassie droplet. However, to achieve maximum roll off over
superhydrophobic surfaces, a large separation between the structures is required, which
may lead to droplet instability and result in CW transition[79]. Furthermore, there is a
lack of relevant work examining the transition of wettability on a groove structure and
analyzing the effects of geometric and structural parameters of the wetting transition on a
surface. It is therefore essential to gain an in–depth understanding of the droplet behavior
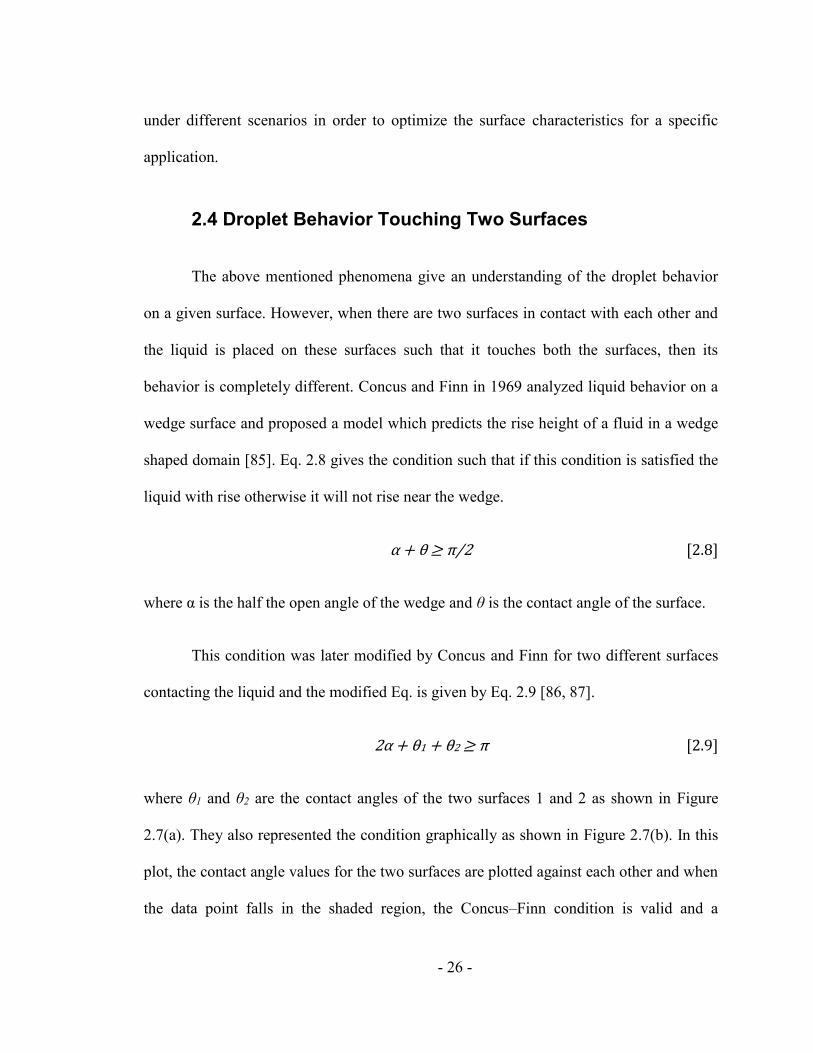
- 26 -
under different scenarios in order to optimize the surface characteristics for a specific
application.
2.4 Droplet Behavior Touching Two Surfaces
The above mentioned phenomena give an understanding of the droplet behavior
on a given surface. However, when there are two surfaces in contact with each other and
the liquid is placed on these surfaces such that it touches both the surfaces, then its
behavior is completely different. Concus and Finn in 1969 analyzed liquid behavior on a
wedge surface and proposed a model which predicts the rise height of a fluid in a wedge
shaped domain [85]. Eq. 2.8 gives the condition such that if this condition is satisfied the
liquid with rise otherwise it will not rise near the wedge.
α + θ ≥ π/2 [2.8]
where α is the half the open angle of the wedge and θ is the contact angle of the surface.
This condition was later modified by Concus and Finn for two different surfaces
contacting the liquid and the modified Eq. is given by Eq. 2.9 [86, 87].
2α + θ1 + θ2 ≥ π [2.9]
where θ1 and θ2 are the contact angles of the two surfaces 1 and 2 as shown in Figure
2.7(a). They also represented the condition graphically as shown in Figure 2.7(b). In this
plot, the contact angle values for the two surfaces are plotted against each other and when
the data point falls in the shaded region, the Concus–Finn condition is valid and a
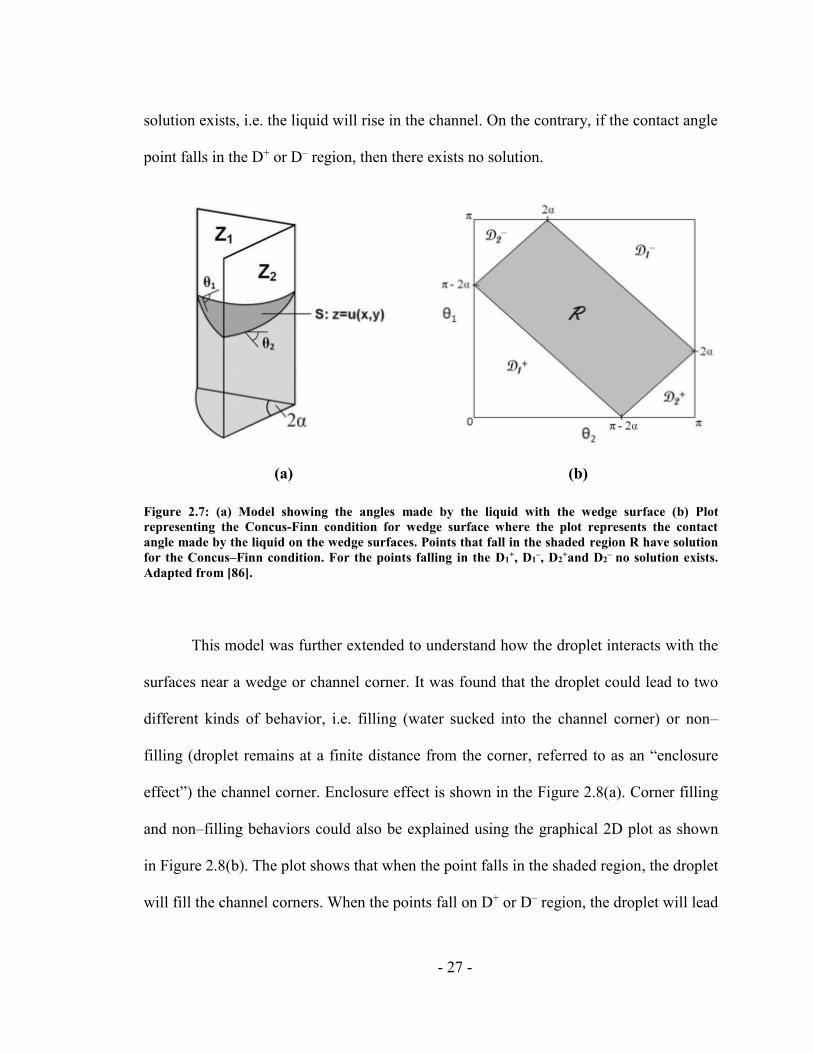
- 27 -
solution exists, i.e. the liquid will rise in the channel. On the contrary, if the contact angle
point falls in the D+ or D– region, then there exists no solution.
(a) (b)
Figure 2.7: (a) Model showing the angles made by the liquid with the wedge surface (b) Plot
representing the Concus-Finn condition for wedge surface where the plot represents the contact
angle made by the liquid on the wedge surfaces. Points that fall in the shaded region R have solution
for the Concus–Finn condition. For the points falling in the D1+, D1
–, D2+and D2
– no solution exists.
Adapted from [86].
This model was further extended to understand how the droplet interacts with the
surfaces near a wedge or channel corner. It was found that the droplet could lead to two
different kinds of behavior, i.e. filling (water sucked into the channel corner) or non–
filling (droplet remains at a finite distance from the corner, referred to as an “enclosure
effect”) the channel corner. Enclosure effect is shown in the Figure 2.8(a). Corner filling
and non–filling behaviors could also be explained using the graphical 2D plot as shown
in Figure 2.8(b). The plot shows that when the point falls in the shaded region, the droplet
will fill the channel corners. When the points fall on D+ or D– region, the droplet will lead
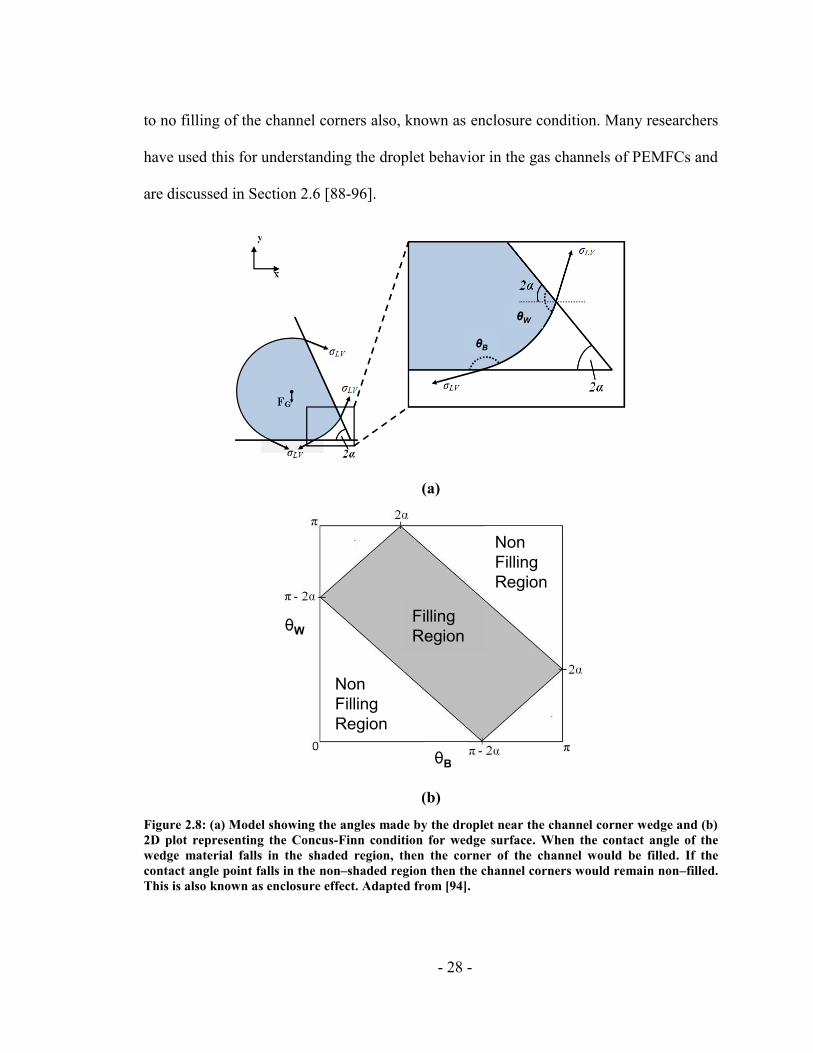
- 28 -
to no filling of the channel corners also, known as enclosure condition. Many researchers
have used this for understanding the droplet behavior in the gas channels of PEMFCs and
are discussed in Section 2.6 [88-96].
(a)
(b)
Figure 2.8: (a) Model showing the angles made by the droplet near the channel corner wedge and (b)
2D plot representing the Concus-Finn condition for wedge surface. When the contact angle of the
wedge material falls in the shaded region, then the corner of the channel would be filled. If the
contact angle point falls in the non–shaded region then the channel corners would remain non–filled.
This is also known as enclosure effect. Adapted from [94].
θB
θW
θW
θB
Non
Filling
Region
Filling
Region
Non
Filling
Region
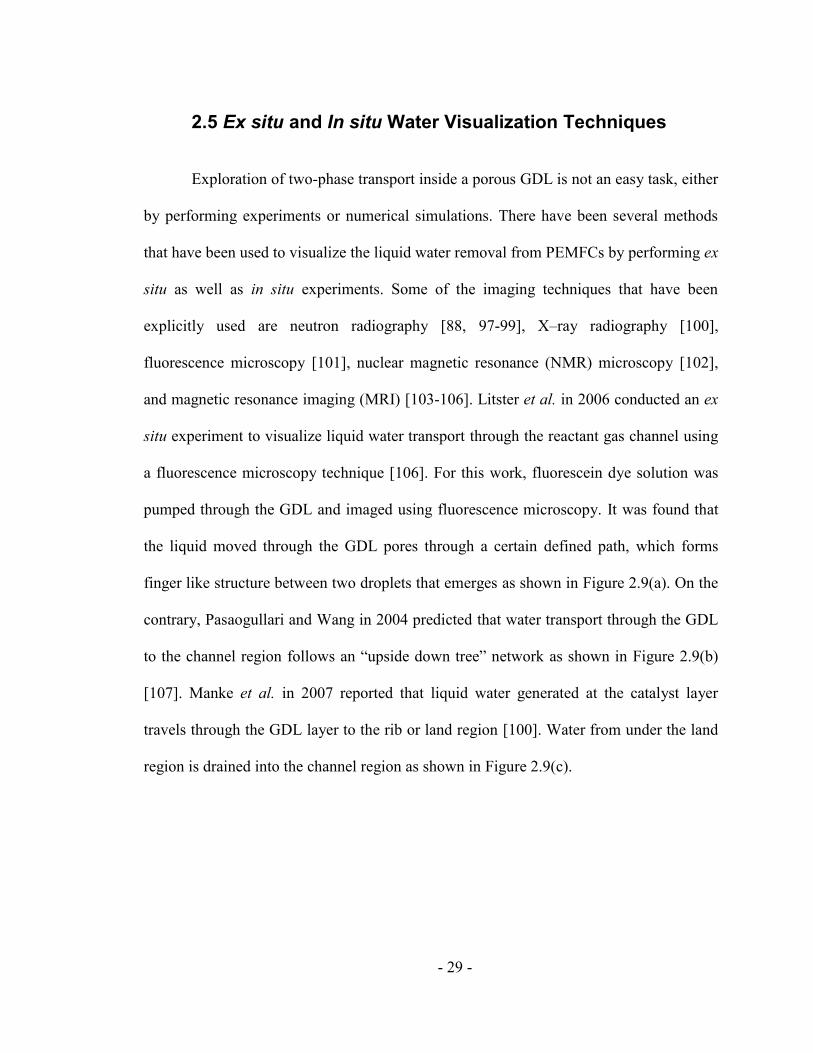
- 29 -
2.5 Ex situ and In situ Water Visualization Techniques
Exploration of two-phase transport inside a porous GDL is not an easy task, either
by performing experiments or numerical simulations. There have been several methods
that have been used to visualize the liquid water removal from PEMFCs by performing ex
situ as well as in situ experiments. Some of the imaging techniques that have been
explicitly used are neutron radiography [88, 97-99], X–ray radiography [100],
fluorescence microscopy [101], nuclear magnetic resonance (NMR) microscopy [102],
and magnetic resonance imaging (MRI) [103-106]. Litster et al. in 2006 conducted an ex
situ experiment to visualize liquid water transport through the reactant gas channel using
a fluorescence microscopy technique [106]. For this work, fluorescein dye solution was
pumped through the GDL and imaged using fluorescence microscopy. It was found that
the liquid moved through the GDL pores through a certain defined path, which forms
finger like structure between two droplets that emerges as shown in Figure 2.9(a). On the
contrary, Pasaogullari and Wang in 2004 predicted that water transport through the GDL
to the channel region follows an “upside down tree” network as shown in Figure 2.9(b)
[107]. Manke et al. in 2007 reported that liquid water generated at the catalyst layer
travels through the GDL layer to the rib or land region [100]. Water from under the land
region is drained into the channel region as shown in Figure 2.9(c).
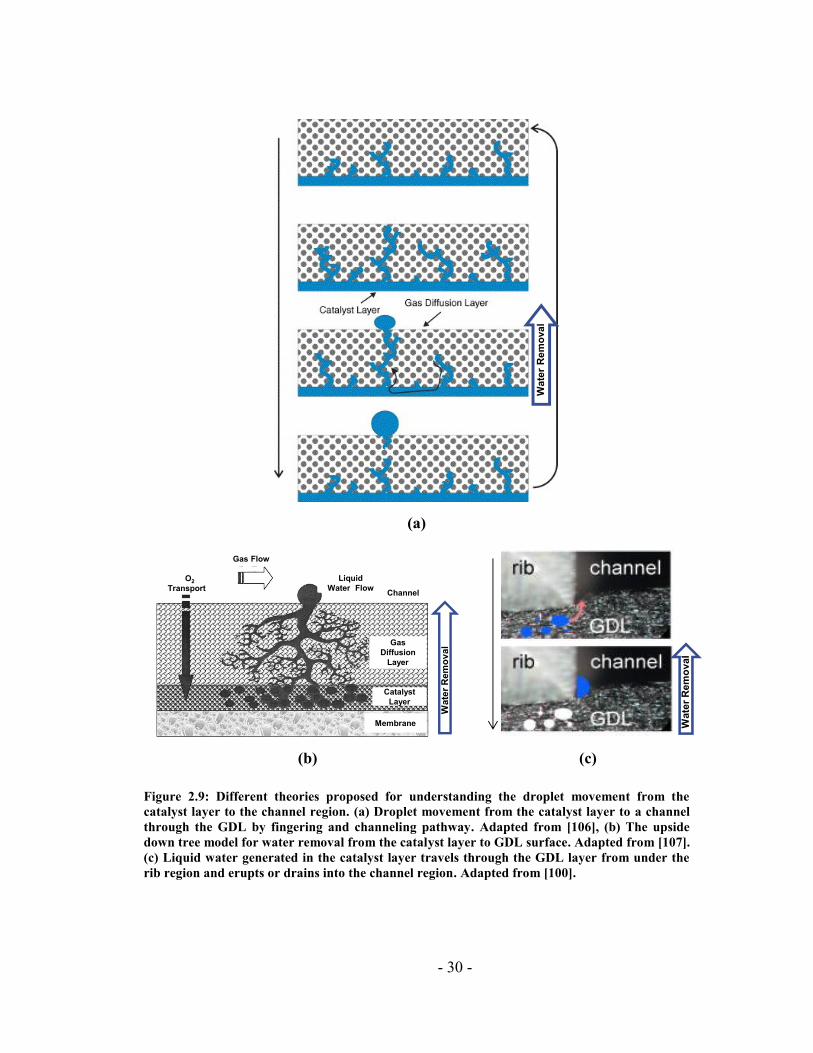
- 30 -
(a)
(b)
(c)
Figure 2.9: Different theories proposed for understanding the droplet movement from the
catalyst layer to the channel region. (a) Droplet movement from the catalyst layer to a channel
through the GDL by fingering and channeling pathway. Adapted from [106], (b) The upside
down tree model for water removal from the catalyst layer to GDL surface. Adapted from [107].
(c) Liquid water generated in the catalyst layer travels through the GDL layer from under the
rib region and erupts or drains into the channel region. Adapted from [100].
Wate
r R
em
oval
Wate
r R
em
ov
al
OO2
Transport
Gas Flow
Liquid
Water FlowChannel
Gas
Diffusion
Layer
Catalyst
Layer
Membrane Wate
r R
em
ov
al
- 31 -
Later on, other techniques such as X–ray radiography, ultrasound, NMR and MRI
microscopy techniques became popular for the visualization of water in PEMFCs. In
1999, researchers from the National Institute of Standards and Technology (NIST)
developed neutron imaging technologies to investigate water transport in PEMFCs [98].
Satija et al. in 2004 designed their PEMFC such that they could visualize liquid water
production, transportation and removal from the fuel cell using neutron imaging
techniques [97]. Owejan et al. in 2006 also performed in situ testing on an interdigitated
cathode flow field to quantify the amount of liquid water transport through the porous
GDL in a PEMFC [96]. The results showed that the water accumulated in certain regions
of the porous media while there were few regions where the reactant gases established a
consistent in-plane transport path through the porous media. Neutron imaging has the
capability to image the diffusion media easily. For in situ experiments of water
quantification, neutron radiography and MRI microscopy techniques [97, 99, 102-104]
have been very promising due to their non–intrusive nature and their ability to visualize
the liquid inside a porous GDL. However, their extensive application is restricted by high
cost, limited availability and complex modification to the system[108].
There have been several other methods used to investigate water management
issues in a cost effective way. One of the methodologies uses transparent materials to
visualize the gas channel[88, 109-114]. Tuber et al. first studied the effect of GDL
material on water management using transparent material for the fuel cell assembly. They
visualized the water emergence using optical imaging technique. It was experimentally
verified that the hydrophobic coating (PTFE) applied on the GDL fibers affects the water
- 32 -
transport in the cell. It was observed that the water distribution was much more random
within the channel and not a continuous process. Esposito et al. used a fluorescent die
and transparent ex situ setup to visualize the droplet deformation when it was exposed to
the gas flow in the channel [114]. They were able to visualize the advancing and receding
contact angle made by the droplet due to the shear force exerted by the airflow in the
channel.
Kandlikar et al. have performed extensive work by using visually accessible fuel
cell [109, 115-119]. Sapphire windows, which are transparent, have been used to
visualize the gas channel to study the effect of GDL, channel geometry and flow
maldistribution in the PEMFCs. They were able to classify the water flow pattern as a
function of the water and the superficial air velocities in the channel. They also found that
water emergence on the GDL was a more dynamic and discrete process when compared
to the continuous water eruption mechanism suggested by the previous researchers. The
water emergence follows a mechanism similar to the Haines Jump process, shown in
Figure 2.10, observed in geological studies. Haines Jump mechanism is described as the
liquid movement through a porous material. Here the liquid would emerge to the surface
of the porous material at one location and drain all the liquid there. The next pore
location where the liquid has filled the pores completely would drain out on the surface
and the process continues. Hence, the liquid emergence on the surface of the porous
material is a discontinuous process. Studies were also conducted to understand the GDL
intrusion effect into the gas channels, and it was observed that the channel area was
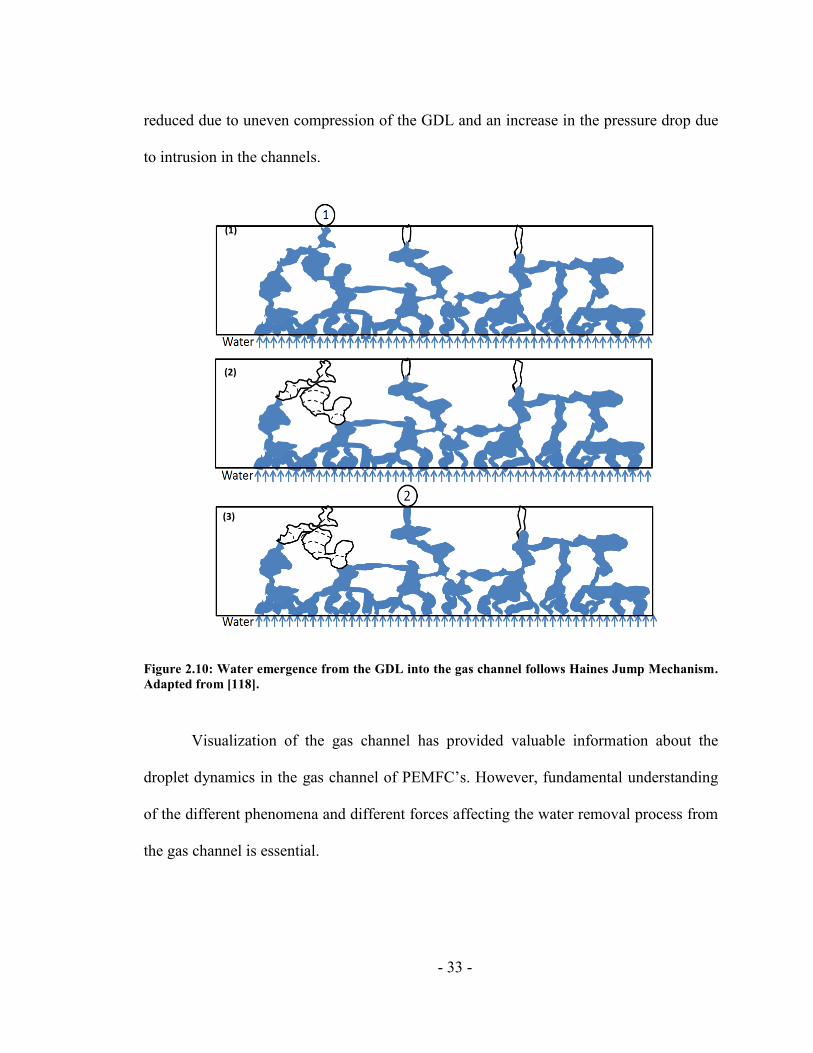
- 33 -
reduced due to uneven compression of the GDL and an increase in the pressure drop due
to intrusion in the channels.
Figure 2.10: Water emergence from the GDL into the gas channel follows Haines Jump Mechanism.
Adapted from [118].
Visualization of the gas channel has provided valuable information about the
droplet dynamics in the gas channel of PEMFC’s. However, fundamental understanding
of the different phenomena and different forces affecting the water removal process from
the gas channel is essential.
(1)
(2)
(3)
- 34 -
2.6 Different Phenomena Affecting the Water Removal from
Gas Channels
It was revealed from the literature that the water accumulation at the corners
where the GDL and the channel walls of the gas channel meet leads to increased pressure
drop in the channels [91, 92]. Water stagnation in the gas channels hinders the reactant
gas flow to the catalyst layer where the reaction occurs, and lowers the overall efficiency
of the cell [120, 121]. Water removal from the gas channel is dependent on several
factors such as gas velocity, contact angle on the GDL and channel wall surfaces, Δθ,
droplet emergence location, and the cross sectional geometry of the channel [88, 89, 91-
94, 117-133]. Gas flow in the channel can exert a pressure force on the droplet modifying
its shape, detaching it from the GDL and the channel wall surfaces, and removing it from
the gas channel [128-131].
2.6.1 Forces Affecting Droplet Removal
A droplet or a slug (elongated droplet touching the sidewalls) experiences
different forces that act on it and determine its movement in the gas channel. Figure 2.11
shows the different forces acting on a droplet which include gravity (Fg), surface tension
(Fσ) and the drag force (FD) applied due to the gas flow in the channel [134, 135]. It is
seen that the droplet moves in the gas channel when the gravity and drag forces overcome
the surface tension force holding the droplet in the channel.
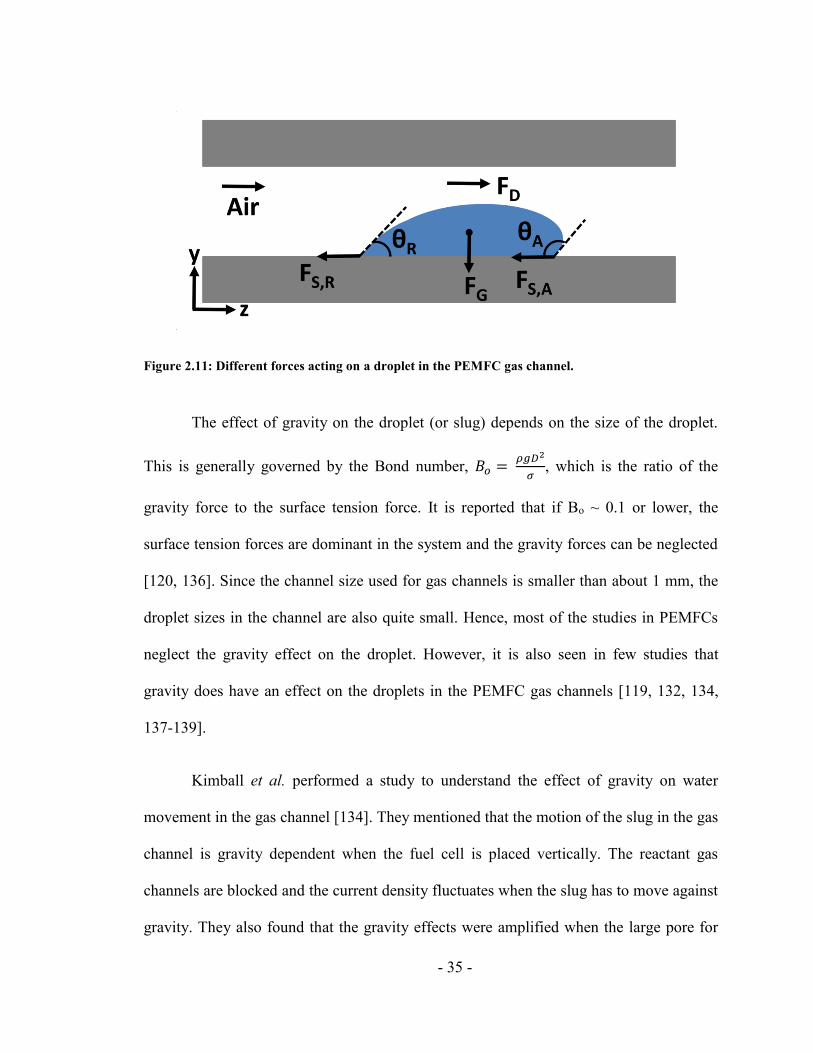
- 35 -
Figure 2.11: Different forces acting on a droplet in the PEMFC gas channel.
The effect of gravity on the droplet (or slug) depends on the size of the droplet.
This is generally governed by the Bond number, 𝐵𝑜 = 𝜌𝑔𝐷2
𝜎, which is the ratio of the
gravity force to the surface tension force. It is reported that if Bo ~ 0.1 or lower, the
surface tension forces are dominant in the system and the gravity forces can be neglected
[120, 136]. Since the channel size used for gas channels is smaller than about 1 mm, the
droplet sizes in the channel are also quite small. Hence, most of the studies in PEMFCs
neglect the gravity effect on the droplet. However, it is also seen in few studies that
gravity does have an effect on the droplets in the PEMFC gas channels [119, 132, 134,
137-139].
Kimball et al. performed a study to understand the effect of gravity on water
movement in the gas channel [134]. They mentioned that the motion of the slug in the gas
channel is gravity dependent when the fuel cell is placed vertically. The reactant gas
channels are blocked and the current density fluctuates when the slug has to move against
gravity. They also found that the gravity effects were amplified when the large pore for
- 36 -
droplet emergence was under the channel region. However, when the large pore was
under the land region, the gravity effects diminished [137]. Yi et al. also studied the
effect of gravity on fuel cell performance and concluded that at an optimized
gravitational angle for cell orientation, the output power of PEMFC stack can be
enhanced greatly [138]. Chen and Wu studied the effect of gravity on water discharge in
PEMFC gas channels [139]. They concluded that the excess water present in the cathode
channel is easily removed from the cell when the anode channel orientation is upwards.
They also suggested that the placement of the anode and the cathode is very important for
the performance of the PEMFC. Lu et al. studied the effect of the orientation of the cell
on water distribution and flow patterns in the gas channels and also found that the vertical
orientation of the cell was beneficial for the water flow pattern and the two phase flow in
the gas channels as compared to a horizontal cell [119]. Cheah et al. performed
experiments to understand the effect of gravity and surface wettability on the liquid
behavior in the PEMFC gas channels [140]. They suggested that the selection of channel
geometry, surface wettability, and orientation for the fuel cell flow channel should not be
made in isolation. Horizontally mounted hydrophilic square channels would produce
large slugs that would require lower energy for removal. However, these large slugs
would produce large mass transport resistances for the reactant gas to diffuse to the
catalyst layer. On the other hand, a hydrophobic square channel would produce smaller
slug and require more energy for its removal. However, the smaller slugs would
minimize the problems of reactant transport. Das et al. studied the effect of adhesion
force on the liquid water removal from the GDL [132]. They reported that for droplets
smaller than 1.5 mm in diameter, the gravity effect could be neglected. However, when
- 37 -
the droplet size is above 2 mm or Bo is above 0.14, gravity has a significant effect on
their removal. Therefore, it can be concluded from these studies that the gravity effect in
the PEMFC gas channel can be neglected only when the droplet diameter is smaller than
1 mm or Bo less than 0.1, otherwise it needs to be considered in the analysis.
The surface tension forces also play a major role in the droplet removal process.
The adhesion force exerted by the surface tension on the droplet is a function of the
surface wettability defined by the contact angle (θ) and the contact angle hysteresis (Δθ)
[27]. When Δθ of a material is high, a larger drag force is required from the airflow in the
channel to remove the droplet. When a droplet interface has an angle θ < 90°, it is called
a hydrophilic surface and the liquid would spread. In an interface with θ > 90°, known as
a hydrophobic surface, the liquid repels the surface and tries to attain a spherical shape.
Droplet removal from a hydrophobic surface is easier as the force required to remove the
droplet is less than a hydrophilic surface for a given Δθ. The GDL being a hydrophobic
surface allows droplet removal relatively easily as compared to a hydrophilic channel
surface.
There have been many analytical models proposed in the past to understand the
effect of different forces acting on a droplet growing on the base of a microchannel [124,
125, 127, 128, 141-144]. These models generally employ force balance or torque balance
to evaluate the effect of different parameters and membrane properties on droplet
formation and its removal. Luca et al. tried to validate these two models with
experimental data available in literature and found that the force balance model yields
better results when wall shear stress is above 7 Pa and membrane pore diameter is below
- 38 -
1.5µm [144]. On a similar note, Chen et al. presented a simplified model based on
macroscopic force balance and droplet geometry approximation for predicting the
instability in the droplet which leads to its removal from the GDL surface [128]. Zhang et
al. performed experimental and analytical studies and developed a correlation for the
droplet detachment diameter from the GDL surface in terms of velocity and Reynolds
Number (Re) [120]. Similarly, Ha et al. performed experimental study to understand the
droplet detachment characteristic from the GDL and complimented it with a simplified
model [145]. The model was used as a criterion to estimate the droplet instability and
removal tendency in the gas channel.
Hao and Cheng performed numerical simulations using the Lattice Boltzmann
method to understand the influence of gas flow velocity and GDL surface wettability on
droplet detachment size and droplet removal time from a gas channel [141, 142]. They
also developed analytical models based on force balance to predict the droplet
detachment size and the shear force required to move the droplet on a hydrophobic wall
in terms of dynamic contact angles for a steady velocity profile. Similarly, Cho et al.
investigated the dynamics of liquid water in PEMFC gas channels through numerical and
analytical studies [124, 125]. They used CFD simulations to determine the droplet
detachment velocity by comparing the wall adhesion and drag force. They found that the
viscous force has a significant impact on smaller droplets at lower air velocities, whereas
the pressure drag is dominant for larger droplets. Golpaygan and Ashgriz conducted a
numerical study to understand the effect of gas flow properties and liquid droplet on the
droplet mobility in the gas channel. It was observed that surface tension has the greatest
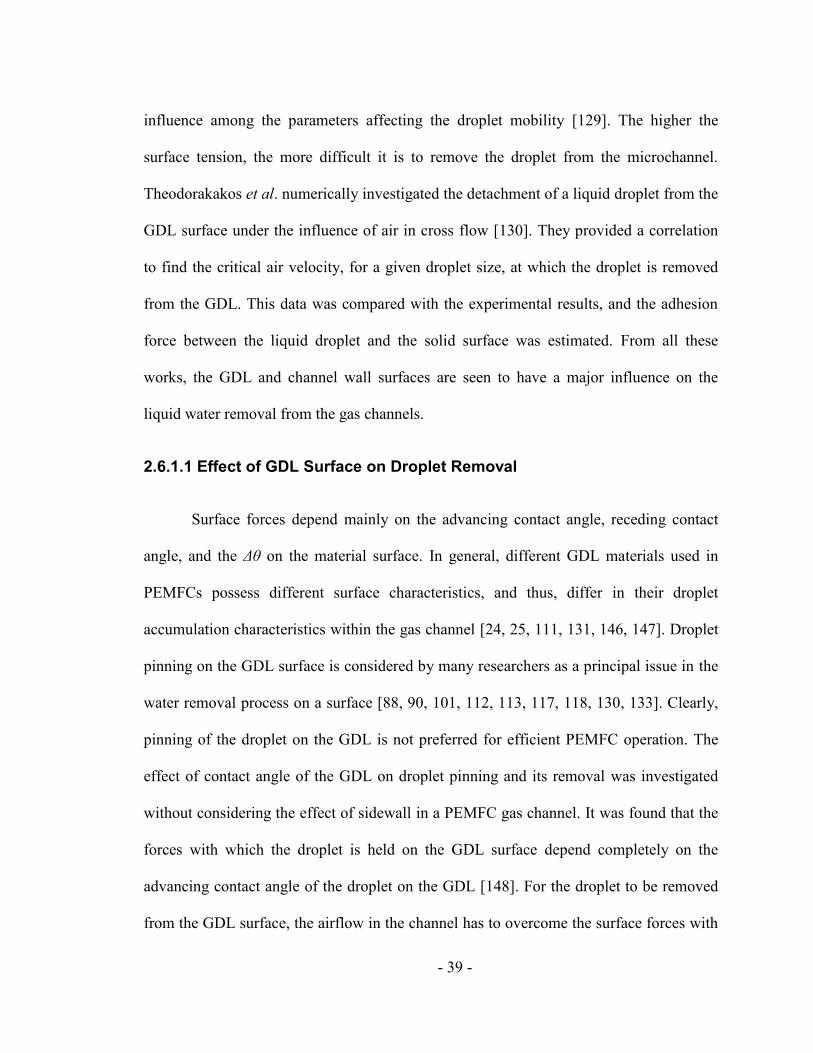
- 39 -
influence among the parameters affecting the droplet mobility [129]. The higher the
surface tension, the more difficult it is to remove the droplet from the microchannel.
Theodorakakos et al. numerically investigated the detachment of a liquid droplet from the
GDL surface under the influence of air in cross flow [130]. They provided a correlation
to find the critical air velocity, for a given droplet size, at which the droplet is removed
from the GDL. This data was compared with the experimental results, and the adhesion
force between the liquid droplet and the solid surface was estimated. From all these
works, the GDL and channel wall surfaces are seen to have a major influence on the
liquid water removal from the gas channels.
2.6.1.1 Effect of GDL Surface on Droplet Removal
Surface forces depend mainly on the advancing contact angle, receding contact
angle, and the Δθ on the material surface. In general, different GDL materials used in
PEMFCs possess different surface characteristics, and thus, differ in their droplet
accumulation characteristics within the gas channel [24, 25, 111, 131, 146, 147]. Droplet
pinning on the GDL surface is considered by many researchers as a principal issue in the
water removal process on a surface [88, 90, 101, 112, 113, 117, 118, 130, 133]. Clearly,
pinning of the droplet on the GDL is not preferred for efficient PEMFC operation. The
effect of contact angle of the GDL on droplet pinning and its removal was investigated
without considering the effect of sidewall in a PEMFC gas channel. It was found that the
forces with which the droplet is held on the GDL surface depend completely on the
advancing contact angle of the droplet on the GDL [148]. For the droplet to be removed
from the GDL surface, the airflow in the channel has to overcome the surface forces with
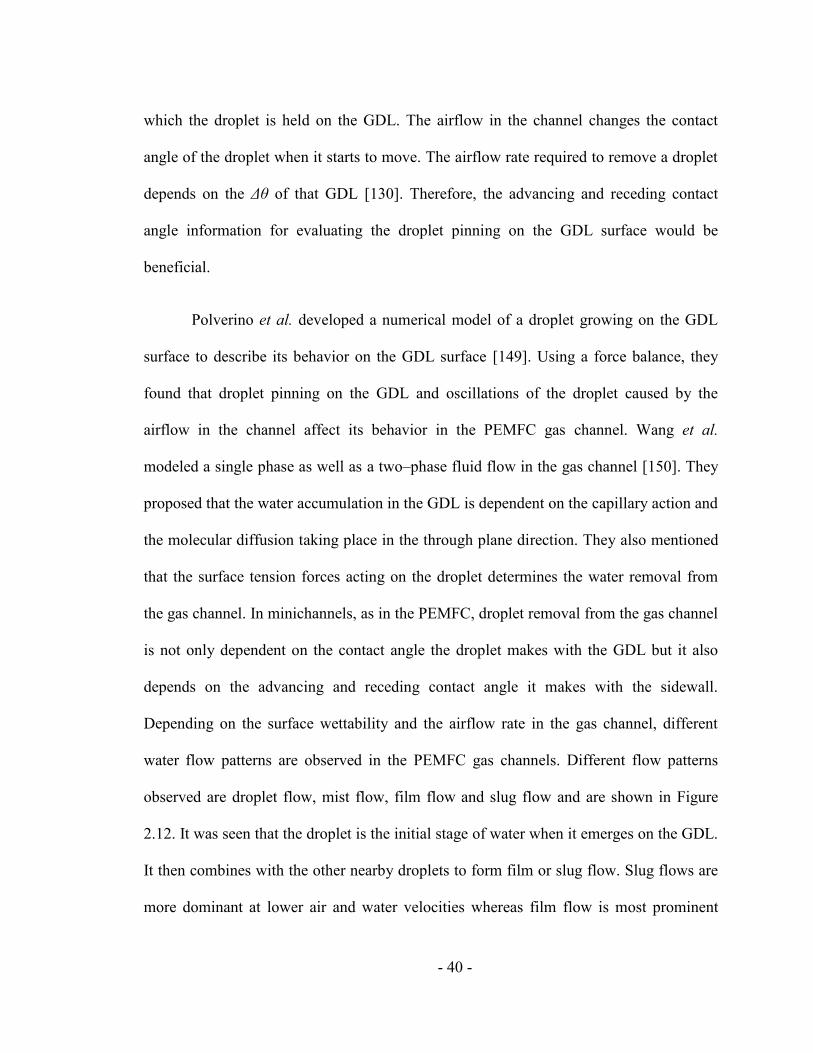
- 40 -
which the droplet is held on the GDL. The airflow in the channel changes the contact
angle of the droplet when it starts to move. The airflow rate required to remove a droplet
depends on the Δθ of that GDL [130]. Therefore, the advancing and receding contact
angle information for evaluating the droplet pinning on the GDL surface would be
beneficial.
Polverino et al. developed a numerical model of a droplet growing on the GDL
surface to describe its behavior on the GDL surface [149]. Using a force balance, they
found that droplet pinning on the GDL and oscillations of the droplet caused by the
airflow in the channel affect its behavior in the PEMFC gas channel. Wang et al.
modeled a single phase as well as a two–phase fluid flow in the gas channel [150]. They
proposed that the water accumulation in the GDL is dependent on the capillary action and
the molecular diffusion taking place in the through plane direction. They also mentioned
that the surface tension forces acting on the droplet determines the water removal from
the gas channel. In minichannels, as in the PEMFC, droplet removal from the gas channel
is not only dependent on the contact angle the droplet makes with the GDL but it also
depends on the advancing and receding contact angle it makes with the sidewall.
Depending on the surface wettability and the airflow rate in the gas channel, different
water flow patterns are observed in the PEMFC gas channels. Different flow patterns
observed are droplet flow, mist flow, film flow and slug flow and are shown in Figure
2.12. It was seen that the droplet is the initial stage of water when it emerges on the GDL.
It then combines with the other nearby droplets to form film or slug flow. Slug flows are
more dominant at lower air and water velocities whereas film flow is most prominent
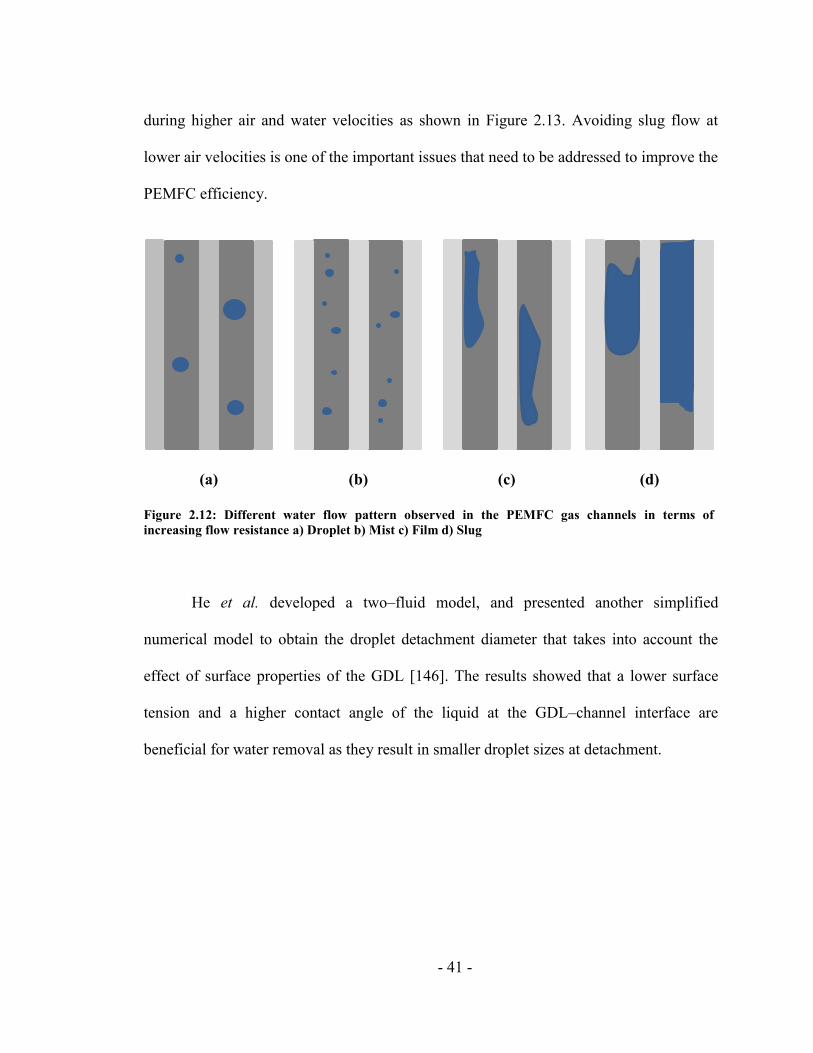
- 41 -
during higher air and water velocities as shown in Figure 2.13. Avoiding slug flow at
lower air velocities is one of the important issues that need to be addressed to improve the
PEMFC efficiency.
(a) (b) (c) (d)
Figure 2.12: Different water flow pattern observed in the PEMFC gas channels in terms of
increasing flow resistance a) Droplet b) Mist c) Film d) Slug
He et al. developed a two–fluid model, and presented another simplified
numerical model to obtain the droplet detachment diameter that takes into account the
effect of surface properties of the GDL [146]. The results showed that a lower surface
tension and a higher contact angle of the liquid at the GDL–channel interface are
beneficial for water removal as they result in smaller droplet sizes at detachment.
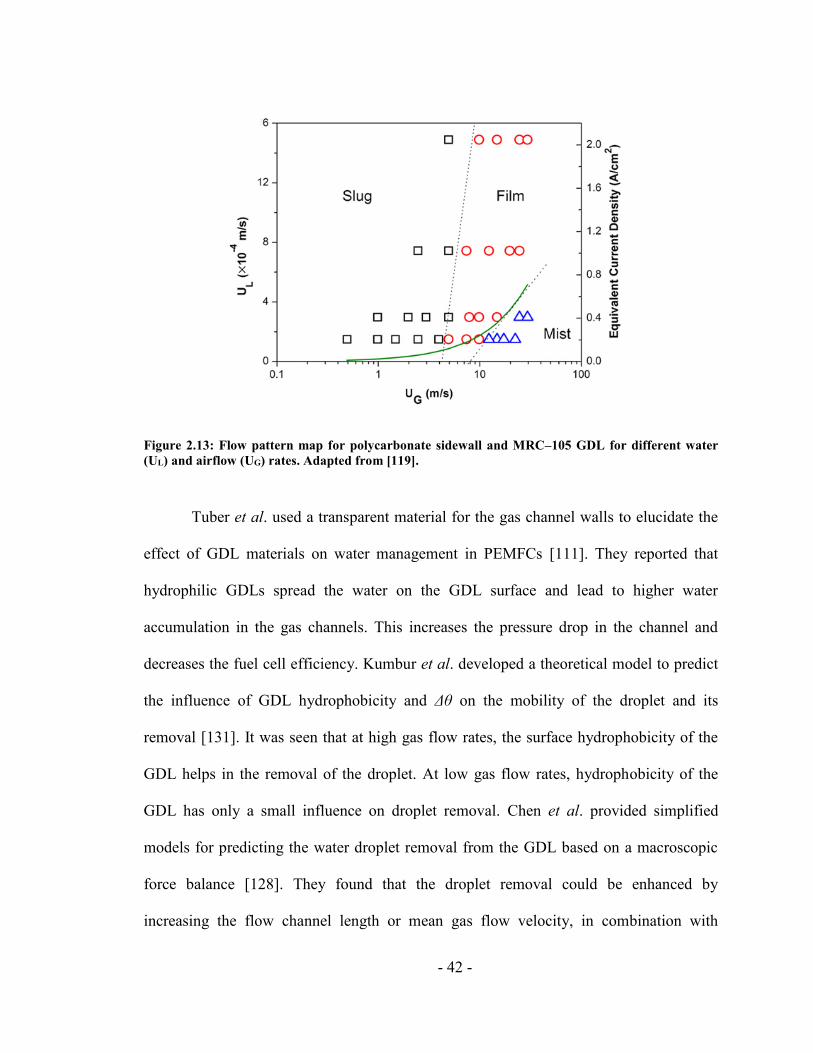
- 42 -
Figure 2.13: Flow pattern map for polycarbonate sidewall and MRC–105 GDL for different water
(UL) and airflow (UG) rates. Adapted from [119].
Tuber et al. used a transparent material for the gas channel walls to elucidate the
effect of GDL materials on water management in PEMFCs [111]. They reported that
hydrophilic GDLs spread the water on the GDL surface and lead to higher water
accumulation in the gas channels. This increases the pressure drop in the channel and
decreases the fuel cell efficiency. Kumbur et al. developed a theoretical model to predict
the influence of GDL hydrophobicity and Δθ on the mobility of the droplet and its
removal [131]. It was seen that at high gas flow rates, the surface hydrophobicity of the
GDL helps in the removal of the droplet. At low gas flow rates, hydrophobicity of the
GDL has only a small influence on droplet removal. Chen et al. provided simplified
models for predicting the water droplet removal from the GDL based on a macroscopic
force balance [128]. They found that the droplet removal could be enhanced by
increasing the flow channel length or mean gas flow velocity, in combination with
- 43 -
decreasing the channel height or the Δθ, as well as increasing the hydrophobicity of the
GDL.
2.6.1.2 Effect of Channel Material Properties on Droplet Removal
Earlier works reported in this area indicate that material properties of the channel
sidewall have great influence on water transport in the gas channel [119, 148, 152-154].
It is seen that even though the water moved faster on a hydrophobic surface, having a
hydrophobic channel sidewall is disadvantageous for gas diffusion to the catalyst layer
and fuel cell performance [152]. Quan and Lai performed a numerical simulation to
understand water management in gas channels and found that a hydrophilic channel
surface facilitates the transport of reactant gases to the reaction sites by transporting the
water along the channel edges [153]. This acts as an effective water management strategy
in the gas channels. On the other hand, hydrophilic surface also increases the pressure
drop due to liquid water spreading, forming slugs and leading to blockages in the
channels. Zhu et al. conducted a numerical study to understand the effect of surface
wettability on droplet removal from the gas channels [148]. They proposed that
hydrophilic channel walls spread water to the channel corners leading to film flow and
eventually resulting in blocking of the gas flow pathways. A similar experimental study
was performed by Lu et al. and found that hydrophilic channels help in uniform water
distribution along the GDL surface [119]. They also stated that hydrophilic gas channel
walls help in creating film flow in the channel and therefore reduce the pressure drop in
the channel. Zhang et al. also studied the effect of channel material properties and found
that the hydrophilicity of the channel surface facilitates the removal of the water by
- 44 -
wicking it into the channel corners [120]. Therefore, from all these work, it is seen that
both hydrophilic and hydrophobic channels have their own merits and demerits.
2.6.1.3 Effect of Channel Cross Sectional Geometry on Droplet Removal
It was also noted that the channel geometry has an important effect on water
management in the PEMFC gas channels. Owejan et al. performed an in situ study to
understand the effect of gas channel properties on water accumulation in PEMFCs [133].
They stated that triangular cross–sectional channels retained less water as compared to
rectangular channels at a given current density Zhu et al. performed a numerical
investigation on six different channel geometries to understand which geometry performs
best for a PEMFC gas channel [154]. It was observed that the detachment time,
detachment diameter, and removal time of water droplets were found to be lower for
triangular and trapezoidal channels, and higher for rectangular and upside down trapezoid
channels. It was also seen that the normalized friction factor was highest for the upside
down trapezoid and lowest for the semicircle as shown in Figure 2.14(a). A similar study
was performed by Lu et al., and reported that sinusoidal and trapezoidal channels
produce lower pressure drops in the channel compared to rectangular gas channels as
shown in Figure 2.14(b) [119].
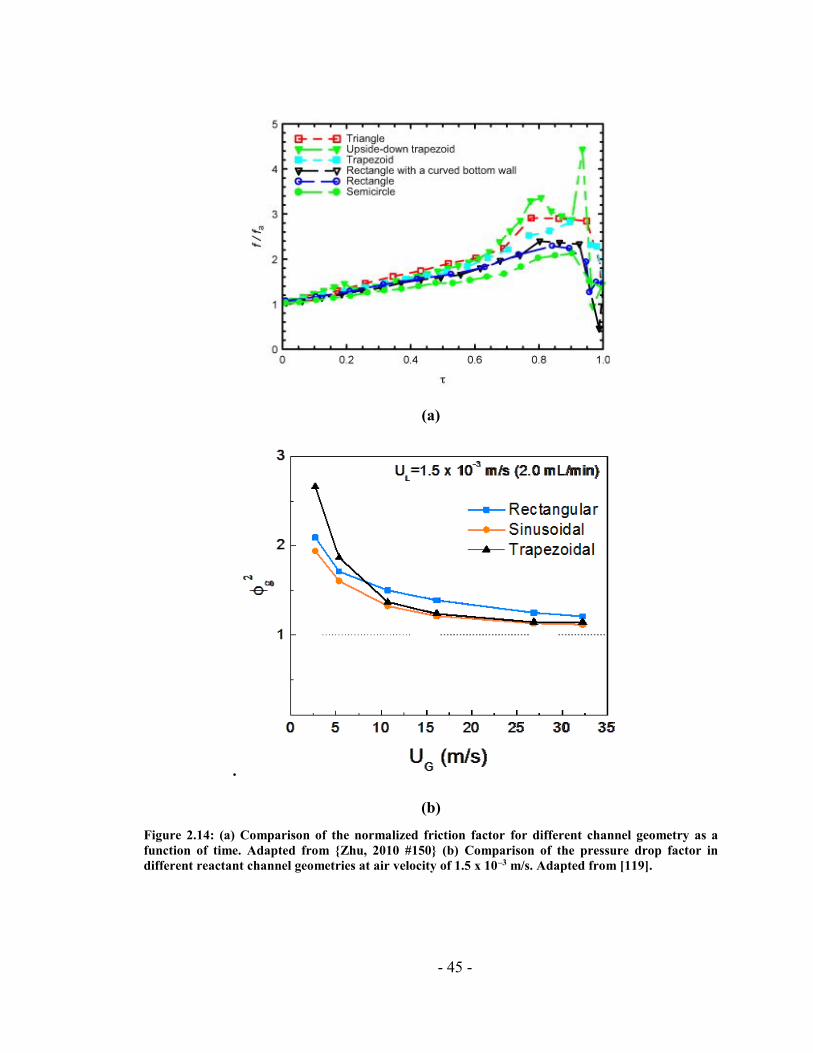
- 45 -
(a)
.
(b)
Figure 2.14: (a) Comparison of the normalized friction factor for different channel geometry as a
function of time. Adapted from {Zhu, 2010 #150} (b) Comparison of the pressure drop factor in
different reactant channel geometries at air velocity of 1.5 x 10⁻³ m/s. Adapted from [119].
- 46 -
Wang et al. performed two–phase flow modeling with different channel
geometries and reported that water generally is trapped around the geometrical
heterogeneity [150]. Akhtar et al. researched the effect of the aspect ratio of the gas
channel on fuel cell efficiency and showed that the measured pressure drop decreases
with increasing channel cross sectional area [155]. It was also seen that for the same cross
sectional area but for different aspect ratio, the pressure drop was significantly different.
Hence, the aspect ratio is believed to play an important role in the water transport
phenomena occurring in the fuel cell.
According to most researchers, sinusoidal channels seem to perform much better
in terms of water removal and pressure drop in the system. However, sinusoidal channels
provide high electrical contact resistance and the stamping process of making channels is
very difficult. The next best channel configuration that could be used for gas channels are
the trapezoidal channels, which are cheap and easy to manufacture.
However, a trapezoidal channel can have different channel angles and the
trapezoidal channel angle that provides the best-working configuration has not yet been
identified. To evaluate the importance of the trapezoid channel angle, Hwang et al.
conducted a simulation to verify the droplet dynamics at the channel corner [156]. It was
seen that the effect of the sidewall became more prominent as the open angle between the
sidewall and the base decreased. To investigate the water accumulation and removal
processes from the gas channel at a microscopic level, Rath and Kandlikar analyzed the
droplet interactions with the sidewall of a trapezoidal gas channel at different channel
open angles [90]. They found that the droplet interacted with the channel walls in two
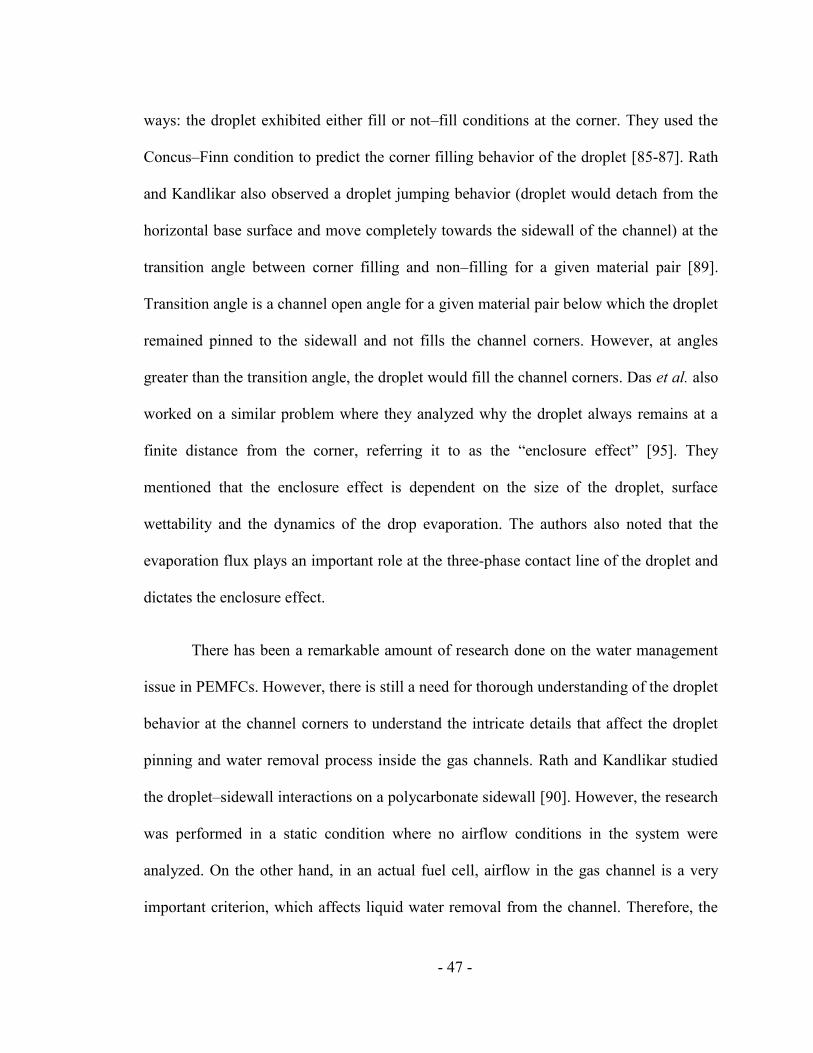
- 47 -
ways: the droplet exhibited either fill or not–fill conditions at the corner. They used the
Concus–Finn condition to predict the corner filling behavior of the droplet [85-87]. Rath
and Kandlikar also observed a droplet jumping behavior (droplet would detach from the
horizontal base surface and move completely towards the sidewall of the channel) at the
transition angle between corner filling and non–filling for a given material pair [89].
Transition angle is a channel open angle for a given material pair below which the droplet
remained pinned to the sidewall and not fills the channel corners. However, at angles
greater than the transition angle, the droplet would fill the channel corners. Das et al. also
worked on a similar problem where they analyzed why the droplet always remains at a
finite distance from the corner, referring it to as the “enclosure effect” [95]. They
mentioned that the enclosure effect is dependent on the size of the droplet, surface
wettability and the dynamics of the drop evaporation. The authors also noted that the
evaporation flux plays an important role at the three-phase contact line of the droplet and
dictates the enclosure effect.
There has been a remarkable amount of research done on the water management
issue in PEMFCs. However, there is still a need for thorough understanding of the droplet
behavior at the channel corners to understand the intricate details that affect the droplet
pinning and water removal process inside the gas channels. Rath and Kandlikar studied
the droplet–sidewall interactions on a polycarbonate sidewall [90]. However, the research
was performed in a static condition where no airflow conditions in the system were
analyzed. On the other hand, in an actual fuel cell, airflow in the gas channel is a very
important criterion, which affects liquid water removal from the channel. Therefore, the
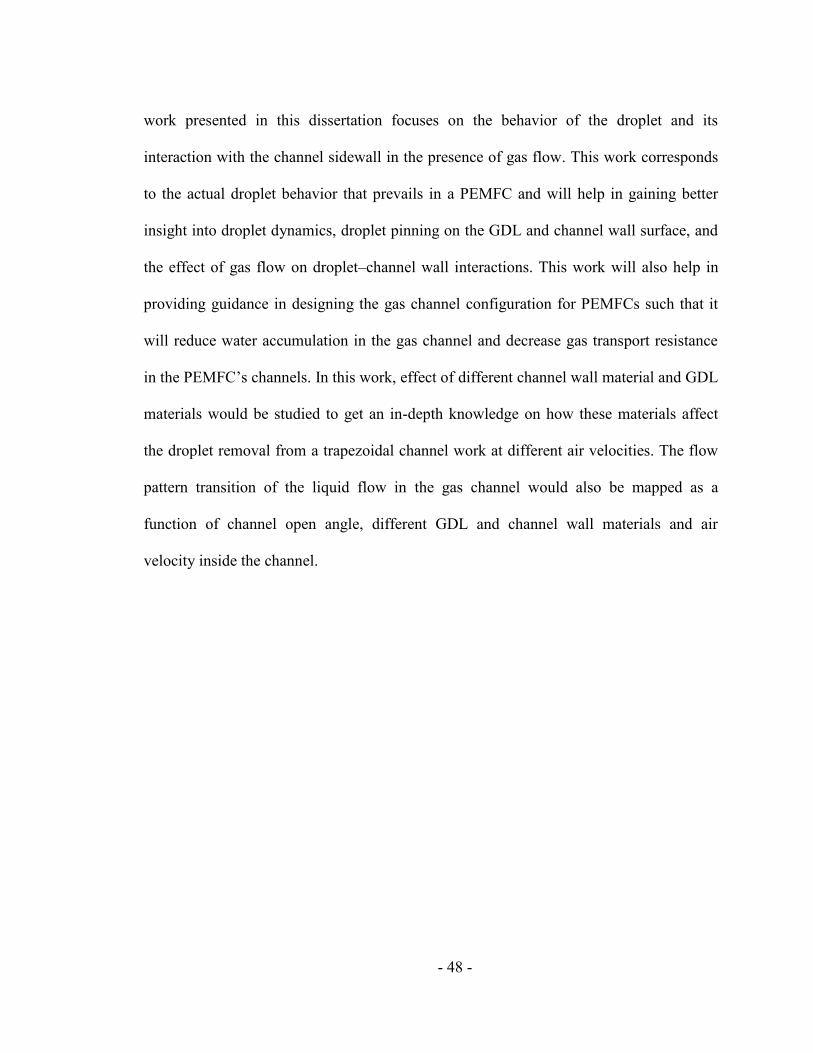
- 48 -
work presented in this dissertation focuses on the behavior of the droplet and its
interaction with the channel sidewall in the presence of gas flow. This work corresponds
to the actual droplet behavior that prevails in a PEMFC and will help in gaining better
insight into droplet dynamics, droplet pinning on the GDL and channel wall surface, and
the effect of gas flow on droplet–channel wall interactions. This work will also help in
providing guidance in designing the gas channel configuration for PEMFCs such that it
will reduce water accumulation in the gas channel and decrease gas transport resistance
in the PEMFC’s channels. In this work, effect of different channel wall material and GDL
materials would be studied to get an in-depth knowledge on how these materials affect
the droplet removal from a trapezoidal channel work at different air velocities. The flow
pattern transition of the liquid flow in the gas channel would also be mapped as a
function of channel open angle, different GDL and channel wall materials and air
velocity inside the channel.
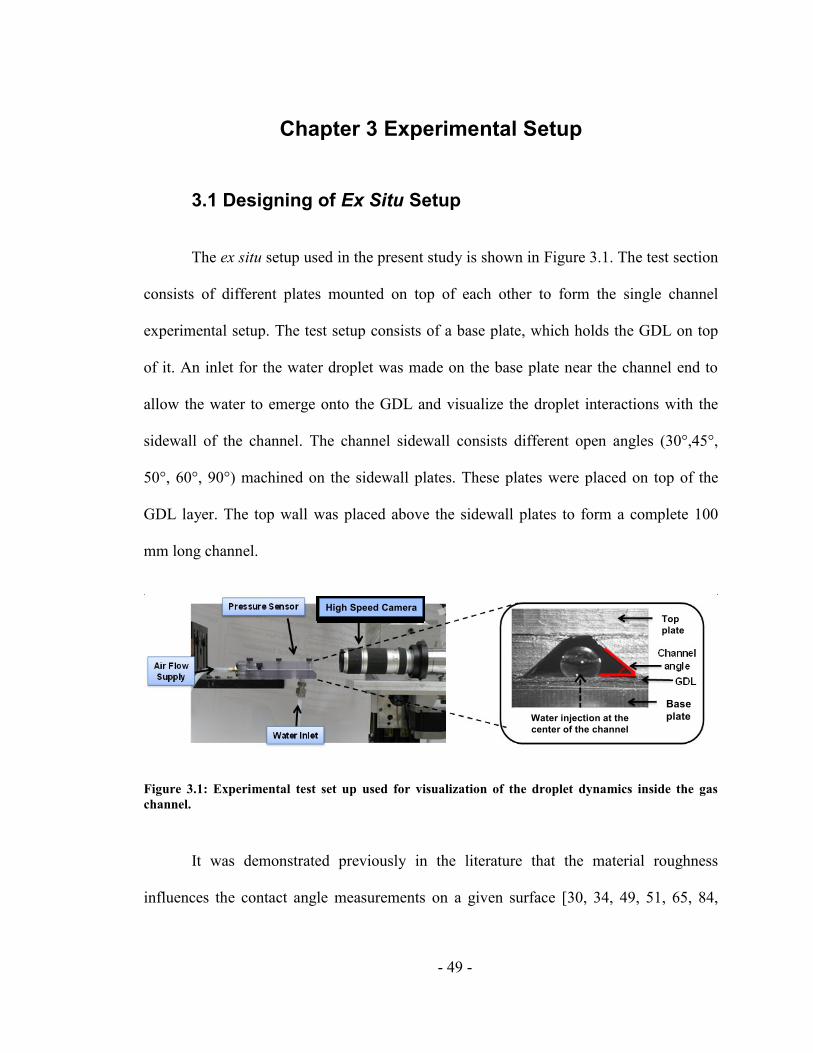
- 49 -
Chapter 3 Experimental Setup
3.1 Designing of Ex Situ Setup
The ex situ setup used in the present study is shown in Figure 3.1. The test section
consists of different plates mounted on top of each other to form the single channel
experimental setup. The test setup consists of a base plate, which holds the GDL on top
of it. An inlet for the water droplet was made on the base plate near the channel end to
allow the water to emerge onto the GDL and visualize the droplet interactions with the
sidewall of the channel. The channel sidewall consists different open angles (30°,45°,
50°, 60°, 90°) machined on the sidewall plates. These plates were placed on top of the
GDL layer. The top wall was placed above the sidewall plates to form a complete 100
mm long channel.
Figure 3.1: Experimental test set up used for visualization of the droplet dynamics inside the gas
channel.
It was demonstrated previously in the literature that the material roughness
influences the contact angle measurements on a given surface [30, 34, 49, 51, 65, 84,
High Speed Camera
Top
plate
Base
plateWater injection at the
center of the channel
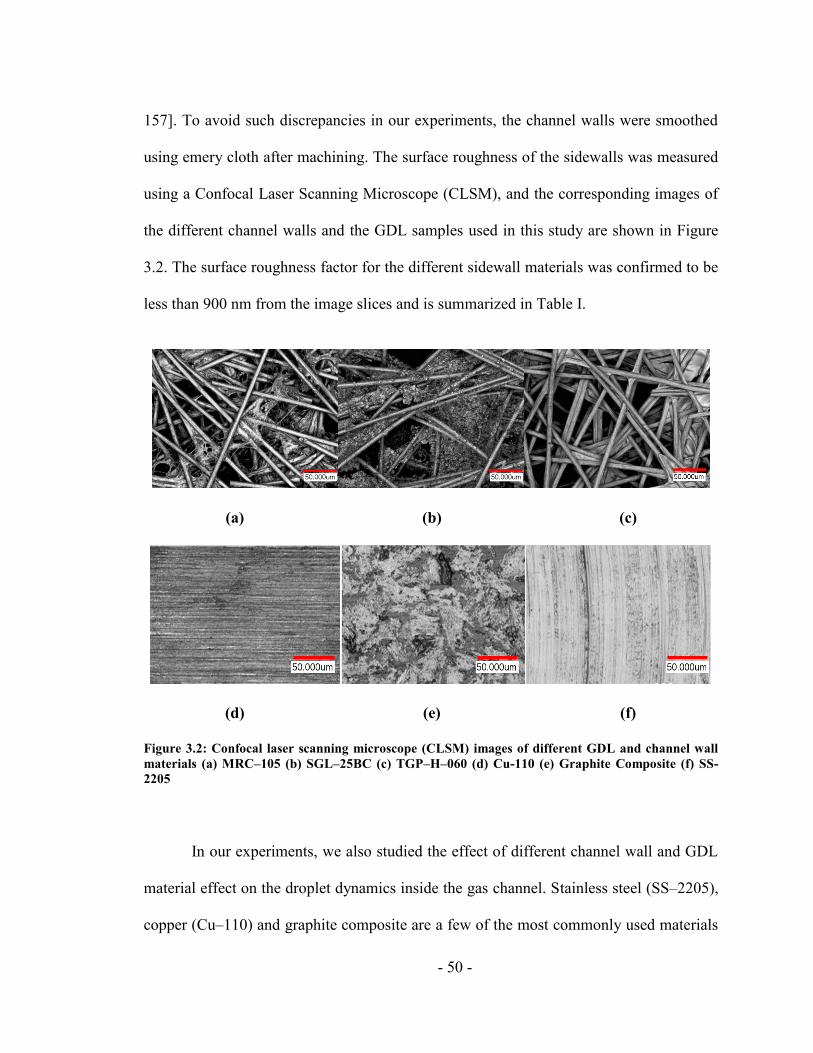
- 50 -
157]. To avoid such discrepancies in our experiments, the channel walls were smoothed
using emery cloth after machining. The surface roughness of the sidewalls was measured
using a Confocal Laser Scanning Microscope (CLSM), and the corresponding images of
the different channel walls and the GDL samples used in this study are shown in Figure
3.2. The surface roughness factor for the different sidewall materials was confirmed to be
less than 900 nm from the image slices and is summarized in Table I.
(a) (b) (c)
(d) (e) (f)
Figure 3.2: Confocal laser scanning microscope (CLSM) images of different GDL and channel wall
materials (a) MRC–105 (b) SGL–25BC (c) TGP–H–060 (d) Cu-110 (e) Graphite Composite (f) SS-
2205
In our experiments, we also studied the effect of different channel wall and GDL
material effect on the droplet dynamics inside the gas channel. Stainless steel (SS–2205),
copper (Cu–110) and graphite composite are a few of the most commonly used materials
- 51 -
for the bipolar plates in the PEMFCs. Therefore, all three of these channel sidewall
materials were tested. Along with this, different GDL materials such as SGL–25BC,
MRC–105 with 6% PTFE and TGP–H–060 with 6% PTFE were tested to understand the
effect of GDL material on droplet removal from the PEMFC gas channel. To evaluate the
performance difference due to GDL aging or deterioration, MRC–105 that was run for 40
and 125 hours in in situ experiment previously was compared with a fresh GDL sample
performance [119].
Table I: Surface roughness measured for the different sidewall materials used.
Material Surface Roughness (Ra)
Copper (Cu–110) 554 nm
Graphite Composite 873 nm
Stainless Steel (SS–2205) 558 nm
Polycarbonate (LexanTM) 666 nm
3.2 Experimentation
The ex situ experimental setup consists of four different sections connected to it
as shown in Figure 3.3. The different sections are as following (1) water system (2)
airflow system (3) visualization section and (4) pressure drop measuring system. Water
section consists of water stream coming from the main line that was passed through
deionized water generator to remove the ions from the water. The deionized water was
introduced on the GDL surface using a syringe pump from Harvard Apparatus (Model 11
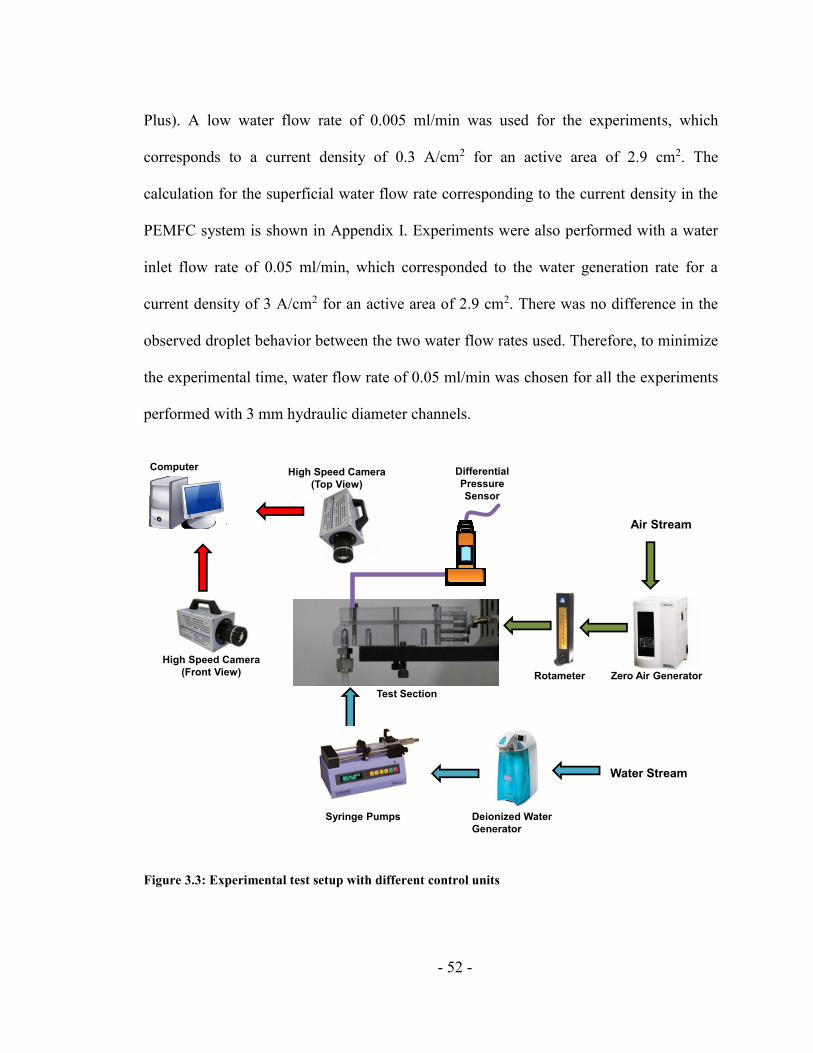
- 52 -
Plus). A low water flow rate of 0.005 ml/min was used for the experiments, which
corresponds to a current density of 0.3 A/cm2 for an active area of 2.9 cm2. The
calculation for the superficial water flow rate corresponding to the current density in the
PEMFC system is shown in Appendix I. Experiments were also performed with a water
inlet flow rate of 0.05 ml/min, which corresponded to the water generation rate for a
current density of 3 A/cm2 for an active area of 2.9 cm2. There was no difference in the
observed droplet behavior between the two water flow rates used. Therefore, to minimize
the experimental time, water flow rate of 0.05 ml/min was chosen for all the experiments
performed with 3 mm hydraulic diameter channels.
Figure 3.3: Experimental test setup with different control units
Zero Air Generator
Deionized Water
Generator
Air Stream
Syringe Pumps
Differential
Pressure
Sensor
Rotameter
Water Stream
Computer
Test Section
High Speed Camera
(Top View)
High Speed Camera
(Front View)
- 53 -
The airflow into the gas channel from the Parker Balston HPZA 18000 Zero Air
Generator was via an air manifold that was attached to the system at the rear end. The gas
flow was controlled using a rotameter, which was attached just before the air manifold.
Experiments were performed by varying the air velocity inside the channel. As the
channel sizes used were larger than real world fuel cell dimensions, the airflow rates used
in the system were matched according to the air velocities (v) observed in the real fuel
cell used for automobile application. The superficial air velocities between 0.2 and 2.4
m/s were simulated for a range of current densities from 0.1 to 1.1 A/cm2 for stoich of 1
and 2. These values would correspond to an active area of 50 cm2 in a typical fuel cell
that meets the Department of Energy specifications [133]. The superficial air velocity
calculation corresponding to the current density in the PEMFC system is shown in
Appendix I. The relationship between the air velocities used in this experiment
corresponding to the actual current densities for a single channel of dimension 183 mm
long, 0.4 mm deep and 0.7 mm wide is shown in Table II.
The visualization section consists of the high-speed video recordings to visualize
the droplet dynamics in the gas channel. High–speed videos were recorded using the
Keyence VW–6000 high–speed digital camera. The droplet dynamics with the sidewall
were captured at a frame rate of 250 fps. Videos were obtained from front as well as top
view to understand the droplet-corner interaction and the flow pattern transition observed
inside the gas channel as a function of channel angle, air velocity and material properties
(base and wall contact angle). During experimentation, the air velocity was set to a
desired value and the droplet was allowed to grow on the GDL surface. As the droplet
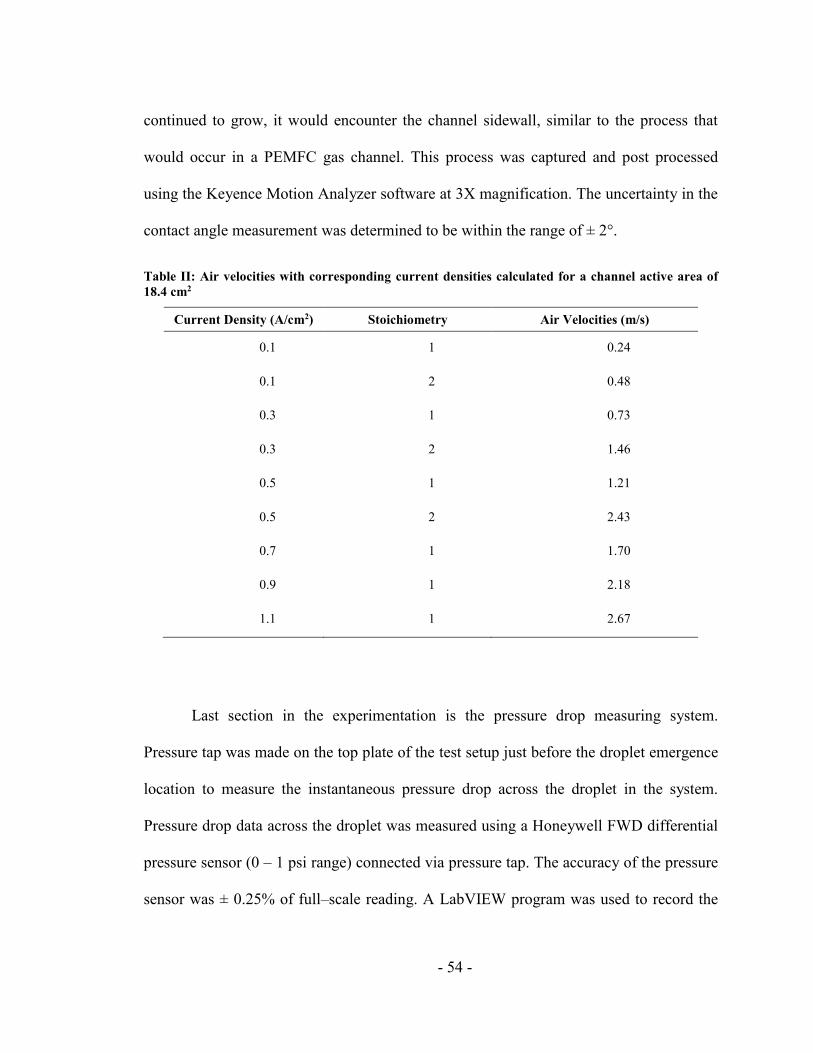
- 54 -
continued to grow, it would encounter the channel sidewall, similar to the process that
would occur in a PEMFC gas channel. This process was captured and post processed
using the Keyence Motion Analyzer software at 3X magnification. The uncertainty in the
contact angle measurement was determined to be within the range of ± 2°.
Table II: Air velocities with corresponding current densities calculated for a channel active area of
18.4 cm2
Current Density (A/cm2) Stoichiometry Air Velocities (m/s)
0.1 1 0.24
0.1 2 0.48
0.3 1 0.73
0.3 2 1.46
0.5 1 1.21
0.5 2 2.43
0.7 1 1.70
0.9 1 2.18
1.1 1 2.67
Last section in the experimentation is the pressure drop measuring system.
Pressure tap was made on the top plate of the test setup just before the droplet emergence
location to measure the instantaneous pressure drop across the droplet in the system.
Pressure drop data across the droplet was measured using a Honeywell FWD differential
pressure sensor (0 – 1 psi range) connected via pressure tap. The accuracy of the pressure
sensor was ± 0.25% of full–scale reading. A LabVIEW program was used to record the
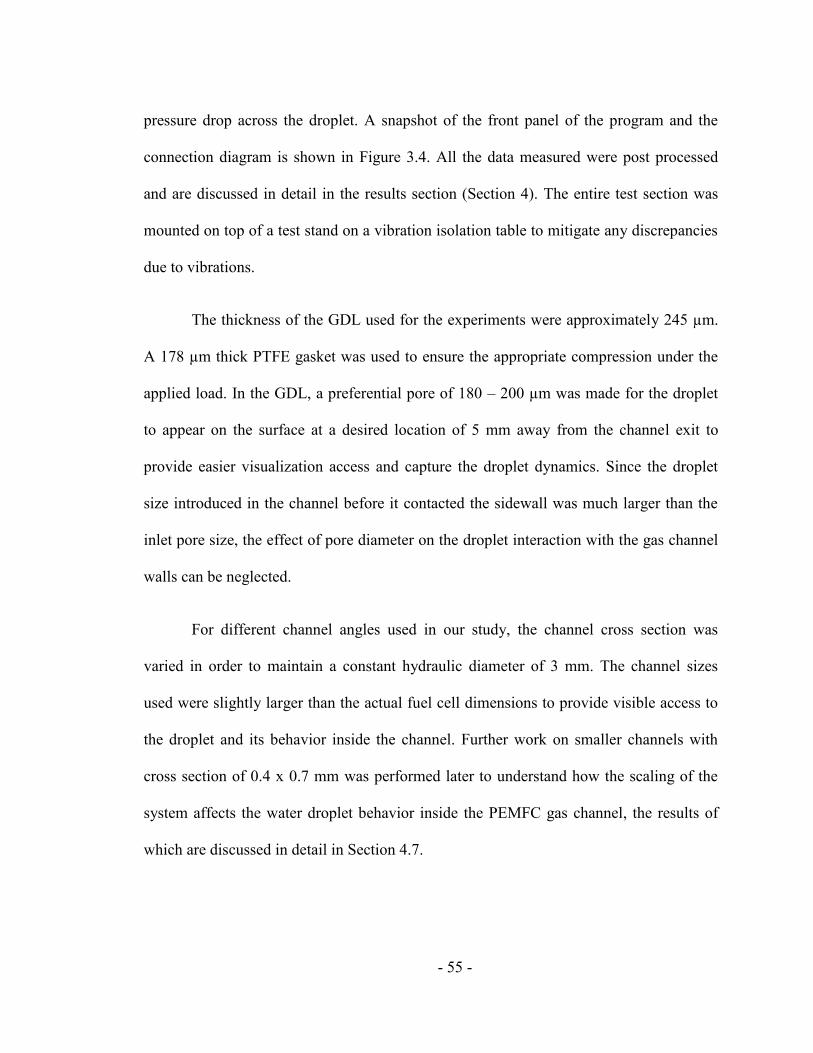
- 55 -
pressure drop across the droplet. A snapshot of the front panel of the program and the
connection diagram is shown in Figure 3.4. All the data measured were post processed
and are discussed in detail in the results section (Section 4). The entire test section was
mounted on top of a test stand on a vibration isolation table to mitigate any discrepancies
due to vibrations.
The thickness of the GDL used for the experiments were approximately 245 µm.
A 178 µm thick PTFE gasket was used to ensure the appropriate compression under the
applied load. In the GDL, a preferential pore of 180 – 200 µm was made for the droplet
to appear on the surface at a desired location of 5 mm away from the channel exit to
provide easier visualization access and capture the droplet dynamics. Since the droplet
size introduced in the channel before it contacted the sidewall was much larger than the
inlet pore size, the effect of pore diameter on the droplet interaction with the gas channel
walls can be neglected.
For different channel angles used in our study, the channel cross section was
varied in order to maintain a constant hydraulic diameter of 3 mm. The channel sizes
used were slightly larger than the actual fuel cell dimensions to provide visible access to
the droplet and its behavior inside the channel. Further work on smaller channels with
cross section of 0.4 x 0.7 mm was performed later to understand how the scaling of the
system affects the water droplet behavior inside the PEMFC gas channel, the results of
which are discussed in detail in Section 4.7.
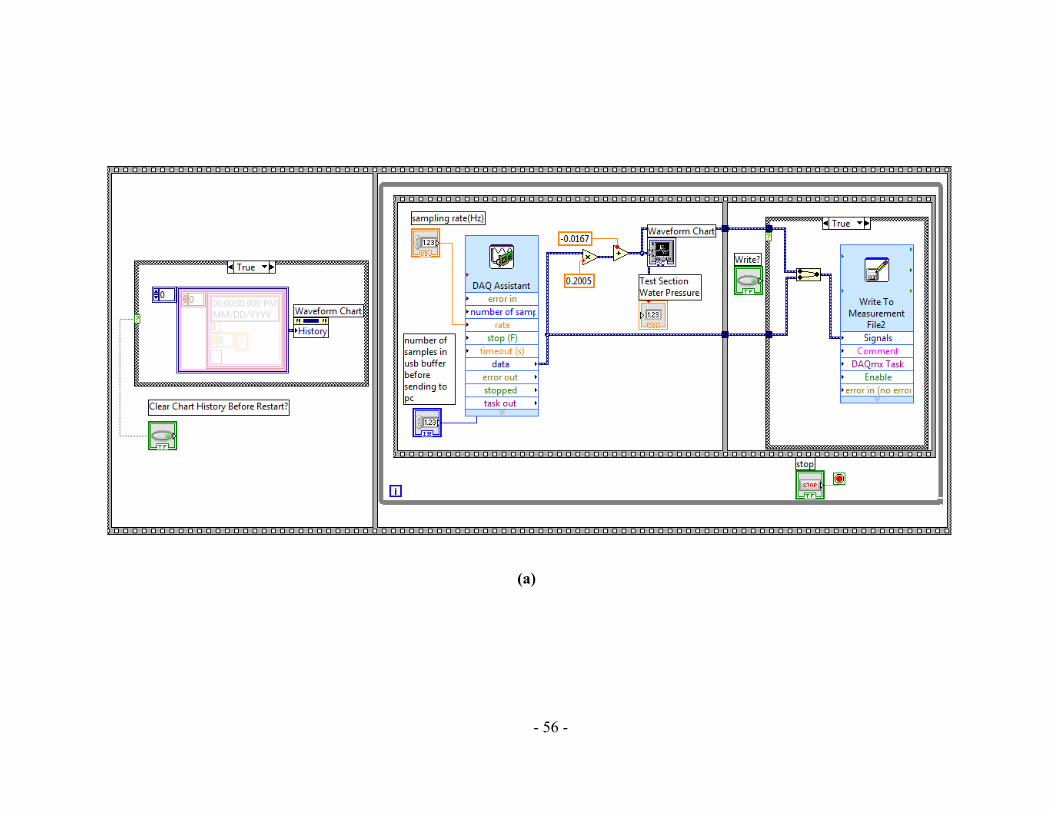
- 56 -
(a)
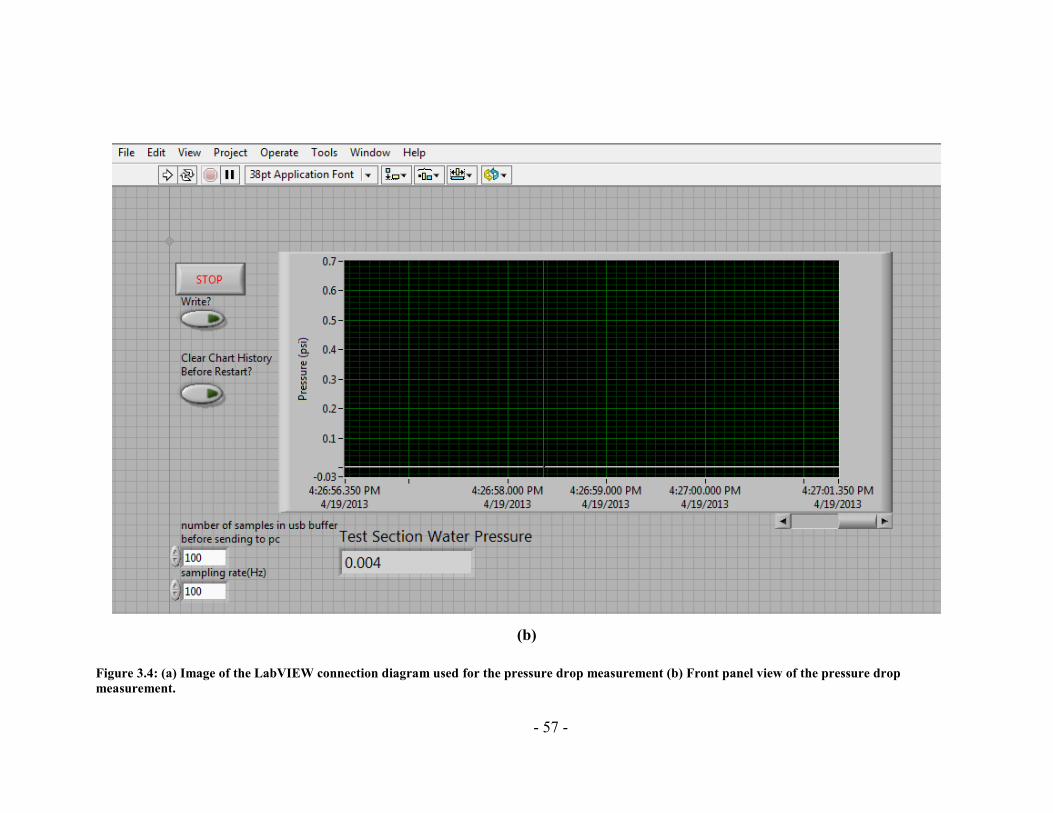
- 57 -
(b)
Figure 3.4: (a) Image of the LabVIEW connection diagram used for the pressure drop measurement (b) Front panel view of the pressure drop
measurement.
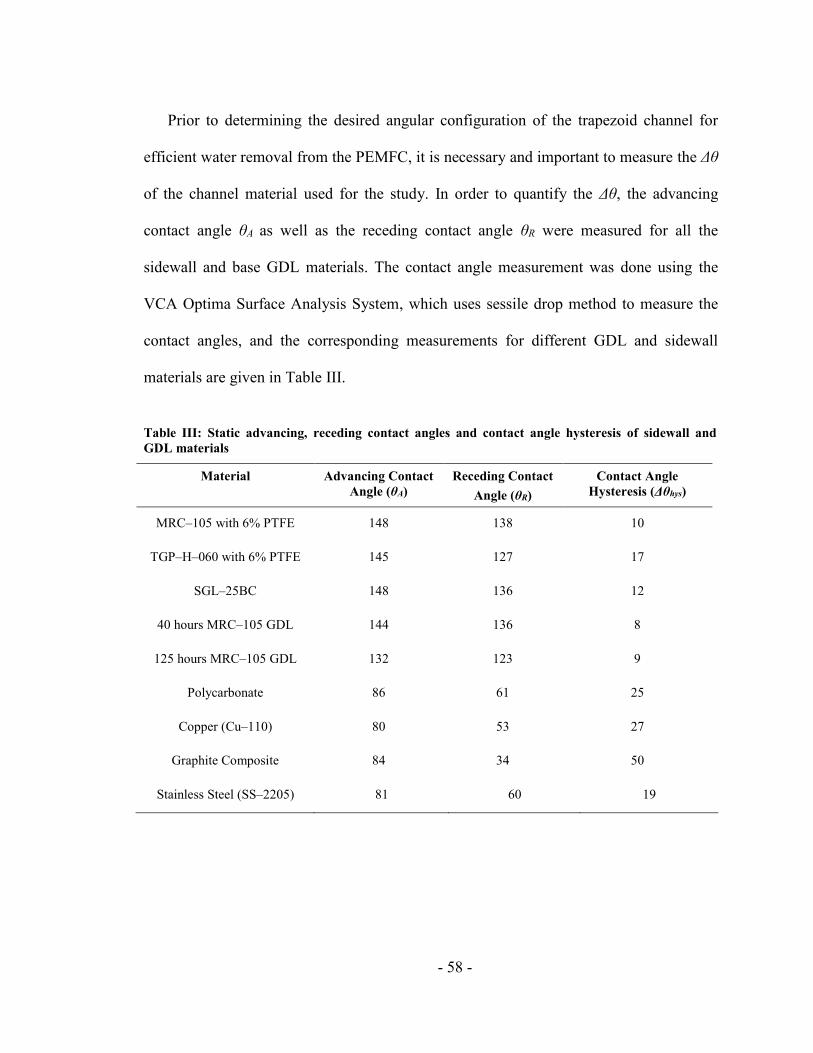
- 58 -
Prior to determining the desired angular configuration of the trapezoid channel for
efficient water removal from the PEMFC, it is necessary and important to measure the Δθ
of the channel material used for the study. In order to quantify the Δθ, the advancing
contact angle θA as well as the receding contact angle θR were measured for all the
sidewall and base GDL materials. The contact angle measurement was done using the
VCA Optima Surface Analysis System, which uses sessile drop method to measure the
contact angles, and the corresponding measurements for different GDL and sidewall
materials are given in Table III.
Table III: Static advancing, receding contact angles and contact angle hysteresis of sidewall and
GDL materials
Material Advancing Contact
Angle (θA)
Receding Contact
Angle (θR)
Contact Angle
Hysteresis (Δθhys)
MRC–105 with 6% PTFE 148 138 10
TGP–H–060 with 6% PTFE 145 127 17
SGL–25BC 148 136 12
40 hours MRC–105 GDL 144 136 8
125 hours MRC–105 GDL 132 123 9
Polycarbonate 86 61 25
Copper (Cu–110) 80 53 27
Graphite Composite 84 34 50
Stainless Steel (SS–2205) 81 60 19
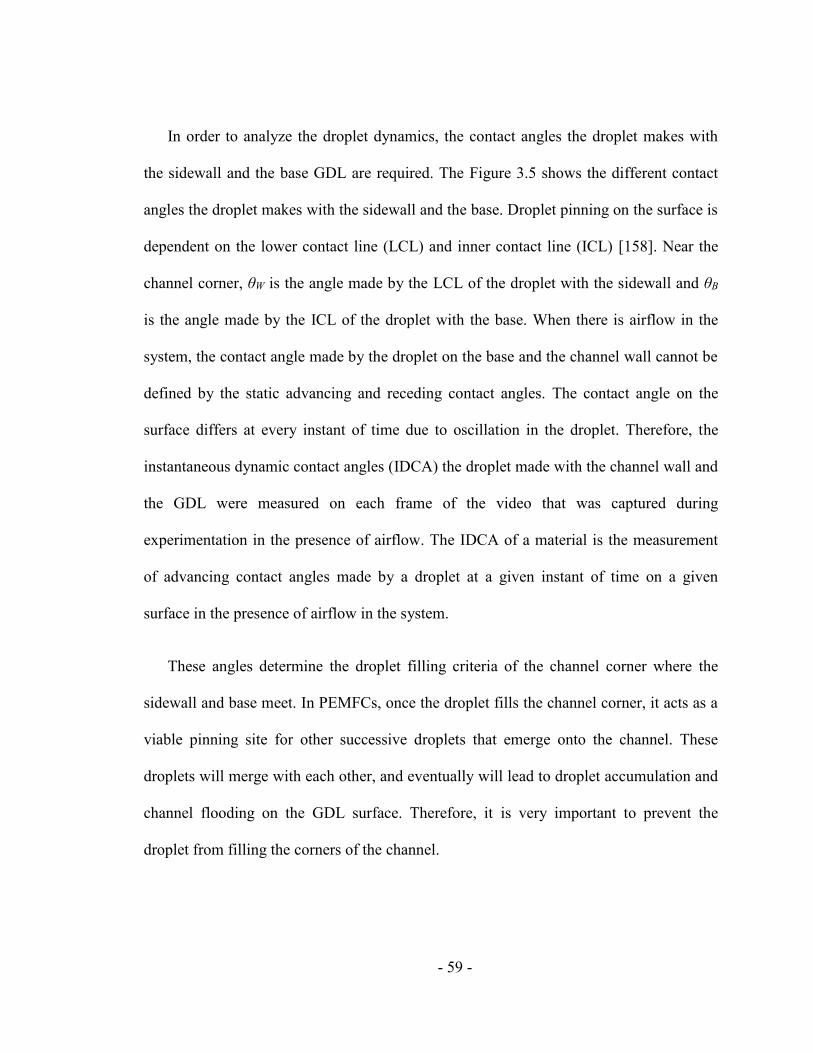
- 59 -
In order to analyze the droplet dynamics, the contact angles the droplet makes with
the sidewall and the base GDL are required. The Figure 3.5 shows the different contact
angles the droplet makes with the sidewall and the base. Droplet pinning on the surface is
dependent on the lower contact line (LCL) and inner contact line (ICL) [158]. Near the
channel corner, θW is the angle made by the LCL of the droplet with the sidewall and θB
is the angle made by the ICL of the droplet with the base. When there is airflow in the
system, the contact angle made by the droplet on the base and the channel wall cannot be
defined by the static advancing and receding contact angles. The contact angle on the
surface differs at every instant of time due to oscillation in the droplet. Therefore, the
instantaneous dynamic contact angles (IDCA) the droplet made with the channel wall and
the GDL were measured on each frame of the video that was captured during
experimentation in the presence of airflow. The IDCA of a material is the measurement
of advancing contact angles made by a droplet at a given instant of time on a given
surface in the presence of airflow in the system.
These angles determine the droplet filling criteria of the channel corner where the
sidewall and base meet. In PEMFCs, once the droplet fills the channel corner, it acts as a
viable pinning site for other successive droplets that emerge onto the channel. These
droplets will merge with each other, and eventually will lead to droplet accumulation and
channel flooding on the GDL surface. Therefore, it is very important to prevent the
droplet from filling the corners of the channel.
- 60 -
Figure 3.5: Image of a droplet touching the base GDL and the sidewall of a channel. This shows the
different contact lines the droplet makes with the different surfaces. Adapted from [90]
As mentioned earlier, the Concus–Finn condition was used to predict the liquid
behavior in the corner of a channel. They used the 2D graph as shown in Figure 2.8(b) for
predicting the droplet behavior in the corner of the channel. To make the plots simple to
understand for our particular application, instead of drawing the whole box to indicate the
filling region as shown by Concus–Finn in their work, only the upper limit line of the box
was used. This would imply that for any contact angle points falling below the Concus–
Finn limit (CFL) line or transition point, the droplet would move towards the corner of
the channel and would ultimately fill the corner of the channel. If the IDCA point falls
above the CFL line, then the droplet would remain pinned to the sidewall and not move
towards the channel corner. Therefore, using the static contact angles, the CFL for non–
filling condition of the channel corners is predicted by the Eq. 3.2
θB
θW
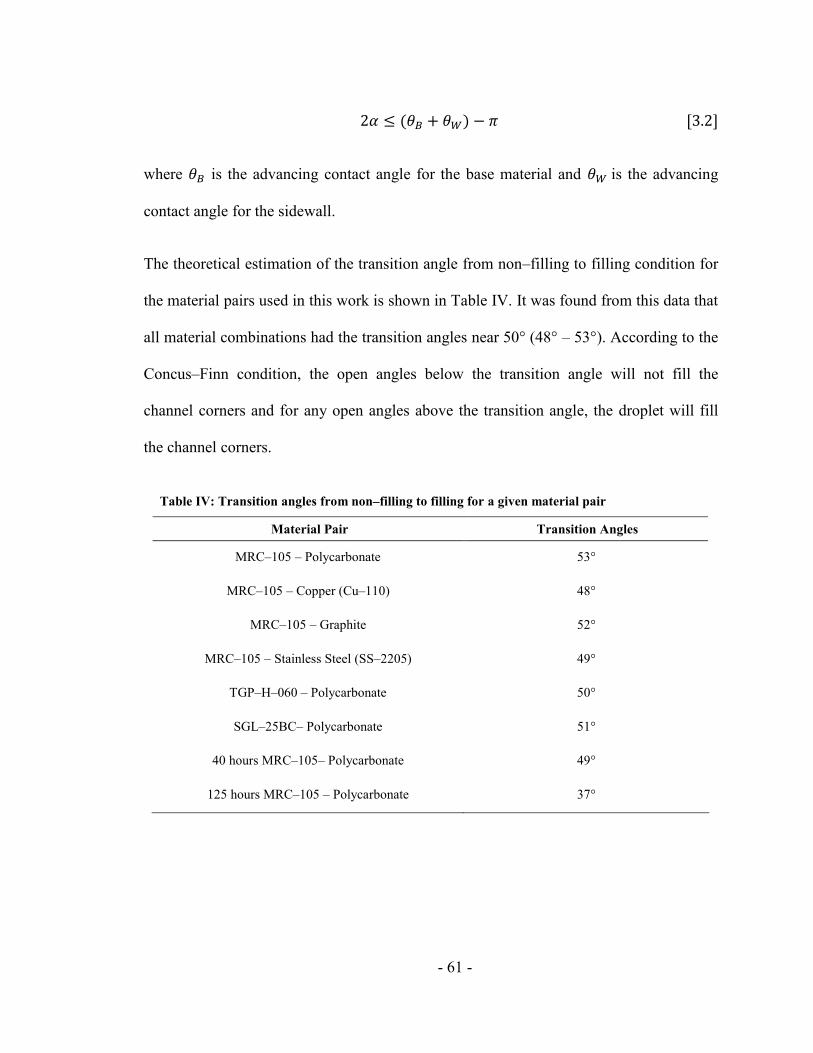
- 61 -
2𝛼 ≤ (𝜃𝐵 + 𝜃𝑊) − 𝜋 [3.2]
where 𝜃𝐵 is the advancing contact angle for the base material and 𝜃𝑊 is the advancing
contact angle for the sidewall.
The theoretical estimation of the transition angle from non–filling to filling condition for
the material pairs used in this work is shown in Table IV. It was found from this data that
all material combinations had the transition angles near 50° (48° – 53°). According to the
Concus–Finn condition, the open angles below the transition angle will not fill the
channel corners and for any open angles above the transition angle, the droplet will fill
the channel corners.
Table IV: Transition angles from non–filling to filling for a given material pair
Material Pair Transition Angles
MRC–105 – Polycarbonate 53°
MRC–105 – Copper (Cu–110) 48°
MRC–105 – Graphite 52°
MRC–105 – Stainless Steel (SS–2205) 49°
TGP–H–060 – Polycarbonate 50°
SGL–25BC– Polycarbonate 51°
40 hours MRC–105– Polycarbonate 49°
125 hours MRC–105 – Polycarbonate 37°
- 62 -
Chapter 4 Experimental Results
High–speed videos at frame rates of 250 fps were captured in order to see the
droplet dynamic behavior in the gas channel with different trapezoidal angular
configurations. Frame by frame analysis was performed on the videos to estimate the
IDCA and the movement of the droplet with airflow. Pressure drop data was recorded for
all the experiments performed and processed to evaluate the effect of different parameters
(channel open angle, superficial air velocity, channel material, GDL material, GDL
degradation, channel scaling and droplet inlet location) on the droplet dynamics in the
system. More than 500 experimental cycles were performed and analyzed. Corner filling
and non-filling behavior was analyzed for all the experiments performed. One of the
major observations was that the IDCA made by the droplet on the sidewall and the GDL
was outside the range of the static advancing and receding contact angles. The airflow
causes oscillations in the droplet interface introducing significant variations in the
associated dynamic contact angles.
4.1 Effect of Channel Wall Angle
To evaluate the effect of the channel trapezoid angle on the droplet dynamics,
experiments were performed with five different sidewall angles (30°, 45°, 50°,60°, 90°)
for air velocities of 0.4 and 2 m/s. Figure 4.1 shows the image sequence of the video
captured for the droplet behavior at 30° for air velocity of 0.4 m/s. The video was
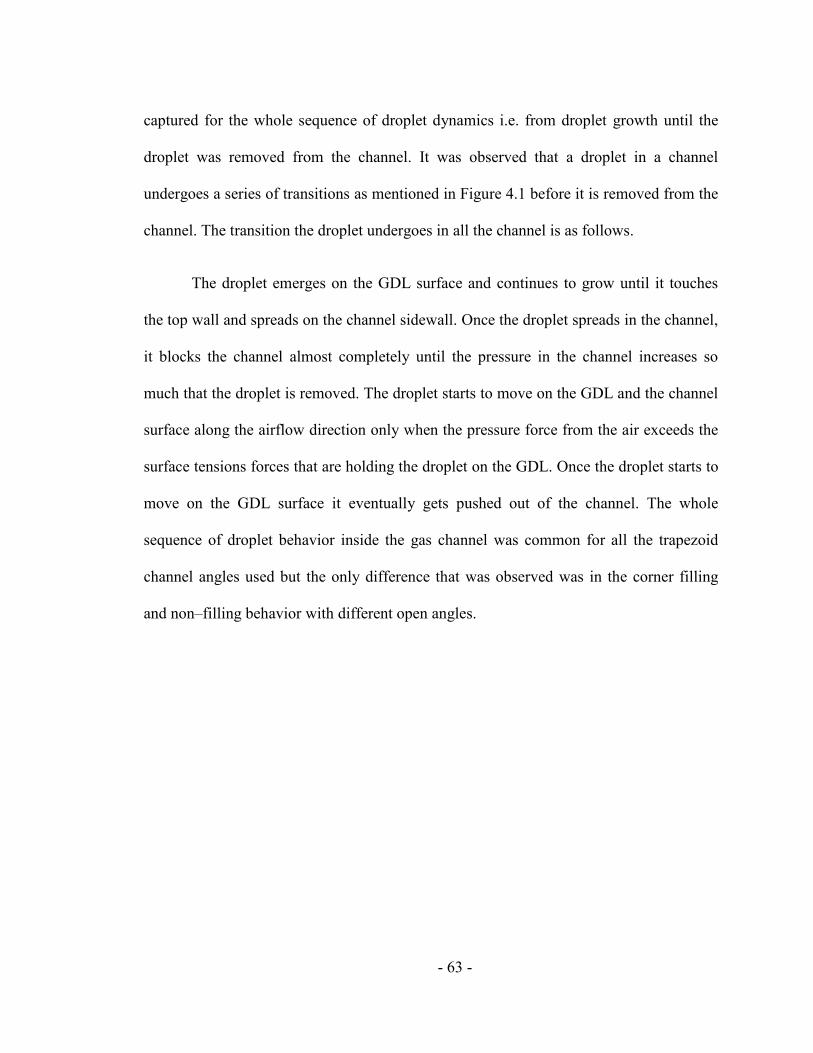
- 63 -
captured for the whole sequence of droplet dynamics i.e. from droplet growth until the
droplet was removed from the channel. It was observed that a droplet in a channel
undergoes a series of transitions as mentioned in Figure 4.1 before it is removed from the
channel. The transition the droplet undergoes in all the channel is as follows.
The droplet emerges on the GDL surface and continues to grow until it touches
the top wall and spreads on the channel sidewall. Once the droplet spreads in the channel,
it blocks the channel almost completely until the pressure in the channel increases so
much that the droplet is removed. The droplet starts to move on the GDL and the channel
surface along the airflow direction only when the pressure force from the air exceeds the
surface tensions forces that are holding the droplet on the GDL. Once the droplet starts to
move on the GDL surface it eventually gets pushed out of the channel. The whole
sequence of droplet behavior inside the gas channel was common for all the trapezoid
channel angles used but the only difference that was observed was in the corner filling
and non–filling behavior with different open angles.
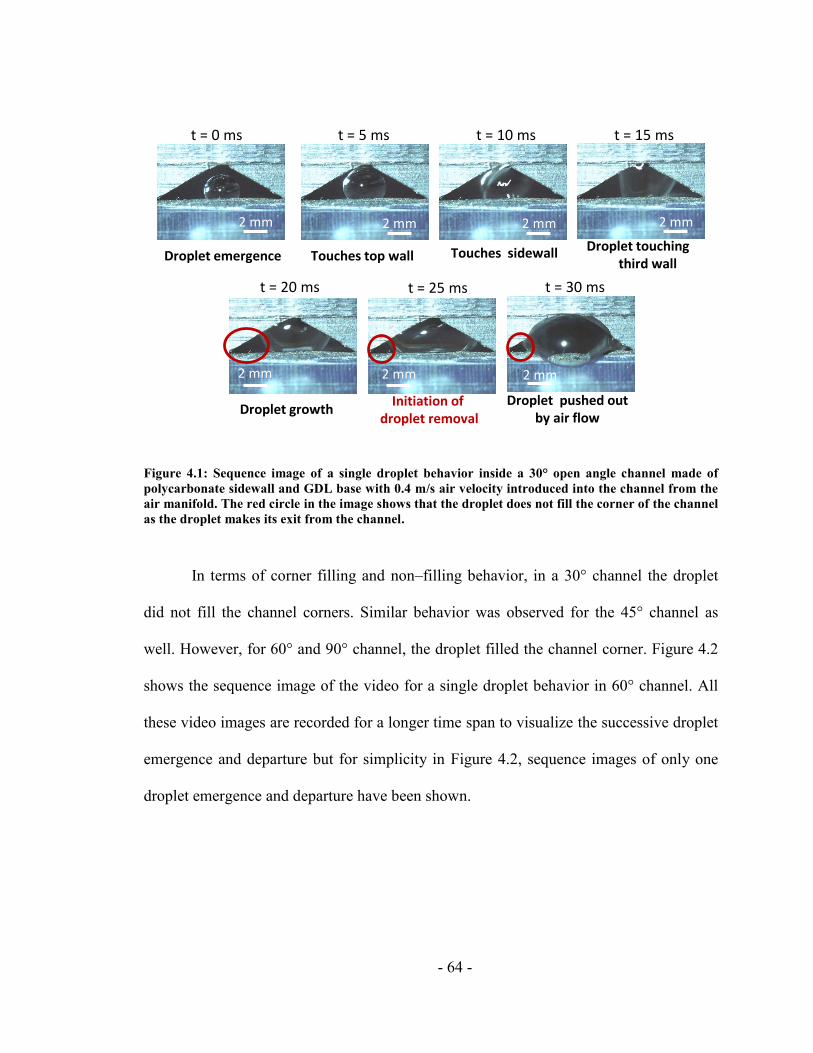
- 64 -
Figure 4.1: Sequence image of a single droplet behavior inside a 30° open angle channel made of
polycarbonate sidewall and GDL base with 0.4 m/s air velocity introduced into the channel from the
air manifold. The red circle in the image shows that the droplet does not fill the corner of the channel
as the droplet makes its exit from the channel.
In terms of corner filling and non–filling behavior, in a 30° channel the droplet
did not fill the channel corners. Similar behavior was observed for the 45° channel as
well. However, for 60° and 90° channel, the droplet filled the channel corner. Figure 4.2
shows the sequence image of the video for a single droplet behavior in 60° channel. All
these video images are recorded for a longer time span to visualize the successive droplet
emergence and departure but for simplicity in Figure 4.2, sequence images of only one
droplet emergence and departure have been shown.
Droplet emergence Touches top wall
Initiation of droplet removal
Droplet pushed out by air flow
Droplet growth
Touches sidewall Droplet touching third wall
2 mm 2 mm 2 mm 2 mm
2 mm 2 mm 2 mm 2 mm
t = 0 ms t = 5 ms t = 10 ms t = 15 ms
t = 20 ms t = 25 ms t = 30 ms
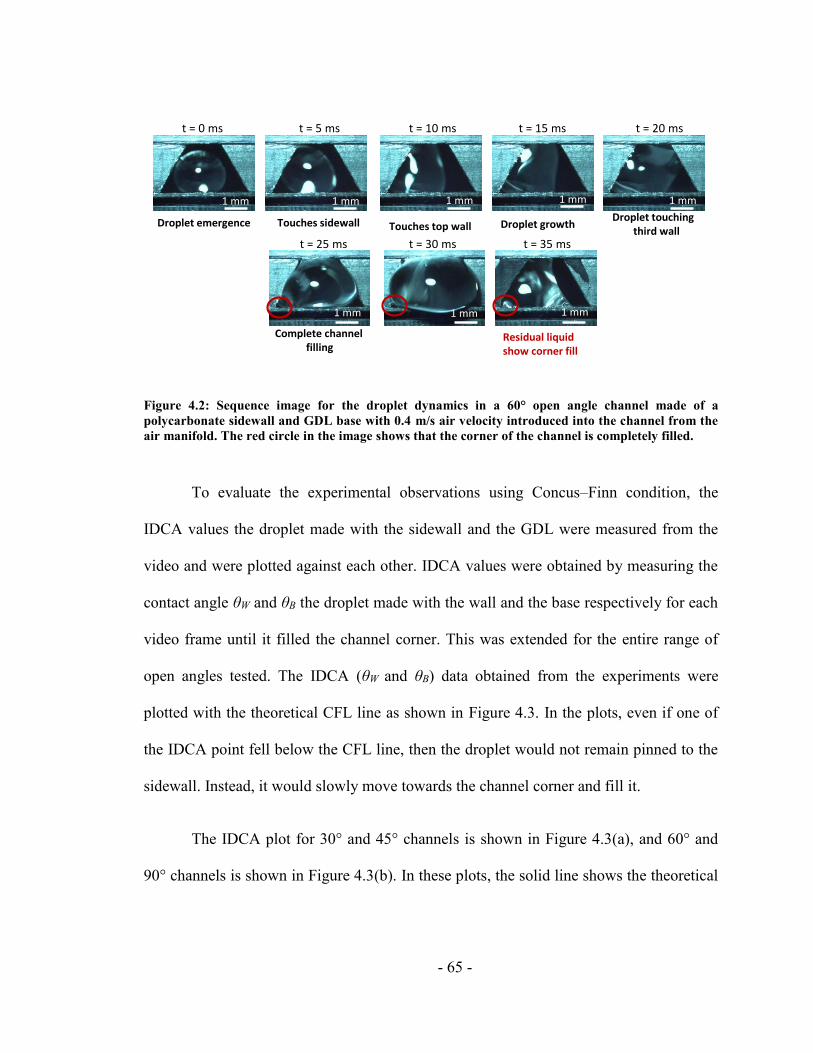
- 65 -
Figure 4.2: Sequence image for the droplet dynamics in a 60° open angle channel made of a
polycarbonate sidewall and GDL base with 0.4 m/s air velocity introduced into the channel from the
air manifold. The red circle in the image shows that the corner of the channel is completely filled.
To evaluate the experimental observations using Concus–Finn condition, the
IDCA values the droplet made with the sidewall and the GDL were measured from the
video and were plotted against each other. IDCA values were obtained by measuring the
contact angle θW and θB the droplet made with the wall and the base respectively for each
video frame until it filled the channel corner. This was extended for the entire range of
open angles tested. The IDCA (θW and θB) data obtained from the experiments were
plotted with the theoretical CFL line as shown in Figure 4.3. In the plots, even if one of
the IDCA point fell below the CFL line, then the droplet would not remain pinned to the
sidewall. Instead, it would slowly move towards the channel corner and fill it.
The IDCA plot for 30° and 45° channels is shown in Figure 4.3(a), and 60° and
90° channels is shown in Figure 4.3(b). In these plots, the solid line shows the theoretical
Droplet emergence Touches sidewall
Residual liquidshow corner fill
Complete channel filling
Droplet growth Touches top wallDroplet touching
third wall
1 mm 1 mm 1 mm 1 mm 1 mm
1 mm 1 mm 1 mm
t = 0 ms t = 5 ms t = 10 ms t = 15 ms t = 20 ms
t = 25 ms t = 30 ms t = 35 ms
- 66 -
CFL for a particular channel angle. The dotted line for ΔθB and ΔθW shows the static Δθ
observed for the base GDL and the sidewall respectively. The filled boxes in the plot
shows the filling contact angle, i.e. the contact angle values that would attract the droplet
towards the corner of the channel and the open boxes shows the non–filling dynamic
contact angle values which would not lead to corner filling scenario. Figure 4.3 clearly
shows that the IDCA points for the 30° and 45° channels obtained from the experimental
results fell above the CFL line. This indicates that the droplet would not fill the corner,
which matched the experimental results observed from the videos. For the 60° and 90°
channels, the contact angle points fell below the CFL line showing that the corner should
be filled. The observed results were similar for all the air velocities used in the study.
These results were also consistent with the findings shown by Rath and Kandlikar for a
static condition (no airflow rate introduced in the system) [89, 90]. However, for the 50°
channel, which is near the transition point for corner filling behavior according to the
Concus–Finn condition, the experimental results showed different behavior at different
air velocities [94]. These results are discussed in more detail in the next section (Section
4.2).
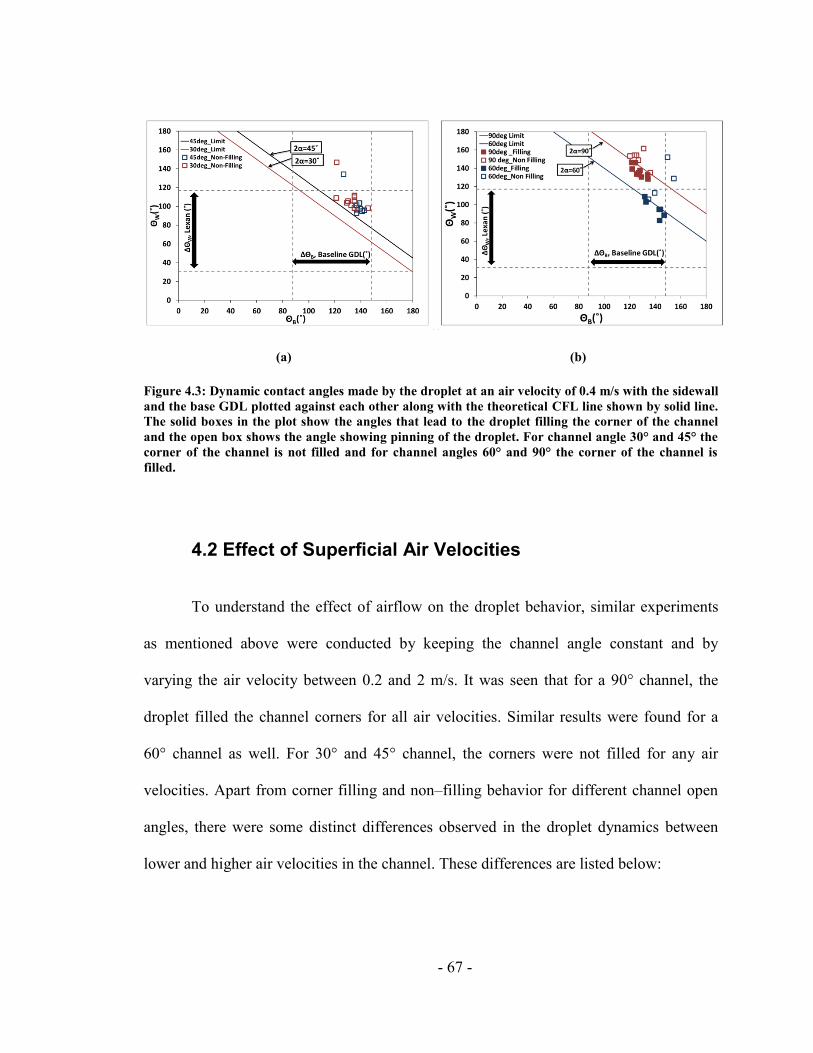
- 67 -
(a) (b)
Figure 4.3: Dynamic contact angles made by the droplet at an air velocity of 0.4 m/s with the sidewall
and the base GDL plotted against each other along with the theoretical CFL line shown by solid line.
The solid boxes in the plot show the angles that lead to the droplet filling the corner of the channel
and the open box shows the angle showing pinning of the droplet. For channel angle 30° and 45° the
corner of the channel is not filled and for channel angles 60° and 90° the corner of the channel is
filled.
4.2 Effect of Superficial Air Velocities
To understand the effect of airflow on the droplet behavior, similar experiments
as mentioned above were conducted by keeping the channel angle constant and by
varying the air velocity between 0.2 and 2 m/s. It was seen that for a 90° channel, the
droplet filled the channel corners for all air velocities. Similar results were found for a
60° channel as well. For 30° and 45° channel, the corners were not filled for any air
velocities. Apart from corner filling and non–filling behavior for different channel open
angles, there were some distinct differences observed in the droplet dynamics between
lower and higher air velocities in the channel. These differences are listed below:
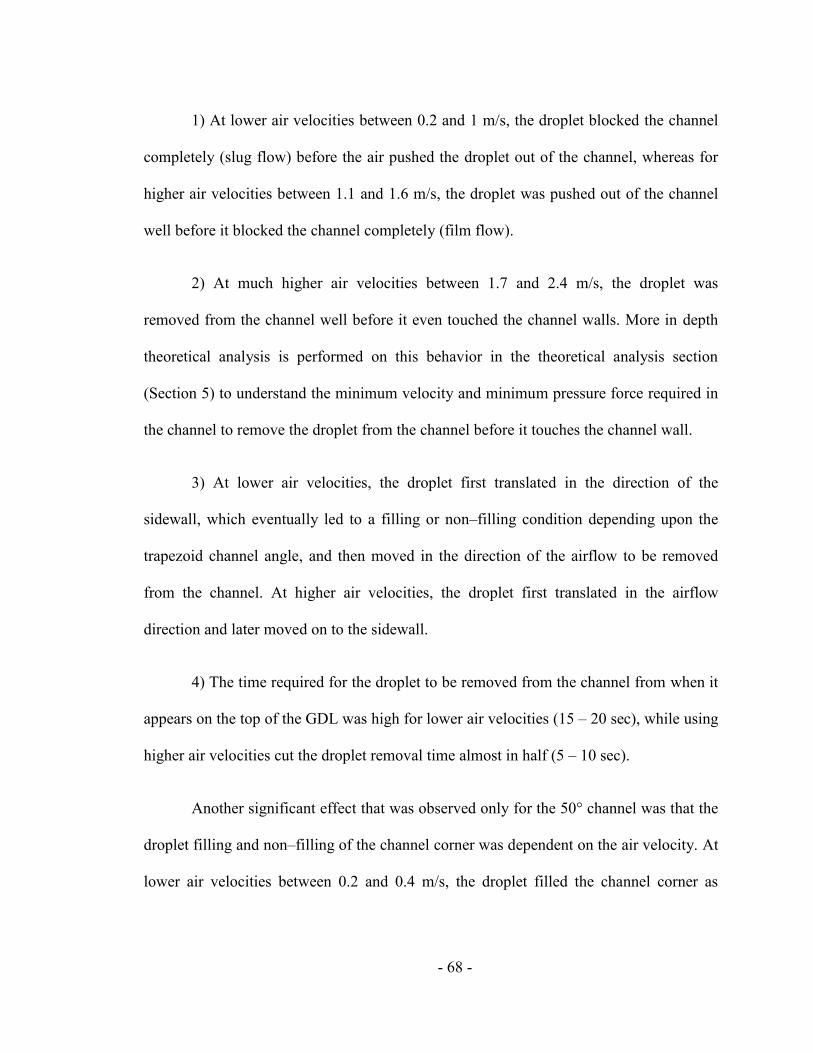
- 68 -
1) At lower air velocities between 0.2 and 1 m/s, the droplet blocked the channel
completely (slug flow) before the air pushed the droplet out of the channel, whereas for
higher air velocities between 1.1 and 1.6 m/s, the droplet was pushed out of the channel
well before it blocked the channel completely (film flow).
2) At much higher air velocities between 1.7 and 2.4 m/s, the droplet was
removed from the channel well before it even touched the channel walls. More in depth
theoretical analysis is performed on this behavior in the theoretical analysis section
(Section 5) to understand the minimum velocity and minimum pressure force required in
the channel to remove the droplet from the channel before it touches the channel wall.
3) At lower air velocities, the droplet first translated in the direction of the
sidewall, which eventually led to a filling or non–filling condition depending upon the
trapezoid channel angle, and then moved in the direction of the airflow to be removed
from the channel. At higher air velocities, the droplet first translated in the airflow
direction and later moved on to the sidewall.
4) The time required for the droplet to be removed from the channel from when it
appears on the top of the GDL was high for lower air velocities (15 – 20 sec), while using
higher air velocities cut the droplet removal time almost in half (5 – 10 sec).
Another significant effect that was observed only for the 50° channel was that the
droplet filling and non–filling of the channel corner was dependent on the air velocity. At
lower air velocities between 0.2 and 0.4 m/s, the droplet filled the channel corner as
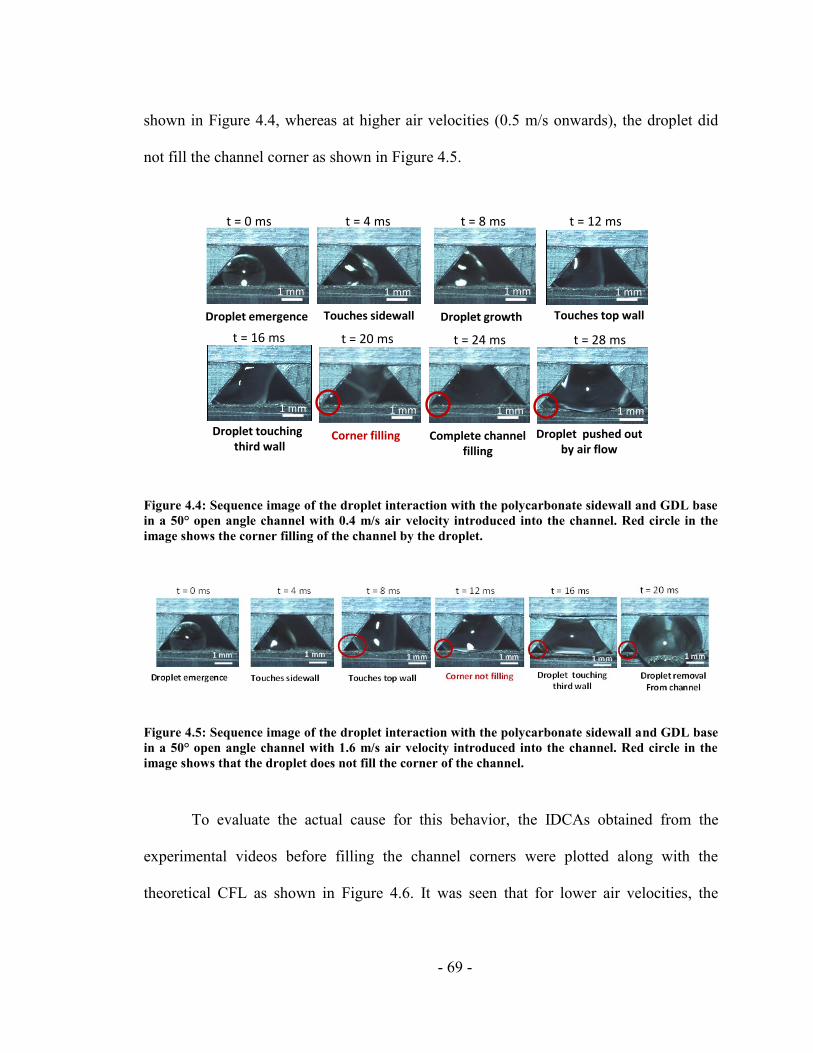
- 69 -
shown in Figure 4.4, whereas at higher air velocities (0.5 m/s onwards), the droplet did
not fill the channel corner as shown in Figure 4.5.
Figure 4.4: Sequence image of the droplet interaction with the polycarbonate sidewall and GDL base
in a 50° open angle channel with 0.4 m/s air velocity introduced into the channel. Red circle in the
image shows the corner filling of the channel by the droplet.
Figure 4.5: Sequence image of the droplet interaction with the polycarbonate sidewall and GDL base
in a 50° open angle channel with 1.6 m/s air velocity introduced into the channel. Red circle in the
image shows that the droplet does not fill the corner of the channel.
To evaluate the actual cause for this behavior, the IDCAs obtained from the
experimental videos before filling the channel corners were plotted along with the
theoretical CFL as shown in Figure 4.6. It was seen that for lower air velocities, the
1 mm
Droplet emergence Touches sidewall
Corner filling Complete channel filling
Droplet pushed out by air flow
Droplet growth Touches top wall
t = 0 ms t = 4 ms t = 8 ms t = 12 ms
t = 24 ms t = 28 mst = 20 ms
1 mm 1 mm 1 mm 1 mm
1 mm 1 mm 1 mm 1 mm
Droplet touching third wall
t = 16 ms
1 mm
- 70 -
IDCA made with the sidewall and the base GDL measured from the video were found to
lie below the CFL line implying that the droplet should fill the channel corner, while for
higher air velocities, the contact angle points were above the CFL line. These results were
similar to what was observed from the experimental videos. From these observations, it
can be inferred that the air velocities inside the channel manipulates the droplet and
oscillates it before it contacts the sidewall. For open angles closer to transition angle,
these oscillations in the droplet drive the channel corner filling and non–filling behavior
at different air velocities. According to the static advancing contact angle values for the
GDL and polycarbonate sidewall, the transition angle is 53°. Experimentally, a 50°
channel marks the transition point from non–filling to filling.
To further characterize the effect of airflow on the droplet in different channel
angular configurations, the length of the sidewall (polycarbonate length) and the length of
the GDL (GDL length) from the corner of the channel which were left non–wetted by the
droplet for a given instant of time, as shown in Figure 4.7, were also measured and
plotted. This will provide the amount of clearance length left open near the channel
corner when the droplet is pinned onto the surface. This plot will also give insight on the
time required by the droplet to fill the channel corner in a particular angular
configuration.

- 71 -
(a) (b)
Figure 4.6: Dynamic contact angles made by the droplet in a 50° open angle channel made up of
polycarbonate sidewall and the base GDL plotted against each other along with the theoretical CFL
line shown by solid line at different air velocities a) 0.2 m/s and b) 1.6 m/s
Figure 4.7: Length of the sidewall (Lexan length) and the length of the GDL (GDL length) from the
corner of the channel which was left non–wetted by the droplet at a given instant of time
The length measurement was done manually using Keyence Motion Analyzer
software by going through each frame in the video and measuring the wetted and non–
wetted length values for a particular time. Figure 4.8 shows the length of the non–wetted
0
20
40
60
80
100
120
140
160
180
0 20 40 60 80 100 120 140 160 180
θW
(˚)
θB (˚)
50deg_Limit
0.2 m/s_Filling
0.2 m/s_Non-Filling
ΔθW
ΔθB
2α=50˚
0
20
40
60
80
100
120
140
160
180
0 20 40 60 80 100 120 140 160 180
θW
(˚)
θB (˚)
50deg_Limit
1.6 m/s_Non-Filling
1.6 m/s_Filling
ΔθW
ΔθB
2α=50˚
GDL Length
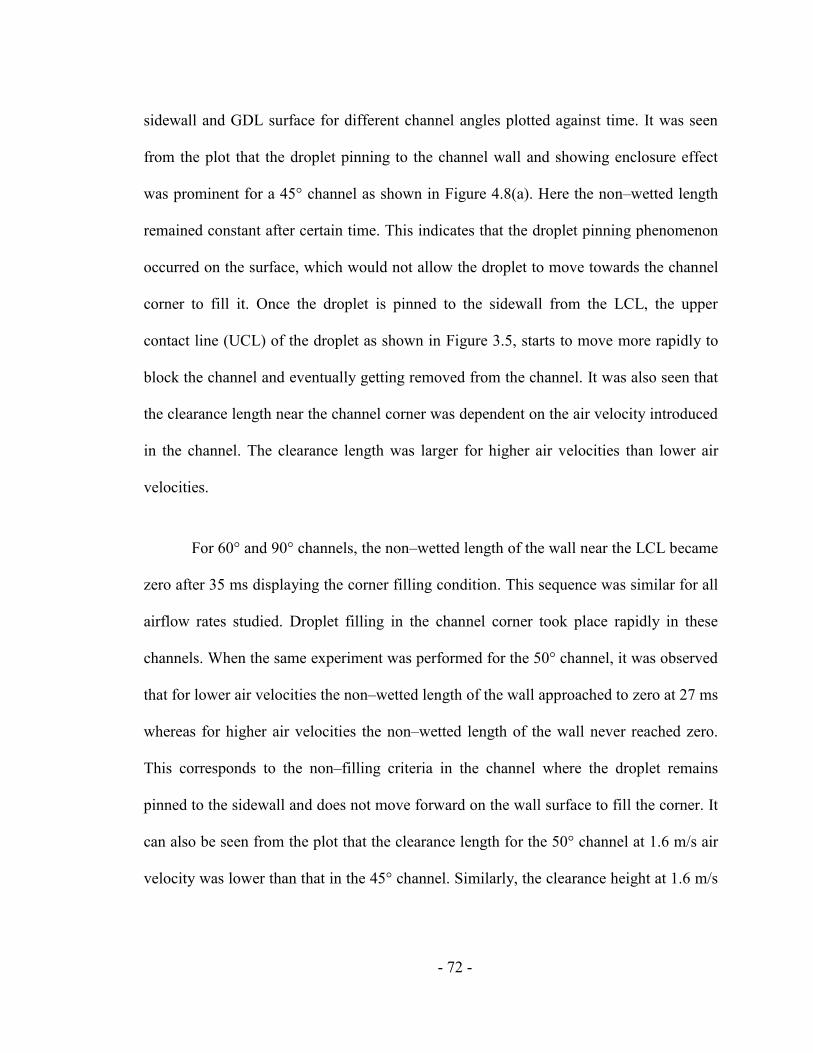
- 72 -
sidewall and GDL surface for different channel angles plotted against time. It was seen
from the plot that the droplet pinning to the channel wall and showing enclosure effect
was prominent for a 45° channel as shown in Figure 4.8(a). Here the non–wetted length
remained constant after certain time. This indicates that the droplet pinning phenomenon
occurred on the surface, which would not allow the droplet to move towards the channel
corner to fill it. Once the droplet is pinned to the sidewall from the LCL, the upper
contact line (UCL) of the droplet as shown in Figure 3.5, starts to move more rapidly to
block the channel and eventually getting removed from the channel. It was also seen that
the clearance length near the channel corner was dependent on the air velocity introduced
in the channel. The clearance length was larger for higher air velocities than lower air
velocities.
For 60° and 90° channels, the non–wetted length of the wall near the LCL became
zero after 35 ms displaying the corner filling condition. This sequence was similar for all
airflow rates studied. Droplet filling in the channel corner took place rapidly in these
channels. When the same experiment was performed for the 50° channel, it was observed
that for lower air velocities the non–wetted length of the wall approached to zero at 27 ms
whereas for higher air velocities the non–wetted length of the wall never reached zero.
This corresponds to the non–filling criteria in the channel where the droplet remains
pinned to the sidewall and does not move forward on the wall surface to fill the corner. It
can also be seen from the plot that the clearance length for the 50° channel at 1.6 m/s air
velocity was lower than that in the 45° channel. Similarly, the clearance height at 1.6 m/s
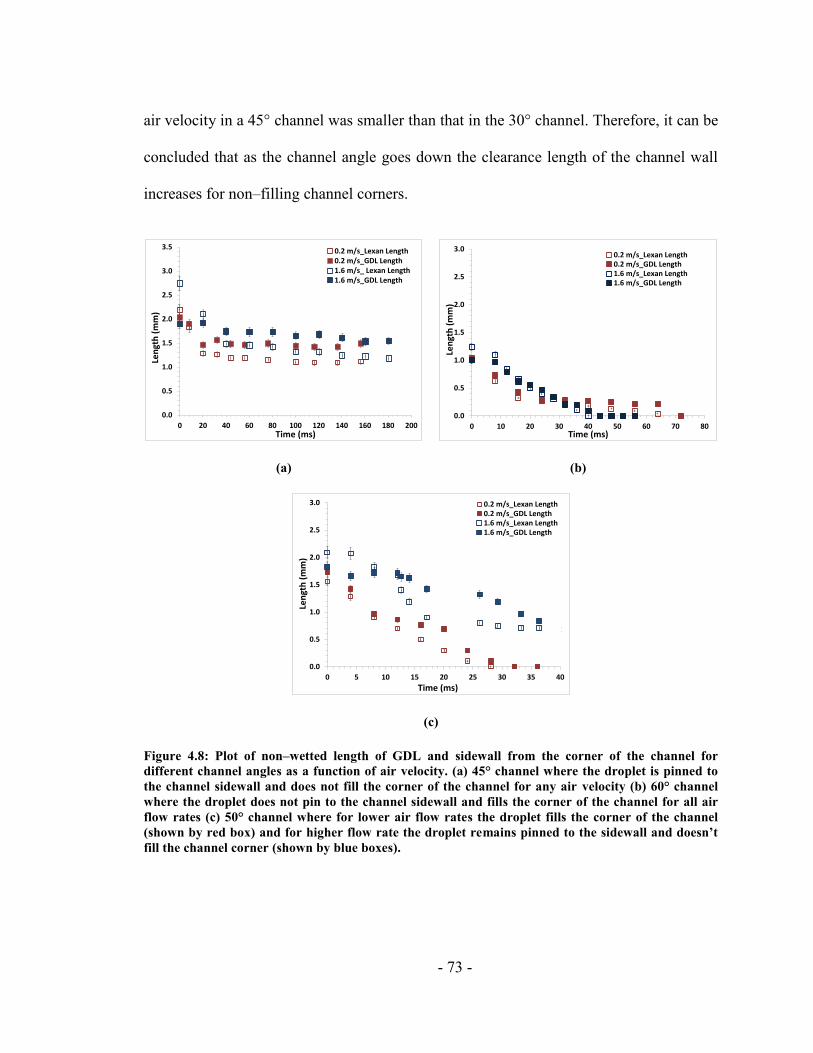
- 73 -
air velocity in a 45° channel was smaller than that in the 30° channel. Therefore, it can be
concluded that as the channel angle goes down the clearance length of the channel wall
increases for non–filling channel corners.
(a) (b)
(c)
Figure 4.8: Plot of non–wetted length of GDL and sidewall from the corner of the channel for
different channel angles as a function of air velocity. (a) 45° channel where the droplet is pinned to
the channel sidewall and does not fill the corner of the channel for any air velocity (b) 60° channel
where the droplet does not pin to the channel sidewall and fills the corner of the channel for all air
flow rates (c) 50° channel where for lower air flow rates the droplet fills the corner of the channel
(shown by red box) and for higher flow rate the droplet remains pinned to the sidewall and doesn’t
fill the channel corner (shown by blue boxes).
0.0
0.5
1.0
1.5
2.0
2.5
3.0
3.5
0 20 40 60 80 100 120 140 160 180 200
Len
gth
(m
m)
Time (ms)
0.2 m/s_Lexan Length0.2 m/s_GDL Length1.6 m/s_ Lexan Length1.6 m/s_GDL Length
0.0
0.5
1.0
1.5
2.0
2.5
3.0
0 10 20 30 40 50 60 70 80
Len
gth
(m
m)
Time (ms)
0.2 m/s_Lexan Length0.2 m/s_GDL Length1.6 m/s_Lexan Length1.6 m/s_GDL Length
0.0
0.5
1.0
1.5
2.0
2.5
3.0
0 5 10 15 20 25 30 35 40
Len
gth
(m
m)
Time (ms)
0.2 m/s_Lexan Length0.2 m/s_GDL Length1.6 m/s_Lexan Length1.6 m/s_GDL Length
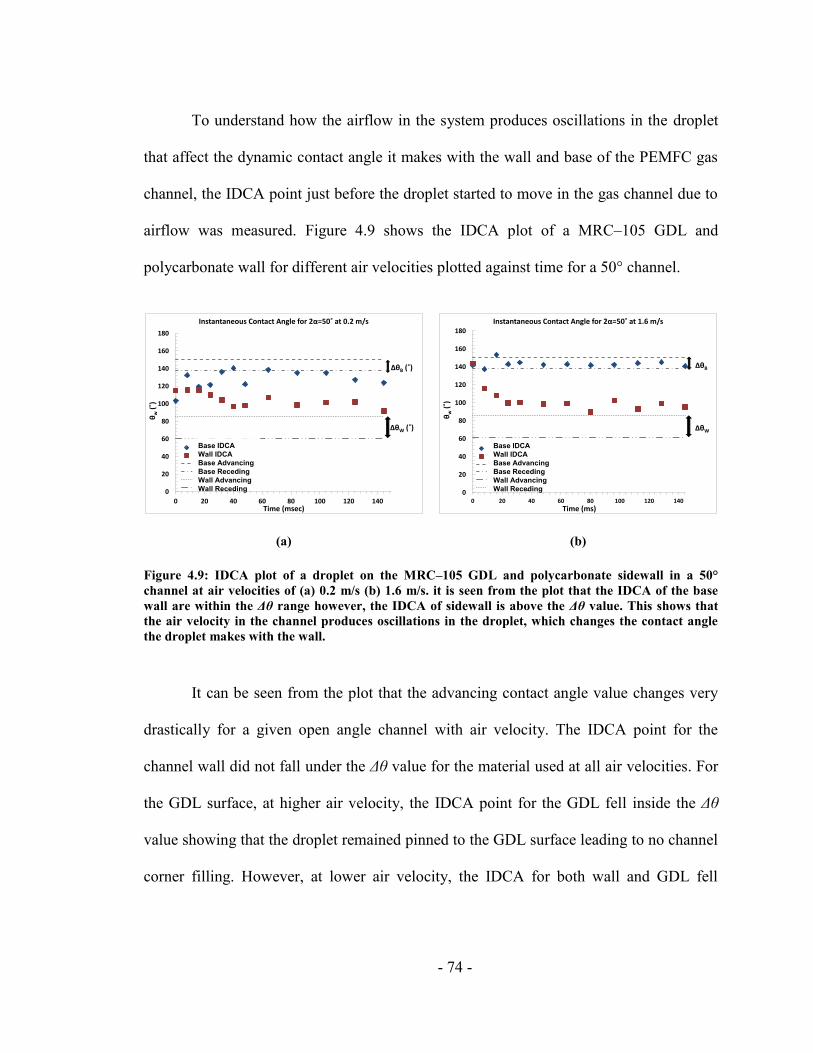
- 74 -
To understand how the airflow in the system produces oscillations in the droplet
that affect the dynamic contact angle it makes with the wall and base of the PEMFC gas
channel, the IDCA point just before the droplet started to move in the gas channel due to
airflow was measured. Figure 4.9 shows the IDCA plot of a MRC–105 GDL and
polycarbonate wall for different air velocities plotted against time for a 50° channel.
(a) (b)
Figure 4.9: IDCA plot of a droplet on the MRC–105 GDL and polycarbonate sidewall in a 50°
channel at air velocities of (a) 0.2 m/s (b) 1.6 m/s. it is seen from the plot that the IDCA of the base
wall are within the Δθ range however, the IDCA of sidewall is above the Δθ value. This shows that
the air velocity in the channel produces oscillations in the droplet, which changes the contact angle
the droplet makes with the wall.
It can be seen from the plot that the advancing contact angle value changes very
drastically for a given open angle channel with air velocity. The IDCA point for the
channel wall did not fall under the Δθ value for the material used at all air velocities. For
the GDL surface, at higher air velocity, the IDCA point for the GDL fell inside the Δθ
value showing that the droplet remained pinned to the GDL surface leading to no channel
corner filling. However, at lower air velocity, the IDCA for both wall and GDL fell
0
20
40
60
80
100
120
140
160
180
0 20 40 60 80 100 120 140
θw
(˚)
Time (msec)
Instantaneous Contact Angle for 2α=50˚ at 0.2 m/s
Base CLWall CLBase AdvancingBase RecedingWall AdvancingWall Receding
ΔθW (˚)
ΔθB (˚)
Base IDCA
Wall IDCA
Base Advancing
Base Receding
Wall Advancing
Wall Receding 0
20
40
60
80
100
120
140
160
180
0 20 40 60 80 100 120 140
θw
(˚)
Time (ms)
Instantaneous Contact Angle for 2α=50˚ at 1.6 m/s
Base CLWall CLBase AdvancingBase RecedingWall RecedingWall Advancing
ΔθW
ΔθB
Base IDCA
Wall IDCA
Base Advancing
Base Receding
Wall Advancing
Wall Receding
- 75 -
outside their respective Δθ values showing that the droplet got de-pinned from the
channel wall and led to corner filling. This implies that the air velocity changes the
contact angle on the channel wall significantly due to the oscillation in the droplet.
4.3 Pressure Drop across the Droplet
The corner filling of a reactant channel leads to an undesired water buildup within
the channel, which may eventually reduce the performance of a PEMFC. Pressure drop
across the droplet is one of the reliable ways to measure the gas transport resistance due
to the water hold up in the channel. When the water builds up in the channel, pressure
drop increases accordingly. Therefore, lower pressure drop corresponds to lower gas
transport resistance. In order to study the pressure drop across the droplet in various
channels, a pressure tap was made behind the droplet inlet, which would read the pressure
change across the droplet as the droplet grew. The peak pressure drop across the droplet
for different air velocities in the channel was plotted and is shown in Figure 4.10. The
uncertainty in the peak pressure drop was about 0.25%. Figure 4.10 clearly shows that in
a 90° channel the pressure drop across the droplet increases as the air velocity increases.
However, at lower air velocities the pressure drop is high. This is observed when the
droplet grows and completely blocks the channel and the pressure in the channel starts to
build up. When the pressure in the system reaches to a certain point, the droplet is
removed from the channel. The time taken by lower air velocities to remove the droplet
from the channel is comparatively large, which leads to high pressure build up in the
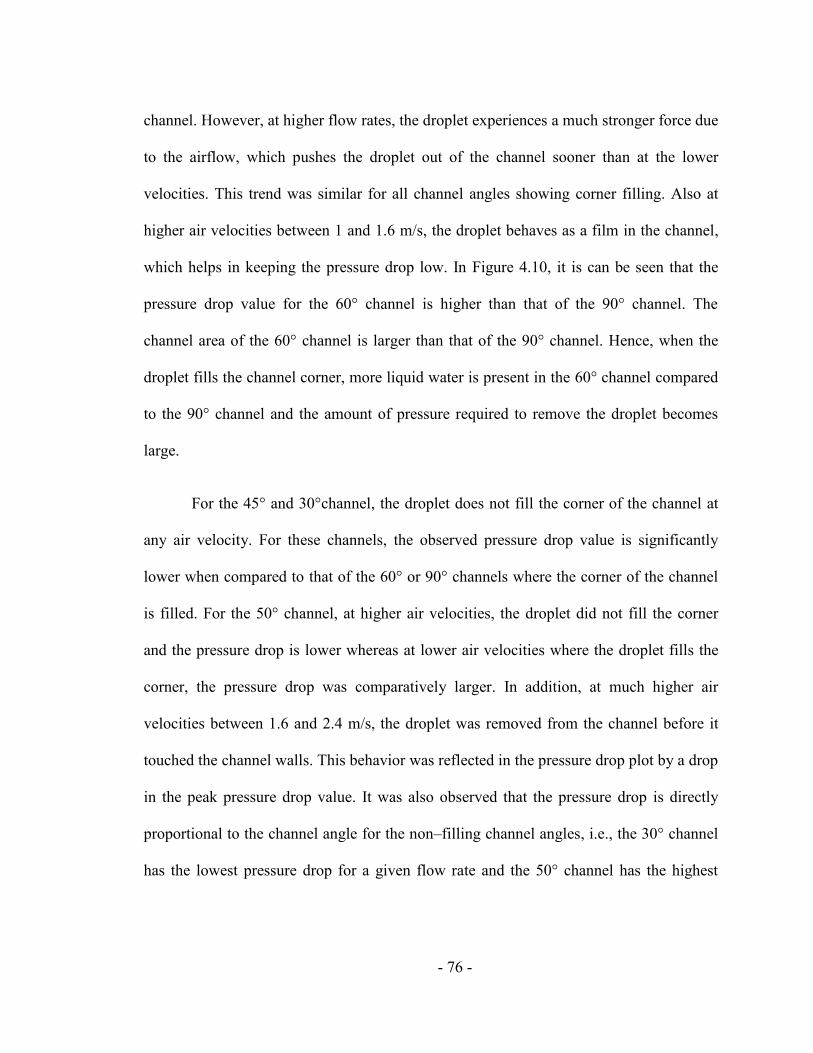
- 76 -
channel. However, at higher flow rates, the droplet experiences a much stronger force due
to the airflow, which pushes the droplet out of the channel sooner than at the lower
velocities. This trend was similar for all channel angles showing corner filling. Also at
higher air velocities between 1 and 1.6 m/s, the droplet behaves as a film in the channel,
which helps in keeping the pressure drop low. In Figure 4.10, it is can be seen that the
pressure drop value for the 60° channel is higher than that of the 90° channel. The
channel area of the 60° channel is larger than that of the 90° channel. Hence, when the
droplet fills the channel corner, more liquid water is present in the 60° channel compared
to the 90° channel and the amount of pressure required to remove the droplet becomes
large.
For the 45° and 30°channel, the droplet does not fill the corner of the channel at
any air velocity. For these channels, the observed pressure drop value is significantly
lower when compared to that of the 60° or 90° channels where the corner of the channel
is filled. For the 50° channel, at higher air velocities, the droplet did not fill the corner
and the pressure drop is lower whereas at lower air velocities where the droplet fills the
corner, the pressure drop was comparatively larger. In addition, at much higher air
velocities between 1.6 and 2.4 m/s, the droplet was removed from the channel before it
touched the channel walls. This behavior was reflected in the pressure drop plot by a drop
in the peak pressure drop value. It was also observed that the pressure drop is directly
proportional to the channel angle for the non–filling channel angles, i.e., the 30° channel
has the lowest pressure drop for a given flow rate and the 50° channel has the highest
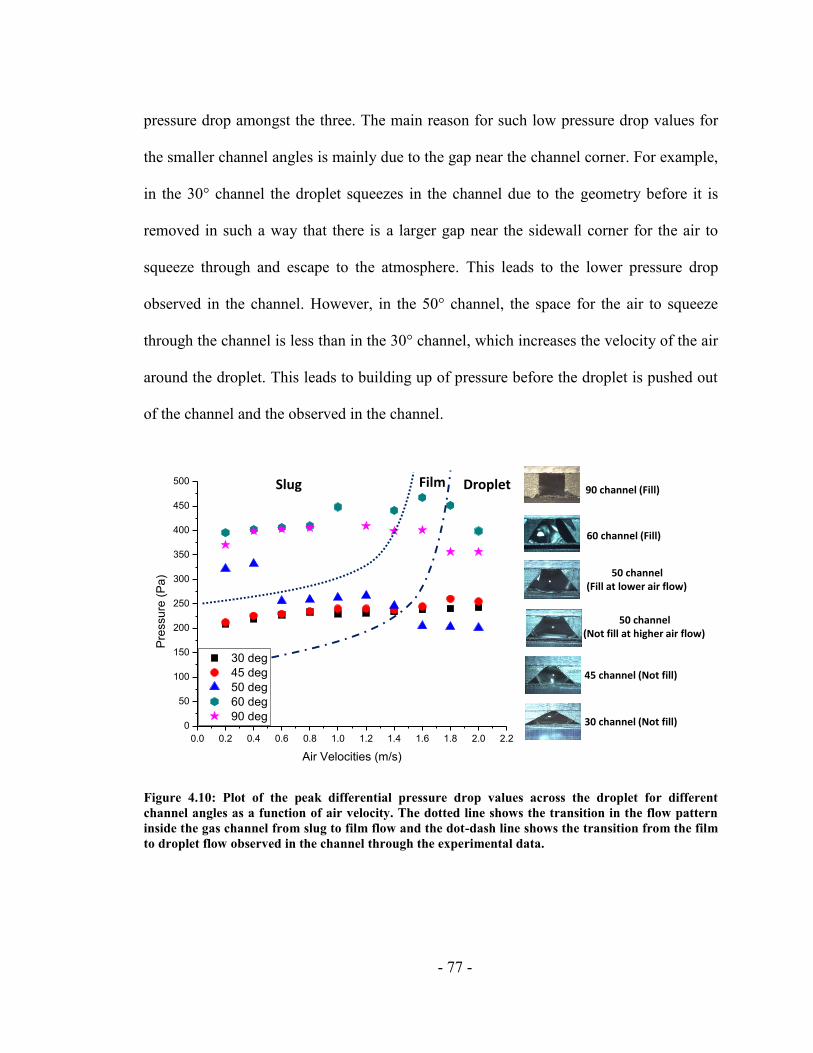
- 77 -
pressure drop amongst the three. The main reason for such low pressure drop values for
the smaller channel angles is mainly due to the gap near the channel corner. For example,
in the 30° channel the droplet squeezes in the channel due to the geometry before it is
removed in such a way that there is a larger gap near the sidewall corner for the air to
squeeze through and escape to the atmosphere. This leads to the lower pressure drop
observed in the channel. However, in the 50° channel, the space for the air to squeeze
through the channel is less than in the 30° channel, which increases the velocity of the air
around the droplet. This leads to building up of pressure before the droplet is pushed out
of the channel and the observed in the channel.
Figure 4.10: Plot of the peak differential pressure drop values across the droplet for different
channel angles as a function of air velocity. The dotted line shows the transition in the flow pattern
inside the gas channel from slug to film flow and the dot-dash line shows the transition from the film
to droplet flow observed in the channel through the experimental data.
0.0 0.2 0.4 0.6 0.8 1.0 1.2 1.4 1.6 1.8 2.0 2.2
0
50
100
150
200
250
300
350
400
450
500
30 deg
45 deg
50 deg
60 deg
90 deg
Pre
ssu
re (
Pa
)
Air Velocities (m/s)
Slug Film Droplet
50 channel(Not fill at higher air flow)
90 channel (Fill)
60 channel (Fill)
50 channel(Fill at lower air flow)
45 channel (Not fill)
30 channel (Not fill)
- 78 -
The different flow patterns observed in this study are slug flow, film flow and
droplet flow. The dotted line and the dot–dash line in the plot, which are plotted using
visual observation of the data, show the flow patterns observed for different channel open
angles at different air velocities. The pressure drop points falling to the left side of the
dotted line represent slug flow, the points falling on the right side of dotted line show
film flow and the points falling to the right side of the dot-dash line shows droplet flow. It
was observed from the high–speed videos that at higher air velocities (1.6 m/s and
above), all the channels showed droplet flow, i.e., the droplet did not touch the sidewalls
and is removed as a droplet.
4.4 Effect of Channel Wall Material
To evaluate the droplet behavior as a function of different sidewall materials,
experiments were conducted with stainless steel (SS–2205), copper (Cu–110) and
graphite composite channel walls with 45° and 50° open angles. These angles were
chosen as they were near the transition angle for the materials mentioned with MRC–105
as the base. The transition angles calculated using the static contact angle for these
materials with the MRC–105 GDL are shown in Table IV. For all these experiments, the
MRC–105 GDL base was kept constant and the sidewall materials were changed. The air
velocities in the channel were varied between 0.2 and 2.4 m/s. Different dynamics were
observed for different sidewall materials.
- 79 -
4.4.1 Stainless Steel Sidewall
The transition angle for SS–2205 and MRC–105 was found to be 49° according to
a theoretical prediction using the Concus–Finn condition. Experimentally it was found
that for a 45° channel, corner filling did not occur for any air velocity agreeing with the
theoretical predictions. A recorded image sequence of the droplet growth and its
interaction with the SS–2205 sidewall for a 45° channel and air velocity of 1.6 m/s is
shown in Figure 4.11. The IDCA for the SS–2205 sidewall and the MRC–105 base
measured from each frame of the video sequence was plotted against the CFL as shown
in Figure 4.12. According to the Concus–Finn condition, any point falling below the CFL
line would lead to a corner filling condition, and any point above would lead to a no
corner filling condition. The Concus–Finn plot with IDCA points also verified the
observed experimental behavior.
Figure 4.11: Image sequence of the droplet interaction with the Stainless Steel (SS 2205) sidewall and
MRC–105 base in the 45° open angle channel with 1.6 m/s air velocity inside the channel. The red
circle in the image shows that the droplet does not fill the channel corners.
However, for the 50° channel, the experimental and theoretical results did not
agree. For the 50° channel, corner filling was observed only for lower air velocities
between 0.2 and 0.6 m/s, and not for higher air velocities (0.7 – 2.4 m/s). Image
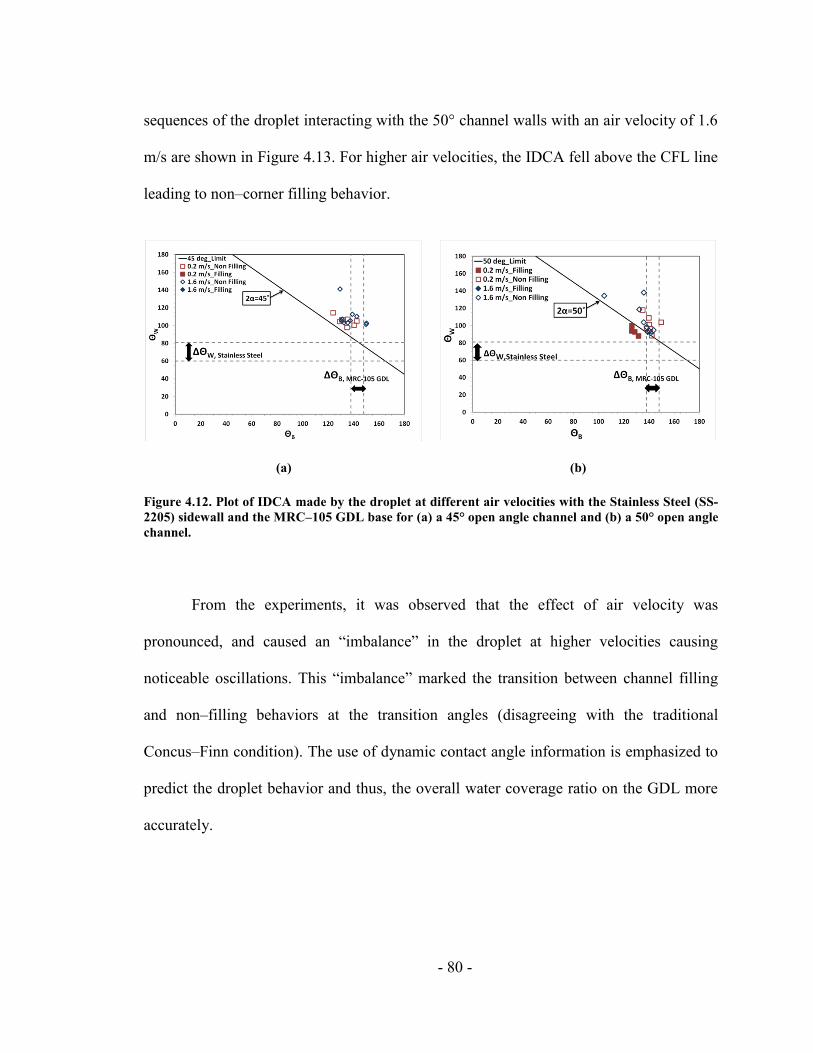
- 80 -
sequences of the droplet interacting with the 50° channel walls with an air velocity of 1.6
m/s are shown in Figure 4.13. For higher air velocities, the IDCA fell above the CFL line
leading to non–corner filling behavior.
(a) (b)
Figure 4.12. Plot of IDCA made by the droplet at different air velocities with the Stainless Steel (SS-
2205) sidewall and the MRC–105 GDL base for (a) a 45° open angle channel and (b) a 50° open angle
channel.
From the experiments, it was observed that the effect of air velocity was
pronounced, and caused an “imbalance” in the droplet at higher velocities causing
noticeable oscillations. This “imbalance” marked the transition between channel filling
and non–filling behaviors at the transition angles (disagreeing with the traditional
Concus–Finn condition). The use of dynamic contact angle information is emphasized to
predict the droplet behavior and thus, the overall water coverage ratio on the GDL more
accurately.
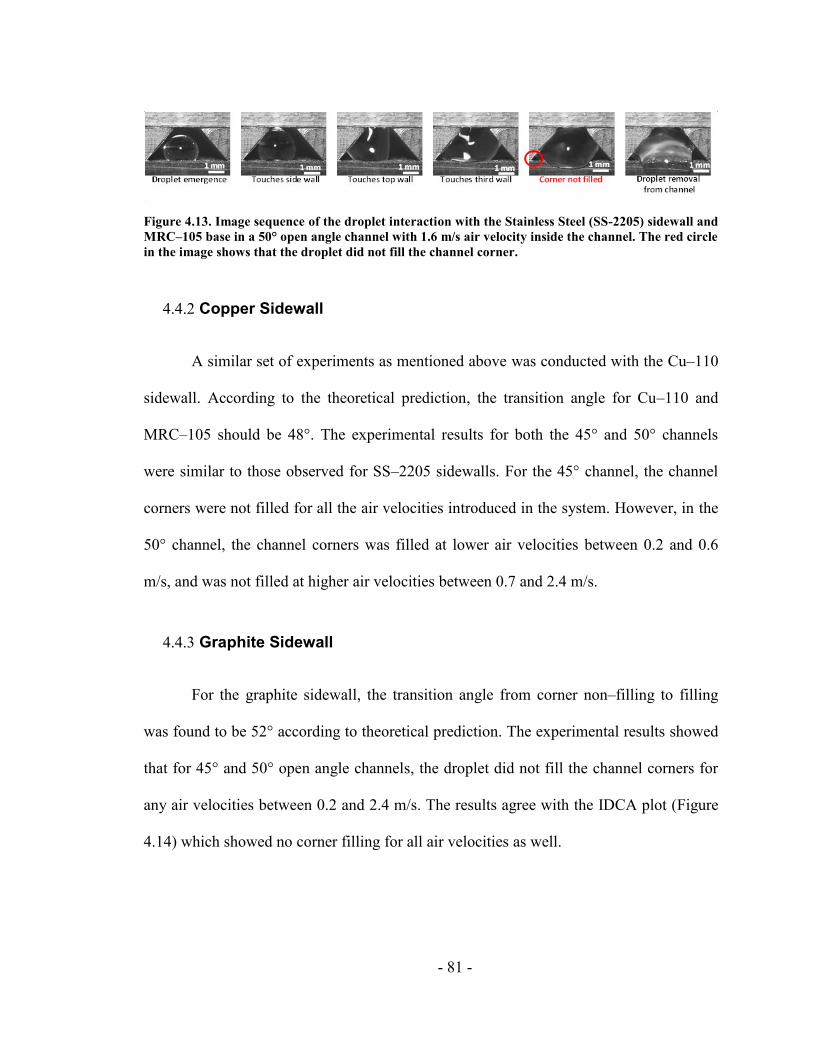
- 81 -
Figure 4.13. Image sequence of the droplet interaction with the Stainless Steel (SS-2205) sidewall and
MRC–105 base in a 50° open angle channel with 1.6 m/s air velocity inside the channel. The red circle
in the image shows that the droplet did not fill the channel corner.
4.4.2 Copper Sidewall
A similar set of experiments as mentioned above was conducted with the Cu–110
sidewall. According to the theoretical prediction, the transition angle for Cu–110 and
MRC–105 should be 48°. The experimental results for both the 45° and 50° channels
were similar to those observed for SS–2205 sidewalls. For the 45° channel, the channel
corners were not filled for all the air velocities introduced in the system. However, in the
50° channel, the channel corners was filled at lower air velocities between 0.2 and 0.6
m/s, and was not filled at higher air velocities between 0.7 and 2.4 m/s.
4.4.3 Graphite Sidewall
For the graphite sidewall, the transition angle from corner non–filling to filling
was found to be 52° according to theoretical prediction. The experimental results showed
that for 45° and 50° open angle channels, the droplet did not fill the channel corners for
any air velocities between 0.2 and 2.4 m/s. The results agree with the IDCA plot (Figure
4.14) which showed no corner filling for all air velocities as well.
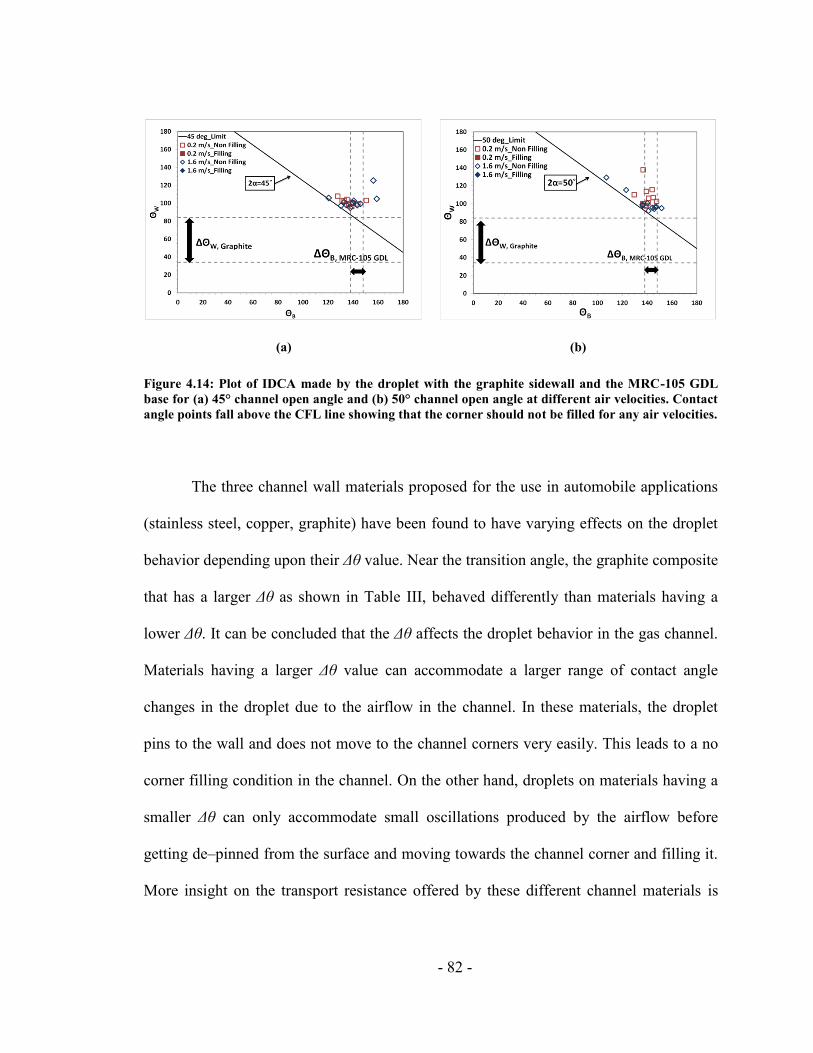
- 82 -
(a) (b)
Figure 4.14: Plot of IDCA made by the droplet with the graphite sidewall and the MRC-105 GDL
base for (a) 45° channel open angle and (b) 50° channel open angle at different air velocities. Contact
angle points fall above the CFL line showing that the corner should not be filled for any air velocities.
The three channel wall materials proposed for the use in automobile applications
(stainless steel, copper, graphite) have been found to have varying effects on the droplet
behavior depending upon their Δθ value. Near the transition angle, the graphite composite
that has a larger Δθ as shown in Table III, behaved differently than materials having a
lower Δθ. It can be concluded that the Δθ affects the droplet behavior in the gas channel.
Materials having a larger Δθ value can accommodate a larger range of contact angle
changes in the droplet due to the airflow in the channel. In these materials, the droplet
pins to the wall and does not move to the channel corners very easily. This leads to a no
corner filling condition in the channel. On the other hand, droplets on materials having a
smaller Δθ can only accommodate small oscillations produced by the airflow before
getting de–pinned from the surface and moving towards the channel corner and filling it.
More insight on the transport resistance offered by these different channel materials is
- 83 -
provided by the pressure drop data in the channel which is discussed in detail in the next
section.
When using a MRC–105 GDL with any of the selected channel materials, the
droplet filling of the channel corners did not take place for angles below 45°, and the 50°
channel behaved as a transition angle between filling and non–filling. The Concus–Finn
condition could not accurately predict the corner filling behavior of the droplet near the
transition angle. Hence, using IDCA information would be helpful in predicting the
droplet behavior in the gas channel of a PEMFC.
4.4.4 Pressure Drop in the Channel
Figure 4.15 shows the peak pressure drop across the droplet in a gas channel with
different channel wall materials and air velocities. The uncertainty in the peak pressure
drop value was about 0.25%. For the 45° channel, Figure 4.15(a) shows that as the air
velocity increases, the peak pressure drop across the droplet increases for different
channel wall materials. Once the pressure inside the system reaches its maximum value,
the droplet is removed from the system. At air velocities between 0.5 and 1.6 m/s, the
droplet starts to transition towards the film flow regime instead of slug flow as observed
at lower air velocities and the peak pressure drop starts to decrease. At higher air
velocities between1.7 and 2.4 m/s the droplet was removed from the system before it
even touched the sidewalls of the channel. Therefore, the force required to remove the
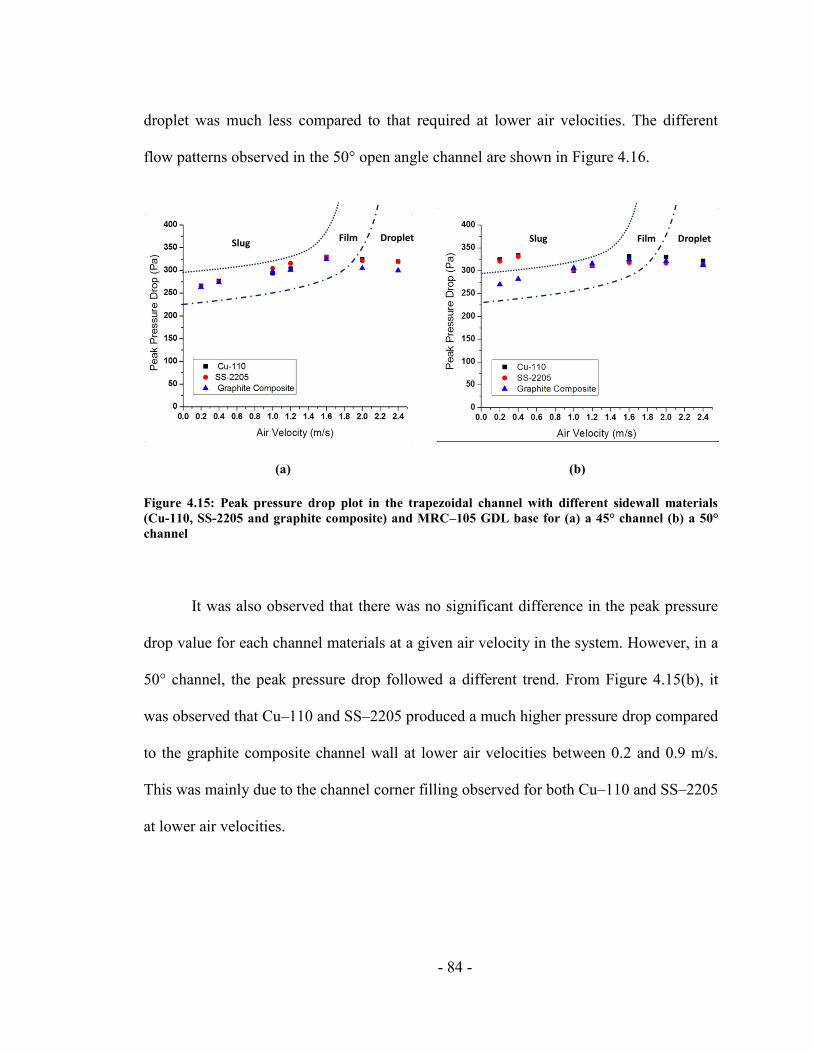
- 84 -
droplet was much less compared to that required at lower air velocities. The different
flow patterns observed in the 50° open angle channel are shown in Figure 4.16.
(a) (b)
Figure 4.15: Peak pressure drop plot in the trapezoidal channel with different sidewall materials
(Cu-110, SS-2205 and graphite composite) and MRC–105 GDL base for (a) a 45° channel (b) a 50°
channel
It was also observed that there was no significant difference in the peak pressure
drop value for each channel materials at a given air velocity in the system. However, in a
50° channel, the peak pressure drop followed a different trend. From Figure 4.15(b), it
was observed that Cu–110 and SS–2205 produced a much higher pressure drop compared
to the graphite composite channel wall at lower air velocities between 0.2 and 0.9 m/s.
This was mainly due to the channel corner filling observed for both Cu–110 and SS–2205
at lower air velocities.
Slug Film Droplet Slug Film Droplet
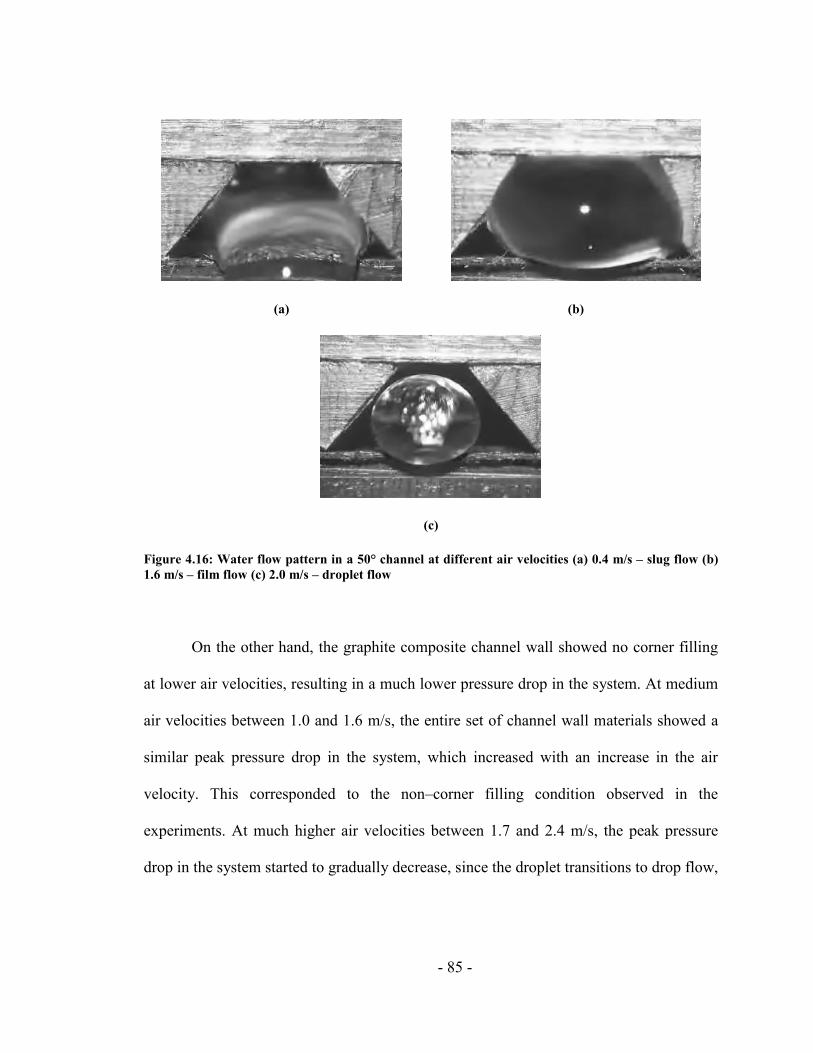
- 85 -
(a) (b)
(c)
Figure 4.16: Water flow pattern in a 50° channel at different air velocities (a) 0.4 m/s – slug flow (b)
1.6 m/s – film flow (c) 2.0 m/s – droplet flow
On the other hand, the graphite composite channel wall showed no corner filling
at lower air velocities, resulting in a much lower pressure drop in the system. At medium
air velocities between 1.0 and 1.6 m/s, the entire set of channel wall materials showed a
similar peak pressure drop in the system, which increased with an increase in the air
velocity. This corresponded to the non–corner filling condition observed in the
experiments. At much higher air velocities between 1.7 and 2.4 m/s, the peak pressure
drop in the system started to gradually decrease, since the droplet transitions to drop flow,
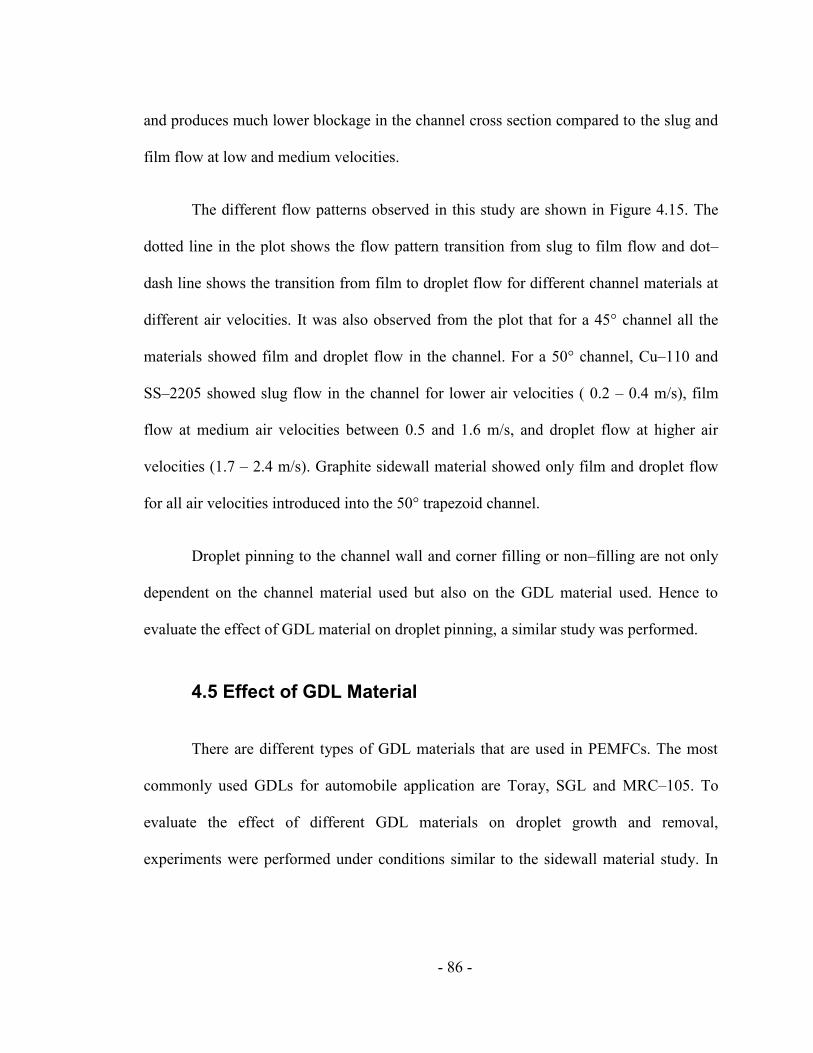
- 86 -
and produces much lower blockage in the channel cross section compared to the slug and
film flow at low and medium velocities.
The different flow patterns observed in this study are shown in Figure 4.15. The
dotted line in the plot shows the flow pattern transition from slug to film flow and dot–
dash line shows the transition from film to droplet flow for different channel materials at
different air velocities. It was also observed from the plot that for a 45° channel all the
materials showed film and droplet flow in the channel. For a 50° channel, Cu–110 and
SS–2205 showed slug flow in the channel for lower air velocities ( 0.2 – 0.4 m/s), film
flow at medium air velocities between 0.5 and 1.6 m/s, and droplet flow at higher air
velocities (1.7 – 2.4 m/s). Graphite sidewall material showed only film and droplet flow
for all air velocities introduced into the 50° trapezoid channel.
Droplet pinning to the channel wall and corner filling or non–filling are not only
dependent on the channel material used but also on the GDL material used. Hence to
evaluate the effect of GDL material on droplet pinning, a similar study was performed.
4.5 Effect of GDL Material
There are different types of GDL materials that are used in PEMFCs. The most
commonly used GDLs for automobile application are Toray, SGL and MRC–105. To
evaluate the effect of different GDL materials on droplet growth and removal,
experiments were performed under conditions similar to the sidewall material study. In
- 87 -
these experiments, the channel wall material was kept constant (polycarbonate) while the
GDL material was changed along with the channel open angle.
4.5.1 Toray (TGP–H–060) GDL
For Toray (TGP–H–060 with 6% PTFE) GDL and a polycarbonate sidewall, the
transition angle was found to be 50° according to the Concus–Finn condition. According
to the experimental results, no corner filling behavior was observed for both 45° and 50°
channels at all air velocities introduced in the channel. The experimental results agreed
with the theoretical predictions for the TGP–H–060 GDL. The IDCA plot for both the
45° and 50° channel at 0.2 and 1.6 m/s air velocities is shown in Figure 4.17. From the
IDCA plot, it can be seen that the contact angle values fall well above the Δθ values. This
is mainly due to the oscillations in the droplet, which affect the contact angle the droplet
makes with the wall.
(a) (b)
Figure 4.17: Plot of IDCA made by the droplet with the polycarbonate sidewall and the TGP–H–060
base for (a) a 45° channel and (b) a 50° channel at different air velocities
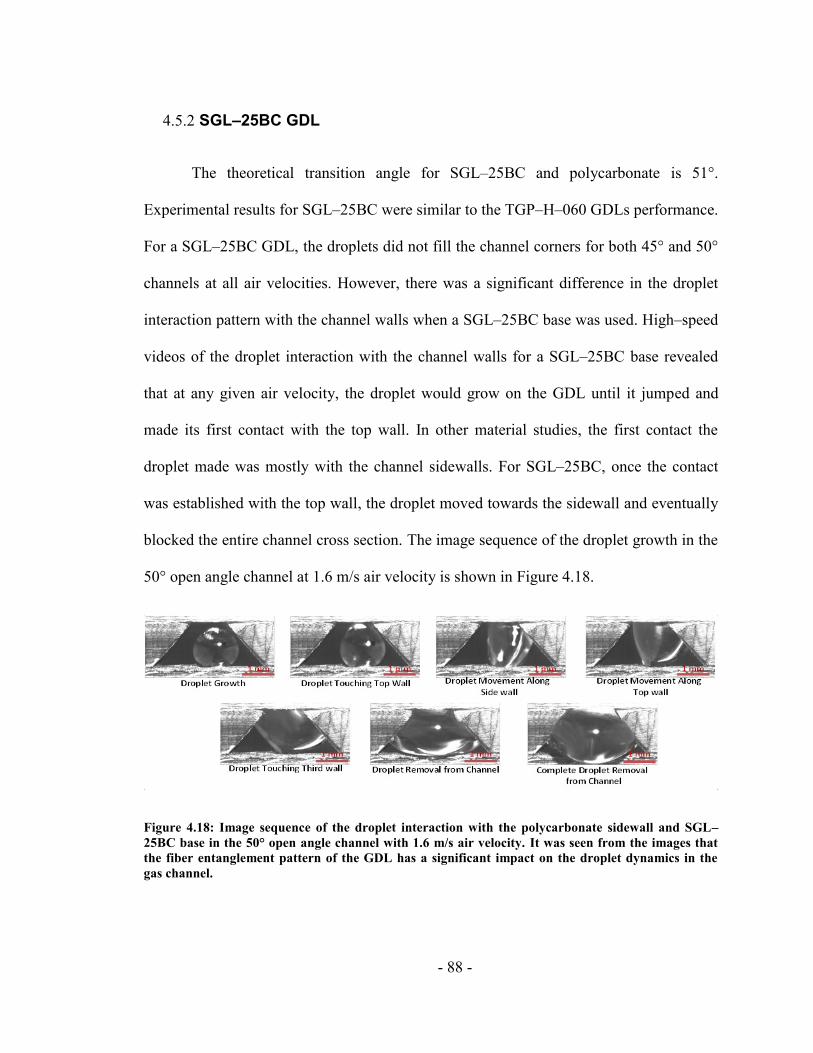
- 88 -
4.5.2 SGL–25BC GDL
The theoretical transition angle for SGL–25BC and polycarbonate is 51°.
Experimental results for SGL–25BC were similar to the TGP–H–060 GDLs performance.
For a SGL–25BC GDL, the droplets did not fill the channel corners for both 45° and 50°
channels at all air velocities. However, there was a significant difference in the droplet
interaction pattern with the channel walls when a SGL–25BC base was used. High–speed
videos of the droplet interaction with the channel walls for a SGL–25BC base revealed
that at any given air velocity, the droplet would grow on the GDL until it jumped and
made its first contact with the top wall. In other material studies, the first contact the
droplet made was mostly with the channel sidewalls. For SGL–25BC, once the contact
was established with the top wall, the droplet moved towards the sidewall and eventually
blocked the entire channel cross section. The image sequence of the droplet growth in the
50° open angle channel at 1.6 m/s air velocity is shown in Figure 4.18.
Figure 4.18: Image sequence of the droplet interaction with the polycarbonate sidewall and SGL–
25BC base in the 50° open angle channel with 1.6 m/s air velocity. It was seen from the images that
the fiber entanglement pattern of the GDL has a significant impact on the droplet dynamics in the
gas channel.
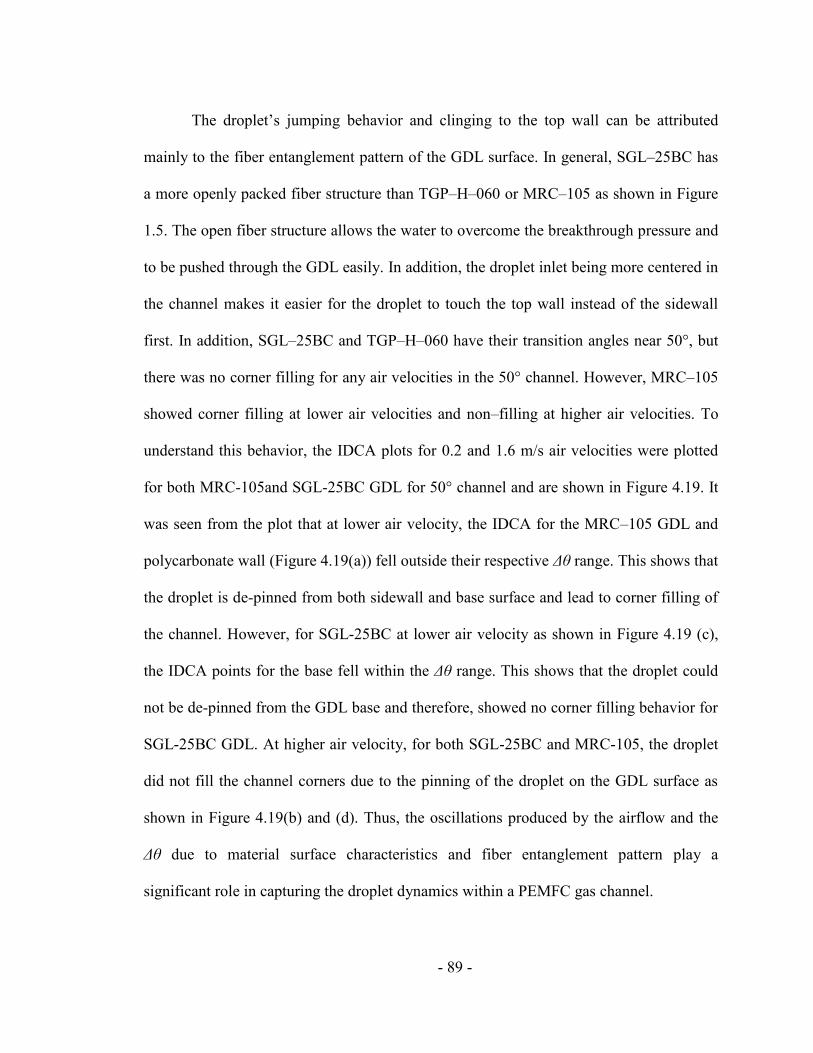
- 89 -
The droplet’s jumping behavior and clinging to the top wall can be attributed
mainly to the fiber entanglement pattern of the GDL surface. In general, SGL–25BC has
a more openly packed fiber structure than TGP–H–060 or MRC–105 as shown in Figure
1.5. The open fiber structure allows the water to overcome the breakthrough pressure and
to be pushed through the GDL easily. In addition, the droplet inlet being more centered in
the channel makes it easier for the droplet to touch the top wall instead of the sidewall
first. In addition, SGL–25BC and TGP–H–060 have their transition angles near 50°, but
there was no corner filling for any air velocities in the 50° channel. However, MRC–105
showed corner filling at lower air velocities and non–filling at higher air velocities. To
understand this behavior, the IDCA plots for 0.2 and 1.6 m/s air velocities were plotted
for both MRC-105and SGL-25BC GDL for 50° channel and are shown in Figure 4.19. It
was seen from the plot that at lower air velocity, the IDCA for the MRC–105 GDL and
polycarbonate wall (Figure 4.19(a)) fell outside their respective Δθ range. This shows that
the droplet is de-pinned from both sidewall and base surface and lead to corner filling of
the channel. However, for SGL-25BC at lower air velocity as shown in Figure 4.19 (c),
the IDCA points for the base fell within the Δθ range. This shows that the droplet could
not be de-pinned from the GDL base and therefore, showed no corner filling behavior for
SGL-25BC GDL. At higher air velocity, for both SGL-25BC and MRC-105, the droplet
did not fill the channel corners due to the pinning of the droplet on the GDL surface as
shown in Figure 4.19(b) and (d). Thus, the oscillations produced by the airflow and the
Δθ due to material surface characteristics and fiber entanglement pattern play a
significant role in capturing the droplet dynamics within a PEMFC gas channel.
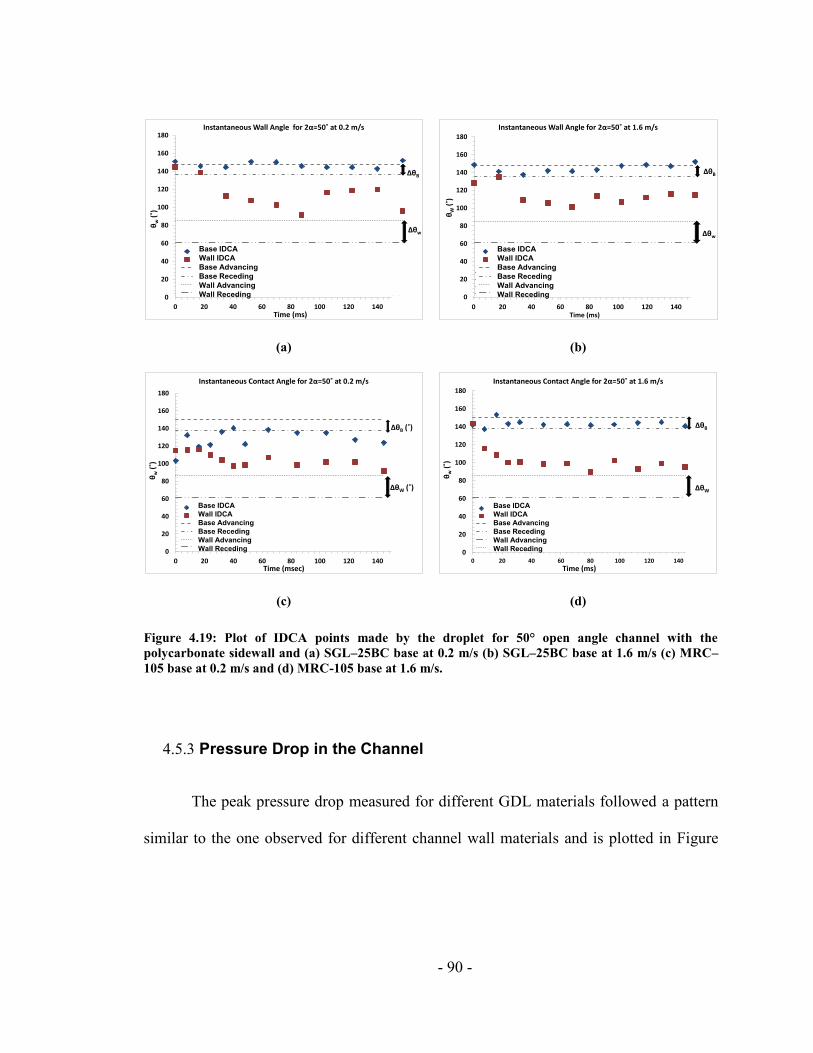
- 90 -
(a) (b)
(c) (d)
Figure 4.19: Plot of IDCA points made by the droplet for 50° open angle channel with the
polycarbonate sidewall and (a) SGL–25BC base at 0.2 m/s (b) SGL–25BC base at 1.6 m/s (c) MRC–
105 base at 0.2 m/s and (d) MRC-105 base at 1.6 m/s.
4.5.3 Pressure Drop in the Channel
The peak pressure drop measured for different GDL materials followed a pattern
similar to the one observed for different channel wall materials and is plotted in Figure
0
20
40
60
80
100
120
140
160
180
0 20 40 60 80 100 120 140
θw
(˚)
Time (ms)
Instantaneous Wall Angle for 2α=50˚ at 0.2 m/s
Base CLWall CLBase AdvancingBase RecedingWall AdvancingWall Receding
Δθw
ΔθB
0
20
40
60
80
100
120
140
160
180
0 20 40 60 80 100 120 140
θw
(˚)
Time (msec)
Instantaneous Contact Angle for 2α=50˚ at 0.2 m/s
Base CLWall CLBase AdvancingBase RecedingWall AdvancingWall Receding
ΔθW (˚)
ΔθB (˚)
0
20
40
60
80
100
120
140
160
180
0 20 40 60 80 100 120 140
θw
(˚)
Time (msec)
Instantaneous Contact Angle for 2α=50˚ at 0.2 m/s
Base CLWall CLBase AdvancingBase RecedingWall AdvancingWall Receding
ΔθW (˚)
ΔθB (˚)
Base IDCA
Wall IDCA
Base Advancing
Base Receding
Wall Advancing
Wall Receding 0
20
40
60
80
100
120
140
160
180
0 20 40 60 80 100 120 140
θW
(˚)
Time (ms)
Instantaneous Wall Angle for 2α=50˚ at 1.6 m/s
Base CLWall CLBase AdvancingBase RecedingWall AdvancingWall Receding
Δθw
ΔθB
0
20
40
60
80
100
120
140
160
180
0 20 40 60 80 100 120 140
θw
(˚)
Time (msec)
Instantaneous Contact Angle for 2α=50˚ at 0.2 m/s
Base CLWall CLBase AdvancingBase RecedingWall AdvancingWall Receding
ΔθW (˚)
ΔθB (˚)
0
20
40
60
80
100
120
140
160
180
0 20 40 60 80 100 120 140
θw
(˚)
Time (msec)
Instantaneous Contact Angle for 2α=50˚ at 0.2 m/s
Base CLWall CLBase AdvancingBase RecedingWall AdvancingWall Receding
ΔθW (˚)
ΔθB (˚)
Base IDCA
Wall IDCA
Base Advancing
Base Receding
Wall Advancing
Wall Receding
0
20
40
60
80
100
120
140
160
180
0 20 40 60 80 100 120 140
θw
(˚)
Time (msec)
Instantaneous Contact Angle for 2α=50˚ at 0.2 m/s
Base CLWall CLBase AdvancingBase RecedingWall AdvancingWall Receding
ΔθW (˚)
ΔθB (˚)
Base IDCA
Wall IDCA
Base Advancing
Base Receding
Wall Advancing
Wall Receding 0
20
40
60
80
100
120
140
160
180
0 20 40 60 80 100 120 140
θw
(˚)
Time (ms)
Instantaneous Contact Angle for 2α=50˚ at 1.6 m/s
Base CLWall CLBase AdvancingBase RecedingWall RecedingWall Advancing
ΔθW
ΔθB
Base IDCA
Wall IDCA
Base Advancing
Base Receding
Wall Advancing
Wall Receding
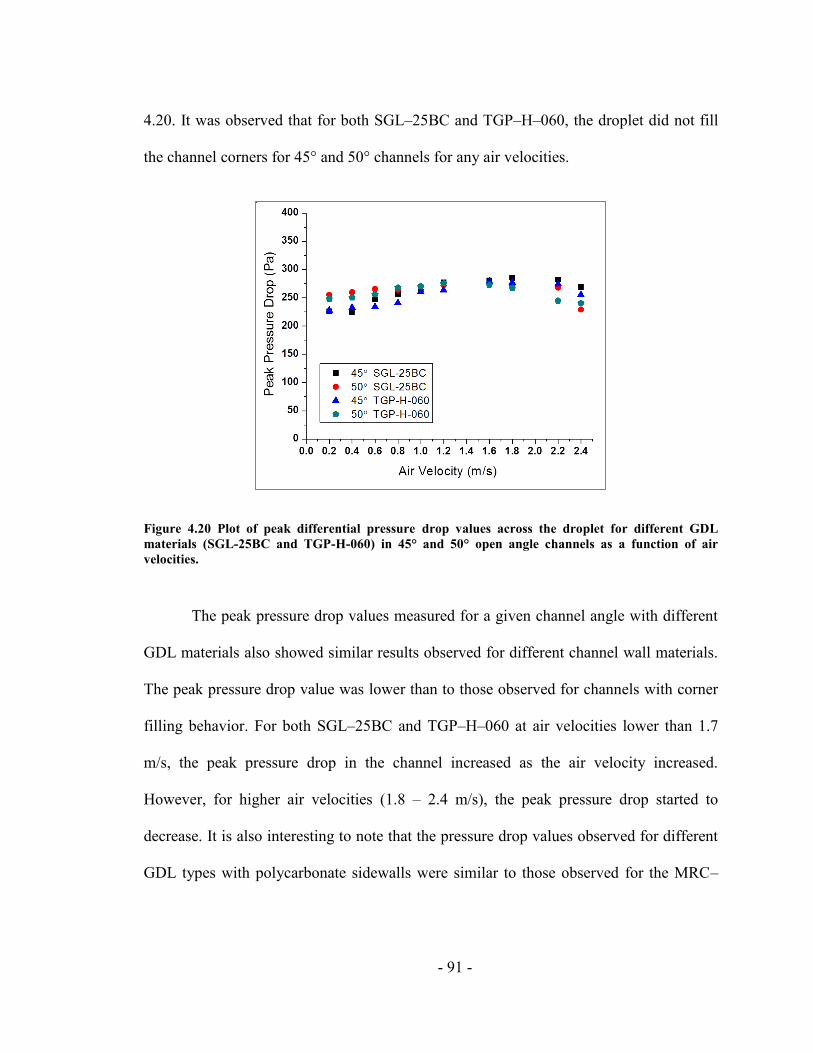
- 91 -
4.20. It was observed that for both SGL–25BC and TGP–H–060, the droplet did not fill
the channel corners for 45° and 50° channels for any air velocities.
Figure 4.20 Plot of peak differential pressure drop values across the droplet for different GDL
materials (SGL-25BC and TGP-H-060) in 45° and 50° open angle channels as a function of air
velocities.
The peak pressure drop values measured for a given channel angle with different
GDL materials also showed similar results observed for different channel wall materials.
The peak pressure drop value was lower than to those observed for channels with corner
filling behavior. For both SGL–25BC and TGP–H–060 at air velocities lower than 1.7
m/s, the peak pressure drop in the channel increased as the air velocity increased.
However, for higher air velocities (1.8 – 2.4 m/s), the peak pressure drop started to
decrease. It is also interesting to note that the pressure drop values observed for different
GDL types with polycarbonate sidewalls were similar to those observed for the MRC–
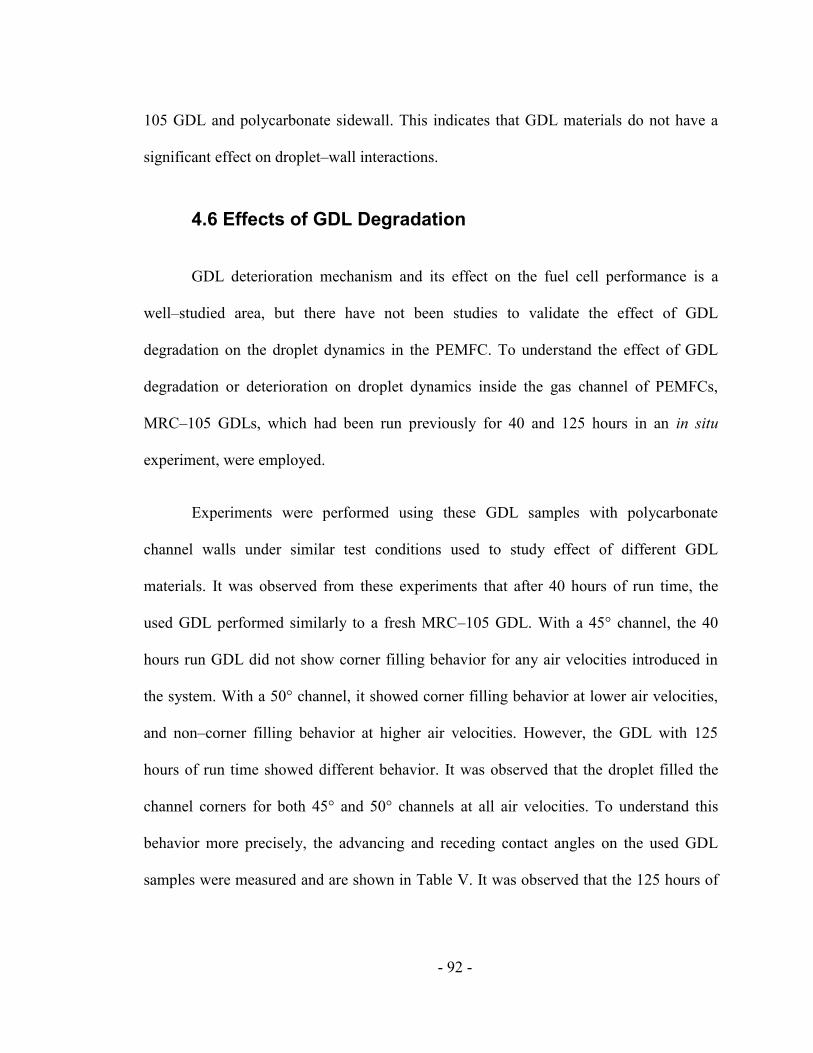
- 92 -
105 GDL and polycarbonate sidewall. This indicates that GDL materials do not have a
significant effect on droplet–wall interactions.
4.6 Effects of GDL Degradation
GDL deterioration mechanism and its effect on the fuel cell performance is a
well–studied area, but there have not been studies to validate the effect of GDL
degradation on the droplet dynamics in the PEMFC. To understand the effect of GDL
degradation or deterioration on droplet dynamics inside the gas channel of PEMFCs,
MRC–105 GDLs, which had been run previously for 40 and 125 hours in an in situ
experiment, were employed.
Experiments were performed using these GDL samples with polycarbonate
channel walls under similar test conditions used to study effect of different GDL
materials. It was observed from these experiments that after 40 hours of run time, the
used GDL performed similarly to a fresh MRC–105 GDL. With a 45° channel, the 40
hours run GDL did not show corner filling behavior for any air velocities introduced in
the system. With a 50° channel, it showed corner filling behavior at lower air velocities,
and non–corner filling behavior at higher air velocities. However, the GDL with 125
hours of run time showed different behavior. It was observed that the droplet filled the
channel corners for both 45° and 50° channels at all air velocities. To understand this
behavior more precisely, the advancing and receding contact angles on the used GDL
samples were measured and are shown in Table V. It was observed that the 125 hours of
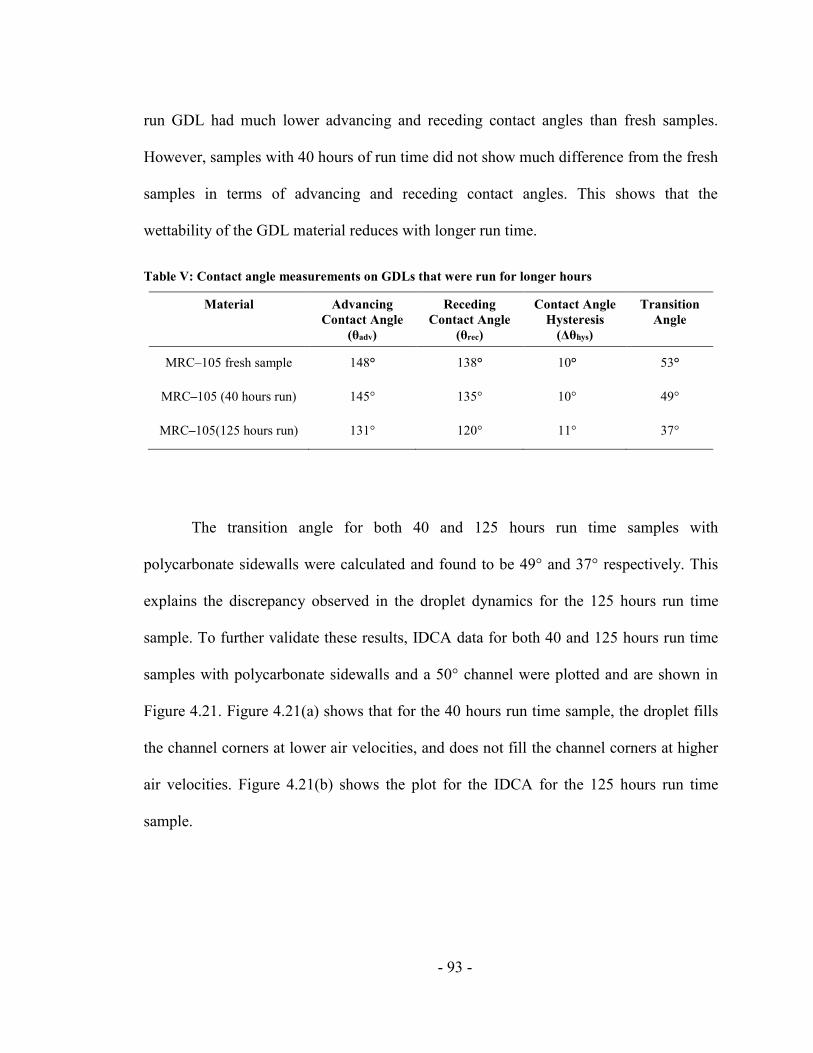
- 93 -
run GDL had much lower advancing and receding contact angles than fresh samples.
However, samples with 40 hours of run time did not show much difference from the fresh
samples in terms of advancing and receding contact angles. This shows that the
wettability of the GDL material reduces with longer run time.
Table V: Contact angle measurements on GDLs that were run for longer hours
Material Advancing
Contact Angle
(θadv)
Receding
Contact Angle
(θrec)
Contact Angle
Hysteresis
(Δθhys)
Transition
Angle
MRC–105 fresh sample 148° 138° 10° 53°
MRC–105 (40 hours run) 145° 135° 10° 49°
MRC–105(125 hours run) 131° 120° 11° 37°
The transition angle for both 40 and 125 hours run time samples with
polycarbonate sidewalls were calculated and found to be 49° and 37° respectively. This
explains the discrepancy observed in the droplet dynamics for the 125 hours run time
sample. To further validate these results, IDCA data for both 40 and 125 hours run time
samples with polycarbonate sidewalls and a 50° channel were plotted and are shown in
Figure 4.21. Figure 4.21(a) shows that for the 40 hours run time sample, the droplet fills
the channel corners at lower air velocities, and does not fill the channel corners at higher
air velocities. Figure 4.21(b) shows the plot for the IDCA for the 125 hours run time
sample.
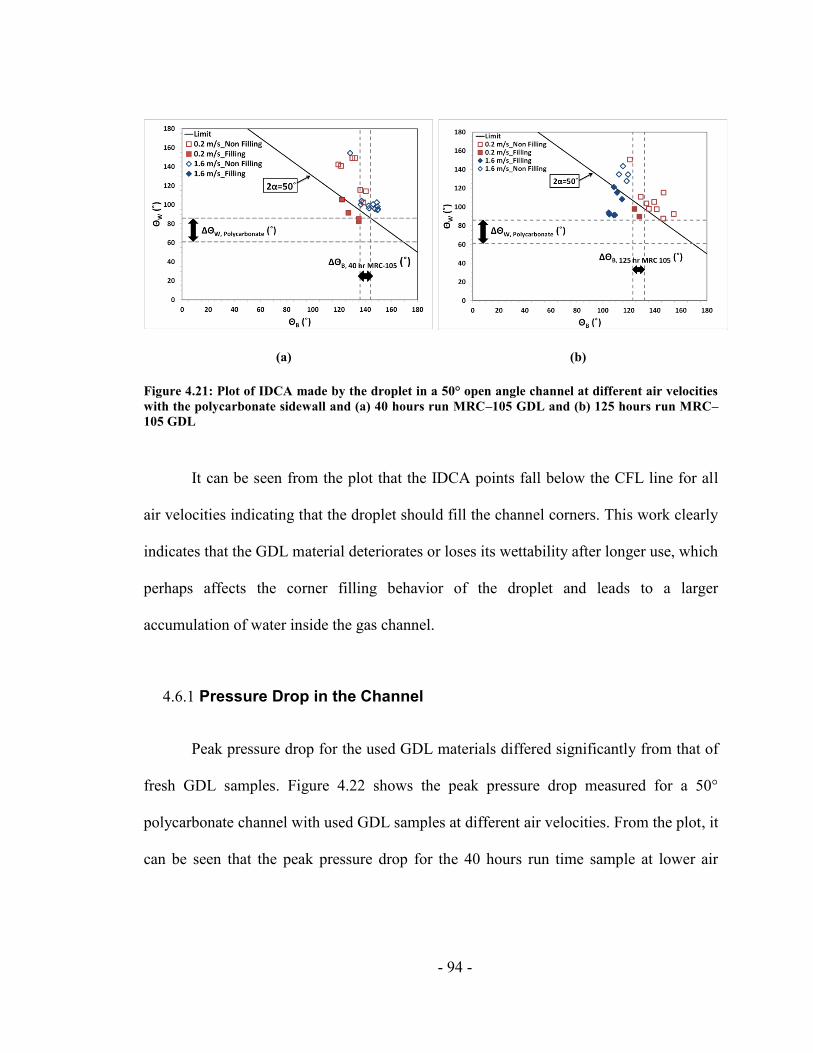
- 94 -
(a) (b)
Figure 4.21: Plot of IDCA made by the droplet in a 50° open angle channel at different air velocities
with the polycarbonate sidewall and (a) 40 hours run MRC–105 GDL and (b) 125 hours run MRC–
105 GDL
It can be seen from the plot that the IDCA points fall below the CFL line for all
air velocities indicating that the droplet should fill the channel corners. This work clearly
indicates that the GDL material deteriorates or loses its wettability after longer use, which
perhaps affects the corner filling behavior of the droplet and leads to a larger
accumulation of water inside the gas channel.
4.6.1 Pressure Drop in the Channel
Peak pressure drop for the used GDL materials differed significantly from that of
fresh GDL samples. Figure 4.22 shows the peak pressure drop measured for a 50°
polycarbonate channel with used GDL samples at different air velocities. From the plot, it
can be seen that the peak pressure drop for the 40 hours run time sample at lower air
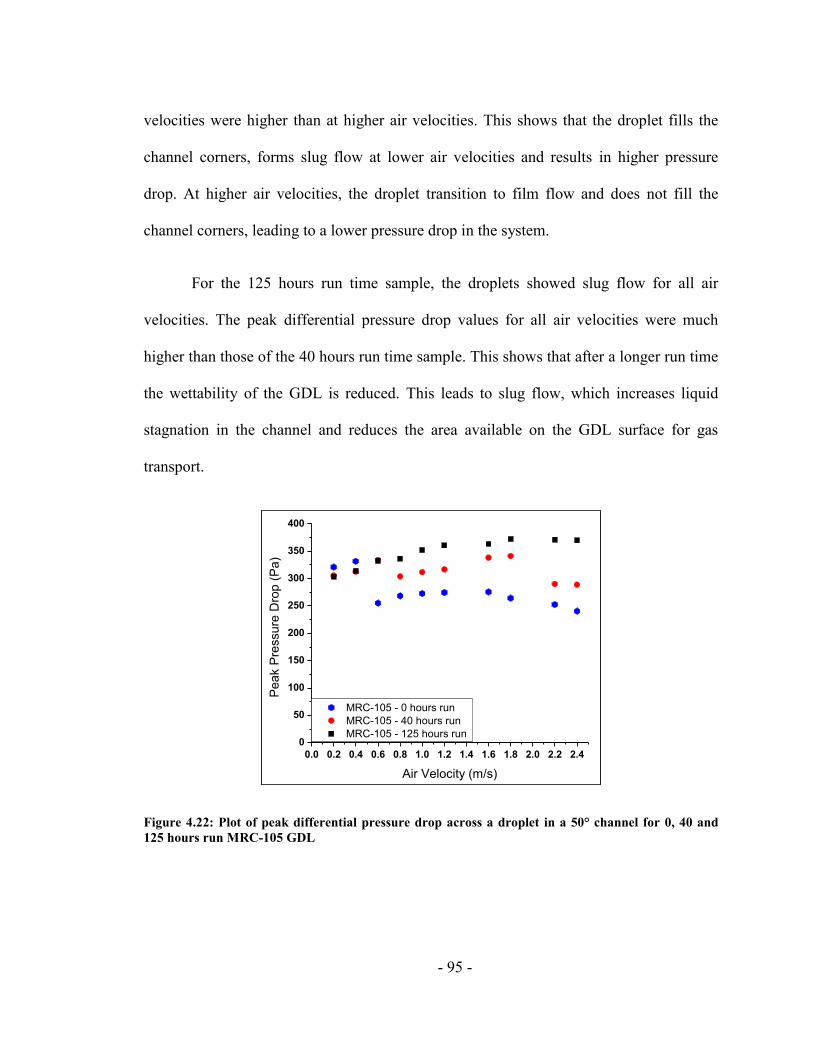
- 95 -
velocities were higher than at higher air velocities. This shows that the droplet fills the
channel corners, forms slug flow at lower air velocities and results in higher pressure
drop. At higher air velocities, the droplet transition to film flow and does not fill the
channel corners, leading to a lower pressure drop in the system.
For the 125 hours run time sample, the droplets showed slug flow for all air
velocities. The peak differential pressure drop values for all air velocities were much
higher than those of the 40 hours run time sample. This shows that after a longer run time
the wettability of the GDL is reduced. This leads to slug flow, which increases liquid
stagnation in the channel and reduces the area available on the GDL surface for gas
transport.
Figure 4.22: Plot of peak differential pressure drop across a droplet in a 50° channel for 0, 40 and
125 hours run MRC-105 GDL
0.0 0.2 0.4 0.6 0.8 1.0 1.2 1.4 1.6 1.8 2.0 2.2 2.4
0
50
100
150
200
250
300
350
400
MRC-105 - 0 hours run
MRC-105 - 40 hours run
MRC-105 - 125 hours run
Pe
ak P
ressu
re D
rop
(P
a)
Air Velocity (m/s)
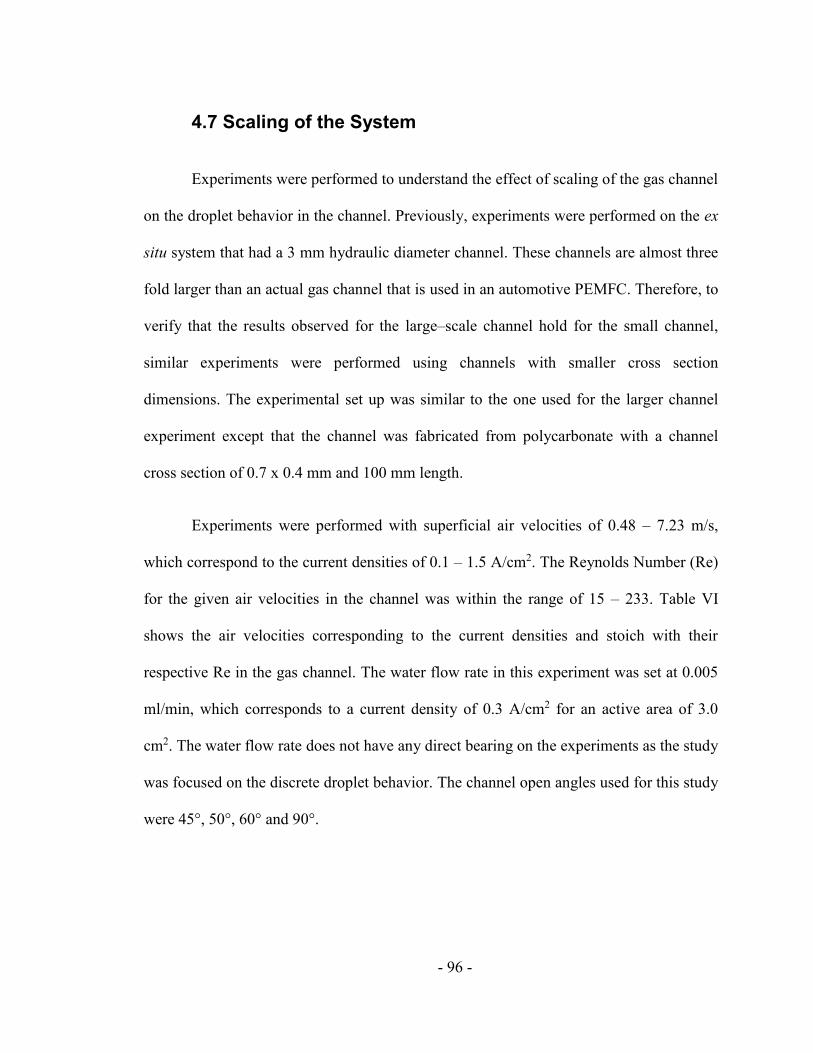
- 96 -
4.7 Scaling of the System
Experiments were performed to understand the effect of scaling of the gas channel
on the droplet behavior in the channel. Previously, experiments were performed on the ex
situ system that had a 3 mm hydraulic diameter channel. These channels are almost three
fold larger than an actual gas channel that is used in an automotive PEMFC. Therefore, to
verify that the results observed for the large–scale channel hold for the small channel,
similar experiments were performed using channels with smaller cross section
dimensions. The experimental set up was similar to the one used for the larger channel
experiment except that the channel was fabricated from polycarbonate with a channel
cross section of 0.7 x 0.4 mm and 100 mm length.
Experiments were performed with superficial air velocities of 0.48 – 7.23 m/s,
which correspond to the current densities of 0.1 – 1.5 A/cm2. The Reynolds Number (Re)
for the given air velocities in the channel was within the range of 15 – 233. Table VI
shows the air velocities corresponding to the current densities and stoich with their
respective Re in the gas channel. The water flow rate in this experiment was set at 0.005
ml/min, which corresponds to a current density of 0.3 A/cm2 for an active area of 3.0
cm2. The water flow rate does not have any direct bearing on the experiments as the study
was focused on the discrete droplet behavior. The channel open angles used for this study
were 45°, 50°, 60° and 90°.
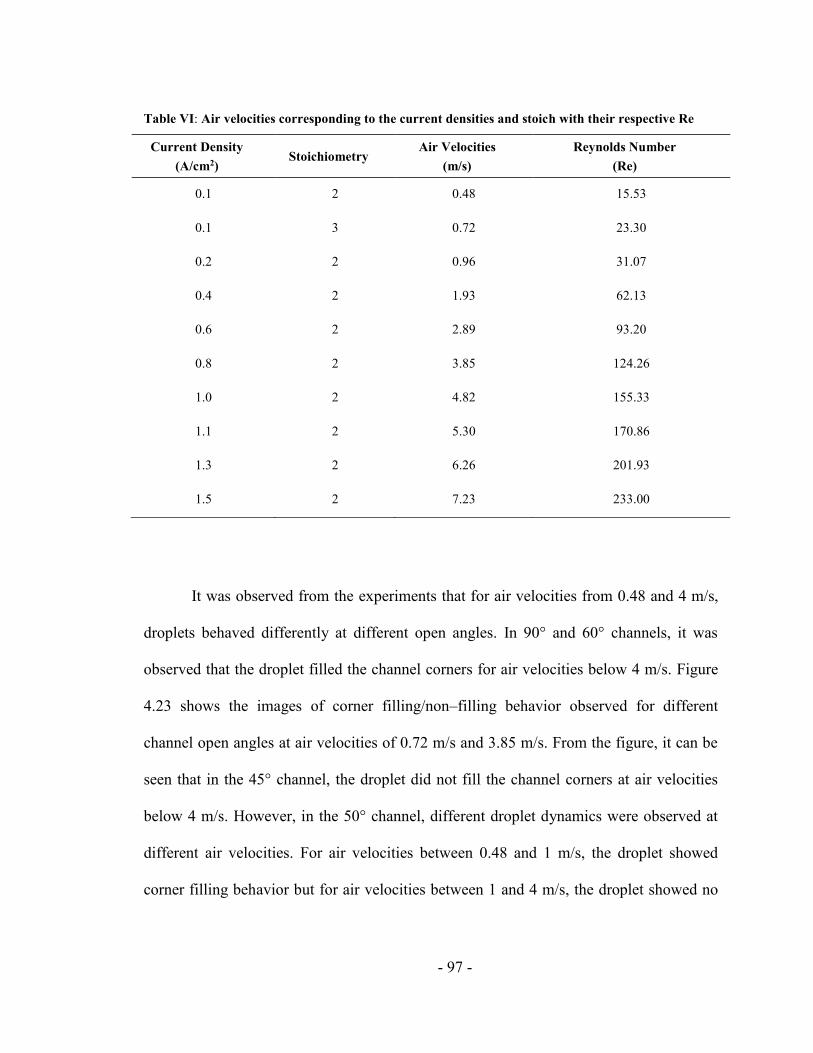
- 97 -
Table VI: Air velocities corresponding to the current densities and stoich with their respective Re
Current Density
(A/cm2) Stoichiometry
Air Velocities
(m/s)
Reynolds Number
(Re)
0.1 2 0.48 15.53
0.1 3 0.72 23.30
0.2 2 0.96 31.07
0.4 2 1.93 62.13
0.6 2 2.89 93.20
0.8 2 3.85 124.26
1.0 2 4.82 155.33
1.1 2 5.30 170.86
1.3 2 6.26 201.93
1.5 2 7.23 233.00
It was observed from the experiments that for air velocities from 0.48 and 4 m/s,
droplets behaved differently at different open angles. In 90° and 60° channels, it was
observed that the droplet filled the channel corners for air velocities below 4 m/s. Figure
4.23 shows the images of corner filling/non–filling behavior observed for different
channel open angles at air velocities of 0.72 m/s and 3.85 m/s. From the figure, it can be
seen that in the 45° channel, the droplet did not fill the channel corners at air velocities
below 4 m/s. However, in the 50° channel, different droplet dynamics were observed at
different air velocities. For air velocities between 0.48 and 1 m/s, the droplet showed
corner filling behavior but for air velocities between 1 and 4 m/s, the droplet showed no
- 98 -
corner filling behavior. It could be concluded that the corner filling behavior observed in
smaller channels was similar to the results observed for larger channel experiments. This
clearly shows that the scaling of the system did not affect the droplet dynamics in the
PEMFC gas channels. Hence, the larger channel experiment performed earlier which
provided much easier visual and experimental results could be used to understand the
liquid water dynamics.
(a)
(b)
Figure 4.23: Corner filling and non–filling behavior in different channel open angles (90°, 50° and
45°) at different air velocities (a) 0.72 m/s (b) 3.85 m/s. For all air velocities, droplet fills the channel
corner in a 90° channel and does not fill the corner in a 45° channel. In 50° channel, the droplet fills
the channel corner at lower air velocities and does not fill at higher air velocities.
- 99 -
To characterize the liquid flow pattern in different channel open angles as a
function of air velocity, videos were taken from the top view of the channel, i.e., along
the airflow direction and parallel to the channel length. From this view, the length of the
film or the slug or the droplet flow along the channel cross section was measured. Figure
4.24 shows a film and a slug flow pattern in the gas channel from a top view for 90° and
50° channels. Using these images, channel blockage percentages along the channel cross
section were calculated and are shown in Table VII.
(a)
(b)
Figure 4.24: Image of a film and a slug flow from top view at air velocities of 0.72 m/s and 3.85 m/s
respectively in a (a) 90° channel and (b) 50° channel.
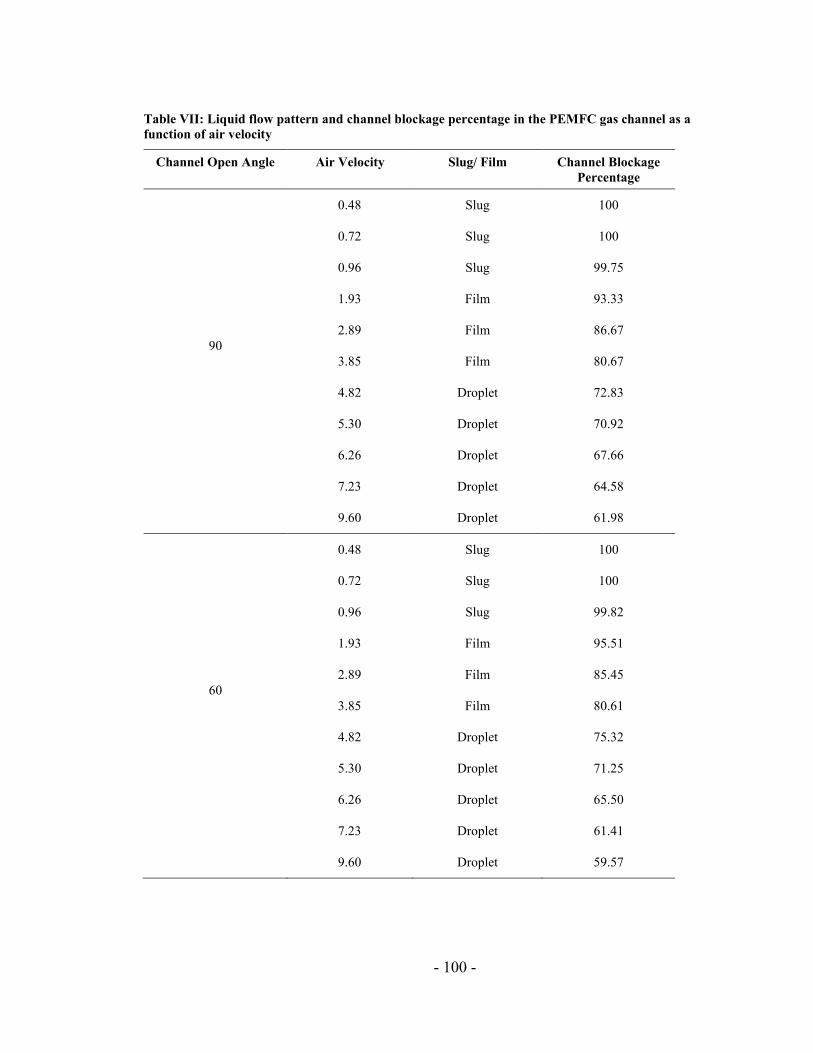
- 100 -
Table VII: Liquid flow pattern and channel blockage percentage in the PEMFC gas channel as a
function of air velocity
Channel Open Angle Air Velocity Slug/ Film Channel Blockage
Percentage
90
0.48 Slug 100
0.72 Slug 100
0.96 Slug 99.75
1.93 Film 93.33
2.89 Film 86.67
3.85 Film 80.67
4.82 Droplet 72.83
5.30 Droplet 70.92
6.26 Droplet 67.66
7.23 Droplet 64.58
9.60 Droplet 61.98
60
0.48 Slug 100
0.72 Slug 100
0.96 Slug 99.82
1.93 Film 95.51
2.89 Film 85.45
3.85 Film 80.61
4.82 Droplet 75.32
5.30 Droplet 71.25
6.26 Droplet 65.50
7.23 Droplet 61.41
9.60 Droplet 59.57
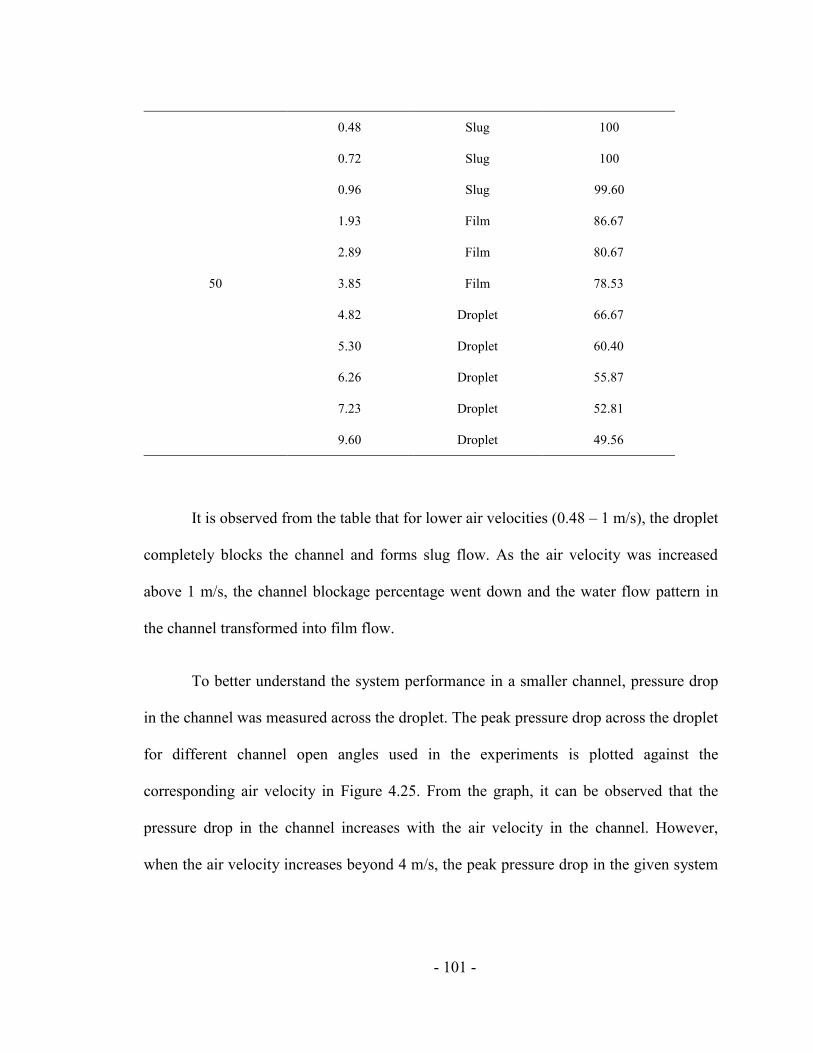
- 101 -
50
0.48 Slug 100
0.72 Slug 100
0.96 Slug 99.60
1.93 Film 86.67
2.89 Film 80.67
3.85 Film 78.53
4.82 Droplet 66.67
5.30 Droplet 60.40
6.26 Droplet 55.87
7.23 Droplet 52.81
9.60 Droplet 49.56
It is observed from the table that for lower air velocities (0.48 – 1 m/s), the droplet
completely blocks the channel and forms slug flow. As the air velocity was increased
above 1 m/s, the channel blockage percentage went down and the water flow pattern in
the channel transformed into film flow.
To better understand the system performance in a smaller channel, pressure drop
in the channel was measured across the droplet. The peak pressure drop across the droplet
for different channel open angles used in the experiments is plotted against the
corresponding air velocity in Figure 4.25. From the graph, it can be observed that the
pressure drop in the channel increases with the air velocity in the channel. However,
when the air velocity increases beyond 4 m/s, the peak pressure drop in the given system
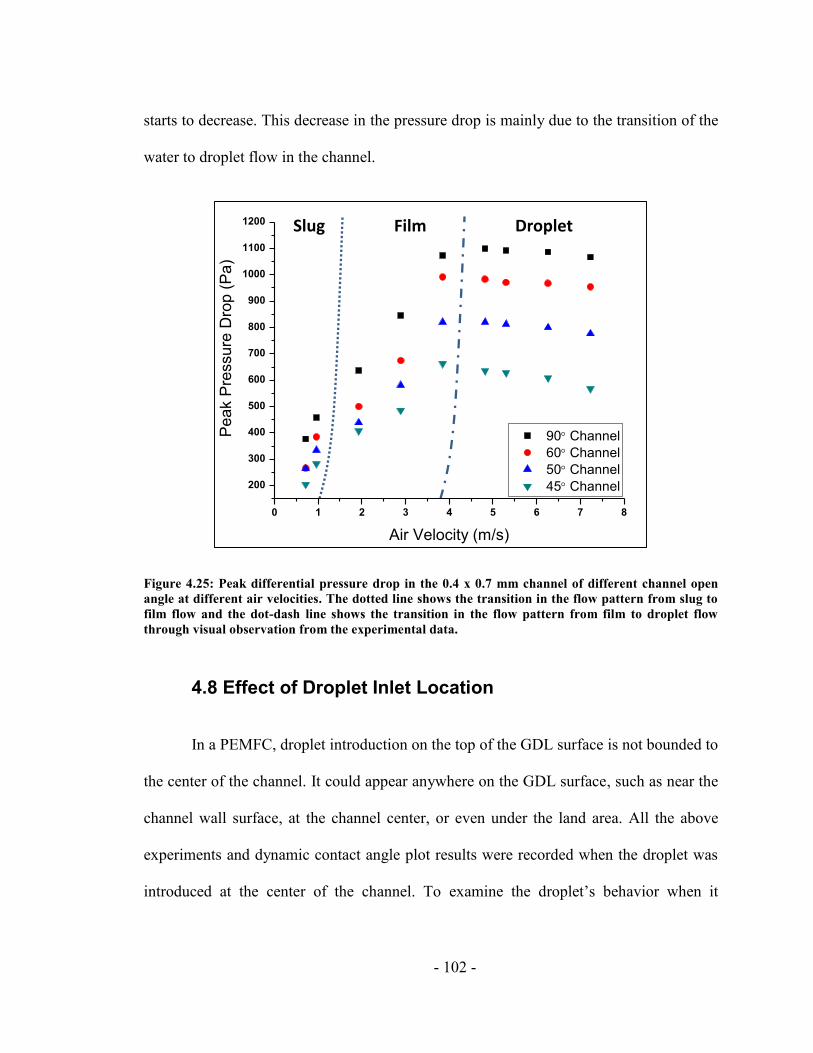
- 102 -
starts to decrease. This decrease in the pressure drop is mainly due to the transition of the
water to droplet flow in the channel.
Figure 4.25: Peak differential pressure drop in the 0.4 x 0.7 mm channel of different channel open
angle at different air velocities. The dotted line shows the transition in the flow pattern from slug to
film flow and the dot-dash line shows the transition in the flow pattern from film to droplet flow
through visual observation from the experimental data.
4.8 Effect of Droplet Inlet Location
In a PEMFC, droplet introduction on the top of the GDL surface is not bounded to
the center of the channel. It could appear anywhere on the GDL surface, such as near the
channel wall surface, at the channel center, or even under the land area. All the above
experiments and dynamic contact angle plot results were recorded when the droplet was
introduced at the center of the channel. To examine the droplet’s behavior when it
Slug Film Droplet
0 1 2 3 4 5 6 7 8
200
300
400
500
600
700
800
900
1000
1100
1200
90 Channel
60 Channel
50 Channel
45 Channel
Peak P
ressure
Dro
p (
Pa)
Air Velocity (m/s)
- 103 -
appeared near the sidewall, a preferential pore for the droplet inlet was introduced 1 mm
away from the sidewall and base interface. It was observed that for a 45° channel the
droplet filled the channel corners for all air velocities as shown in Figure 4.26.
Figure 4.26: : Sequence image of the droplet interaction with the polycarbonate sidewall and GDL
base in a 45° channel when the droplet is introduced near the sidewall (1 mm away from the channel
corner) at an air velocity of 0.4 m/s introduced in the channel.
According to the Concus–Finn condition, the droplet should not fill the channel
corner made by the polycarbonate and GDL in a 45° channel. Using the IDCA values
from the experiments and plotting them against the CFL condition revealed that the
droplet should indeed fill the channel corners as shown in Figure 4.27. This implies that
the IDCA the droplet makes with the sidewall and GDL was altered dynamically by the
airflow in the system, which led to the contact angle being in the filling region. This
Droplet inlet at side Touches sidewall Corner filling
Touches top wallDroplet grow
1 mm
1 mm1 mm
1 mm1 mm
Complete channel filling
1 mm
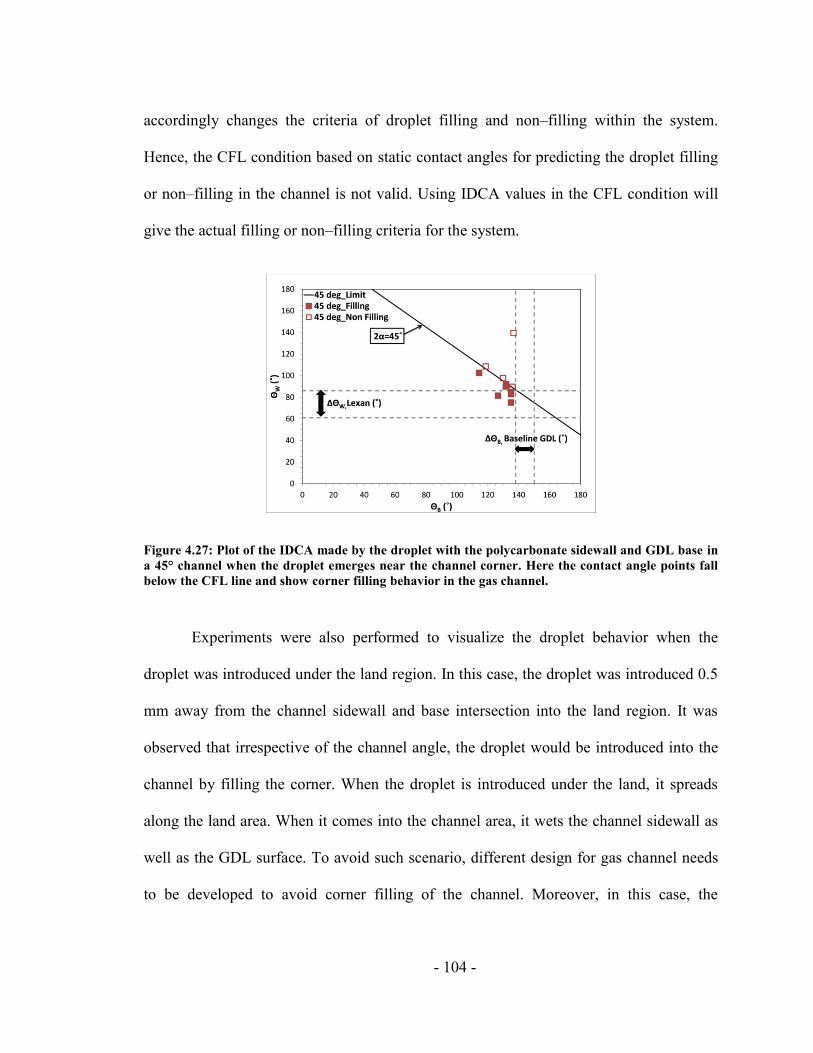
- 104 -
accordingly changes the criteria of droplet filling and non–filling within the system.
Hence, the CFL condition based on static contact angles for predicting the droplet filling
or non–filling in the channel is not valid. Using IDCA values in the CFL condition will
give the actual filling or non–filling criteria for the system.
Figure 4.27: Plot of the IDCA made by the droplet with the polycarbonate sidewall and GDL base in
a 45° channel when the droplet emerges near the channel corner. Here the contact angle points fall
below the CFL line and show corner filling behavior in the gas channel.
Experiments were also performed to visualize the droplet behavior when the
droplet was introduced under the land region. In this case, the droplet was introduced 0.5
mm away from the channel sidewall and base intersection into the land region. It was
observed that irrespective of the channel angle, the droplet would be introduced into the
channel by filling the corner. When the droplet is introduced under the land, it spreads
along the land area. When it comes into the channel area, it wets the channel sidewall as
well as the GDL surface. To avoid such scenario, different design for gas channel needs
to be developed to avoid corner filling of the channel. Moreover, in this case, the
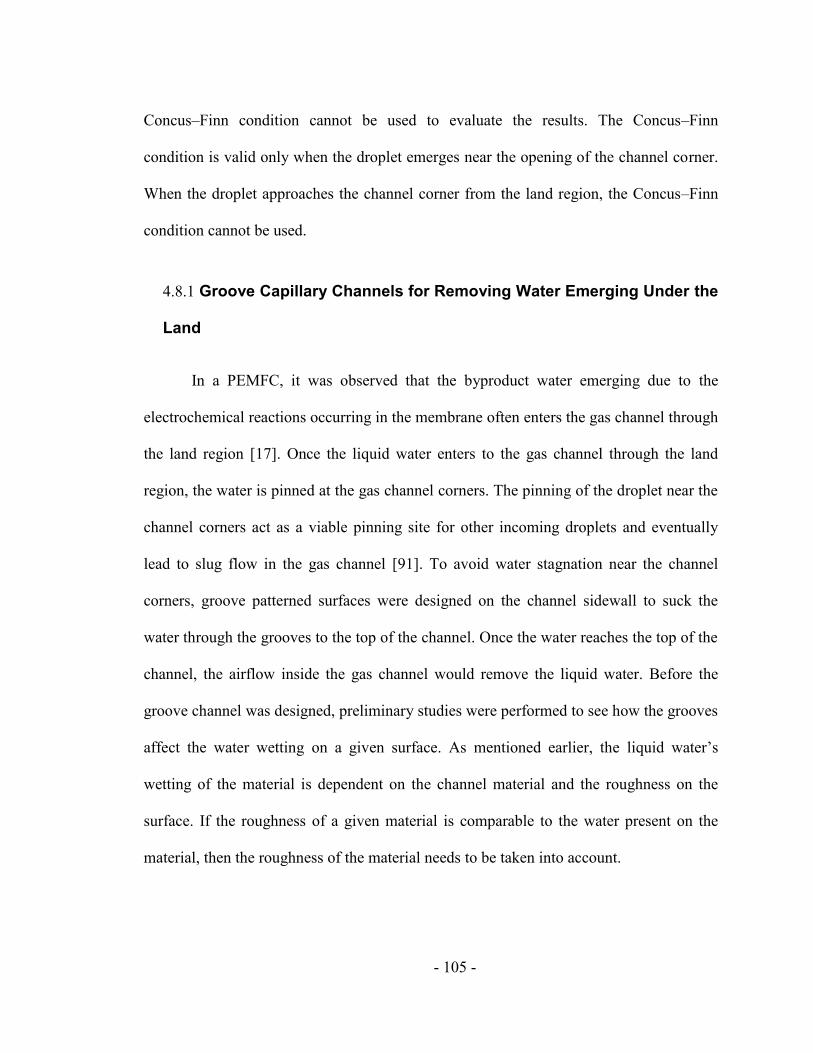
- 105 -
Concus–Finn condition cannot be used to evaluate the results. The Concus–Finn
condition is valid only when the droplet emerges near the opening of the channel corner.
When the droplet approaches the channel corner from the land region, the Concus–Finn
condition cannot be used.
4.8.1 Groove Capillary Channels for Removing Water Emerging Under the
Land
In a PEMFC, it was observed that the byproduct water emerging due to the
electrochemical reactions occurring in the membrane often enters the gas channel through
the land region [17]. Once the liquid water enters to the gas channel through the land
region, the water is pinned at the gas channel corners. The pinning of the droplet near the
channel corners act as a viable pinning site for other incoming droplets and eventually
lead to slug flow in the gas channel [91]. To avoid water stagnation near the channel
corners, groove patterned surfaces were designed on the channel sidewall to suck the
water through the grooves to the top of the channel. Once the water reaches the top of the
channel, the airflow inside the gas channel would remove the liquid water. Before the
groove channel was designed, preliminary studies were performed to see how the grooves
affect the water wetting on a given surface. As mentioned earlier, the liquid water’s
wetting of the material is dependent on the channel material and the roughness on the
surface. If the roughness of a given material is comparable to the water present on the
material, then the roughness of the material needs to be taken into account.
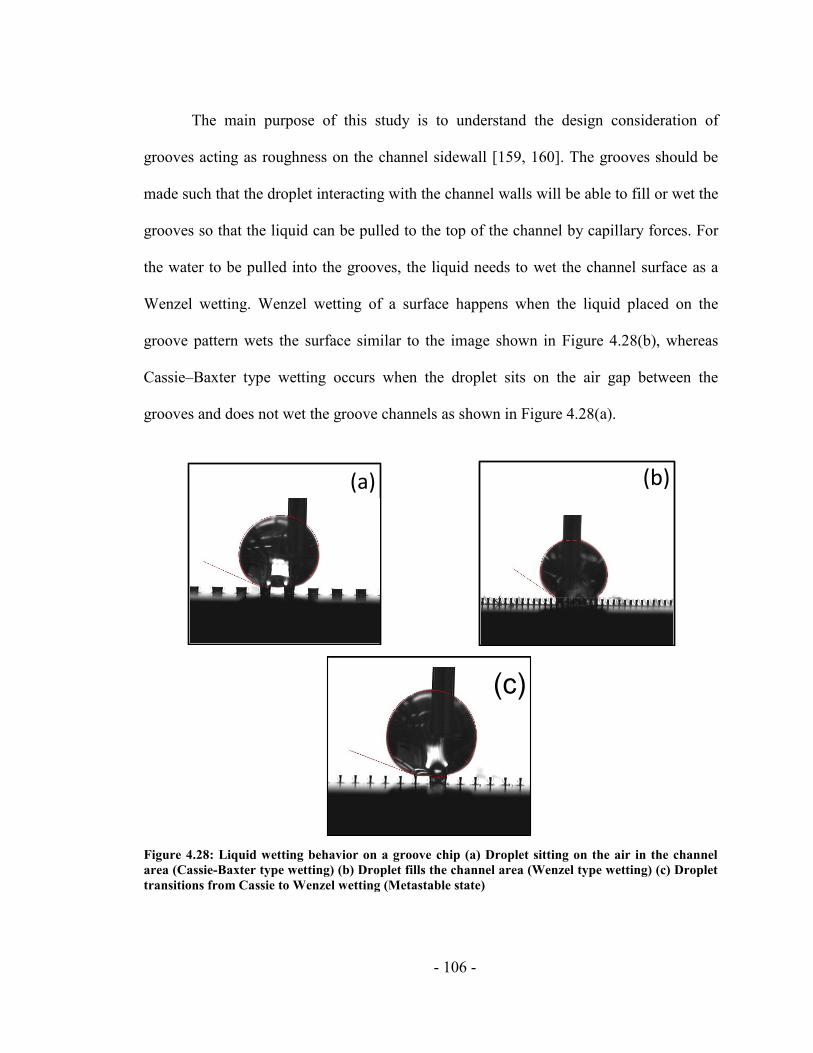
- 106 -
The main purpose of this study is to understand the design consideration of
grooves acting as roughness on the channel sidewall [159, 160]. The grooves should be
made such that the droplet interacting with the channel walls will be able to fill or wet the
grooves so that the liquid can be pulled to the top of the channel by capillary forces. For
the water to be pulled into the grooves, the liquid needs to wet the channel surface as a
Wenzel wetting. Wenzel wetting of a surface happens when the liquid placed on the
groove pattern wets the surface similar to the image shown in Figure 4.28(b), whereas
Cassie–Baxter type wetting occurs when the droplet sits on the air gap between the
grooves and does not wet the groove channels as shown in Figure 4.28(a).
Figure 4.28: Liquid wetting behavior on a groove chip (a) Droplet sitting on the air in the channel
area (Cassie-Baxter type wetting) (b) Droplet fills the channel area (Wenzel type wetting) (c) Droplet
transitions from Cassie to Wenzel wetting (Metastable state)
(a) (b)
(c)
- 107 -
Preliminary experiments were performed to understand how the groove–patterned
roughness affects the wetting behavior on a surface. For these experiments, <1 0 0> p–
type silicon chips 20 mm × 20 mm in size with etched microchannels of different
roughness patterns were used. Silicon chips were used for this experiment as they have a
similar static contact angle to polycarbonate and copper, and are also easier to fabricate
100 µm channels on silicon. Table VIII shows the groove patterns that were made on the
silicon chip.
For different values of channel depth and width, the droplets exhibited Wenzel or
Cassie type behavior as shown in Figure 4.28, and at times, even a metastable state was
observed. A metastable state is where the droplet is in transition between Wenzel and
Cassie wetting as shown in Figure 4.28(c). The complete set of observed behavior for
different channel configurations is tabulated in Table IX. It was also observed that for a
channel width above 161 µm the droplet sometimes enters into a metastable state and
transitions into Wenzel type. This illustrates that the droplet wetting characteristics is
affected by the channel width.
In addition to the channel width effect, an additional effect of roughness height
was observed. When a droplet is in the Cassie state, reducing the roughness height below
a certain limit makes it enter the Wenzel state. The transition occurs when the roughness
height is smaller than the depth to which liquid projects into the channel.
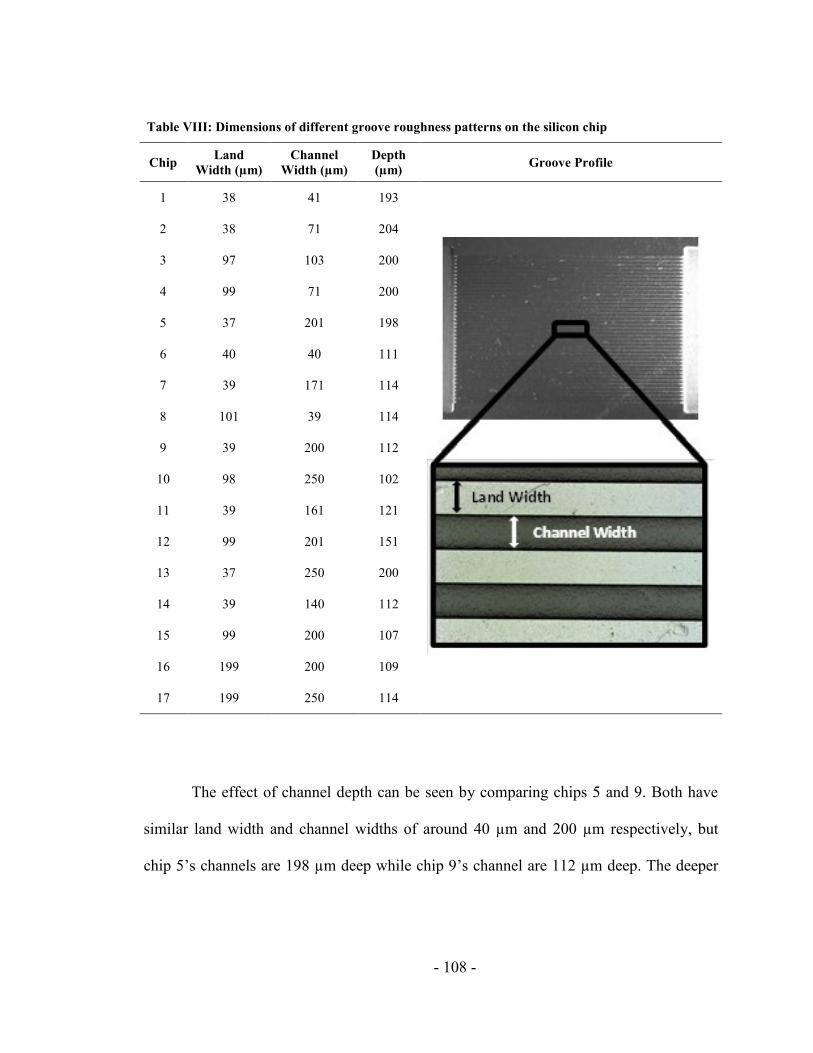
- 108 -
Table VIII: Dimensions of different groove roughness patterns on the silicon chip
Chip Land
Width (µm)
Channel
Width (µm)
Depth
(µm) Groove Profile
1 38 41 193
2 38 71 204
3 97 103 200
4 99 71 200
5 37 201 198
6 40 40 111
7 39 171 114
8 101 39 114
9 39 200 112
10 98 250 102
11 39 161 121
12 99 201 151
13 37 250 200
14 39 140 112
15 99 200 107
16 199 200 109
17 199 250 114
The effect of channel depth can be seen by comparing chips 5 and 9. Both have
similar land width and channel widths of around 40 µm and 200 µm respectively, but
chip 5’s channels are 198 µm deep while chip 9’s channel are 112 µm deep. The deeper
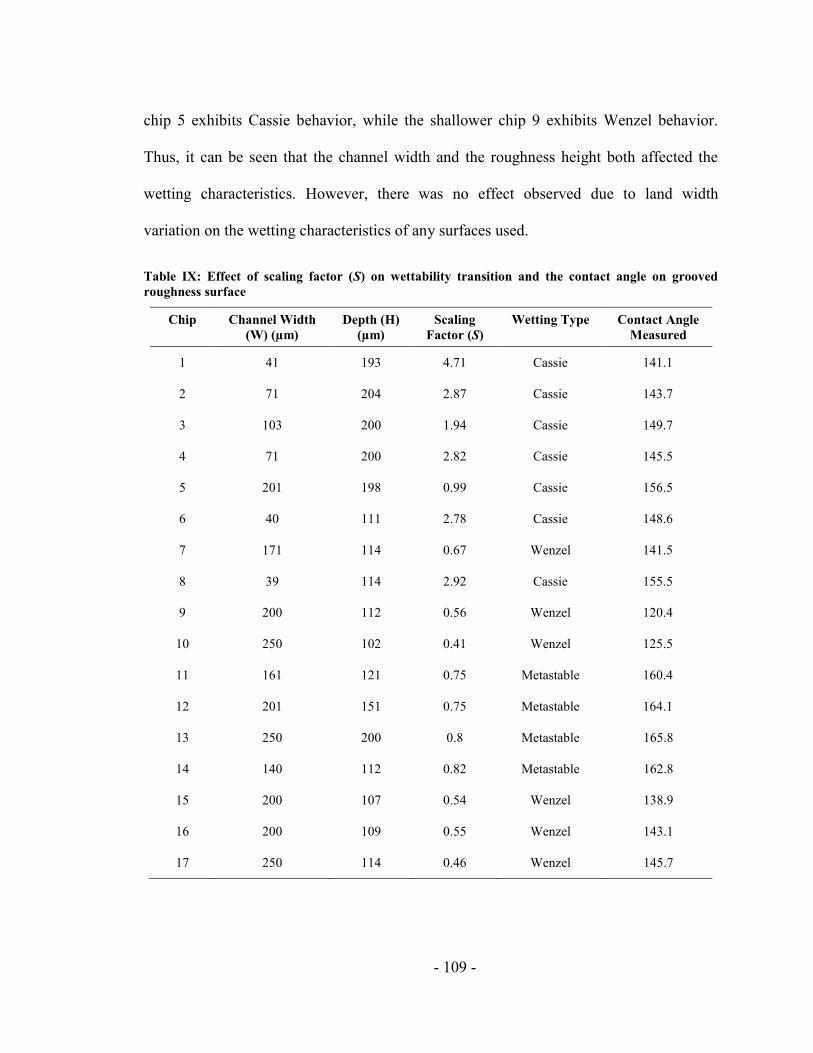
- 109 -
chip 5 exhibits Cassie behavior, while the shallower chip 9 exhibits Wenzel behavior.
Thus, it can be seen that the channel width and the roughness height both affected the
wetting characteristics. However, there was no effect observed due to land width
variation on the wetting characteristics of any surfaces used.
Table IX: Effect of scaling factor (S) on wettability transition and the contact angle on grooved
roughness surface
Chip Channel Width
(W) (µm)
Depth (H)
(µm)
Scaling
Factor (S)
Wetting Type Contact Angle
Measured
1 41 193 4.71 Cassie 141.1
2 71 204 2.87 Cassie 143.7
3 103 200 1.94 Cassie 149.7
4 71 200 2.82 Cassie 145.5
5 201 198 0.99 Cassie 156.5
6 40 111 2.78 Cassie 148.6
7 171 114 0.67 Wenzel 141.5
8 39 114 2.92 Cassie 155.5
9 200 112 0.56 Wenzel 120.4
10 250 102 0.41 Wenzel 125.5
11 161 121 0.75 Metastable 160.4
12 201 151 0.75 Metastable 164.1
13 250 200 0.8 Metastable 165.8
14 140 112 0.82 Metastable 162.8
15 200 107 0.54 Wenzel 138.9
16 200 109 0.55 Wenzel 143.1
17 250 114 0.46 Wenzel 145.7
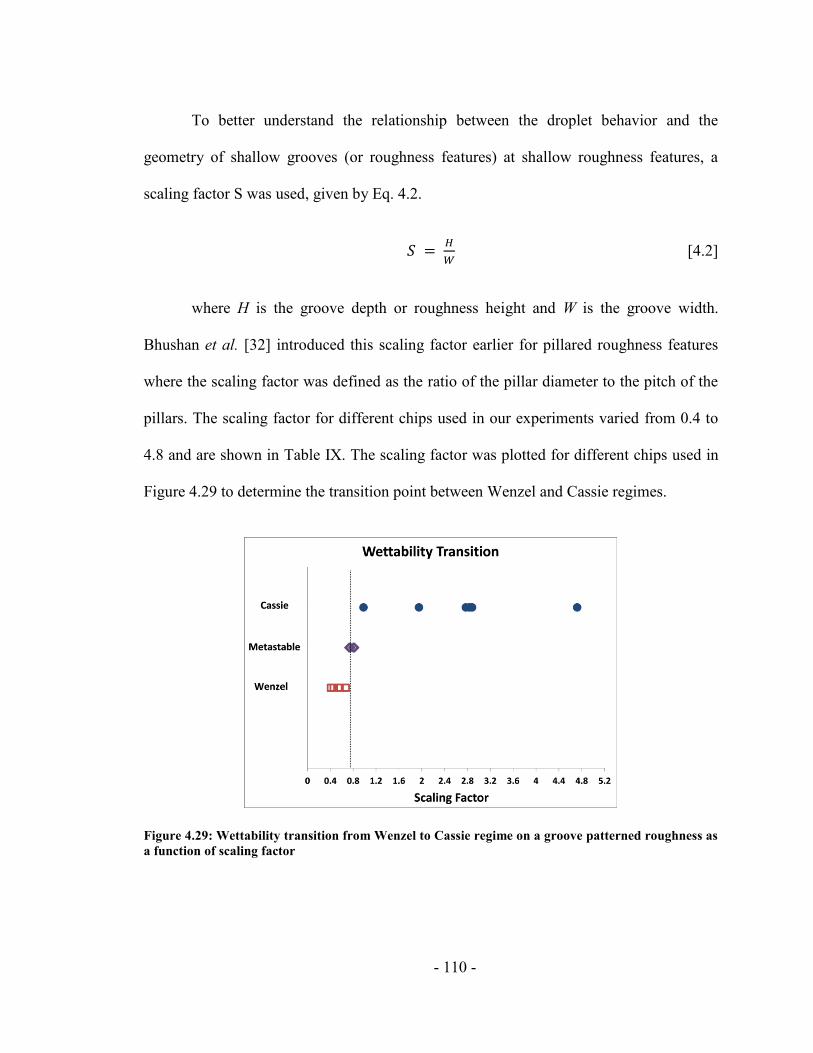
- 110 -
To better understand the relationship between the droplet behavior and the
geometry of shallow grooves (or roughness features) at shallow roughness features, a
scaling factor S was used, given by Eq. 4.2.
𝑆 = 𝐻
𝑊 [4.2]
where H is the groove depth or roughness height and W is the groove width.
Bhushan et al. [32] introduced this scaling factor earlier for pillared roughness features
where the scaling factor was defined as the ratio of the pillar diameter to the pitch of the
pillars. The scaling factor for different chips used in our experiments varied from 0.4 to
4.8 and are shown in Table IX. The scaling factor was plotted for different chips used in
Figure 4.29 to determine the transition point between Wenzel and Cassie regimes.
Figure 4.29: Wettability transition from Wenzel to Cassie regime on a groove patterned roughness as
a function of scaling factor
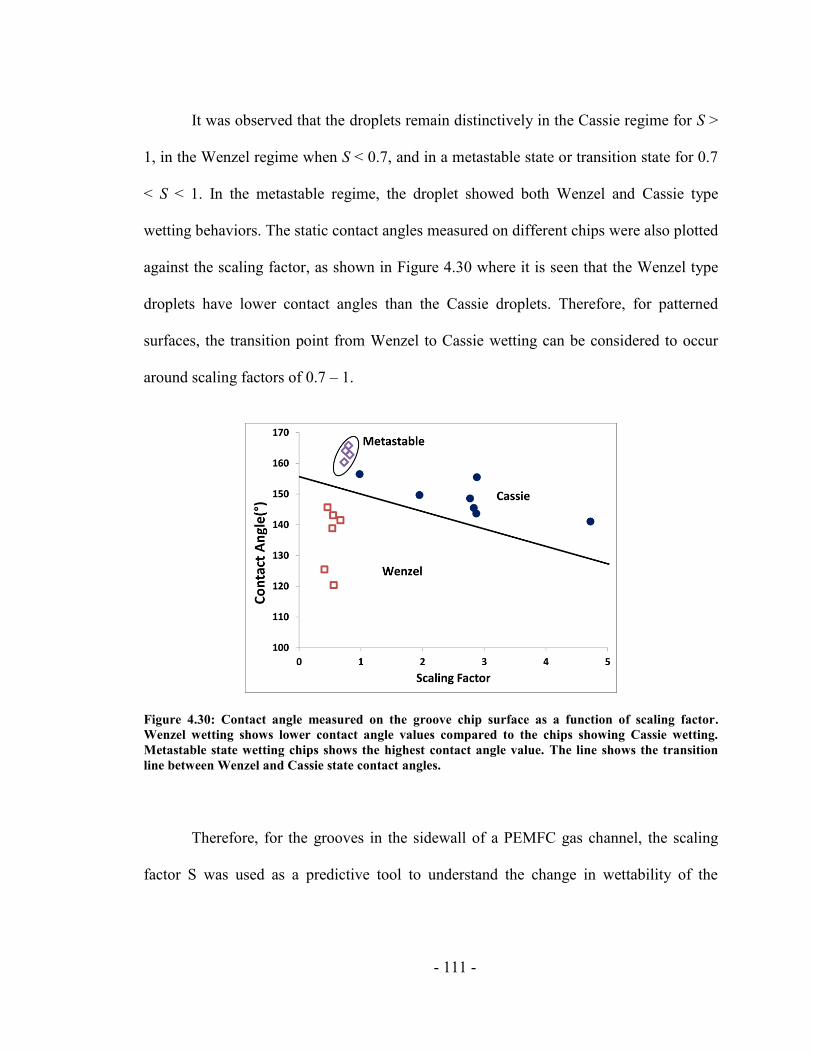
- 111 -
It was observed that the droplets remain distinctively in the Cassie regime for S >
1, in the Wenzel regime when S < 0.7, and in a metastable state or transition state for 0.7
< S < 1. In the metastable regime, the droplet showed both Wenzel and Cassie type
wetting behaviors. The static contact angles measured on different chips were also plotted
against the scaling factor, as shown in Figure 4.30 where it is seen that the Wenzel type
droplets have lower contact angles than the Cassie droplets. Therefore, for patterned
surfaces, the transition point from Wenzel to Cassie wetting can be considered to occur
around scaling factors of 0.7 – 1.
Figure 4.30: Contact angle measured on the groove chip surface as a function of scaling factor.
Wenzel wetting shows lower contact angle values compared to the chips showing Cassie wetting.
Metastable state wetting chips shows the highest contact angle value. The line shows the transition
line between Wenzel and Cassie state contact angles.
Therefore, for the grooves in the sidewall of a PEMFC gas channel, the scaling
factor S was used as a predictive tool to understand the change in wettability of the
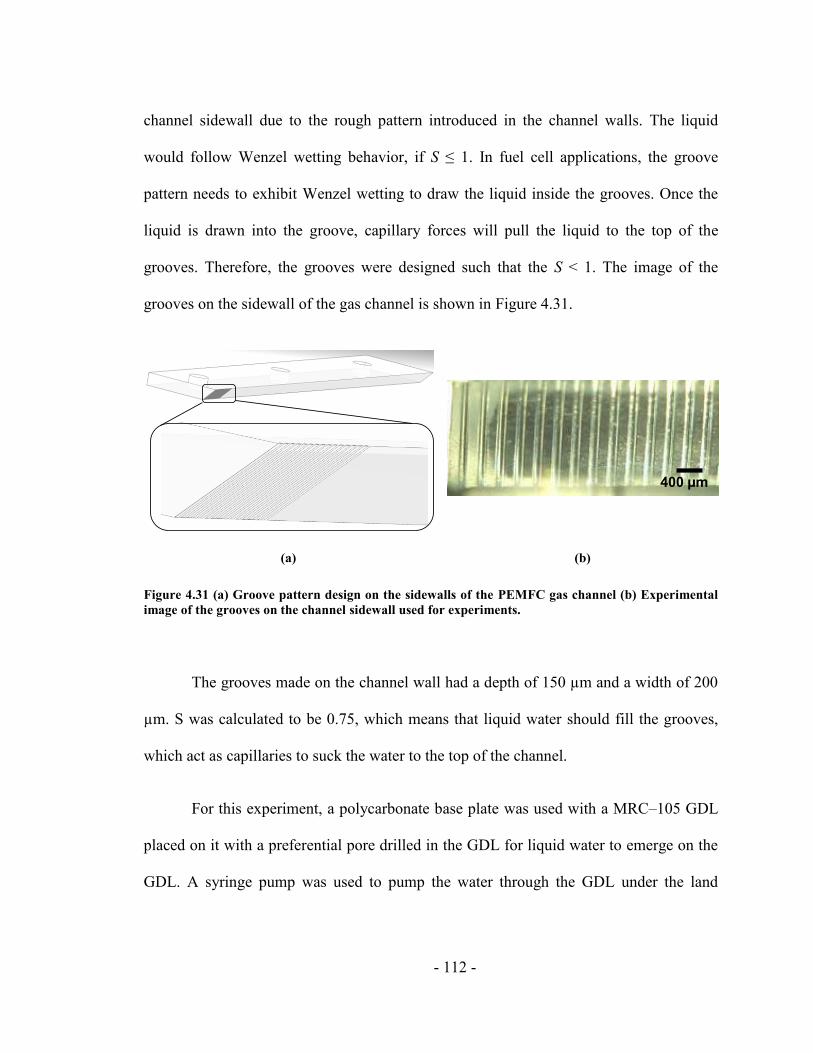
- 112 -
channel sidewall due to the rough pattern introduced in the channel walls. The liquid
would follow Wenzel wetting behavior, if S ≤ 1. In fuel cell applications, the groove
pattern needs to exhibit Wenzel wetting to draw the liquid inside the grooves. Once the
liquid is drawn into the groove, capillary forces will pull the liquid to the top of the
grooves. Therefore, the grooves were designed such that the S < 1. The image of the
grooves on the sidewall of the gas channel is shown in Figure 4.31.
(a) (b)
Figure 4.31 (a) Groove pattern design on the sidewalls of the PEMFC gas channel (b) Experimental
image of the grooves on the channel sidewall used for experiments.
The grooves made on the channel wall had a depth of 150 µm and a width of 200
µm. S was calculated to be 0.75, which means that liquid water should fill the grooves,
which act as capillaries to suck the water to the top of the channel.
For this experiment, a polycarbonate base plate was used with a MRC–105 GDL
placed on it with a preferential pore drilled in the GDL for liquid water to emerge on the
GDL. A syringe pump was used to pump the water through the GDL under the land
400 µm
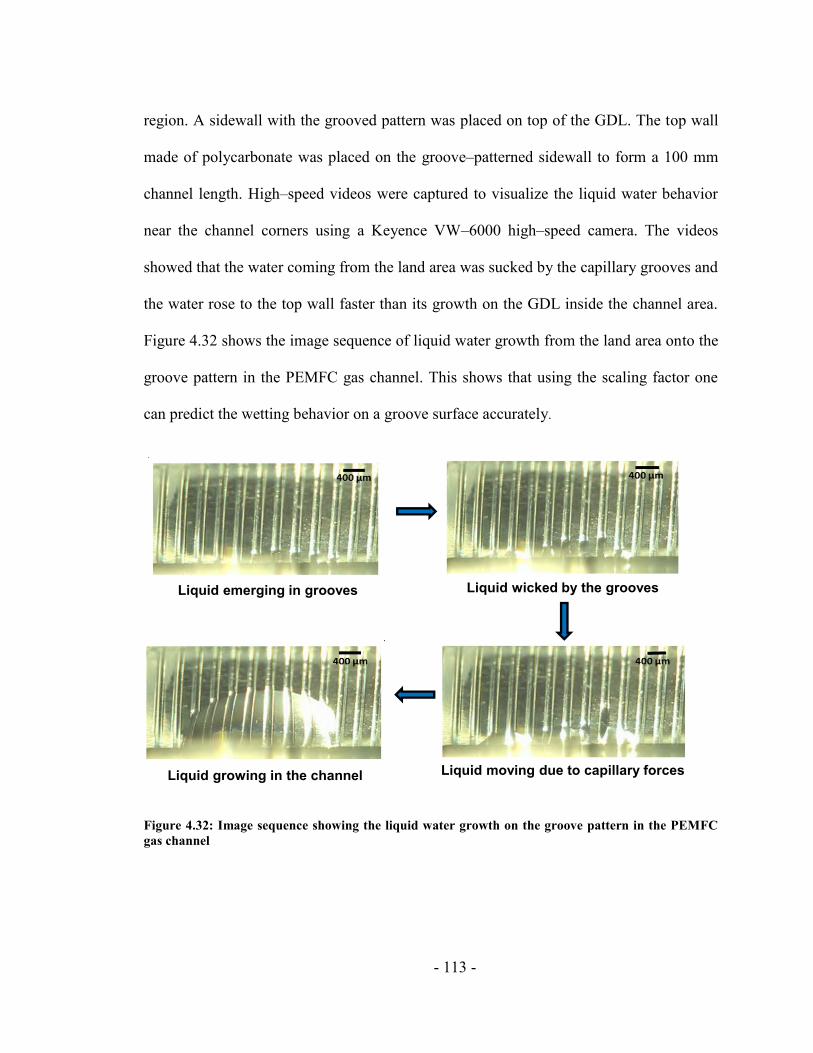
- 113 -
region. A sidewall with the grooved pattern was placed on top of the GDL. The top wall
made of polycarbonate was placed on the groove–patterned sidewall to form a 100 mm
channel length. High–speed videos were captured to visualize the liquid water behavior
near the channel corners using a Keyence VW–6000 high–speed camera. The videos
showed that the water coming from the land area was sucked by the capillary grooves and
the water rose to the top wall faster than its growth on the GDL inside the channel area.
Figure 4.32 shows the image sequence of liquid water growth from the land area onto the
groove pattern in the PEMFC gas channel. This shows that using the scaling factor one
can predict the wetting behavior on a groove surface accurately.
Figure 4.32: Image sequence showing the liquid water growth on the groove pattern in the PEMFC
gas channel
Liquid wicked by the groovesLiquid emerging in grooves
Liquid growing in the channel Liquid moving due to capillary forces
- 114 -
However, the suction by the capillary grooves used for this experiment was not
strong enough to pull the liquid quickly to the top due to the large size of the capillary
grooves. Therefore, grooves with smaller channel depth and width are needed to achieve
good capillary rise inside the grooves before the liquid grows inside the channel area.
This is being incorporated in the future design of the sidewalls for PEMFC gas channel.
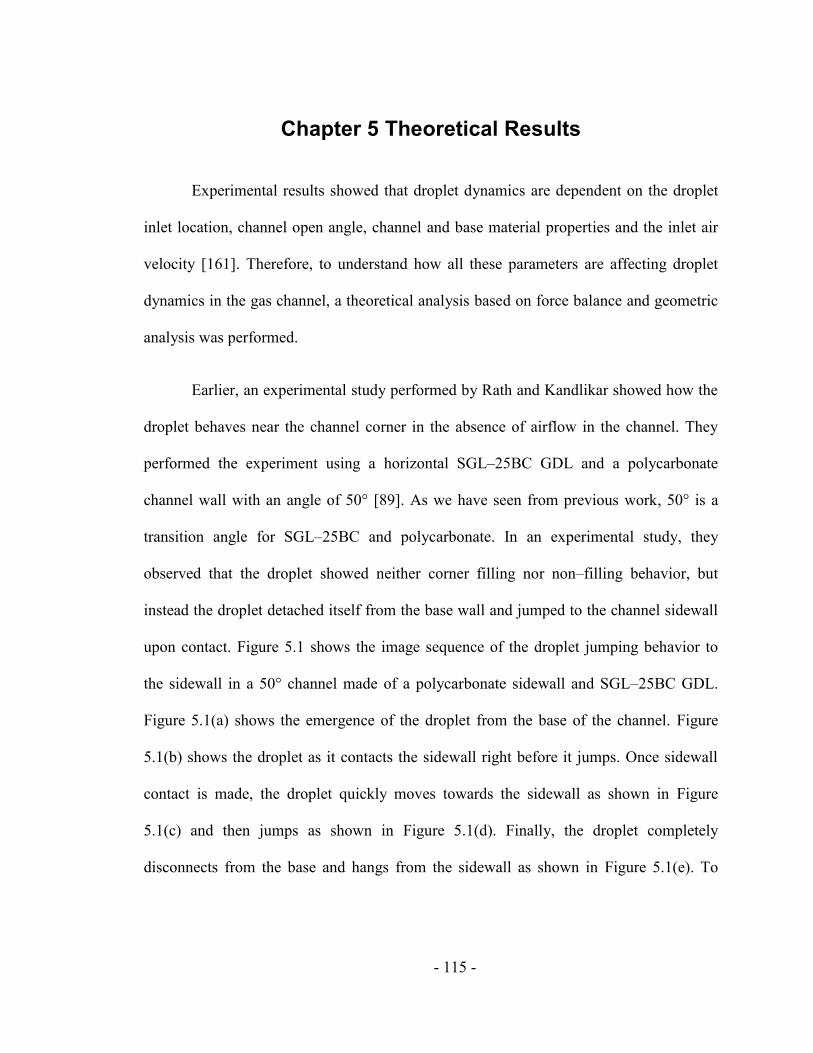
- 115 -
Chapter 5 Theoretical Results
Experimental results showed that droplet dynamics are dependent on the droplet
inlet location, channel open angle, channel and base material properties and the inlet air
velocity [161]. Therefore, to understand how all these parameters are affecting droplet
dynamics in the gas channel, a theoretical analysis based on force balance and geometric
analysis was performed.
Earlier, an experimental study performed by Rath and Kandlikar showed how the
droplet behaves near the channel corner in the absence of airflow in the channel. They
performed the experiment using a horizontal SGL–25BC GDL and a polycarbonate
channel wall with an angle of 50° [89]. As we have seen from previous work, 50° is a
transition angle for SGL–25BC and polycarbonate. In an experimental study, they
observed that the droplet showed neither corner filling nor non–filling behavior, but
instead the droplet detached itself from the base wall and jumped to the channel sidewall
upon contact. Figure 5.1 shows the image sequence of the droplet jumping behavior to
the sidewall in a 50° channel made of a polycarbonate sidewall and SGL–25BC GDL.
Figure 5.1(a) shows the emergence of the droplet from the base of the channel. Figure
5.1(b) shows the droplet as it contacts the sidewall right before it jumps. Once sidewall
contact is made, the droplet quickly moves towards the sidewall as shown in Figure
5.1(c) and then jumps as shown in Figure 5.1(d). Finally, the droplet completely
disconnects from the base and hangs from the sidewall as shown in Figure 5.1(e). To
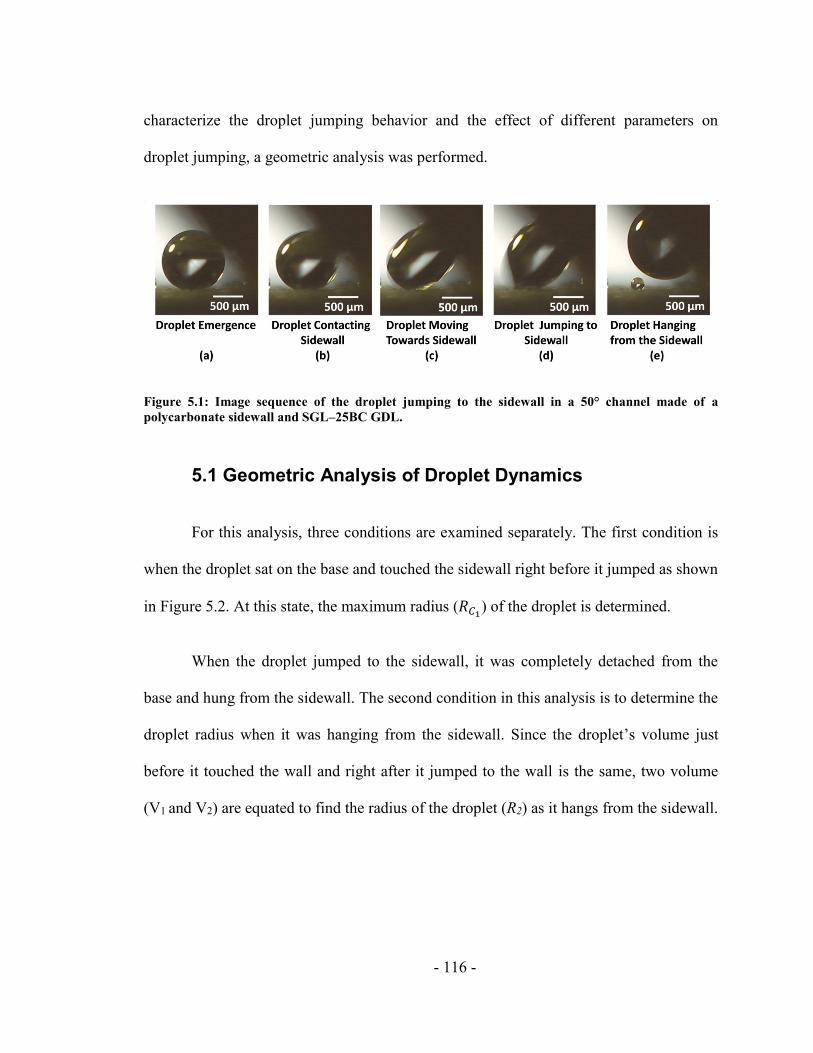
- 116 -
characterize the droplet jumping behavior and the effect of different parameters on
droplet jumping, a geometric analysis was performed.
Figure 5.1: Image sequence of the droplet jumping to the sidewall in a 50° channel made of a
polycarbonate sidewall and SGL–25BC GDL.
5.1 Geometric Analysis of Droplet Dynamics
For this analysis, three conditions are examined separately. The first condition is
when the droplet sat on the base and touched the sidewall right before it jumped as shown
in Figure 5.2. At this state, the maximum radius (𝑅𝐶1) of the droplet is determined.
When the droplet jumped to the sidewall, it was completely detached from the
base and hung from the sidewall. The second condition in this analysis is to determine the
droplet radius when it was hanging from the sidewall. Since the droplet’s volume just
before it touched the wall and right after it jumped to the wall is the same, two volume
(V1 and V2) are equated to find the radius of the droplet (R2) as it hangs from the sidewall.
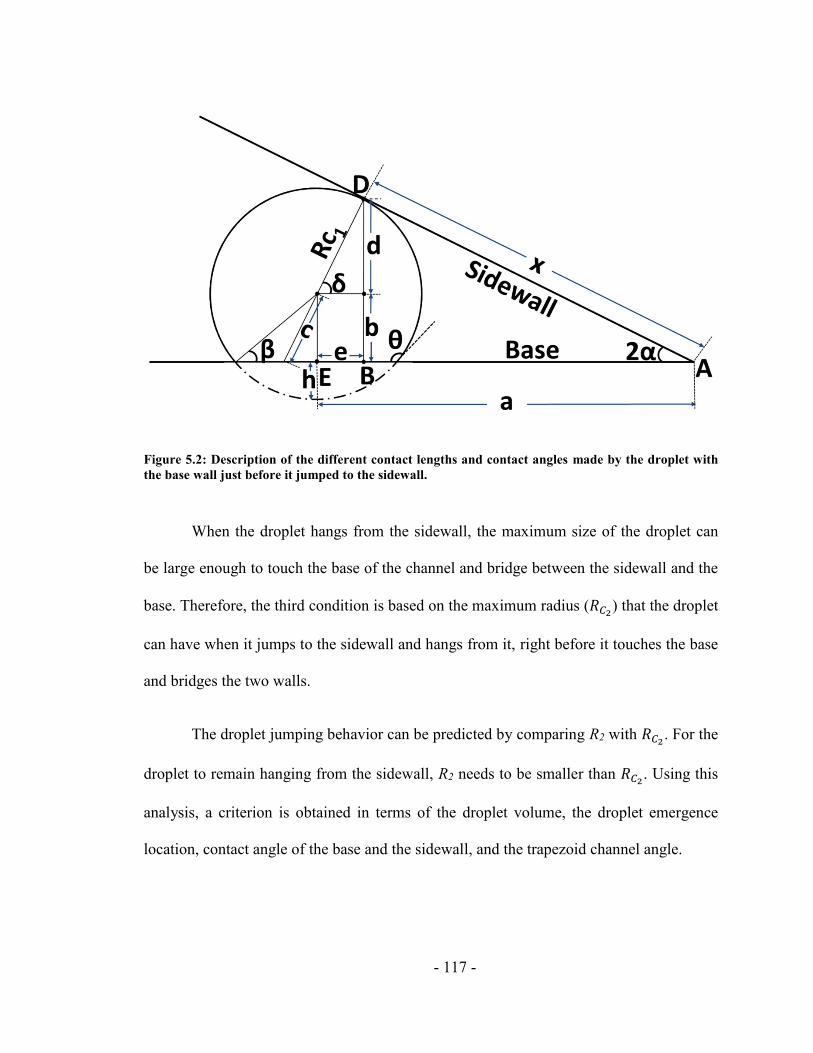
- 117 -
Figure 5.2: Description of the different contact lengths and contact angles made by the droplet with
the base wall just before it jumped to the sidewall.
When the droplet hangs from the sidewall, the maximum size of the droplet can
be large enough to touch the base of the channel and bridge between the sidewall and the
base. Therefore, the third condition is based on the maximum radius (𝑅𝐶2) that the droplet
can have when it jumps to the sidewall and hangs from it, right before it touches the base
and bridges the two walls.
The droplet jumping behavior can be predicted by comparing R2 with 𝑅𝐶2. For the
droplet to remain hanging from the sidewall, R2 needs to be smaller than 𝑅𝐶2. Using this
analysis, a criterion is obtained in terms of the droplet volume, the droplet emergence
location, contact angle of the base and the sidewall, and the trapezoid channel angle.
- 118 -
In the above analysis, the gravitational force is neglected. This assumption is valid
for droplets with a Bo (ratio of gravity to surface tension forces) less than 0.3 [132]. For
water droplets at standard earth gravity, this results in a limiting droplet radius of 1.5 mm.
In addition, the droplet jumping to the sidewall occurred because the base material used
had higher a contact angle than the sidewall material. Therefore, for the droplet to jump,
the surface energy of the sidewall needs to be lower than the base. To understand the
effect of surface energies on droplet behavior, a Gibbs free energy analysis was
performed on the droplet in two states: (a) just before the jump and (b) as it hangs from
the sidewall.
5.1.1 Condition 1: Droplet Sitting on the Base Wall before Jumping to the
Sidewall
The maximum radius 𝑅𝐶1that is associated with the droplet volume just before it
jumps to the sidewall is first determined. For this analysis, the following parameters, as
shown in Figure 5.2, are defined:
θ is the static contact angle of the base wall.
2α is the open angle between the wall and the base.
a is the distance to the droplet emergence location from the channel corner.
x is the distance from the channel corner to where the droplet contacts the
sidewall (D) right before it jumps.
- 119 -
b is the vertical distance from the center of the sphere which constitutes the
droplet to the base of the channel.
c is the distance from center of the droplet to the base such that it makes an angle
δ with the base and is in line with the radius of the droplet, 𝑅𝐶1.
d and e are the vertical and horizontal distances from the tangent point D to the
center of the droplet respectively.
β is the inner open angle made by the radius 𝑅𝐶1 with the base of the channel.
The relationship between the above–mentioned angles is given in detail in Appendix II.
The channel open angle is related to the droplet critical radius as
𝑡𝑎𝑛 2𝛼 = 𝑅𝐶1 𝑠𝑖𝑛 𝛽+𝑅𝐶1 𝑠𝑖𝑛 𝛿
𝑎−𝑅𝐶1 𝑐𝑜𝑠 𝛿 [5.1]
From Eq. 5.1, the maximum radius of the droplet 𝑅𝐶1 just before it snaps and
jumps to the sidewall is obtained. A detailed derivation of 𝑅𝐶1 is given in Appendix II.
𝑅𝐶1=
𝑎 𝑠𝑖𝑛 2𝛼
1−(𝑐𝑜𝑠 𝜃 𝑐𝑜𝑠 2𝛼) [5.2]
Figure 5.3 shows two images from the experimental video, where point D acts as
the midpoint around which the droplet hangs when it is pulled towards the sidewall. The
droplet jumping condition is dependent on the distance x. Detailed derivation of x is
given in Appendix II.
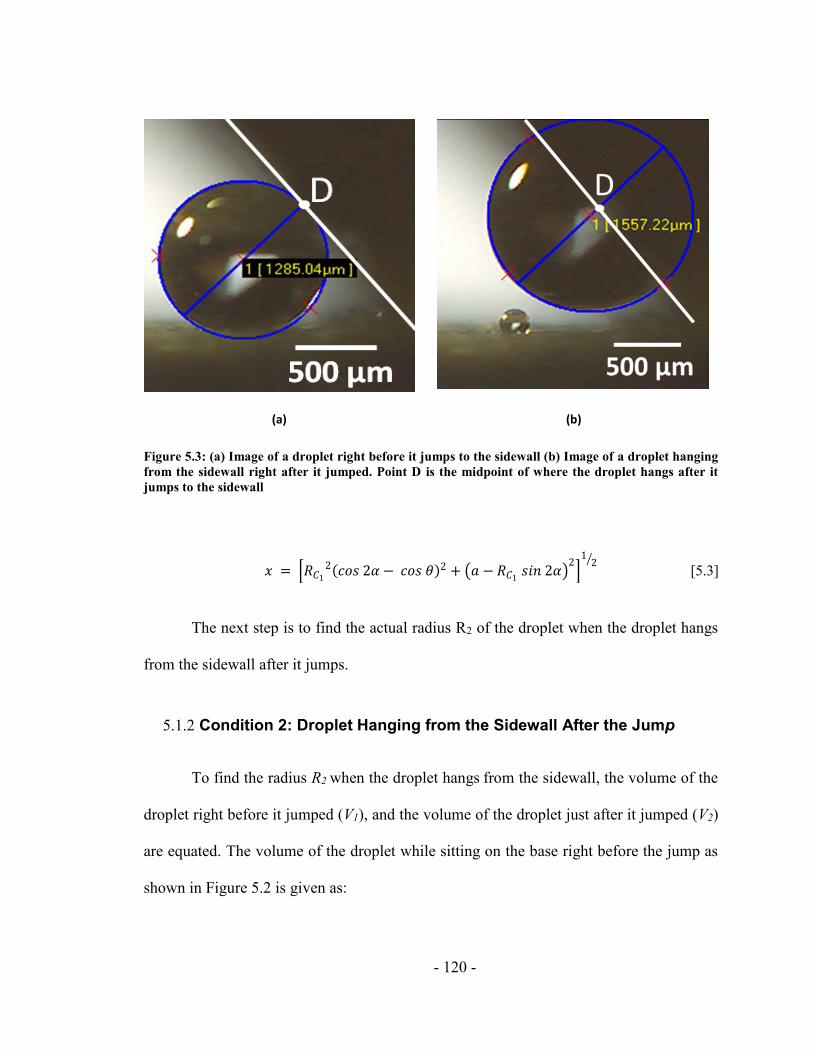
- 120 -
(a) (b)
Figure 5.3: (a) Image of a droplet right before it jumps to the sidewall (b) Image of a droplet hanging
from the sidewall right after it jumped. Point D is the midpoint of where the droplet hangs after it
jumps to the sidewall
𝑥 = 𝑅𝐶1
2(𝑐𝑜𝑠 2𝛼 − 𝑐𝑜𝑠 𝜃)2 + 𝑎 − 𝑅𝐶1 𝑠𝑖𝑛 2𝛼
2
12
[5.3]
The next step is to find the actual radius R2 of the droplet when the droplet hangs
from the sidewall after it jumps.
5.1.2 Condition 2: Droplet Hanging from the Sidewall After the Jump
To find the radius R2 when the droplet hangs from the sidewall, the volume of the
droplet right before it jumped (V1), and the volume of the droplet just after it jumped (V2)
are equated. The volume of the droplet while sitting on the base right before the jump as
shown in Figure 5.2 is given as:
- 121 -
𝑉1 = 𝜋 2𝑅𝐶1
3−3 𝑅𝐶13𝑐𝑜𝑠 𝜃+ 𝑅𝐶1
3 𝑐𝑜𝑠3𝜃
3 [5.4]
The volume of the droplet while hanging from the sidewall is given as
𝑉2 =𝜋
3𝑅2
3(2 − 3 𝑐𝑜𝑠 ∅ + 𝑐𝑜𝑠3∅ ) [5.5]
where ∅ is the static contact angle of the sidewall. Detailed derivations for V1 and V2 are
given in Appendix II.
Equating both the volumes V1 and V2, R2 is found to be
𝑅2 = 𝑎 𝑠𝑖𝑛 2𝛼
1−(𝑐𝑜𝑠 𝜃 𝑐𝑜𝑠 2𝛼)
2−3 𝑐𝑜𝑠 𝜃+ 𝑐𝑜𝑠3𝜃
2− 3 𝑐𝑜𝑠 ∅+𝑐𝑜𝑠3∅
13
[5.6]
5.1.3 Droplet Jumping Criterion Analysis from Geometrical
Considerations
The next step in the derivation process is to determine the maximum radius 𝑅𝐶2 as
shown in Figure 5.4. The following parameters shown in Figure 5.4 are defined as:
O is the center of the hanging droplet.
x is the distance from the channel corner to the midpoint D around which the
droplet hangs from the sidewall.
g is the vertical distance from the center of a droplet with radius 𝑅𝐶2 to the
channel sidewall.
𝜂 is the angle made by line g with the sidewall at point C.
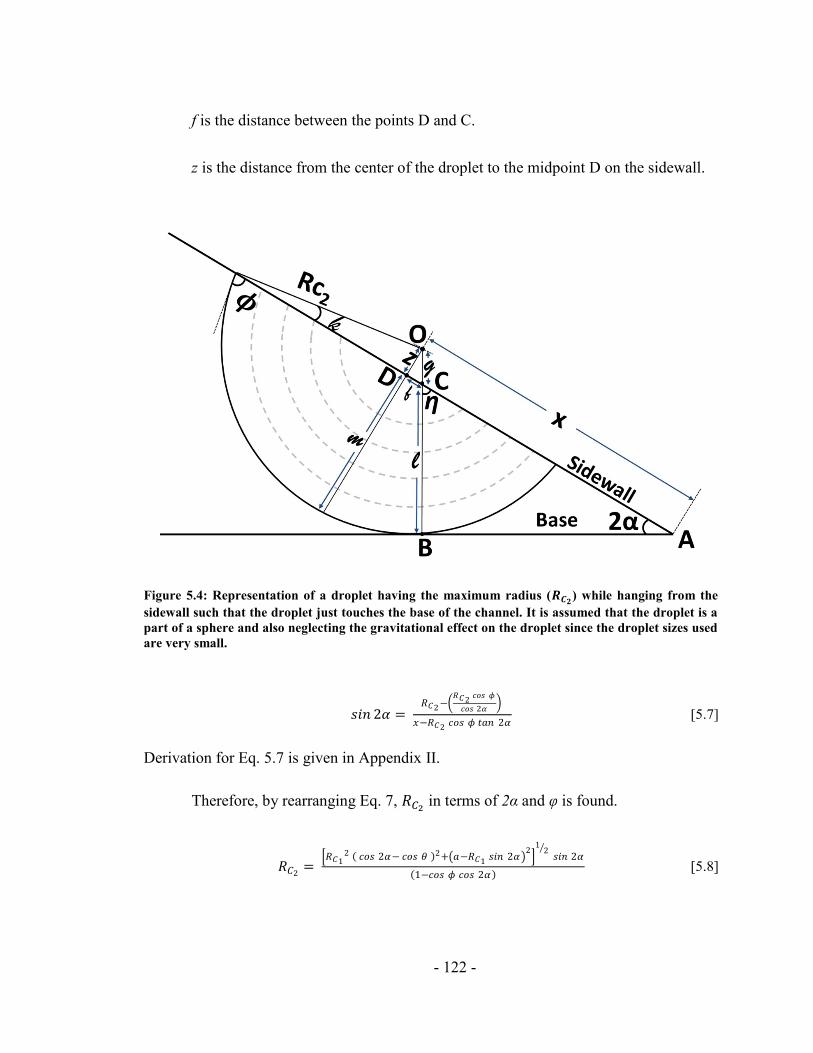
- 122 -
f is the distance between the points D and C.
z is the distance from the center of the droplet to the midpoint D on the sidewall.
Figure 5.4: Representation of a droplet having the maximum radius (𝑹𝑪𝟐) while hanging from the
sidewall such that the droplet just touches the base of the channel. It is assumed that the droplet is a
part of a sphere and also neglecting the gravitational effect on the droplet since the droplet sizes used
are very small.
𝑠𝑖𝑛 2𝛼 = 𝑅𝐶2
− 𝑅𝐶2
𝑐𝑜𝑠 𝜙
𝑐𝑜𝑠 2𝛼
𝑥−𝑅𝐶2 𝑐𝑜𝑠 𝜙 𝑡𝑎𝑛 2𝛼 [5.7]
Derivation for Eq. 5.7 is given in Appendix II.
Therefore, by rearranging Eq. 7, 𝑅𝐶2 in terms of 2α and φ is found.
𝑅𝐶2=
𝑅𝐶12 ( 𝑐𝑜𝑠 2𝛼− 𝑐𝑜𝑠 𝜃 )2+ 𝑎−𝑅𝐶1
𝑠𝑖𝑛 2𝛼 2
12
𝑠𝑖𝑛 2𝛼
(1−𝑐𝑜𝑠 𝜙 𝑐𝑜𝑠 2𝛼) [5.8]
- 123 -
Substituting 𝑅𝐶1in Eq. 5.8
𝑅𝐶2=
𝑎 𝑠𝑖𝑛 2𝛼
1−(𝑐𝑜𝑠 𝜃 𝑐𝑜𝑠 2𝛼)
2 ( 𝑐𝑜𝑠 2𝛼− 𝑐𝑜𝑠 𝜃 )2+ 𝑎−
𝑎 𝑠𝑖𝑛 2 2𝛼
1−(𝑐𝑜𝑠 𝜃 𝑐𝑜𝑠 2𝛼)
2
12
𝑠𝑖𝑛 2𝛼
(1−𝑐𝑜𝑠 𝜙 𝑐𝑜𝑠 2𝛼) [5.9]
It can be seen from Eq. 5.8 that 𝑅𝐶2 is a function of 𝑅𝐶1
, the distance of the droplet
emergence location from the channel corner a, the channel open angle 2α, and the base
and sidewall contact angles θ and ∅, respectively. The droplet jumping condition is thus
defined as follows.
(a) 𝑅2 ≤ 𝑅𝐶2 – Droplet jumps to the sidewall
(b) 𝑅2 > 𝑅𝐶2 – Droplet bridges the base and channel wall
Equating Eq. 5.6 and 5.9, the criterion for droplet jumping is obtained
𝑅2
𝑅𝐶2
=
a sin 2α
1−(cos θ cos 2α )
2−3 cos θ+ cos 3θ
2− 3 cos ∅+cos 3∅
13
(1−𝑐𝑜𝑠 𝜙 𝑐𝑜𝑠 2𝛼)
𝑎 𝑠𝑖𝑛 2𝛼
1−(𝑐𝑜𝑠 𝜃 𝑐𝑜𝑠 2𝛼)
2 ( 𝑐𝑜𝑠 2𝛼− 𝑐𝑜𝑠 𝜃 )2+ 𝑎−
𝑎 𝑠𝑖𝑛 2 2𝛼
1−(𝑐𝑜𝑠 𝜃 𝑐𝑜𝑠 2𝛼)
2
12
𝑠𝑖𝑛 2𝛼
≤ 1 [5.10]
Eq. 5.10 gives the condition to determine whether the droplet jumps to the
sidewall or not. For any given material at a given channel open angle and droplet
emergence location, the droplet behavior in the channel can be identified using this
criterion.
The Concus–Finn condition is able to predict the channel corner filling and non–
filling behavior. However, it is not able to predict the droplet jumping behavior.
Therefore, to understand how a droplet will behave in a system for a given material pair,
- 124 -
first check if 𝑅2
𝑅𝐶2
≤ 1. If this criterion is satisfied, then the droplet will jump to the
sidewall. If this condition is not satisfied, then the droplet will enter a corner filling or
non–filling condition, which could be predicted using the Concus–Finn condition.
5.1.4 Experimental Results
To validate the criterion derived for determining the droplet jumping behavior,
experiments were performed on different base and wall materials. A preferential pore of
100 µm was made on the base material for the droplet to emerge at a known location. The
distance between the preferential pore and the channel corner was varied between 0.5 and
2.5 mm during the experiments and the droplet dynamics were observed. The channel
open angle was varied from 25° – 90°. In these experiments, only one side of the channel
wall was used with the GDL base for easier visualization. The experiments were
performed such that the droplet size did not exceed 1.5 mm in diameter while sitting on
the GDL without touching the walls. The videos were captured using a high–speed
Keyence VW–6000 camera at 125 fps, and the droplet dynamics were evaluated.
Different set of material pairs used for the base and channel wall, and their theoretical
transition angles based on the Concus–Finn condition are given in Table X. The
experimental results for the droplet behavior near the channel corners for different
material pairs and different open angles are summarized in Table XI. Fig. 5 shows the
plot of 𝑅2
𝑅𝐶2
versus the channel open angle for different tests performed. Fig. 5 validates
the use of the proposed jumping criterion with the experimental data for different sets of
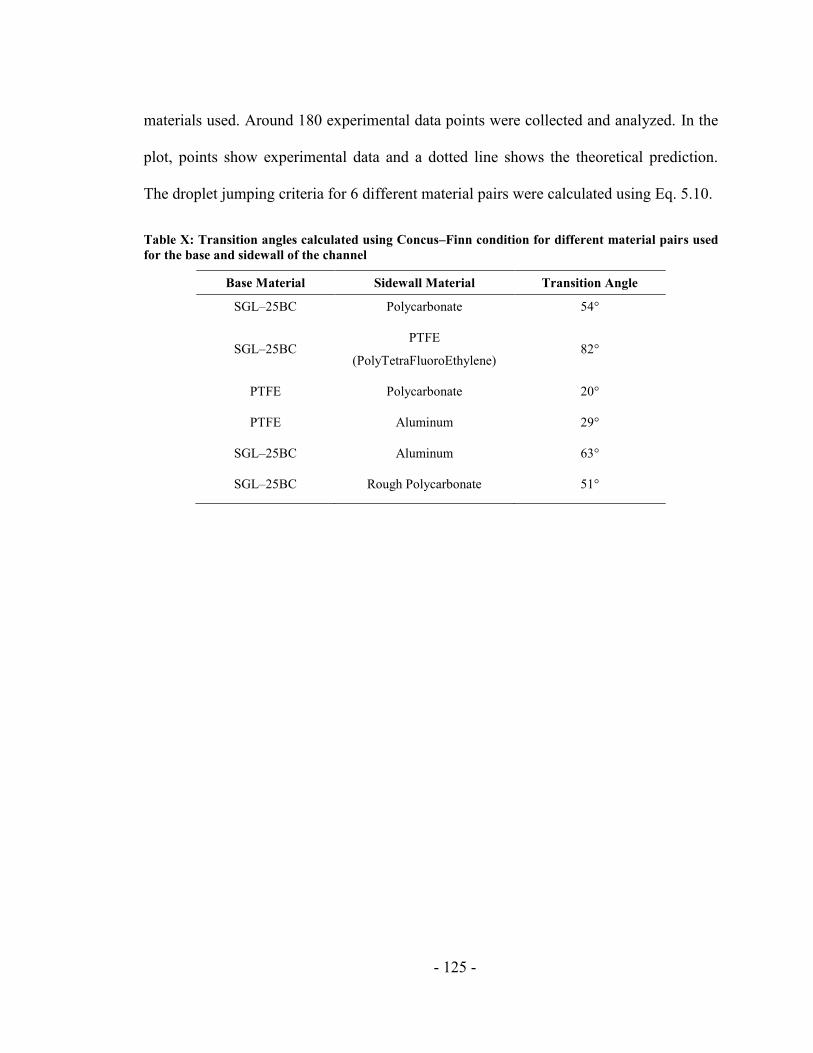
- 125 -
materials used. Around 180 experimental data points were collected and analyzed. In the
plot, points show experimental data and a dotted line shows the theoretical prediction.
The droplet jumping criteria for 6 different material pairs were calculated using Eq. 5.10.
Table X: Transition angles calculated using Concus–Finn condition for different material pairs used
for the base and sidewall of the channel
Base Material Sidewall Material Transition Angle
SGL–25BC Polycarbonate 54°
SGL–25BC PTFE
(PolyTetraFluoroEthylene) 82°
PTFE Polycarbonate 20°
PTFE Aluminum 29°
SGL–25BC Aluminum 63°
SGL–25BC Rough Polycarbonate 51°
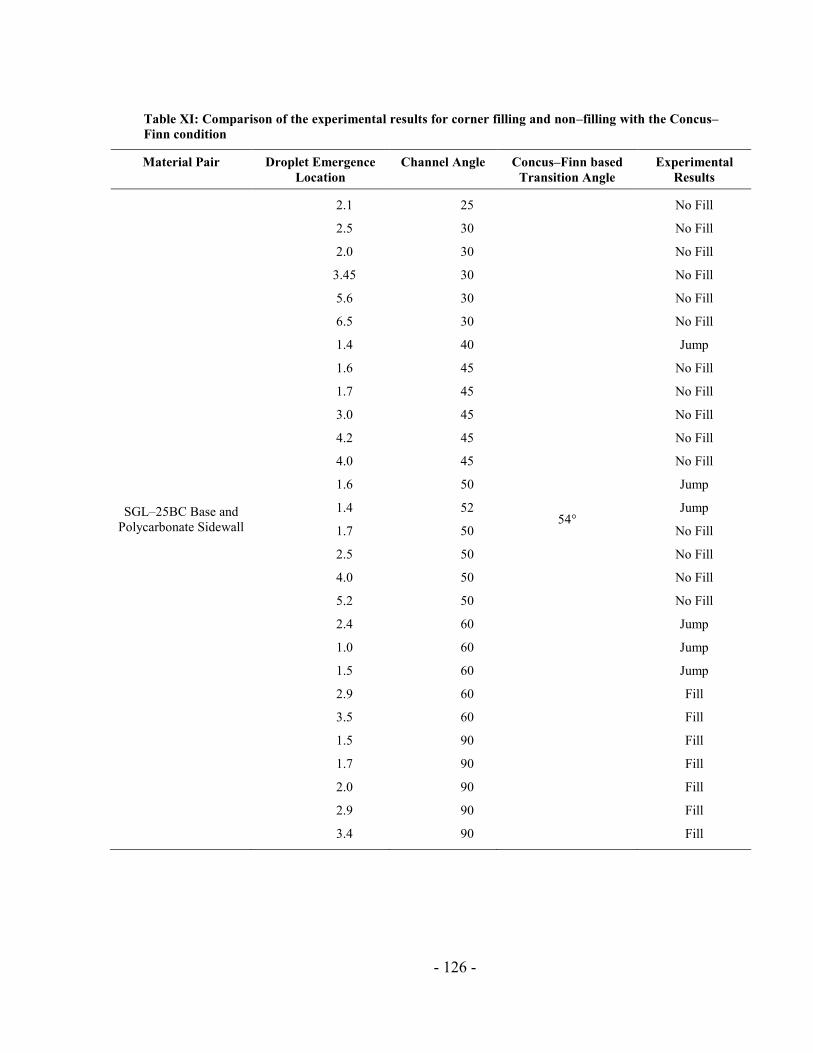
- 126 -
Table XI: Comparison of the experimental results for corner filling and non–filling with the Concus–
Finn condition
Material Pair Droplet Emergence
Location
Channel Angle Concus–Finn based
Transition Angle
Experimental
Results
SGL–25BC Base and
Polycarbonate Sidewall
2.1
2.5
2.0
3.45
5.6
6.5
1.4
1.6
1.7
3.0
4.2
4.0
1.6
1.4
1.7
2.5
4.0
5.2
2.4
1.0
1.5
2.9
3.5
1.5
1.7
2.0
2.9
3.4
25
30
30
30
30
30
40
45
45
45
45
45
50
52
50
50
50
50
60
60
60
60
60
90
90
90
90
90
54°
No Fill
No Fill
No Fill
No Fill
No Fill
No Fill
Jump
No Fill
No Fill
No Fill
No Fill
No Fill
Jump
Jump
No Fill
No Fill
No Fill
No Fill
Jump
Jump
Jump
Fill
Fill
Fill
Fill
Fill
Fill
Fill
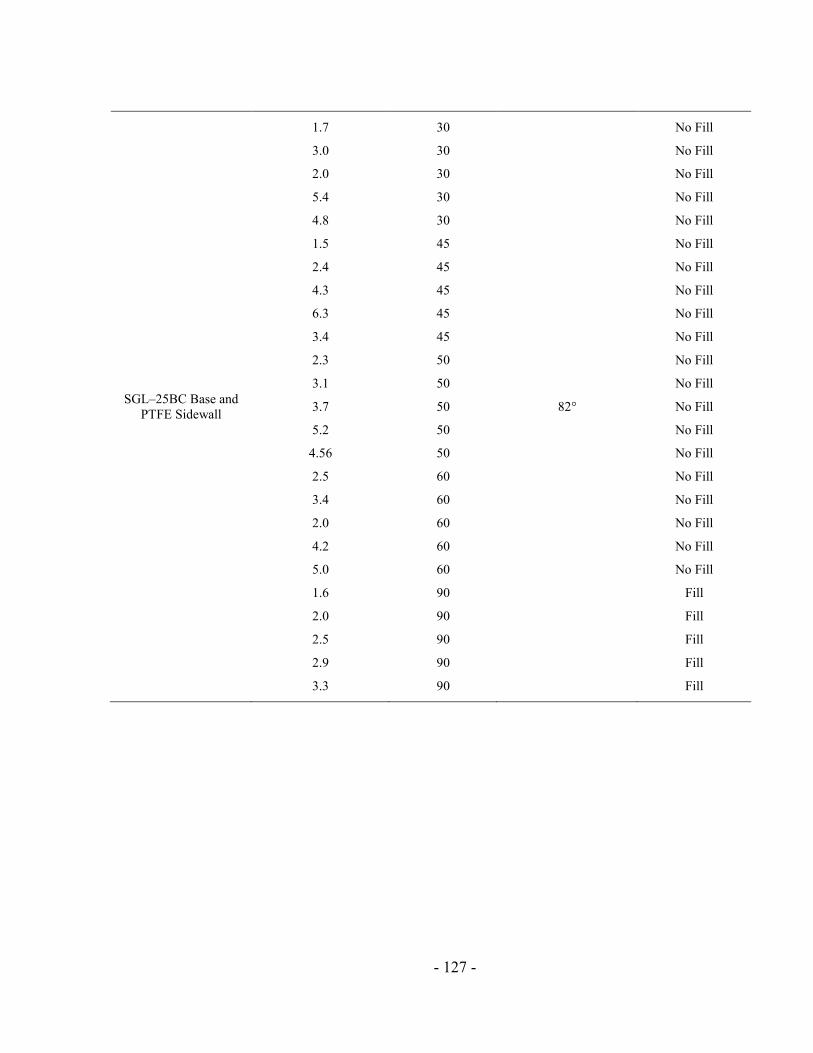
- 127 -
SGL–25BC Base and
PTFE Sidewall
1.7
3.0
2.0
5.4
4.8
1.5
2.4
4.3
6.3
3.4
2.3
3.1
3.7
5.2
4.56
2.5
3.4
2.0
4.2
5.0
1.6
2.0
2.5
2.9
3.3
30
30
30
30
30
45
45
45
45
45
50
50
50
50
50
60
60
60
60
60
90
90
90
90
90
82°
No Fill
No Fill
No Fill
No Fill
No Fill
No Fill
No Fill
No Fill
No Fill
No Fill
No Fill
No Fill
No Fill
No Fill
No Fill
No Fill
No Fill
No Fill
No Fill
No Fill
Fill
Fill
Fill
Fill
Fill

- 128 -
PTFE Base and
Polycarbonate Sidewall
1.1
2.6
2.5
2.3
3.5
1.7
2.1
2.6
3.1
2.4
1.4
2.6
2.5
4.0
1.89
0.7
2.3
1.3
2.0
3.4
0.5
0.9
1.5
1.9
0.6
30
30
30
30
30
45
45
45
45
45
50
50
50
50
50
60
60
60
60
60
90
90
90
90
90
20°
Fill
Fill
Jump
Fill
Fill
Fill
Fill
Fill
Fill
Fill
Fill
Fill
Fill
Fill
Fill
Fill
Fill
Fill
Fill
Fill
Fill
Fill
Fill
Fill
Fill
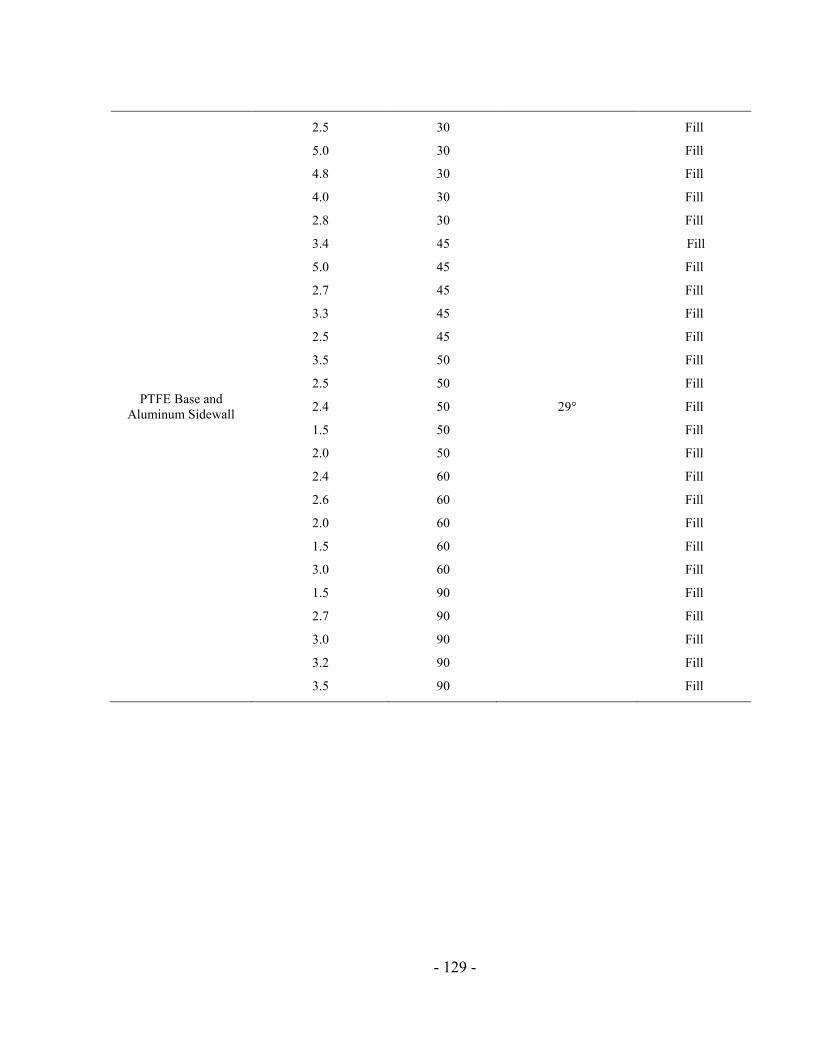
- 129 -
PTFE Base and
Aluminum Sidewall
2.5
5.0
4.8
4.0
2.8
3.4
5.0
2.7
3.3
2.5
3.5
2.5
2.4
1.5
2.0
2.4
2.6
2.0
1.5
3.0
1.5
2.7
3.0
3.2
3.5
30
30
30
30
30
45
45
45
45
45
50
50
50
50
50
60
60
60
60
60
90
90
90
90
90
29°
Fill
Fill
Fill
Fill
Fill
Fill
Fill
Fill
Fill
Fill
Fill
Fill
Fill
Fill
Fill
Fill
Fill
Fill
Fill
Fill
Fill
Fill
Fill
Fill
Fill
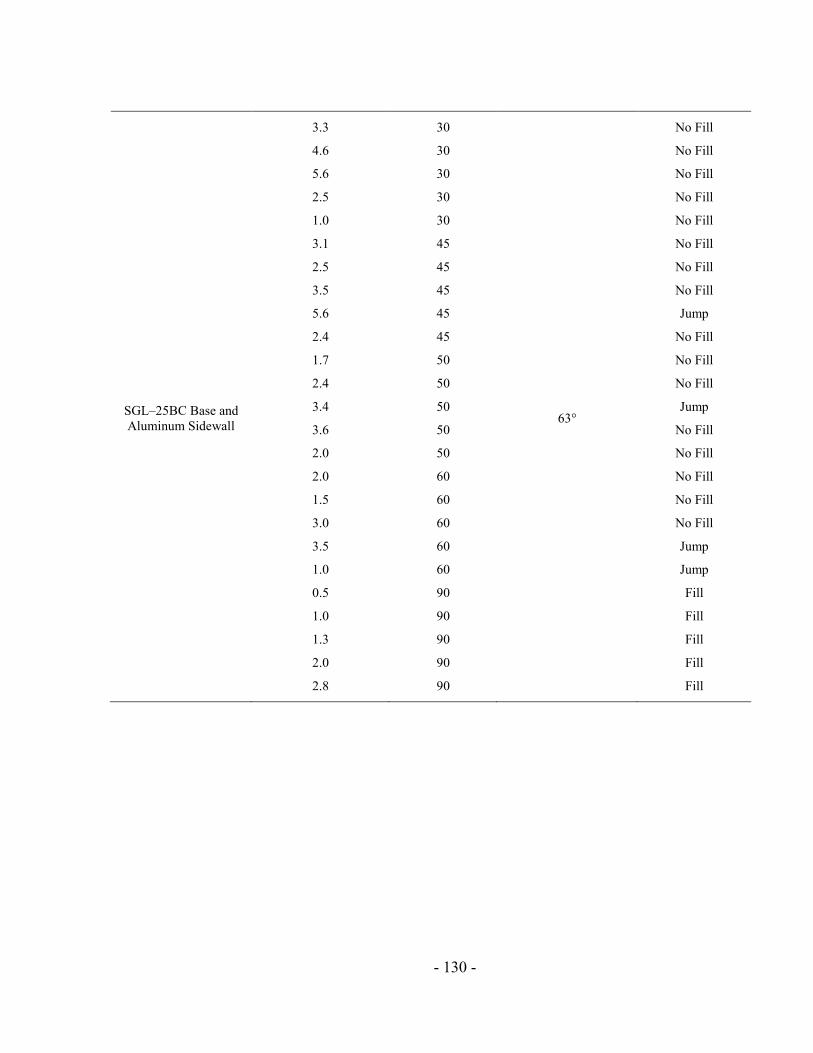
- 130 -
SGL–25BC Base and
Aluminum Sidewall
3.3
4.6
5.6
2.5
1.0
3.1
2.5
3.5
5.6
2.4
1.7
2.4
3.4
3.6
2.0
2.0
1.5
3.0
3.5
1.0
0.5
1.0
1.3
2.0
2.8
30
30
30
30
30
45
45
45
45
45
50
50
50
50
50
60
60
60
60
60
90
90
90
90
90
63°
No Fill
No Fill
No Fill
No Fill
No Fill
No Fill
No Fill
No Fill
Jump
No Fill
No Fill
No Fill
Jump
No Fill
No Fill
No Fill
No Fill
No Fill
Jump
Jump
Fill
Fill
Fill
Fill
Fill
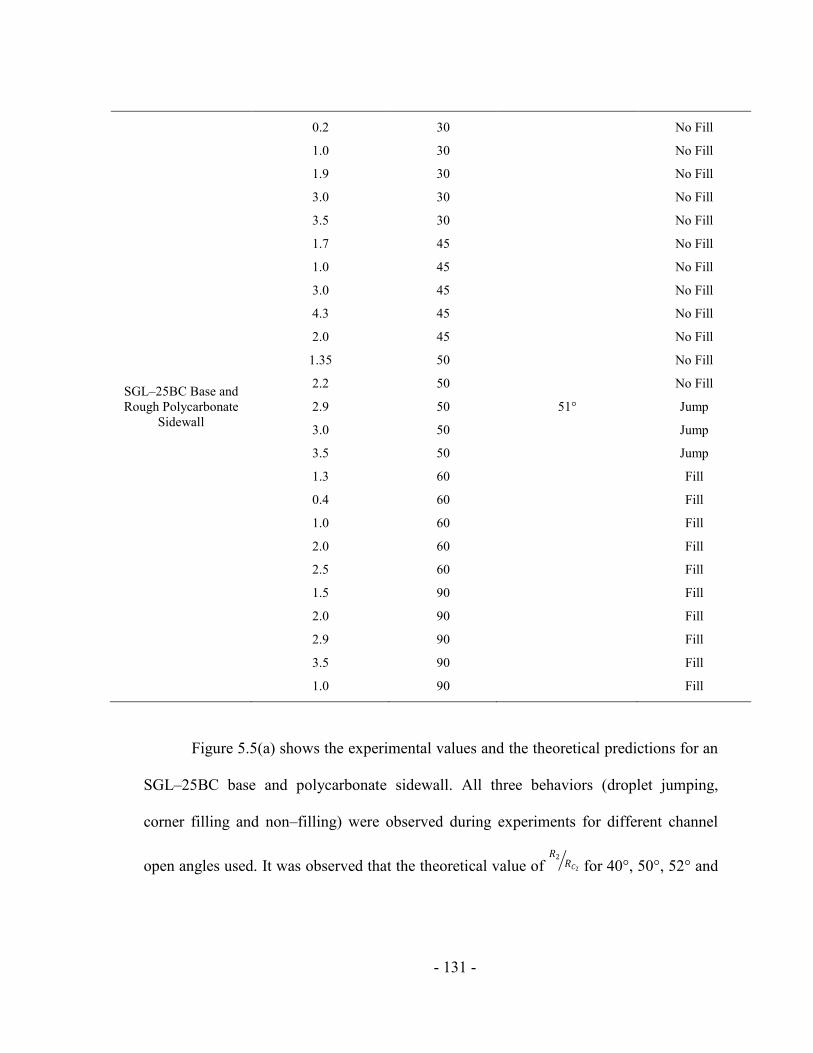
- 131 -
SGL–25BC Base and
Rough Polycarbonate
Sidewall
0.2
1.0
1.9
3.0
3.5
1.7
1.0
3.0
4.3
2.0
1.35
2.2
2.9
3.0
3.5
1.3
0.4
1.0
2.0
2.5
1.5
2.0
2.9
3.5
1.0
30
30
30
30
30
45
45
45
45
45
50
50
50
50
50
60
60
60
60
60
90
90
90
90
90
51°
No Fill
No Fill
No Fill
No Fill
No Fill
No Fill
No Fill
No Fill
No Fill
No Fill
No Fill
No Fill
Jump
Jump
Jump
Fill
Fill
Fill
Fill
Fill
Fill
Fill
Fill
Fill
Fill
Figure 5.5(a) shows the experimental values and the theoretical predictions for an
SGL–25BC base and polycarbonate sidewall. All three behaviors (droplet jumping,
corner filling and non–filling) were observed during experiments for different channel
open angles used. It was observed that the theoretical value of 𝑅2
𝑅𝐶2
for 40°, 50°, 52° and
- 132 -
60° channel corner angles also fell below 1 indicating that the droplet would jump to the
sidewall. The proposed model is thus seen to predict the droplet jumping behavior
accurately.
Similar experiments were performed with a SGL–25BC GDL base and a PTFE
(PolyTetraFluoroEthylene) sidewall, and the results of which are shown in Figure 5.5(b).
Here, only corner filling and non–filling behaviors were observed during the
experiments. For an open angle below 60°, no corner filling of the channel corners was
observed. At a 90° open angle, the droplet filled the channel corners. It can be seen from
Table XI that for this material pair, the transition angle from non–filling to filling is at
82°. This means that the droplet will fill the channel corners for open angles above 82°
and thus matches with the experimental results.
Figure 5.5(c) is the plot for a PTFE base and a polycarbonate sidewall. Since the
transition angle for this material pair is 20°, the entire range of open angles used for
experiments should show corner filling. It was seen that corner filling behavior occurred
for most of the open angles used in the experiment. However, at a 30° open angle, the
droplet jumped to the channel sidewall. Using the proposed jumping criterion, the 𝑅2
𝑅𝐶2
value for this case was calculated and it was observed that the value was below 1,
indicating that the droplet should jump.
Similarly, for a PTFE base and aluminum sidewall, no jumping behavior was
observed for any channel angles used. Only corner filling behavior was observed
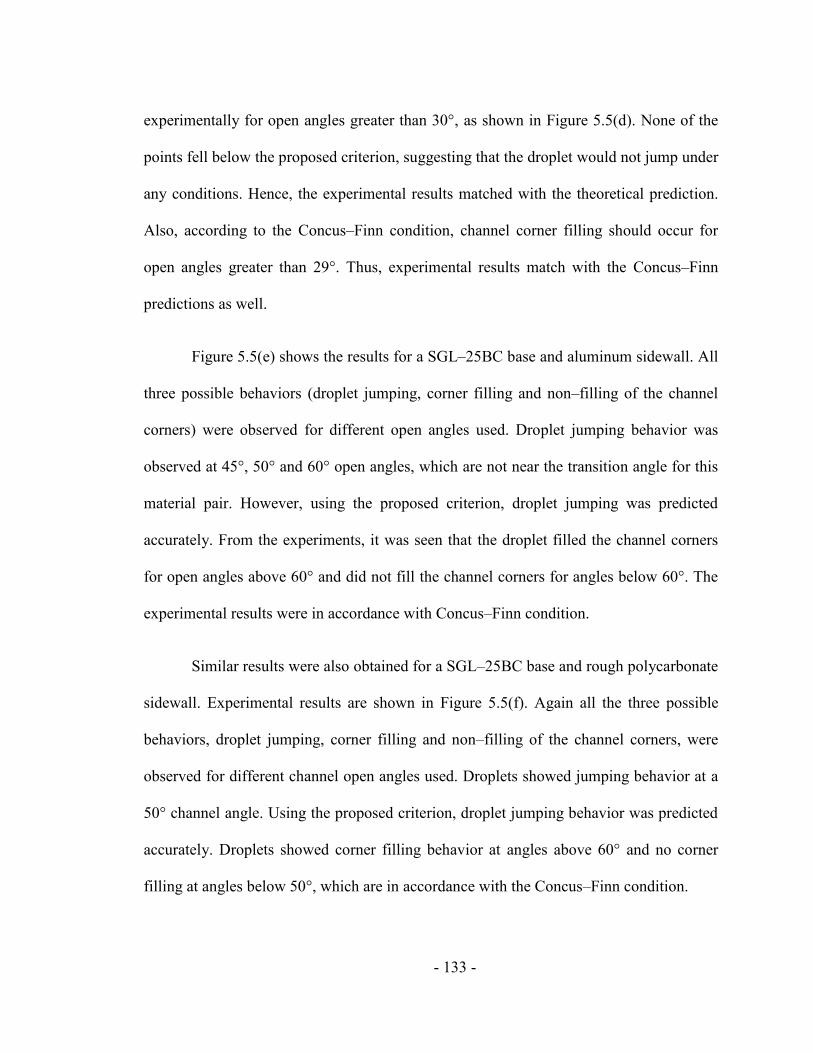
- 133 -
experimentally for open angles greater than 30°, as shown in Figure 5.5(d). None of the
points fell below the proposed criterion, suggesting that the droplet would not jump under
any conditions. Hence, the experimental results matched with the theoretical prediction.
Also, according to the Concus–Finn condition, channel corner filling should occur for
open angles greater than 29°. Thus, experimental results match with the Concus–Finn
predictions as well.
Figure 5.5(e) shows the results for a SGL–25BC base and aluminum sidewall. All
three possible behaviors (droplet jumping, corner filling and non–filling of the channel
corners) were observed for different open angles used. Droplet jumping behavior was
observed at 45°, 50° and 60° open angles, which are not near the transition angle for this
material pair. However, using the proposed criterion, droplet jumping was predicted
accurately. From the experiments, it was seen that the droplet filled the channel corners
for open angles above 60° and did not fill the channel corners for angles below 60°. The
experimental results were in accordance with Concus–Finn condition.
Similar results were also obtained for a SGL–25BC base and rough polycarbonate
sidewall. Experimental results are shown in Figure 5.5(f). Again all the three possible
behaviors, droplet jumping, corner filling and non–filling of the channel corners, were
observed for different channel open angles used. Droplets showed jumping behavior at a
50° channel angle. Using the proposed criterion, droplet jumping behavior was predicted
accurately. Droplets showed corner filling behavior at angles above 60° and no corner
filling at angles below 50°, which are in accordance with the Concus–Finn condition.
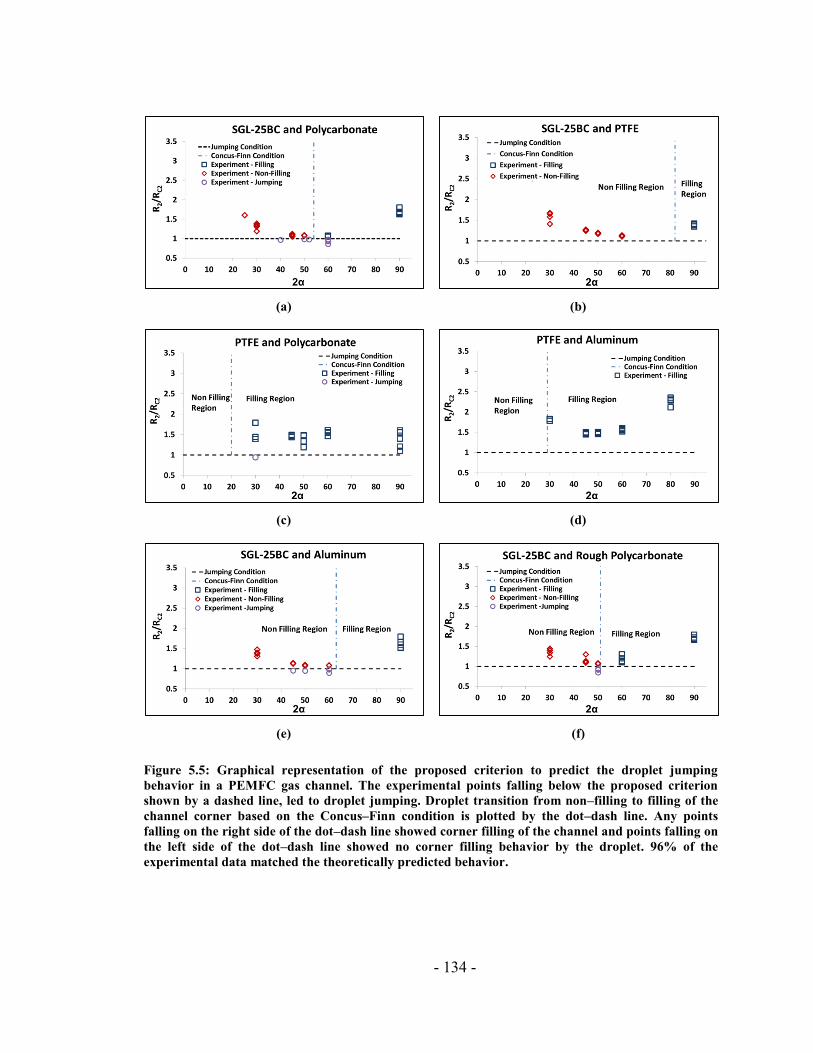
- 134 -
(a) (b)
(c) (d)
(e) (f)
Figure 5.5: Graphical representation of the proposed criterion to predict the droplet jumping
behavior in a PEMFC gas channel. The experimental points falling below the proposed criterion
shown by a dashed line, led to droplet jumping. Droplet transition from non–filling to filling of the
channel corner based on the Concus–Finn condition is plotted by the dot–dash line. Any points
falling on the right side of the dot–dash line showed corner filling of the channel and points falling on
the left side of the dot–dash line showed no corner filling behavior by the droplet. 96% of the
experimental data matched the theoretically predicted behavior.
- 135 -
Comparing the 𝑅2
𝑅𝐶2
data results for all the material pairs used it was seen that the
proposed theoretical model was able to predict the droplet-corner interaction for more
than 96% of the cases. To understand why the droplet jumps to the sidewall an energy
balance on the droplet while sitting on the base wall and while hanging from the sidewall
was performed. This is similar to the droplet spreading analysis performed on a surface to
understand the wetting behavior of a droplet [31, 145, 162-170]. Detailed explanation of
the energy balance and the results are presented in Section 5.1.5.
It is noted from the proposed criterion that the droplet jumping behavior depends
on the channel open angle, material properties and droplet emergence location in the
channel. Among these parameters, droplet emergence location plays a major role in the
droplet behavior near the channel corner. When the droplet emerges very close to the
channel corner, the droplet does not have enough room to jump and hang from the
sidewall. Instead, it touches the sidewall and forms a bridge between the sidewall and the
base as shown in Figure 5.6.
Figure 5.6 shows the droplet jumping image sequence for an SGL–25BC base and
aluminum sidewall with a 45° corner angle where the droplet emergence is very close to
the channel corner. Figure 5.6(a) shows the emergence of a droplet from the GDL base
very close to the channel corner. Figure 5.6(b) shows the image of the droplet when it
contacts the sidewall right before it jumps. Once contact is made with the sidewall, the
droplet quickly moves towards the sidewall, as shown in Figure 5.6(c), and then jumps,
as shown in Figure 5.6 (d). However, due to the small clearance between the base and the
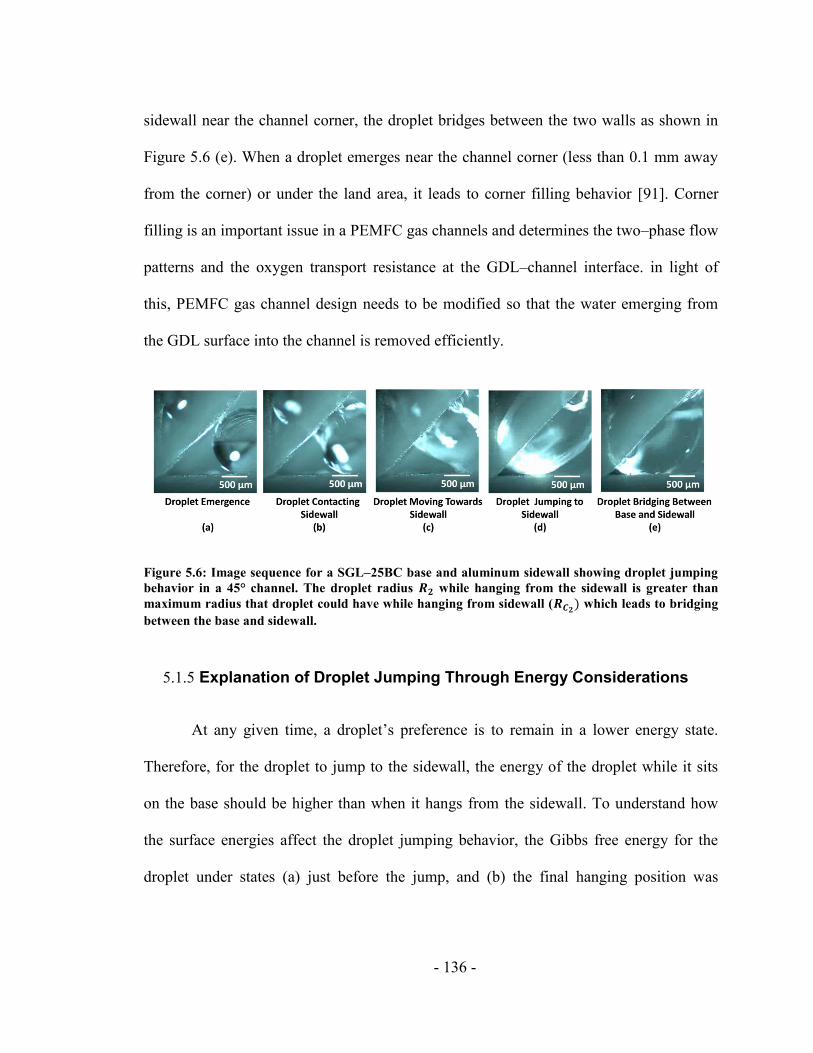
- 136 -
sidewall near the channel corner, the droplet bridges between the two walls as shown in
Figure 5.6 (e). When a droplet emerges near the channel corner (less than 0.1 mm away
from the corner) or under the land area, it leads to corner filling behavior [91]. Corner
filling is an important issue in a PEMFC gas channels and determines the two–phase flow
patterns and the oxygen transport resistance at the GDL–channel interface. in light of
this, PEMFC gas channel design needs to be modified so that the water emerging from
the GDL surface into the channel is removed efficiently.
Figure 5.6: Image sequence for a SGL–25BC base and aluminum sidewall showing droplet jumping
behavior in a 45° channel. The droplet radius 𝑹𝟐 while hanging from the sidewall is greater than
maximum radius that droplet could have while hanging from sidewall (𝑹𝑪𝟐) which leads to bridging
between the base and sidewall.
5.1.5 Explanation of Droplet Jumping Through Energy Considerations
At any given time, a droplet’s preference is to remain in a lower energy state.
Therefore, for the droplet to jump to the sidewall, the energy of the droplet while it sits
on the base should be higher than when it hangs from the sidewall. To understand how
the surface energies affect the droplet jumping behavior, the Gibbs free energy for the
droplet under states (a) just before the jump, and (b) the final hanging position was
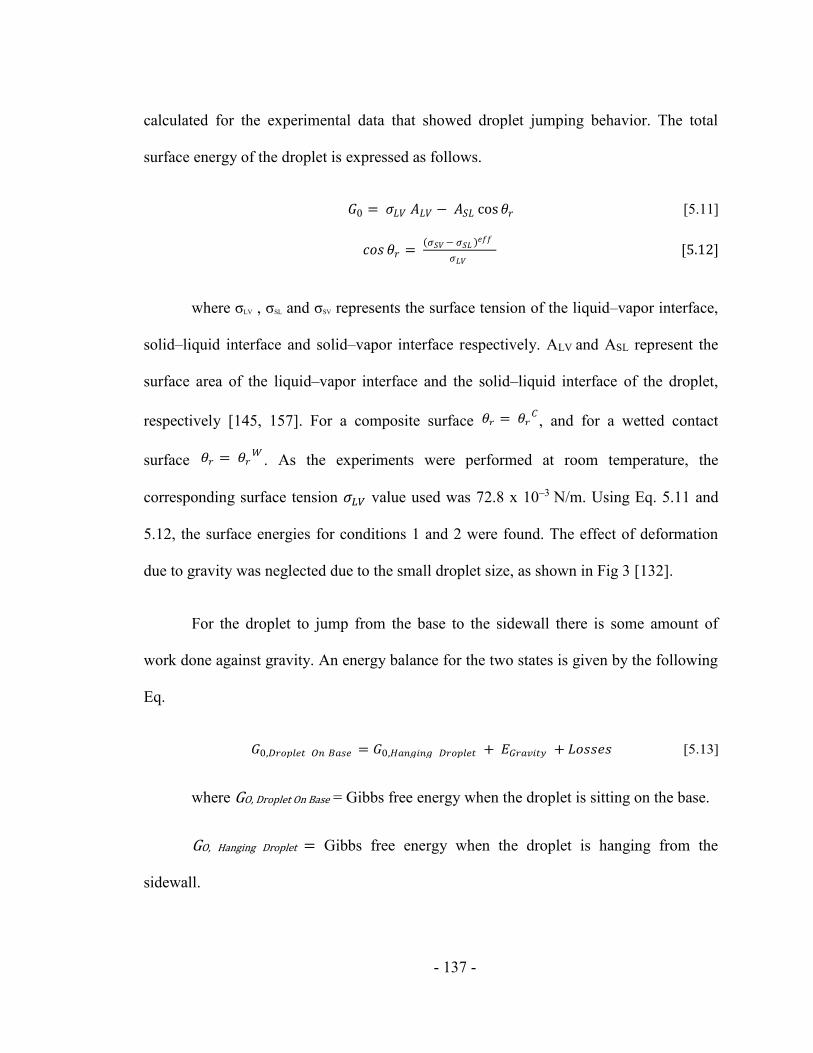
- 137 -
calculated for the experimental data that showed droplet jumping behavior. The total
surface energy of the droplet is expressed as follows.
𝐺0 = 𝜎𝐿𝑉 𝐴𝐿𝑉 − 𝐴𝑆𝐿 cos 𝜃𝑟 [5.11]
𝑐𝑜𝑠 𝜃𝑟 = (𝜎𝑆𝑉 − 𝜎𝑆𝐿 )𝑒𝑓𝑓
𝜎𝐿𝑉 [5.12]
where σLV , σSL and σSV represents the surface tension of the liquid–vapor interface,
solid–liquid interface and solid–vapor interface respectively. ALV and ASL represent the
surface area of the liquid–vapor interface and the solid–liquid interface of the droplet,
respectively [145, 157]. For a composite surface 𝜃𝑟 = 𝜃𝑟𝐶
, and for a wetted contact
surface 𝜃𝑟 = 𝜃𝑟𝑊
. As the experiments were performed at room temperature, the
corresponding surface tension 𝜎𝐿𝑉 value used was 72.8 x 10⁻³ N/m. Using Eq. 5.11 and
5.12, the surface energies for conditions 1 and 2 were found. The effect of deformation
due to gravity was neglected due to the small droplet size, as shown in Fig 3 [132].
For the droplet to jump from the base to the sidewall there is some amount of
work done against gravity. An energy balance for the two states is given by the following
Eq.
𝐺0,𝐷𝑟𝑜𝑝𝑙𝑒𝑡 𝑂𝑛 𝐵𝑎𝑠𝑒 = 𝐺0,𝐻𝑎𝑛𝑔𝑖𝑛𝑔 𝐷𝑟𝑜𝑝𝑙𝑒𝑡 + 𝐸𝐺𝑟𝑎𝑣𝑖𝑡𝑦 + 𝐿𝑜𝑠𝑠𝑒𝑠 [5.13]
where GO, Droplet On Base = Gibbs free energy when the droplet is sitting on the base.
GO, Hanging Droplet = Gibbs free energy when the droplet is hanging from the
sidewall.
- 138 -
E Gravity = Energy required by the droplet to move against gravity from the base to
the sidewall (Potential Energy).
Losses = Losses mainly due to viscous dissipation.
To calculate E Gravity, the centers of mass of the droplet while sitting on the base
and while hanging from the sidewall are determined. The vertical distance between the
two centers of mass is then calculated and used as the height the droplet moved against
gravity. Equating all the different energy terms, the energy loss due to viscous dissipation
is calculated. The different energy values calculated for different test conditions where
the droplet jumped to the sidewall are shown in Table XII. The radii for different material
pairs when the droplet is sitting on the base surface and when it is hanging from the
sidewall are given by 𝑅𝐶1 and R2 respectively. Using these radii, the surface area of the
liquid–vapor interface of the droplet is found. From the surface area values, the Gibbs
free energy of the droplet while sitting on the base and while hanging from the sidewall is
determined. It can be seen from Table XII that the energy while sitting on the base was
almost 1.5 times greater than when the droplet was hanging from the sidewall. This
shows that the droplet jumps to the sidewall because it prefers the lower energy state. The
loss terms are positive and quite small, indicating that the energy approach provides a
good explanation for the droplet jumping condition. The maximum energy losses are
around 15% of the Gibbs free energy when the droplet is sitting on the base. These losses
are mainly due to the oscillations before the droplet stabilizes after jumping to the
sidewall and the viscous dissipations of the droplet.
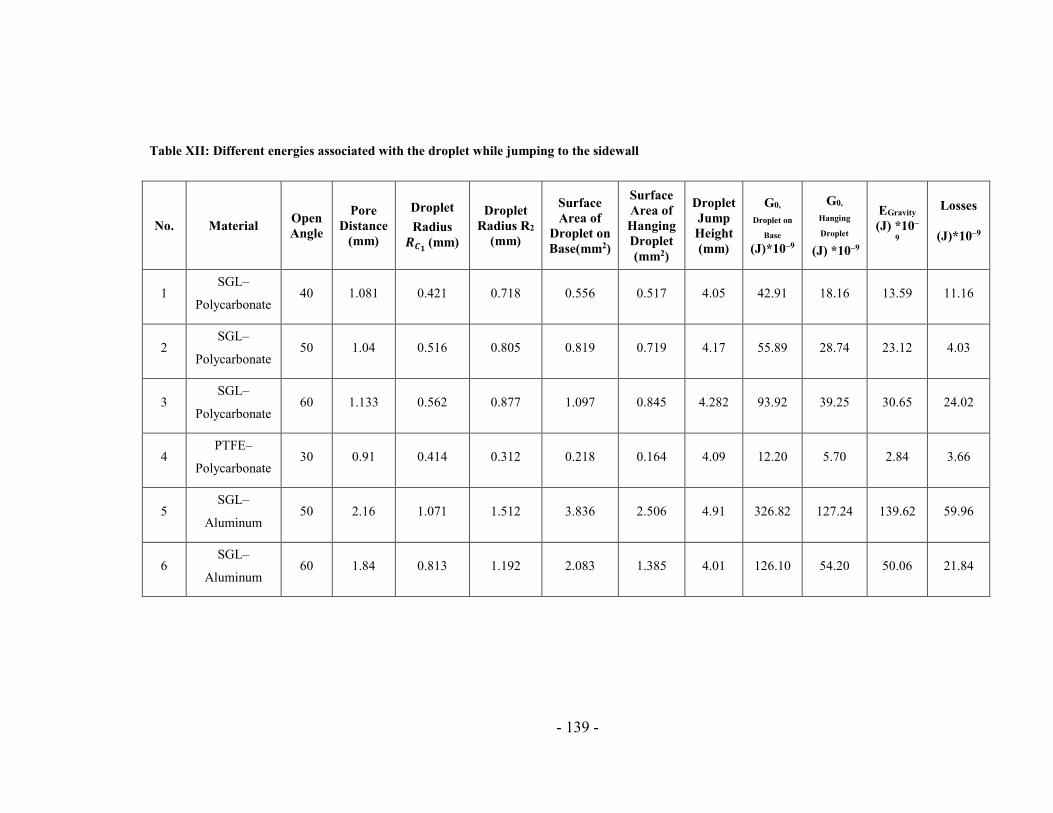
- 139 -
Table XII: Different energies associated with the droplet while jumping to the sidewall
No. Material Open
Angle
Pore
Distance
(mm)
Droplet
Radius
𝑹𝑪𝟏 (mm)
Droplet
Radius R2
(mm)
Surface
Area of
Droplet on
Base(mm2)
Surface
Area of
Hanging
Droplet
(mm2)
Droplet
Jump
Height
(mm)
G0,
Droplet on
Base
(J)*10–9
G0,
Hanging
Droplet
(J) *10–9
EGravity
(J) *10–
9
Losses
(J)*10–9
1 SGL–
Polycarbonate 40 1.081 0.421 0.718 0.556 0.517 4.05 42.91 18.16 13.59 11.16
2 SGL–
Polycarbonate 50 1.04 0.516 0.805 0.819 0.719 4.17 55.89 28.74 23.12 4.03
3 SGL–
Polycarbonate 60 1.133 0.562 0.877 1.097 0.845 4.282 93.92 39.25 30.65 24.02
4 PTFE–
Polycarbonate 30 0.91 0.414 0.312 0.218 0.164 4.09 12.20 5.70 2.84 3.66
5 SGL–
Aluminum 50 2.16 1.071 1.512 3.836 2.506 4.91 326.82 127.24 139.62 59.96
6 SGL–
Aluminum 60 1.84 0.813 1.192 2.083 1.385 4.01 126.10 54.20 50.06 21.84
- 140 -
5.1.6 Pressure Drop and Force Analysis
The geometrical analysis done to understand the droplet jumping to the sidewall
was performed in the absence of airflow in the system. However, in an actual fuel cell,
there is airflow in the cell, which produces pressure drop in the presence of liquid water
at a given working condition. From experiments performed to understand how the air
velocity affects droplet dynamics in the gas channel it was found that the pressure drop
value associated with each experimental condition was different [171]. It was observed
that with very high air velocities introduced in the system, the droplet would slide off on
the GDL without touching the sidewall and be removed from the channel. To encompass
all the different forces acting on the liquid, a theoretical analysis was performed to
incorporate airflow in the system. Correlations were obtained to understand the minimum
velocity and pressure force required in a microchannel system to remove the droplet
before it touches the sidewall and after it touches the wall, leading to non–filling or filling
of the channel corner. Experimental data shown in Section 4.7 for the 0.4 x 0.7 mm cross
section experiments were used for this.
To predict the pressure drop in a trapezoidal channel as a function of air velocity
and the channel open angle, a surface plot was developed using Matlab. Figure 5.7 and
Figure 5.8 show the pressure drop plots as a function of channel open angles and air
velocities for filling and non–filling cases respectively. Similar trends were observed for
both.
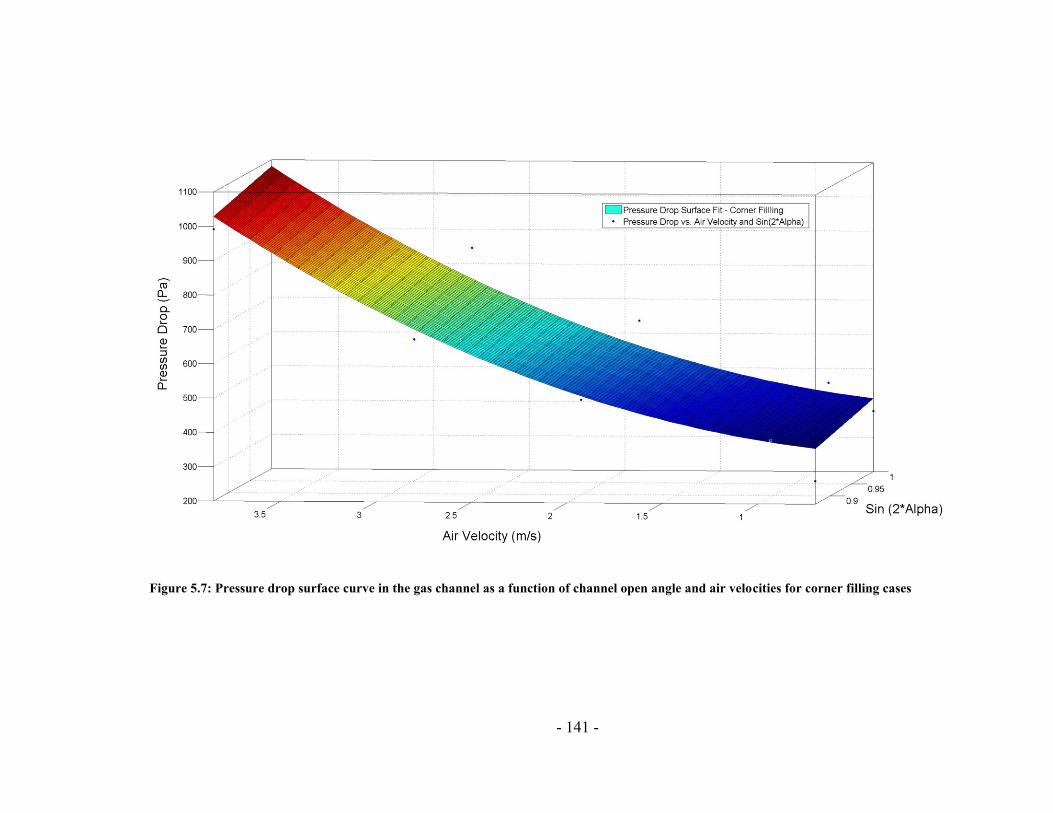
- 141 -
Figure 5.7: Pressure drop surface curve in the gas channel as a function of channel open angle and air velocities for corner filling cases
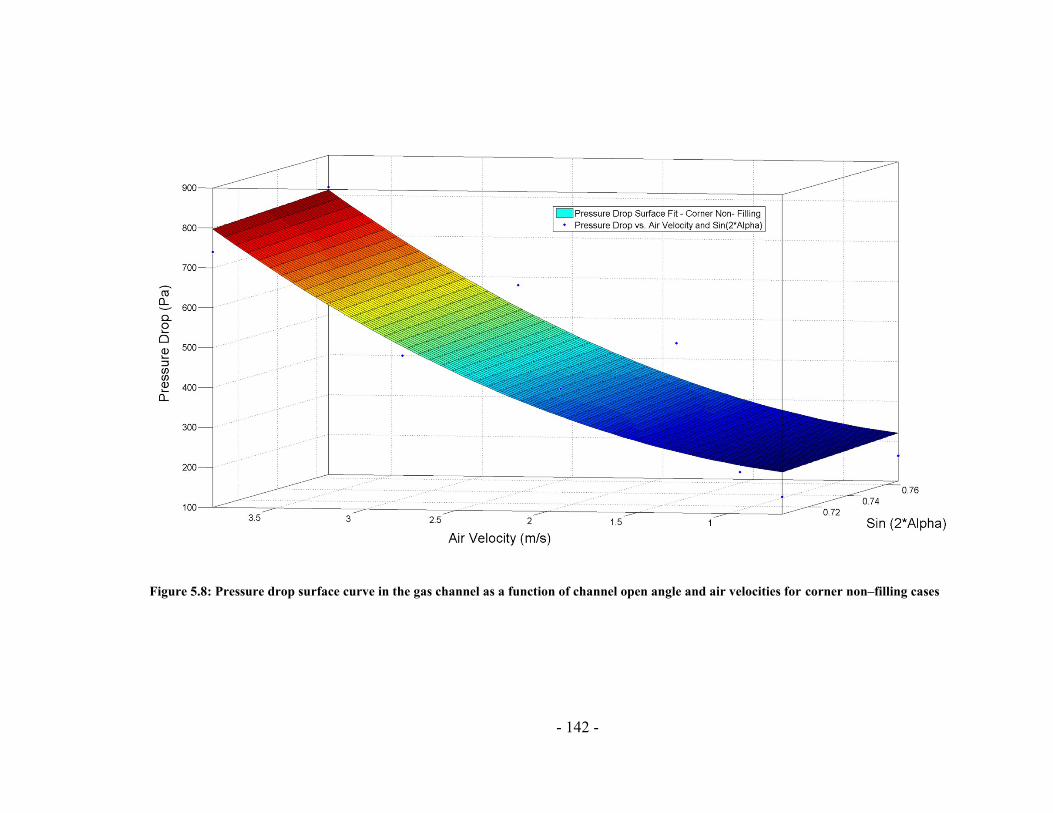
- 142 -
Figure 5.8: Pressure drop surface curve in the gas channel as a function of channel open angle and air velocities for corner non–filling cases
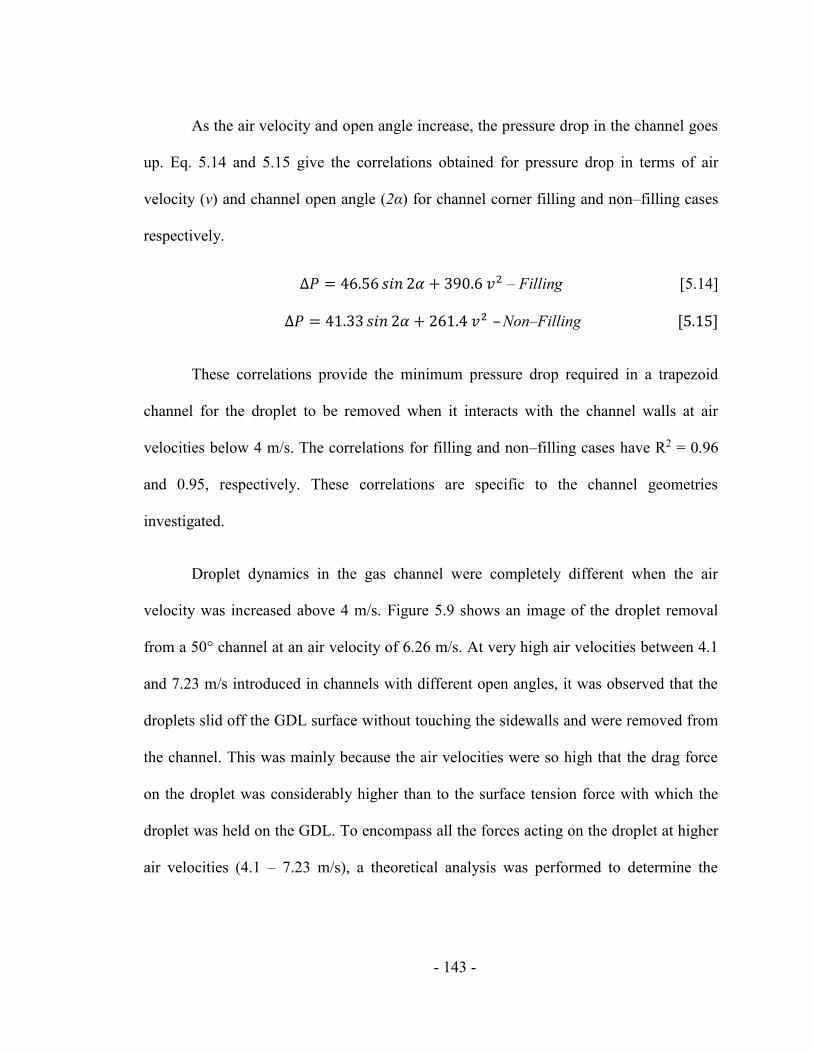
- 143 -
As the air velocity and open angle increase, the pressure drop in the channel goes
up. Eq. 5.14 and 5.15 give the correlations obtained for pressure drop in terms of air
velocity (v) and channel open angle (2α) for channel corner filling and non–filling cases
respectively.
∆𝑃 = 46.56 𝑠𝑖𝑛 2𝛼 + 390.6 𝑣2 – Filling [5.14]
∆𝑃 = 41.33 𝑠𝑖𝑛 2𝛼 + 261.4 𝑣2 – Non–Filling [5.15]
These correlations provide the minimum pressure drop required in a trapezoid
channel for the droplet to be removed when it interacts with the channel walls at air
velocities below 4 m/s. The correlations for filling and non–filling cases have R2 = 0.96
and 0.95, respectively. These correlations are specific to the channel geometries
investigated.
Droplet dynamics in the gas channel were completely different when the air
velocity was increased above 4 m/s. Figure 5.9 shows an image of the droplet removal
from a 50° channel at an air velocity of 6.26 m/s. At very high air velocities between 4.1
and 7.23 m/s introduced in channels with different open angles, it was observed that the
droplets slid off the GDL surface without touching the sidewalls and were removed from
the channel. This was mainly because the air velocities were so high that the drag force
on the droplet was considerably higher than to the surface tension force with which the
droplet was held on the GDL. To encompass all the forces acting on the droplet at higher
air velocities (4.1 – 7.23 m/s), a theoretical analysis was performed to determine the
- 144 -
minimum velocity required in a microchannel for removing the droplet before it touched
the sidewall.
Figure 5.9: Image of a droplet sliding on the GDL and getting removed from the 50° channel without
touching the walls of the channel
The analysis consisted of a force balance on the droplet just before it was moved
from the GDL surface. Different forces acting on the droplet in a gas channel are shown
in Figure 5.10. The gravitational force was neglected in this analysis. As discussed
earlier, this assumption is valid for droplets with a Bo less than 0.1 [132]. For water
droplets at standard earth gravity, this result in a limiting droplet radius of 1.5 mm. The
droplet sizes in this study were observed to be less than 0.4 mm. Since the Re used for the
experiments was below 250, the airflow in the channel was assumed to be laminar. In
addition, the air inside the gas channel was considered to be incompressible. For a fluid
to be considered incompressible, the Mach number should be smaller than 0.3. Mach
number (M) is defined as
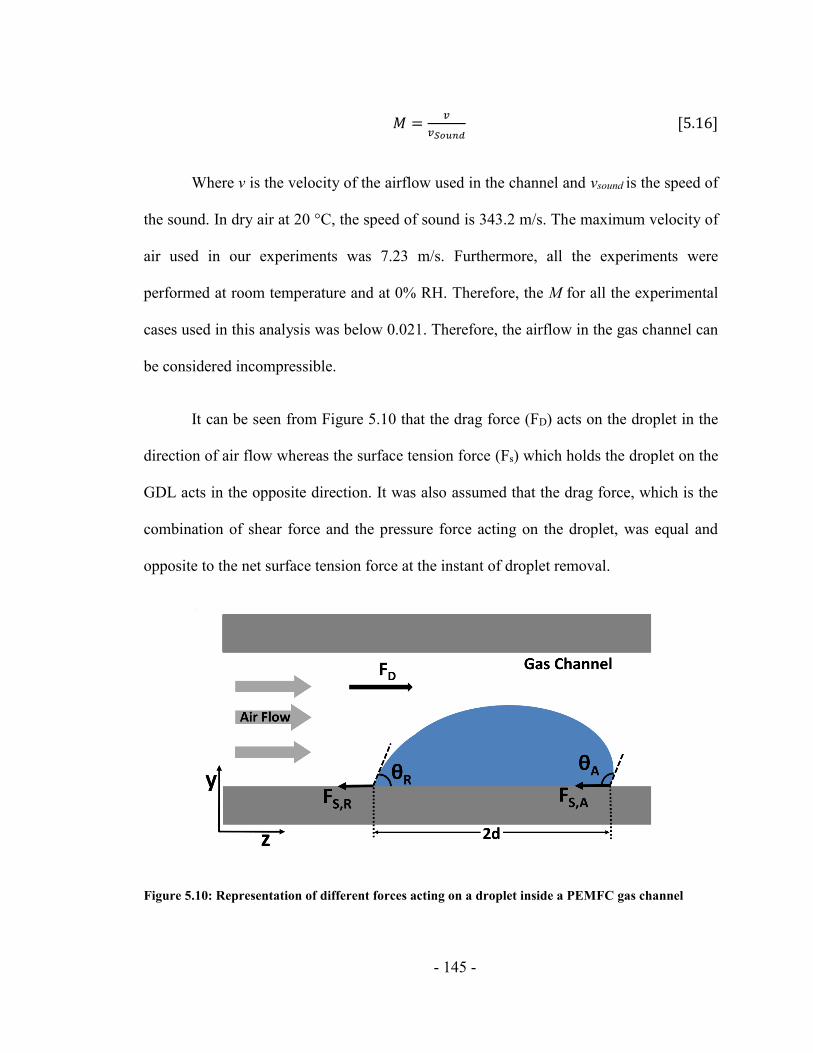
- 145 -
𝑀 =𝑣
𝑣𝑆𝑜𝑢𝑛𝑑 [5.16]
Where v is the velocity of the airflow used in the channel and vsound is the speed of
the sound. In dry air at 20 °C, the speed of sound is 343.2 m/s. The maximum velocity of
air used in our experiments was 7.23 m/s. Furthermore, all the experiments were
performed at room temperature and at 0% RH. Therefore, the M for all the experimental
cases used in this analysis was below 0.021. Therefore, the airflow in the gas channel can
be considered incompressible.
It can be seen from Figure 5.10 that the drag force (FD) acts on the droplet in the
direction of air flow whereas the surface tension force (Fs) which holds the droplet on the
GDL acts in the opposite direction. It was also assumed that the drag force, which is the
combination of shear force and the pressure force acting on the droplet, was equal and
opposite to the net surface tension force at the instant of droplet removal.
Figure 5.10: Representation of different forces acting on a droplet inside a PEMFC gas channel
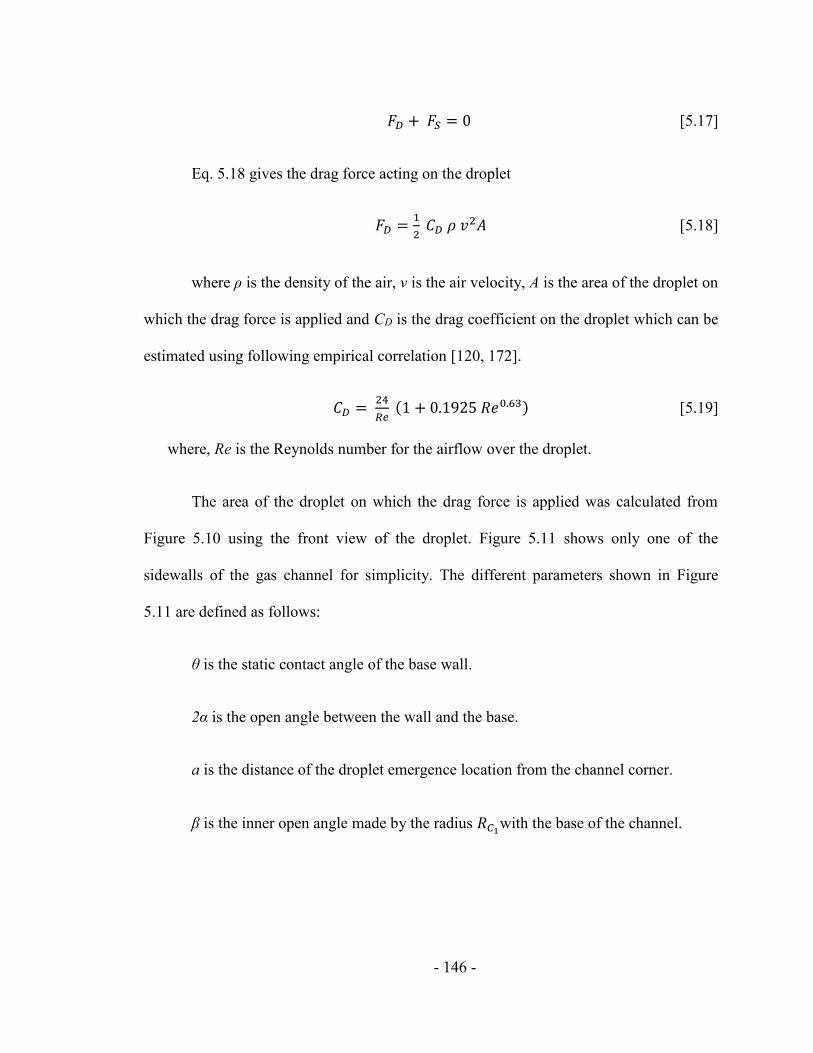
- 146 -
𝐹𝐷 + 𝐹𝑆 = 0 [5.17]
Eq. 5.18 gives the drag force acting on the droplet
𝐹𝐷 =1
2 𝐶𝐷 𝜌 𝑣2𝐴 [5.18]
where ρ is the density of the air, v is the air velocity, A is the area of the droplet on
which the drag force is applied and CD is the drag coefficient on the droplet which can be
estimated using following empirical correlation [120, 172].
𝐶𝐷 = 24
𝑅𝑒 (1 + 0.1925 𝑅𝑒0.63) [5.19]
where, Re is the Reynolds number for the airflow over the droplet.
The area of the droplet on which the drag force is applied was calculated from
Figure 5.10 using the front view of the droplet. Figure 5.11 shows only one of the
sidewalls of the gas channel for simplicity. The different parameters shown in Figure
5.11 are defined as follows:
θ is the static contact angle of the base wall.
2α is the open angle between the wall and the base.
a is the distance of the droplet emergence location from the channel corner.
β is the inner open angle made by the radius 𝑅𝐶1with the base of the channel.
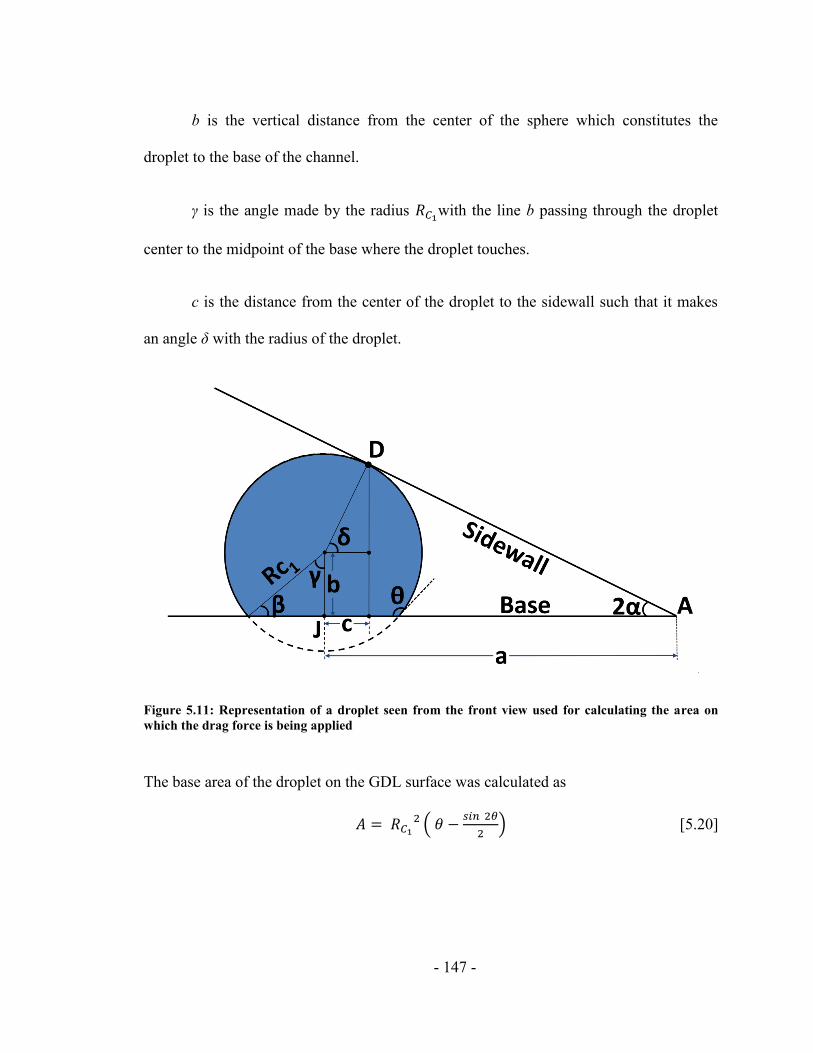
- 147 -
b is the vertical distance from the center of the sphere which constitutes the
droplet to the base of the channel.
γ is the angle made by the radius 𝑅𝐶1with the line b passing through the droplet
center to the midpoint of the base where the droplet touches.
c is the distance from the center of the droplet to the sidewall such that it makes
an angle δ with the radius of the droplet.
Figure 5.11: Representation of a droplet seen from the front view used for calculating the area on
which the drag force is being applied
The base area of the droplet on the GDL surface was calculated as
𝐴 = 𝑅𝐶1
2 𝜃 −𝑠𝑖𝑛 2𝜃
2 [5.20]
- 148 -
The trapezoid channel open angle is related to the droplet critical radius (maximum
radius of the droplet before it touches the sidewall) by
𝑡𝑎𝑛 2𝛼 = 𝑅𝐶1 𝑠𝑖𝑛 𝛽+𝑅𝐶1 𝑠𝑖𝑛 𝛿
𝑎−𝑅𝐶1 𝑐𝑜𝑠 𝛿 [5.21]
From Eq. 5.21, 𝑅𝐶1, the maximum radius of the droplet just before it interacts with the
sidewall was obtained.
𝑅𝐶1=
𝑎 𝑠𝑖𝑛 2𝛼
1−(𝑐𝑜𝑠 𝜃 𝑐𝑜𝑠 2𝛼) [5.22]
Substituting the area of the droplet and 𝑅𝐶1 into Eq. 5.19, the drag force applied on the
droplet was obtained.
𝐹𝐷 =1
2 𝐶𝐷 𝜌 𝑣2
𝑎 𝑠𝑖𝑛 2𝛼
1−(𝑐𝑜𝑠 𝜃 𝑐𝑜𝑠 2𝛼) 2
𝜃 −𝑠𝑖𝑛 2𝜃
2 [5.23]
Eq. 5.23 gives the total drag force applied on the droplet by the airflow in a
trapezoidal gas channel.
The surface tension forces due to advancing (FS, A) and receding (FS, R) contact
angles are given by
𝐹𝑆,𝐴 = 𝜎. 2𝑑. 𝑐𝑜𝑠 𝜃𝐴 [5.24]
𝐹𝑆,𝑅 = 𝜎. 2𝑑. 𝑐𝑜𝑠 𝜃𝑅 [5.25]
where σ is the surface tension coefficient and 2d is the width of the contact line
(normal to the air flow direction) of the droplet on the GDL surface.
The net surface tension force FS and the width 2d are given by
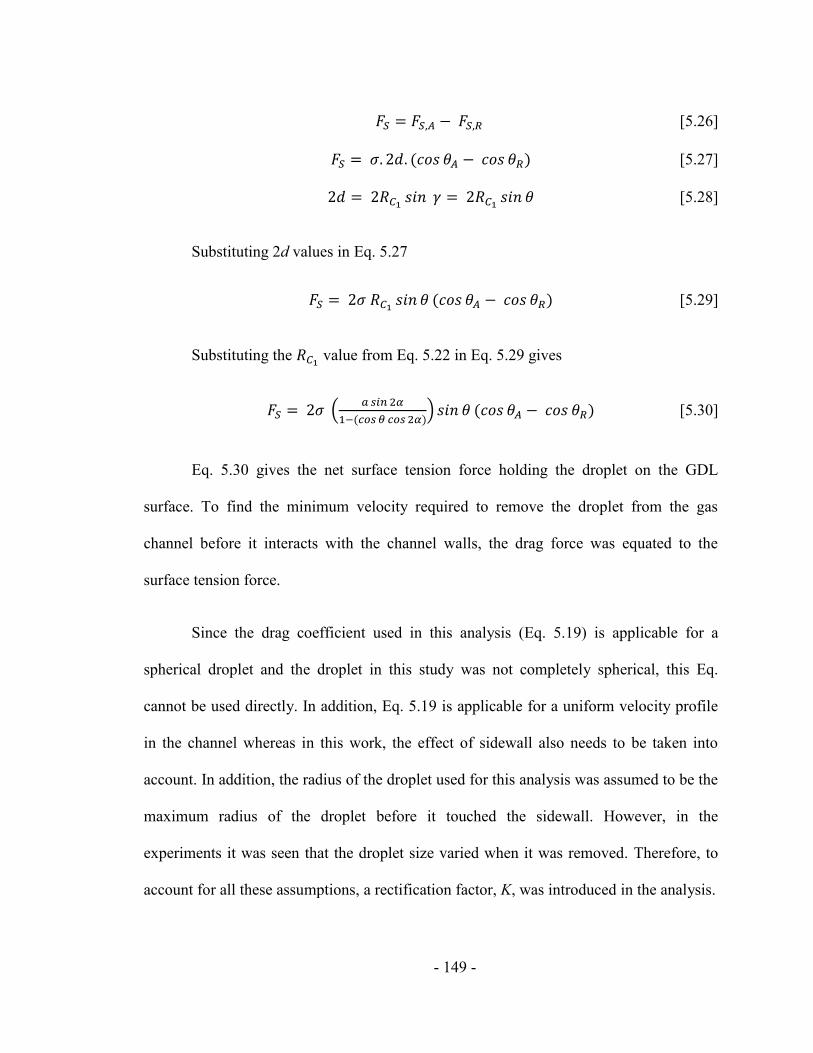
- 149 -
𝐹𝑆 = 𝐹𝑆,𝐴 − 𝐹𝑆,𝑅 [5.26]
𝐹𝑆 = 𝜎. 2𝑑. (𝑐𝑜𝑠 𝜃𝐴 − 𝑐𝑜𝑠 𝜃𝑅) [5.27]
2𝑑 = 2𝑅𝐶1𝑠𝑖𝑛 𝛾 = 2𝑅𝐶1
𝑠𝑖𝑛 𝜃 [5.28]
Substituting 2d values in Eq. 5.27
𝐹𝑆 = 2𝜎 𝑅𝐶1𝑠𝑖𝑛 𝜃 (𝑐𝑜𝑠 𝜃𝐴 − 𝑐𝑜𝑠 𝜃𝑅) [5.29]
Substituting the 𝑅𝐶1 value from Eq. 5.22 in Eq. 5.29 gives
𝐹𝑆 = 2𝜎 𝑎 𝑠𝑖𝑛 2𝛼
1−(𝑐𝑜𝑠 𝜃 𝑐𝑜𝑠 2𝛼) 𝑠𝑖𝑛 𝜃 (𝑐𝑜𝑠 𝜃𝐴 − 𝑐𝑜𝑠 𝜃𝑅) [5.30]
Eq. 5.30 gives the net surface tension force holding the droplet on the GDL
surface. To find the minimum velocity required to remove the droplet from the gas
channel before it interacts with the channel walls, the drag force was equated to the
surface tension force.
Since the drag coefficient used in this analysis (Eq. 5.19) is applicable for a
spherical droplet and the droplet in this study was not completely spherical, this Eq.
cannot be used directly. In addition, Eq. 5.19 is applicable for a uniform velocity profile
in the channel whereas in this work, the effect of sidewall also needs to be taken into
account. In addition, the radius of the droplet used for this analysis was assumed to be the
maximum radius of the droplet before it touched the sidewall. However, in the
experiments it was seen that the droplet size varied when it was removed. Therefore, to
account for all these assumptions, a rectification factor, K, was introduced in the analysis.
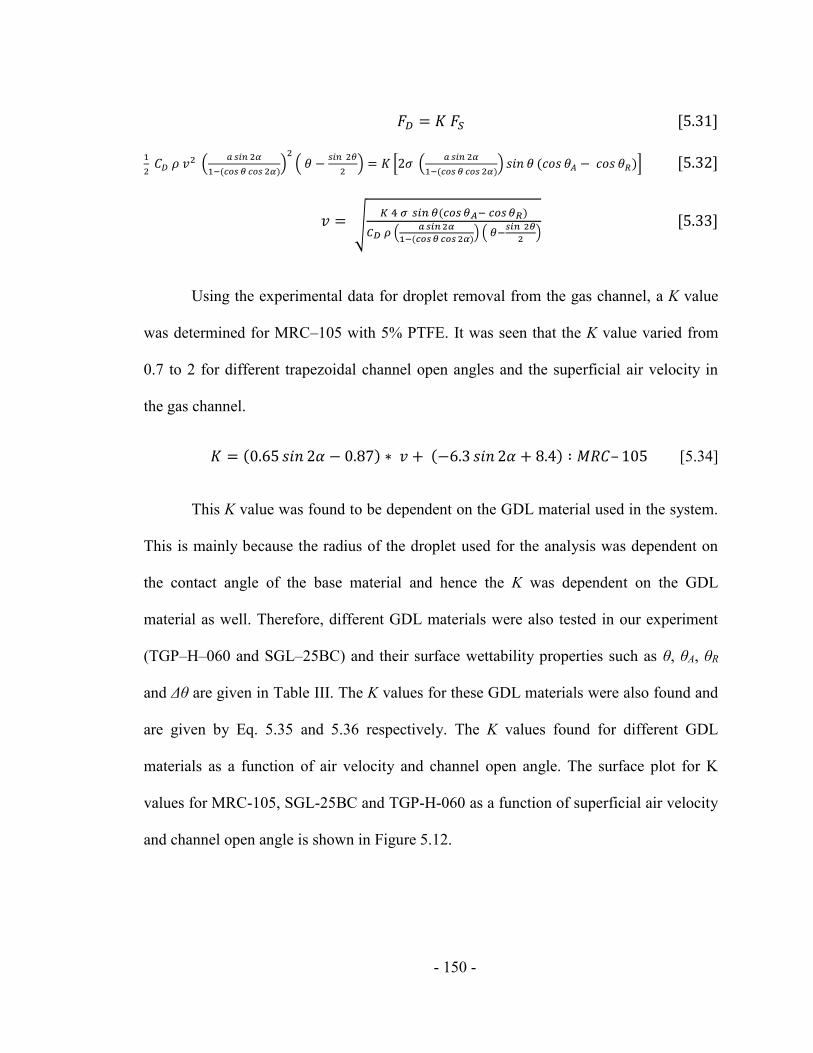
- 150 -
𝐹𝐷 = 𝐾 𝐹𝑆 [5.31]
1
2 𝐶𝐷 𝜌 𝑣2
𝑎 𝑠𝑖𝑛 2𝛼
1−(𝑐𝑜𝑠 𝜃 𝑐𝑜𝑠 2𝛼) 2
𝜃 −𝑠𝑖𝑛 2𝜃
2 = 𝐾 2𝜎
𝑎 𝑠𝑖𝑛 2𝛼
1−(𝑐𝑜𝑠 𝜃 𝑐𝑜𝑠 2𝛼) 𝑠𝑖𝑛 𝜃 (𝑐𝑜𝑠 𝜃𝐴 − 𝑐𝑜𝑠 𝜃𝑅) [5.32]
𝑣 = √𝐾 4 𝜎 𝑠𝑖𝑛 𝜃(𝑐𝑜𝑠 𝜃𝐴− 𝑐𝑜𝑠𝜃𝑅)
𝐶𝐷 𝜌 𝑎𝑠𝑖𝑛2𝛼
1−(𝑐𝑜𝑠𝜃 𝑐𝑜𝑠 2𝛼) 𝜃−
𝑠𝑖𝑛 2𝜃
2 [5.33]
Using the experimental data for droplet removal from the gas channel, a K value
was determined for MRC–105 with 5% PTFE. It was seen that the K value varied from
0.7 to 2 for different trapezoidal channel open angles and the superficial air velocity in
the gas channel.
𝐾 = (0.65 𝑠𝑖𝑛 2𝛼 − 0.87) ∗ 𝑣 + (−6.3 𝑠𝑖𝑛 2𝛼 + 8.4) ∶ 𝑀𝑅𝐶– 105 [5.34]
This K value was found to be dependent on the GDL material used in the system.
This is mainly because the radius of the droplet used for the analysis was dependent on
the contact angle of the base material and hence the K was dependent on the GDL
material as well. Therefore, different GDL materials were also tested in our experiment
(TGP–H–060 and SGL–25BC) and their surface wettability properties such as θ, θA, θR
and Δθ are given in Table III. The K values for these GDL materials were also found and
are given by Eq. 5.35 and 5.36 respectively. The K values found for different GDL
materials as a function of air velocity and channel open angle. The surface plot for K
values for MRC-105, SGL-25BC and TGP-H-060 as a function of superficial air velocity
and channel open angle is shown in Figure 5.12.
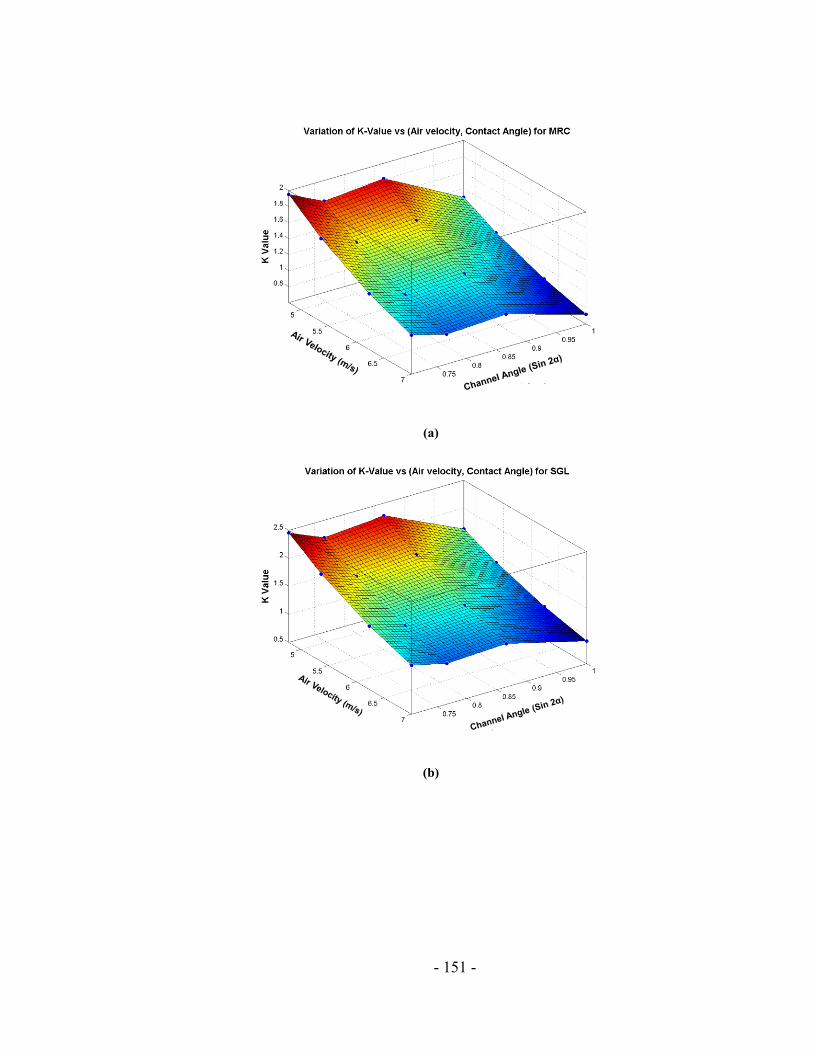
- 151 -
(a)
(b)
Channel Angle
- 152 -
(c)
Figure 5.12: Surface plot of K value as a function of superficial air velocity and sin (2α) for different
GDL material (a) MRC-105 (b) SGL-25BC (c) TGP-H-060.
To show clearly how the air velocity and channel open angle affect the K value
separately for different GDL materials, K values for different GDL materials were plotted
against superficial air velocity for different channel open angles (Figure 5.13(a)) and
against channel open angle for different superficial air velocities (Figure 5.13(b)). It is
seen from the graph that the K value increases linearly with increase in air velocity for all
GDL materials. However, the K value is similar for SGL-25BC and MRC-105 but for
TGP-H-060 the K value is slightly higher. This increase in K for TGP-H-060 can be
attributed to the Δθ of the GDL material. The Δθ for TGP-H-060 is around 17° whereas
for SGL-25BC and MRC-105 it is around 10°. Therefore, it requires larger drag force for
it to remove the droplet from the gas channel.
Channel Angle
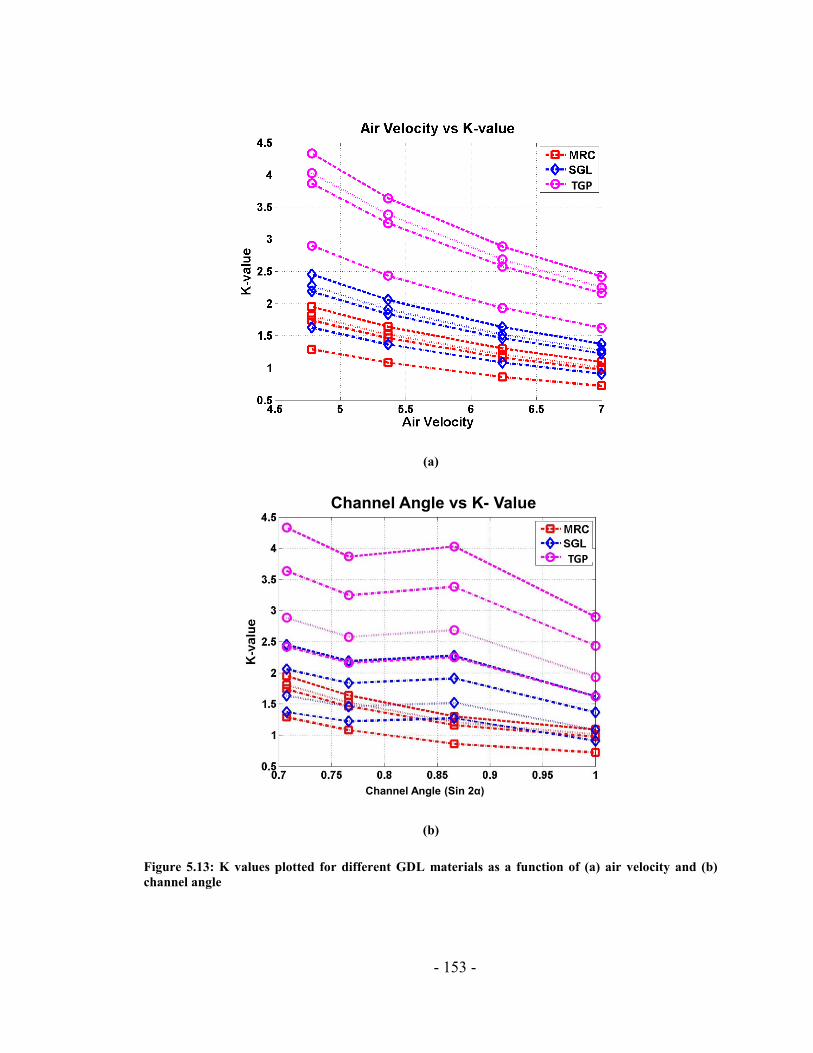
- 153 -
(a)
(b)
Figure 5.13: K values plotted for different GDL materials as a function of (a) air velocity and (b)
channel angle
TGP
TGP
Channel Angle vs K- Value
Channel Angle (Sin 2α)
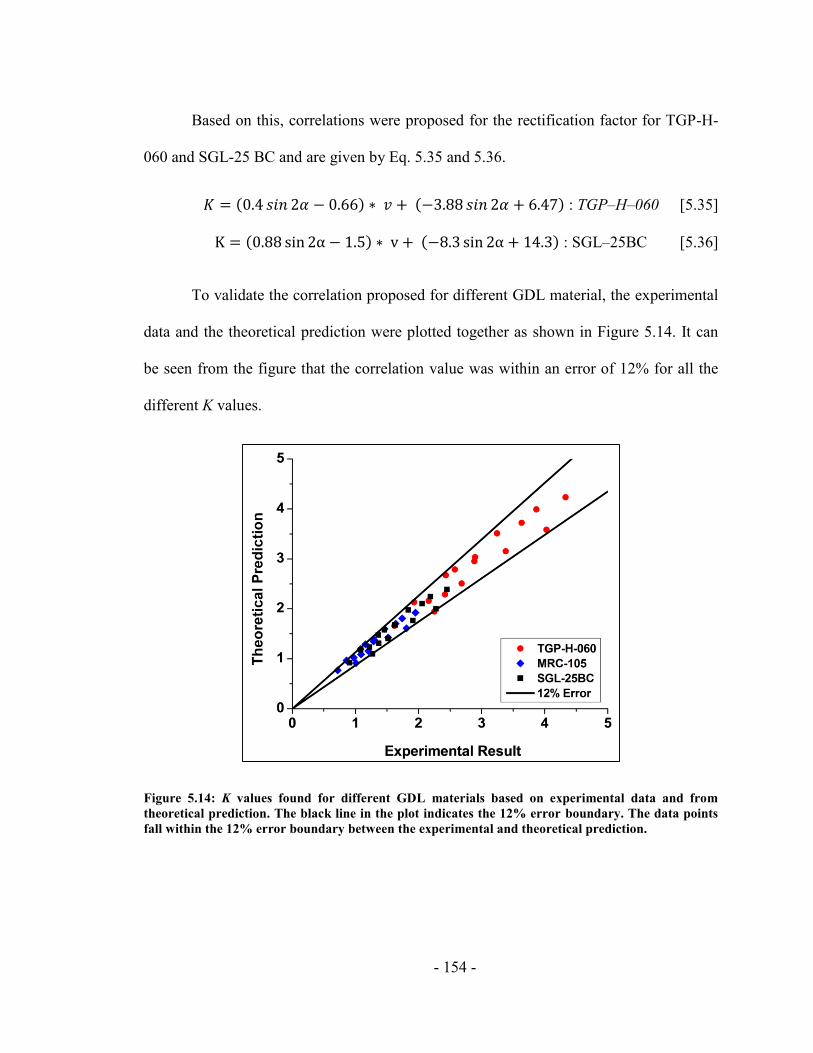
- 154 -
Based on this, correlations were proposed for the rectification factor for TGP-H-
060 and SGL-25 BC and are given by Eq. 5.35 and 5.36.
𝐾 = (0.4 𝑠𝑖𝑛 2𝛼 − 0.66) ∗ 𝑣 + (−3.88 𝑠𝑖𝑛 2𝛼 + 6.47) : TGP–H–060 [5.35]
K = (0.88 sin 2α − 1.5) ∗ v + (−8.3 sin 2α + 14.3) : SGL–25BC [5.36]
To validate the correlation proposed for different GDL material, the experimental
data and the theoretical prediction were plotted together as shown in Figure 5.14. It can
be seen from the figure that the correlation value was within an error of 12% for all the
different K values.
Figure 5.14: K values found for different GDL materials based on experimental data and from
theoretical prediction. The black line in the plot indicates the 12% error boundary. The data points
fall within the 12% error boundary between the experimental and theoretical prediction.
- 155 -
In this study, a semi-empirical correlation was obtained to find the minimum
velocity required in a given trapezoidal gas channel to remove the liquid water before the
touches the channel sidewall. The correlation for K obtained in this analysis is specific to
the experiments performed in this study. For channels with different aspect ratio or
hydraulic diameter, the constant K would change and that needs to be found
experimentally.
This study clearly indicates the important role played by the channel sidewalls
and the channel angle on water transport characteristics. Knowing the previously
mentioned parameters (contact angle of the base and the sidewall material, channel open
angle and droplet emergence location) for a given system, the minimum velocity required
to remove the droplet from the channel before it touches the channel walls can be found
using Eq. 5.33. In addition, if the inlet gas velocity in the channel is known, the minimum
pressure drop required to remove the droplet from the gas channel when the droplet
touches the channel walls can be found out using Eq. 5.14 or 5.15.
- 156 -
Chapter 6 Conclusions
In a PEMFC, efficient water removal from the gas channel is one of the key issues
that needs to be addressed. In this study, ex situ experiments were conducted to study
water droplet dynamics in a gas channel from a fundamental perspective. High–speed
videos revealed that droplet dynamics at the gas channel corner are significantly affected
by the changes in (i) the trapezoid channel angle, (ii) air velocities, (iii) channel material,
and (iv) droplet inlet location. Therefore, experiments were conducted to understand the
effect of each parameter separately on droplet behavior. Experiments were also
conducted to understand the effect of channel scaling on the droplet behavior. It was also
seen from the experiments that in the absence of airflow, a droplet emerging from the
channel base jumped to the sidewall such that it completely lost contact with the base and
hung from the sidewall. Therefore, theoretical models were developed to understand this
jumping mechanism and to characterize droplet behavior inside PEMFC gas channels as
a function of the above four parameters. The effects of different parameters on droplet
dynamics are summarized below.
Effect of Channel Angle – It was observed from the experiments that for channel
open angles of 50° and below, the droplet did not fill the channel corners, and did
fill the corners for higher open angles. The surface energies of the channel wall
and base material influence the corner filling behavior of the channel at a given
channel open angle. Experimental results confirmed the Concus–Finn theoretical
- 157 -
predictions regarding the corner filling behavior. However, near the transition
angle based on the Concus–Finn condition, droplet behavior changed due to
oscillations in the droplet created by the air velocity inside the channel. It was
noted that using the instantaneous dynamic contact angle was necessary while
applying the Concus–Finn condition.
Effect of Air Velocity – Airflow inside the channel introduces oscillations in the
droplet before it touches the channel sidewall, and significantly affects the
instantaneous dynamic contact angle the droplet makes with the channel sidewall.
This dynamic contact angle determines the corner filling and non–filling criteria
for a given channel angle. For the channel open angles that fall near the transition
angle, the airflow has significant effect in determining the channel corner filling
behavior. At the transition angle, lower air velocities result in channel corner
filling while higher ones do not.
Effect of Channel Material – Different channel materials used in PEMFC
applications were observed to have similar characteristic behavior in terms of
droplet pinning and transport resistance in the channel. For all the material pairs
used in this study, the transition angle was noted to be 50°. Any channel having
an open angle of 50° or smaller did not fill the channel corners when run at higher
air velocities corresponding to higher current densities. No noticeable difference
- 158 -
was observed for different GDL materials tested in terms of the corner filling
behavior.
Effect of GDL Degradation – GDL samples that had run longer showed lower
advancing and receding contact angles. This clearly shows that the GDL loses its
hydrophobicity with use. This loss in hydrophobicity affects the corner filling
behavior and hence shifts the transition angle according to the Concus–Finn
condition.
Effect of Scaling of the Channel – Scaling of the channel did not affect the
droplet behavior in the PEMFC gas channel. Smaller channels (0.4 mm × 0.7
mm) showed the same droplet dynamics in terms of corner filling behavior as
observed in a larger dimension channel (3 mm × 3 mm). The liquid flow pattern
observed in the gas channel changed from slug to film to droplet flow depending
upon the trapezoid channel angle and the air velocity inside the channel.
Effect of Droplet Location – Droplet dynamics in the channel were also
dependent on the liquid emergence location within the channel. Predicting the
filling and non–filling criteria of the channel based on Concus–Finn condition
works well only when the droplet emerges in the middle of the channel. When the
droplet emerges close to the channel corners or under the land areas, the Concus–
Finn condition based on static contact angle fails to predict the droplet behavior
- 159 -
near the channel corners. Instead, it was noted that using the instantaneous
dynamic contact angle while applying the Concus–Finn condition predicted the
droplet behavior in the channel accurately.
Theoretical Model – To incorporate all the different droplet behaviors due to the
different parameters mentioned above, a geometrical analysis as well as a force
balance analysis was performed. Geometrical analysis was helpful in
understanding the droplet jumping behavior observed in the gas channel while
there was no airflow in the gas channel. A correlation was obtained to predict the
droplet jumping behavior in terms of the channel open angle, material surface
properties and droplet inlet location. In the presence of airflow, the droplet
showed corner filling or non–filling behavior at lower air velocities whereas the
droplet slid off the GDL surface at higher air velocities. For these cases, a semi-
empirical correlation was obtained to predict the minimum pressure drop as well
as minimum velocity required to remove the droplet from the gas channel. All of
these models were validated by experimental results.
- 160 -
Chapter 7 Future Work
Some of the areas where this work could be extended to better understand droplet
behavior in PEMFC gas channels are as follows:
7.1 Capillary Grooves – Prevent Spreading of Liquid on the
GDL
From the experimental results, it was found that corner filling is a serious issue
with PEMFCs, especially when the droplets are introduced from the land or channel wall
regions, and hence design modifications are warranted. Possible suggestions to address
this issue include the incorporation of additional microchannel grooves on the sidewall
that act as capillary channels to draw liquid from the land area and transport it to the top
wall from where it would be removed by the airflow. The proposed design was validated
and results were shown in Section 4.8.1. However, the width of the grooves used in that
design was around 200 – 250 µm, which is quite large to provide good capillary rise
action. Therefore, this work could be extended further to incorporate smaller width
grooves on the sidewall to see how it helps in the removal of the water from the gas
channel. A relation between the channel width and the capillary rise in the grooves in the
presence of airflow could be investigated which would help the designer incorporate the
optimum groove size in automotive fuel cell designs. Secondly, the grooves tested in this
work were straight. The grooves could be made inclined on the sidewall such that they
- 161 -
are in the direction of the airflow. This will also aid in the removal of the liquid from the
gas channel.
7.2 Compression of the GDL and its Effect on Droplet
Dynamics
Compression of the GDL leads to larger intrusion of GDL in the channel, and
affects the droplet dynamics in the gas channel. In this work, compression effects were
not studied. Further work can be pursued to investigate the intrusion effect due to GDL
compression. In addition, a study is recommended to investigate the plastic deformation
near the corners due to compression and its effect on the droplet dynamics.
7.3 Study the Effect of the Different Droplet Dynamics
Observed on Mass Transport Resistance inside the Gas
Channel
The experimental work pursued in this dissertation, aimed only to understand
droplet behavior in terms of its interaction with the sidewall and its removal. The effect
of droplet dynamics on the mass transport resistance for oxygen transport to the reactant
sites was not studied. A numerical study is suggested to determine the mass transport
resistance in the gas channel under different airflow conditions.
- 162 -
7.4 Study the Effect of Temperature, Pressure and Humidity
on Droplet Behavior
The study undertaken here was performed at room temperature under atmospheric
pressure and no humidity conditions. However, a PEMFC works at temperature between
25° and 80°C, and at different humidity conditions. The droplet dynamics in the gas
channel would change at different temperature and relative humidity (RH) conditions due
to evaporation effects [173-177]. Therefore, the study could be extended to understand
how droplet dynamics would be affected due to changes in temperature, pressure and RH.
7.5 Analysis of the Oscillations Produced in the Droplet
Due to the Airflow
It was observed that near the transition angles, the oscillations introduced in the
droplet by the airflow in the gas channel changed the IDCA the droplet made with the
channel wall. This actually determines the corner filling and non–filling behavior.
Therefore, a numerical study could be conducted to understand the streamlines of the
airflow over the droplet or film under different airflow conditions. This study could be
helpful in understanding how the airflow streamlines produce the oscillations in the
droplet and change the IDCA the droplet makes with the channel walls.
- 163 -
Appendix I
1. Water Flow Rate Calculation
The channel dimensions used for these calculations were according to an active
area of 50 cm2 in a typical fuel cell that meets the Department of Energy specifications
[133].
Length of channel (LC) = 183 mm
Channel width (Cw) = 0.7 mm
Land Width (Lw) = 0.5 mm
Active Area = (Lw + Cw) * LC
Active Area = (0.5 + 0.7) *183 mm
Active Area (A) = 219.6 mm2 = 2.916 cm2
Current Density (i) = 0.3 A/cm2
Number of moles of water (n) = 2
Faraday constant = 96485
According to the Nernst Eq.
- 164 -
𝑊𝑎𝑡𝑒𝑟 𝐺𝑒𝑛𝑒𝑟𝑎𝑡𝑖𝑜𝑛 𝑄𝑔 = 𝑖𝐴
𝑛𝐹 𝑚𝑜𝑙/𝑠𝑒𝑐
𝑊𝑎𝑡𝑒𝑟 𝐺𝑒𝑛𝑒𝑟𝑎𝑡𝑖𝑜𝑛 𝑄𝑔 = (0.3 ∗ 2.916 )
(2 ∗ 96485) 𝑚𝑜𝑙
𝑠𝑒𝑐= 4.533 ∗ 10−6 𝑚𝑜𝑙/𝑠𝑒𝑐
𝑊𝑎𝑡𝑒𝑟 𝐺𝑒𝑛𝑒𝑟𝑎𝑡𝑖𝑜𝑛 (𝑔/𝑠𝑒𝑐) = (𝑄𝑔) ∗ 𝑀𝑜𝑙𝑒𝑐𝑢𝑙𝑎𝑟 𝑤𝑒𝑖𝑔ℎ𝑡 𝑜𝑓 𝑊𝑎𝑡𝑒𝑟 (𝑔/𝑚𝑜𝑙)
𝑊𝑎𝑡𝑒𝑟 𝐺𝑒𝑛𝑒𝑟𝑎𝑡𝑖𝑜𝑛 (𝑔/ 𝑠𝑒𝑐) = 4.533 ∗ 10−6 𝑚𝑜𝑙/𝑠𝑒𝑐 ∗ 18.0153 𝑔/𝑚𝑜𝑙
= 8.167 ∗ 10−5 𝑔/𝑠𝑒𝑐
𝑀𝑎𝑠𝑠 𝑓𝑙𝑜𝑤 𝑟𝑎𝑡𝑒 (𝑐𝑚/𝑠𝑒𝑐) = 𝑄𝑔
𝜌𝑤𝑎𝑡𝑒𝑟∗ 106
𝑀𝑎𝑠𝑠 𝑓𝑙𝑜𝑤 𝑟𝑎𝑡𝑒 (𝑐𝑚/𝑠𝑒𝑐) = 8.167 ∗ 10−5
996.95 ∗ 103∗ 106 = 8.192 ∗ 10−5 (𝑐𝑚/𝑠𝑒𝑐)
𝑀𝑎𝑠𝑠 𝑓𝑙𝑜𝑤 𝑟𝑎𝑡𝑒 (𝑠𝑐𝑐𝑚) = 𝑀𝑎𝑠𝑠 𝑓𝑙𝑜𝑤 𝑟𝑎𝑡𝑒 (𝑐𝑚/𝑠𝑒𝑐) ∗ 60
𝑀𝑎𝑠𝑠 𝑓𝑙𝑜𝑤 𝑟𝑎𝑡𝑒 (𝑠𝑐𝑐𝑚) = 8.192 ∗ 10−5 ∗ 60 = 0.005 𝑠𝑐𝑐𝑚
2. Superficial Airflow Rate Calculation
The channel dimensions used for these calculations were according to an active
area of 50 cm2 in a typical fuel cell that meets the Department of Energy specifications
[51].
𝐴𝑐𝑡𝑖𝑣𝑒 𝐴𝑟𝑒𝑎 (𝐴) = (Lw + 𝐶𝑤) ∗ L𝐶 ∗ 22 𝑐ℎ𝑎𝑛𝑛𝑒𝑙
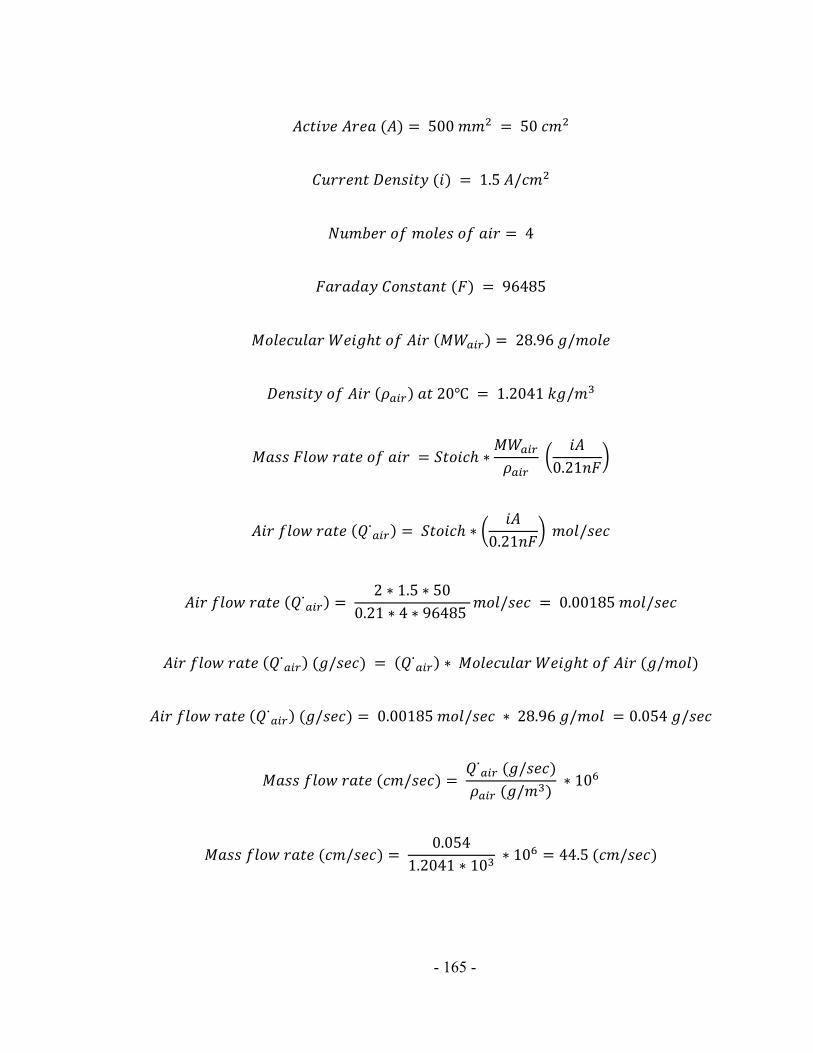
- 165 -
𝐴𝑐𝑡𝑖𝑣𝑒 𝐴𝑟𝑒𝑎 (𝐴) = 500 𝑚𝑚2 = 50 𝑐𝑚2
𝐶𝑢𝑟𝑟𝑒𝑛𝑡 𝐷𝑒𝑛𝑠𝑖𝑡𝑦 (𝑖) = 1.5 𝐴/𝑐𝑚2
𝑁𝑢𝑚𝑏𝑒𝑟 𝑜𝑓 𝑚𝑜𝑙𝑒𝑠 𝑜𝑓 𝑎𝑖𝑟 = 4
𝐹𝑎𝑟𝑎𝑑𝑎𝑦 𝐶𝑜𝑛𝑠𝑡𝑎𝑛𝑡 (𝐹) = 96485
𝑀𝑜𝑙𝑒𝑐𝑢𝑙𝑎𝑟 𝑊𝑒𝑖𝑔ℎ𝑡 𝑜𝑓 𝐴𝑖𝑟 (𝑀𝑊𝑎𝑖𝑟) = 28.96 𝑔/𝑚𝑜𝑙𝑒
𝐷𝑒𝑛𝑠𝑖𝑡𝑦 𝑜𝑓 𝐴𝑖𝑟 (𝜌𝑎𝑖𝑟) 𝑎𝑡 20℃ = 1.2041 𝑘𝑔/𝑚3
𝑀𝑎𝑠𝑠 𝐹𝑙𝑜𝑤 𝑟𝑎𝑡𝑒 𝑜𝑓 𝑎𝑖𝑟 = 𝑆𝑡𝑜𝑖𝑐ℎ ∗𝑀𝑊𝑎𝑖𝑟
𝜌𝑎𝑖𝑟
𝑖𝐴
0.21𝑛𝐹
𝐴𝑖𝑟 𝑓𝑙𝑜𝑤 𝑟𝑎𝑡𝑒 (𝑄 ̇𝑎𝑖𝑟) = 𝑆𝑡𝑜𝑖𝑐ℎ ∗ 𝑖𝐴
0.21𝑛𝐹 𝑚𝑜𝑙/𝑠𝑒𝑐
𝐴𝑖𝑟 𝑓𝑙𝑜𝑤 𝑟𝑎𝑡𝑒 (𝑄 ̇𝑎𝑖𝑟) = 2 ∗ 1.5 ∗ 50
0.21 ∗ 4 ∗ 96485 𝑚𝑜𝑙/𝑠𝑒𝑐 = 0.00185 𝑚𝑜𝑙/𝑠𝑒𝑐
𝐴𝑖𝑟 𝑓𝑙𝑜𝑤 𝑟𝑎𝑡𝑒 (𝑄 ̇𝑎𝑖𝑟) (𝑔/𝑠𝑒𝑐) = (𝑄 ̇𝑎𝑖𝑟) ∗ 𝑀𝑜𝑙𝑒𝑐𝑢𝑙𝑎𝑟 𝑊𝑒𝑖𝑔ℎ𝑡 𝑜𝑓 𝐴𝑖𝑟 (𝑔/𝑚𝑜𝑙)
𝐴𝑖𝑟 𝑓𝑙𝑜𝑤 𝑟𝑎𝑡𝑒 (𝑄 ̇𝑎𝑖𝑟) (𝑔/𝑠𝑒𝑐) = 0.00185 𝑚𝑜𝑙/𝑠𝑒𝑐 ∗ 28.96 𝑔/𝑚𝑜𝑙 = 0.054 𝑔/𝑠𝑒𝑐
𝑀𝑎𝑠𝑠 𝑓𝑙𝑜𝑤 𝑟𝑎𝑡𝑒 (𝑐𝑚/𝑠𝑒𝑐) = 𝑄 ̇𝑎𝑖𝑟 (𝑔/𝑠𝑒𝑐)
𝜌𝑎𝑖𝑟 (𝑔/𝑚3) ∗ 106
𝑀𝑎𝑠𝑠 𝑓𝑙𝑜𝑤 𝑟𝑎𝑡𝑒 (𝑐𝑚/𝑠𝑒𝑐) = 0.054
1.2041 ∗ 103 ∗ 106 = 44.5 (𝑐𝑚/𝑠𝑒𝑐)
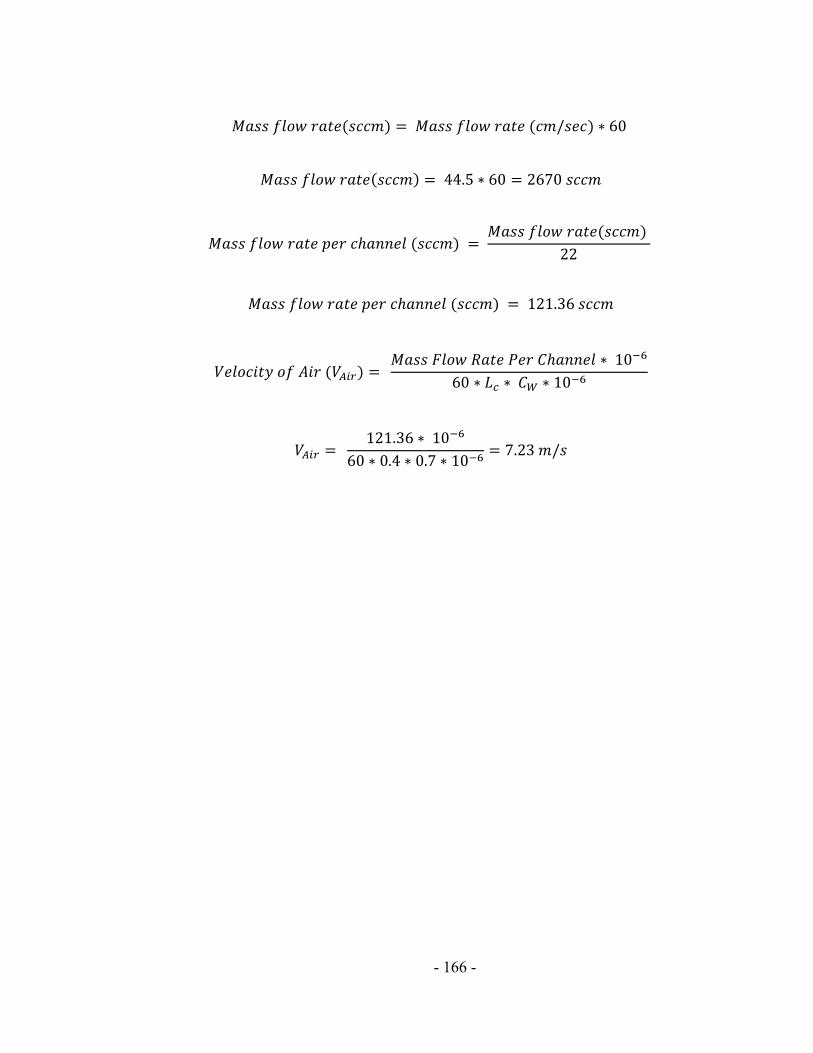
- 166 -
𝑀𝑎𝑠𝑠 𝑓𝑙𝑜𝑤 𝑟𝑎𝑡𝑒(𝑠𝑐𝑐𝑚) = 𝑀𝑎𝑠𝑠 𝑓𝑙𝑜𝑤 𝑟𝑎𝑡𝑒 (𝑐𝑚/𝑠𝑒𝑐) ∗ 60
𝑀𝑎𝑠𝑠 𝑓𝑙𝑜𝑤 𝑟𝑎𝑡𝑒(𝑠𝑐𝑐𝑚) = 44.5 ∗ 60 = 2670 𝑠𝑐𝑐𝑚
𝑀𝑎𝑠𝑠 𝑓𝑙𝑜𝑤 𝑟𝑎𝑡𝑒 𝑝𝑒𝑟 𝑐ℎ𝑎𝑛𝑛𝑒𝑙 (𝑠𝑐𝑐𝑚) = 𝑀𝑎𝑠𝑠 𝑓𝑙𝑜𝑤 𝑟𝑎𝑡𝑒(𝑠𝑐𝑐𝑚)
22
𝑀𝑎𝑠𝑠 𝑓𝑙𝑜𝑤 𝑟𝑎𝑡𝑒 𝑝𝑒𝑟 𝑐ℎ𝑎𝑛𝑛𝑒𝑙 (𝑠𝑐𝑐𝑚) = 121.36 𝑠𝑐𝑐𝑚
𝑉𝑒𝑙𝑜𝑐𝑖𝑡𝑦 𝑜𝑓 𝐴𝑖𝑟 (𝑉𝐴𝑖𝑟) = 𝑀𝑎𝑠𝑠 𝐹𝑙𝑜𝑤 𝑅𝑎𝑡𝑒 𝑃𝑒𝑟 𝐶ℎ𝑎𝑛𝑛𝑒𝑙 ∗ 10−6
60 ∗ 𝐿𝑐 ∗ 𝐶𝑊 ∗ 10−6
𝑉𝐴𝑖𝑟 = 121.36 ∗ 10−6
60 ∗ 0.4 ∗ 0.7 ∗ 10−6= 7.23 𝑚/𝑠
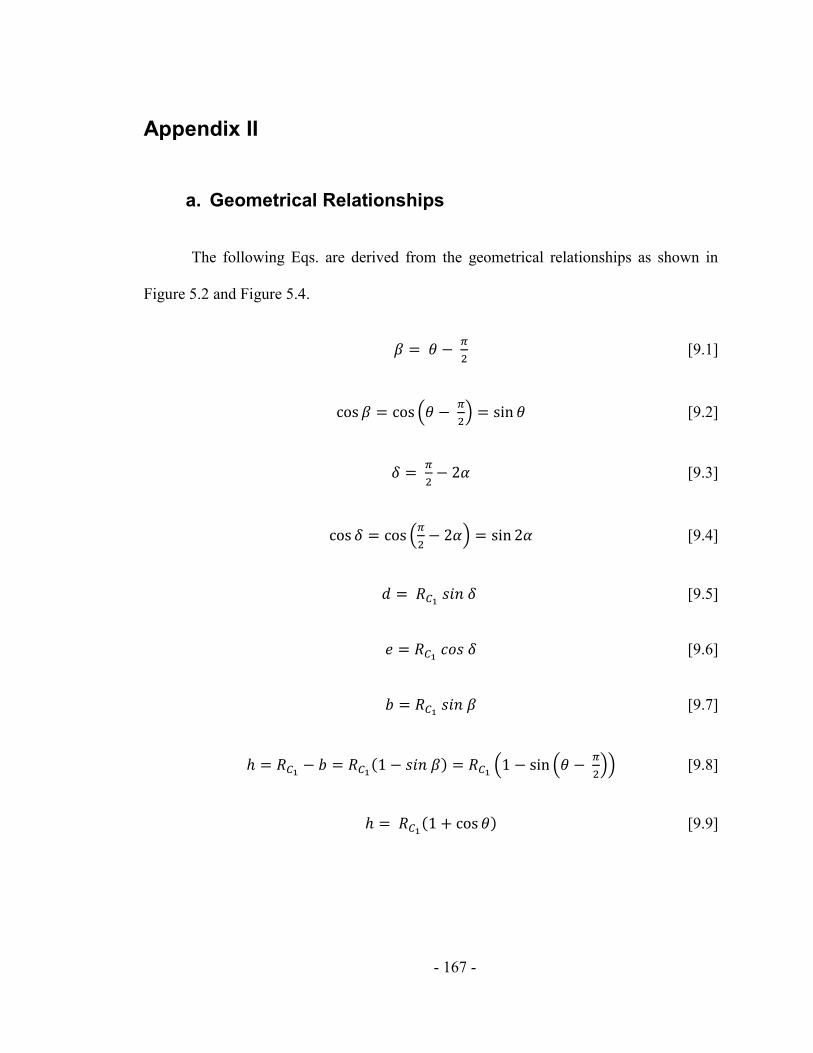
- 167 -
Appendix II
a. Geometrical Relationships
The following Eqs. are derived from the geometrical relationships as shown in
Figure 5.2 and Figure 5.4.
𝛽 = 𝜃 − 𝜋
2 [9.1]
cos 𝛽 = cos 𝜃 − 𝜋
2 = sin 𝜃 [9.2]
𝛿 = 𝜋
2− 2𝛼 [9.3]
cos 𝛿 = cos 𝜋
2− 2𝛼 = sin 2𝛼 [9.4]
𝑑 = 𝑅𝐶1 𝑠𝑖𝑛 𝛿 [9.5]
𝑒 = 𝑅𝐶1 𝑐𝑜𝑠 𝛿 [9.6]
𝑏 = 𝑅𝐶1 𝑠𝑖𝑛 𝛽 [9.7]
ℎ = 𝑅𝐶1− 𝑏 = 𝑅𝐶1
(1 − 𝑠𝑖𝑛 𝛽) = 𝑅𝐶1 1 − sin 𝜃 −
𝜋
2 [9.8]
ℎ = 𝑅𝐶1(1 + cos 𝜃) [9.9]

- 168 -
𝜂 =𝜋
2− 2𝛼 [9.10]
𝑘 =𝜋
2− 𝜙 [9.11]
𝑧 = 𝑅𝐶2 𝑠𝑖𝑛 𝑘 = 𝑅𝐶2
𝑐𝑜𝑠 𝜙 [9.12]
𝑓 = 𝑧 𝑡𝑎𝑛 2𝛼 = 𝑅𝐶2 𝑐𝑜𝑠 𝜙 𝑡𝑎𝑛 2𝛼 [9.13]
𝑠𝑖𝑛 𝜂 =𝑧
𝑔 [9.14]
𝑔 = 𝑧
𝑠𝑖𝑛 𝜂=
𝑅𝐶2 𝑐𝑜𝑠 𝜙
𝑐𝑜𝑠 2𝛼 [9.15]
𝑚 = 𝑅2 − 𝑧 = 𝑅2 − 𝑅2 𝑐𝑜𝑠 ∅ [9.16]
i. To Find the Maximum Radius 𝑹𝑪𝟏 Right Before it Jumps
The open angle 2α is related to the 𝑅𝐶1 and is given by Eq. 5.1
𝑡𝑎𝑛 2𝛼 = 𝑅𝐶1 𝑠𝑖𝑛 𝛽+𝑅𝐶1 𝑠𝑖𝑛 𝛿
𝑎−𝑅𝐶1 𝑐𝑜𝑠 𝛿 [5.1]
Rearranging Eq. 5.1, the maximum radius of the droplet just before it snaps and jumps to
the sidewall is obtained.
𝑅𝐶1=
𝑎 𝑡𝑎𝑛 2𝛼
𝑠𝑖𝑛 𝛽+ 𝑠𝑖𝑛 𝛿+𝑐𝑜𝑠 𝛿 𝑡𝑎𝑛 2𝛼 [9.17]
Substituting β and δ in terms of θ and 2α, the critical radius 𝑅𝐶1 can be obtained.
𝑅𝐶1=
a tan2α
sin θ− π
2 + sin
π
2−2α +cos
π
2−2α tan2α
[9.18]
Solving Eq. 9.18, 𝑅𝐶1 is obtained as below
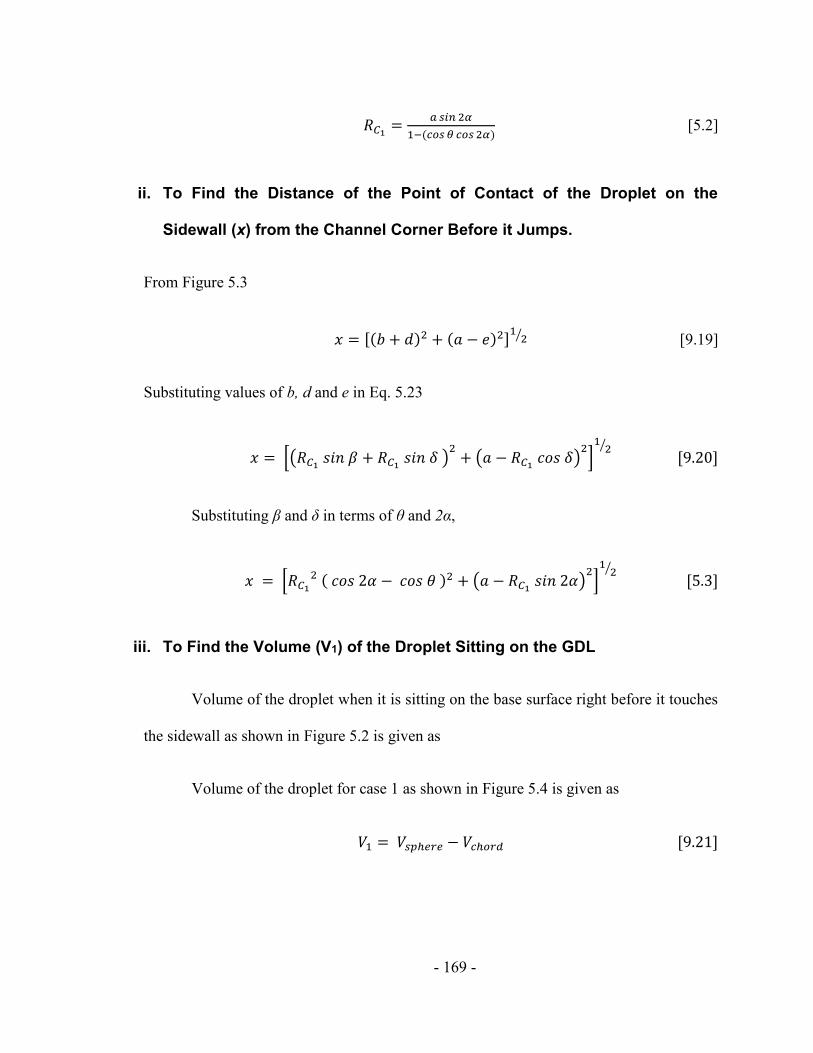
- 169 -
𝑅𝐶1=
𝑎 𝑠𝑖𝑛 2𝛼
1−(𝑐𝑜𝑠 𝜃 𝑐𝑜𝑠 2𝛼) [5.2]
ii. To Find the Distance of the Point of Contact of the Droplet on the
Sidewall (x) from the Channel Corner Before it Jumps.
From Figure 5.3
𝑥 = [(𝑏 + 𝑑)2 + (𝑎 − 𝑒)2]1
2 [9.19]
Substituting values of b, d and e in Eq. 5.23
𝑥 = 𝑅𝐶1 𝑠𝑖𝑛 𝛽 + 𝑅𝐶1
𝑠𝑖𝑛 𝛿 2+ 𝑎 − 𝑅𝐶1
𝑐𝑜𝑠 𝛿 2 1
2
[9.20]
Substituting β and δ in terms of θ and 2α,
𝑥 = 𝑅𝐶1
2 ( 𝑐𝑜𝑠 2𝛼 − 𝑐𝑜𝑠 𝜃 )2 + 𝑎 − 𝑅𝐶1 𝑠𝑖𝑛 2𝛼
2 1
2
[5.3]
iii. To Find the Volume (V1) of the Droplet Sitting on the GDL
Volume of the droplet when it is sitting on the base surface right before it touches
the sidewall as shown in Figure 5.2 is given as
Volume of the droplet for case 1 as shown in Figure 5.4 is given as
𝑉1 = 𝑉𝑠𝑝ℎ𝑒𝑟𝑒 − 𝑉𝑐ℎ𝑜𝑟𝑑 [9.21]
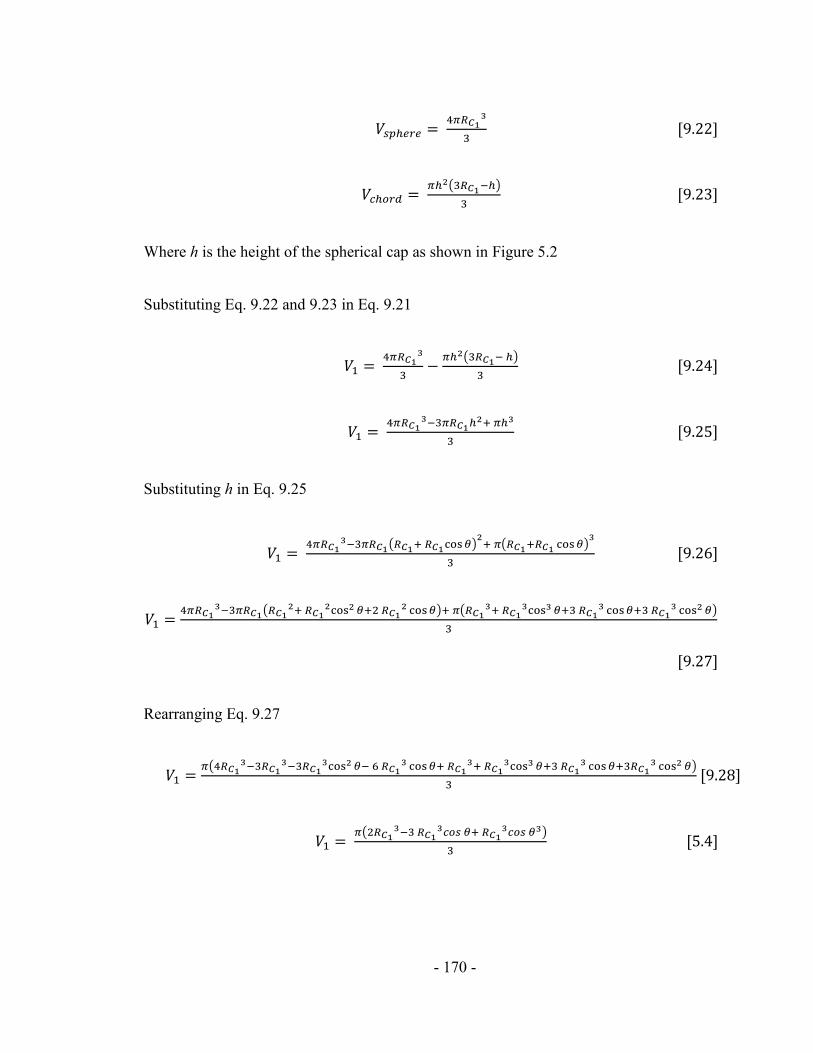
- 170 -
𝑉𝑠𝑝ℎ𝑒𝑟𝑒 = 4𝜋𝑅𝐶1
3
3 [9.22]
𝑉𝑐ℎ𝑜𝑟𝑑 = 𝜋ℎ2 3𝑅𝐶1−ℎ
3 [9.23]
Where h is the height of the spherical cap as shown in Figure 5.2
Substituting Eq. 9.22 and 9.23 in Eq. 9.21
𝑉1 = 4𝜋𝑅𝐶1
3
3−
𝜋ℎ2 3𝑅𝐶1− ℎ
3 [9.24]
𝑉1 = 4𝜋𝑅𝐶1
3−3𝜋𝑅𝐶1ℎ2+ 𝜋ℎ3
3 [9.25]
Substituting h in Eq. 9.25
𝑉1 = 4𝜋𝑅𝐶1
3−3𝜋𝑅𝐶1 𝑅𝐶1+ 𝑅𝐶1cos𝜃 2+ 𝜋 𝑅𝐶1+𝑅𝐶1 cos𝜃
3
3 [9.26]
𝑉1 =4𝜋𝑅𝐶1
3−3𝜋𝑅𝐶1 𝑅𝐶12+ 𝑅𝐶1
2cos2 𝜃+2 𝑅𝐶12 cos𝜃 + 𝜋 𝑅𝐶1
3+ 𝑅𝐶13cos3 𝜃+3 𝑅𝐶1
3 cos𝜃+3 𝑅𝐶13 cos2 𝜃
3
[9.27]
Rearranging Eq. 9.27
𝑉1 =𝜋 4𝑅𝐶1
3−3𝑅𝐶13−3𝑅𝐶1
3cos2 𝜃− 6 𝑅𝐶13 cos𝜃+ 𝑅𝐶1
3+ 𝑅𝐶13cos3 𝜃+3 𝑅𝐶1
3 cos𝜃+3𝑅𝐶13 cos2 𝜃
3 [9.28]
𝑉1 = 𝜋 2𝑅𝐶1
3−3 𝑅𝐶13𝑐𝑜𝑠 𝜃+ 𝑅𝐶1
3𝑐𝑜𝑠 𝜃3
3 [5.4]
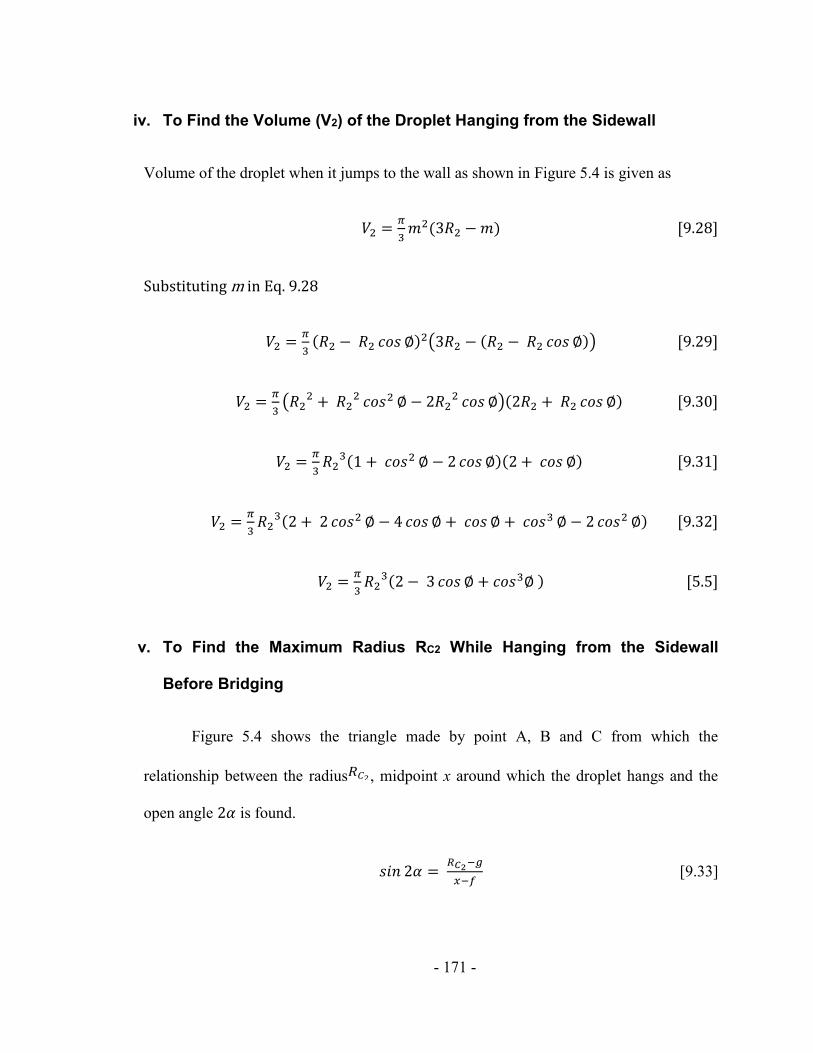
- 171 -
iv. To Find the Volume (V2) of the Droplet Hanging from the Sidewall
Volume of the droplet when it jumps to the wall as shown in Figure 5.4 is given as
𝑉2 =𝜋
3𝑚2(3𝑅2 − 𝑚) [9.28]
Substituting m in Eq. 9.28
𝑉2 =𝜋
3(𝑅2 − 𝑅2 𝑐𝑜𝑠 ∅)2 3𝑅2 − (𝑅2 − 𝑅2 𝑐𝑜𝑠 ∅) [9.29]
𝑉2 =𝜋
3 𝑅2
2 + 𝑅22 𝑐𝑜𝑠2 ∅ − 2𝑅2
2 𝑐𝑜𝑠 ∅ (2𝑅2 + 𝑅2 𝑐𝑜𝑠 ∅) [9.30]
𝑉2 =𝜋
3𝑅2
3(1 + 𝑐𝑜𝑠2 ∅ − 2 𝑐𝑜𝑠 ∅)(2 + 𝑐𝑜𝑠 ∅) [9.31]
𝑉2 =𝜋
3𝑅2
3(2 + 2 𝑐𝑜𝑠2 ∅ − 4 𝑐𝑜𝑠 ∅ + 𝑐𝑜𝑠 ∅ + 𝑐𝑜𝑠3 ∅ − 2 𝑐𝑜𝑠2 ∅) [9.32]
𝑉2 =𝜋
3𝑅2
3(2 − 3 𝑐𝑜𝑠 ∅ + 𝑐𝑜𝑠3∅ ) [5.5]
v. To Find the Maximum Radius RC2 While Hanging from the Sidewall
Before Bridging
Figure 5.4 shows the triangle made by point A, B and C from which the
relationship between the radius𝑅𝐶2 , midpoint x around which the droplet hangs and the
open angle 2𝛼 is found.
𝑠𝑖𝑛 2𝛼 = 𝑅𝐶2−𝑔
𝑥−𝑓 [9.33]
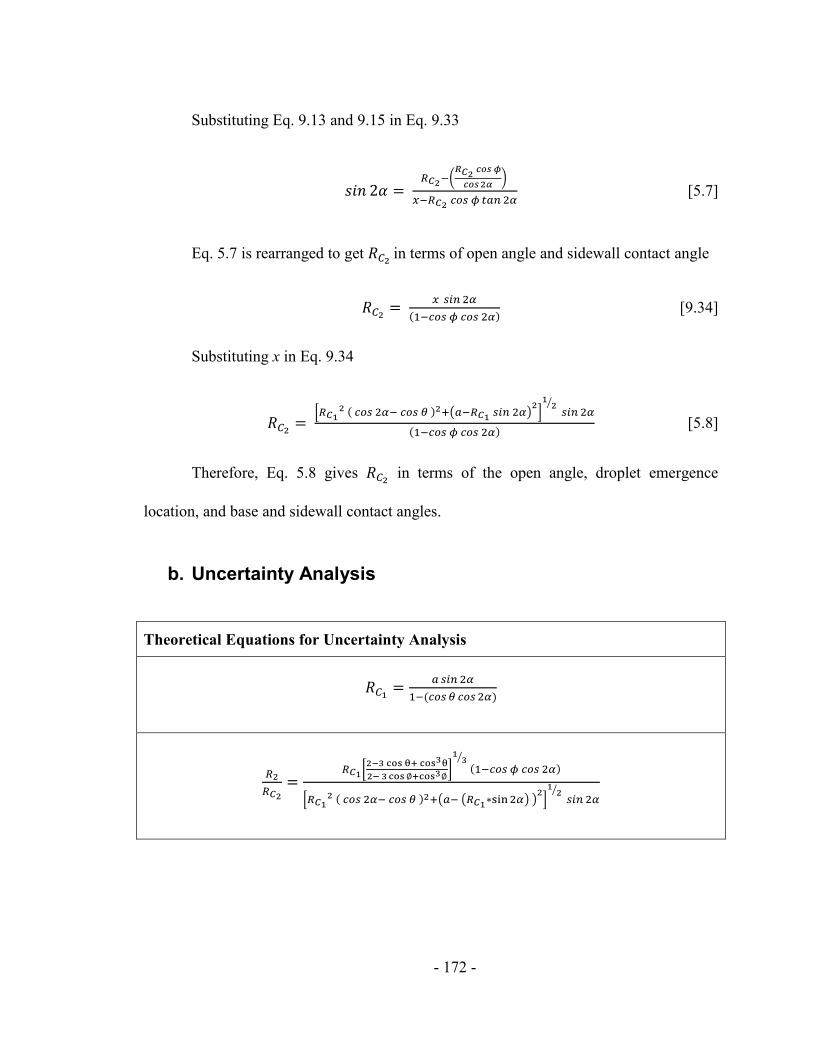
- 172 -
Substituting Eq. 9.13 and 9.15 in Eq. 9.33
𝑠𝑖𝑛 2𝛼 = 𝑅𝐶2−
𝑅𝐶2 𝑐𝑜𝑠 𝜙
𝑐𝑜𝑠2𝛼
𝑥−𝑅𝐶2 𝑐𝑜𝑠 𝜙 𝑡𝑎𝑛 2𝛼 [5.7]
Eq. 5.7 is rearranged to get 𝑅𝐶2 in terms of open angle and sidewall contact angle
𝑅𝐶2=
𝑥 𝑠𝑖𝑛 2𝛼
(1−𝑐𝑜𝑠 𝜙 𝑐𝑜𝑠 2𝛼) [9.34]
Substituting x in Eq. 9.34
𝑅𝐶2=
𝑅𝐶12 ( 𝑐𝑜𝑠 2𝛼− 𝑐𝑜𝑠 𝜃 )2+ 𝑎−𝑅𝐶1 𝑠𝑖𝑛 2𝛼
2 1
2 𝑠𝑖𝑛 2𝛼
(1−𝑐𝑜𝑠 𝜙 𝑐𝑜𝑠 2𝛼) [5.8]
Therefore, Eq. 5.8 gives 𝑅𝐶2 in terms of the open angle, droplet emergence
location, and base and sidewall contact angles.
b. Uncertainty Analysis
Theoretical Equations for Uncertainty Analysis
𝑅𝐶1=
𝑎 𝑠𝑖𝑛 2𝛼
1−(𝑐𝑜𝑠 𝜃 𝑐𝑜𝑠 2𝛼)
𝑅2
𝑅𝐶2
=𝑅𝐶1
2−3 cos θ+ cos3θ
2− 3 cos∅+cos3∅
13
(1−𝑐𝑜𝑠 𝜙 𝑐𝑜𝑠 2𝛼)
𝑅𝐶12 ( 𝑐𝑜𝑠 2𝛼− 𝑐𝑜𝑠 𝜃 )2+ 𝑎− 𝑅𝐶1∗sin2𝛼
2 1
2 𝑠𝑖𝑛 2𝛼
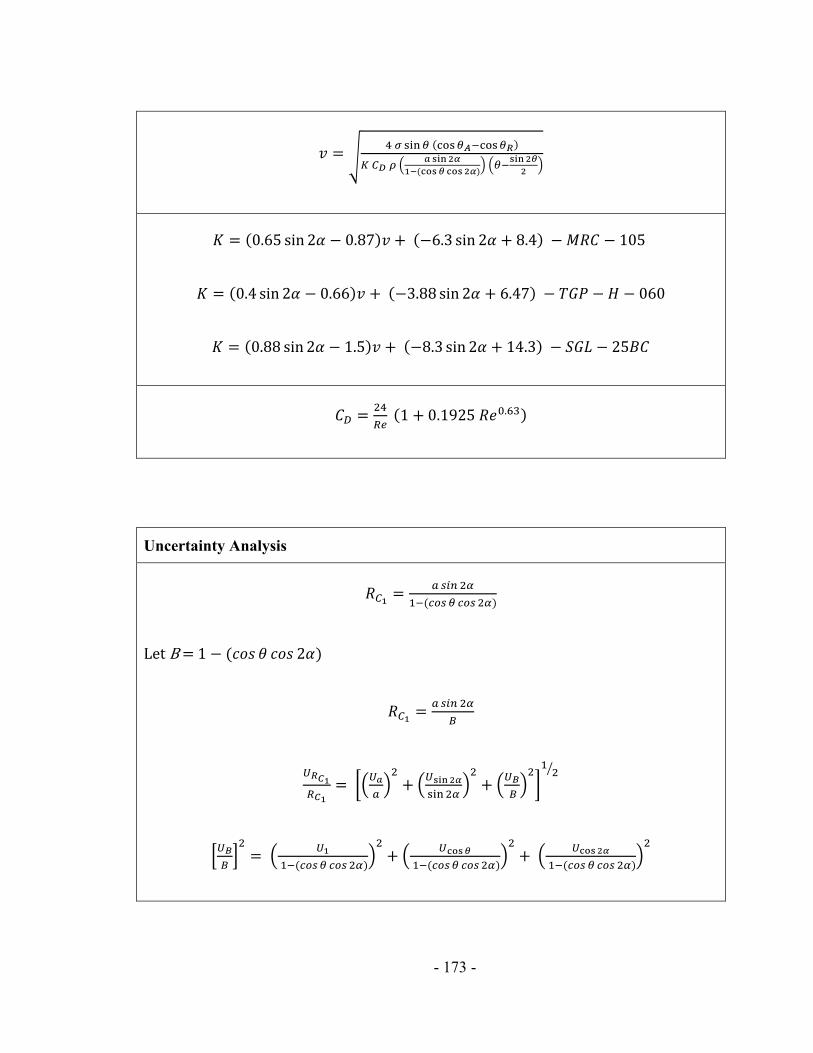
- 173 -
𝑣 = √4 𝜎 sin𝜃 (cos𝜃𝐴−cos𝜃𝑅)
𝐾 𝐶𝐷 𝜌 𝑎 sin2𝛼
1−(cos𝜃cos 2𝛼) 𝜃−
sin2𝜃
2
𝐾 = (0.65 sin 2𝛼 − 0.87)𝑣 + (−6.3 sin 2𝛼 + 8.4) − 𝑀𝑅𝐶 − 105
𝐾 = (0.4 sin 2𝛼 − 0.66)𝑣 + (−3.88 sin 2𝛼 + 6.47) − 𝑇𝐺𝑃 − 𝐻 − 060
𝐾 = (0.88 sin 2𝛼 − 1.5)𝑣 + (−8.3 sin 2𝛼 + 14.3) − 𝑆𝐺𝐿 − 25𝐵𝐶
𝐶𝐷 =24
𝑅𝑒 (1 + 0.1925 𝑅𝑒0.63)
Uncertainty Analysis
𝑅𝐶1=
𝑎 𝑠𝑖𝑛 2𝛼
1−(𝑐𝑜𝑠 𝜃 𝑐𝑜𝑠 2𝛼)
Let B = 1 − (𝑐𝑜𝑠 𝜃 𝑐𝑜𝑠 2𝛼)
𝑅𝐶1=
𝑎 𝑠𝑖𝑛 2𝛼
𝐵
𝑈𝑅𝐶1
𝑅𝐶1
= 𝑈𝑎
𝑎 2
+ 𝑈sin2𝛼
sin2𝛼 2
+ 𝑈𝐵
𝐵 2
12
𝑈𝐵
𝐵 2
= 𝑈1
1−(𝑐𝑜𝑠𝜃 𝑐𝑜𝑠 2𝛼) 2
+ 𝑈cos𝜃
1−(𝑐𝑜𝑠𝜃 𝑐𝑜𝑠 2𝛼) 2
+ 𝑈cos2𝛼
1−(𝑐𝑜𝑠 𝜃 𝑐𝑜𝑠 2𝛼) 2
- 174 -
𝑈𝐶𝑜𝑛𝑠𝑡𝑎𝑛𝑡 = 0
𝑈𝐵
𝐵 2
= 𝑈cos𝜃
1−(𝑐𝑜𝑠𝜃 𝑐𝑜𝑠 2𝛼) 2
+ 𝑈cos2𝛼
1−(𝑐𝑜𝑠𝜃 𝑐𝑜𝑠 2𝛼) 2
𝑈𝑅𝐶1
𝑅𝐶1
= 𝑈𝑎
𝑎 2
+ 𝑈sin2𝛼
sin2𝛼 2
+ 𝑈cos𝜃
1−(𝑐𝑜𝑠𝜃 𝑐𝑜𝑠 2𝛼) 2
+ 𝑈cos2𝛼
1−(𝑐𝑜𝑠 𝜃 𝑐𝑜𝑠 2𝛼) 2
12
𝑅2
𝑅𝐶2
=𝑅𝐶1
2−3 cos θ+ cos3θ
2− 3 cos∅+cos3∅
13
(1−𝑐𝑜𝑠 𝜙 𝑐𝑜𝑠 2𝛼)
𝑅𝐶12 ( 𝑐𝑜𝑠 2𝛼− 𝑐𝑜𝑠 𝜃 )2+ 𝑎− 𝑅𝐶1∗sin2𝛼
2 1
2 𝑠𝑖𝑛 2𝛼
𝑈 𝑅2𝑅𝐶2𝑅2𝑅𝐶2
=
[
𝑈𝑅𝐶1
𝑅𝐶1
2
+ (
𝑈
2−3 cos θ+ cos3θ
2− 3 cos∅+cos3∅
13
2−3 cos θ+ cos3θ
2− 3 cos∅+cos3∅
13 )
2
+ 𝑈(1−𝑐𝑜𝑠 𝜙 𝑐𝑜𝑠 2𝛼)
1−𝑐𝑜𝑠 𝜙 𝑐𝑜𝑠 2𝛼 2
+
(
𝑈
( 𝑅𝐶12 ( 𝑐𝑜𝑠 2𝛼− 𝑐𝑜𝑠 𝜃 )2+ 𝑎− 𝑅𝐶1
∗sin 2𝛼 2
12
)
𝑅𝐶12 ( 𝑐𝑜𝑠 2𝛼− 𝑐𝑜𝑠 𝜃 )2+ 𝑎− 𝑅𝐶1∗sin2𝛼
2 1
2
)
2
+ 𝑈𝑠𝑖𝑛2𝛼
𝑠𝑖𝑛 2𝛼 2
]
12
𝑈𝑅𝐶1
𝑅𝐶1
= 𝑈𝑎
𝑎 2
+ 𝑈sin2𝛼
sin2𝛼 2
+ 𝑈cos𝜃
1−(𝑐𝑜𝑠𝜃 𝑐𝑜𝑠 2𝛼) 2
+ 𝑈cos2𝛼
1−(𝑐𝑜𝑠 𝜃 𝑐𝑜𝑠 2𝛼) 2
12
Let C = 2 − 3 cos θ + cos3θ
Let D = 2 − 3 cos ∅ + cos3∅
- 175 -
𝑈 𝐶𝐷
13
𝐶
𝐷
= 1/3 { 𝑈C
C 2
+ 𝑈D
D 2
}
12
𝑈𝐶
𝐶=
𝑈𝑐𝑜𝑠 𝜃
2−3 cos θ+ cos3θ 2
+ 3 𝑈𝑐𝑜𝑠 𝜃
2−3 cos θ+ cos3θ 2
12
= 2 𝑈𝑐𝑜𝑠 𝜃
2−3 cos θ+ cos3θ
𝑈𝐷
𝐷=
𝑈𝑐𝑜𝑠 ∅
2−3 cos ∅+ cos3∅ 2
+ 3 𝑈𝑐𝑜𝑠 ∅
2−3 cos ∅+ cos3∅ 2
12
= 2 𝑈𝑐𝑜𝑠 ∅
2−3 cos ∅+ cos3∅
𝑈
2−3 cos θ+ cos3θ
2− 3 cos∅+cos3∅
13
2−3 cos θ+ cos3θ
2− 3 cos∅+cos3∅
13
= 1/3 { 2 𝑈𝑐𝑜𝑠 𝜃
2−3 cos θ+ cos3θ
2
+ 2 𝑈𝑐𝑜𝑠 ∅
2−3 cos ∅+ cos3∅
2
}
12
𝑈(1−𝑐𝑜𝑠 𝜙 𝑐𝑜𝑠 𝜙)
1−𝑐𝑜𝑠 𝜙 𝑐𝑜𝑠 2𝛼=
𝑈𝑐𝑜𝑠 𝜙
1−𝑐𝑜𝑠 𝜙 𝑐𝑜𝑠 2𝛼 2
+ 𝑈𝑐𝑜𝑠 𝜙
1−𝑐𝑜𝑠 𝜙 𝑐𝑜𝑠 2𝛼 2
12
Let 𝐸 = ( 𝑐𝑜𝑠 2𝛼 − 𝑐𝑜𝑠 𝜃 )2
Let 𝐹 = 𝑎 − 𝑅𝐶1∗ sin 2𝛼
2
Let 𝐺 = 𝑅𝐶1
2
𝑈(𝐺𝐸+𝐹)1/2
(𝐺𝐸+𝐹)1/2 = 1/2 { 𝑈𝐺𝐸
𝐺𝐸+𝐹 2
+ 𝑈𝐹
𝐺𝐸+𝐹 2
}
12
𝑈𝐺𝐸2 = (𝐺𝐸)2
𝑈𝐺
𝐺 2
+ 𝑈𝐸
𝐸 2
- 176 -
𝑈𝐸
𝐸 2
= 2 { 𝑈cos2𝛼
cos2𝛼− 𝑐𝑜𝑠 𝜃 2
+ 𝑈𝑐𝑜𝑠 𝜃
cos2𝛼−𝑐𝑜𝑠 𝜃 2
}
𝑈𝐹
𝐹 2
= 2
{
𝑈𝑎
𝑎− 𝑅𝐶1∗sin2𝛼 2
+ ( 𝑅𝐶1∗sin2𝛼
2[(
𝑈𝑅𝐶1𝑅𝐶1
)
2
+ 𝑈sin2𝛼sin2𝛼
2]
𝑎− 𝑅𝐶1∗sin2𝛼 )
2
}
𝑈(𝐺𝐸+𝐹)1/2
(𝐺𝐸+𝐹)1/2 = [1/2 {(𝐺𝐸)2
𝑈𝐺𝐺
2+
𝑈𝐸𝐸
2
(𝐺𝐸+𝐹 )2+
𝑈𝐹
𝐺𝐸+𝐹 2
}]
12
𝑈
( 𝑅𝐶12 ( 𝑐𝑜𝑠 2𝛼− 𝑐𝑜𝑠 𝜃 )2+ 𝑎− 𝑅𝐶1
∗𝑠𝑖𝑛2𝛼 2
12
)
𝑅𝐶12 ( 𝑐𝑜𝑠 2𝛼− 𝑐𝑜𝑠 𝜃 )2+ 𝑎− 𝑅𝐶1∗𝑠𝑖𝑛 2𝛼
2 1
2 =
[
1/
2
{
𝑅𝐶12 ( 𝑐𝑜𝑠 2𝛼− 𝑐𝑜𝑠 𝜃 )2
2
[
𝑈𝑎𝑎
2+
𝑈𝑠𝑖𝑛2𝛼𝑠𝑖𝑛2𝛼
2+
𝑈𝑐𝑜𝑠𝜃 1−(𝑐𝑜𝑠𝜃 𝑐𝑜𝑠 2𝛼)
2+
𝑈𝑐𝑜𝑠2𝛼 1−(𝑐𝑜𝑠𝜃 𝑐𝑜𝑠 2𝛼)
2
+ 2{ 𝑈𝑐𝑜𝑠 2𝛼
𝑐𝑜𝑠2𝛼− 𝑐𝑜𝑠 𝜃 2+
𝑈𝑐𝑜𝑠 𝜃𝑐𝑜𝑠2𝛼−𝑐𝑜𝑠 𝜃
2}
]
𝑅𝐶12 ( 𝑐𝑜𝑠 2𝛼− 𝑐𝑜𝑠 𝜃 )2+ 𝑎− 𝑅𝐶1∗𝑠𝑖𝑛 2𝛼
2
+
- 177 -
𝑎− 𝑅𝐶1∗sin2𝛼 4
(
2
{
(𝑈𝑎
𝑎− 𝑅𝐶1∗sin2𝛼
)
2
+
(
𝑅𝐶1∗sin 2𝛼
2[(
𝑈𝑅𝐶1𝑅𝐶1
)
2
+ 𝑈sin 2𝛼sin 2𝛼
2]
𝑎− 𝑅𝐶1∗sin 2𝛼
)
2
}
)
𝑅𝐶12 ( 𝑐𝑜𝑠 2𝛼− 𝑐𝑜𝑠 𝜃 )2+ 𝑎− 𝑅𝐶1∗𝑠𝑖𝑛 2𝛼
2
}
]
12
𝑣 = √4 𝜎 sin𝜃 (cos𝜃𝐴−cos𝜃𝑅)
𝐾 𝐶𝐷 𝜌 𝑎 sin2𝛼
1−(cos𝜃cos 2𝛼) 𝜃−
sin2𝜃
2
𝑣 = √4 𝜎 sin𝜃 (cos𝜃𝐴−cos𝜃𝑅)
𝐾 𝐶𝐷 𝜌𝑅𝐶1 𝜃−sin2𝜃
2
𝐶𝐷 = 24
𝑅𝑒 (1 + 0.1925 𝑅𝑒0.63) = 24 𝑅𝑒−1 + 4.62𝑅𝑒−0.37
Let 𝐻 = 𝜃 −sin2𝜃
2
Let 𝐽 = (cos 𝜃𝐴 − cos 𝜃𝑅)
𝑈𝑣
𝑣= 1/2
𝑈𝜎
𝜎 2
+ 𝑈 sin 𝜃
sin𝜃 2
+ 𝑈𝐽
𝐽 2
+ 𝑈𝐾
𝐾 2
+ 𝑈𝐶𝐷
𝐶𝐷 2
+ 𝑈𝑅𝐶1
𝑅𝐶1
2
+ 𝑈𝜌
𝜌 2
+
𝑈𝐻
𝐻 2
12
𝑈𝐽
𝐽 2
= 𝑈cos𝜃𝐴
cos𝜃𝐴−cos𝜃𝑅 2
+ 𝑈 cos𝜃𝐴
cos𝜃𝐴−cos𝜃𝑅 2
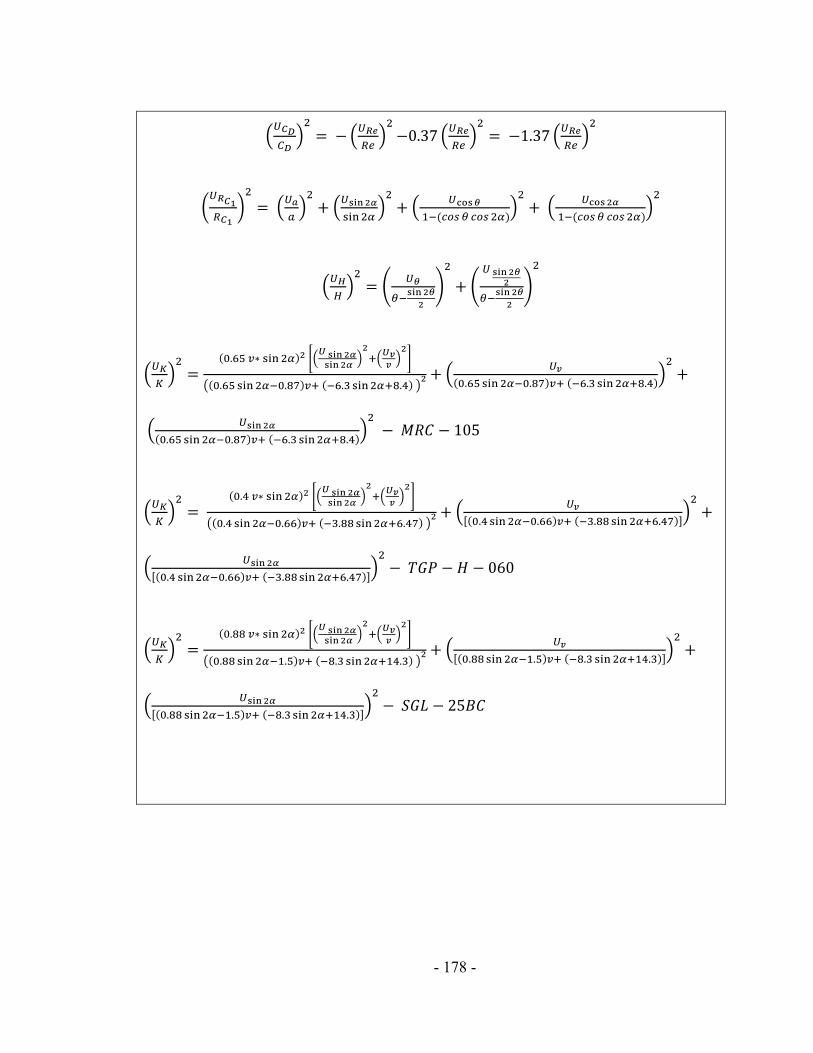
- 178 -
𝑈𝐶𝐷
𝐶𝐷 2
= − 𝑈𝑅𝑒
𝑅𝑒 2
−0.37 𝑈𝑅𝑒
𝑅𝑒 2
= −1.37 𝑈𝑅𝑒
𝑅𝑒 2
𝑈𝑅𝐶1
𝑅𝐶1
2
= 𝑈𝑎
𝑎 2
+ 𝑈sin2𝛼
sin2𝛼 2
+ 𝑈cos𝜃
1−(𝑐𝑜𝑠 𝜃 𝑐𝑜𝑠 2𝛼) 2
+ 𝑈cos2𝛼
1−(𝑐𝑜𝑠 𝜃 𝑐𝑜𝑠 2𝛼) 2
𝑈𝐻
𝐻 2
= (𝑈𝜃
𝜃−sin2𝜃
2
)
2
+ (𝑈
sin2𝜃
2
𝜃−sin2𝜃
2
)
2
𝑈𝐾
𝐾 2
=(0.65 𝑣∗ sin 2𝛼)2
𝑈 sin2𝛼 sin2𝛼
2+
𝑈𝑣𝑣
2
(0.65 sin2𝛼−0.87)𝑣+ (−6.3 sin2𝛼+8.4) 2 +
𝑈𝑣
(0.65 sin2𝛼−0.87)𝑣+ (−6.3 sin2𝛼+8.4) 2
+
𝑈sin2𝛼
(0.65 sin2𝛼−0.87)𝑣+ (−6.3 sin2𝛼+8.4) 2
− 𝑀𝑅𝐶 − 105
𝑈𝐾
𝐾 2
= (0.4 𝑣∗ sin 2𝛼)2
𝑈 sin 2𝛼 sin2𝛼
2+
𝑈𝑣𝑣
2
(0.4 sin2𝛼−0.66)𝑣+ (−3.88 sin2𝛼+6.47) 2 +
𝑈𝑣
[(0.4 sin2𝛼−0.66)𝑣+ (−3.88 sin2𝛼+6.47)] 2
+
𝑈sin 2𝛼
[(0.4 sin2𝛼−0.66)𝑣+ (−3.88sin2𝛼+6.47)] 2
− 𝑇𝐺𝑃 − 𝐻 − 060
𝑈𝐾
𝐾 2
=(0.88 𝑣∗ sin 2𝛼)2
𝑈 sin2𝛼 sin2𝛼
2+
𝑈𝑣𝑣
2
(0.88 sin2𝛼−1.5)𝑣+ (−8.3 sin2𝛼+14.3) 2 +
𝑈𝑣
[(0.88 sin2𝛼−1.5)𝑣+ (−8.3 sin2𝛼+14.3)] 2
+
𝑈sin2𝛼
[(0.88 sin2𝛼−1.5)𝑣+ (−8.3sin2𝛼+14.3)] 2
− 𝑆𝐺𝐿 − 25𝐵𝐶
- 179 -
References
[1] Dresselhaus, M. S., and Thomas, I. L., 2001, "Alternative Energy Technologies,"
Nature, 414(6861), pp. 332-337.
[2] OECD, 1996, "Towards Sustainable Transportation," OECD- hosted by the
Government of CanadaVancouver, British Columbia.
[3] OECD, 2010, "Reducing Transport Greenhouse Gas Emissions - Trends & Data,"
International Transport ForumLeipzig, Germany.
[4] UW Courses, 2007, "Improving IC Engine Efficiency,"
http://courses.washington.edu/me341/oct22v2.htm.
[5] Baglione, M., Duty, M., and Pannone, G., 2007, "Vehicle System Energy Analysis
Methodology and Tool for Determining Vehicle Subsystem Energy Supply and
Demand," SAE World Congress & ExhibitionDetroit, MI, USA.
[6] Kavya, 2012, "Car Pollution - LabSaints," http://labsaints.com/ecology-adopts-
changes-to-air-quality-fees-clean-cars-standards-general-regulation-of-sources/car-
pollution-2/.
[7] Hoffmann, P., 2002, Tomorrow's Energy: Hydrogen, Fuel Cells and the Prospects for
a Cleaner Planet, The MIT Press, Cambridge, MA.
[8] Wen, Z., Liu, J., and Li, J., 2008, "Core/Shell Pt/C Nanoparticles Embedded in
Mesoporous Carbon as a Methanol-Tolerant Cathode Catalyst in Direct Methanol Fuel
Cells," Advanced Materials, 20(4), pp. 743-747.
[9] Srinivasan, S., 2006, "Fuel Cells: From Fundamentals to Applications," Springer,
New York.
[10] World Energy Council, August 4, 2011, "Fuel Cell Efficiency,"
http://www.worldenergy.org/focus/fuel_cells/377.asp.
[11] Eberle, D. U., and von Helmolt, D. R., 2010, "Sustainable Transportation Based on
Electric Vehicle Concepts: a Brief Overview," Energy & Environmental Science, 3(6),
pp. 689-699.
[12] Steinbrenner, J. E., Lee, E. S., Hidrovo, C. H., Eaton, J. K., and Goodson, K. E.,
2011, "Impact of Channel Geometry on Two-Phase Flow in Fuel Cell Microchannels,"
Journal of Power Sources, 196(11), pp. 5012-5020.
[13] Owejan, J. P., Gagliardo, J. J., Sergi, J. M., Kandlikar, S. G., and Trabold, T. A.,
2009 "Water Management Studies in PEM Fuel Cells, Part I: Fuel Cell Design and In
Situ Water Distributions," International Journal of Hydrogen Energy, 34 (8), pp. 3436–
3444.
- 180 -
[14] Saha, M. S., Li, R., and Sun, X., 2007, "Composite of Pt-Ru Supported SnO2
Nanowires Grown on Carbon Paper for Electrocatalytic Oxidation of Methanol,"
Electrochemistry Communications, 9(9), pp. 2229-2234.
[15] Mathias, M., Roth, J., Fleming, J., and Lehnert, W., 2003, "Diffusion Media
Materials and Characterisation," Handbook of Fuel Cells: Fundamentals, Technology,
and Applications, W. Vielstich, A. Lamm, and H. Gasteiger, eds., Wiley, Hoboken, N.J.
[16] Middelman, E., Kout, W., Vogelaar, B., Lenssen, J., and de Waal, E., 2003, "Bipolar
Plates for PEM Fuel Cells," Journal of Power Sources, 118(1), pp. 44-46.
[17] Mench, M. M., 2008, "Basic Electrochemical Principles," Fuel Cell Engines, John
Wiley & Sons, Inc., pp. 29-61.
[18] Jiang, Z., and Jiang, Z.-J., 2011, "Carbon Nanotubes Supported Metal Nanoparticles
for the Applications in Proton Exchange Membrane Fuel Cells (PEMFCs)," Carbon
Nanotubes - Growth and Applications, D. M. Naraghi, ed., InTech.
[19] Wang, L., and Liu, H., 2004, "Performance Studies of PEM Fuel Cells with
Interdigitated Flow Fields," Journal of Power Sources, 134(2), pp. 185-196.
[20] Kowal, J. J., Turhan, A., Heller, K., Brenizer, J., and Mench, M. M., 2006, "Liquid
Water Storage, Distribution, and Removal from Diffusion Media in PEFCS," Journal of
Electrochemical Society, 153(10), pp. A1971-A1978.
[21] Li, H., Tang, Y., Wang, Z., Shi, Z., Wu, S., Song, D., Zhang, J., Fatih, K., Zhang, J.,
Wang, H., Liu, Z., Abouatallah, R., and Mazza, A., 2008, "A Review of Water Flooding
Issues in the Proton Exchange Membrane Fuel Cell," Journal of Power Sources, 178, pp.
103–117.
[22] Barbir, F., Gorgun, H., and Wang, X., 2005, "Relationship Between Pressure Drop
and Cell Resistance as a Diagnostic Tool for PEM Fuel Cells," Journal of Power Sources,
141, pp. 96–101.
[23] Nguyen, T. V., and Knobbe, M. W., 2003, "A Liquid Water Management Strategy
for PEM Fuel Cell Stacks," Journal of Power Sources, 114 pp. 70-79.
[24] Owejan, J. P., Trabold, T. A., Gagliardo, J. J., Jacobson, D. L., Carter, R. N.,
Hussey, D. S., and Arif, M., 2007, "Voltage Instability in a Simulated Fuel Cell Stack
Correlated to Cathode Water Accumulation," Journal of Power Sources, 171, pp. 626-
633.
[25] He, W., Lin, G., and Van Nguyen, T., 2003, "Diagnostic Tool to Detect Electrode
Flooding in Proton Exchange Membrane Fuel Cells," AIChE Journal, 49, pp. 3221-3228.
[26] Cha, S. W., O‟Hayre, R., Lee, S. J., Saito, Y., and Prinz, F. B., 2004, "Geometric
Scale Effect of Flow Channels on Performance of Fuel Cells," Jounal of The
Electrochemical Society, pp. A1856-A1864.
- 181 -
[27] Whyman, G., Bormashenko, E., and Stein, T., 2008, "The Rigorous Derivation of
Young, Cassie-Baxter and Wenzel Equations and the Analysis of the Contact Angle
Hysteresis Phenomenon," Chemical Physics Letters, 450(4-6), pp. 355-359.
[28] Carey, V. P., 1992, "Liquid-Vapor Phase-Change Phenomena," Taylor and Francis,
Bristol, PA.
[29] Fang, C., Hidrovo, C., Wang, F. M., Eaton, J., and Goodson, K., 2008, "3-D
Numerical Simulation of Contact Angle Hysteresis for Microscale Two Phase Flow,"
International Journal of Multiphase Flow, 34(7), pp. 690-705.
[30] Wenzel, R. N., 1949, "Surface Roughness and Contact Angle," The Journal of
Physical and Colloid Chemistry, 53(9), pp. 1466-1467.
[31] Quéré, D., Di Meglio, J.-M., and Brochard-Wyart, F., 1988, "Wetting of Fibers :
Theory and Experiments," Revue de Physique Appliquée, 23(6), pp. 1023-1030.
[32] Bhushan, B., Nosonovsky, M., and Chae Jung, Y., 2007, "Towards Optimization of
Patterned Superhydrophobic Surfaces," Journal of The Royal Society Interface, 4, pp.
643-648.
[33] Quéré, D., 2008, "Wetting and Roughness," Annual Review of Materials Research,
38(1), pp. 71-99.
[34] Cassie, A. B. D., 1948, "Contact Angles," Discussions of the Faraday Society, 3, pp.
11-16.
[35] Wray, P., 2011, "Ceramic Tech Today (AcerS Ceramic Materials, Applications and
Business Blog)," http://ceramics.org/ceramictechtoday/2011/01/20/extreme-caution-
suggested-superhydrophobic-surfaces-may-have-weak-icephobic-properties/.
[36] Drelich, J., and Miller, J. D., 1994, "The Effect of Solid Surface Heterogeneity and
Roughness on the Contact Angle/Drop (Bubble) Size Relationship," Journal of Colloid
and Interface Science, 164(1), pp. 252-259.
[37] Kwon, Y., Patankar, N., Choi, J., and Lee, J., 2009, "Design of Surface Hierarchy
for Extreme Hydrophobicity," Langmuir, 25(11), pp. 6129-6136.
[38] Shirtcliffe, N. J., McHale, G., Newton, M. I., Chabrol, G., and Perry, C. C., 2004,
"Dual-Scale Roughness Produces Unusually Water-Repellent Surfaces," Advanced
Materials, 16(21), pp. 1929-1932.
[39] Patankar, N. A., 2004, "Mimicking the Lotus Effect: Influence of Double
Roughness Structures and Slender Pillars," Langmuir, 20(19), pp. 8209-8213.
[40] Gao, X., Yan, X., Yao, X., Xu, L., Zhang, K., Zhang, J., Yang, B., and Jiang, L.,
2007, "The Dry-Style Antifogging Properties of Mosquito Compound Eyes and Artificial
Analogues Prepared by Soft Lithography," Advanced Materials, 19(17), pp. 2213-2217.
[41] Gao, L., and McCarthy, T. J., 2007, "How Wenzel and Cassie Were Wrong,"
Langmuir, 23(7), pp. 3762-3765.
- 182 -
[42] Gao, and McCarthy, T. J., 2007, "Reply to “Comment on How Wenzel and Cassie
Were Wrong by Gao and McCarthy”," Langmuir, 23(26), pp. 13243-13243.
[43] Chang-Hwan, C., and Chang-Jin, K., 2006, "Fabrication of a Dense Array of Tall
Nanostructures over a Large Sample Area with Sidewall Profile and Tip Sharpness
Control," Nanotechnology, 17(21), p. 5326.
[44] Dorrer, C., and Rühe, J., 2008, "Wetting of Silicon Nanograss: From
Superhydrophilic to Superhydrophobic Surfaces," Advanced Materials, 20(1), pp. 159-
163.
[45] Autumn, K., and Hansen, W., 2006, "Ultrahydrophobicity Indicates a Non-Adhesive
Default State in Gecko Setae," Journal of Comparative Physiology A: Neuroethology,
Sensory, Neural, and Behavioral Physiology, 192(11), pp. 1205-1212.
[46] Gao, L., and McCarthy, T. J., 2006, "Contact Angle Hysteresis Explained,"
Langmuir, 22(14), pp. 6234-6237.
[47] Extrand, C. W., 2003, "Contact Angles and Hysteresis on Surfaces with Chemically
Heterogeneous Islands," Langmuir, 19(9), pp. 3793-3796.
[48] Extrand, C. W., and Kumagai, Y., 1997, "An Experimental Study of Contact Angle
Hysteresis," Journal of Colloid and Interface Science, 191(2), pp. 378-383.
[49] Bartell, F. E., and Shepard, J. W., 1953, "Surface Roughness as Related to
Hysteresis of Contact Angles. II. The Systems Paraffin–3 Molar Calcium Chloride
Solution–Air and Paraffin–Glycerol–Air," The Journal of Physical Chemistry, 57(4), pp.
455-458.
[50] Nosonovsky, M., 2007, "Multiscale Roughness and Stability of Superhydrophobic
Biomimetic Interfaces," Langmuir, 23(6), pp. 3157-3161.
[51] Drelich, J., and Miller, J. D., 1993, "Modification of the Cassie Equation,"
Langmuir, 9(2), pp. 619-621.
[52] Milne, A. J. B., Elliott, J. A. W., Zabeti, P., Zhou, J., and Amirfazli, A., 2011,
"Model and Experimental Studies for Contact Angles of Surfactant Solutions on Rough
and Smooth Hydrophobic Surfaces," Physical Chemistry Chemical Physics, 13(36), pp.
16208-16219.
[53] Choi, W., Tuteja, A., Mabry, J. M., Cohen, R. E., and McKinley, G. H., 2009, "A
Modified Cassie–Baxter Relationship to Explain Contact Angle Hysteresis and
Anisotropy on Non-Wetting Textured Surfaces," Journal of Colloid and Interface
Science, 339(1), pp. 208-216.
[54] Cheng, Y.-T., and Rodak, D. E., 2005, "Is the Lotus Leaf Superhydrophobic?,"
Applied Physics Letters, 86(14), pp. 144101-144103.
[55] Bico, J., Thiele, U., and Quéré, D., 2002, "Wetting of Textured Surfaces," Colloids
and Surfaces A: Physicochemical and Engineering Aspects, 206(1–3), pp. 41-46.
- 183 -
[56] Nosonovsky, M., 2007, "On the Range of Applicability of the Wenzel and Cassie
Equations," Langmuir, 23(19), pp. 9919-9920.
[57] Li, W., and Amirfazli, A., 2007, "Microtextured Superhydrophobic Surfaces: A
Thermodynamic Analysis," Advances in Colloid and Interface Science, 132(2), pp. 51-
68.
[58] Marmur, A., 2006, "Soft Contact: Measurement and Interpretation of Contact
Angles," Soft Matter, 2(1), pp. 12-17.
[59] Yoshimitsu, Z., Nakajima, A., Watanabe, T., and Hashimoto, K., 2002, "Effects of
Surface Structure on the Hydrophobicity and Sliding Behavior of Water Droplets,"
Langmuir, 18(15), pp. 5818-5822.
[60] McHale, G., Aqil, S., Shirtcliffe, N. J., Newton, M. I., and Erbil, H. Y., 2005,
"Analysis of Droplet Evaporation on a Superhydrophobic Surface," Langmuir, 21(24),
pp. 11053-11060.
[61] Shirtcliffe, N. J., McHale, G., Newton, M. I., and Perry, C. C., 2005, "Wetting and
Wetting Transitions on Copper-Based Super-Hydrophobic Surfaces," Langmuir, 21(3),
pp. 937-943.
[62] Thiele, U., Brusch, L., Bestehorn, M., and Bär, M., 2003, "Modelling Thin-Film
Dewetting on Structured Substrates and Templates: Bifurcation Analysis and Numerical
Simulations," The European Physical Journal E: Soft Matter and Biological Physics,
11(3), pp. 255-271.
[63] Herminghaus, S., 2000, "Roughness-Induced Non-Wetting," Europhysics Letter,
52(2), pp. 165-170.
[64] Shibuichi, S., Onda, T., Satoh, N., and Tsujii, K., 1996, "Super Water-Repellent
Surfaces Resulting from Fractal Structure," The Journal of Physical Chemistry, 100(50),
pp. 19512-19517.
[65] He, B., Lee, J., and Patankar, N. A., 2004, "Contact Angle Hysteresis on Rough
Hydrophobic Surfaces," Colloids and Surfaces A: Physicochemical and Engineering
Aspects, 248(1–3), pp. 101-104.
[66] Barthlott, W., and Neinhuis, C., 1997, "Purity of the Sacred Lotus, or Escape from
Contamination in Biological Surfaces," Planta, 202(1), pp. 1-8.
[67] Patankar, N. A., 2004, "Transition Between Superhydrophobic States on Rough
Surfaces," Langmuir, 20(17), pp. 7097-7102.
[68] Liu, B., and Lange, F. F., 2006, "Pressure Induced Transition Between
Superhydrophobic States: Configuration Diagrams and Effect of Surface Feature Size,"
Journal of Colloid and Interface Science, 298(2), pp. 899-909.
- 184 -
[69] Jeong, H. E., Lee, S. H., Kim, J. K., and Suh, K. Y., 2006, "Nanoengineered
Multiscale Hierarchical Structures with Tailored Wetting Properties," Langmuir, 22(4),
pp. 1640-1645.
[70] Bormashenko, E., Bormashenko, Y., Stein, T., Whyman, G., Pogreb, R., and Barkay,
Z., 2007, "Environmental Scanning Electron Microscopy Study of the Fine Structure of
the Triple Line and Cassie−Wenzel Wetting Transition for Sessile Drops Deposited on
Rough Polymer Substrates," Langmuir, 23(8), pp. 4378-4382.
[71] Bormashenko, E., Pogreb, R., Whyman, G., Bormashenko, Y., and Erlich, M., 2007,
"Vibration-Induced Cassie-Wenzel Wetting Transition on Rough Surfaces," Applied
Physics Letters, 90(20), pp. 201917-201912.
[72] Bormashenko, E., Stein, T., Whyman, G., Bormashenko, Y., and Pogreb, R., 2006,
"Wetting Properties of the Multiscaled Nanostructured Polymer and Metallic
Superhydrophobic Surfaces," Langmuir, 22(24), pp. 9982-9985.
[73] Nosonovsky, M., 2007, "Model for Solid-Liquid and Solid-Solid Friction of Rough
Surfaces with Adhesion Hysteresis," The Journal of Chemical Physics, 126(22), pp.
224701-224706.
[74] Ishino, C., and Okumura, K., 2008, "Wetting Transitions on Textured Hydrophilic
Surfaces," The European Physical Journal E: Soft Matter and Biological Physics, 25(4),
pp. 415-424.
[75] Lafuma, A., and Quere, D., 2003, "Superhydrophobic States," Nature Mater, 2(7),
pp. 457-460.
[76] Koishi, T., Yasuoka, K., Fujikawa, S., Ebisuzaki, T., and Zeng, X. C., 2009,
"Coexistence and Transition Between Cassie and Wenzel State on Pillared Hydrophobic
Surface," Proceedings of the National Academy of Sciences, pp. 8435-8440.
[77] He, B., Patankar, N. A., and Lee, J., 2003, "Multiple Equilibrium Droplet Shapes
and Design Criterion for Rough Hydrophobic Surfaces," Langmuir, 19(12), pp. 4999-
5003.
[78] Jung, Y. C., and Bhushan, B., 2008, "Dynamic Effects of Bouncing Water Droplets
on Superhydrophobic Surfaces," Langmuir, 24(12), pp. 6262-6269.
[79] Forsberg, P., Nikolajeff, F., and Karlsson, M., 2011, "Cassie-Wenzel and Wenzel-
Cassie Transitions on Immersed Superhydrophobic Surfaces Under Hydrostatic
Pressure," Soft Matter, 7(1), pp. 104-109.
[80] Bahadur, V., and Garimella, S. V., 2009, "Preventing the Cassie−Wenzel Transition
Using Surfaces with Noncommunicating Roughness Elements," Langmuir, 25(8), pp.
4815-4820.
- 185 -
[81] Daniel, S., Chaudhury, M. K., and de Gennes, P. G., 2005, "Vibration-Actuated
Drop Motion on Surfaces for Batch Microfluidic Processes," Langmuir, 21(9), pp. 4240-
4248.
[82] Celestini, F., and Kofman, R., 2006, "Vibration of Submillimeter Size Supported
Droplets," Physical Review E, 73(4), p. 041602.
[83] Noblin, X., Buguin, A., and Brochard-Wyart, F., 2004, "Vibrated Sessile Drops:
Transition Between Pinned and Mobile Contact Line Oscillations," The European
Physical Journal E: Soft Matter and Biological Physics, 14(4), pp. 395-404.
[84] Meiron, T. S., Marmur, A., and Saguy, I. S., 2004, "Contact Angle Measurement on
Rough Surfaces," Journal of Colloid and Interface Science, 274(2), pp. 637-644.
[85] Concus, P., and Finn, R., 1969, "On the Behavior of a Capillary Surface In a
Wedge," Proceedings of the National Academy of Sciences, 63(2), pp. 292-299.
[86] Concus, P., and Finn, R., 1994, "Capillary Surfaces in a Wedge—Differing Contact
Angles," Microgravity Science and Technology, 7(2), pp. 152-155.
[87] Concus, P., and Finn, R., 1996, "Capillary Wedges Revisited," SIAM Journal on
Mathematical Analysis, 27(1), pp. 56-69.
[88] Owejan, J. P., Gagliardo, J. J., Falta, S. R., and Trabold, T. A., 2009, "Accumulation
and Removal of Liquid Water in Proton Exchange Membrane Fuel Cells," Journal of The
Electrochemical Society, 156(12), pp. B1475-B1483.
[89] Rath, C. D., and Kandlikar, S. G., 2011, "Effct of Channel Geometry on Two-Phase
Flow Structure in Fuel Cell Gas Channels," Proceedings of the ASME 2011 9th
International Conference on Nanochannels, Microchannels, and MinichannelsEdmonton,
Alberta, CANADA.
[90] Rath, C. D., and Kandlikar, S. G., 2011, "Liquid Filling in a Corner with a Fibrous
Wall—An Application to Two-Phase Flow in PEM Fuel Cell Gas Channels," Colloids
and Surfaces A: Physicochemical and Engineering Aspects, 384(1-3), pp. 653-660.
[91] Gopalan, P., and Kandlikar, S. G., 2012, "Droplet-Sidewall Dynamic Interactions in
PEMFC Gas Channels," Journal of The Electrochemical Society, 159(8), pp. F468-F475.
[92] Gopalan, P., and Kandlikar, S. G., 2013, "Effect of Channel Material on Water
Droplet Dynamics in a PEMFC Gas Channel," Journal of The Electrochemical Society,
160(6), pp. F487-F495.
[93] Gopalan, P., and Kandlikar, S. G., 2012, "Effect of Channel Materials on the
Behavior of Water Droplet Emerging from GDL into PEMFC Gas Channels," ECS
Transactions, 50(2), pp. 503-512.
[94] Gopalan, P., and Kandlikar, S. G., 2011, "Investigation of Water Droplet Interaction
with the Sidewalls of the Gas Channel in a PEM Fuel Cell in the Presence of Gas Flow,"
ECS Transactions, 41(1), pp. 479-488.
- 186 -
[95] Das, S., Waghmare, P. R., Fan, M., Gunda, N. S. K., Roy, S. S., and Mitra, S. K.,
2012, "Dynamics of Liquid Droplets in an Evaporating Drop: Liquid Droplet "Coffee
Stain" Effect," RSC Advances, 2(22), pp. 8390-8401.
[96] Owejan, J. P., Trabold, T. A., Jacobson, D. L., Baker, D. R., Hussey, D. S., and Arif,
M., 2006, "In Situ investigation of Water Transport in an Operating PEM Fuel Cell Using
Neutron Radiography: Part 2 – Transient Water Accumulation in an Interdigitated
Cathode Flow Field," International Journal of Heat and Mass Transfer, 49(25–26), pp.
4721-4731.
[97] Satija, R., Jacobson, D. L., Arif, M., and Werner, S. A., 2004, "In Situ Neutron
Imaging Technique for Evaluation of Water Management Systems in Operating PEM
Fuel Cells," Journal of Power Sources, 129(2), pp. 238-245.
[98] Bellows, R. J., Lin, M.Y., Arif, M., Thompson, A.K., and Jacobson, D.L., 1999,
"Neutron Imaging Technique for In Situ Measurement of Water Transport Gradients
within Nafion in Polymer Electrolyte Fuel Cells," Journal of The Electrochemical
Society, 146(3), pp. 1099-1103.
[99] Chuang, P. A., Turhan, A., Heller, A. K., Brenizer, J. S., Trabold, T. A., and Mench,
M. M., 2005, "The Nature of Flooding and Drying in Polymer Electrolyte Fuel Cells,"
ASME Conference Proceedings, 2005(37645), pp. 31-37.
[100] Manke, I., Hartnig, C., Grunerbel, M., Lehnert, W., Kardjilov, N., Haibel, A.,
Hilger, A., Banhart, J., and Riesemeier, H., 2007, "Investigation of Water Evolution and
Transport in Fuel Cells with High Resolution Synchrotron X-Ray Radiography," Applied
Physics Letters, 90(17), pp. 174105-174103.
[101] Bazylak, A., Sinton, D., and Djilali, N., 2008, "Dynamic Water Transport and
Droplet Emergence in PEMFC Gas Diffusion Layers," Journal of Power Sources, 176(1),
pp. 240-246.
[102] Feindel, K. W., Bergens, S. H., and Wasylishen, R. E., 2007, "The Influence of
Membrane Electrode Assembly Water Content on the Performance of a Polymer
Electrolyte Membrane Fuel Cell as Investigated by 1H NMR Microscopy," Physical
Chemistry Chemical Physics, 9(15), pp. 1850-1857.
[103] Tsushima, S., Nanjo, T., Nishida, K., and Hirai, S., 2006, "Investigation of the
Lateral Water Distribution in a Proton Exchange Membrane in Fuel Cell Operation by
3D-MRI," ECS Transactions, 1(6), pp. 199-205.
[104] Tsushima, S., Teranishi, K., and Hirai, S., 2004, "Magnetic Resonance Imaging of
the Water Distribution within a Polymer Electrolyte Membrane in Fuel Cells,"
Electrochemical and Solid-State Letters, 7(9), pp. A269-A272.
[105] Dunbar, Z., and Masel, R. I., 2007, "Quantitative MRI Study of Water Distribution
During Operation of a PEM Fuel Cell Using Teflon® Flow Fields," Journal of Power
Sources, 171(2), pp. 678-687.
- 187 -
[106] Litster, S., Sinton, D., and Djilali, N., 2006, "Ex Situ Visualization of Liquid Water
Transport in PEM Fuel Cell Gas Diffusion Layers," Journal of Power Sources, 154(1),
pp. 95-105.
[107] Pasaogullari, U., and Wang, C. Y., 2004, "Liquid Water Transport in Gas Diffusion
Layer of Polymer Electrolyte Fuel Cells," Journal of The Electrochemical Society,
151(3), pp. A399-A406.
[108] Daino, M. M., and Kandlikar, S. G., 2009, "Evaluation of Imaging Techniques
Applied to Water Management Research in PEMFCs," ASME 2009 7th International
Conference on Nanochannels, Microchannels, and Minichannels, ASME, Pohang, South
Korea, pp. 467-479.
[109] Kandlikar, S. G., Lu, Z., Domigan, W. E., White, A. D., and Benedict, M. W.,
2009, "Measurement of Flow Maldistribution in Parallel Channels and its Application to
Ex Situ and In Situ Experiments in PEMFC Water Management Studies," International
Journal of Heat and Mass Transfer, 52(7–8), pp. 1741-1752.
[110] Kandlikar, S. G., Lu, Z., Lin, T. Y., Cooke, D., and Daino, M., 2009, "Uneven Gas
Diffusion Layer Intrusion in Gas Channel Arrays of Proton Exchange Membrane Fuel
Cell and its Effects on Flow Distribution," Journal of Power Sources, 194(1), pp. 328-
337.
[111] Tuber, K., Pocza, D., and Hebling, C., 2003, "Visualization of Water Buildup in the
Cathode of a Transparent PEM Fuel Cell," Journal of Power Sources, 124(2), pp. 403-
414.
[112] Metz, T., Paust, N., Müller, C., Zengerle, R., and Koltay, P., 2008, "Passive Water
Removal in Fuel Cells by Capillary Droplet Actuation," Sensors and Actuators A:
Physical, 143(1), pp. 49-57.
[113] Ous, T., and Arcoumanis, C., 2009, "The Formation of Water Droplets in an Air-
Breathing PEMFC," International Journal of Hydrogen Energy, 34(8), pp. 3476-3487.
[114] Esposito, A., Montello, A. D., Guezennec, Y. G., and Pianese, C., 2010,
"Experimental Investigation of Water Droplet–Air Flow Interaction in a Non-Reacting
PEM Fuel Cell Channel," Journal of Power Sources, 195(9), pp. 2691-2699.
[115] Lu, Z., White, A. D., Pelaez, J., Hardbarger, M., Domigan, W., Sergi, J. M., and
Kandlikar, S. G., 2008, "Investigation of Water Transport in an Ex Situ Experimental
Facility Modelled on an Actual DOE Automotive Target Complient Fuel Cell," ASME
2008 6th International Conference on Nanochannels, Microchannels, and Minichannels
Darmstadt, Germany, pp. 1295-1303.
[116] Kandlikar, S. G., Lu, Z., Domigan, W. E., White, A. D., and Benedict, M. W.,
2009, "Measurement of flow maldistribution in parallel channels and its application to
ex-situ and in-situ experiments in PEMFC water management studies," International
Journal of Heat and Mass Transfer, 52(7–8), pp. 1741-1752.
- 188 -
[117] Lu, Z., Kandlikar, S. G., Rath, C., Grimm, M., Domigan, W., White, A. D.,
Hardbarger, M., Owejan, J. P., and Trabold, T. A., 2009, "Water Management Studies in
PEM Fuel Cells, Part II: Ex Situ Investigation of Flow Maldistribution, Pressure Drop
and Two-Phase Flow Pattern in Gas Channels," International Journal of Hydrogen
Energy, 34(8), pp. 3445-3456.
[118] Lu, Z., Daino, M. M., Rath, C., and Kandlikar, S. G., 2010, "Water Management
Studies in PEM Fuel Cells, Part III: Dynamic Breakthrough and Intermittent Drainage
Characteristics from GDLs with and without MPLs," International Journal of Hydrogen
Energy, 35(9), pp. 4222-4233.
[119] Lu, Z., Rath, C., Zhang, G., and Kandlikar, S. G., 2011, "Water Management
Studies in PEM Fuel Cells, Part IV: Effects of Channel Surface Wettability, Geometry
and Orientation on the Two-Phase Flow in Parallel Gas Channels," International Journal
of Hydrogen Energy, 36(16), pp. 9864-9875.
[120] Zhang, F. Y., Yang, X. G., and Wang, C. Y., 2006, "Liquid Water Removal from a
Polymer Electrolyte Fuel Cell," Journal of The Electrochemical Society, 153(2), pp.
A225-A232.
[121] Wang, C.-Y., 2004, "Fundamental Models for Fuel Cell Engineering," Chemical
Reviews, 104(10), pp. 4727-4766.
[122] Gostick, J. T., Fowler, M. W., Ioannidis, M. A., Pritzker, M. D., Volfkovich, Y. M.,
and Sakars, A., 2006, "Capillary Pressure and Hydrophilic Porosity in Gas Diffusion
Layers for Polymer Electrolyte Fuel Cells," Journal of Power Sources, 156(2), pp. 375-
387.
[123] Wang, K., Lu, Y. C., Xu, J. H., and Luo, G. S., 2009, "Determination of Dynamic
Interfacial Tension and its Effect on Droplet Formation in the T-Shaped Microdispersion
Process," Langmuir, 25(4), pp. 2153-2158.
[124] Cho, S. C., Wang, Y., and Chen, K. S., 2012, "Droplet Dnamics in a Polymer
Electrolyte Fuel Cell Gas Flow Channel: Forces, Deformation and Detachment. II:
Comparisons of Analytical Solution with Numerical and Experimental Results," Journal
of Power Sources, 210, pp. 191-197.
[125] Cho, S. C., Wang, Y., and Chen, K. S., 2012, "Droplet Dynamics in a Polymer
Electrolyte Fuel Cell Gas Flow Channel: Forces, Deformation, and Detachment. I:
Theoretical and Numerical Analyses," Journal of Power Sources, 206, pp. 119-128.
[126] Nam, J. H., and Kaviany, M., 2003, "Effective Diffusivity and Water-Saturation
Distribution in Single- and Two-Layer PEMFC Diffusion Medium," International Journal
of Heat and Mass Transfer, 46(24), pp. 4595-4611.
[127] Weber, A. Z., and Newman, J., 2004, "Modeling Transport in Polymer-Electrolyte
Fuel Cells," Chemical Reviews, 104(10), pp. 4679-4726.
- 189 -
[128] Chen, K. S., Hickner, M. A., and Noble, D. R., 2005, "Simplified Models for
Predicting the Onset of Liquid Water Droplet Instability at the Gas Diffusion Layer/Gas
Flow Channel Interface," International Journal of Energy Research, 29(12), pp. 1113-
1132.
[129] Golpaygan, A., and Ashgriz, N., 2005, "Effects of Oxidant Fluid Properties on the
Mobility of Water Droplets in the Channels of PEM Fuel Cell," International Journal of
Energy Research, 29(12), pp. 1027-1040.
[130] Theodorakakos, A., Ous, T., Gavaises, M., Nouri, J. M., Nikolopoulos, N., and
Yanagihara, H., 2006, "Dynamics of Water Droplets Detached from Porous Surfaces of
Relevance to PEM Fuel Cells," Journal of Colloid and Interface Science, 300(2), pp. 673-
687.
[131] Kumbur, E. C., Sharp, K. V., and Mench, M. M., 2006, "Liquid Droplet Behavior
and Instability in a Polymer Electrolyte Fuel Cell Flow Channel," Journal of Power
Sources, 161(1), pp. 333-345.
[132] Das, P. K., Grippin, A., Kwong, A., and Weber, A. Z., 2012, "Liquid-Water-
Droplet Adhesion-Force Measurements on Fresh and Aged Fuel-Cell Gas-Diffusion
Layers," Journal of The Electrochemical Society, 159(5), pp. B489-B496.
[133] Owejan, J. P., Trabold, T. A., Jacobson, D. L., Arif, M., and Kandlikar, S. G., 2007,
"Effects of Flow Field and Diffusion Layer Properties on Water Accumulation in a PEM
Fuel Cell," International Journal of Hydrogen Energy, 32(17), pp. 4489-4502.
[134] Kimball, E., Whitaker, T., Kevrekidis, Y. G., and Benziger, J. B., 2008, "Drops,
Slugs, and Flooding in Polymer Electrolyte Membrane Fuel Cells," AIChE Journal,
54(5), pp. 1313-1332.
[135] Lee, J., Hinebaugh, J., and Bazylak, A., 2013, "Visualizing Liquid Water in PEM
Fuel Cells Using X-ray Based Radiography in through-and In-Planes," ECS
MeetingToronto, ON, p. 125.
[136] Allen, J. S., Son, S. Y., and Collicott, S. H., 2010, "Proton Exchange Membrane
Fuel Cell (PEMFC) Flow-Field Design for Improved Water Management," Handbook of
Fuel Cells, John Wiley & Sons, Ltd.
[137] Kimball, E. E., Benziger, J. B., and Kevrekidis, Y. G., 2010, "Effects of GDL
Structure with an Efficient Approach to the Management of Liquid Water in PEM Fuel
Cells," Fuel Cells, 10(4), pp. 530-544.
[138] Yi, Y., Zheng-kai, T., Zhi-gang, Z., and Mu, P., 2012, "Gravity Effect on the
Performance of PEM Fuel Cell Stack with Different Gas Manifold Positions,"
International Journal of Energy Research, 36(7), pp. 845-855.
[139] Chen, S., and Wu, Y., 2010, "Gravity Effect on Water Discharged in PEM Fuel
Cell Cathode," International Journal of Hydrogen Energy, 35(7), pp. 2888-2893.
- 190 -
[140] Cheah, M. J., Kevrekidis, I. G., and Benziger, J. B., 2013, "Water Slug Formation
and Motion in Gas Flow Channels: The Effects of Geometry, Surface Wettability, And
Gravity," Langmuir, 29(31), pp. 9918-9934.
[141] Hao, L., and Cheng, P., 2010, "An Analytical Model for Micro-Droplet Steady
Movement on the Hydrophobic Wall of a Micro-Channel," International Journal of Heat
and Mass Transfer, 53(5–6), pp. 1243-1246.
[142] Hao, L., and Cheng, P., 2009, "Lattice Boltzmann Simulations of Liquid Droplet
Dynamic Behavior on a Hydrophobic Surface of a Gas Flow Channel," Journal of Power
Sources, 190(2), pp. 435-446.
[143] Ha, T., Kim, B., Kim, H.-S., and Min, K., 2008, "Investigation on the Liquid Water
Droplet Instability in a Simulated Flow Channel of PEM Fuel Cell," J Mech Sci Technol,
22(5), pp. 1030-1036.
[144] De Luca, G., Di Maio, F. P., Di Renzo, A., and Drioli, E., 2008, "Droplet
Detachment in Cross-Flow Membrane Emulsification: Comparison Among Torque and
Force Based Models," Chemical Engineering and Processing: Process Intensification,
47(7), pp. 1150-1158.
[145] Yang, J.-T., Yang, Z.-H., Chen, C.-Y., and Yao, D.-J., 2008, "Conversion of
Surface Energy and Manipulation of a Single Droplet across Micropatterned Surfaces,"
Langmuir, 24(17), pp. 9889-9897.
[146] He, G., Ming, P., Zhao, Z., Abudula, A., and Xiao, Y., 2007, "A Two-Fluid Model
for Two-Phase Flow in PEMFCs," Journal of Power Sources, 163(2), pp. 864-873.
[147] Spernjak, D., Advani, S., and Prasad, A. K., 2006, "Experimental Investigation of
Liquid Water Formation and Transport in a Transparent Single-Serpentine PEM Fuel
Cell," ASME Conference Proceedings, ASME, pp. 453-461.
[148] Zhu, X., Sui, P. C., and Djilali, N., 2008, "Three-Dimensional Numerical
Simulations of Water Droplet Dynamics in a PEMFC Gas Channel," Journal of Power
Sources, 181(1), pp. 101-115.
[149] Polverino, P., Esposito, A., and Pianese, C., 2013, "Experimental Validation of a
Lumped Model of Single Droplet Deformation, Oscillation and Detachment on the GDL
Surface of a PEM Fuel Cell," International Journal of Hydrogen Energy, 38(21), pp.
8934-8953.
[150] Wang, Z. H., Wang, C. Y., and Chen, K. S., 2001, "Two-phase Flow and Transport
in the Air Cathode of Proton Exchange Membrane Fuel Cells," Journal of Power Sources,
94(1), pp. 40-50.
[151] Sergi, J. M., Lu, Z., and Kandlikar, S. G., "In Situ Characterization of Two-Phase
Flow in the Cathode Channels of an Operating PEM Fuel Cell with Visual Access," Proc.
Proceeding of the seventh international conference on nanochannels, microchannels, and
minichannels, pp. 303-311.
- 191 -
[152] Cai, Y. H., Hu, J., Ma, H. P., Yi, B. L., and Zhang, H. M., 2006, "Effects of
Hydrophilic/Hydrophobic Properties on the Water Behavior in the Microchannels of a
Proton Exchange Membrane Fuel Cell," Journal of Power Sources, 161(2), pp. 843-848.
[153] Quan, P., and Lai, M.-C., 2007, "Numerical Study of Water Management in the Air
Flow Channel of a PEM Fuel Cell Cathode," Journal of Power Sources, 164(1), pp. 222-
237.
[154] Zhu, X., Liao, Q., Sui, P. C., and Djilali, N., 2010, "Numerical Investigation of
Water Droplet Dynamics in a Low-Temperature Fuel Cell Microchannel: Effect of
Channel Geometry," Journal of Power Sources, 195(3), pp. 801-812.
[155] Akhtar, N., Qureshi, A., Scholta, J., Hartnig, C., Messerschmidt, M., and Lehnert,
W., 2009, "Investigation of Water Droplet Kinetics and Optimization of Channel
Geometry for PEM Fuel Cell Cathodes," International Journal of Hydrogen Energy,
34(7), pp. 3104-3111.
[156] Hwang, C.-C., Ho, J.-R., and Lee, S.-C., 1999, "Molecular Dynamics of a Liquid
Drop Spreading in a Corner Formed by Two Planar Substrates," Physical Review E,
60(5), pp. 5693-5698.
[157] Patankar, N. A., 2003, "On the Modeling of Hydrophobic Contact Angles on
Rough Surfaces," Langmuir, 19(4), pp. 1249-1253.
[158] Kalinin, Y. V., Berejnov, V., and Thorne, R. E., 2009, "Contact Line Pinning by
Microfabricated Patterns: Effects of Microscale Topography," Langmuir, 25(9), pp.
5391-5397.
[159] Gopalan, P., and Kandlikar, S. G., "Contact Line Characteristics of Liquid-Gas
Interfaces Over Confined/Structured Surfaces," Proc. Proceedings of the 3rd European
Conference on Microfluidics - Microfluidics 2012.
[160] Gopalan, P., and Kandlikar, S. G., 2013, "Contact Line Characteristics of Liquid-
Gas Interfaces Over Confined/Structured Surfaces," Microfluidics and Nanofluidics, p. In
Press.
[161] Gopalan, P., and Kandlikar, S. G., 2014, "Modeling Dynamic Interaction Between
an Emerging Water Droplet and the Sidewall of a Trapezoidal Channel," Colloids and
Surfaces A: Physicochemical and Engineering Aspects, 441, pp. 262-274.
[162] Voinov, O. V., 2000, "Wetting Line Dynamics in the Process of Drop Spreading,"
Journal of Colloid and Interface Science, 226(1), pp. 22-28.
[163] de Gennes, P. G., 1985, "Wetting: Statics and Dynamics," Reviews of Modern
Physics, 57(3), pp. 827-863.
[164] Bonn, D., Eggers, J., Indekeu, J., Meunier, J., and Rolley, E., 2009, "Wetting and
Spreading," Reviews of Modern Physics, 81(2), pp. 739-805.
- 192 -
[165] Kalin, M., and Polajnar, M., 2013, "The Correlation Between the Surface Energy,
the Contact Angle and the Spreading Parameter, and their Relevance for the Wetting
Behaviour of DLC with Lubricating Oils," Tribology International, 66(0), pp. 225-233.
[166] Cazabat, A. M., and Stuart, M. A. C., 1989, "The Dynamics of Wetting,"
Physicochemical Hydrodynamics NATO ASI Series, 174, pp. 709-720.
[167] Cazabat, A.-M., 1987, "How Does a Droplet Spread?," Contemporary Physics,
28(4), pp. 347-364.
[168] Ball, P., 1989, "Spread it About," Nature, 338, pp. 624-625.
[169] Leger, L., and Joanny, J. F., 1992, "Liquid Spreading," Reports on Progress in
Physics, 55(4), p. 431.
[170] Forcada, M. L., and Mate, C. M., 1993, "Molecular Layering During Evaporation
of Ultrathin Liquid Films," Nature, 363, pp. 527-529.
[171] Gopalan, P., and Kandlikar, S. G., 2014, "Effect of Channel Materials and
Trapezoidal Corner Angles on Emerging Droplet Behavior in Proton Exchange
Membrane Fuel Cell Gas Channels," Journal of Power Sources, 248, pp. 230-238.
[172] Clift, R., Grace, J., and Weber, M., 1978, "Bubbles, Drops and Particles
Academic," New York, p. 346.
[173] Banerjee, R., and Kandlikar, S. G., 2014, "Liquid Water Quantification in the
Cathode Side Gas Channels of a Proton Exchange Membrane Fuel Cell through Two-
Phase Flow Visualization," Journal of Power Sources, 247, pp. 9-19.
[174] Pérez-Page, M., and Pérez-Herranz, V., 2011, "Effect of the Operation and
Humidification Temperatures on the Performance of a Pem Fuel Cell Stack on Dead-End
Mode," International Journal of Electrochemical Science, 6, pp. 492-505.
[175] Murthy, M., Esayian, M., Lee, W.-k., and Van Zee, J. W., 2003, "The Effect of
Temperature and Pressure on the Performance of a PEMFC Exposed to Transient CO
Concentrations," Journal of Electrochemical Society, 150(1), pp. A-29-A34.
[176] Belkhiri, Z., Zeroual, M., Ben Moussa, H., and Zitouni, B., 2011, "Effect of
Temperature and Water Content on the Performance of PEM Fuel Cell," Revue des
Energies Renouvelables, 14(1), pp. 121-130.
[177] Kim, S., and Hong, I., 2008, "Effects of Humidity and Temperature on a Proton
Exchange Membrane Fuel Cell (PEMFC) Stack," Journal of Industrial and Engineering
Chemistry, 14(3), pp. 357-364.