investigation on practical use of h/v spectral ratio … on practical use of h/v spectral ratio for...
TRANSCRIPT
Investigation on Practical Use of H/V Spectral Ratio for
Microzoning Considering the History of Landform
Development
Microzoning Considering the History of Landform
Developmen
T. Kuriyama Kozo Keikaku Engineering Inc., Tokyo, Japan
N. Ueno, T. Yamamoto & T. Enomoto Kanagawa University, Yokohama, Japan
I. Matsuda Emeritus Professor of Kanto Gakuin University, Yokohama, Japan
M. Navarro University of Almeria,Almeria, Spain
SUMMARY:
The shaking characteristics, predominant period and amplification, due to surface soil structure are very
important for damage estimation for buildings before the earthquake occurrence (Aki, K. 1957). Up to now, we
are using microtremor observation in order to check the purpose of microtremor utilization for seismic
microzoning study and we investigated the predominant period distribution by performing the dense microtremor
observation in Yokohama City, Japan about 6,500 sites dividing 250m interval and analyzed H/V spectra at each
site. And the result is significantly good agreement between the predominant period obtained from H/V spectra
and the general information of surface soil structure. In this paper, we summarized the observed H/V spectra in
Yokohama City and we investigated about the relationship between predominant period and depth of
unconsolidated soil layer considering the history of landform development.
Keywords: H/V Spectral Ratio, Microzoning, History of Landform Development
1. INTRODUCTION
In recent years, disaster prediction studies for damages from earthquakes have been conducted on a
prefectural scale. It is predicted that even more specific disaster prediction studies will be conducted
on a village, town, or city scale in the future as well. Ground shaking characteristics have been
reflected in earthquake proofing design using the response and limit strength design methods that have
come into effect recently. Included in the background behind this type of research activity is realizing
the importance of being able to obtain more detailed information on ground shaking characteristics
that are attributable to ground structures (Matsuzawa T. et al. 2003, Yamamoto T. et al. 2004). It is
particularly important to clarify ground shaking characteristics for subsurface ground layers, which are
evaluated using a wide variety of methods, one of which is through observations of constant
microtremors. The ground shaking characteristics, predominant period and amplification, due to
surface soil structure are very important for damage estimation for buildings before the earthquake
occurrence (Navarro M. 2004). These shaking characteristics, especially predominant period, are able
to calculate by soil structure with shear wave velocity obtained from SPT information and PS logging
Test (Enomoto T. 2000). A simple method for estimation of predominant period of surface soil
structure is to use the H/V spectra based on microtremor measurement and it's very useful and popular
in the world (Yamamoto T. 2007). Up to now, we are using microtremor observation in order to check
the purpose of microtremor utilization for seismic microzoning study and we investigated the
predominant period distribution by performing the dense microtremor observation in Yokohama City,
Japan about 6,500 sites dividing 250m interval and analysed H/V spectra at each site. And the result is
very significantly good agreement between the predominant period obtained from H/V spectra and the
general information of surface soil structure. By the way, the deposit soil materials accumulated on
engineering basement, namely bearing soil layer for buildings, are constituted the geographical
settlement, hill, table land and low land, and the history of landform development is influenced by the
change of sea water level due to glacial period according to the meteorological change of earth and
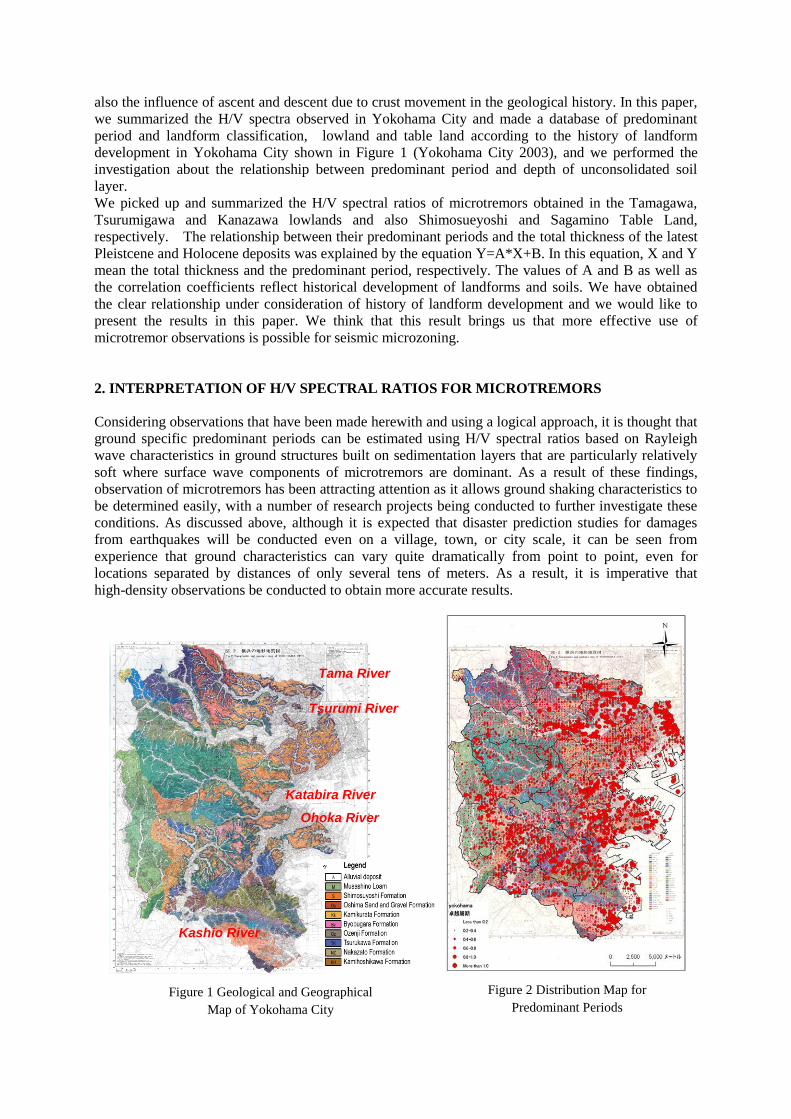
also the influence of ascent and descent due to crust movement in the geological history. In this paper,
we summarized the H/V spectra observed in Yokohama City and made a database of predominant
period and landform classification, lowland and table land according to the history of landform
development in Yokohama City shown in Figure 1 (Yokohama City 2003), and we performed the
investigation about the relationship between predominant period and depth of unconsolidated soil
layer. We picked up and summarized the H/V spectral ratios of microtremors obtained in the Tamagawa,
Tsurumigawa and Kanazawa lowlands and also Shimosueyoshi and Sagamino Table Land,
respectively. The relationship between their predominant periods and the total thickness of the latest
Pleistcene and Holocene deposits was explained by the equation Y=A*X+B. In this equation, X and Y
mean the total thickness and the predominant period, respectively. The values of A and B as well as
the correlation coefficients reflect historical development of landforms and soils. We have obtained
the clear relationship under consideration of history of landform development and we would like to
present the results in this paper. We think that this result brings us that more effective use of
microtremor observations is possible for seismic microzoning.
2. INTERPRETATION OF H/V SPECTRAL RATIOS FOR MICROTREMORS
Considering observations that have been made herewith and using a logical approach, it is thought that
ground specific predominant periods can be estimated using H/V spectral ratios based on Rayleigh
wave characteristics in ground structures built on sedimentation layers that are particularly relatively
soft where surface wave components of microtremors are dominant. As a result of these findings,
observation of microtremors has been attracting attention as it allows ground shaking characteristics to
be determined easily, with a number of research projects being conducted to further investigate these
conditions. As discussed above, although it is expected that disaster prediction studies for damages
from earthquakes will be conducted even on a village, town, or city scale, it can be seen from
experience that ground characteristics can vary quite dramatically from point to point, even for
locations separated by distances of only several tens of meters. As a result, it is imperative that
high-density observations be conducted to obtain more accurate results.
Figure 2 Distribution Map for
Predominant Periods
Tsurumi River
Tama River
Katabira River
Ohoka River
Kashio River
Figure 1 Geological and Geographical
Map of Yokohama City
3. OBSERVATIONS OF HIGH-DENSITY MICROTREMORS FROM STEADY MICROTREMORS
3.1 Observations of High-density Microtremors in Yokohama
The author began to conduct observations of high-density microtremors in Yokohama starting in 2005
with the purpose of clarifying details on ground shaking characteristics. Dividing the entire city of
Yokohama up into sections defined using 250-m-wide meshes, the author observed approximately
6500 different points of those identified, not including those that were unobservable, near the center of
each specified mesh. A servo speedometer was used to measure velocities, with the sampling
frequency set to 100 Hz and the observation time to 180 seconds. Figure 2 shows a distribution map
for predominant periods. The figure displays results for predominant periods corresponding to
topography and geology as well as the ground for the city of Yokohama.
3.2 Relationship between H/V Spectra for Microtremors and Land/Ground Features
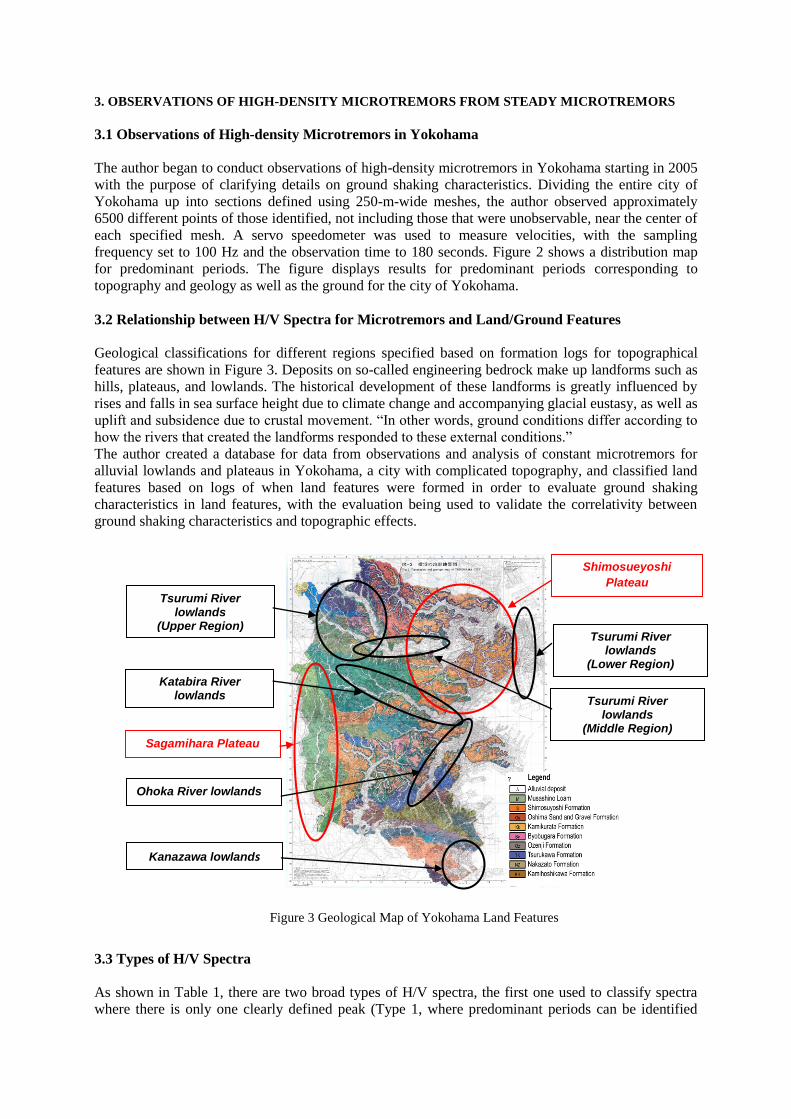
Geological classifications for different regions specified based on formation logs for topographical
features are shown in Figure 3. Deposits on so-called engineering bedrock make up landforms such as
hills, plateaus, and lowlands. The historical development of these landforms is greatly influenced by
rises and falls in sea surface height due to climate change and accompanying glacial eustasy, as well as
uplift and subsidence due to crustal movement. “In other words, ground conditions differ according to
how the rivers that created the landforms responded to these external conditions.”
The author created a database for data from observations and analysis of constant microtremors for
alluvial lowlands and plateaus in Yokohama, a city with complicated topography, and classified land
features based on logs of when land features were formed in order to evaluate ground shaking
characteristics in land features, with the evaluation being used to validate the correlativity between
ground shaking characteristics and topographic effects.
3.3 Types of H/V Spectra
As shown in Table 1, there are two broad types of H/V spectra, the first one used to classify spectra
where there is only one clearly defined peak (Type 1, where predominant periods can be identified
Figure 3 Geological Map of Yokohama Land Features
Shimosueyoshi
Plateau
Sagamihara Plateau
Tsurumi River lowlands
(Upper Region)
Tsurumi River lowlands
(Middle Region)
Tsurumi River lowlands
(Lower Region)
Kanazawa lowlands
Katabira River lowlands
Ohoka River lowlands
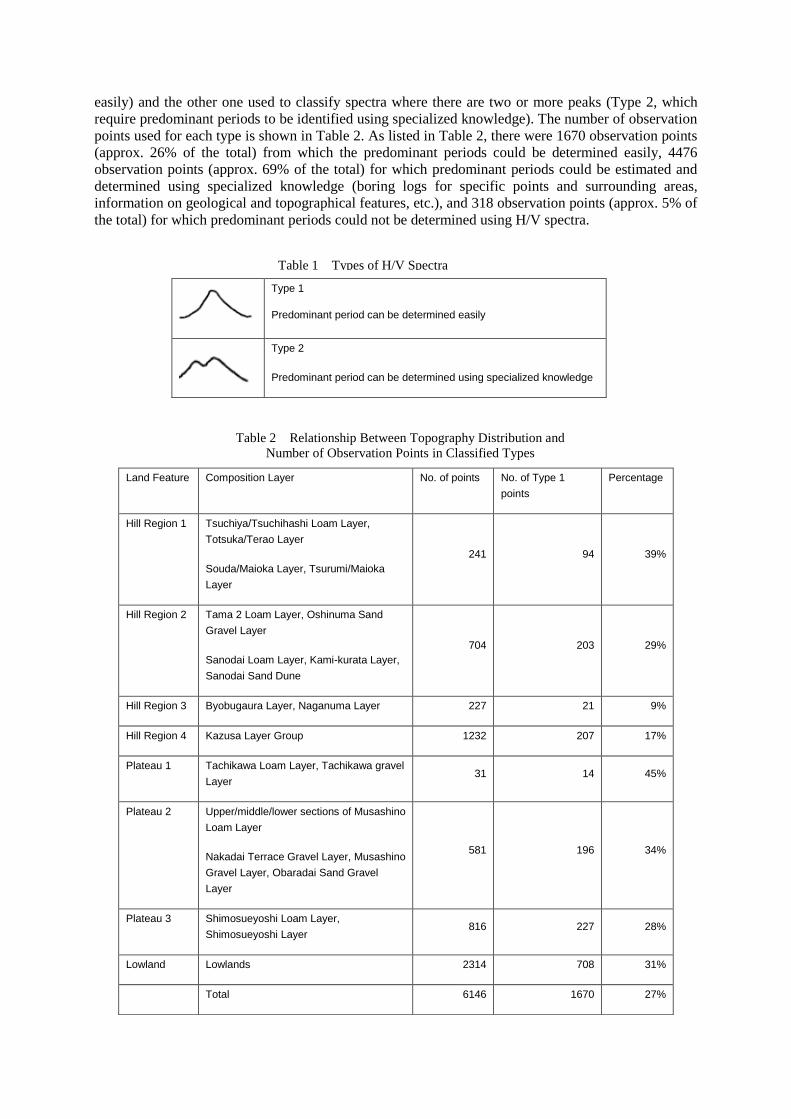
easily) and the other one used to classify spectra where there are two or more peaks (Type 2, which
require predominant periods to be identified using specialized knowledge). The number of observation
points used for each type is shown in Table 2. As listed in Table 2, there were 1670 observation points
(approx. 26% of the total) from which the predominant periods could be determined easily, 4476
observation points (approx. 69% of the total) for which predominant periods could be estimated and
determined using specialized knowledge (boring logs for specific points and surrounding areas,
information on geological and topographical features, etc.), and 318 observation points (approx. 5% of
the total) for which predominant periods could not be determined using H/V spectra.
Type 1
Predominant period can be determined easily
Type 2
Predominant period can be determined using specialized knowledge
Land Feature Composition Layer No. of points No. of Type 1
points
Percentage
Hill Region 1 Tsuchiya/Tsuchihashi Loam Layer,
Totsuka/Terao Layer
Souda/Maioka Layer, Tsurumi/Maioka
Layer
241 94 39%
Hill Region 2 Tama 2 Loam Layer, Oshinuma Sand
Gravel Layer
Sanodai Loam Layer, Kami-kurata Layer,
Sanodai Sand Dune
704 203 29%
Hill Region 3 Byobugaura Layer, Naganuma Layer 227 21 9%
Hill Region 4 Kazusa Layer Group 1232 207 17%
Plateau 1 Tachikawa Loam Layer, Tachikawa gravel
Layer 31 14 45%
Plateau 2 Upper/middle/lower sections of Musashino
Loam Layer
Nakadai Terrace Gravel Layer, Musashino
Gravel Layer, Obaradai Sand Gravel
Layer
581 196 34%
Plateau 3 Shimosueyoshi Loam Layer,
Shimosueyoshi Layer 816 227 28%
Lowland Lowlands 2314 708 31%
Total 6146 1670 27%
Table 2 Relationship Between Topography Distribution and
Number of Observation Points in Classified Types
Table 1 Types of H/V Spectra
3.4 Correspondence to Topographic Classifications
From comparisons of the distribution patterns for Type 1 and Type 2, it can be seen that Type 2
features are present locally in dominant regions whereas Type 1 features cannot be identified in
dominant regions. The ratio of Type 1 observation points was calculated for land features in
Yokohama, which were classified as hills, plateaus, or alluvial lowlands, and it was found that there
was a relatively high rate of Type 1 observation points for Hill Region 1 and Plateau 1, but not, for
example, for Hill Region 3, which had few Type 1 observation points compared to other hill regions.
The percentage of observation points in Yokohama for which the ground predominant periods could
be identified easily using H/V spectra was almost 30%. Including the observation points for which the
predominant periods could be determined using boring logs as well as geological information,
topographical information and ground information for surrounding areas around observation points,
predominant periods can be estimated for approximately 95% of all observation points, which
demonstrates that observation of constant microtremors is an effective method to use to find ground
predominant periods when used in conjunction with classification of regions.
4. APPROACH FROM HISTORICAL DEVELOPMENT OF LANDFORMS AND SOILS
4.1 Methodology
In recent estimations of earthquake damage, velocity and acceleration at the ground surface are found
based on AVS30, which is the average S-wave velocity from the ground to 30 m below the ground
surface. It is extremely costly to measure AVS30 densely with identical accuracy, and so it is
corrected for altitude and distance to rivers, etc. but it is found for each accessible microrelief.
However, there are serious disadvantages in determining AVS30 for each microrelief.
In seismic microzoning targeting the buildings that exist everywhere in cities, deposits on so-called
engineering bedrock is the target on so-called engineering bedrock. These deposits make up landforms
such as hills, plateaus, and lowlands. The historical development of these landforms is greatly
influenced by rises and falls in sea surface height due to climate change and accompanying glacial
eustasy, as well as uplift and subsidence due to crustal movement. In other words, ground conditions
differ according to how the rivers that created the landforms responded to these external conditions.
Specifically, the type of deposit and its distribution, or the distribution of the ground, is determined
according to the sediment transportation ability of the respective river. Therefore, seismic microzoning
must be performed for each plain formed by the respective river and, in terms of microrelief, it is
unreasonable to treat areas in between different plains in the same way. Also, even within the same
plain, the microrelief does not represent the deposits to 30 m below the ground. The microrelief is the
topography forming the ground surface, and it only represents the final stage in the historical
development of the landforms. It does not reflect the state of the ground (deposits) to 30 m below the
surface.
The authors of this paper investigated the practical use of microtremors in seismic microzoning. Here,
considering historical development of landforms, we show that more effective use of microtremor
observations is possible and that microtremor observations are valuable data for seismic microzoning.
4.2 Alluvium thickness and predominant period
Unlike carrying out seismic observation by installing seismometers, it is possible to measure
microtremors at any time in any place and so a large volume of spatially-close data can be obtained.
Predominant periods of approximately 2 seconds and below, which are important in earthquake
damage to the low- and medium-rise buildings common in cities, are considered to be dependent on
the nature (primarily, lithofacies and hardness) and thickness of the deposits in the surface layer.
Therefore, taking alluvium thickness as X (m) and predominant period of microtremor as Y (sec.), the
two are related using the following regression equation:
X=A*Y+B (4.1)
A indicates the contribution ratio of each 1 m of alluvium to the predominant period and is inversely
proportional to S-wave velocity of the alluvium. Also, if B=0, the average S-wave velocity of the
alluvium is 4/A. B indicates the contribution to the predominant period of deposits lower than the
alluvium.
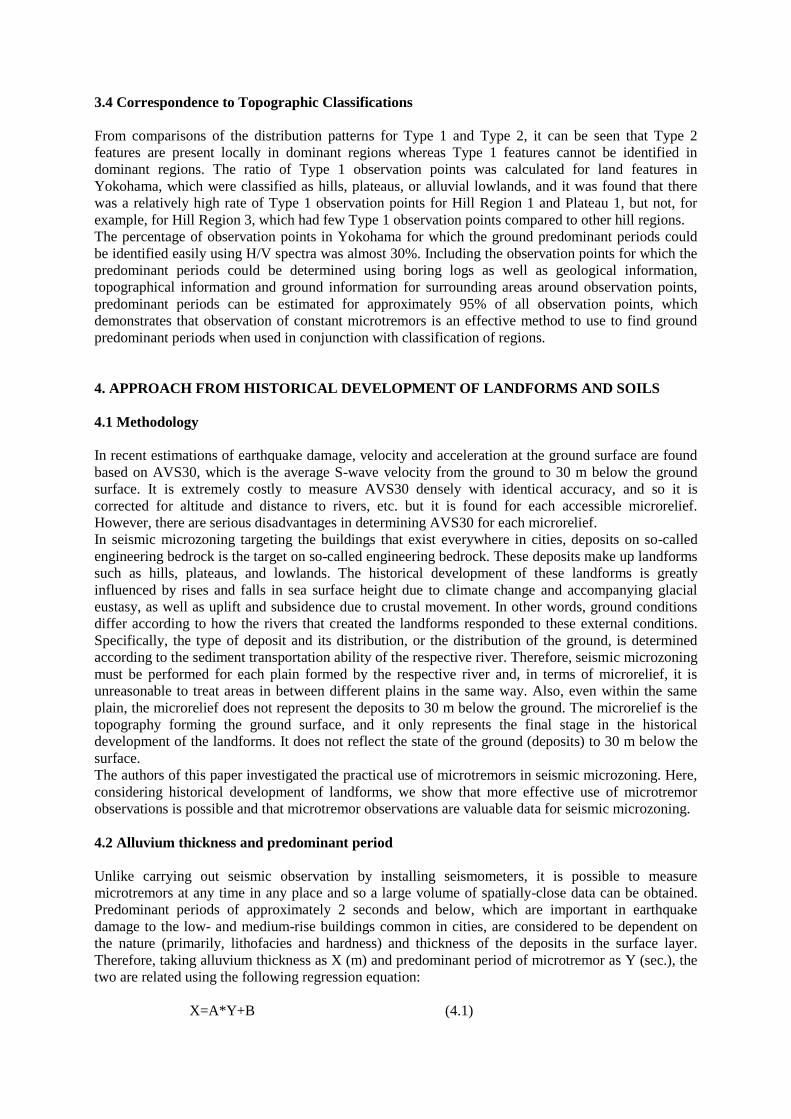
Figure 4 shows a geological cross-section of the area downstream of the Tama River lowlands
prepared using boring data measured during the construction of the Yokohama/Haneda route of the
Metropolitan Expressway. The vertical lines show the locations of the borings and they are numbered.
Some numbers are omitted because it would complicate the diagram if all of the data were entered.
Also, it must be kept in mind that the horizontal and vertical scales differ, so gradients are emphasized.
From number 74 (hereafter, the word “number” will be omitted) to 87, a sandy gravel layer with its
top face at from -47 to -53 m forms the basal gravel of the alluvium. It appears that the bottom face
reaches -60 m. This deep valley is named the Paleo-Tama River Valley. From 108 to 132 is a buried
wave-cut platform formed during the Jomon Transgression. Here, the alluvium is thin and the Kazusa
Group that forms the bedrock is thickly covered by the Middle/Late Pleistocene Series (called the
intermediate layer). From Figure 4, the ground subject to seismic microzoning is divided into three;
bedrock, intermediate layer, and alluvium.
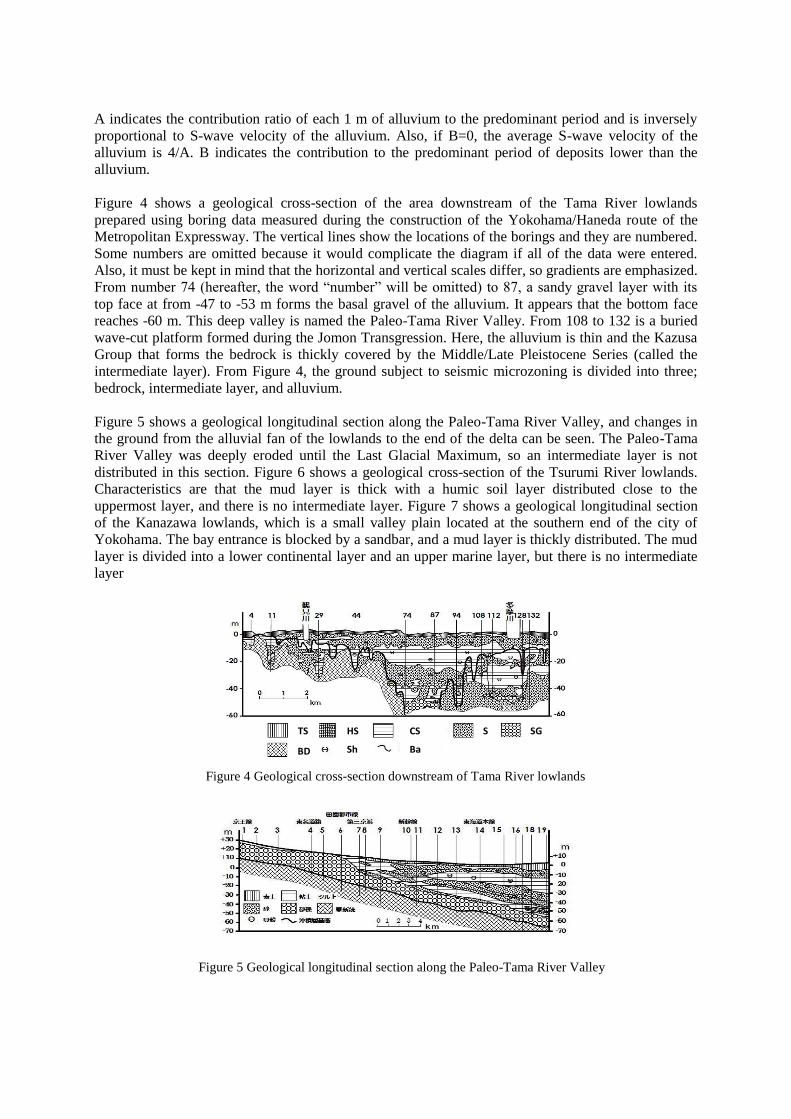
Figure 5 shows a geological longitudinal section along the Paleo-Tama River Valley, and changes in
the ground from the alluvial fan of the lowlands to the end of the delta can be seen. The Paleo-Tama
River Valley was deeply eroded until the Last Glacial Maximum, so an intermediate layer is not
distributed in this section. Figure 6 shows a geological cross-section of the Tsurumi River lowlands.
Characteristics are that the mud layer is thick with a humic soil layer distributed close to the
uppermost layer, and there is no intermediate layer. Figure 7 shows a geological longitudinal section
of the Kanazawa lowlands, which is a small valley plain located at the southern end of the city of
Yokohama. The bay entrance is blocked by a sandbar, and a mud layer is thickly distributed. The mud
layer is divided into a lower continental layer and an upper marine layer, but there is no intermediate
layer
Figure 4 Geological cross-section downstream of Tama River lowlands
Figure 5 Geological longitudinal section along the Paleo-Tama River Valley
HS CS S SG
BD Ba Sh
TS
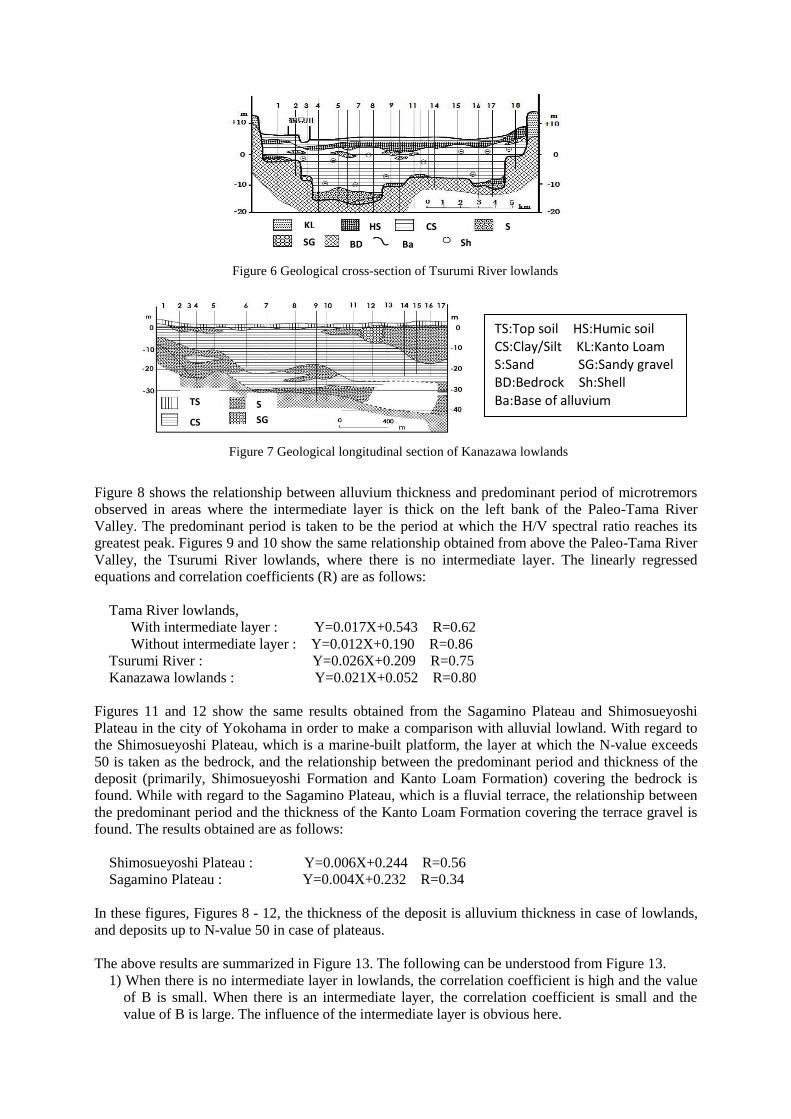
Figure 8 shows the relationship between alluvium thickness and predominant period of microtremors
observed in areas where the intermediate layer is thick on the left bank of the Paleo-Tama River
Valley. The predominant period is taken to be the period at which the H/V spectral ratio reaches its
greatest peak. Figures 9 and 10 show the same relationship obtained from above the Paleo-Tama River
Valley, the Tsurumi River lowlands, where there is no intermediate layer. The linearly regressed
equations and correlation coefficients (R) are as follows:
Tama River lowlands,
With intermediate layer : Y=0.017X+0.543 R=0.62
Without intermediate layer : Y=0.012X+0.190 R=0.86
Tsurumi River : Y=0.026X+0.209 R=0.75
Kanazawa lowlands : Y=0.021X+0.052 R=0.80
Figures 11 and 12 show the same results obtained from the Sagamino Plateau and Shimosueyoshi
Plateau in the city of Yokohama in order to make a comparison with alluvial lowland. With regard to
the Shimosueyoshi Plateau, which is a marine-built platform, the layer at which the N-value exceeds
50 is taken as the bedrock, and the relationship between the predominant period and thickness of the
deposit (primarily, Shimosueyoshi Formation and Kanto Loam Formation) covering the bedrock is
found. While with regard to the Sagamino Plateau, which is a fluvial terrace, the relationship between
the predominant period and the thickness of the Kanto Loam Formation covering the terrace gravel is
found. The results obtained are as follows:
Shimosueyoshi Plateau : Y=0.006X+0.244 R=0.56
Sagamino Plateau : Y=0.004X+0.232 R=0.34
In these figures, Figures 8 - 12, the thickness of the deposit is alluvium thickness in case of lowlands,
and deposits up to N-value 50 in case of plateaus.
The above results are summarized in Figure 13. The following can be understood from Figure 13.
1) When there is no intermediate layer in lowlands, the correlation coefficient is high and the value
of B is small. When there is an intermediate layer, the correlation coefficient is small and the
value of B is large. The influence of the intermediate layer is obvious here.
Figure 6 Geological cross-section of Tsurumi River lowlands
Figure 7 Geological longitudinal section of Kanazawa lowlands
TS:Top soil HS:Humic soil CS:Clay/Silt KL:Kanto Loam S:Sand SG:Sandy gravel BD:Bedrock Sh:Shell Ba:Base of alluvium TS
CS SG
S
KL
SG
HS CS
BD Ba
S
Sh

2) The fact that the value of A in the Kanazawa lowlands and Tsurumi River lowlands is larger than
in the Tama River lowlands indicates that the average S-wave velocity in the alluvium of the
Kanazawa and Tsurumi River lowlands is slower than in the Tama River lowlands. In other
words, the alluvium is soft.
3) The fact that the value of B in the Kanazawa lowlands is smaller than in the Tama River
lowlands without an intermediate layer and smaller than in the Tsurumi River lowlands indicates
that the predominant period is more dependent on the alluvium in the Kanazawa lowlands. In
other words, in the Kanazawa lowlands, there is a large contrast between the bedrock and the
alluvium. This result is consistent with the fact that the bedrock of the Kanazawa lowlands is
made up of older deposits.
Figure 8 Tama River lowlands
(With intermediate layer)
Figure 9 Tama River lowlands
(Without intermediate layer)
Figure 10 Kanazawa lowlands
(Without intermediate layer)
Figure 13 Relationship between predominant period and sedimentary layer thickness
(In case of lowlands, alluvium thickness; In case of plateaus, deposits up to N-value 50)
Figure 11 Shimosueyoshi
Plateau -marine terrace
Figure 12 Sagamino Plateau
-fluvial terrace
Predominant period (sec.) Predominant period (sec.) Predominant period (sec.)
Thickness of deposit (m) Thickness of deposit (m) Thickness of deposit (m)
Predominant period (sec.) Predominant period (sec.)
Thickness of deposit (m) Thickness of deposit (m)
Thickness of deposit (m)
Predominant period (sec.)
Tsurumi River lowlands without intermediate layer
Tama River lowlands with intermediate layer
Tama River lowlands without intermediate layer
Kanazawa lowlands without intermediate layer
Shimosueyoshi Plateau
Sagamihara Plateau
4) In the plateaus, the value of A is small. This is consistent with the fact that deposits in the surface
layer of plateaus are more consolidated than in alluvial lowlands.
5) In the plateaus, the correlation coefficient is small. This shows that the deposits in the surface
layer of the plateaus are non-uniform.
5. MODELING OF RELATIONSHIP BETWEEN PREDOMINANT PERIOD AND
HISTORICAL DEVELOPMENT OF LANDFORMS
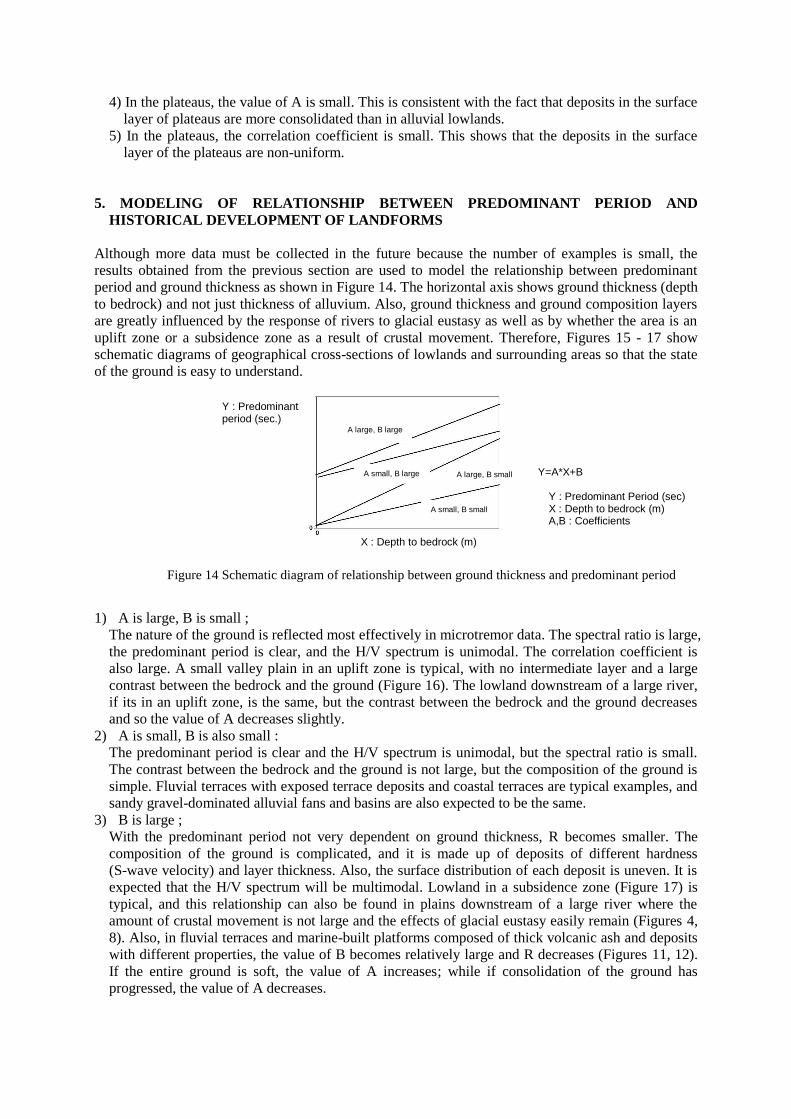
Although more data must be collected in the future because the number of examples is small, the
results obtained from the previous section are used to model the relationship between predominant
period and ground thickness as shown in Figure 14. The horizontal axis shows ground thickness (depth
to bedrock) and not just thickness of alluvium. Also, ground thickness and ground composition layers
are greatly influenced by the response of rivers to glacial eustasy as well as by whether the area is an
uplift zone or a subsidence zone as a result of crustal movement. Therefore, Figures 15 - 17 show
schematic diagrams of geographical cross-sections of lowlands and surrounding areas so that the state
of the ground is easy to understand.
1) A is large, B is small ;
The nature of the ground is reflected most effectively in microtremor data. The spectral ratio is large,
the predominant period is clear, and the H/V spectrum is unimodal. The correlation coefficient is
also large. A small valley plain in an uplift zone is typical, with no intermediate layer and a large
contrast between the bedrock and the ground (Figure 16). The lowland downstream of a large river,
if its in an uplift zone, is the same, but the contrast between the bedrock and the ground decreases
and so the value of A decreases slightly.
2) A is small, B is also small :
The predominant period is clear and the H/V spectrum is unimodal, but the spectral ratio is small.
The contrast between the bedrock and the ground is not large, but the composition of the ground is
simple. Fluvial terraces with exposed terrace deposits and coastal terraces are typical examples, and
sandy gravel-dominated alluvial fans and basins are also expected to be the same.
3) B is large ;
With the predominant period not very dependent on ground thickness, R becomes smaller. The
composition of the ground is complicated, and it is made up of deposits of different hardness
(S-wave velocity) and layer thickness. Also, the surface distribution of each deposit is uneven. It is
expected that the H/V spectrum will be multimodal. Lowland in a subsidence zone (Figure 17) is
typical, and this relationship can also be found in plains downstream of a large river where the
amount of crustal movement is not large and the effects of glacial eustasy easily remain (Figures 4,
8). Also, in fluvial terraces and marine-built platforms composed of thick volcanic ash and deposits
with different properties, the value of B becomes relatively large and R decreases (Figures 11, 12).
If the entire ground is soft, the value of A increases; while if consolidation of the ground has
progressed, the value of A decreases.
A small, B large
Figure 14 Schematic diagram of relationship between ground thickness and predominant period
A large, B large
A large, B small
A small, B small
X : Depth to bedrock (m)
Y : Predominant period (sec.)
Y=A*X+B
Y : Predominant Period (sec) X : Depth to bedrock (m) A,B : Coefficients
6. CONCLUSION
The nature of the bedrock and ground is reflected in the predominant period of microtremors, and so
analysis of the historical development of landforms and ground is essential in seismic microzoning. As
an example, the zoning procedure shall be as follows: Landform classification maps will be created
from field surveys and interpretation of aerial photographs, and if possible, geographical sections will
be created by collecting boring data. Next, with reference to these maps and sections, the historical
development of the landforms will be compiled. Based on these results, deposits will be classified, and
units will be established for conducting area classification from their combinations. Furthermore,
microtremors will be measured and area classification will be conducted by confirming consistency
with distribution of predominant periods of the microtremors. Response calculations will be carried
out for each area-classified unit, and seismic motion characteristics will be assigned to each zone.
ACKNOWLEDGEMENTS
We would like to express the great gratitude to all those who participate microtremors observations in
Yokohama City. And also we are grateful to have been granted permission to use measurement results from
Abeki Laboratory of the Faculty of Engineering, Kanto Gakuin University as microtremor data for the Tama
River and Kanazawa lowlands.
REFERENCES
Aki, K. (1957), "Space and time spectra of stationary stochastic wave, with special reference to microtremors",
Bulletin of the Earthquake Research Institute, Vol. 35, Pages 415-456.
Enomoto, T., Kuriyama, T. Abeki, N. Iwatate, T. Navarro M. and Nagumo M., (2000). "Study on microtremor
characteristics based on simultaneous measurements between basement and surface using borehole",
Proceedings of 12WCEE, Paper No. 0918, 1-8.
Matsuzawa T. et al. (2003) "Investigation on Ground Shaking Characteristics in Northern Part of Ashigara Basin
Using Boring Data and Microtremor Observation", Summaries of Technical Papers of Annual Convention
(Tokai), Architectural Institute of Japan, p279-282.
Navarro, M., Vidal, F., Feriche, M., Enomoto, T., Sanchez, F.J. and Matsuda, I. (2004) "Expected ground RC
building structures resonance phenomena in Granada city (southern Spain)", Proc. of the 13th World
Conference on Earthquake Engineering, Vancouver, BC, Canada, 2004. Paper No. 3308.
Yamamoto T. et al. (2004) "Investigation on Ground Shaking Characteristics in Southern Part of Ashigara Basin
Using Microtremor Observation, Part I/Part II", Annual Convention of Architectural Institute of Japan.
Yamamoto, T., Enomoto, T., Sugimoto, M., Navarro, M. and Rahimian, M. (2007) "Investigation on
Applicability of H/V Spectrum Obtained from Microtremors to Seismic Microzoning Study", Proceedings,
Ninth Canadian Conference on Earthquake Engineering, Paper No. 1238, 2007.
Yokohama City (2003), Geological and Geographical Map of Yokohama City, Institute for Environment of
Yokohama City
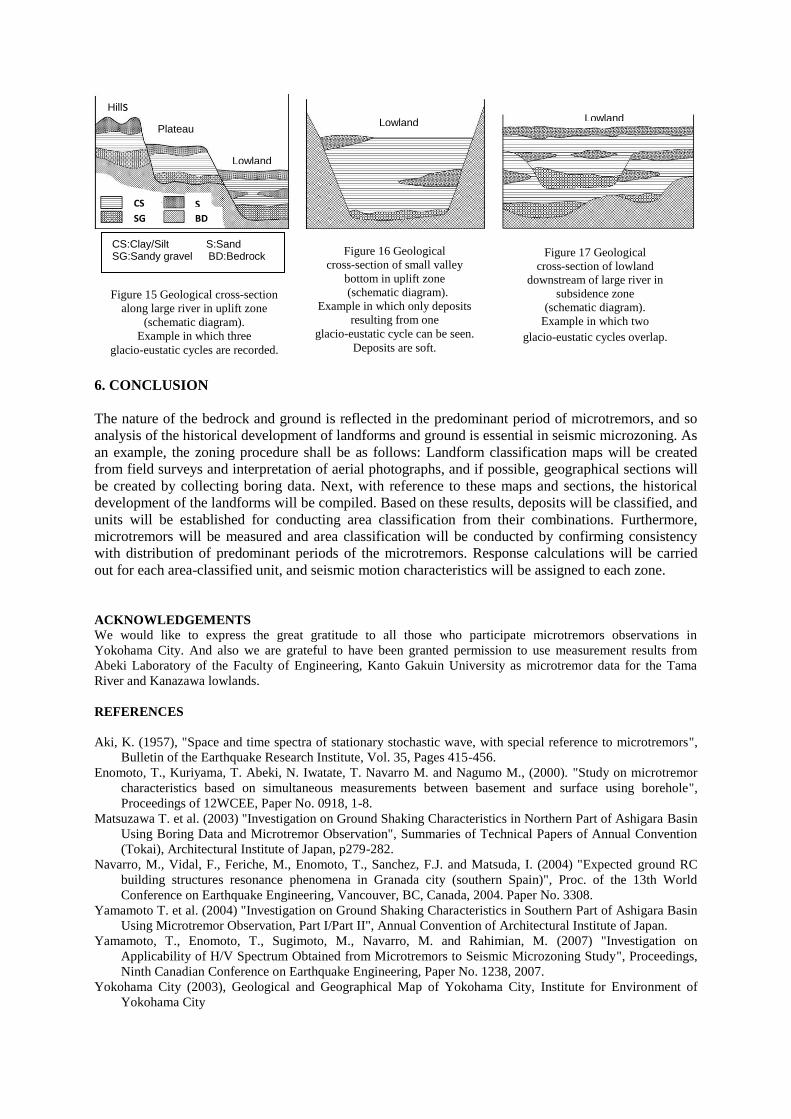
Figure 15 Geological cross-section
along large river in uplift zone
(schematic diagram).
Example in which three
glacio-eustatic cycles are recorded.
Figure 16 Geological
cross-section of small valley
bottom in uplift zone
(schematic diagram).
Example in which only deposits
resulting from one
glacio-eustatic cycle can be seen.
Deposits are soft.
Figure 17 Geological
cross-section of lowland
downstream of large river in
subsidence zone
(schematic diagram).
Example in which two
glacio-eustatic cycles overlap.
CS:Clay/Silt S:Sand SG:Sandy gravel BD:Bedrock
Hills
Plateau
Lowland
Lowland Lowland
CS S
SG BD