investigation towards alternative water resources
TRANSCRIPT
Investigation Towards
Alternative Water Resources
Mtwara, Tanzania
An investigation by:
Mattijn van Hoek
Student Land & Water Management
(International Water Management)
Waterschap Velt & Vecht
AMREF Flying Doctors
University of Applied Sciences Van Hall Lareinstein

In
InvaltMt
Writte
MattijStudeUniveConta Perso
P. FilH. Klo
Perso
J. vanI. KagE. Fu
Perso H. va
nvestigation t
vestigternattwara
en by:
jn van Hoekent Land & Wersity of Applact: mattijn.v
ons involved
ius (hydrologomp (policy o
ons involved
n Oppenraaijgonji (projectungo (project
ons involved
an Hoof (teac
towards alter
AMRE
gationtive w
a, Tan
Water managlied Sciences
vanhoek@wu
Waterschap
gist) officer)
AMREF
j (program mt manager Mt officer Mtwa
University o
cher, accomp
rnative water
EF Flying Doc
n towawater nzania
gement (major
s Van Hall Laur.nl
p Velt & Vech
WatePostb7740
manager, NetMtwara, Tanzaara, Tanzania
AMRHaag2332
of Applied Sc
panist)
HogePostb6880
r resources in
ctors / Water
ards resoua
r: International W
arenstein
ht
erschap Velt bus 330 AH Coevord
therlands) ania) a)
EF Flying Dogse Schouww
KG Leiden
ciences Van H
eschool Van bus 9001 GB Velp
n Mtwara, Ta
rschap Velt &
urces
Water managem
en Vecht
den
octors weg 6G
Hall Larenste
Hall Larenste
anzania
& Vecht 1
in
ment)
ein
ein

Investigation towards alternative water resources in Mtwara, Tanzania
AMREF Flying Doctors / Waterschap Velt & Vecht 2
Investigation towards alternative water resources in Mtwara, Tanzania
Hoek van, M., (August 2010). Investigation Towards Alternative Water Resources in Mtwara, Tanzania. Coevorden, The Netherlands. Waterschap Velt en Vecht
This report is written as a study towards alternative water resources next to the actual used methods. The results should be read as an advise.

Investigation towards alternative water resources in Mtwara, Tanzania
AMREF Flying Doctors / Waterschap Velt & Vecht 3
Preface I would like to use this opportunity to thank Hermen Klomp and Pieter Filius of the Regional water authority Velt en Vecht located in Coevorden, the Netherlands. They have coordinated and advised me by providing technical input for my graduation study at AMREF Mtwara (Tanzania).
Furthermore, I would like to thank Joris van Oppenraaij from AMREF Netherland. His advices, critics and experiences were helpful for me. As well as the advises from Mark Rietveld and Dick Bouwman from Aqua for All. Their expertise in hydrogeology has been helpful. From Hogeschool van Hall – Larenstein, I would like to thank my teacher and coordinator Henk van Hoof. His support, enthusiasm and commitment to his job is an example for many.
Moreover, I would like to thank Ignatio Kagonji, project manager AMREF Mtwara (Tanzania) by advising me in executing the field visits and in controlling the scope of work. As well as Emmanuel Fungo, project officer AMREF Mtwara (Tanzania) who has attended me with all the field visits and by sharing a room in his house for giving me an unforgettable experience in the warm and friendly surrounding of Mtwara town.
And of course I would like to thank the other staff of AMREF, namely Said, Lwanji, Lawrence, Ligaga who warmly welcomed me in Mtwara and facilitated me with never ending enthusiasm.
Also I would like to thank all the local residents of Mtwara rural, who took their time to answer the questions and discuss the matters of access to safe and reliable water sources.
To my parents,
August 2010
Mattijn van Hoek
Investigation towards alternative water resources in Mtwara, Tanzania
AMREF Flying Doctors / Waterschap Velt & Vecht 4
Table of Contents
1 Introduction ........................................................................................ 6
1.1 Background ................................................................................ 6
1.2 Objectives of the study ............................................................... 6
1.3 Methodology .............................................................................. 7
1.4 Structure of this Report .............................................................. 7
2 Description of study area ................................................................... 8
2.1 Project area ................................................................................ 8
2.2 Geomorphology and hydrogeology .......................................... 10
2.3 Climate ..................................................................................... 10
2.4 Land use & Vegetation ............................................................. 11
2.4.1 Agriculture ............................................................................ 12
2.4.2 Mining .................................................................................. 12
2.4.3 Vegetation ............................................................................ 12
2.4.4 Water catchments ................................................................ 13
3 Methods ........................................................................................... 15
3.1 Actual ways for collecting water ............................................... 15
3.2 Comparison of alternatives ...................................................... 15
3.3 Village meetings ....................................................................... 15
3.4 Rainfall analysis ....................................................................... 16
3.5 Constructing and drilling of boreholes ...................................... 16
3.6 Alternatives .............................................................................. 16
3.6.1 Performance and cost analyse ............................................. 17
4 Results ............................................................................................. 20
4.1 Actual ways for collecting water ............................................... 20
4.1.1 Unprotected shallow wells .................................................... 20
4.1.2 Swamps in the base of the valleys ....................................... 20
4.1.3 Ruvuma River ...................................................................... 21
4.1.4 Stored water in ground tanks in the villages ......................... 21
4.1.5 Buying water from boreholes ................................................ 22
4.1.6 Water from Roads ................................................................ 22
4.2 Comparison of alternatives ...................................................... 23
4.3 Village meetings ....................................................................... 24
4.3.1 Possible alternatives according to villages ........................... 25
4.3.2 Opinions about presented alternatives ................................. 25

Investigation towards alternative water resources in Mtwara, Tanzania
AMREF Flying Doctors / Waterschap Velt & Vecht 5
4.4 Rainfall analysis ....................................................................... 28
4.5 Constructing and drilling of boreholes ...................................... 32
4.6 Alternative 1. Surface water harvesting with subsurface storage 33
4.6.1 Affordability .......................................................................... 34
4.6.2 Technical usability ................................................................ 35
4.6.3 Sustainability ........................................................................ 35
4.6.4 Water quality ........................................................................ 35
4.6.5 Performance and cost analyse ............................................. 36
4.7 Alternative 2. Surface water harvesting .................................... 42
4.7.1 Affordability .......................................................................... 42
4.7.2 Technical usability ................................................................ 42
4.7.3 Sustainability ........................................................................ 42
4.7.4 Water quality ........................................................................ 43
4.7.5 Performance and cost analyse ............................................. 43
4.8 Alternative 3. Roof water harvesting ........................................ 48
4.8.1 Affordability .......................................................................... 48
4.8.2 Technical usability ................................................................ 49
4.8.3 Sustainability ........................................................................ 49
4.8.4 Water quality ........................................................................ 49
4.8.5 Performance and cost analyse ............................................. 49
4.9 Overview results ...................................................................... 53
5 Conclusions & Discussion ............................................................... 54
5.1 Objectives of investigation ....................................................... 54
5.2 Conclusions ............................................................................. 54
5.2.1 Alternative I. Surface harvesting with subsurface soil storage 54
5.2.2 Alternative II. Surface harvesting with subsurface reservoir . 55
5.2.3 Alternative III. Tank storage with hard roof harvesting .......... 55
5.3 Discussion................................................................................ 56
References .............................................................................................. 57
Appendices .............................................................................................. 58

Investigation towards alternative water resources in Mtwara, Tanzania
AMREF Flying Doctors / Waterschap Velt & Vecht 6
1 Introduction
1.1 Background
The government of Tanzania declares in the national water policy that ‘the availability of water is a basic need and entitled to everyone’. Based on findings of AMREF, the estimation of disease burden related due to the lack of safe drinking water and adequate sanitation in Tanzania is 70%.
To improve the water supply in the district, the African Medical, Research Foundation (AMREF) Tanzania and the Mtwara Rural District Council has started the WATSAN project in 2008. This project is about water, hygiene, and sanitation. AMREF hopes to finish this project in collaboration with water board Velt en Vecht (by providing technical assistance and function as co-financier) in 2011.
The project aims to improve the health and quality of life of selected marginalized communities of Mtwara district. Including 6 wards and 40 villages. This is done by increasing access to- and sustainable use of safe water and basic sanitation services by constructing boreholes in each village.
1.2 Objectives of the study
This study outlines a study towards more sustainable water sources in Mtwara region, Tanzania, according to the Tanzania national water policy.
The purpose of the investigation is to provide technical evidence for an addendum towards the European Union (main financier in this project) for adjustment of the scope towards development of alternative water sources.
This study, as defined in the Terms of Reference (appendix 1) has the following objectives:
1. Exploring the possibilities of alternative water sources (apart from deep boreholes)
2. Standardize collected data in database formats and train the local staff where needed
Ad1. The objective is to investigate possible alternative drinking water sources in the villages of phase three and other villages out of the project area. This possibility arises by the release of budget by reducing the number of boreholes from 51 to 40. Those, potential, alternative solutions will possibly offer the population a more reliable and affordable access to safe drinking water. Key

Investigation towards alternative water resources in Mtwara, Tanzania
AMREF Flying Doctors / Waterschap Velt & Vecht 7
elements for analysing alternative water resources are affordability, technical usability, and durability. The result is a method, which is based on these key elements.
Ad2. Setting up of a proper data management system will be done for water source monitoring, both qualitative and quantitative. With adequate monitoring, it is possible to intervene in time when recharge of a water source is insufficient or contamination takes place. The local staffs receive training in adequate monitoring and the use of databases in ArcGIS.
1.3 Methodology
The approach of this investigation is based on a participatory approach that involve community members, village and sub village governments and committees. The methods used to gather and analyse information include desk studies, data collection, field visits and different analyses. The investigation is started with the desk study and data collection. Together with the fields visit it is possible to analyse the objectives of the study. In appendix 2 is found the plan of approach for this investigation. Apart from the study there will take place a training in GIS and data management (the trained elements can be found in appendix 9)
1.4 Structure of this Report
The report focuses on the actual used water resources and the possible alternatives. For this, the study area will be discussed in chapter 2, the description of the study area. Thereafter, in chapter 3 the methods are discussed to come up with the result and findings in chapter 4. This chapter starts with presenting the actual approach towards water collecting and the finish with suitable alternatives which are analysed by different points, like the sustainability, performance and costs. Chapter 5 is the conclusion and the report finish with the discussion in chapter 6.

2
Figure 2.On the leTanzaniathe southoverview districts, iRural. Booverview Rural with
2
1 eft the country a with Mtwara reheast. Top right
w of the five diffein yellow Mtwar
ottom right a smw of the district M
h the different w
In
De
In thidifferean ovthe cto geand aresult
2.1
WithiremoTandMtwapopuRepoMtwathe madeq
Eachcases
egion in an rent
ra mall Mtwara wards.
nvestigation t
escrip
is chapter, dent aspects verview of thlimate will be
et an insight actual used mts (outcomes
Project
n Tanzania te area. Thahimba, Mtw
ara rural conlation of Mt
ort) and hasara Rural is majority of puate sanitati
day, the cols, the collect
towards alter
AMRE
ption o
different aspare geomorphe charactere analysed foin the precip
methods for ws) of the disc
area
the Mtwarahe region cwara urban sist of six dtwara is 23 an estimat3858 km2 (A
people do non.
lection of wated water is n
rnative water
EF Flying Doc
of stu
ects of the phology and ristics of the or the meteopitation potenwater harves
cussions held
a region, locconsists of
and Mtwaraivisions, 18
31.554 (WATted annual gArcGIS 9.2, Wot have acc
ater takes 2 tnot safe. Wa
r resources in
ctors / Water
dy ar
project areahydrogeologsubsurface
orological chantial. After lasting this chad during the v
cated in the five district
a rural (figuwards en 11TSAN Mtwagrowth of 1.Wards_Tanzcess to safe
to 7 hours peater scarcity
n Mtwara, Ta
rschap Velt &
rea
a are discussgy, in order tolayers. Furtaracteristics
and use & veapter will endvillage meeti
southeast, ts, Masasi, ure 2.1). The19 villages. Tara Baseline.4%. The suzania). In thee drinking w
er householdresults in an
anzania
& Vecht 8
sed. The o receive hermore, , in order egetation d with the ngs.
is still a Newala,
e district The total
e Survey urface of e district,
water and
d. In most average
8
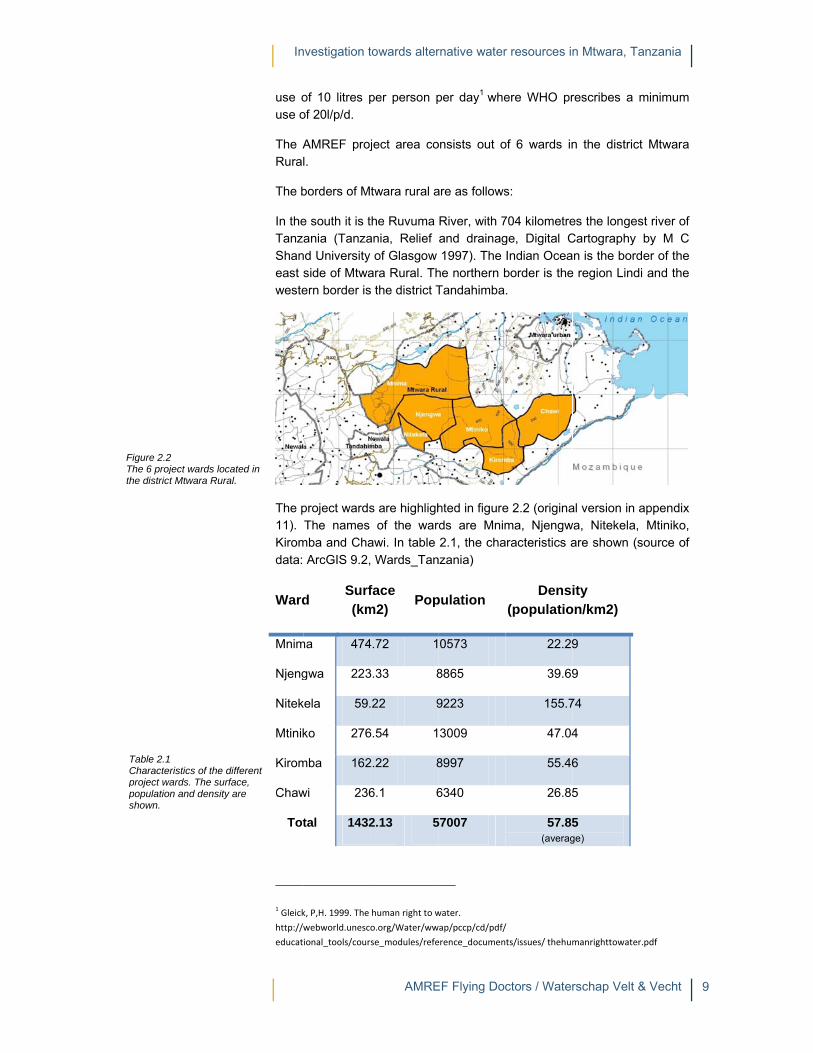
Figure 2.2The 6 projthe distric
Table 2.1Characteproject wpopulatioshown.
2 ject wards locat
ct Mtwara Rural.
1 eristics of the difwards. The surfaon and density a
In
use ouse o
The ARural
The b
In theTanzaShaneast sweste
The p11). Kiromdata:
Ward
Mnim
Njeng
Nitek
Mtinik
Kirom
Chaw
Tot
1 Gleick
http://w
educat
ted in
fferent ce,
are
nvestigation t
of 10 litres pof 20l/p/d.
AMREF projl.
borders of Mt
e south it is tania (Tanza
nd University side of Mtwaern border is
project wardsThe names
mba and ChaArcGIS 9.2,
d Surf(km
ma 474
gwa 223
kela 59.
ko 276
mba 162
wi 236
tal 1432
k, P,H. 1999. The
webworld.unesco
ional_tools/cours
towards alter
AMRE
per person p
ject area co
twara rural a
he Ruvuma ania, Relief
of Glasgow ara Rural. Th the district T
s are highlighof the war
awi. In table Wards_Tan
face m2)
Pop
4.72 1
3.33 8
22 9
6.54 1
2.22 8
6.1 6
2.13 5
human right to w
o.org/Water/ww
se_modules/refe
rnative water
EF Flying Doc
per day1 whe
onsists out o
are as follows
River, with 7and drainag1997). The
he northern bTandahimba
hted in figurerds are Mnim2.1, the cha
nzania)
pulation
0573
8865
9223
3009
8997
6340
57007
water.
wap/pccp/cd/pdf/
erence_documen
r resources in
ctors / Water
ere WHO pr
of 6 wards in
s:
704 kilometrege, Digital CIndian Oceaborder is the.
e 2.2 (originama, Njengw
aracteristics a
Densi(populatio
22.29
39.69
155.7
47.04
55.46
26.85
57.85(averag
/
ts/issues/ thehum
n Mtwara, Ta
rschap Velt &
rescribes a m
n the district
es the longesCartography n is the bord
e region Lind
al version in awa, Nitekela, are shown (s
ity on/km2)
9
9
74
4
6
5
5 ge)
manrighttowater
anzania
& Vecht 9
minimum
t Mtwara
st river of by M C
der of the i and the
appendix Mtiniko,
source of
r.pdf
9

Figure 2.3GeologicaRural. Gearea is loNon-Maricolour).
3 al map of Mtwarenerally the projcated in the formine Neocene (pi
In
2.2
Geoloentirewith cultivdominprojeinto cthe so
Geolopart cretaPalaeseen projesmallcombnorthNeoc
2.3
Genelocal on 10coord
ra ject mation ink
nvestigation t
Geomo
ogy determiely of red-earpeat type h
vate, even dunant around ct area. At th
coarsely sandocio-econom
ogically Mtwcharacterize
ceous rockseozoic basemin the geoloct area is ml part of thebination of C east borde
cene.
Climate
eral climate climate esti
0 local statiodinates.
towards alter
AMRE
orphology
nes soils. Trth soils. Thehumus soil. uring the rainthe lakes ne
he top of thedy soil. (Sou
mic profile an
wara region ied by quats and the ment compleogical map, fimainly locatee northern p
Cretaceous ar there is a
e
information mator from
ons that are l
rnative water
EF Flying Doc
y and hy
The soils of e Ruvuma riv
These areny season. Sear the Ruvu valleys, the
urce: Regiond investmen
is divided internary, tertwestern pa
ex of highly migure 2.3 (oried in the forpart of the and Alluvium
small area
is based onFAO (http://wlocated betw
r resources in
ctors / Water
ydrogeol
Mtwara Rever valley coe extremely Some black uma River in
soil is changal Administrat potentials,
n two parts. tiary sedimeart with Nometamorphosiginal versionrmation Nonproject area
m & Quaterncontaining t
n the prograwww.fao.org
ween 23 and
n Mtwara, Ta
rschap Velt &
ogy
egion consisnsists of allufertile and cotton type the south pa
ging from a ration, Mtwar2010)
The easternents and M
one-Marine sed rocks. An in appendix-Marine Neoa is positionion formatiothe formation
am New_Lo). The data 86km from
anzania
& Vecht 1
st almost uvial soils
easy to soils are art of the red earth ra region,
n coastal Mesozoic Neocene
As can be x 11) the ocene. A ned in a n. In the n Marine
ocClim, a is based the used
0

Figure 2.4Graph of meteoroloThe preciof a dry a
4 f different ogical characteripitation consist
and wet period.
In
PrevabordeApril/humidregioRegio
The rthe ptends1160
LikewMtwa
2.4
The valley
The plocatedownAt soswamperiod
ristics. ts out
nvestigation t
ailing winds ers on the In/May, the dod rainy seasn is dry, coonal Commis
rainy seasoneak being re
s to vary witmm in the h
wise, temperara in Octobe
Land us
land use is ys and platea
profile (pictured on the pla
n to the valleome places, mps and pond.
towards alter
AMRE
are critical ndian Oceanominant windson to the rooler and lessioner’s Off
n of Novembeached in Jah altitude. In
hills and the p
ratures vary er to 23° C in
se & Veg
based on thaus varying b
re 2.5) gives ateau this is ey, on the hilthe valleys ands. The sw
rnative water
EF Flying Doc
in determininn. During theds are from region, wheness humid. ice, 1997)
ber/Decembeanuary but on Mtwara displateau area
from 35° an March.
getation
he elevationbetween 50 t
an overviewaround 200 ls, the land are used to
wamps and
r resources in
ctors / Water
ng climate fe period Novthe northea
n they blow(Source: Pla
er to April/Mccasionally istrict rains v.
as the highe
n. The projecto 200 metre
w of the land metres abovis used for ccultivate riceponds dry o
n Mtwara, Ta
rschap Velt &
or this regiovember/Dece
ast. They briw from south
anning Com
May is single n February o
vary from 93
est monthly
ct area exise above sea
use. The villve sea level. cultivating tree, but contaiout slowly in
anzania
& Vecht 1
on, which ember to ng a hot
heast the mmission,
peaked, or March
35 mm to
mean at
ts out of level.
ages are By going
ee crops. in mainly
n the dry
1

Figure 2.5Profile of villages athe agricuthe slopesbottom of swamp.
5 the region. There on the platea
ulture takes placs of the valley. Tf the valley is ma
In
2.4.1
Land The mcropsand sextenand gFor thAMRlike faboutHowewhichhouse
Farmcomm
2.4.2
ProspMnaz(Sourprofile
2.4.3
The vthat tdifferewith 4providtype fused and c
The corre
au and ce on The ainly
nvestigation t
Agricult
use in Mtwamain occupas produced insince ten yensively as prgroundnuts. Mhis the majoEF Baselinefishing, beekt 1,672,000 ever, the acth is increasinehold is estim
m mechanizatmon farming
2 Mining
pects for thezi Bay Naturrce: Regione and investm
3 Vegetat
vegetation mthe project ent types ar46% by far de the peopfor 25% of thfor cattle. T
cows.
ponds and sponds to 1%
towards alter
AMRE
ure
ara, like the ration of the inn the region ears, maize rotein sourceMtwara is the
ority of the hoe survey Mtwkeeping andhectares of tual utilized ng by 7% evemated at 1.5
tion is introdtool.
e mining indral Gas projal Administrment potenti
tion
map (Figure area is divi
re mentionedthe highest
ple with incohe area. TheThe animal ke
small lakes% of the tota
rnative water
EF Flying Doc
rest of Tanzanhabitants of include casshas gained
es like pigeoe leading casouseholds rewara, 2008),d small-scale
land out of area for far
ery 10 yearsha.
duced slowly
dustry in theect, (MB-NGration, Mtwaals, 2010)
2.6, originalided in five d in Table 2percentage. me (cash cr bushed graseeping is pri
s comprise aal surface of t
r resources in
ctors / Water
ania is predof the region issava, sorghupopularity. Vn peas, cowshew nut proely on agricu apart from
e industries.which 85%
rming is estis. The averag
y, the hand
e region areG) which wilara region,
l version in different ve
2.2. CultivatioMainly cash
rop). Woodlassland, 27%imarily based
a total areathe project w
n Mtwara, Ta
rschap Velt &
ominately agrs farming. Mum, millet, anVarious crop
wpeas, Bamboducer in theulture (88%)
other rural Mtwara regis potentially
imated to bege farm size
hoe is still t
e enormous,l be operatinthe socio-e
appendix 11egetation typon with tree hew nut treeand is the ve of the area d on goats,
a of 10.3 kmwards.
anzania
& Vecht 1
ricultural. ajor food nd paddy ps grown bara nuts e country.
(Source: activities gion has y arable. e 27.3%, per rural
the most
like the ng soon. economic
1) shows pes. The
crops is es, those egetation is mainly chickens
m², what
2

Figure 2.VegetatioRural. Cucrops is d
Figure 2.Water caboundariecatchmenthe red lin
Table 2.2The tableand the pdifferent vproject ar
6 on map from Mtultivation with thdominating the
7 atchment map. Tes of the main ants are indicatednes
2 e shows the surfpercentages of tvegetation typesrea.
In
Vege
Bush
Cultiv
Inland
Wood
2.4.4
WateThe bwhich
With is givof thedifferetopog
The watershowwith M
The sKirom
twara hree region
The and sub d by
face the s in the
nvestigation t
etation type
ed Grasslan
vation with T
d Water
dland
4 Water c
er catchmentboundaries oh is feeding t
ArcGIS the ven an overve watershedent catchmegraphical bac
project wardrshed of the
wn watershedMozambique
south part ofmba are loc
towards alter
AMRE
d
ree Crops
catchments
ts have diffeof a watershthe river basi
boundaries iew of the nes. In figure
ents. Stretcheckground.
ds are locatRuvuma Riv
ds are sub ce.
f the ward Mcated in the
rnative water
EF Flying Doc
Surfa
3
6
3
s
rent boundahed give infoin. It is base
of the waterecessary ste2.7, the red
ed elevation
ted in four dver is a majocatchments.
tiniko and the water catc
r resources in
ctors / Water
ace (km2)
391.2
660.5
10.3
351.7
aries then theormation aboed on the elev
rshed are lineps for lineati lines are thof SRTM Sa
different wator water catcThe Ruvuma
he south partchment that
n Mtwara, Ta
rschap Velt &
Percenta
27
46
1
25
e district bouout the surfavation.
eated. In apion of the bohe boundarieatellite is proj
ter catchmechment and ta River is th
t of Chawi anis flowing
anzania
& Vecht 1
age (%)
7
6
5
undaries. ace area,
ppendix 8 oundaries es of the jected as
ents. The the other
he border
nd whole into the
3

Investigation towards alternative water resources in Mtwara, Tanzania
AMREF Flying Doctors / Waterschap Velt & Vecht 14
Ruvuma River. The north part of Chawi is flowing to the small rivers that are flowing directly to the Indian Ocean in the north east of Mtwara region.
The north part of Mtiniko, Nitekela and almost whole Njengwa (except a small part in the north west) and the south east part of Mnima are flowing into the valley which is going north where it combines with the catchment of the north west of Mnima and the slice of Njengwa.

Investigation towards alternative water resources in Mtwara, Tanzania
AMREF Flying Doctors / Waterschap Velt & Vecht 15
3 Methods
Different methods are used to get the findings as presented in the results. The methods used are discussed in the same order as the results are presented in chapter 4.
3.1 Actual ways for collecting water
The used methods for funding the results for the actual approach to collect water is done including, interviewees and field observations during field visits.
The interviewees find place after there is made an appointment with the representative person of each visited village. The representative person can be the village officer, the village chairman of the pump operator. If necessary, the representative person ask nearby villagers for help.
In this survey, the field observations are as well from importance to find out the actual ways for collecting water. The field observations are done by visiting the villages by car and visiting the local used water systems by walking.
3.2 Comparison of alternatives
A desk-study is conducted to obtain a comprehensive overview of possible alternative methods for the collection and the storage of rainwater. In this desk-study there is done a review of published literature on the subject covering local and foreign sources. By using the results (positive successes) of applied systems elsewhere in the world, it is possible to do evaluate the feasibility for this region.
The evaluation of the feasibility is done by analysing the alternatives to two aspects, namely ‘geomorphology and hydrogeology’ and the ‘Tanzanian water policy’. The evaluation is done together with the employees of AMREF.
3.3 Village meetings
In the village meetings the used methods are in detail presented in the strategy village meetings, appendix 5. The method of a village meeting is used to assess the possibility for alternative water collection methods within the study area and assess the demand of alternative water collection methods within the study area. The approach of the village meetings can be summarised as follow:

Investigation towards alternative water resources in Mtwara, Tanzania
AMREF Flying Doctors / Waterschap Velt & Vecht 16
The first subject is to let the villagers think about any possible alternatives. It is a brainstorm activity whereby the villagers needs to mention any, according to them, suitable alternative.
Thereafter the suitable alternatives, based on the desk-study, are presented with the local villagers. In this presentation the alternatives are explained by making use of pictures and schematic overviews.
After summarize the mentioned alternatives by the villagers and the presented alternatives all alternatives are discussed once more towards the feasibility according the villagers.
3.4 Rainfall analysis
Methods which are used to analyse the precipitation data are mentioned as follow: the mean annual precipitation and the ranked annual precipitation gives insight in the average precipitation for the project area over the period of records. By ranking the annual precipitation the extreme highs and low annual precipitation are identified easily, as well as the ranger of average and average minus the standard deviation.
Thereafter the pattern analysis is done by analysing the variation of the annual precipitation around longer-term mean precipitation and the moving mean.
The variation of the annual precipitation around longer-term mean precipitation makes it possible to identity patterns of wet and dry years. The moving mean dampens the year-to-year fluctuations and the extreme values. This presents a smoother curve to show the general stream flow pattern.
With the rainfall analysis the different minimum annual repetition times needs to be calculated so they can be used as input for the performance calculations.
3.5 Constructing and drilling of boreholes
To find out the overview of the different elements in the system of constructing boreholes there has are executed interviewees with pump operators, AMREF employees. For receiving a comprehensive overview of the system, several field visits have find place to find out by personal field observations the exact elements in the system.
It is important to obtain a comprehensive overview of the different elements in the system to be able to decide the costs and to find out the probable bottlenecks.
3.6 Alternatives
Different methods are used for the calculations for analysing the alternatives. The following aspects will be used as method for analysing the different alternatives:
Affordability

Investigation towards alternative water resources in Mtwara, Tanzania
AMREF Flying Doctors / Waterschap Velt & Vecht 17
Technical usability
Sustainability
Water quality
Performance and cost analyse.
The last bullet, performance and cost analyse needs more explanation, for this the methods of the performance and cost analyse are discussed as well.
3.6.1 Performance and cost analyse
The calculations are done, by making use of the constructed models where different parameters are included. The underneath mentioned parameters are explained in detail in appendix 10, where the calculations of the models are discussed.
Three different annual precipitation levels; Three different demand levels; Number of users Surface type of catchment area; Variation in size of storage facility; Efficiency of storage of water; Efficiency of fetching of water; Price for a of bucket of water
For analysing the performance of the different systems, different indicators are used. The different measurements provide information for different stakeholders who will be connected to the system. In the following paragraphs the performance of each indicator will be discussed.
Demand satisfaction
The demand satisfaction is measured in percentages by dividing the amount of water that is annual delivered to the water user and the annual demand of the water user.
This is the fraction of the annual demand that the system manages to deliver. In other words, it gives an answer to the question ‘how well the water system performs’. The demand satisfaction is of special interest to the householder. (T.H. Thomas, D.B. Martinson, Roofwater harvesting).
By calculating the demand satisfaction, it is first needed to calculate the annual amount that is delivered. This is done by removing the annual overflow of the annual runoff (see formula 3.1).
The annual runoff will be that part of the amount of water that falls on the prepared surface and will be stored by the storage facility. Some of the precipitation will get lost by evaporation, infiltration or will be lost in the sand filter etc. The annual overflow is the amount of water that cannot be stored and will leave the storage facility through an escape or overflow structure. The storage facility can be a tank, reservoir, soil body etc.
Formula 3.1

Investigation towards alternative water resources in Mtwara, Tanzania
AMREF Flying Doctors / Waterschap Velt & Vecht 18
The annual water that is delivered is calculated as follows:
By knowing the amount of water that is annually delivered into the water storage, it is possible to calculate demand satisfaction. This is done by dividing the annual amount of water that is delivered to the annual amount of water that will be used by the local households, the demand (formula 3.2).
%
Efficiency
The efficiency is the fraction of the rainfall on the catchment area that can be used by the water user. It is the amount of water that is delivered to the water user in relation to the annual amount of water that is falling in the catchment area. The efficiency is of interest to the designer of the system. First the annual amount of water that is delivered is calculated by making use of formula 3.1 and the efficiency is thereafter calculated by using formula 3.3.
%
Reliability of supply
Another measurement for receiving an answer on the question ‘How well does the water system perform’ is by calculating the reliability of supply. The reliability of supply provides an overview in percentages as to how many days of a year the water storage facility runs dry. It is the percentages of days whereby the storage facility contains water.
Payback time
The payback time is an indicator tool to analyse the amount of time which is needed to payback the construction costs. This can be of interest to the funder. It is based on the cost price of water for a 20-liter bucket, the annual water demand of the water user(s) and the construction costs of the system. It is calculated in formula 3.4:
Knowing the annual value of water is it possible to calculate to payback time in months (see formula 3.5):
12
Formula 3.2
Formula 3.3
Formula 3.4
Formula 3.5

Investigation towards alternative water resources in Mtwara, Tanzania
AMREF Flying Doctors / Waterschap Velt & Vecht 19
Equivalent unit cost (for every water user)
By calculating the costs per litre for a storage tank it is possible to compare different storage. A more accurate way to compare the costs of different storage tanks is by making use of the equivalent unit cost. It scales down the particular system to the capacity of 1m³. It is calculated by dividing the costs of the water storage facility by the square root of the volume of the storage facility, as shown in formula 3.6. In other words it is the costs for every cubic metre.
A small addition can be made to calculate as well the costs for each cubic metre/water user. This is done by dividing the equivalent unit cost by the number of water users that are using the system (formula 3.7).
/ /
Budget
By taking the depreciation of the different components into account and by adding the operation and maintenance it is useful to calculate the cost for each month to be able to operate and maintain the system. Based on a fluctuating usage of the systems where it is needed to pay for money the average use of monthly water consumed for the system is calculated (see appendix 13). Based on this number it is possible to calculate the costs of each cubic metre water which is consumed. When this amount is known it is also possible to compare it with the actual price of bucket (20-litres). Because the water users pay for water there is an average monthly income and because of the depreciation of the components and the operation and maintenance of the system there are also monthly costs. By comparing the income and the costs there arise an insight if the system is profitable.
Formula 3.6
Formula 3.7

4
Figure 4.1Unprotectevalley neashallow weyear round
4
ed shallow well rby Maranje. Thell contains watd.
In
Re
In theusingshow
In pato conresultconstparagworkeresult
4.1
Differused
4.1.1
Due shallois settime, to 3 hvalleyvariesfreshimprodry u
4.1.2
Downswamand sfetchi
in the he er
nvestigation t
esults
e results theg the methown:
ragraph 4.1 ntinue with thts of the rtruction andgraph 4.5 theed out in pats in paragra
Actual w
rent methodsmethods are
Unprote
to the topoow wells are t as limit in spend on a
hours. Throuys, it is hards. Some sha, but with aoved shallowp in the midd
Swamp
nstream the wmps formed. swamps are ing water. W
towards alter
AMRE
s
ere will be pods, explaine
the actual uhe conclusiorainfall anal drilling of
e possible altaragraph 4.6aph 4.9.
ways for
s are used e discussed
ected shallo
ographical pall located othe Tanzaniround-trip fo
ugh the locatdly possible allow wells aran iron colo
w well which cdle of the dry
s in the ba
water catchmBecause of ta breeding
When the wet
rnative water
EF Flying Doc
resented all ed in chapt
used methodons of the villyses is givboreholes i
ternatives ar till 4.8 to c
r collecti
for collectingin the followi
ow wells
osition of thon a distancean water ac
or fetching oftion of the shto come th
re salty with our. In figurecontains wat
y season.
ase of the v
ments in the the stagnantspot for mosseason com
r resources in
ctors / Water
the results er 3. The f
s for collectiage meeting
ven in chapis discussedre introducedcome up with
ng water
g water in thing paragrap
he villages e of more thact of 2005. Inf water from shallow wells,
here by bikea milky coloe 4.1 is shoter. However
valleys
wet season,t water (see fsquitoes. It i
mes to its end
n Mtwara, Ta
rschap Velt &
which are ffollowing res
ng water is ags in chapter pter 4.3 whd in chapterd whereby thh an overvie
r
he project aphs.
on the platan 500 metren the dry seshallow wells, at the bottos. The wateur and someown an unpr, most of the
there are pofigure 4.2), ths as well a d and the dry
anzania
& Vecht 2
found by sults are
analysed 4.2. The
here the r 4.4. In
heses are ew of the
area. The
eau, the es, which ason the s takes 1 om of the er quality e water is protected e springs
onds and he ponds place for y season
20

Figure 4.The swamnearby th
Figure 4.3The floodpRiver, neaBandariar
2 mps in the vallehe village Ngoro
3 plains of the Ruarby the village rusha)
In
is sloswamon ththese
4.1.3
Villaguse tdrinkiBandlocateRiverwill cvillag
4.1.4
Peopwaterthe vvillagfar froa dep(17-4divertthe usmall
The occurtankscontaarea
ey ongoro.
uvuma
nvestigation t
owly enterinmps contain wese swamps
e swamps, si
Ruvuma
ges nearby tthe river (seing water. (
dariarusha) Aed further awr. For the villacost 8 hourse executive
Stored w
ple who haver for a longeillages. Somes contain som any othepth of 2.4 me45 cubic meted toward thnpaved walkl flows to a s
catchment ars, as well ass were full oamination tak(date observ
towards alter
AMRE
g, different water for a ls and pondsnce the near
a River
the Ruvuma ee figure 4.3Per.Comm. At the end way from theagers of Mals for a rounofficer, Mala
water in gr
e the ability er time. The me villages do
everal grounr water sour
etres (8ft). Thetre). The sthe ground taking pads onubsurface re
area is unprs losses by hof water andkes place aved: 06-05-20
rnative water
EF Flying Doc
swamps aronger period
s. People of rby located w
River, like 3) for washin
Ismael A Mof the dry e Ruvuma Ramba, fetch
ndtrip. (Per.Camba).
round tanks
to purchaseavailability oo not have and tanks, esprce. The tankhe diameter dtreams that ank. Normallyn small slopeeservoir, a ca
rotected, so high infiltratiod intensely nd there are010)
r resources in
ctors / Water
re running od water. Thesurrounding
water source
Ngorongoro ng, fishing aMkoba, villaseason also
River come ting of water Comm. Twa
s in the vill
e a hand dugof ground tanany ground wpecially Malaks that have differs in a raare formed y the small f
es in the villaatchment are
contaminaton into the saused by vil
e many loss
n Mtwara, Ta
rschap Velt &
out of waterre is a high villages opt
is dried up.
and Bandas well as soge executiveo villages wto fetch watat the Ruvum
alib Faraji C
lages
g reservoir cnks is diverswater tanks amba which isbeen visited
ange of 3 to by heavy r
flow is makinage. By leadiea is created
tion of the randy soil. Thlagers, even
ses in the ca
anzania
& Vecht 2
r. A few pressure
t to go to
ariarusha, ource for e officer,
which are er at the ma water
Chinanda,
can store e among
and other s located
d all have 5 metres rains are ng use of ng those .
rainwater he visited n though atchment
21

Figure 4.4Reservoirwater fromthe surfacfilling the is construin. A smalgive acce
Figure 4.Drinking ptap is lockunlocked
4 r in Malamba, wm two roofs andce are collected tank. A fence o
ucted to prevent ll door, in the fross to the water
5 points in Maranjked and one is
d.
In
They coverconst
Sporashowestab
4.1.5
In BaJapanBandconstnot ha
In theharvethe dwaterwater
4.1.6
With side smallgoatspersohuma
In thestore 200S1000is 50
where d from d for f wood t falling ont,
nje. One
nvestigation t
fetch the wr are construtructed to pro
adically roof wn in figure 4blished under
Buying w
andariarushan Internatio
dariarusha istructed in 20ad any break
e wet seasoest rainwaterdry season hr is even sor cost €1,45.
Water fr
the construcof the roadl ponds durins), infiltrated onal observaan consumpt
e dry seasonwater can s
SH (€ 0,12) iSH (€ 0,58) SH (€ 0.03,
towards alter
AMRE
water by makucted on theotect the chil
water harve4.4. The guttr a small slop
water from
a and Maranonal Coopes constructed002. The borekdowns till no
n, the borehr and fetch whowever, theld in the surIn figure 4.5
rom Roads
ction of new . The small ng rain. Hereor evaporat
ation it is notion.
n arises watesell the watein the rainyat the end oMarch 2010
rnative water
EF Flying Doc
king use of ae tank. Aroudren from fa
esting takes ters are madpe towards t
m boreholes
nje is still a wration Agend in 2000 aehole in Marow.
hole is normawater of near villagers marrounding vil5 there is sho
s
roads, drainadrainage ca
e it is storedted. By the
ot known wh
er scarcity. Fer. For a bucseason, for
of the dry se0). People w
r resources in
ctors / Water
a bucket on nd the tanks
alling into the
place. A node of GI shehe ground re
s
working borency (JICA).and the borranje has, un
ally not functrby unprotecake use of tlages. Normown a drinkin
age canals aanals collect until it is usstaff of AMRether the wa
For the peopcket of 20 litsome villagason. The c
who cannot
n Mtwara, Ta
rschap Velt &
a rope. Nors a fence of reservoir.
oteworthy exeets or PVCeservoir.
ehole, funde. The borerehole in Manlike other bo
tioning. The cted shallow the borehole
mally one cubng point.
are made in t the precip
sed by cattleREF and on ater is also
ple who weretres people es (Malamb
current value afford this o
anzania
& Vecht 2
rmally no f wood is
xample is C and are
ed by the ehole in aranje is oreholes,
villagers wells. In
e and the bic metre
the bank itation to
e (namely basis of used for
e able to pay from a), up to of water
offer their
22

Investigation towards alternative water resources in Mtwara, Tanzania
AMREF Flying Doctors / Waterschap Velt & Vecht 23
labour for cultivating land in exchange for water. (Per.Comm. Nuran Issa Liyumba, pump operator, Malamba)
4.2 Comparison of alternatives
The desktop study is done according to a funnel-model. The scope started as broad as possible without excluding any alternative. After this the possibilities were filtered according to parameters (like topography, geology, rainfall) which are representative for the project area. Out of the new list, the technical staff of AMREF selects three alternatives, next to the actual method of drilling deep boreholes. Those three alternatives will be tested at the phase III villages of the project area. Three alternatives will be discussed in respect to:
Affordability Technical usability Sustainability/durability Considerations
The not selected alternatives can be found in appendix 4. The selection is based on two criteria. The criteria of the methods are the geomorphology and hydrogeology of the area and the Tanzanian water policy, which prescribes are drinking point between 500 metres from each household.
The selected methods, meet the demand of the Tanzanian water policy. (The goal of the project of the AMREF boreholes is also reducing the distance for water fetching). The selected methods meet also the second criteria of the geomorphologic and hydro geologic characteristics of the area (as discussed in chapter 2.2)
Method Geomorphology and hydrogeology
Tanzanian water policy (<500 metres)
Flooding technique with ditch pattern
Unsuitable Unsuitable
Contour bending Unsuitable Suitable
Infiltration with percolation tank
Unsuitable Unsuitable
Roof water harvesting
Suitable Suitable
Recharge pit/shafts Suitable Unsuitable
Small earthen dam Unsuitable Unsuitable
Sand dam Unsuitable Unsuitable

Investigation towards alternative water resources in Mtwara, Tanzania
AMREF Flying Doctors / Waterschap Velt & Vecht 24
Surface water harvesting for subsurface soil storage
Suitable Suitable
Rock catchment Unsuitable Not applicable
Surface water harvesting with reservoir
Suitable Suitable
Water pyramids Suitable Unsuitable
4.3 Village meetings
Seven villages out of 13 of the third phase of the AMREF project have been visited. The strategy of the village meetings and minutes of each meeting can be found in appendix 7 & 8. The village consultation consists of questions whereby the villages need to think about the case when there is no water available. Which possibility do they know or, in their opinion, may be possible in this area. After that the possible alternatives are explained and the villages may give a reaction on the feasibility of the alternatives. The following general results came out of the discussions:
I. The people in the village are aware of the risks of fetching water at unprotected water sources.
II. All people give utmost priority to a reliable water supply nearby the villages.
III. For the possible alternatives (in comparison to the deep boreholes), a difference needs to be made according to the location of the villages. The villages that are located near the Ruvuma River are positioned in low-lying areas. All the other villages in the project phase are located at elevated areas, on the Ruvuma plateau.
The view of the villagers according to the village meetings on reliable water supply in the village are:
I. A reliable water supply with fetching point nearby the village (in each sub village one drinking point)
II. For creating an impervious layer for storage facilities only concrete is seen as possible.
III. For storage pots, with a maximum size of 100 litres, Masasi-clay may be suitable.
Table 4.1 Overview of possible alternatives, according to the desk study. On base of the criteria is made a selection of three suitable methods for this area.

Investigation towards alternative water resources in Mtwara, Tanzania
AMREF Flying Doctors / Waterschap Velt & Vecht 25
4.3.1 Possible alternatives according to villages
Low lying villages
One village is located in the low-lying areas nearby the Ruvuma River. The possible alternatives are:
Protected shallow wells Rain water harvesting by
o Roof water harvesting o Hard surface water harvesting
Elevated villages
The possible alternatives mentioned in the villages, which are located on the plateau, differ. The mentioned possibilities are less. Protected shallow wells are not suitable and trials of placing protected shallow wells (by Finnwater) have not been successful (Ngorongoro). Rainwater harvesting is seen as the suitable solution, but adequate storage is lacking. In one village (Maranje) the annual amount of rainfall is considered as not sufficient for being a reliable source of water for the whole village (the explanation of the rainfall analyses that the annual rainfall is sufficient for the whole village was ignored).
Furthermore, the villagers who are living on the plateau come up with possibilities to improve the water storage in the valleys. One of the possibilities is constructing a, so-called, Lambo (in some villages called Rambo). A basin of concrete is constructed in the bottom of the valley. Hereby it is possible to collect water from the surrounding hills. Locations of these Lambo are unknown.
The construction of protected shallow wells in the valley is mentioned as well. In Nachume there have been several attempts to dig a shallow well, but all the times the shallow well is collapsed by the recharge of groundwater. A protected shallow well made of concrete rings is seen as the solution.
4.3.2 Opinions about presented alternatives
All the alternative possibilities are seen as suitable and normally the people prefer both the deep borehole and the alternatives.
In Bandariarusha, the first priority is given to the borehole and then to alternatives. Maranje
(Owners of a working borehole) are putting question marks by the annual amount of rainfall and if this can be sufficient for providing water whole-year-round for all the villagers. Besides, their own water supply, they prefer another borehole, so they will have the possibility to sell more water to people from other villages.
During the dry period all the villages, except Marnaje, are facing problems with scarcity. Maranje is the only village with a working deep borehole.

Figure 4.6An overvimeetings.follows: lisand the pby the villthe possibdiscussionalternative The picturmeeting inMalamba (bottom-le(bottom-ri
6 iew of different v. The strategy isstening to the dossibilities proplagers. Explanable alternatives n about the poses.
res shows the vn Nachume (top(top-right), Mar
eft) and Ngoronight)
In
This rainwseen
The receivharvea cerinfiltralead t
Roof Howevillagas roo
An imdiffere
In undvillag
The tareashas baltern
The cclosevillagsysteactiveis me
village s as
demand posed tion of and a
ssible
village p-left), ranje gro
nvestigation t
borehole is cwater harvest
as a problem
alternative ving possibleesting. The rartain depth ated rainwatthe water to
water harvever, this cae, as there aof.
mpression of ent village m
derneath tabes and the m
table is divides and that arebeen a discusnatives accor
conclusion ofe as possible e. The ment
ems in the rege or inactive entioned seve
towards alter
AMRE
constructed bting is seen m in Malamb
whereby rae attention. ainwater is leis placed aer. By makina well.
vesting is sannot be conare not suffic
f the village meetings are
ble 4.2 is givementioned po
ed by the ville located at ssion about trding to the v
f the demandto the villageioned possibgion. Some osystem is kneral times bu
rnative water
EF Flying Doc
by JICA in 2as an esse
ba and Nachu
inwater is uThe alternatead to an infn impervioung use of a
een as a pnsidered as cient househ
meetings cashown.
en an overvieossible altern
ages, which the elevatedthe demandsvillagers.
ds for a village. If possibleble alternativof the possibnown in the aut the people
r resources in
ctors / Water
002. To tackntial solutionume.
used and stive is basedfiltration field us layer to adrainage sys
possibility foa source of
holds with ga
an be seen in
ew of the denatives.
are located areas. In eas of the villag
ge is a reliabe, a drinking es are all ba
bilities are mearea. The lame spoken to, h
n Mtwara, Ta
rschap Velt &
kle the water n. Lack of st
stored in thed hard surfawhere it is s
avoid leakinstem it is po
or local houf water for thalvanized iro
n figure 4.6,
mands of the
in the low-lyach village mges and the p
ble water suppoint in eachsed on usedentioned but mbo, for examhave never s
anzania
& Vecht 2
scarcity, torage is
e soil is ce water
stored. At g of the
ossible to
useholds. he whole on sheets
where 4
e visited
ing meeting possible
pply as h sub d
no mple, it seen it.
26

Investigation towards alternative water resources in Mtwara, Tanzania
AMREF Flying Doctors / Waterschap Velt & Vecht 27
Village Demands Mentioned possible alternatives
Low lying villages
Bandariarusha
Reliable water supply in each sub village.
Deep Borehole
Shallow wells
Big roof for surface water harvesting
Elevated villages
Maranje Another borehole with drinking points in every sub village
-
Malamba High need for water. Roundtrip in dry period is up to 8 hours per day per household.
There is a unique place for a ‘lambo’ (8km of the village)
Replacing of the broken submersible pump of the JICA borehole.
Water harvesting (roof & surface)
Mtopwa Clean water without iron Shallow wells in the valleys.
Mkahara Concrete rings to prevent collapsing their dug shallow well.
Water supply before the drilled AMREF borehole.
Big tanks by big roofs, for rainwater harvesting
Ngorongoro A reliable water supply nearby the village. The fetching time is in the dry period 4 hours for a roundtrip.
Construction of shallow wells in the valleys.
Construction of ‘lambos´ in the valleys
Use of roof water harvesting
Collect water from small streams nearby village during wet period.
Nachume Storage facilities for collecting rainwater.
Filtering of dirty surface water.
Improve unprotected shallow wells in the valleys.
A ‘lambo’, which is constructed in the valley
Table 4.2 The table shows an overview of the visited villages with their demands and mentioned possible alternatives. A division is made with low-lying villages and elevated villages.

Investigation towards alternative water resources in Mtwara, Tanzania
AMREF Flying Doctors / Waterschap Velt & Vecht 28
4.4 Rainfall analysis
Rainfall data is obtained from weather station Naliendele Agromet, prepared by S.B. Pallangyo. The data covers a period of more than 14 years, from January 1995 to March 2010. Naliendele Agromet is located in the project area and with a radius of 30 km it covers the whole project area. It is assumed that in this area the deviation of the precipitation data is insignificant and for that reason the data of this weather station is representative for the whole area.
In figure 4.7 is shown a comparison with the FAO data (see chapter 2.3). The FAO data shows the same patron of line, but gives some small differences in the months February and March. In those two months the precipitation is, respectively 36 and 46 mm less by comparing it with the precipitation of weather station Naliendele. The used precipitation data for the calculations in this study are based on the weather station Naliendele,
By ranking the annual precipitation and plotting the average within one standard deviation the annual precipitation that have occurred about 68% of the time, by a normal probability distribution. By calculating the probability of occurrence for each year, it is found that the lowest value between one standard deviation (the year 2007) is equivalent with a probability of 80%. This means that the annual precipitation of the year 2007 occurs in 8 out of 10 years and for this the repetition time is 1 in 5 years. For these reasons, priority is given to the precipitation of 2007 by the calculations in this study.
0
50
100
150
200
250
January
February
March
April
May
June
July
August
September
Octo
ber
Novem
ber
Decem
ber
mm/m
onth
Comparison precipitation data from FAO & Naliendele weather station
Prcipt FAO (mm) Prcipt Naliendele (mm)
Figure 4.7 Graph with the comparison the precipitation of the FAO data (see chapter 2.3) with the data of the Naliendele weather station. In the months February and March the differences of the precipitation are, respectively 36 and 46 mm.

Figure 4.8Graph of annual raand 2009average alines are standard plus stand
8 the distribution
ainfall between 19. The red line isand the small grthe average mindeviation and adard deviation.
In
In figprecipdevia
Meanperiodprecipdiffersthe mFromdecre
By taprecipannua
4
1
1
14
1
1
Precipitation (mm)
of the 1997 s the reen nus
average
nvestigation t
gure 4.8 is pitation that
ation. The pro
n annual pred of interespitation by ts from 567 m
mean annuam 2002 to 20easing by tim
aking the 5-ypitation remaal peeks are
0
200
400
600
800
000
200
400
600
800
2004
2002
Ranked one
Prcpt.
towards alter
AMRE
seen that tt falls in thobability for t
ecipitation is st; it is obtthe number mm in 2003 tal precipitatio009 there arime.
year moving ains betwee replaced by
2002
2006
2008
2000
Annual Pre standard d
Average
rnative water
EF Flying Doc
the year 20he range ofthis year is 8
the averagtained by dof months a
to 1619 mm on is slowly ses a saw p
average it isn 80 and 10
y a smoother
2000
2001
1997
1999
ecipitation, deviation (N
Average
r resources in
ctors / Water
07 is the yf average m
80%.
e precipitatioividing the a year. The in 2004. In fincreasing
patron, with
s found that 00mm and thr constant tre
1999
1998
1996
1995
orange maNaliendele s
‐ Stdev / Ave
n Mtwara, Ta
rschap Velt &
year with theminus one
on for the msum of all annual pre
figure 4.9 is sfrom 1995 high and low
the averagehat the high
end line.
1995
2007
2009
2005
rk for rangestation)
rage + Stdev
anzania
& Vecht 2
e lowest standard
multi-year monthly
cipitation seen that to 2001. w peeks,
e monthly and low
2005
2003
e
29

Investigation towards alternative water resources in Mtwara, Tanzania
AMREF Flying Doctors / Waterschap Velt & Vecht 30
The annual variations are analysed, so the next focus will be on the monthly variations. In figure 4.10 the average monthly precipitation and the precipitation of 2007 is plotted. By taking a two year period the wet period comes up well in the period from September until May, whereby it is split if only one year is taken (on the left and right side of the graph).
By analysing the mean monthly precipitation, it is shown that there is one dry period and one wet period. The dry period starts in May and goes up to October, the wet period is from November to April. The top of the wet-period is in March followed by lower peeks in February and January. The top in March is around 213mm and in June, the precipitation is only 5mm. The overall precipitation for a year with reliability of 50% is 1063mm.
By analysing the precipitation of 2007 there are a few differences compared to the average. The dry period lasts one month longer and is from May until December. In the wet period, the precipitation is more concentrated in the months February and April. With a significant lower amount in precipitation in December and January, (less than 50% compared to the average). The overall precipitation for the year 2007 is 797mm. That is a difference of 266mm compared to the mean annual precipitation.
For different reasons the precipitation data of the year 2007 is taken as standard for further calculations in this study: The calculated repetition time of the minimum annual precipitation is 1 in 5 years. The rainfall intensity is not gradual over the whole year round, but 53% of the annual precipitation falls in two months (February and April). The storage facilities need to be dimensioned in a way that enough water can be stored to overcome seven months of dryness.
40
56
72
88
104
120
136
1995
1996
1997
1998
1999
2000
2001
2002
2003
2004
2005
2006
2007
2008
2009
Precipitation (mm)
Variation of Annual Precipitation Around Longer‐term Mean Precipitation for Period of Record + 5‐Year Moving average for Mean annual precipitation
Mean annual precipitation
Mean precipitation for period of record (88.39mm)
5‐Year Mov. Avg. (Mean annual precipitation)
Figure 4.9 Mean Annual Precipitation. In blue is plotted the average precipitation over the years 1995 to 2009. In red is plotted the average over the period of record and in green is plotted the 5-year moving average. The high and low peeks from the mean annual precipitation are faded in a smoother trend by visualising a 5-year moving average.

Figure 4.Two curvperiod of and obtaithe dry encolumn simonthly pcolumn shof the yeaperiod forprecipitatthe wet pconcentra
10 ves are plotted o
two years to visin a better overvn wet period. Thignifies the meaprecipitation thehows the precipar 2007. The wer the mean montion is smooth weriod of 1007 isated on a few m
In
Chara
1
1
2
2
Precipitation (mm)
over a sualize view of he blue an e red pitation et nthly whereby s
months
nvestigation t
acteristics fo
Repetition Dry perio Wet perio Overall p 53% of th
April.
0
50
100
150
200
250January
February
March
Mont
towards alter
AMRE
or the year 20
n time is 1 ind is 7 month
od is 5 monthrecipitation ohe annual ra
April
May
June
July
August
hly Precipit
Mean month
Precipitation
rnative water
EF Flying Doc
007:
n 5 years hs hs, of 797.3mmain falls in tw
August
September
October
November
Decem
ber
tation (for p
ly Precipitatio
of 2007 (relia
r resources in
ctors / Water
wo months, n
January
February
March
April
Ma y
period of tw
on (reliability o
ability of 80%)
n Mtwara, Ta
rschap Velt &
namely Febr
yJune
July
August
September
October
wo years)
of 50%)
anzania
& Vecht 3
uary and
October
November
Decem
ber
31

Table 4.3 Descriptiodifferent cconstructin
Figure 4.1Overview boreholesthe borehopanels. Thtot the elewhere it isdifferent d
on and costs of tcomponents for ing a borehole.
11 of the system o
s. On the left sidole with the solahe water is pumevated tank froms distributed to drinking points.
In
4.5
The atankswater4.11
If the reliabshow
Desc
Wate
Distri
Cons
Pump
Solar
Subm
Total
In tabseen €11.1€9.88€30.0water
the
of de is ar
mped m
nvestigation t
Constru
actual approas. The waterr tank the wis shown an
system is wbility of suppl
wn in table 4.2
cription of C
er storage tan
bution netwo
struction of bo
p house
r panels
mersible pum
l
ble 4.3 the coin figure 4
119. In the b81 and the en000 and haver tank of 50
towards alter
AMRE
ucting an
ach is the drr tanks have
water is distroverview of
well maintainely are 100%2.
Components
nk (50m³)
ork
orehole
mp
osts of the d4.11. The dborehole is pnergy is come a depreciam³ and cos
rnative water
EF Flying Doc
nd drillin
illing and cone the capacitributed to difthe system
ed the dema. The total co
s Cos
different comrilling and cplaced a sub
ming from theation of 20 yet €16.352 fr
r resources in
ctors / Water
ng of bor
nstruction of ty of 50 cubfferent drinki
nd satisfactioosts of the d
sts in Euro
16.352,00
13.081,00
11.119,00
5.000,00
30.000,00
9.811,00
85.363,00
ponents are construction bmersible pue solar panelears. The warom where it
n Mtwara, Ta
rschap Velt &
reholes
boreholes abic metres. Fing points.
on, efficiencydifferent elem
Costs in
28.1
22.5
19.1
8.6
51.6
16.8
146.9
shown whicof a boreh
ump. This pus. Solar pan
ater is pumpet is distribut
anzania
& Vecht 3
and water From the In figure
y and the ments are
in Shilling
58.144,00
525.482,00
46.918,00
610.000,00
660.000,00
894.542,00
95.086,00
ch can be hole cost ump cost els costs ed to the ed by to
32

Investigation towards alternative water resources in Mtwara, Tanzania
AMREF Flying Doctors / Waterschap Velt & Vecht 33
different drinking points. This distribution network cost €13.081, which include all the pipes and taps.
By taking into account the depreciation of each component and assuming that the labour price is included in the price of the investments the total cost/month is €442,11, table 4.3. Including the operation and maintenance the total cost for each month is €662.11.
Based on the average monthly cubic metre water consumed, the price per cubic metre water should be € 1.84. (total budget in appendix 13). At the moment the actual price for one cubic metre water is €1.45 (see chapter 4.1)
Calculation of costs per month and per m³ consumed
Cost/month Price per m³ (€)
Investments (include labour costs) 442,11 1,23
Operation and Maintenance
- Maintenance and repair 100,00 0,28
- Salary 120,00 0,33
Total 662,11 1,84
The total costs for each month are 662,11 and based on the average monthly consumption of water the monthly income for the system is 521,94. This means that there is a monthly loss of 140,17, as can be seen in table 4.5.
Monthly income (€) 521,94
Monthly costs (€) 662,11
Difference income and costs (€) - 140,17
4.6 Alternative 1. Surface water harvesting with subsurface storage
This method is based on a possibility found in a study for rain water harvesting in Sri Lanka. In this study, it is mentioned: “A cheaper catchment surface can be made by laying a piece of plastic sheeting in a shallow excavated and levelled area”.
The water storage capacity draining capacity of coarse sandy soil is 34%, this result in volumetric moisture storage of 340 Litres for every cubic
Table 4.4 Overview of the calculations of the monthly costs and the price for one cubic meter.
Table 4.5 Overview of the monthly income and costs. It can be seen that this alternative is not profitable.

Figure 4.Schemati1. The wsoil and drains it shallow w
12 ic sketch of altewater is stored d by making
is lead to a prwell
In
metreIRC. Sanit
On thand ihumudepthprecipdownprecipto thethem period
I.
II.
Pondfor th
The u
4.6.1
Showtime price,relateand d
ernative d in the
use of rotected
nvestigation t
e. (Water Ha- The Ha
tation Centre
he bases of fin the villageus and on theh of the layepitation will
npour almospitation thate valleys. Thmore suitab
d for two rea
Due to threcharge Clayish sis possibcertain le
ds and swamree to four m
use of coarse
Infiltrationevaporati
The soil ia filter
No mosq Process o
Affordab
wn underneaconsuming. , based on ted durability.durability.
towards alter
AMRE
arvesting. A gue, The N
e, 1992)
field observaes are very e places in tr of humus iinfiltrate qui
st no watedrops at the
he top soil inble for agricuasons:
he hills arounby seepage
soil has a higble to retain vel.
mps are formemonths into th
e sandy soil
n rate is hion is able to rem
uito breedingof mineralisa
bility
th are the eThe costs o
the selection The materia
rnative water
EF Flying Doc
Guide for PNetherlands;
ations can besandy. On
the village ws only one tickly at the er pools or hillsides wiln the valleysulture. The v
nd the valleyof the infiltra
gher moisturthe ground
ed in the rainhe dry period
as storage fa
high what r
move small c
g, by absencation improve
lements for tof the placemn of materialals in this stu
r resources in
ctors / Water
Planners and IRC Inter
e concluded many placehere there iso two decimplateaus. D
r ponds ocl partly infiltrs contains mvalleys conta
ys this result ated precipitare supplying
dwater for a
ny season thd.
acility has dif
results in a
contaminatio
ce of stagnates water qua
the costs. Pment of poinl. The mater
udy are base
n Mtwara, Ta
rschap Velt &
d Project Manational Wa
that the soils, there is ts little agricu
metre. As a reirectly after ccur. Howerate and partmore clay anain water for
in a longer ation. capacity, wlonger peri
hat can conta
fferent advan
a minimum
ons because
ed surface wlity
oint I and V nt II - IV canrials corresp
ed on cost, av
anzania
& Vecht 3
anagers / ater and
s around totally no lture, the esult, the a heavy ver, the tly run off d makes a longer
period of
whereby it iod on a
ain water
ntages.
loss to
it act as
water
are very n vary in ond to a vailability
34
Investigation towards alternative water resources in Mtwara, Tanzania
AMREF Flying Doctors / Waterschap Velt & Vecht 35
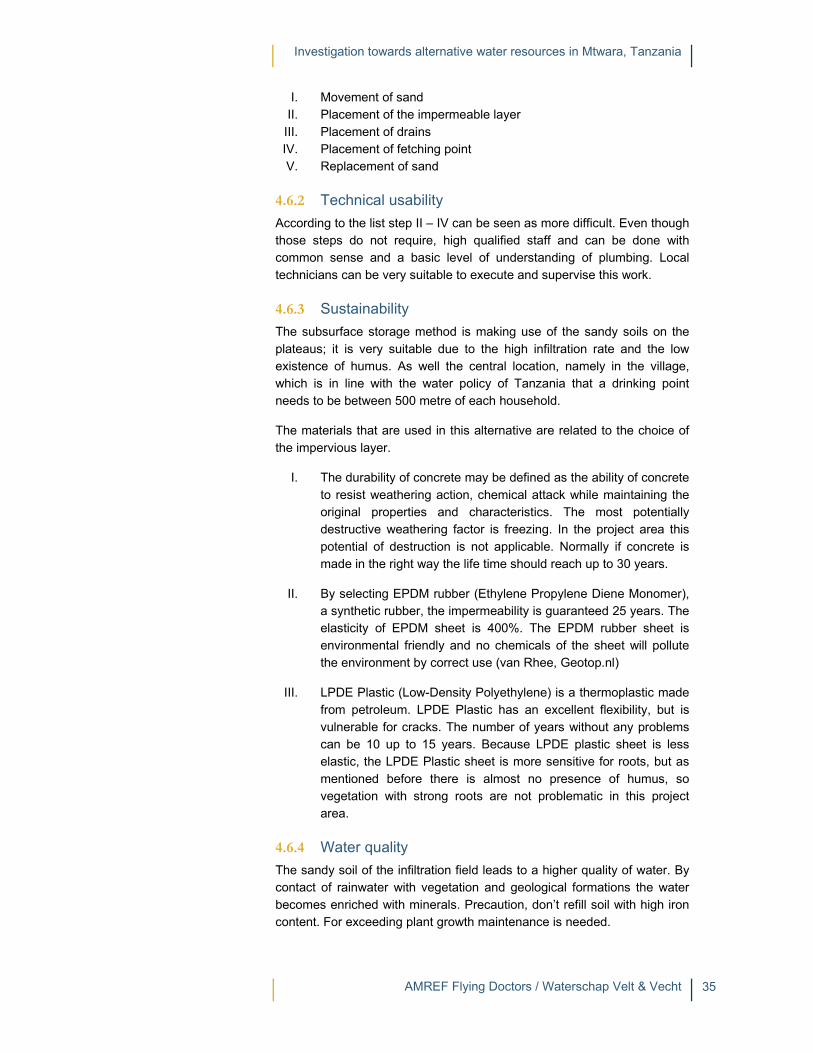
I. Movement of sand II. Placement of the impermeable layer
III. Placement of drains IV. Placement of fetching point V. Replacement of sand
4.6.2 Technical usability
According to the list step II – IV can be seen as more difficult. Even though those steps do not require, high qualified staff and can be done with common sense and a basic level of understanding of plumbing. Local technicians can be very suitable to execute and supervise this work.
4.6.3 Sustainability
The subsurface storage method is making use of the sandy soils on the plateaus; it is very suitable due to the high infiltration rate and the low existence of humus. As well the central location, namely in the village, which is in line with the water policy of Tanzania that a drinking point needs to be between 500 metre of each household.
The materials that are used in this alternative are related to the choice of the impervious layer.
I. The durability of concrete may be defined as the ability of concrete to resist weathering action, chemical attack while maintaining the original properties and characteristics. The most potentially destructive weathering factor is freezing. In the project area this potential of destruction is not applicable. Normally if concrete is made in the right way the life time should reach up to 30 years.
II. By selecting EPDM rubber (Ethylene Propylene Diene Monomer), a synthetic rubber, the impermeability is guaranteed 25 years. The elasticity of EPDM sheet is 400%. The EPDM rubber sheet is environmental friendly and no chemicals of the sheet will pollute the environment by correct use (van Rhee, Geotop.nl)
III. LPDE Plastic (Low-Density Polyethylene) is a thermoplastic made from petroleum. LPDE Plastic has an excellent flexibility, but is vulnerable for cracks. The number of years without any problems can be 10 up to 15 years. Because LPDE plastic sheet is less elastic, the LPDE Plastic sheet is more sensitive for roots, but as mentioned before there is almost no presence of humus, so vegetation with strong roots are not problematic in this project area.
4.6.4 Water quality
The sandy soil of the infiltration field leads to a higher quality of water. By contact of rainwater with vegetation and geological formations the water becomes enriched with minerals. Precaution, don’t refill soil with high iron content. For exceeding plant growth maintenance is needed.

Investigation towards alternative water resources in Mtwara, Tanzania
AMREF Flying Doctors / Waterschap Velt & Vecht 36
Preventing the water for pollution it is important that the infiltration field and the surrounding surface catchment will not come in contact with any faecal defecation. Hence it is necessary to build a good fence to keep out animals
4.6.5 Performance and cost analyse
The comparison is done by first analysing the performance indicators related to demand satisfaction, efficiency and reliability of supply. The next step is to compare the costs of the possible different materials of the systems with the other performance indicators, payback time, equivalent unit costs and the costs for water user for each cubic metre storage. The total costs of the system are also included.
Village population: 1918 (average 3rd phase villages) Village households: 383 (average 3rd phase
villages)
Demand 15L/c/day Repetition time
1 in 2 years
Repetition time
1 in 5 years
Repetition time
1 in 10 years
Type o
f catchmen
t
Size of sto
rage / diam
eter(m)
N° o
f fields / su
rface roof(m
²)
Dep
th of sto
rage (m) / vo
lume
(m³)
Offset (m
)
Dem
and satisfactio
n (%
)
Efficiency (%
)
Reliab
ility of su
pply (%
)
Dem
and satisfactio
n (%
)
Efficiency (%
)
Reliab
ility of su
pply (%
)
Dem
and satisfactio
n (%
)
Efficiency (%
)
Reliab
ility of su
pply (%
)
Subsurface
soil sto
rage
B.field
12 3 15 120% 100% 100% 90% 100% 84% 82% 100% 87%
15 3 15 142% 95% 100% 112% 100% 100% 103% 100% 97%
16 3 15 150% 94% 100% 120% 100% 100% 110% 100% 100%
½ S. Field
3 2 25 137% 97% 100% 107% 100% 100% 98% 100% 93%
4 2 25 171% 91% 100% 137% 97% 100% 127% 97% 100%
4 2.5 25 189% 100% 100% 142% 100% 100% 130% 100% 100%
S.field
2 1 25 126% 77% 100% 98% 80% 93% 88% 79% 90%
2 1.5 25 144% 89% 100% 116% 95% 100% 107% 95% 100%
2 2 25 163% 100% 100% 122% 100% 100% 112% 100% 100%
First an example on how to read table 4.6:
In the top is mentioned for how many water users the system is applicable. In this case, the subsurface ground catchment (seen on the row which is marked with the colour green) is applicable for a village population of 1918. This is the average population of the village of the 3rd phase in the project. The number of households is related to the population and for that 383 (each household exists out of 5 persons). The demand is based on the baseline survey done prior to the execution of the project. The different repetition times are the amount of annual
Table 4.6 The results of the performance indicators of alternative I, subsurface soil storage. The example is discussing the green cells and the blue cells are the results, based on the best performing dimensions

Figure 4.Graph of by differe
13 f the fluctuation sent annual rainfa
In
rainfaand 1syste
In thethe fir
By anthe m
The tThe ssoccefieldssurfaSummwith tdepthmetre
The prainfatime that ause. collecthe pstorag
The eby ththat twaterOverf
storage all
nvestigation t
all. There are1 in 10 year
em will be ba
e next row arst three perf
type of ca size of sto number o depth of s offset wid
nalysing the model to find
type of the size of the ser field, this s will be 2 ace of the fiemary: to covthe size of a h of 1 metree.
performanceall. By takingof once in twannually moAs explaine
cted precipitaperformance ge facility tha
efficiency is e catchment
there is overfr from Januaflow leads to
towards alter
AMRE
e three differers. Based onsed on a rep
are the headformance ind
atchment; orage / diam
of fields / surfstorage (m) /dth (m)
green cells,the best sys
catchment issurface for tcorrespond
and the depeld is 15 meter the demasoccer field
e and the of
e indicators g a look at thewo years there water is ded, water thation minus of the who
an the water
77%, which t area was aflow. Figure ary to March
o inefficiency
rnative water
EF Flying Doc
ent repetitionn the rainfal
petition time o
ders of the cdicators. The
meter (m) face roof (m²/ volume (m3
, as an examtem dimensi
s a surface he storage fto the size o
pth of the fietre available
and in an ave are neededffset width a
give differene results of ae demand sdelivered thahat is delivethe overflow
ole year ther users annua
means that able to store4.4 shows th. In these . From April
r resources in
ctors / Water
n times, 1 in l analyses itof 1 in 5 yea
characteristice characterist
²) 3)
mple, it is poons.
catchment wfacility is setof 100m by eld will be 1to increase
erage village. The infiltrat
around the in
nt values for an annual raiatisfaction isan the wateered to the
w of the storare has beenally need.
not all the we in the storahat the storathree monththe storage i
n Mtwara, Ta
rschap Velt &
2 years, 1 int is decided rs.
cs of the systics are as fo
ossible to un
with ground t as the surf60m. The nu1 metre. Arothe catchme
e two infiltrattion fields winfiltration fiel
r the differeninfall with a rs 126%. Thar users werewater user
age facility. Bn more wate
water that is age facility; age facility whs, there is ois slowly dec
anzania
& Vecht 3
n 5 years that the
stem and ollow:
derstand
storage. face of a umber of ound the ent area. ion fields ill have a lds is 15
nt annual repetition at means e able to rs is the By taking er in the
collected it means
was full of overflow.
clining.
37

Investigation towards alternative water resources in Mtwara, Tanzania
AMREF Flying Doctors / Waterschap Velt & Vecht 38
The reliability of supply is 100%. That means that there were no days without water. All the days of the year, the storage facility is containing water.
By analysing the same performance indicators by a repetition time of once in five years the demand satisfaction is 98%, the efficiency is 80% and the reliability of supply is 93%. The efficiency is increasing because the overflow is declining; the reliability of supply and the demand satisfaction are becoming under the 100%. This means that there is insufficient water in the storage facility by an annual rainfall with a repetition time of 1 in 5 years.
It is even becoming worse in case of an annual rainfall with a repetition time of 1 in 10 years. The demand satisfaction and the reliability of supply are declining to representative 88% and 90%; the efficiency is decreasing with 1% to 79%.
Analysing the results with a repetition time of 1 in 5 years three different dimensions are considered,
surface of a basketball field (28 metre by 15 metre) surface of half a soccer field (60 metre by 50 metre) surface of a soccer field (100 by 60 metre)
For each of the different surfaces, different dimensions have been analysed and the best results with realistic assumptions are placed in bold and have blue shading.
An average village has a population of 1918 people. By selecting the size of a basketball field as surface of the infiltration fields, 15 infiltration fields are needed. These infiltration fields’ needs to have a depth of 3 metres and the offset width (catchment area) around the infiltration field should be at least 15 metre. The offset is needed to increase the size of the catchment area. With those dimensions, the system delivers a reliable supply of water, without overflow and whereby more water is collected than the demand. The demand for the average village is based on 15 litres per capita per day.
A reliable supply of water is also possible when the infiltration field has the size of half a soccer field. In this case, four fields needs to be dug, with a depth of 2 metres. There is a slightly overflow of 3%. By digging an infiltration field with the dimensions of a soccer field, a depth of 1.5 metres is needed. The reliability of supply is 100%, but 5% of the annual precipitation will overflow.
In figure 4.14, the fluctuations of the selected (in bold/blue, table) dimensions with the best results are shown. The results of the dimensions of a basketball field are similar to the results of the dimensions of a soccer field. By selecting, an infiltration field with the dimension of half soccer field the results shows a higher storage capacity.
The main reason why the infiltration field with the dimension of a 1/2 soccer field has a higher storage capacity is a bigger catchment area. In

Investigation towards alternative water resources in Mtwara, Tanzania
AMREF Flying Doctors / Waterschap Velt & Vecht 39
the wet season more rainwater is collected and stored in the storage facility. The storage capacity is bigger, what result in a higher level of water in the storage facility in the end of the dry season (November)
The next step is analysing the results of the performance indicators that are related to costs.
In the last example is discussed the dimension of a soccer field with an offset width of 30 metres. The number of infiltration fields is two and the depth is two metres. There is a choice of three different possible materials to construct an impervious layer. The three different materials are concrete, LPDE plastic sheet and EPDM rubber sheet. As discussed in the explanation of the method (see chapter 4.2.3) the different materials have different advantages and disadvantages.
By taking concrete as an example, the different results from the performance indicators are as follows:
The payback time is 43 months. This means that the money that is earned based on the annual water demand in 3 years and 6 months will be enough to pay back the construction costs. The total costs are almost € 55,000 - and the cost/m³/water user will be € 0,46.
By looking to the bold/blue cells in table 4.7 it can be conclude that the infiltration field with the surface of a soccer field has the cheapest construction costs (orange cell). By a depth of 1.5 metres the construction costs will be € 26,277.The payback time is 20 months and the construction cost for one cubic metre will be € 344. That means that the costs for 1m³ for each water user is € 0,18.
By increasing the depth with 0.5 metre to 2.0 metres, the efficiency is increased to 100% (see table 4.6), what means that there is no overflow. The total construction costs will increase with 5.8% to € 33,975.
0
2000
4000
6000
8000
10000
Decem
ber
January
February
March
April
May
June
July
August
September
Octo
ber
Novem
ber
Storage
Cap
acity (m
³)
Fluctuation storage capacity (in m³) based different surface dimensions with repetition time of 1 in 5 years
Basketball field 1/2 Soccer field Soccer field
Figure 4.14 Graph of the fluctuation storage by different dimensions of the infiltration field. The repetition time of the annual rainfall is 1 in 5 years.
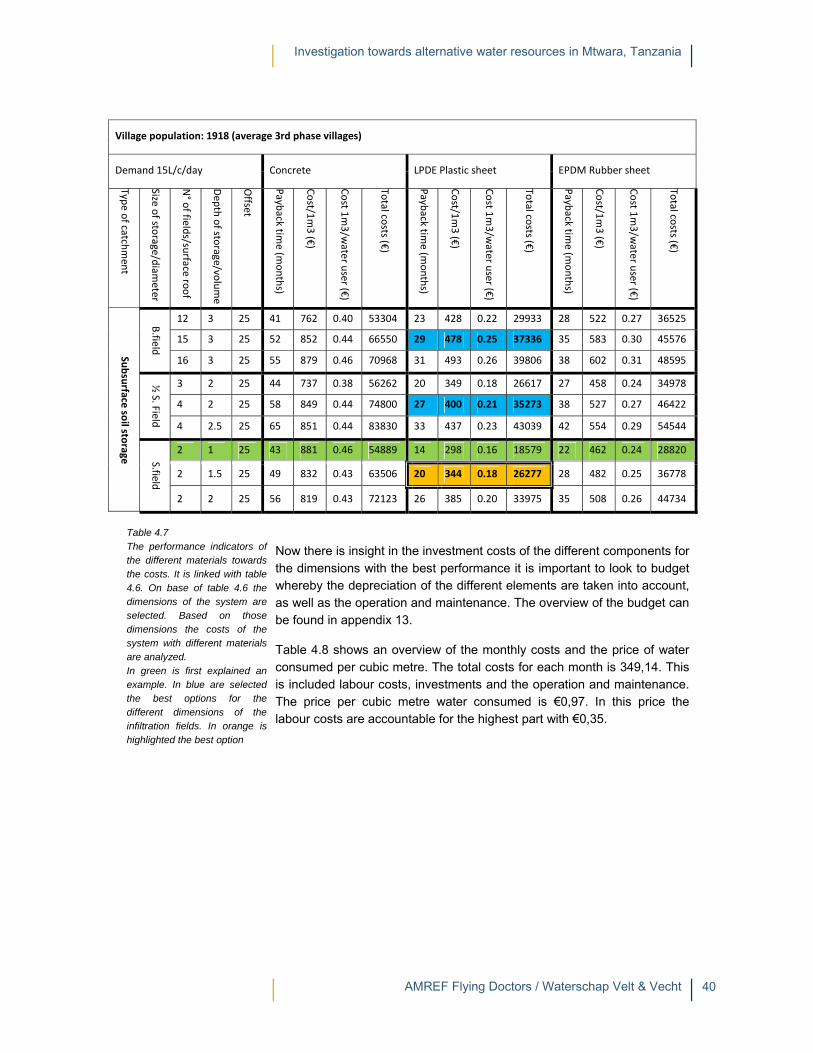
Investigation towards alternative water resources in Mtwara, Tanzania
AMREF Flying Doctors / Waterschap Velt & Vecht 40
Village population: 1918 (average 3rd phase villages)
Demand 15L/c/day Concrete LPDE Plastic sheet EPDM Rubber sheet
Type o
f catchment
Size of sto
rage/diam
eter
N° o
f fields/su
rface roof
Dep
th of sto
rage/volume
Offset
Payb
ack time (m
onths)
Cost/1
m3 (€
)
Cost 1
m3/w
ater user (€
)
Total co
sts (€)
Payb
ack time (m
onths)
Cost/1
m3 (€
)
Cost 1
m3/w
ater user (€
)
Total co
sts (€)
Payb
ack time (m
onths)
Cost/1
m3 (€
)
Cost 1
m3/w
ater user (€
)
Total co
sts (€)
Subsurface so
il storage
B.field
12 3 25 41 762 0.40 53304 23 428 0.22 29933 28 522 0.27 36525
15 3 25 52 852 0.44 66550 29 478 0.25 37336 35 583 0.30 45576
16 3 25 55 879 0.46 70968 31 493 0.26 39806 38 602 0.31 48595
½ S. Field
3 2 25 44 737 0.38 56262 20 349 0.18 26617 27 458 0.24 34978
4 2 25 58 849 0.44 74800 27 400 0.21 35273 38 527 0.27 46422
4 2.5 25 65 851 0.44 83830 33 437 0.23 43039 42 554 0.29 54544
S.field
2 1 25 43 881 0.46 54889 14 298 0.16 18579 22 462 0.24 28820
2 1.5 25 49 832 0.43 63506 20 344 0.18 26277 28 482 0.25 36778
2 2 25 56 819 0.43 72123 26 385 0.20 33975 35 508 0.26 44734
Now there is insight in the investment costs of the different components for the dimensions with the best performance it is important to look to budget whereby the depreciation of the different elements are taken into account, as well as the operation and maintenance. The overview of the budget can be found in appendix 13.
Table 4.8 shows an overview of the monthly costs and the price of water consumed per cubic metre. The total costs for each month is 349,14. This is included labour costs, investments and the operation and maintenance. The price per cubic metre water consumed is €0,97. In this price the labour costs are accountable for the highest part with €0,35.
Table 4.7 The performance indicators of the different materials towards the costs. It is linked with table 4.6. On base of table 4.6 the dimensions of the system are selected. Based on those dimensions the costs of the system with different materials are analyzed. In green is first explained an example. In blue are selected the best options for the different dimensions of the infiltration fields. In orange is highlighted the best option

Investigation towards alternative water resources in Mtwara, Tanzania
AMREF Flying Doctors / Waterschap Velt & Vecht 41
Calculation of costs per month and per m³ consumed
Cost/month Price per m³ (€)
Labour costs 125,13 0,35
Investments 86,63 0,23
Operation and Maintenance
- Maintenance and repair 20,00 0,06
- Salary 120,00 0,33
Total 349,14 0,97
The monthly costs are 349,14 and the monthly income is 521.94. The monthly income is based on the average monthly consumption. The price for one cubic metre of water is set as the same as the actual price of €1.45.
As can be seen in table 4.9, the difference in income and costs is €172,80. This means that the system with surface water harvesting with subsurface soil storage is profitable.
Monthly income (€) 521,94
Monthly costs (€) 349,14
Difference income and costs (€) 172,80
Table 4.8 Overview of the costs per month and the costs for each cubic metre water consumed
Table 4.9 Presented is the difference of the income and the costs. By making use of this alternative the system will be profitable.

Figure 4.Schemati2. The wsurface subsurfac
15 ic sketch of altewater is lead
catchment tce reservoir
In
4.7
This for cowet evapoconcron thThe depecapac
By prto theevaporange90% figure
4.7.1
The reseramouarea invespoten
4.7.2
The das wesimilasubsu
4.7.3
The sis po
ernative by the
to the
nvestigation t
Alterna
alternative isollecting rainwthe groundoration. Therete, asphalte ground. Samount of rnds on whetcity of the top
reparation ofe point of cooration and es from abofor a slopin
e 4.15 is show
Affordab
biggest invrvoir should unt of water tshould be b
stment in an ntial of the ca
2 Technic
difficulty in teell by the faar systems. urface reserv
3 Sustain
sustainabilityossible to br
towards alter
AMRE
ative 2. S
s based on water run-off
d, is storede losses cat, or plastic sometimes sirainwater thather the catcp layer. (J. M
f the ground ollection andinfiltration lout 10% for g strip catchwn a schema
bility
estment is have a vo
to overcomebig enough t
impermeabatchment are
cal usability
echnical usaact that seve
A pickaxe voir, some st
ability
y depends oning down th
rnative water
EF Flying Doc
urface w
ground surfaf. Part of thed in depresn be reduc
sheeting to fomply compaat can be chment is flat
Mbugua, Rain
surface, a sd storage casses. The poa pervious, hment coveratic overview
the subsurflume that is
e the seven mto catch a sule pavement
ea.
y
ability is not veral local ho
and a shotrong men ar
n the maintenhe losses du
r resources in
ctors / Water
water har
ace catchme rainfall will bssions, or ed by consorm a smootacting of the collected in t or sloping, anwater harve
sufficiently ran be assureortion of rainflat ground
red with impw of the meth
face reservos enough tomonth dry peufficient amot can be nee
very high; thuseholds weovel is needre needed to
nance. By prue to infiltrat
n Mtwara, Ta
rschap Velt &
rvesting
ents, which abe lost as it sdisappears
structing layth impervioussurface is aa ground caand on the in
esting)
apid flow of ted in order tonfall that is hcatchment,
pervious mathod
oir. The suo collect a eriod. The caount of rainweded to incr
his can be coere able to cded for dig do this work
roper maintetion or wate
anzania
& Vecht 4
are used serves to
through ing tiles, s surface
adequate. atchment nfiltration
the water o reduce
harvested to some
terials. In
ubsurface sufficient atchment water. An ease the
oncluded construct ging the k.
enance, it er that is
42

Investigation towards alternative water resources in Mtwara, Tanzania
AMREF Flying Doctors / Waterschap Velt & Vecht 43
flowing away from the storage tank. The risk of contamination is increasing due the fact that the water is flowing on areas that might be used for other purposes as well. For increasing the sustainability, it is recommended to install a fence around the catchment area.
4.7.4 Water quality
Considering the water quality it might be necessary to install a sand filter before the water is entering the subsurface reservoir. A fence around the catchment area is also needed to prevent people and animals to enter the catchment area. By a possibility to enter the catchment area the risk of contamination increases.
4.7.5 Performance and cost analyse
The surface ground catchment is a solution on small scale. The different options that have been analysed are based on different number of households. The different options are:
1 subsurface reservoir with surface catchment for 1 household 1 subsurface reservoir with surface catchment for 2 households 1 subsurface reservoir with surface catchment for 10 households
(a so called 10-cell)
The performance of each of this selection has been weighted to the different repetitions times. The results can be seen in table 4.10. For one tank for each household the tank needs to have a diameter of 3 metre and the depth of the storage needs to be 2.5 metres by an offset of 3 metres. With these dimensions, the performance indicators by a repetition time of 1 in 5 years are as follows:
The demand satisfaction is reaching 122%, the efficiency is 99% and the reliability of supply is 100%. The efficiency of 99% suggest that there is a little overflow and the demand satisfaction of 122% means that there is annually more water collected then the annual water demand.
For one subsurface reservoir for two households the best results are shown when the dimension of the offset is increased to 5 metre and diameter of the tank is enlarged to 5 metres. The depth of the tank will stay the same, 2.5 metres.
The demand satisfaction is 122% and the efficiency and the reliability of supply are 100%. There is no spilling of water by overflow.
When the decision is made that every ten households should need to have one subsurface reservoir, the catchment area around the tanks needs a radius of 30 metres and the diameter of the tank needs to be 8 metres and the depth is increased to 3 metres.
By selecting those dimensions the results of the performance indicators are 112% for the demand satisfaction, the efficiency will be 98% and the reliability of supply is 100%. The efficiency is 98% so not all the water that is collected will be released for fetching but some is spilled.

Investigation towards alternative water resources in Mtwara, Tanzania
AMREF Flying Doctors / Waterschap Velt & Vecht 44
If there is an annual rainfall (dry year) that occurs once in ten years the reliability of supply is decreasing to 97%, what means that in 3% (11 days) of the year there will not be sufficient water. By increasing the diameter to 9 metre, the system will be suitable for a one in ten-year rainfall situation.
By comparing the fluctuation storage in figure 4.16 it shows the difference in storage capacity. The storage capacity that is needed for a 10-cell is many times larger than the storage capacity that is needed for a tank that is used for two households. The storage fluctuation of the tank for two households has a higher peak in April compared to the tank that is needed for singe household. Because the water use of the tank for two households is higher, the storage is also decreasing faster. Based on the calculations it is shown that at the end of the dry period the capacity of the tank for a single household is higher compared to the capacity of the tank for two households. Because of the higher demand of a double household is the slope of the fluctuation graph steeper.
Village population: 1918 (average 3rd phase villages) Village households: 383 (average 3rd phase
villages)
Demand 15L/c/day Repetition time 1 in
2 years
Repetition time 1 in
5 years
Repetition time 1 in
10 years
Type o
f catchmen
t
Size of sto
rage/diam
eter
N° o
f fields/su
rface ro
of
Dep
th of sto
rage/volume
Offset
Dem
and satisfactio
n
Efficiency
Reliab
ility of su
pply
Dem
and satisfactio
n
Efficiency
Reliab
ility of su
pply
Dem
and satisfactio
n
Efficiency
Reliab
ility of su
pply
Surface
ground catch
ment
2
1 H.hold 1
2.5 3 108% 78% 93% 85% 81% 84% 78% 81% 87%
3 2.5 3 151% 92% 100% 122% 99% 100% 113% 100% 100%
4 2.5 3 199% 100% 100% 150% 100% 100% 137% 100% 100%
3
2 H.holds 1
2.5 5 106% 87% 90% 85% 92% 84% 80% 98% 87%
4 2.5 5 136% 97% 100% 105% 100% 93% 96% 100% 93%
5 2.5 5 162% 100% 100% 122% 100% 100% 111% 100% 100%
7 10 H.holds 1
3 30 123% 85% 100% 99% 91% 97% 91% 92% 90%
8 3 30 137% 91% 100% 112% 98% 100% 103% 99% 97%
9 3 30 154% 96% 100% 120% 100% 100% 110% 100% 100%
Table 4.10 The performance indicators of the different materials towards the costs. It is linked with table 4.2. On base of table 4.2 the dimensions of the system are selected. Based on those dimensions the costs of the system with different materials are analysed.

Investigation towards alternative water resources in Mtwara, Tanzania
AMREF Flying Doctors / Waterschap Velt & Vecht 45
By analysing the next step we include the costs with the performance indicators we see the following remarkable characteristics as shown in table 4.11.
The total costs for 1 subsurface reservoir for a single household will costs more when it is decided to use the material ferro-cement instead of LPDE plastic sheet. EPDM rubber sheet is 28 dollar more expensive than LPDE plastic sheet. EPDM rubber sheet has a lifeline longer than 25 years while LPDE plastic sheet needs to be replaced after 10 years.
By comparing the performance indicators of costs with the best results from the performance indicators of usage (the bold and blue cells) the differences are as follows:
The construction costs (with LPDE plastic) are respectively for one storage facility for a single household, one storage facility for every two households and for one storage facility for each 10-cell € 725,- € 880,- and € 1328,-. Because all the different systems have a different storage volume and different amount of water users it is hard to compare. By calculating the equivalent unit cost, the cost for each cubic, metre the results are as follow: € 197,- for ‘one tank single household’, € 144,- for 1 tank 2 households and € 124,- for ‘one tank ten households’. The costs for 1m³ are the cheapest by constructing a tank for single household and the most expensive for a 10-cell. By comparing as well the number of water users with the equivalent unit costs, the tank for ten households is by far the lowest, with € 2,50 compared to € 39,00 and € 14,00 for the tanks for a single household and for two households. The payback time is as well the lowest for the tank for 10 households. The payback time will be 40 months instead of 218 or 132 months for the other two possibilities.
020406080
100120140160180
Decem
ber
January
February
March
April
May
June
July
August
Septem
ber
Octo
ber
November
Storage
Cap
acity (m
³)
Fluctuation storage capacity (in m³) based on demand of different amount of households
1 household 1 tank 2 households 1 tank
10 households 1 tank
Figure 4.16 The fluctuation storage of the storage capacity, which is based on different number of households.

Investigation towards alternative water resources in Mtwara, Tanzania
AMREF Flying Doctors / Waterschap Velt & Vecht 46
When the choice will be made on the 10-cell option and it will be used for an average village the total number of subsurface reservoirs, with a surface catchment, will be 38 pieces. The total costs will be € 25,346 to provide the total population of average village sufficient water, year round.
Demand 15/L/c/day Ferro-Cement LPDE Plastic sheet EPDM Rubber sheet
Typ
e of ca
tchme
nt
Size
of storag
e/dia
me
ter
N° o
f stora
ge/volum
e
Dep
th of sto
rage
/volume
Offse
t
Pa
yback tim
e (mon
ths)
Co
st/1m³(€
)
Co
st 1m
³/wate
r user (€)
To
tal costs (€)
Pa
yback tim
e (mon
ths)
Co
st/1m³(€
)
Co
st 1m
³/wate
r user (€)
To
tal costs (€)
Pa
yback tim
e (mon
ths)
Co
st/1m³(€
)
Co
st 1m
³/wate
r user (€)
To
tal costs (€)
Su
rface g
roun
d ca
tchm
ent
2 1 H.h
old 1
2.5 6 227 308 61 753 206 280 56 684 212 288 57 703
3 2.5 6 248 224 44 822 218 197 39 725 227 205 41 752
4 2.5 6 277 188 37 918 235 159 31 780 247 167 33 819
3
2. H
.hold
s 1
2.5 10 120 218 21 801 114 206 20 755 118 231 21 782
4 2.5 10 132 179 18 875 122 165 16 810 128 173 17 849
5 2.5 10 146 158 15 970 132 144 14 880 141 152 15 934
7
10 H
.ho
lds 1
3 25 41 147 3 1384 36 128 2.6 1206 39 140 2.8 1312
8 3 25 46 145 2.9 1552 40 124 2.5 1328 44 136 2.7 1462
9 3 25 52 144 2.9 1743 44 121 2.4 1466 49 135 2.7 1631
Now there is insight in the investment costs of the different components for the dimensions with the best performance it is important to look to budget whereby the depreciation of the different elements are taken into account, as well as the operation and maintenance. The overview of the budget can be found in appendix 4.13.
With the depreciation the labour costs will be €91,33 monthly and the investments €267,12 (table 4.12). For the operation and maintenance the total monthly costs are €170,00. In total the total monthly costs are €528.45. This means that the price per cubic metre is €1.47, whereby the investments of the components in the system are the biggest part of the price per cubic water consumed.
Table 4.11 This table is the continuations of table 4.10. In table 4.10 the performance indicators towards reliability of supply, efficiency and demand satisfaction are analysed. The best dimensions are found an in this table the comparative indicators towards costs are analysed. In blue the best performing materials are highlighted. In orange the best overall performance is indicated.

Investigation towards alternative water resources in Mtwara, Tanzania
AMREF Flying Doctors / Waterschap Velt & Vecht 47
Calculation of costs per month and per m³ consumed
Cost/month (€) Price per m³ (€)
Labour costs 91,33 0,25
Investments 267,12 0,74
Operation and Maintenance
- Maintenance and repair 50,00 0,14
- Salary 120,00 0,33
Total 528,45 1,47
The monthly costs is 528,45 and the monthly income is 521.94. The monthly income is based on the average monthly consumption. The price for one cubic metre of water is set as the same as the actual price of €1.45.
As can be seen in table 4.13, the difference in income and costs is €6,51 negative. This means that the system with surface water harvesting with subsurface reservoir storage is not profitable. The monthly loss of money is insignificant and the monthly income and costs are almost even.
Monthly income (€) 521,94
Monthly costs (€) 528,45
Difference income and costs (€) - 6,51
Table 4.12 Overview of the costs per month and the costs for each cubic metre water consumed. The price for one cubic metre water is 1.47. Two cents more expensive than the actual marked price of water.
Table 4.13 Presented is the difference of the income and the costs. By making use of this alternative the system is almost turning even, a monthly loss of €6.51 takes place

Figure 4.1Schematic3. The waroof to the a storage f
7 c sketch of alterater is lead fro gutters and stofacility
In
4.8
Rain extreand stank, Morehere Thom
The efiguremean
4.8.1
To benot amost not su
If thehousehigh (
A rooreserin the
The swaterannuaovercFor rpart.
rnative om the ored in
nvestigation t
Alterna
falls ontomely variablso the roof ru
water can over, as theis no need f
mas, D.B. Ma
essential elee 4.17, are ns of leading
Affordab
e ‘suitable’ thabsorb the ra
plastics areuitable, as th
ere are no haehold needs(TSH 6500/m
of water harvoir then a se wet season
size of the tar user. Out oal rain with a
come a dry proof water h
towards alter
AMRE
ative 3. R
hard surface (for the typun-off is zerobe drawn f
tank is genefor the waterartinson, Roo
ements of a a suitable hrun-off flow.
bility
he roof shouain or pollut
e suitable, whey produce
ard materialss to considem² = € 3.77/m
rvesting syssmall water rn. However, a
ank is based of the rainfalla repetition tiperiod of 7 marvesting sy
rnative water
EF Flying Doc
Roof wate
e roofs andpically 99% oo). However from that reerally locatedr to be carrieof water harv
roof water hard surface.
uld be made te the run-of
while grass aless runoff.
s present asr investing i
m²).
stem will pereservoir. A sa small store
on the annul analyses, itime of 1 in 5onths a large
ystem the wa
r resources in
ctors / Water
er harves
d then runsof each yearif the run-of
eservoir whed immediate
ed or piped fresting)
harvesting se roof, a wa
of some haff. Thus, tile
and palm-lea
s roof surfacn it. The inv
rform bettersmall reservo
e is cheaper t
ual rainfall ant is conclude
5 years contae water storaater tank is
n Mtwara, Ta
rschap Velt &
sting
s off. The rr that it is noff is channellenever it is ely next to throm elsewhe
system, as sater reservo
rd material tes, metal sheaf roofs are g
ce for the hovestment ca
r with a largoir will overflthan a larger
nd the demaed that the aains 7 dry moage facility is
the most e
anzania
& Vecht 4
run-off is ot raining, ed into a needed.
e house, ere. (T.H.
shown in oir and a
that does eets and generally
ouse, the n be too
ge water low often r one.
nd of the mount of onths. To s needed. xpensive
48

Investigation towards alternative water resources in Mtwara, Tanzania
AMREF Flying Doctors / Waterschap Velt & Vecht 49
The gutters are normally made of PVC pipes or parts of GI sheets. The materials and the quantities of the materials of the tank are based on the Bill of Quantities as written in ‘Technical handbook – water from roofs’ by Erik Nissen-Petersen and Catherine W. Wanjihia. The cost of the provision is based on the local price for the used materials, see appendix 12.
4.8.2 Technical usability
Technical knowledge is needed to construct the tank. People should have had technical education for constructing tanks. Local technicians are able to construct the gutters and, if is decided to construct a subsurface ground tank strong men are needed for digging a hole.
4.8.3 Sustainability
For constructing a tank, there are different possibilities. Normally NGO’s are under pressure of both, clients and funders and so they will prefer safe solutions to minimize failure. These solutions are often more expensive and need high maintenance.
For increasing the durability of the roof water harvesting system, the tank and gutters needs to be checked and cleaned every year. By removing obstacles in the gutters a decreasing in roof run-off can be avoided. The tank needs to be checked to avoid small leakages.
4.8.4 Water quality
Rainwater does not contains is not enriched with minerals. This means that the water is not full of taste.
According the health is it possible that the galvanized iron sheets leads to a risk of zinc pollution. For this reason it is necessary to control the water quality frequently
4.8.5 Performance and cost analyse
The technology of making use of the roof catchment is, similar to the subsurface reservoir with surface catchment, a small-scale solution. It is a solution for a single household. The results of the roof surfaces are based on four different aspects, namely:
Different roof surfaces Different materials Different tank sizes Different minimum annual precipitation
The roof catchment is based on a household of five people, according to the Mtwara Baseline survey (Source: EWAREMA Consult, Final baseline survey report, Mtwara, water, hygiene and sanitation project, September 2008)
Based on the rainfall analyses (see chapter 4.4) is concluded that the priority of the precipitation will be based on a minimum annual rainfall with a repetition time of 1 in 5 years. Based on the roof distribution analyses

Investigation towards alternative water resources in Mtwara, Tanzania
AMREF Flying Doctors / Waterschap Velt & Vecht 50
(see appendix 3) can be concluded that the roof surface will be based on a roof surface with the dimensions of an average roof surface minus one standard deviation. The average roof surface of the houses with GI sheet is 67.2m² and the standard deviation is 16.3m². The average roof surface minus one standard deviation is becoming 50.9m².
The calculations are done for three different minimum annual rainfalls and the roof surfaces are calculated for the average roof surface, average minus one standard deviation and the average minus two standard deviations. In table 4.14 the results are shown.
The storage facility with a capacity of 5 m³ does not have the capacity to overcome the dry season. The efficiency is 70%, what means that 30% of the annual rainfall will overflow/spill from the tank. Due to the lack of storage the reliability of supply is 67% that means that tank does not contain water for 120 days in a year. By an increasing of tank size to 11 m3 the efficiency is 82% and the reliability of supply is 92%. Compare to the tank with 5m³ storage is it a big improvement, but there are still 29 days each year where the tank does not contain water.
When taking a storage facility of 15m³ for each household by a roof surface of 50.9m² (roof surface µ-1σ) the reliability of supply will be 100%. The efficiency is 90%, what means that there is still some overflow. In figure 4.18 this can be seen by the red line.
V illagepopul ation:98( average3rdp hase villages ) Villa gehousehold s:383(aver age3rdphavillages)Typeofcatchment Surfaceroof EfficiencyReliabilityofsupply Reliabilityofsupply Demandsatisfaction Reliability of supply
Roofcatchment µ‐2 58 7 97% 6µ‐2 100 10 110% 10µ‐2 100 10 115% 10

Investigation towards alternative water resources in Mtwara, Tanzania
AMREF Flying Doctors / Waterschap Velt & Vecht 51
Only the tank with a storage capacity of 15 m³ is sufficient for a household. For this, only the performance indicators of the 15m³ tank will be discussed
By taking a look to the different options for materials there are different options, whereby the costs depends on the material prices in Mtwara. The performance indicator tools, which are related to the costs, show that the tank made of Ferro-cement is the cheapest method (table 4.15). The overall costs are €497,20. This results in an equivalent unit cost (cost/1m³) of €128.43. The payback time is construction costs versus annual demand. The construction costs are based on the material and size of the tank and the annual demand is based on the roof surface, which is related to the amount of rainfall. The payback time is the lowest by the biggest roofsurface, because, as assumed, the usages of water will increase when the size of the surface is increasing. Because the income is based on 50 TZS (€0.03) for the use of every 20 litre, the incomes will increase when the demand is increasing. This results in a payback time of 131 months.
Typ
e o
f catch
me
nt
Ma
teria
l tan
k
Size of storage (m
³)
Su
rface
roof (m
²)
Pa
yback tim
e (m
on
ths)
Co
st/1m³ (€)
Co
st 1m
³/wa
ter u
ser (€
)
To
tal co
sts (€)
Ro
of ca
tchm
ent
Concrete 15
67.2 176
172 34.4 665 50.9 185
34.5 225
Ferro-Cement 15
67.2 131
128 25.7 497 50.9 138
34.5 168
S.C. Blocks 15 67.2 212
207 41.4 802 50.9 223 34.5 272
0.02.04.06.08.010.012.014.016.0
Decem
ber
January
February
March
April
May
June
July
August
Septem
ber
Octo
ber
Novem
ber
Amount water (m
3)
Adaptive Demand
Adaptive Tank storage (m3) Overflow (m3)
Maximum tank storage
Figure 4.18 The fluctuation of a storage facility with 15m³ is only in April totally filled. With an adaptive demand (water use of water user is based the presence of water in the storage facility)
Table 4.15 This table is the continuation of table 4.14. On the left, the different materials for the tank are mentioned and on the right the indicators of total costs, the cost/m³ and the cost/m³/water user are shown.

Investigation towards alternative water resources in Mtwara, Tanzania
AMREF Flying Doctors / Waterschap Velt & Vecht 52
When is decided that 50% (based on expectations that in 10 year 50% of the households will have a hard surface as roof) of the households will receive a water tank the overall costs for an average village (households 383) is €190.351. During the field visits, the measurements are taken of the roof surface from the houses with GI sheets. They are analysed on the surface distribution and the total amount of households with a galvanized iron sheet as roof surface is 6.4% of the project area. The used roof surface for calculation is the average roof surface in the area minus one standard deviation that means that 84% of the households with an iron sheet as roof will receive a tank. The total amount of households, which are selected to acquire a roof water harvesting system, will be 5.4%. The cost for providing 5.4% households of an average village with a storage tank for roof water harvesting is € 10,088.
Now there is insight in the investment costs of the different components for the dimensions with the best performance it is important to look to budget whereby the depreciation of the different elements are taken into account, as well as the operation and maintenance. The overview of the budget can be found in appendix 13. For the budget the number of households for receiving a tank is set as the whole village, namely 383 tanks.
The labour costs is €234,77, this mean that the cost for each cubic metre water consumed is €0,65. The monthly investment costs is 1480,50. Because there are no operation costs the costs for operation and maintenance are only €50,00 monthly. The total price for each cubic water consumed is €4,83.
Calculation of costs per month and per m³ consumed
Cost/month (€) Price per m³ (€)
Labour costs 234,77 0,65
Investments 1480,50 4,12
Operation and Maintenance
- Maintenance and repair 50,00 0,06
Total 1.735,27 4,83
The total costs for each month is €1735.27 and the monthly income is €521,96. For this the difference is €978.56 negative. For this the investments for this systems seems to be not suitable, because the lack of profitable aspects.
Table 4.16 Overview of the costs per month and the costs for each cubic metre water consumed. The price for one cubic metre water is €4,83, widely more than the actual price of water.

Investigation towards alternative water resources in Mtwara, Tanzania
AMREF Flying Doctors / Waterschap Velt & Vecht 53
Monthly income (€) 521,94
Monthly costs (€) 1.735,27
Difference income and costs (€) - 978,56
4.9 Overview results
In table 4.18 is shown the comparison of the best performing dimensions of the different analyzed alternative methods.
The actual method is the drilling and construction of a borehole with a 50 cubic metre water tank.
Alternative 1 is based on a surface catchment with subsurface soil storage, the total costs for are 26.277 for 2 infiltration field with a surface of 100 metres by 60 metres and a depth of 1.5 metre. The impervious layer is made of LPDE plastic. This method will provide sufficient water to an average village of 383 households.
Alternative 2 is based on a surface catchment with subsurface ground tank. The subsurface ground tank has a diameter of 8 metre and a depth of 3 metres. The catchment area around the ground tank needs to be at least 30 metres. This method will provide sufficient water for a 10-cell
Alternative 3 is based on hard roof water harvesting with tank made of ferro-cement. The volume of the tank is 15m³ and the roof surface needs to be bigger than or equal to 50.9m². This method will provide sufficient water for a single household
Borehole Alternative 1 Alternative 2 Alternative 3
Demand satisfaction (%)
100 116 112 107
Efficiency (%) 100 95 98 90
Reliability of supply (%)
100 100 100 100
Total costs (€) 85.363,00 26.277,00 40.214,71 212.801,00
Monthly costs (€)
662.11 349,14 528,45 1735,27
Price per m³ water (€)
1,84 0.97 1.47 4.83
Table 4.18 The best performing systems, for alternative water sources. Method 1 is the surface catchment with subsurface soil storage made with LPDE plastic. Method 2 is a surface catchment with ground tank storage made of LPDE plastic and method 3 is based on roof water harvesting with a tank made of ferro-cement.
Table 4.17 Presented is the difference of the income and the costs. By making use of this alternative the system is not profitable. More than €975,- are the netto monthly costs
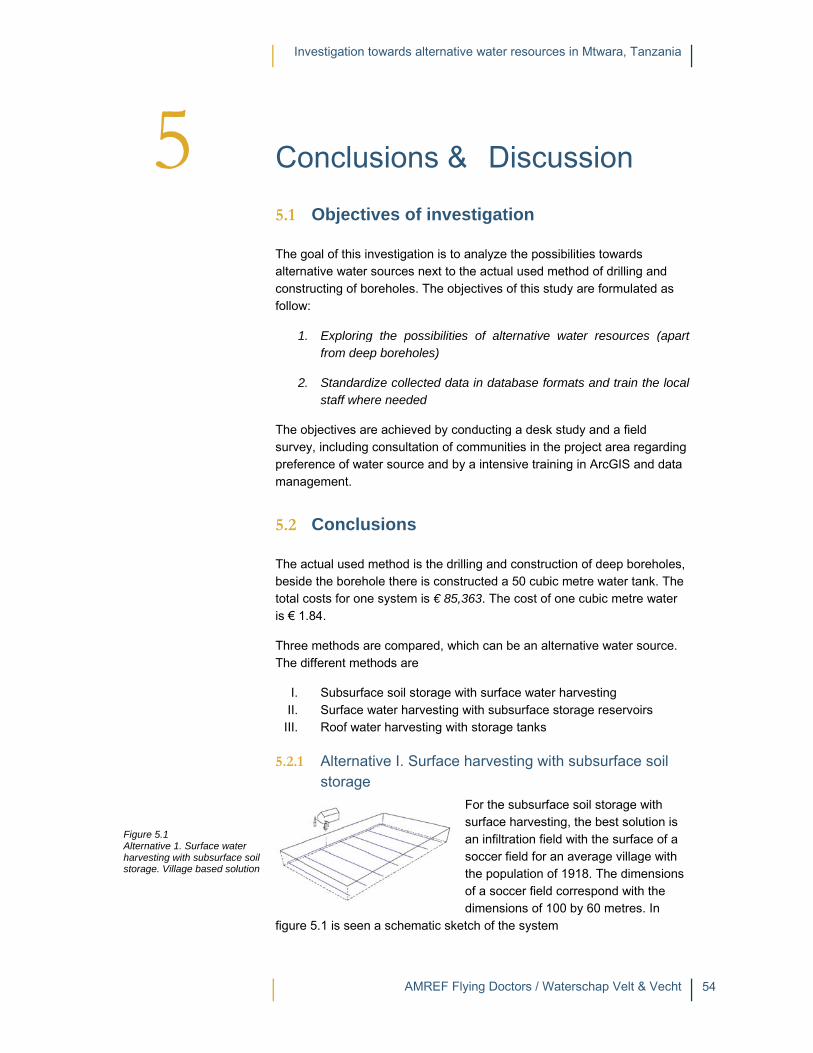
5
Figure 5.1 Alternativeharvestingstorage. V
5
e 1. Surface watg with subsurfacVillage based sol
In
Co
5.1
The galternconstfollow
1
2
The osurveprefemana
5.2
The abesidtotal cis € 1
ThreeThe d
I. II.
III.
5.2.1
figure
ter ce soil lution
nvestigation t
onclus
Objecti
goal of this innative water tructing of bow:
1. Exploringfrom deep
2. Standardstaff whe
objectives arey, including rence of wat
agement.
Conclu
actual used mde the borehocosts for one.84.
e methods ardifferent meth
SubsurfaSurface wRoof wate
Alternatstorage
e 5.1 is seen
towards alter
AMRE
sions
ves of in
nvestigation sources nexoreholes. The
g the possibp boreholes)
dize collectedre needed
e achieved bconsultation
ter source an
sions
method is theole there is ce system is €
re comparedhods are
ce soil storagwater harveser harvesting
tive I. Surfa
a schematic
rnative water
EF Flying Doc
& D
nvestigat
is to analyzet to the actuae objectives
bilities of alt)
d data in data
by conducting of communi
nd by a inten
e drilling andconstructed a€ 85,363. The
d, which can
ge with surfasting with subg with storag
ace harves
For the surfacean infiltsoccer fthe popof a socdimens
c sketch of th
r resources in
ctors / Water
Discus
tion
e the possibilal used methof this study
ternative wa
abase forma
g a desk stuities in the pr
nsive training
d constructiona 50 cubic me cost of one
be an altern
ace water habsurface store tanks
sting with s
subsurface e harvesting, ration field wfield for an a
pulation of 19ccer field corions of 100 b
he system
n Mtwara, Ta
rschap Velt &
ssion
ities towardshod of drillingy are formulat
ter resource
ats and train
dy and a fielroject area re in ArcGIS a
n of deep boetre water ta
e cubic metre
ative water s
rvesting rage reservo
subsurface
soil storage the best solu
with the surfaaverage villag918. The dimrrespond withby 60 metres
anzania
& Vecht 5
s g and ted as
es (apart
the local
d egarding
and data
oreholes, ank. The e water
source.
irs
e soil
with ution is ce of a ge with
mensions h the s. In
54

Figure 5.2Alternativeharvestingreservoir. solution
Figure 5.3Alternativeharvestingreservoir. solution
2 e 2. Surface wag with subsurfac10-cell based
3 e 3. Surface wag with subsurfacHousehold bas
In
The nneedsThe w
€ 26.€0.97
Even€ 36,
5.2.2
The bbe co
an avfor a metre
5.2.3
The bwith t
sheetconstbiggeconsu
In sh
Out obaseddimensubsuvillagmethoLPDE
ater ce
ater ce sed
nvestigation t
needed depths to be at leawater resista
277,00. The 7.
is chosen fo778.
2 Alternatreservo
best selectioonstructing a
verage villagevillage with 3
e water cons
3 Alternat
best size for the capacity
t is 6.8%. Thtructing tankser than 50.9mumed is € 4,8
hort
of the performd on the sannsion of 100 urface soil ste with 383 hod II, but theE plastic and
towards alter
AMRE
h is 1.5 metrast 15 metreant layer is LP
cost for eve
or a more du
tive II. Surfir
n for the subsubsurface
e will cost € 383 househoumed is € 1.
tive III. Tan
a storage facof 15m³. If th
he costs for cs for all the h
m² will cost € 83
mance indicad formation ometres by 6
torage is ableouseholds. T
e number of w EPDM rubb
rnative water
EF Flying Doc
re and the offto increase
PDE plastic a
ry cubic met
rable materia
face harve
bsurface resereservoir wit
depth of metres. Afigure 5.2amount ovillage. Tbe € 667months.
40.214,71. Tolds and 38 1.47.
nk storage
cility for hardhe roof surfac
surfacethe whminimurepetitischemThe totgalvanis 5.4%househ
constructing ohouses with a€ 10.088. The
ators, the beson the platea
60 metres ane to provide The cost for ewater users i
ber are cheap
r resources in
ctors / Water
fset around tthe size of thand the total
re water con
al, EPDM rub
sting with
ervoir with suth a diameter3 metres an
A schematic 2. This will reof water for eThe total cos7,- and the paBy up scalin
This will prov10-cels. The
with hard
d roof water hce is bigger te will provideole year on t
um annual raion time of 1 atic sketch istal number oized iron she
% (2010) andholds with a one tank is €a GI sheet roe cost for eve
st option is mau. By a surfd a depth of sufficient waevery cubic mis higher. Boper than the
n Mtwara, Ta
rschap Velt &
the infiltrationhe catchmencosts will be
nsumed the p
bber, the tota
subsurface
urface catchmr of 8 metres
nd an offset o sketch is seesult sufficieevery 10-cell
sts for ach 10ayback time ng this technovide sufficient
cost for eve
roof harve
harvesting isthan 50.9m²
e sufficient wthe conditionainfall with a
in 5 years. As shown in fi
of householdseet upward od the total amgalvanized ir
€ 497,20 andoof with a suery cubic me
method I. Metface with the 1.5 metre, th
ater for an avmetre is mor
oth the materactual used
anzania
& Vecht 5
n field nt area. e
price is
al cost is
e
ment will s, a of 30 een in nt l in the 0-cell will is 20 ology to t water ry cubic
esting
s a tank , the roof
water for n of a
A gure 5.3. s with a of 50.9m² mount of ron
d for rface
etre water
thod I is
he verage re than rials
55

Investigation towards alternative water resources in Mtwara, Tanzania
AMREF Flying Doctors / Waterschap Velt & Vecht 56
methods. If is decided for a durability of 10 years the total costs for the alternative is €26.277 whereby the actual used method cost €85.363. This is a difference of €59.086. If is decided for a system with a durability of 25 years the alternative is still € 48,858 cheaper than the actual used method of construction and drilling a borehole.
5.3 Discussion
By executing the alternative options for a water source it is recommended to introduce earning potentials. Instead of earning only salary, the local villagers can also chose to build up credits for a part of their salary. These credits can be used to buy water for a reduced offer of charge. This will decrease the labour cost and introduce the possibilities for investing.
On the bases of the field observations it is recommended to execute a project whereby the construction is done by the local villagers. This will result in a more understanding of the system and a more responsible attitude towards maintaining of the system. At the moment maintenance of the system is the bottle-neck of the success of the system, for this more attention needs to be given to a community based maintenance plan of the constructed system.
To increase the storage volume the subsurface soil storage facility it is recommended to introduce filter cloth. Filter cloth can be used to separate different layers in the storage facility. With this it is possible to use aggregate on the bottom, as one cubic metre aggregate has a higher storage capacity than one cubic metre coarse sand (see figure 5.3).
For the next steps it is recommended to set up a pilot project to get practical experiences and challenges, which still needs to be tackled.
Challenges which needs to be tackled is the issue of land owner ship of the land. It may be needed to use communal land or the land that needs to be used should be bought ore swapped.
Figure 5.3 Possible improvement of the alternative. Introduce filter cloth for different soil porosity to increase the storage capacity

Investigation towards alternative water resources in Mtwara, Tanzania
AMREF Flying Doctors / Waterschap Velt & Vecht 57
References
Nissen-Petersen, E., Wanjihia, C.W., (2006). Danish International Development Assistance, Technical Handbooks, Kenya, ASAL Consultants Ltd,
Hapugoda, K.D., (1995). Action research study on rain water harvesting, Sri Lanka, community water supply & sanitation project, ministry of housing, construction & public utilities
Smet, J., Wijk van, C., (2002). Small Community Water Supplies: Technology, people and partnership. Delft, The Netherlands, IRC International Water and Sanitation Centre. (Technical Paper Series; no. 40). 585 p.
Thomas, T.H. and Martinson, D.B. (2007). Roofwater Harvesting: A Handbook for Practitioners. Delft, The Netherlands, IRC International Water and Sanitation Centre. (Technical Paper Series; no. 49). 160 p.
Waes van, B., Bouwman, D. Aqua for All (2007). Smart Water Harvesting Solutions. Apeldoorn, The Netherlands, Aforma Drukkerij.
NWP. (2006). Smart Water Solutions. Apeldoorn, The Netherlands, Aforma Drukkerij
Lee, M.D., Visscher, J.T., (1992). Water Harvesting. A Guide for Planners and Project Managers. Delft, The Netherlands, IRC International Water and Sanitation Centre. (Technical Paper Series; no. 30) 116 p.
Japan Interntational Cooperation Agency, Jica, (2001). The Study on Water Supply and Sanitation in Lindi and Mtwara regions. Tokyo, Japan. Kokusai Kogyo Co.
Finnwater, (1977). Mtwara-Lindi Water Resources Inventory and Development Plan, Helsinki, Finnland. Polytypos
Planning Commision, Dar Es Salaam, Regional Commissioner’s Office Mtwara (1997). Mtwara region, Socio-Economic Profile
Regional Commissioner’s Office (2010). Mtwara region, The Socio-Economic Profile and Investment Potentials.
Tanzania, Relief and drainage, Digital Cartography by M C Shand University of Glasgow 1997

Investigation towards alternative water resources in Mtwara, Tanzania
AMREF Flying Doctors / Waterschap Velt & Vecht 58
Appendices

I
Appendices
1 Terms of Reference ......................................................................................................... II
2 Plan of Approach for three months study-period ........................................................... IV
3 Distribution Roof Surfaces + Data .................................................................................. IV
4 Desk study Possible Alternatives ................................................................................... VI
5 Rainfall Data .................................................................................................................... X
6 Work Plans ..................................................................................................................... XI
7 General strategy of village meetings ............................................................................. XV
8 Minutes Village meetings ............................................................................................ XVII
9 Overview List of Elements Training ArcGIS 9.2 ......................................................... XXVII
10 Delineating Watershed with ArcGIS ...........................................................................XXIX
11 Maps of Area ............................................................................................................. XXXII
12 Explanation Models ..................................................................................................... XLII
13 Budget for each system ................................................................................................. LIII

II
1 Terms of Reference
MTWARA WATER, HYGIENE AND SANITATION PROJECT
Terms of Reference for internship Mattijn van Hoek
(March – June 2010)
Introduction
The African Medical and Research Foundation (AMREF) Tanzania in collaboration with Mtwara Rural District Council is now on implementation of a four-years water, hygiene and sanitation project in 6 wards and all 40 villages contained in those wards.
The project is designed to facilitate community participation and involvement, so as to achieve the maximum community participatory planning and implementation of project activities which ensure the priorities of disadvantaged groups. The focus is on approaches/technologies and mechanisms that work in rural and low-income urban areas. The emphasis is also on affordable, acceptable, appropriate and evidence based technology that becomes familiar with the target population for easy operation and maintenance.
The Project Overall objective is to contribute to halving by 2015 the proportion of people without sustainable access to safe drinking water and adequate basic sanitation services.
Specific objective is to improve the health and quality of life of selected marginalized communities of Mtwara district in Tanzania by increasing access to and sustainable usage of safe water and basic sanitation services.
Background Information
The proposed TA internship follows a successful and effective mission held in February 2010. During this mission the content and process for the technical assistance process that is provided by Water board (Velt en Vecht) and Aqua for All to AMREF in Tanzania, was agreed upon. In the TA work plan the agreed process and content are defined in detail.
Preferred period of internship
21 March - 30 June 2010; covering 3 months
Objectives of the planned internship
In line with the overall TA work plan, the objectives of the internship are the following:
• Increased skills and knowledge about alternative water source and adjustment of project scope towards a more diversified water scheme for the phase III area and for the expanded project area as envisaged by the project management

III
• Increased skills and knowledge about data management and water source monitoring, both qualitative and quantitative
Scope of works
In order to meet the above-mentioned objectives it is envisaged that the intern will engage on the following scope of works in collaboration with the project staff:
• Conducting desk study and field survey into the feasibility of alternative sources, including consultation of communities regarding preference of water source in the project area where phase III of implementation is planned and in the envisaged expanded project area. • Support in formulating proposal / addendum for adjustment of scope towards development of alternative water sources • Support in setting up an integrated monitoring plan for the water sources • Support in design of an effective data management system (software and organizational arrangements) • Support in standardization of data collection • Support in using data for effective reporting (using tools like GIS)
Deliverables
• Alternative sources survey report • Appropriate data management and monitoring system, specifically for water sources. • Complete database of realized water sources
Materials required for the internship
The intern has to bring a computer with the appropriate software for data management with the possibility to transfer/copy that software to the AMREF office in Mtwara.
Roles and responsibilities
The principal of Mattijn will be water board Velt en Vecht. AMREF takes no responsibility for meeting insurance, accommodation and upkeep expenses. AMREF in Tanzania will facilitate the search for accommodation in Mtwara.
AMREF in Tanzania will be responsible for meeting the logistical requirements for successful implementation of the internship.
The project manager, Ignatio Kagonji, will provide guidance to the intern in Mtwara. This means that Mattijn and Ignatio will discuss progress of the internship on a regular basis.
Contact persons
• Program Manager Tanzania: Martin Mkuye; [email protected] • Program Manager Netherlands: Joris van Oppenraaij; [email protected] • Project Manager Mtwara: Ignatio Kagonji; [email protected]

IV
2 Plan of Approach for three months study-period
By Mattijn van de Hoek, March 17th 2010
Introduction The government of Tanzania declares in the national water policy that ‘the availability of water is a basic need and entitled to everyone’1. Based on findings of AMREF, the estimation of disease burden related due to the lack of safe drinking water and adequate sanitation in Tanzania is 70%. Within Tanzania the Mtwara district, located in the southeast, is one of the most vulnerable areas. The district consist of six divisions, 18 wards en 119 villages. The total population of Mtwara is 231.554(WATSAN MTwara Baseline Survey Report) and has an estimated annual growth of 1.4%. In the district, the majority of people are devoid of safe drinking water and adequate sanitation. Each day, the collection of water takes 4 till 7 hours. In most cases, the collected water is not safe. Water scarcity results in an average use of 10 litres per person per day
2 where WHO prescribes a minimum use of 20L/p/d.
To improve the water supply in the district, the African Medical, Research Foundation (AMREF) Tanzania, and the Mtwara Rural District Council has started the WATSAN project in 2008. This project is about water, hygiene, and sanitation. AMREF hopes to finish this project in collaboration with water board Velt en Vecht and Aqua for All (by providing technical assistance and function as co-financiers) in 2011. The project aims to improve the health and quality of life of selected marginalized communities of Mtwara district. Including 6 wards and 40 villages. This is done by increasing access to- and sustainable use of safe water and basic sanitation services by constructing boreholes in each village. Unfortunately, due to the complexity in the hydro geological conditions, the construction of boreholes in the project area is difficult. . The goals in this study period are twofold. This document discusses the two goals separately:.
1) Exploring the possibilities of alternative water resources (on top of only boreholes).
2) Standardize collected data in database formats and train the local staff where needed
Objectives of the 3 month study period
1 National Water Policy of the United Republic of Tanzania, page 4
2 Gleick, P,H. 1999. The human right to water. http://webworld.unesco.org/Water/wwap/pccp/cd/pdf/ educational_tools/course_modules/reference_documents/issues/ thehumanrighttowater.pdf

V
1. Alternative water resources The objective is to investigate possible alternative drinking water sources in the villages of phase three and other villages out of the project area. This possibility arises by the release of budget by reducing the number of boreholes from 51 to 40. Those, potential, alternative solutions will possibly offer the population a more reliable and broad access to safe drinking water. The purpose of the investigation is to provide technical evidence for an addendum towards the European Union (main financier in this project) for adjustment the scope towards development of alternative water sources.
Core elements for analyzing alternative water resources are affordability, technical usability, and durability. The result is a selection method by distinguish alternative water resources on those elements. Detailed investigation in respect to alternative water sources
I. Present area description a. hydro-geological background b. socio-economical situation c. water supply sector
II. What alternatives for collecting drinking water are suitable for this area? III. To what extent can these alternatives be applied? IV. Distinguish alternative methods by:
a. affordability b. technical usability by making use of a matrix c. sustainability/durability
Answers to the above investigation provide a good basis for the identification of alternative sources. Add. I. The first question will provide detailed insight in the area. This is of utmost importance for a good understanding of the situation subsurface and above ground. This will provide information on the reliability of the constructed and planned boreholes. The certainty of pin-pointing an aquifer will increase, compared to the actual trial-and-error strategy. In addition, a good understanding of the area will provide a solid answer for the most successful alternative solutions. The current water collection methods are described. What result in insight in the local technical capabilities. This will be used for distinguish the technical usability of alternative possibilities.
Add. II. To provide insight in the broad amount of technologies for collecting of water. To narrow this down analyses and discussion on possible alternatives is necessary. For a meaningful and effective, survey only the best suitable alternatives will be investigated. For this reason, a selection of appropriate alternatives for this area will be made.
Add. III. Next to the selection of alternatives, the research to the degree of applicability is important. By this investigation, a map will highlight the potential areas for each method. A potential map provides a comprehensive insight in the demands of and the possibilities in an area, which give leads for community based decision making for the purpose of water supply.
}

VI
Add. IV. By constructing a matrix for alternative water resources the following elements affordability, technical usability, and sustainability are included. In planning sessions the matrix can be used to provide the local population a complete overview. This matrix overview may function as a tool for selecting the best method, based on their needs and demands. Community based planning + decision-making will increase by providing this approach of selecting. Results A matrix with a comprehensive overview of advantages and disadvantages of the possible, alternative methods per village. 2. Database and monitoring Setting up of a proper data management will be done for water source monitoring, both qualitative and quantitative. With adequate monitoring, it is possible to intervene in time when recharge of a water source is falling out of range or contamination takes place. The local staff receives training in adequate monitoring and the use of database(s) in ArcGIS and Ms Acces. Investigative questions in respect to a monitoring plan
I. Why is monitoring needed? II. Which essential elements are needed for monitoring?
III. Which measurements are necessary to monitor correctly? Add I. Monitoring of boreholes is needed to identify adverse trend in the recharge of the water source. Clearly, mechanisms are needed to assess this development in time. Monitoring is also needed for evaluating whether the project has achieved the desired objectives, or whether new measures need to be put in place.
Add II. Monitoring can be done for an variety of parameters. By this question the parameters for monitoring are discussed and the essential elements for monitoring are mentioned. Add III. The result will be an overview of steps that are necessary for measuring the parameters. To obtain reliable data the method for collecting for each step needs to be described carefully. Results A database plan for the monitoring of the boreholes Instruction on use + maintenance of database in ArcGIS and Ms Acces Methodology The study comprises the following methods
I. Desk studies a. Preparation of a work plan for the study
i. Preparation plan (in Netherlands) ii. Survey plan (in Tanzania) iii. Finalizing report plan (in Netherlands)
b. A review of published literature on the subject covering local and foreign sources
i. Description project area ii. Actual used methods for all water resources in Mtwara,
Tanzania

VII
iii. Overview methods for alternative water recourses c. Monitoring
i. Setting up a monitoring plan for the drilled boreholes ii. Design of an effective data management system linked to GIS.
d. An analysis of rainfall data II. Collection of data
a. Collection of data on rainfall from meteorological weather station Mtwara
b. Collection of data in technical experiences for collecting drinking water III. Field visits
a. Survey of the existing rainwater harvesting experiences b. Survey of the drilled boreholes
i. From phase I (and where possible phase II) from the project of AMREF
ii. From previous projects (JICA and Finnwater) c. Asses the possibility for alternative water collection methods within the
study area d. Asses the demand of alternative water collection methods within the
study area e. Standardization of data collection regarding monitoring f. Teaching in using tools like ArcGIS and Ms Acces to local water
council IV. Analyze
a. Project area analyze, of the physical, socio-economic and institutional environment
b. Cost-benefit analyze, of the possible alternative methods for water collection
To achieve the objectives, the study is divided in three core steps. The activities and scheduling are described in each core step. These steps are:
- Preparation in Netherlands - Survey in Tanzania - Finalizing in Netherlands
Annex I provide the schedules for each step Annex II provide an overview of the different phases in the investigation, included the input and output per phase. Annex III provide a preliminary table of contents of the thesis report. Related parties This research is done by a collaboration of regional water authority Velt en Vecht, Aqua for All and AMREF. Water board Velt en Vecht and Aqua for All providing technical assistance in this project. Water board Velt en Vecht Name: Hermen Klomp Function: Policy advisor E-mail: [email protected] Phone: +31 6 295 520 39 Name: Pieter Filius Function: Hydrologist E-mail [email protected] Phone: +31 6 295 520 13

VIII
The Dutch water board Velt en Vecht is a regional government body, headquartered in Coevorden, Netherlands. This water board is in charge with managing the water barriers, the waterways, the water levels, and the water quality in its region. Aqua for All Name: Dick Bouwman Function: Projects manager/ teamleader Water and Sanitation E-mail: [email protected] Phone Name: Mark Rietveld Function: Project assistent E-mail: [email protected] Phone: Aqua for All is an institution committed to the improvement of access to safe drinking water and sanitation facilities in developing countries, headquartered in Nieuwegein, Netherlands. Aqua for All links money and expertise of the Dutch water sector to water- and sanitation projects in developing countries. It does not execute projects by itself, but strengthened projects by advice, monitoring, and co-financing. AMREF Name: Joris van Oppenraaij Function: Program manager Netherlands E-mail: [email protected] Phone: +31 6 144 854 08 Name: Martin Mkuye Function: Program manager Tanzania E-mail: [email protected] Phone: Name: Ignatio Kagonji Function: Project manager Mtwara E-mail: [email protected] Phone: AMREF is an international African organization headquartered in Nairobi, Kenya. AMREF’s mission is to ensure that every African can enjoy the right to good health by helping to create vibrant networks of informed communities that work with empowered health care providers in strong health systems. University of Applied Sciences Van Hall Larenstein Name: Henk van Hoof Function: Project supervisor E-mail: [email protected] Phone: +31 26 369 567 8 Van Hall Larenstein, University of Applied Sciences, is a university that focus on nature and environment, human and animal health, and responsible entrepreneurship.
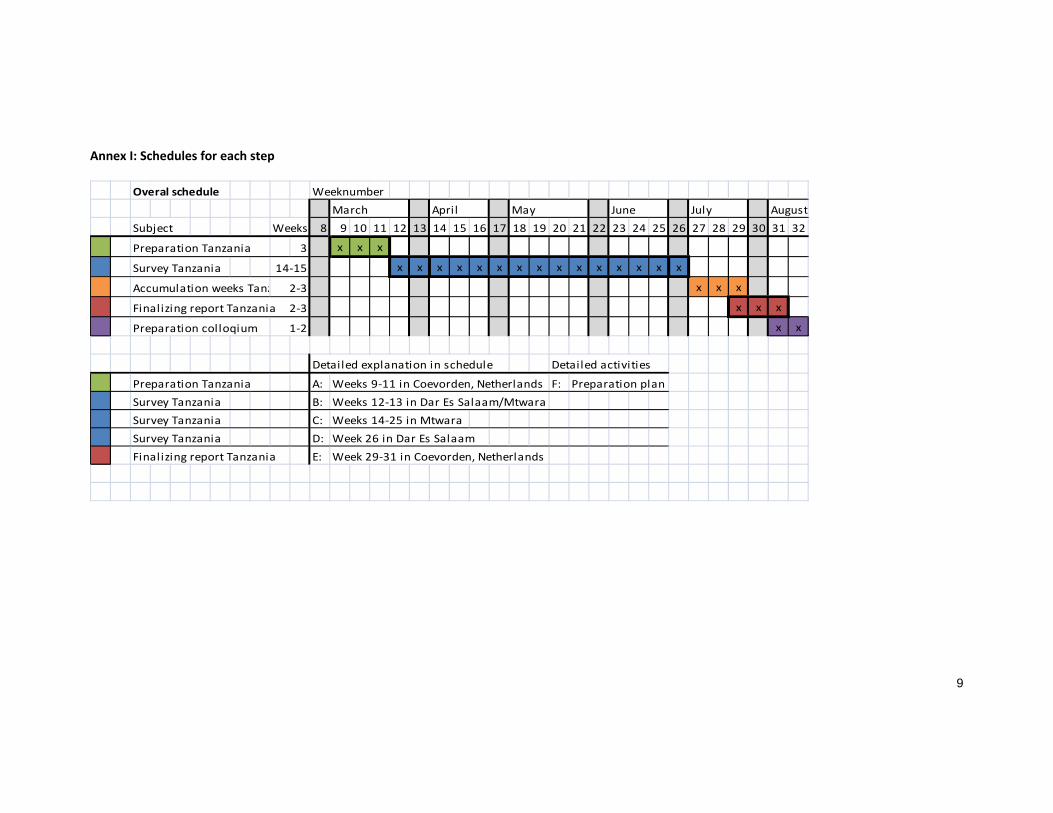
9
Annex I: Schedules for each step
Overal schedule Weeknumber
Subject Weeks 8 9 10 11 12 13 14 15 16 17 18 19 20 21 22 23 24 25 26 27 28 29 30 31 32
Preparation Tanzania 3 x x x
Survey Tanzania x x x x x x x x x x x x x x x
Accumulation weeks Tanz x x x
Finalizing report Tanzania 2‐3 x x x
Preparation colloqium 1‐2 x x
Detailed explanation in schedule Detailed activities
Preparation Tanzania A: Weeks 9‐11 in Coevorden, Netherlands F: Preparation plan
Survey Tanzania B: Weeks 12‐13 in Dar Es Salaam/Mtwara
Survey Tanzania C: Weeks 14‐25 in Mtwara
Survey Tanzania D: Week 26 in Dar Es Salaam
Finalizing report Tanzania E: Week 29‐31 in Coevorden, Netherlands
June July August
14‐15
2‐3
March April May

10
A : Weeks 9-11 in C o evo rden, N etherlands H o urs D ate
m a m a m a m a m a m a m a m a m a m a m a m a m a m a m a m a
1 Obtain backgro und info rmatio n 32
a Research geohydro logical data 12 x x x
b Research climate information 8 x x
c Research Socio-Economic data 12 x x x
2 P lan o f A ppro ach in T anzania 52
a How-to reseach local used methods 4 x
b How-to research alternative so lutions 28
i Overview methods 12 x x x
ii Desciscion making alternatives 4 x
iii Establishment method 12 x x x
c How-to construct the database 12
i Selecting SI derived units 4 x
ii Fieldwork forms 4 x
iii Set up of database 4 x x
d How-to transit the using of the database 8
i Elements to be trained 4 x
ii How to train/educate 4 x
3 R epo rts 6
a Outline report WVV/Amref 4 x
b Outline report Larenstein 2 x
4 Surplus 5
a List o f needs (checklist) 2 x
b Clarity in budget 1 x
c Clarity in malaria medicins 1 x
d Clarity in dates 1 x
5 Overview ho urs
1 Obtain background information 32
2 Plan of Approach in Tanzania 52
3 Reports 6
4 Surplus 5
6 T o tal 95
wo do vr madi wo do vr ma di
17 18 19 22
ma di wo do vr ma
9 10 11 12 15 161 2 3 4 5 8

11
B: Weeks 12‐13 in Dar Es Salaam/Mtwara
Objectives mo tu we th fr sa so mo tu we th fr sa so
Dar Es Salaam
Meeting AMREF/Dar Es Salaam x
Meeting JICA x
Meeting University DES x
Department of Geology xTravelling to‐ and settling in Mtwara xMtwara
Meeting AMREF/Mtwara x
Meeting DWE/DD x
Meeting Ruvuma x
Exploring the project area x x x x x
Refinement of methods for field research x x x x
C: Weeks 14‐25 in Mtwara D: Week 26 in Dar Es Salaam
Objectives days mo tu we th fr sa so Objectives mo tu we th fr sa so
Field research excecution 33 x x x Meeting AMREF/Dar Es Salaam x x x
Report writing 6 x Report writing x x x
Teaching (Acces & GIS) 6 x Teaching (Acces & GIS) x
Maintaining database 11 x Travelling to Dar Es Salaam x
20% buffer (1 day/week) 11 x
Spare time 11 x
E: Week 29‐31 in Netherlands
Objectives mo tu we th fr sa so ma tu we th fr sa so mo tu we th fr sa so
Finalizing report x x x x x x x x x x
Report checking Waterboard x x x x x x x x x x
Report checking AMREF x x x x x x x x x x
Report checking Aqua for All x x x x x x x x x x
Report checking Larenstein x x x x x x x x x x
Preparation colloqium x x x x x
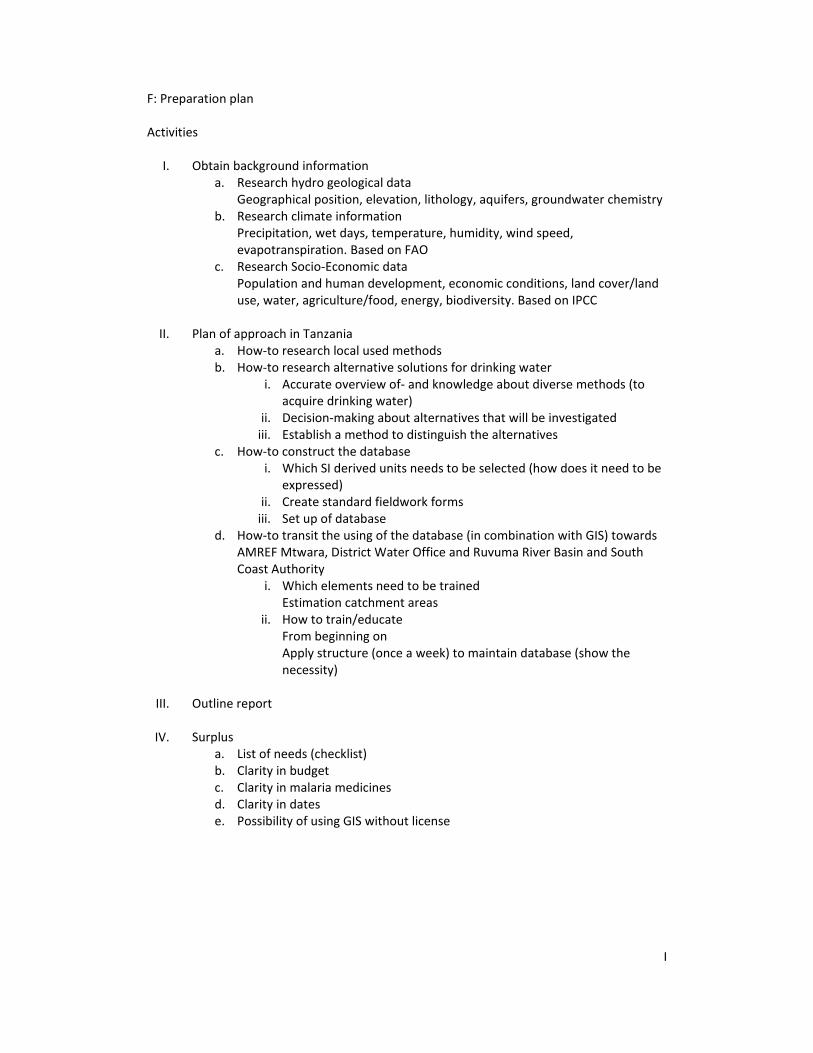
I
F: Preparation plan Activities
I. Obtain background information a. Research hydro geological data
Geographical position, elevation, lithology, aquifers, groundwater chemistry b. Research climate information
Precipitation, wet days, temperature, humidity, wind speed, evapotranspiration. Based on FAO
c. Research Socio‐Economic data Population and human development, economic conditions, land cover/land use, water, agriculture/food, energy, biodiversity. Based on IPCC
II. Plan of approach in Tanzania
a. How‐to research local used methods b. How‐to research alternative solutions for drinking water
i. Accurate overview of‐ and knowledge about diverse methods (to acquire drinking water)
ii. Decision‐making about alternatives that will be investigated iii. Establish a method to distinguish the alternatives
c. How‐to construct the database i. Which SI derived units needs to be selected (how does it need to be
expressed) ii. Create standard fieldwork forms iii. Set up of database
d. How‐to transit the using of the database (in combination with GIS) towards AMREF Mtwara, District Water Office and Ruvuma River Basin and South Coast Authority
i. Which elements need to be trained Estimation catchment areas
ii. How to train/educate From beginning on Apply structure (once a week) to maintain database (show the necessity)
III. Outline report
IV. Surplus
a. List of needs (checklist) b. Clarity in budget c. Clarity in malaria medicines d. Clarity in dates e. Possibility of using GIS without license

AAnnex II: OvervieDark blue boxes
Phase 1: Prepara
Phase 2b:
ew phases show the input a
ation
and the light bluee boxes show thee output
Ph
Ph
ase 2a: Field surv
ase 3 Evaluation
vey
& finalizing
2

III
Annex III: Preliminary table of content of the thesis report
1. Abstract 2. Preface 3. Executive summary 4. Introduction
a. Purpose b. Study area c. Methodology
5. Project area analyse a. Geomorphology and geohydrology b. Climate c. Socio‐economic d. Actual used methods for water harvesting
6. Cost‐benefit analyse a. Advantages and disadvantages of alternative water source methods b. Feasibility
i. Rain fall ii. Water demand iii. Water supply
c. Economics i. Cost scenario
d. Social 7. Results 8. Conclusion and recommendations 9. Discussion 10. Literature 11. Annexes

33
The distprojecte
For selesheet. Tbased othat all overflow
For findi
And for f
By assustandardthe demsurface)
Dis
tribution of td phase 3 vi
ecting appropThe best solun the surfacethe water w
w.
ng the arithm
finding the st
ming a normd deviation’.
mand (the con).
stribut
the roof is allages of the
priate tank siution for the e of the roof.
what will fall
metic mean t
tandard devi
mally distributThan the an
nsidered wat
tion R
analysed by project area
izes it is imphouseholde
. In this caseon the roof
the next form
iation
tion of the ronnual water ter demand i
Roof S
measuring a.
portant to anaers is that thee the efficienc
will be deliv
mula is used:
1
of surface andelivered is s based on t
Surfac
(almost) all
alyses the die all the houcy will be 10vered to the
⋯
nd the roof sin 84% of t
the ‘mean m
ces +
the roofs w
istribution of uses will get 00% for everye householde
surface is sethe househol
minus one sta
Data
with iron she
the houses a tank whic
y house, whaer. The tank
t as ‘mean mlds sufficientandard devia
IV
a
et in the
with iron ch size is at means k will not
minus one t to meet
ation’ roof

V
Model Roof water harvesting can be used to optimise storage volume to available roof surface (Annex 10)
Data Roof Dimensions
roof rank
27,44 1
32,4 2
37,82 3
38,25 4
39 5
40,32 6
40,32 7
41,61 8
42 9
42,09 10
43,5 11
44,16 12
44,84 13
45,26 14
47,12 15
48,3 16
48,98 17
48,99 18
48,99 19
48,99 20
49,7 21
50,32 22
50,4 23
50,82 24
51,1 25
51,12 26
51,8 27
51,83 28
53,25 29
54,76 30
55,08 31
55,48 32
56 33
56,16 34
56,58 35
56,88 36
56,98 37
57,12 38
57,72 39
57,76 40
59,13 41
59,13 42
59,2 43
59,2 44
59,25 45
59,25 46
59,64 47
59,86 48
60 49
60 50
60,68 51
60,75 52
61,56 53
61,6 54
62,16 55
62,32 56
62,32 57
62,32 58
62,64 59
63,75 60
63,75 61
63,99 62
64,38 63
64,38 64
64,38 65
64,78 66
64,97 67
65,45 68
66 69
66,22 70
66,4 71
66,42 72
67,16 73
67,2 74
67,24 75
67,76 76
68,04 77
68,4 78
68,8 79
68,85 80
69 81
69,66 82
71,38 83
71,38 84
72,09 85
72,24 86
72,25 87
72,25 88
72,25 89
72,54 90
72,68 91
72,8 92
72,9 93
72,98 94
73 95
73,04 96
73,04 97
73,1 98
73,87 99
73,92 100
74,52 101
75,65 102
75,68 103
76,5 104
76,5 105
76,5 106
76,54 107
77,19 108
78,2 109
78,3 110
78,4 111
79,17 112
79,2 113
79,68 114
79,9 115
79,98 116
81,9 117
81,9 118
82,8 119
82,8 120
84 121
86,1 122
86,48 123
89 124
90,2 125
91 126
91,14 127
91,3 128
92,4 129
93,15 130
94,5 131
95 132
96,6 133
96,8 134
96,8 135
97,75 136
101 137
101,2 138
101,2 139
104,5 140
109,25 141

4 D
Flooding techni
esk stu
ique
udy Pos
Latteral d
ssible A
ditch pattern
Alternati
Di
de
bo
ives
rect recharge in
eep aquifer (b)
oreholes as reco
n shallow (a) an
with drains an
overy method
nd
nd
Water pyr
saline wate
ramid. Purific
er by condensat
VI
ation of
tion.

Ditch and furro
Recharge basin
ow method
Dendrite
Schemat
bending
e ditch pattern
ic diagram o
Co
f contour Sc
tan
ontour ditch pat
hematic diagra
nk
ttern
m of percolatio
a) Ferro c
undergrou
on Semi‐spher
water tank
cement jar b)
nd tank
rical unde
k
VII
partially
erground

S
Recharge pit
Sand dam
Recharge
Sub‐surfa
e shafts
ace clay dam
Cr
da
co
Su
oss‐section of
am with an im
ore
ub‐surface maso
a small earthe
mpermeable cla
onry dam
en
ay
Simple un
storage we
Rainwater
down‐pipe
nderground ra
ell
filter system
VIII
ainwater
built in

S
Low cost groun
Small ground ca
d level catchme
atchment
ent Simple
storage
Rock catc
roof catchm
chment
ment and La
Ro
rai
ha
rge ground catc
oof catchment
inwater (withd
andpump)
chment
and storage
rawal by simp
Arrangeme
first foul flu
of
ple
Simple first
ent for divert
ush
t flush division
IX
ting the
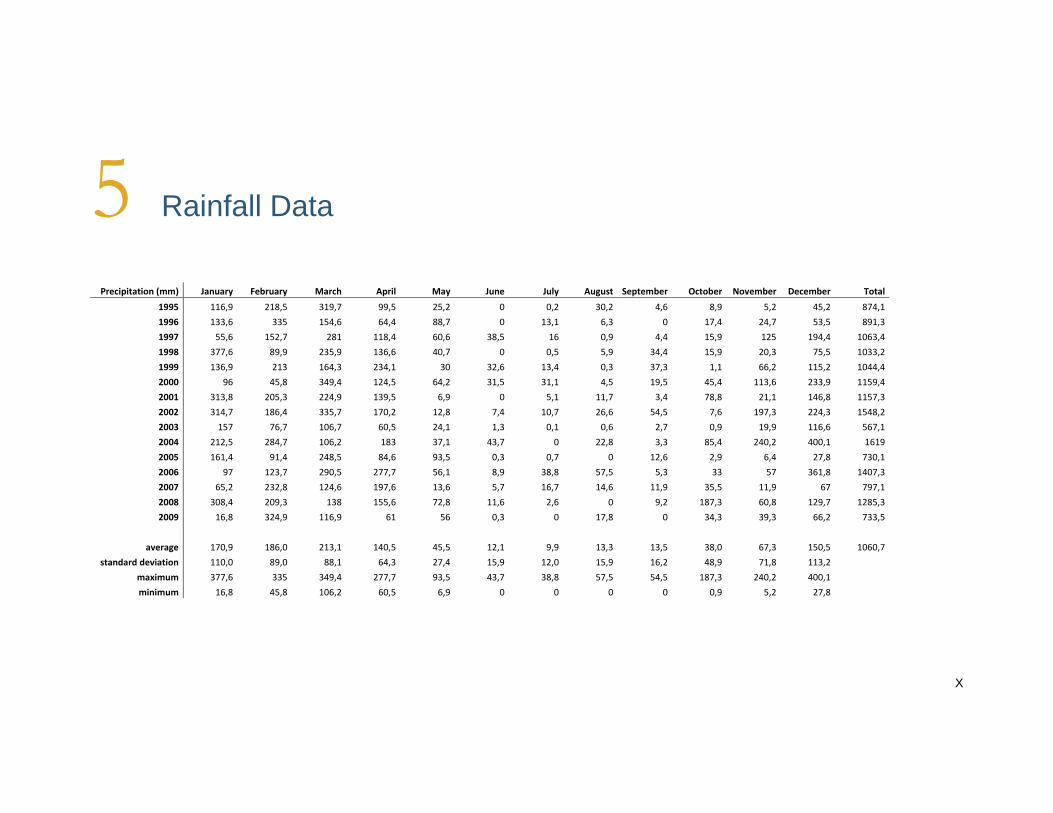
X
5 Rainfall Data
Precipitation (mm) January February March April May June July August September October November December Total
1995 116,9 218,5 319,7 99,5 25,2 0 0,2 30,2 4,6 8,9 5,2 45,2 874,1
1996 133,6 335 154,6 64,4 88,7 0 13,1 6,3 0 17,4 24,7 53,5 891,3
1997 55,6 152,7 281 118,4 60,6 38,5 16 0,9 4,4 15,9 125 194,4 1063,4
1998 377,6 89,9 235,9 136,6 40,7 0 0,5 5,9 34,4 15,9 20,3 75,5 1033,2
1999 136,9 213 164,3 234,1 30 32,6 13,4 0,3 37,3 1,1 66,2 115,2 1044,4
2000 96 45,8 349,4 124,5 64,2 31,5 31,1 4,5 19,5 45,4 113,6 233,9 1159,4
2001 313,8 205,3 224,9 139,5 6,9 0 5,1 11,7 3,4 78,8 21,1 146,8 1157,3
2002 314,7 186,4 335,7 170,2 12,8 7,4 10,7 26,6 54,5 7,6 197,3 224,3 1548,2
2003 157 76,7 106,7 60,5 24,1 1,3 0,1 0,6 2,7 0,9 19,9 116,6 567,1
2004 212,5 284,7 106,2 183 37,1 43,7 0 22,8 3,3 85,4 240,2 400,1 1619
2005 161,4 91,4 248,5 84,6 93,5 0,3 0,7 0 12,6 2,9 6,4 27,8 730,1
2006 97 123,7 290,5 277,7 56,1 8,9 38,8 57,5 5,3 33 57 361,8 1407,3
2007 65,2 232,8 124,6 197,6 13,6 5,7 16,7 14,6 11,9 35,5 11,9 67 797,1
2008 308,4 209,3 138 155,6 72,8 11,6 2,6 0 9,2 187,3 60,8 129,7 1285,3
2009 16,8 324,9 116,9 61 56 0,3 0 17,8 0 34,3 39,3 66,2 733,5
average 170,9 186,0 213,1 140,5 45,5 12,1 9,9 13,3 13,5 38,0 67,3 150,5 1060,7
standard deviation 110,0 89,0 88,1 64,3 27,4 15,9 12,0 15,9 16,2 48,9 71,8 113,2
maximum 377,6 335 349,4 277,7 93,5 43,7 38,8 57,5 54,5 187,3 240,2 400,1
minimum 16,8 45,8 106,2 60,5 6,9 0 0 0 0 0,9 5,2 27,8

XI
6 Work Plans
Work plan I Mattijn & Emanuel for week 16 – 20 2010 Visiting villages Collecting rainfall data The following villages will be visit
Ward Village
Mnima Lipwindi Mtama Kilimahewa
Njengwa Chiwindi Nang’awanga
Mtiniko Shaba Malamba Malanje Mtopwa
Nitekela NiyumbaMigombani
Kilomba Mkahara Nachuma
Chawi Bandariarusha Ngorongoro
The first visit contains of out of two parts. Discussion with chairman, village councils and water committees Village analyses The discussion will focused on: Actual water resources
How many months available
Quality
Quantity
Costs
Water supply problems
Risk boreholes
Complex geology
Change of not hitting of aquifer, low recharge
Difficult to maintain + cost
Possible alternatives
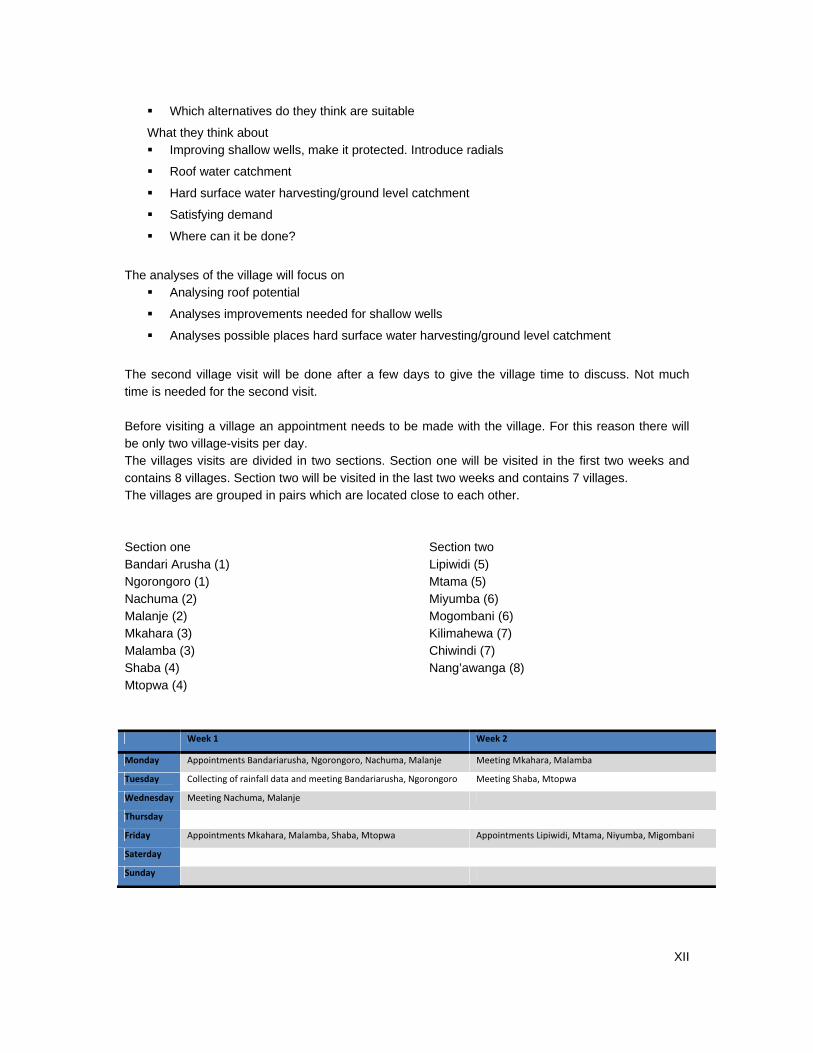
XII
Which alternatives do they think are suitable
What they think about Improving shallow wells, make it protected. Introduce radials
Roof water catchment
Hard surface water harvesting/ground level catchment
Satisfying demand
Where can it be done?
The analyses of the village will focus on
Analysing roof potential
Analyses improvements needed for shallow wells
Analyses possible places hard surface water harvesting/ground level catchment
The second village visit will be done after a few days to give the village time to discuss. Not much time is needed for the second visit. Before visiting a village an appointment needs to be made with the village. For this reason there will be only two village-visits per day. The villages visits are divided in two sections. Section one will be visited in the first two weeks and contains 8 villages. Section two will be visited in the last two weeks and contains 7 villages. The villages are grouped in pairs which are located close to each other. Section one Bandari Arusha (1) Ngorongoro (1) Nachuma (2) Malanje (2) Mkahara (3) Malamba (3) Shaba (4) Mtopwa (4)
Section two Lipiwidi (5) Mtama (5) Miyumba (6) Mogombani (6) Kilimahewa (7) Chiwindi (7) Nang’awanga (8)
Week 1 Week 2
Monday Appointments Bandariarusha, Ngorongoro, Nachuma, Malanje Meeting Mkahara, Malamba
Tuesday Collecting of rainfall data and meeting Bandariarusha, Ngorongoro Meeting Shaba, Mtopwa
Wednesday Meeting Nachuma, Malanje
Thursday
Friday Appointments Mkahara, Malamba, Shaba, Mtopwa Appointments Lipiwidi, Mtama, Niyumba, Migombani
Saterday
Sunday

XIII
Week 3 Week 4
Monday Meeting Lipiwidi, Mtama Meeting Kilimahewa, Chiwindi
Tuesday Meeting Miyumba, Mogombani Meeting Nang'awanga
Wednesday
Thursday
Friday Appointments Kilimahewa, Chiwindi, Nang'awanga
Saterday
Sunday
Midterm discussion Based on the first work plan we have had a small discussion about the progress of the results. The following list gives an overview of the progress.
Ward Village Midterm result
Mnima Lipwindi Mtama Kilimahewa
Incomplete Incomplete Incomplete
Njengwa Chiwindi Nang’awanga
Incomplete Incomplete
Mtiniko Shaba Malamba Malanje Mtopwa
Incomplete Completed Completed Completed
Nitekela Niyumba Migombani
Incomplete Incomplete
Kilomba Mkahara Nachuma
Completed Completed
Chawi Bandariarusha Ngorongoro
Completed Completed
As can be seen from the overview, 7 of the 8 villages are completed. The following villages will be done according to the primary work plan. From the discussion we concluded that the actual plan (two village visits a day) is not always achieved. The following gives a small overview of the reasons for the delays
Driver ill, not possible to hire a driver from the district office (2)
Drivers are in the field (2)
Car at the garage (1)
Preparation AMREF Mkuranga staff (1)
Field trip AMREF Mkuranga staff (2)
Visit Mister Msola (human resources, AMREF DAR) (5)
Preparation EU visit (6)

XIV
Coming activities Finish village’s visits, to get an overview of the ideas and opinions of the residents of the villages,
to discuss possibilities out of the desk-study and to analyses the potential of the villages.
Make appointment with constructors and visit the hardware store to obtain an overview of the
actual prices of materials. To create a comprehensive overview for the cost-benefit analyses.
Obtain a socio-economic report about the region Mtwara from regional office to get an overview of
the socio-economic aspects of the region. The socio-economic report which is available is from
1997 and out-of-date.
A follow up is needed to obtain the borehole report and pump tests of phase 1 from the
constructor. This is still not provided by the constructor. Those data are needed to analyse the
success-rate of the drilled boreholes and setting up of the database.
Maps of region need to be obtained, from one of the following institutions/persons:
DWE/Agricultural office Naliendele/Ruvuma/Regional office.
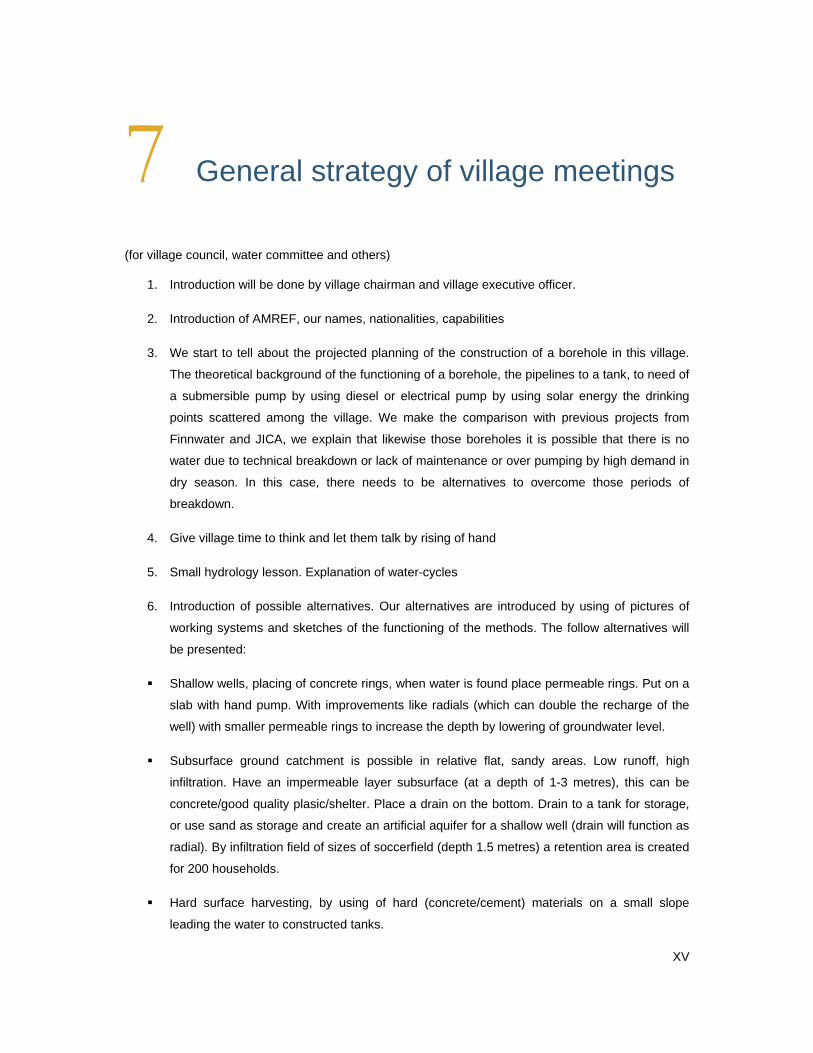
XV
7 General strategy of village meetings
(for village council, water committee and others)
1. Introduction will be done by village chairman and village executive officer.
2. Introduction of AMREF, our names, nationalities, capabilities
3. We start to tell about the projected planning of the construction of a borehole in this village.
The theoretical background of the functioning of a borehole, the pipelines to a tank, to need of
a submersible pump by using diesel or electrical pump by using solar energy the drinking
points scattered among the village. We make the comparison with previous projects from
Finnwater and JICA, we explain that likewise those boreholes it is possible that there is no
water due to technical breakdown or lack of maintenance or over pumping by high demand in
dry season. In this case, there needs to be alternatives to overcome those periods of
breakdown.
4. Give village time to think and let them talk by rising of hand
5. Small hydrology lesson. Explanation of water-cycles
6. Introduction of possible alternatives. Our alternatives are introduced by using of pictures of
working systems and sketches of the functioning of the methods. The follow alternatives will
be presented:
Shallow wells, placing of concrete rings, when water is found place permeable rings. Put on a
slab with hand pump. With improvements like radials (which can double the recharge of the
well) with smaller permeable rings to increase the depth by lowering of groundwater level.
Subsurface ground catchment is possible in relative flat, sandy areas. Low runoff, high
infiltration. Have an impermeable layer subsurface (at a depth of 1-3 metres), this can be
concrete/good quality plasic/shelter. Place a drain on the bottom. Drain to a tank for storage,
or use sand as storage and create an artificial aquifer for a shallow well (drain will function as
radial). By infiltration field of sizes of soccerfield (depth 1.5 metres) a retention area is created
for 200 households.
Hard surface harvesting, by using of hard (concrete/cement) materials on a small slope
leading the water to constructed tanks.

XVI
Roof catchment, first of all the introduction of gutters is needed, the introduction of
splashguards will be mentioned but has low priority, because there is not yet experience with
gutters. Introduction of small tanks made of local materials. The need for a slab (malaria,
evaporation).
7. Give village time to think and let them give comments by rising of hand.
8. Conclusion. We are going to look to the mentioned alternatives and going to calculate the
potential of those alternatives

XVII
8 Minutes Village meetings
Village: Mtopwa Date: 07-05-2010 Location: In village Attending: Mwalami R Mpota (chairman of subvillage Mtopwa)
Emanuel Fungo Mattijn van Hoek General information Names of subvillages
Mtopwa Rahaleo Pachani
Majengo
Actual water resources
Water from the valleys b some streams. 3-4 hours for round trip. Possible for use bicycle, but last part needs to be done by walking.
Dry season no water in the streams. They have option to go to Janjamba where a big swamp is located. This contains water for long period. A round trip is 3 walking hours
Water from streams no smell, but during dry season colours changes to iron. Taste is bitter. Water from swamp is colourless, no smell. Taste is bitter. Bitter like beer. Some sort of salt not like lemon not like beer, hard to explain.
Small swamps of stagnate water fetch water by rains.
Infiltration is very low, water can stay for one day on one place.
All surrounding villages fetch water at the valley no constructions are known in the area.
Summary village meeting
The meeting was attended by 18 men. No chairmen, no village executive officer.
4. Give village time to think and let them talk by rising of hand
Shallow wells in the valley. Some years ago they are dug by hands. Depth of 8ft (2.5 meter). Deeper might be a solution.
Not possible for shallow wells near the villages. Only in the valleys.

XVIII
They don’t trust rainwater. Roofs can be very dirty.
Finding open space for soccer field dig a shallow well next to it. Concrete rings with infiltration which leads to the wells.
7. Give village time to think and let them give comments by rising of hand
All seen as suitable options for the area.
Village: Nachume Date: 30-04-2010 & 04-05-2010 Location: Village office Attending: Venance Chiamba (village executive officer)
Emanuel Fungo Mattijn van Hoek General information Number of households 255 Population of village 1267 Names of subvillages
Dohome Bwanani Chemcheni
Actual income is agriculture. Cash crops are cashew nuts. Food crops are cassava and rice.
Actual water resources
Nearby is a big valley with several local shallow wells. It will take 1 hour for a return trip. The demand is 4 buckets of 20 litres per household. The people will use more water when it will be available next to the door. Assumes 6 buckets per households.
In the dry period the price will go up to 400SH per 20 litres. While the water cost in the wet season 200 -250 SH. AMREF is paying 8-10000SH per hour. Fetching of water is strenuous and time consuming. When water will come closer to home they will spent more time on the field (and not on sleeping). Go back to the field early before the sun is too hot. By rain buckets outside. There is enough rain, but no facilities to store. The shallow wells in the valleys are used by 4 villages in the dry season, namely Malamba, Kiromba, Mpanyani, Misufini.
According to the village executive officer 13 houses have an iron sheet roof. He assumes that after 10 years 50% of the houses will have iron sheet.
Iron sheets cost 16.500SH, size is 4 * 10 ft (3 meters)
Summary village meeting
04-05-2010
6 women and 5 men of the village council and water committee are attending the meeting. 29 men and 28 children are visitor of the meeting.

XIX
4. Give village time to think and let them talk by rising of hand
The better source over here as a lambo. This is a basin what is dug to collect the water
Maybe the lambo should locate in the valley to collect rainwater and surface water
Lambo located near the village, well next to the lambo so water flows to the well
Possibility of tanks by big roofs. Surface rainwater harvesting
What about the thatch roofs, because we have taken measurements of the roofs with iron sheets
Maybe the lambo need to be filled with surface water, but this is dirty how is it possible to clean this before entering the basin?
Is afraid of not digging a borehole because villages nearby already have had a survey.
Bricks and cement are the only materials which can be used to make tanks impermeable. Maybe its possible to construct a tank of makonde clay. Maximum size of 100 litres.
Digging a hole of 1m3 will take 2 hours work and the price will be 4000sh
7. Give village time to think and let them give comments by rising of hand
The people who are attending the meeting are positive about the alternatives. All the alternatives can be feasible in the region.
Village: Ngorongoro Date: 20-04-2010 & 27-04-2010 Location: Village office Attending: Musa dadi Likulunga (village chairman) Emanuel Fungo Mattijn van Hoek General information Number of households 243 Population of village 781 Adults Men 253 Women 278 Children Men 100 Women 150 Year of data 2009/2010
Actual water resources during rainy season
Stagnate water of small ponds scattered around the village. After July, there is not any water in the ponds due to infiltration/evaporation.
The swamps or local unprotected shallow wells in the valley have a maximum depth of two meters. Digging deeper does not result in an increase of water.

XX
By rain there is collecting of water by pans and pots (placing it on the place where the most water is dripping in one point. By heavy rain 3 buckets of 20 litres and by small rain not even 1 bucket.
Actual water resources during dry season
The source for the collecting of water is the borehole (drilled by JICA in 2000) in Bandariarusha. This is needed from July until March. The distance for walking is 2.5 hours without bucket and around 3 hours with bucket, what result in a total of 5.5 hours. When the pump is not functioning the water is collected from a big pond/swamp fed by the Ruvuma River. According to their interpretation, the borehole is not functioning 3 times monthly. The cost of 1 bucket (20 litres) is TSH 50.
In Ngorongro are 7 houses with a roof of iron sheet.
During dry season 10 litres/ person/ day is a lot.
Follow up
Appointment made for 21-04-2010 (postponed to 27-04-2010) at 10.00am (postponed to 15.30pm) for discussion about alternative water sources.
Attending: Village chairman Village executive officer Village council 8 member’s water committee
Summary village meeting
Tuesday 27 March
The meeting is attended by the village council, village chairman, village executive officer, water committees. In total 20 (?) people where attending this meeting in the village office.
The attending women have said that they prefer that the men give comments.
4. Give village time to think and let them talk by rising of hand
Construct shallow wells, comments said that Finnwater has construct 3 20-rings shallow wells with hand pumps, after completion those shallow wells did not provide any water. First thought was not working of pumps, but after removing slabs, no water was founded in the wells.
Construct rambos/lambos (local name) is a underground tank made of concrete, 16 by 9 metres with slab. Sand is removed by using machine.
Using of roof water harvesting. Is seen as good and the most needed option but not sufficient number of roofs
7. Give village time to think and let them give comments by rising of hand
It is hard to give comments on methods that they have never seen in this area.

XXI
Shallow wells is not feasible for this village
The soil is very sandy
Near to village are two small streams (editor: circa 0.5L/s) by storing this water you can overcome 3 dry periods (editor: one dry period is 6-7 months).
General personal conclusion/impression
Shallow well not feasible
Roof surface not sufficient for creating coverage
Hard surface harvesting seems useful alternative if the small streams near the village are used. Create two infiltration fields, nearby the two streams. Together with the rainfall seems it to be a suitable option to bring the drinking points closer to the village.
Construction of borehole seems to be useful alternative if the field survey will find an aquifer.
Village: Bandariarusha Date: 20-04-2010 & 27-04-2010 Location: Village office Attending: Ismael A Mkoba (village executive officer)
Musa A Mshamu (village chairman) Emanuel Fungo
Mattijn van Hoek General information Number of households 382 Population of village 1415 Men 694 Women 721 Year of data 2010 Names of subvillages
Bandariarusha Arushachini Arushaju
Actual water resources during rain season
During the rain season, the village relies on two sources, namely the active working JICA borehole and the local shallow wells. The shallow wells are like a small stream with several points with small ponds. It does not dry up in the dry season. During the rain season, it increases, but the stream stay more or less constant.
Actual water resources during dry season

XXII
During the dry period, more people use the JICA borehole for fetching water. Local unprotected shallow wells are not used for drinking sources. The big swamp nearby is used as source for water. The money, which is collected by the borehole, is sufficient for maintaining the borehole. Many villages (Ngorongo, Chawi, Nganja, Arushaju) visit the borehole during the dry season.
Responding of DWE is slowly by breakdown of pump, it can take up to 20 days before there is a respond. Opt to use local stream. Borehole is active since 2000. During the dry period there is a high demand. So there occur more breakdowns. Last 3 years more problems occur compare to previous years. The price is still 50TSH for each a 20/litre bucket.
Now the leaking of the tank is a problem. There is only one drinking point, so people need to walk a lot to fetch water. The only drinking point is in Bandariarusha.
Summary village meeting
Tuesday 27 March
The meeting was open for everyone and therefor a high amount of people were attending.
On the left side there are sitting 100 men and on the right side there are sitting 60 women. Everything needs to be explained twice, for the different groups. The input is more or less the same.
The village council, the village chairman and the water committee were attending in the meeting. It was a long, but fruitfully meeting from more than one hour on the middle of the day.
4. Give village time to think and let them talk by rising of hand
Borehole is the best option, but drinking points, which are functioning need to be installed in the subvillage Arushaju to avoid long walking distances.
Construct shallow wells, according to the people is this very good possible, mentioned is the impossibility of shallow wells in Arushaju
Construct a very big house in the middle of the village with iron sheets to collect rainwater; the whole village can fetch water from a big tank, which needs to be constructed.
7. Give village time to think and let them give comments by rising of hand
Question from the audience: There are way more thatched roofs than iron sheets roofs, what about those people, do they need to fetch water at the tanks of the people with iron sheets?
Hard surface harvesting seems to be a good option, because there a lot of areas with small slopes.
Deep borehole is first priority and need to be installed first. After this alternatives can be installed as well and unprotected shallow wells are the best option for this area.
General personal conclusion/impression
Three sub villages. For two is a shallow wells feasible, recharge will come from nearby located swamp, which is fed by Ruvuma river.
For Arushaju shallow well not feasible and hard surface is feasible according to local people, Subsurface storage is very good possible due sandy coarse soil. But is hard to understand for the local people, because they can’t visualize it.

XXIII
Roof catchment can be introduced, but will create an coverage rate of 0.1% (!, 29 iron roofs on total of 250 households)
Village: Malamba Date: 06-05-2010 Location: Village office Attending: Twalib Faraji Chinanda (Village executive officer) Nuran Issa Liyumba (Pump operator)
Emanuel Fungo Mattijn van Hoek General information Number of households 445 Population of village 1708 Men 876 Women 832 Year of data 2010 Names of subvillages
Dodoma Sokonja Mkuranga
The source of income is based on agriculture. The cash crop is mainly cashew nut. For increasing the business for the cashew nut the want pesticides. Pesticides needs to be mixed with water. In the dry period the water is not near the fields. One tank (12 litre) is needed to spray 10 cashew nut trees. Spraying tanks needs be filled with 10mL of pesticide and 10Liter of water. The amount of trees owns by a household can go up to 2000. He has 350 trees. Few cashew nut = few profit, but still profitable. If you maintain properly you can get up to 150 kg of cashew nuts. The sell price for cashew nut is at the moment 700Sh/kg and can go up to 1000Sh/kg. The season is from October till January. The pesticides needs to be sprayed 5-6 times seasonally.
Actual water resources during rainy season
Swamps and valleys during rain season. The borehole constructed by JICA has functioned from 2005 to 2008. It has not been functioned for two years. Submersible pump was fallen in the borehole. DWE took the pump for inspection. It took a long time after returning two days functional. The JICA borehole has an depth of 180 metre. JICA placed the pump at 150 metre. Maybe the DWE placed the pump less deep, so recharge of the borehole was not sufficient.
JICA wa able to pump 15 minutes than wait for 45 minutes for recharge. It took 2 days for filling the tank. After returning pump from DWE It was possible to pump for 8 minutes and then wait for 52 minutes for sufficient recharge.
In 8 minutes they were able to fill 6 buckets of 20 litres, 120/8 min (editor: 0.25L/s).
JICA has made two points for survey. The first point is chosen by JICA because the project was almost ended. This one had not sufficient water, but 2nd point was not selected because it was too far. Japanese people have conducted the survey, by making use of VES.
Actual water resources during dry season

XXIV
During the rainy period rainwater and small sources plus water from stagnate water. During dry season people opt to go to Maranje or Ruvuma river. For a round trip Ruvuma it will take 8 (!) hours by bicycle. For a round trip Maranje 4 hours.
Per bicycle, people are able to transport 4 buckets of water (in total 80 litres). The can sell it for 500 to 700 Sh/bucket. Some families have no boys, so they need to buy. Normally every household take care about themselves.
The JICA borehole was used by people from Malamba, Pjani amd Membasokani.
Summary village meeting
The meeting was attended by 6 men. One of the old members was the founder of the village.
4. Give village time to think and let them talk by rising of hand
Lambo is seen as possible option. Topography has some steep slopes. Surface water is flowing in the valleys. Construct a lambo like a big swimming pool. Valley is flowing full with water.
The better point to locate the lmbo is a big hole. Infiltration rate is high. Shallow well is impossible considering the JICA borehole.
Two options where JICA dit the survey. The other point contains for sure sufficient water.
Both the locations (the option for the lambo, and the option for the borehole) are located quite far. For the option of JICA borehole is 2.5 km and the option for the lambo is 4 km. In July and August there is no water.
20-litre cost in the rain eason 200Sh and in the dry session 500 Sh. In October it cost 1000Sh. No water no money. Therefore, the people offer to work free at the field in change for water. People are opt to go to Nachume
7. Give village time to think and let them give comments by rising of hand
It is difficult to recognize the amount of water, which is evaporating. However, in a tank of 9m3 is a loss of 350 buckets annually.
Subsurface ground catchment is seen as preferred option
Select two - three places with the size of a soccer field dig a two meters deep hole. And create a tank. Place a shallow well
Village: Maranje Date: 30-04-2010 Location: In Village Attending: Village executive officer
Emanuel Fungo Mattijn van Hoek

XXV
Summary village meeting
The meeting is attended by 11 women, 17 men. They represent the village council and the water committee. The village executive officer leads the meeting and the village chairman are not present.
4. Give village time to think and let them talk by rising of hand
If it is possible drill another borehole for the times, JICA borehole is not working.
Another option is to dig a big hole in the valley for entering water. Locally known as lambo.
The shallow wells in the villages will not be sufficient in providing water for whole the village. No shallow wells have been drilled in the village.
We want the new borehole and the new alternatives
This is a big village. Two boreholes will give sufficient water for village. Now it is not sufficient. They are sure about maintenance for two boreholes. In the bank account is 2.5 million TSH. Therefore, there is enough money for maintenance.
7. Give village time to think and let them give comments by rising of hand
Shallow wells will not be sufficient when drilled in the village
It is impossible to get enough water by rainwater; there are too many fetched roofs.
Rain is not enough to fill this infiltration field
Borehole is first priority
General personal conclusion/impression
Difficult meeting, not willing to think about alternatives. District water office has drilled a borehole which contains water, the tank is constructed and 8 drinking points are constructed around the village. The only thing missing is a submersible pump. By renovating this system and installing a pump many costs can be saved.
Village: Mkahara Date: 04-05-2010 Location: Village office Attending: Salum Muhambwev(Village executive officer) Mohamedi Adiliki (Village chairman)
Emanuel Fungo Mattijn van Hoek General information Number of households 273 Population of village 1526 Men 803 Women 723 Year of data 2010

XXVI
Actual water resources
Based on spring system, it’s a seasonal spring during rain season actively. The spring is more or less 5 km from the village
The village Kyana is visited for fetching water during the dry season. There is also a spring, but for at long distance, around at 8 kilometres.
Households are using 100 litres per household per day.
The residents fetch in the morning an evening. A round trip takes up to 3 hours. During dry period a 20-liter bucket cost 300SH. During rain season a 20 litre bucket cost 100 sh. 4-6 buckets can be carried on a bicycle.
Not sure about good opportunities of his village. Don’t have experience with nearby located boreholes.
One brick cost 100SH
Summary village meeting
1 woman, 23 men
4. Give village time to think and let them talk by rising of hand
The need tanks by large roofs, rain, water harvesting. Before AMREF borehole will be drilled
Along the valley there is a spring if they dif a hole it collapse. According to the resident rings can be the solution. The spring contains water all the months of the year. All villagers fetching water at this place.
In the village, there is no possibility of shallow wells
7. Give village time to think and let them give comments by rising of hand
So long there is need for water all the solutions that provide the village water is welcome.

XXVII
9 Overview List of Elements Training ArcGIS 9.2
ArcCatalog Content Polygon shapefiles Polyline shapefiles Point shapefiles Preview Geography Table ArcMap Data View Add data Connect to new folders Open attribute table Show All/Selected Sort Ascending Sort Descending Summarize Options Select by attributes Get unique values AND OR Verify Apply Clear Selection Switch Selection Select All Add Field Export Data Export Data Properties Selection With this symbol Display
Transparent Symbology Features Single Symbol Categories Unique values Value Field Add all Values Add Values Remove All Group Values Quantities Graduated colors Graduated symbols Value Normalization Symbol Size from x to y Labels Label features in this layer Label Styles Placement Properties Tools Zoom in Zoom out Pan Full Extent Select Features Clear Selected Features Identify ArcToolbox Analysis Tools Extract Clip Conversion Tools From Raster Raster to Polygon To dBASE
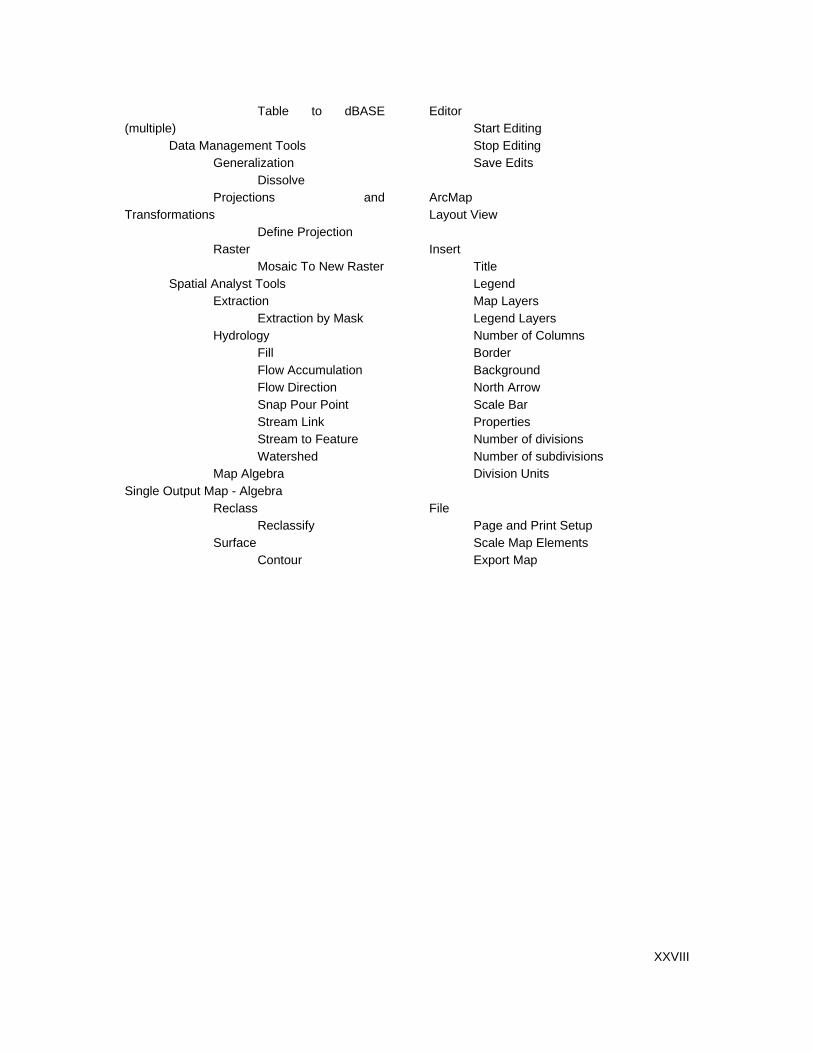
XXVIII
Table to dBASE (multiple) Data Management Tools Generalization Dissolve Projections and Transformations Define Projection Raster Mosaic To New Raster Spatial Analyst Tools Extraction Extraction by Mask Hydrology Fill Flow Accumulation Flow Direction Snap Pour Point Stream Link Stream to Feature Watershed Map Algebra Single Output Map - Algebra Reclass Reclassify Surface Contour
Editor Start Editing Stop Editing Save Edits ArcMap Layout View Insert Title Legend Map Layers Legend Layers Number of Columns Border Background North Arrow Scale Bar Properties Number of divisions Number of subdivisions Division Units File Page and Print Setup Scale Map Elements Export Map

1For delinof stepsexplaine
First, theby the Sobtainedtopograponboard2007)
The follo
S11e038S11e038S11e038S11e038S11e038S11e038S11e038 By addinmaking raster da
The nexlocationswill traveused. If ‘NoDatadepress
With thedone by
0 De
neating wates. With the fed.
e digital elevShuttle Radad elevation dphic databasd the Space
owing data is
8.aux 8.bil 8.blw 8.hdr 8.prj 8.rrd 8.stx
ng the elevatuse of the matasets into a
xt step is anas that are lowel out. Thesethere are s
a’ is put on ionless eleva
e depresionley the using th
elinea
ersheds and following pro
vation map isar Topographdata on a nese of EarthShuttle End
s collected fro
S11e039.aS11e039.bS11e039.bS11e039.hS11e039.pS11e039.rS11e039.s
tion data intomodel ‘Mosaa single raste
alysing the Dwer than thee depressionstill errors in ‘0’ and the
ation model.
ess elevationhe ‘Flow Dire
ating
defining streocess overv
s collected. Thy Mission (Sear-global sc. SRTM condeavour duri
om the NASA
aux bil blw hdr prj rrd stx
SSSSSSS
o ArcGIS 9.2aic to New Rer dataset. T
EM, if there e surroundingns are called
the model previous st
n model the ction (Spatia
Wate
eam networkiew, the pro
The source oSRTM). Theale to genernsisted of aing an 11-da
A ftp server
S11e040.auxS11e040.bilS11e040.blwS11e040.hdrS11e040.prjS11e040.rrdS11e040.stx
2 it is possibRaster (Data The result is c
are errors ing cells. If this
d sinks. To fithe tool ‘Re
tep (‘Fill (Sp
flow from eal Analyst)’.
ershed
s, it is necesocess of ext
of the elevate Shuttle Radrate the mosa specially may mission i
(ftp://e0mss2
x
w r
S1S1S1S1S1S1S1
le to combinManagemen
called a Digit
n the elevatios is the casell those sinks
eclassify (Sppatial Analys
every cell in
d with
ssary to procracting wate
tion data thadar Topogra
st complete hmodified radin February
21u.ecs.nasa
2e038.aux 2e038.bil 2e038.blw 2e038.hdr 2e038.prj 2e038.rrd 2e038.stx
e the different). It allowstal Elevation
on model, thee, no water ts the tool ‘Fiatial Analyst
st)’) is repea
the raster is
h ArcG
ceed throughershed boun
at is used is aphy Missionhigh-resolutiodar system t
of 2000. (F
a.gov/srtm/)
S12eS12eS12eS12eS12eS12eS12e
ent raster intos mosaicking
Model (DEM
ere may be stravelling intoill (Spatial At)’ are execu
ated. The re
s determined
XXIX
GIS
h a series daries is
collected (SRTM) on digital that flew arr, T.G,
e039.aux e039.bil e039.blw e039.hdr e039.prj e039.rrd e039.st
o one, by g multiple M)
some cell o the cell nalyst) is uted and
esult is a
d. This is
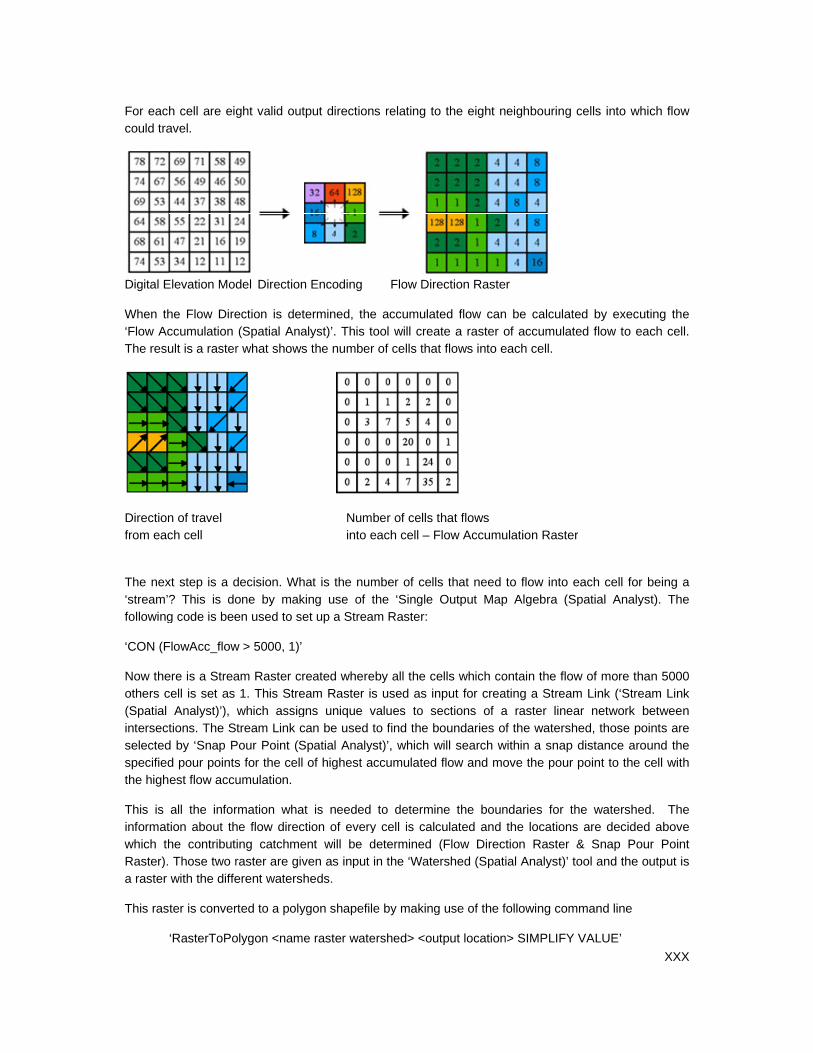
For eachcould tra
Digital E
When th‘Flow AcThe resu
Directionfrom eac
The nex‘stream’?following
‘CON (F
Now theothers c(Spatial intersectselectedspecifiedthe high
This is informatwhich thRaster). a raster
This ras
h cell are eigavel.
Elevation Mod
he Flow Direccumulation ult is a raster
n of travel ch cell
xt step is a d? This is dog code is bee
FlowAcc_flow
ere is a Streacell is set as
Analyst)’), tions. The S
d by ‘Snap Pd pour pointsest flow accu
all the infortion about thhe contribut Those two rwith the diffe
ter is conver
‘RasterToPo
ght valid out
del Direction
ection is det(Spatial Ana
r what shows
decision. Whone by maken used to se
w > 5000, 1)’
am Raster cr1. This Strewhich assigtream Link c
Pour Point (Ss for the cell umulation.
rmation whahe flow direcing catchmeraster are giverent watersh
rted to a poly
olygon <nam
tput direction
n Encoding
termined, thealyst)’. This ts the numbe
Numinto e
hat is the nuking use of et up a Strea
reated whereeam Raster igns unique vcan be used Spatial Analy
of highest a
at is neededction of everyent will be dven as input heds.
ygon shapefi
e raster wate
ns relating to
Flow Dire
e accumulattool will crear of cells that
mber of cells teach cell – F
mber of cellsthe ‘Single
am Raster:
eby all the ces used as invalues to seto find the b
yst)’, which waccumulated
to determiny cell is calcdetermined in the ‘Wate
le by making
ershed> <ou
o the eight n
ection Raste
ted flow canate a raster ot flows into e
that flows Flow Accumu
s that need Output Map
ells which conput for creaections of a
boundaries ofwill search w
flow and mo
ne the bounculated and (Flow Direc
ershed (Spati
g use of the f
utput location
eighbouring
r
n be calculatof accumulateach cell.
ulation Raste
to flow into p Algebra (S
ontain the floating a Streaa raster linef the watersh
within a snapove the pour
ndaries for tthe locationstion Raster ial Analyst)’ t
following com
n> SIMPLIFY
cells into w
ted by exected flow to e
er
each cell forSpatial Analy
ow of more thm Link (‘Strear network hed, those p distance ar
r point to the
the watershes are decide& Snap Po
tool and the
mmand line
Y VALUE’
XXX
hich flow
uting the each cell.
r being a yst). The
han 5000 eam Link between
points are ound the cell with
ed. The ed above our Point output is

TogetheRaster a
In the pstreamsElevatio
er with the toare converted
picture above, and the non Model is u
ool ‘Stream d into a polyl
e, the black bormal blue lsed as back
to Feature line shapefile
boundaries alines are theground.
(Spatial Anae the result c
are the differee main strea
alyst)’, wherecan be seen
ent watersheams in the d
eby the streas follow:
eds, the smadifferent catc
eams of the
ll blue lines achments. Th
XXXI
Streams
are small he Digital

XXXII
11 Maps of Area
Density Wards Mtwara Rural
Elevation Mtwara region
Land use Mtwara Rural
Geological Formations Mtwara Rural
Project Wards Mtwara Rural
Pump Capacity Deep Boreholes (stretched elevation)
Pump Capacity Deep Boreholes (classified elevation)
Pump Capacity Deep Boreholes (geological formation)
Tanzania – Mtwara – Mtwara Rural
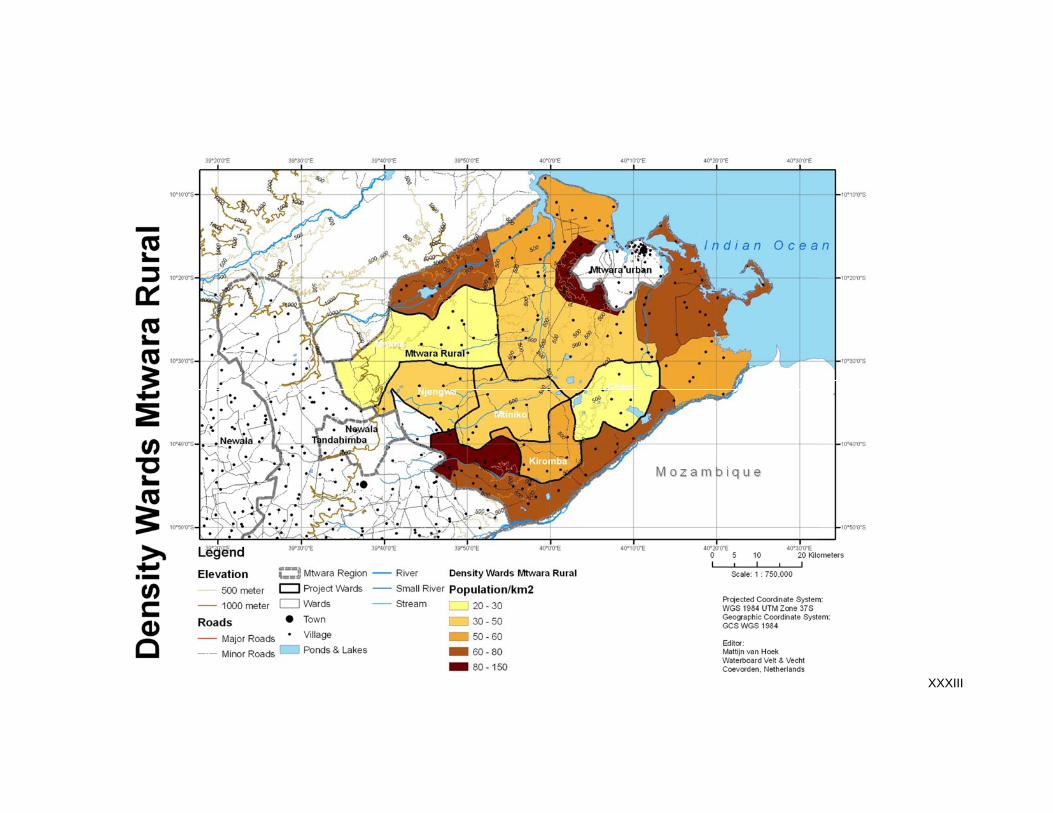
XXXIII

XXXIV

XXXV

XXXVI
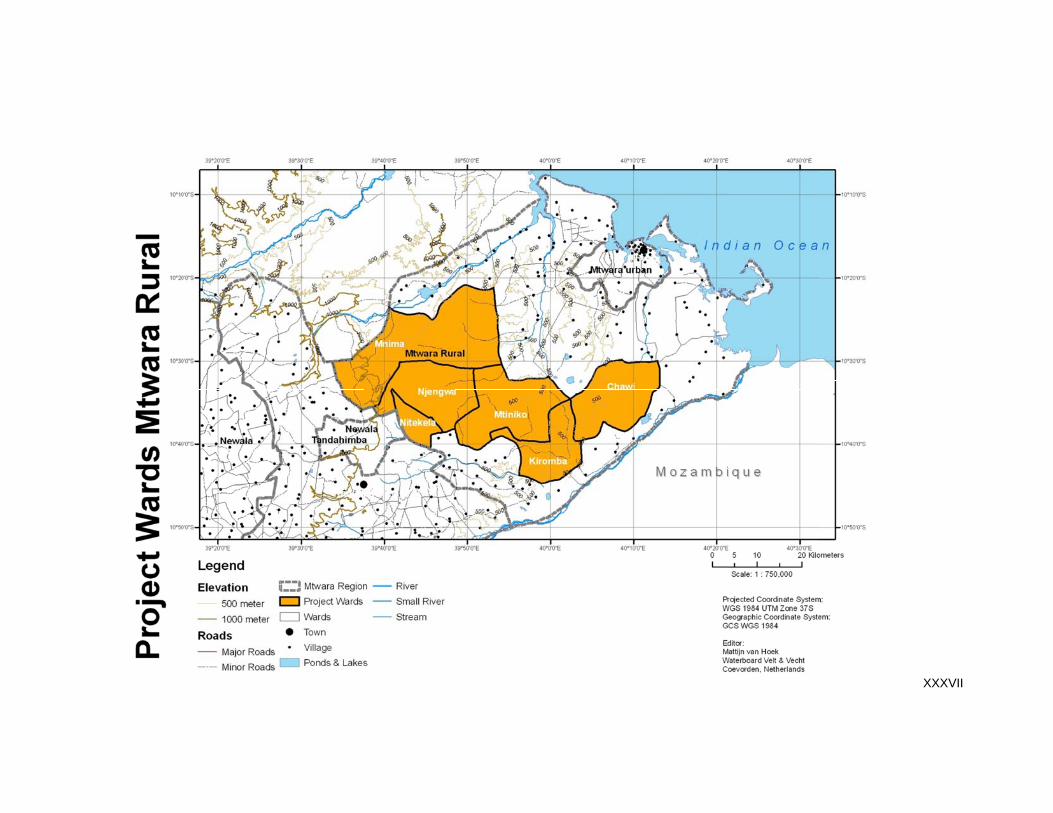
XXXVII

XXXVIII

XXXIX

XL

XLI

XLII
12 Explanation Models
Model 1. Roof catchment with storage tank
The model is based on different aspects. The main aspects are the roof surface, the storage capacity of the tank, the annual precipitation, the material of the tank, the number of people in one household and the demand in litres per capita for each day.
The assumptions are based on the value of water (20-litre bucket) the efficiency of the roof surface.
The annual roof run-off is calculated on base of the annual precipitation the dimensions of the roof surface and the efficiency of the roof. On base of this figure, it is possible to calculate the average daily roof run-off. In the model, it is calculated in litres and buckets (20-litre).
The demand is calculated on base of two different viewpoints, namely standard demand and adaptive demand. The standard demand is based on the number of population of the household and the daily demand per capita. It is the same year round.
Adaptive demand is based on the volume of the storage facility. If the storage facility is full of water, the demand is higher than normal. When the storage capacity is decreasing, the demand is also decreasing. If the storage capacity is below 1/3 of the maximum capacity, the demand is 2/3 of the selected standard daily demand.
In the two graphs of the main page of the model there are shown the two graphs of the adaptive and standard demand are shown. The blue line is the fluctuation of the storage of the tank. This line is based on the daily water demand, the monthly precipitation and the selected storage capacity of the tank. Usually the graph of the adaptive demand is smooth when the volume of the tank is low and the graph is decreasing faster if the storage capacity is more than 2/3 of the maximum capacity if it is compared with the graph with a standard demand.
The red line shows the overflow. If the monthly precipitation is delivering more water to the tank than the maximum storage capacity there is a overflow. To increase the efficiency of the model the overflow should be as low as possible.
On the following two pages an example of the input, the assumptions, the results, the performance indicators and the bill of quantities is shown.

XLIII

XLIV
Name of ward Name of village
Annual rainfall
797.1 mm 7
Set Population Set Households Select from list the surface Length (meter) Width (meter)
1918 383 100 60
Number of Fields Offset (meter)
1.5 2.0 25
Liters/Capita/Day
15
Efficiency offset (%)
0.34 60% 95% 95% 1722
Water Demand Village
28.8 m3/day 875 m3/month 10501 m3/year
Annual Overflow
560 m3/year
* Based on precipitation with repetition time of 1 in 5 years (propability 80%)
Demand satisfaction 116%
Efficiency 96%
Reliability of supply 100%
Payback time
Total months 28
Which is equal to
Years 2
Months 4
TZS Euro
Equivalent Unit Cost 830,580.02 482.33
EUC/Water user 433.04 0.25
Total Costs 63,331,386.40 36,777.81 Total costs as given in the BIQ
Dry months (less or equal to 50 mm monthly precipitation)
Demand, Storage Capacity & Overflow
Performance Indicators
Equivalent Unit Costs divided by the number of people who will use the
tank (corsts for every cubic meter/wateruser)
Average ward Average village
The costs divided by the water storage of the tank (costs for every cubic
meter)
Efficiency
storage (%)
Efficiency
fetching (%)
Currency rate
TZS : EURO
EPDM Rubber Sheet
Input Subsurface Soil Storage
Soccerfield
Annual water delivered (excluded overflow) in relation to the Annual
water demand
Annual water delivered (excluded overflow) in relation to the Annual
Catched Precipitation
Value of water (based on the Annual Water Demand) divided by the
construction costs
Soil Storage Capacity is
based on Sandy Soil
Assumptions
Value of bucket water
(20 liters) TZS
50.00TZS
Select from list the
Depth of Field (meter)
Baseline Survey Mtwara
Select from list where Daily Water Demand
will be based on:
Select from list the Material
for Ground Catchment
Percentages of days whereby the subsurface ground catchment contains
water
Propability 80% (Repetition time 1 in 5 years)
Select from list repetition time of annual
rainfall
0
1000
2000
3000
4000
5000
6000
7000
December
January
February
March
April
May
June
July
August
September
Octo
ber
Novem
ber
Storage
Capacity (m
³)
Fluctuation storage capacity (in m³) based on demand of different amount of households*
230 H.holds (‐40%)
306 H.holds (‐ 20%)
383 Households
460 H.holds (+ 20%)
536 H.holds (+ 40%)
Maximum Storage Capacity

XLV
Bill of Quantities
N° of infiltration fields 2 Ward Average wardLength 100 meter Village Average villageWidth 60 meter Population 1918Depth 1.5 meter
Description of components
Labour Cost People Days
Technicians 2 55 7,000.00 770,000.00
Labourers 95 162 2,500.00 38,571,428.57
5% of population ----------------
Total Labour Costs 39,341,428.57
Materials Unit QuantityUnit cost (TZS) Total Cost (TZS)
Wheelbarrow Pieces 12 10,000.00 120,000.00
Handpump Units 2 1,000,000.00 2,000,000.00
Drains Metres 240 5,000.00 1,200,000.00
Concrete ring (depth 0.5 meter) Units 10 50,000.00 500,000.00
Shovels Pieces 23 5,000.00 115,000.00
EPDM Rubber Sheet Sq.m 3123 6,390.00 19,954,957.82
- - - - -
- - - - -
----------------
Total material costs 23,889,957.82
Transport of Materials Tonnes Loads
Hardware lorries 7 1 100,000.00 100,000.00
Total costs
Labour costs 39,341,428.57
Materials 23,889,957.82
Transport of Materials 100,000.00
Total costs TZS 63,331,386.40
EURO 36,777.81
Cost/day (TZS) Total cost (TZS)

XLVI
Model 2. Surface catchment with subsurface soil storage
This model is based on the system whereby the water is stored in the soil. This is possible by the porosity of the soil. Different soil types have different porosity characteristics. The project area is located in area with sandy coarse soil. The porosity of this type of soil is 0.34. In a bucket of 20 liters filled with sand it is still possible to add 8 liters of water.
In the input of the model there are different main aspects.
The minimum annual rainfall, by selecting the repetition time of annual rainfall. It is possible to select a repetition time 1 in 10 years, 1 in 5 years and 1 in 2 years.
The population of the village should be entered.
The dimensions of the infiltration area need to be selected by choosing the dimensions of a basketball field, a half soccer field or a whole soccer field.
The depth of the infiltration field is selected by making choice between 1 and 5 meters below the surface level.
The offset is the radius around the infiltration field, which is also part of the catchment area. If the offset is increasing the catchment area around the infiltration field is also increasing.
The assumptions are the value of bucket water (20 liters), the porosity of the soil, or in other words the soil storage capacity. The efficiency of the storage and the efficiency of fetching. For calculating the costs from shilling to euro there is made use of the currency rate of 20 may 2010.
In the input, it is also possible to select the material for the impervious layer. The possible options are EPDM rubber, LPDE plastic and concrete.
The demand of the village is calculated in days, month and for every year as well as the total sum of the overflow.
The storage capacity is based on the monthly precipitation, the monthly demand the total size of the catchment area.
In the graph, the fluctuation of the storage capacity is shown. It is based on the demand of different number of households. The households, which are shown, are the number of households what is calculated on bases of the selected population and the number of households by an increase of 20 and 40% and a reduction of 20 and 40%.
With the dotted blue line the maximum storage capacity is shown. This is the maximum storage capacity of water and not the volume of the infiltration field. It is based on the dimensions of the infiltration field and the porosity of the soil.
If the lines are reaching the dotted blue line of the maximum storage capacity it means that the infiltration field is full with water and if the lines are reaching the x-as it means that the storage capacity is 0, so there will not be sufficient water to overcome the whole dry period.
On the following two pages is shown an example of the input, the assumptions, the results, the performance indicators and the bill of quantities.

XLVII
Name of village Name of family
Annual rainfall
797.1 mm 7
Set Population Set Households Diameter (meter) Capacity tank
50 10 8.0 121 m³
Number of Fields Offset (meter)
3 1.0 25
Liters/Capita/Day
15
60% 95% 95% 1722
Water Demand Village
0.8 m3/day 23 m3/month 274 m3/year
Annual Overflow
132 m3/year
* Based on precipitation with repetition time of 1 in 5 years (propability 80%)
Demand satisfaction 107%
Efficiency 69%
Reliability of supply 100%
Payback time
Total months 40
Which is equal to
Years 3
Months 4
TZS Euro
Equivalent Unit Cost 213,743.25 124.12
EUC/Water user 4,274.86 2.48
Total Costs 2,288,204.09 1,328.81 Total costs as given in the BIQ
Performance measures
Equivalent Unit Costs divided by the number of people who will use the
tank (corsts for every cubic meter/wateruser)
Average ward Average household
The costs divided by the water storage of the tank (costs for every cubic
meter)
Efficiency
storage (%)
Efficiency
fetching (%)
Currency rate
TZS : EURO
LPDE Plastic Sheet
Efficiency
offset (%)
Input Surface Catchment
Annual water delivered (excluded overflow) in relation to the Annual
water demand
Annual water delivered (excluded overflow) in relation to the Annual
Catched Precipitation
Value of water (based on the Annual Water Demand) divided by the
construction costs
Assumptions
Value of bucket water
(20 liters) TZS
50.00TZS
Baseline Survey Mtwara
Select from list where Daily Water Demand
will be based on:
Select from list the Material
for Ground Catchment
Percentages of days whereby the subsurface ground catchment contains
water
Propability 80% (Repetition time 1 in 5 years)
Select from list repetition time of annual
rainfall
Select Depth of Subsurface tank
(meter)
Dry months (less or equal to 50 mm monthly precipitation)
Demand, Storage Capacity & Overflow
0
20
40
60
80
100
120
140
December
January
February
March
April
May
June
July
August
September
Octo
ber
Novem
ber
Storage
Capacity (m
³)
Fluctuation storage capacity (in m³) based on demand of different amount of households*
6 H.holds (‐40%)
8 H.holds (‐ 20%)
10 Households
12 H.holds (+ 20%)
14 H.holds (+ 40%)
Maximum Storage Capacity

XLVIII
Bill of Quantities
N° of reservoirs 1 Ward Average wardDiameter 8 meter Village Average household
Depth 3 meter Population 50
Type of Tank
Description of components
Labour Cost People Days
Technicians 0 0 7,000.00 -
Labourers 8 9 5,000.00 344,677.59
15% of population ----------------
Total Labour Costs 344,677.59
Materials Unit QuantityUnit cost (TZS) Total Cost (TZS)
Handpump Units 1 1,000,000.00 1,000,000.00
Wheelbarrow Pieces 1 10,000.00 10,000.00
Fence (barbed wire) Metres 2320 100.00 232,000.00
Fence (poles) Units 29 5,000.00 145,000.00
Cover Sq.m 50 10,000.00 502,654.82
Shovels Pieces 2 5,000.00 10,000.00
LPDE Plastic Sheet Sq.m 40 600.00 23,871.67
- - - - -
- - - - -
- - - - -
----------------
Total material costs 1,923,526.50
Transport of Materials Tonnes Loads
Hardware lorries 7 0.2 100,000.00 20,000.00
Total costs
Labour costs 344,677.59
Materials 1,923,526.50
Transport of Materials 20,000.00
Total costs TZS 2,288,204.09
EURO 1,328.81
Cost/day (TZS) Total cost (TZS)
LPDE Plastic Sheet

XLIX
Model 3. Surface catchment with subsurface tank storage
This model is based on a subsurface ground tank with a catchment area around the ground tank. The main inputs are the repetition time of the annual rainfall, the number of people and the number of households.
The subsurface tank is a circular tank with a selected diameter. The depth of the subsurface tank needs to be selected. In the model it is possible to select a depth up to 5 metres below surface level. Practically, exceeding a depth of 3 metre is hardly possible.
The offset is the radius around the subsurface ground tank. There are losses for the offset and for this; it is possible to set efficiency for the offset. The loses include evaporation, infiltration.
The daily water demand can be selected on the base of different options. The baseline survey Mtwara, the water policy Tanzania and according to the world health organization. the daily water demand are for these representative 15, 25 and 20 litres of water for every capita for every day.
The demand is calculated on the base of the selected daily water demand and the number of population. The storage is based on the precipitation on the catchment area minus the losses and on the area of the surface of the tank, for this part there are no loses calculated.
In the graph the fluctuation of the storage capacity is shown. It can be seen that the maximal storage is only reached once a year during the wet season. During the dry season the storage capacity is slowly decreasing. This is because of the minimum amount of precipitation during the dry period versus the daily water demand of the selected population. The black line is shown the number of household what is selected and the other lines are calculated on the base of a decrease or increase of water users.
On the base of the selected material for the subsurface ground tank and the storage capacity of the tank is calculated and shown in the bill of quantities.
On the following two pages is shown an example of the input, the assumptions, the results, the performance indicators and the bill of quantities.

L
Liters/Capita/Day
15
Select Material
* ¹ List is formed by Analyse of Roof distribution *² Based on houses with iron sheet * ³ Recommended
90% 1722
Roof Run‐off & Demand
Annual Roof Run‐Off Average Daily Roof Run‐off
36515 L/year 100.04 L/day
36.5 m3/year 5.0 Buckets of 20 Liter
Standard Demand is Adaptive demand is
75 L/day Tank > 2/3 100.0 L/day 3.0 m3/month
2.3 m3/month 1/3<Tank<2/3 75.0 L/day 2.3 m3/month
Tank > 1/3 50.0 L/day 1.5 m3/month
Tank storage & Overflow
Annual Water Demand Annual Overflow Annual Water Demand Annual Overflow
29.7 m3 4.3 m3 27.4 m3 5.1 m3
Performance measures
Adaptive demand Standard demand
Demand satisfaction 109% 118%
Efficiency 88% 86%
Reliability of supply 100% 100% Percentages of days whereby the tank contains water
Payback time
Total months 138 150
Which is equal to:
Year(s) 11 12
Months 6 6
TZS Euro
Equivalent Unit Cost 221,164.27 128.43 The costs divided by the water storage of the tank (costs for every cubic meter)
Costs for every cubic meter divided by the water users (cost cubic meter
EUC/Water user 44,232.85 25.69
Total Costs 856,565.52 497.42 Total costs as given in the BIQ
Equivalent Unit Costs divided by the number of people who will use the
tank (corsts for every cubic meter/wateruser)
Ferro ‐ Cement
Annual water delivered to the household (excluded overflow) in relation
to the Annual roof run‐off
Value of water (based on the Annual Water Demand) divided by the
construction costs
Select from list the Daily
Water Demand
Baseline Survey Mtwara
Select Roof Surface & Tank size
Assumptions
Annual water delivered to the household (excluded overflow) in relation
to the Annual water demand
Input surface (m²)
15
Select from the list the Tank
Storage Capaciy (m³)
Currency rate TZS :
EURO
Percentage of Annual Average what will
fill the tank
Value of bucket water
(20 liters) TZS
Select from list repetition time of
annual rainfallPropabil ity 80% (Repetition time 1 in 5 years)
50.9 5
50.00TZS
Number of people
in Household
0.02.04.06.08.0
10.012.014.016.0
December
January
February
March
April
May
June
July
August
September
Octo
ber
Novem
ber
Amount water (m
3)
Adaptive Demand
Adaptive Tankstorage (m3)
Overflow (m3)
Maximum tank storage
0.02.04.06.08.0
10.012.014.016.0
December
February
April
June
August
Octo
ber
Amoun water (m
3)
Standard Demand
Standard Tankstorage (m3)
Overflow (m3)
Maximum tank storage

LI
Bill of Quantities
Type of tank Ferro - Cement Name village
Volume 15 m3 Households 1
Minimum roof surface 51 m2 P.p. Households 5
Description of components
Labour Cost People Days
Technicians 2 8 7,000.00 112,000.00
Labourers 4 8 5,000.00 160,000.00
----------------
Total Labour Costs 272,000.00
Materials Unit QuantityUnit cost (TZS) Total Cost (TZS)
Cement 50 kg bags 26 15,000.00 391,379.57
Lime (Lihno) 25 kg bags 1 7,500.00 8,894.99
Pole Metres 6 3,000.00 17,789.98
Aggregate Tonnes 2 34,285.71 81,325.63
Hardcore Tonnes 1 1,142.86 1,355.43
Burnt bricks Units 59 600.00 35,579.96
Water Liter 18 20.00 355.80
BRC mesh Sq.m 47 800.00 37,951.96
Twisted bars, Y12 Metres 4 12,800.00 45,542.35
uPVC, 4" sewage pipe Metres 4 4,000.00 14,231.98
G.I pipe, ½" Metres 1 12,000.00 14,231.98
Timber, 2"x3" Metres 19 3,250.00 61,671.93
Pole Metres 9 3,000.00 28,463.97
----------------
Total material costs 738,775.54
Transport of Materials Tonnes Loads
Hardware lorries 7 1 100,000.00 100,000.00
Total costs
Labour costs 17,789.98
Materials 738,775.54
Transport of Materials 100,000.00
Total costs TZS 856,565.52
EURO 497.42
Cost/day (TZS) Total cost (TZS)

LII
Costs of the different materials in Mtwara List of Materials Kiswahili Units Unit cost TZS Labour costs Cost/day
Aggregate Kokoto Tonnes 34,285.71 Artesians 7000
Angle iron 25x25mm Units 12,800.00 Labourers 5000
Barbed wire g.12.5 25 Kg 60,000.00
Binding wire g.8 Bending wire Kg 2,500.00
Bolts 6mmx100mm Bolts Number 1,000.00 Transport Cost/tonnes Tonnes
BRC mesh No 65 Metres 800.00 Hardware lorries 100000 7
Burnt bricks, 10"x12"x20" Tofali lakuchoma Units 1,200.00 250000 15
Burnt bricks, 3"x5"x8" Units 400.00
Burnt bricks, 4"x6"x10" Units 600.00
Canvas 1.2 m Turubai Metres 16,000.00
Cement Cement 50 kg bags 15,000.00
Chicken mesh 25mm 0.9mm Wavu wa kuku Metres 45,000.00 Movement of sand Hours
Circular bolts, 6mmx25mm Bolts Units 1,000.00 1m2 2
Circular metal ring Centimetres 1,000.00 Digging
G.I elbow, ½" G.I Elboq Units 600.00 1m2 3
G.I pipe, ½" Metres 24,000.00
G.I pipe, ¾" Metres 30,000.00
G.I Sheet Units
G.I tap Units 6,000.00
G.I wire, 3mm Kg
Galvanised coffee mesh Sq.m 130,000.00
Galvanized ceiling nails Misumari ya dari Kg 3,500.00
Hardcore, 4"x6" Mawe Tonnes 1,142.86
Lime (Lihno) Chokaa 25 kg bags 7,500.00
Mosquito mesh Wavu wa Mbu Sq.m 1,700.00
Nails 3" Misumari inch tatu Kg 2,500.00
Nails, 2" Misumari inch mbili Kg 2,500.00
Oil‐drums, discharged Pipa Number
Plastic bag Number
Plastic basin Baseni Number 2,000.00
Pole Nguzo Lenghts
River Sand Mchanga Tonnes 17,142.86
Rubble stones blocks, 5"x8"x15" Units
Sisal twine Kamba ya katani Roll 2,000.00
Soil compressed blocks, 4"x5"x12" Units 200.00
Timber, 2"x3" Mbao 2"x3" Metres 3,250.00
Timber, 6"x1" Mbao 6"x1" Metres 7,500.00
Twisted bars, Y12 Nondo mm 12 Metres 12,800.00
uPVC, 2" sewage pipe Metres 12,000.00
uPVC, 4" sewage pipe Metres 16,000.00
Water Maji Liter 20.00
Weld mesh 2.4x1.2 gr.8 Wavu Metres 800.00
G.I socket, ¾" Units 1,000.00
G.I nipple, ¾" Units 1,000.00
LPDE Plastic Sheet Sq.m 750.00
EPDM Rubber Sheet Sq.m 6,390.00
Handpump Units 1,000,000.00
Drains Metres 5,000.00
Concrete ring (depth 0.5 meter) Units 50,000.00
Shovels Pieces 5,000.00
Wheelbarrow Pieces 10,000.00

LIII
13 Budget for each system
Actual Used System Borehole + Water Storage Tank + Distribution Network
Number of Villagers Daily water demand per capita Currency (18/5/2010 quoted rate)
1918 15 L/c/d 1.722,00
422,96 m³/month/village (average)
Description of Components Cost of fixed asset Residual value
Euro Shilling Euro Shilling
Water storage tank 16.352 28.158.144,00 ‐ 20 68,13 117.325,60
Distribution network 13.081 22.525.482,00 ‐ 15 72,67 125.141,57
Borehole 11.119 19.146.918,00 ‐ 20 46,33 79.778,83
Pumphouse 5.000 8.610.000,00 ‐ 15 27,78 47.833,33
Solar panels 30.000 51.660.000,00 ‐ 20 125,00 215.250,00
Pump 9.811 16.894.542,00 ‐ 8 102,20 175.984,81
Total 85.363 146.995.086,00 442,11 761.314,14
Operation and Maintenance Cost/month
(Euro)
Cost/month
(Shilling)
Maintenance and repair 100,00 172.200,00
Salary administrator 70,00 120.540,00
Salary operator 50,00 86.100,00
Total 220,00 378.840,00
Calculation of Costs per m³ consumed 85% of production Per m³
(Euro)
Per m³ (Shilling)
Investments 1,23 2.117,61
Operation and Maintenance Maintenance and repair 0,28 478,98
Salary 0,33 574,77
Total 1,84 3.171,37
Price/bucket (20‐Litre) 0,037 63,43
Monthly Income 521,94 898.787,79
Monthly Costs 662,11 1.140.154,14
Difference income costs / month 140,17‐ 241.366,35‐
Annually Income 6.263,33 10.785.453,44
Anually Costs 7.945,33 13.681.849,65
Difference income costs / year 1.682,00‐ 2.896.396,21‐
Useful life of
asset (years)
Cost/month
(Euro)
Cost/month
(Shilling)

LIV
Possible Alternative (1) Subsurface Soil Storage + Surface Catchment
Number of Villagers Daily water demand per capita Currency (18/5/2010 quoted rate)
1918 15 L/c/d 1.722,00
422,96 m³/month/village (average) N° of infiltration fields 2
Length 100 meter
Width 60 meter
Depth 1,5 meter
Labour costs Days Euro/day Shilling/day Cost/month Total cost
2,90 5.000,00 (Euro) (Shilling)
Sand excavation 7695 22.343,20 38.474.993,84 15 124,13 213.749,97
Construction drains 10 29,04 49.999,99 15 0,16 277,78
Installation impervious layer 6 17,42 30.000,00 15 0,10 166,67
Constructing fence 20 58,07 99.999,98 5 0,97 1.666,67
Constructing well 10 29,04 49.999,99 15 0,16 277,78
Total 7741 22.476,77 38.704.993,81 125,52 216.138,85
Description of Components Cost of fixed asset Residual value
Euro Shilling Euro Shilling
Drainage network 696,86 1.199.992,92 ‐ 15 3,87 6.666,63
Hand pump 1.161,44 1.999.999,68 ‐ 8 12,10 20.833,33
Impervious layer (EPDM Rubber) 11.588,24 19.954.949,28 ‐ 15 64,38 110.860,83
Fence 100,00 172.200,00 ‐ 5 1,67 2.870,00
Shallow Well 290,36 499.999,92 ‐ 15 1,61 2.777,78
Total 13.837 23.827.141,80 83,63 144.008,56
Operation and Maintenance Cost/month
(Euro)
Cost/month
(Shilling)
Maintenance and repair 20,00 34.440,00
Salary administrator 70,00 120.540,00
Salary operator 50,00 86.100,00
Total 140,00 241.080,00
Calculation of Costs per m³ consumed 85% of production Per m³
(Euro)
Per m³ (Shilling)
Investments 0,23 400,56
Labour cost 0,35 601,20
Operation and Maintenance Maintenance and repair 0,06 95,80
Salary 0,33 574,77
Total 0,97 1.672,33
Price/bucket (20‐Litre) 0,019 33,45
Monthly Income 521,94 898.787,79
Monthly Costs 349,14 601.227,42
Difference income costs / month 172,80 297.560,37
Annually Income 6.263,33 10.785.453,44
Anually Costs 4.189,74 7.214.729,02
Difference income costs / year 2.073,59 3.570.724,42
Depreciation
(years)
Useful life of
asset (years)
Cost/month
(Euro)
Cost/month
(Shilling)

LV
Possible Alternative (2) Subsurface Reservoir + Surface Catchment
Number of Villagers Daily water demand per capita Currency (18/5/2010 quoted rate)
1918 15 L/c/d 1.722,00
422,96 m³/month/village (average) N° of reservoirs 38
Diameter 8 meter
Depth 3 meter
Type of Tank EPDM Rubber Sheet
Labour costs Days Euro/day Shilling/day Cost/month Total cost
2,90 5.000,00 (Euro) (Shilling)
Sand excavation 2622 7.613,24 13.109.997,90 15 42,30 72.833,32
Construction reservoir 380 1.103,37 1.899.999,70 15 6,13 10.555,55
Constructing cover 760 2.206,74 3.799.999,39 5 36,78 63.333,32
Constructing fence 380 1.103,37 1.899.999,70 15 6,13 10.555,55
Total 4142 12.026,71 20.709.996,69 91,33 157.277,75
Description of Components Cost of fixed asset Residual value
Euro Shilling Euro Shilling
Cover 291,90 502.654,84 ‐ 10 2,43 4.188,79
Hand pump 22.067,36 38.000.000,00 ‐ 8 229,87 395.833,33
Impervious layer (EPDM Rubber) 5.610,26 9.660.865,57 ‐ 15 31,17 53.671,48
Fence 218,93 377.000,00 ‐ 5 3,65 6.283,33
Total 28.188 48.540.520,41 267,12 459.976,93
Operation and Maintenance Cost/month
(Euro)
Cost/month
(Shilling)
Maintenance and repair 50,00 86.100,00
Salary administrator 70,00 120.540,00
Salary operator 50,00 86.100,00
Total 170,00 292.740,00
Calculation of Costs per m³ consumed 85% of production Per m³
(Euro)
Per m³ (Shilling)
Investments 0,74 1.279,44
Labour cost 0,25 437,47
Operation and Maintenance Maintenance and repair 0,14 239,49
Salary 0,33 574,77
Total 1,47 2.531,17
Price/bucket (20‐Litre) 0,029 50,62
Monthly Income 521,94 898.787,79
Monthly Costs 528,45 909.994,69
Difference income costs / month 6,51‐ 11.206,90‐
Annually Income 6.263,33 10.785.453,44
Anually Costs 6.341,43 10.919.936,22
Difference income costs / year 78,10‐ 134.482,78‐
Depreciation
(years)
Useful life of
asset (years)
Cost/month
(Euro)
Cost/month
(Shilling)

LVI
Possible Alternative (3) Tank storage + Roof catchment
Number of Villagers Daily water demand per capita Currency (18/5/2010 quoted rate)
1918 15 L/c/d 1,722.00
422.96 m³/month/village (average) N° of tanks 383
Type of tank Ferro ‐ Cement
Volume 15 m3
Minimum roof surface 51 m2
Labour costs Days Euro/day Shilling/day Cost/month Total cost
2.90 5,000.00 (Euro) (Shilling)
Construction tank 12256 35,586.52 61,279,990.20 15 197.70 340,444.39
Constructing gutters 766 2,224.16 3,829,999.39 5 37.07 63,833.32
Total 13022 37,810.68 65,109,989.58 234.77 404,277.71
Description of Components Cost of fixed asset Residual value
Euro Shilling Euro Shilling
Tank 164,315.35 282,951,030.90 ‐ 10 1,369.29 2,357,925.26
Gutters 10,675.96 18,384,000.00 ‐ 8 111.21 191,500.00
Total 174,991 301,335,030.90 1,480.50 2,549,425.26
Operation and Maintenance Cost/month
(Euro)
Cost/month
(Shilling)
Maintenance and repair 20.00 34,440.00
Total 20.00 34,440.00
Calculation of Costs per m³ consumed 85% of production Per m³ (Euro) Per m³
(Shilling)
Investments 4.12 7,091.29
Labour cost 0.65 1,124.51
Operation and Maintenance Maintenance and repair 0.06 95.80
Total 4.83 8,311.59
Price/bucket (20‐Litre) 0.097 166.23
Monthly Income 521.94 898,787.79
Monthly Costs 1,735.27 2,988,142.97
Difference income costs / month 978.56‐ 1,685,077.47‐
Annually Income 6,263.33 10,785,453.44
Anually Costs 20,823.30 35,857,715.65
Difference income costs / year 14,559.97‐ 25,072,262.21‐
Depreciation
(years)
Useful life of
asset (years)
Cost/month
(Euro)
Cost/month
(Shilling)