investigations of birds during construction and operation
TRANSCRIPT

National Environmental Research InstituteMinistry of the Environment . Denmark
Investigations of birdsduring construction andoperation of Nysted offshorewind farm at RødsandAnnual status report 2003
Report Commissioned by Energi E2 A/S 2004

[Blank page]

National Environmental Research InstituteMinistry of the Environment . Denmark
Investigations of birdsduring construction andoperation of Nysted offshorewind farm at RødsandAnnual status report 2003
Report Commissioned by Energi E2 A/S 2004
Johnny KahlertIb Krag PetersenAnthony D. FoxMark DesholmIb Clausager
Data sheet
Title: Investigations of birds during construction and operation of Nysted offshore windfarm at Rødsand
Subtitle: Annual status report 2003
Authors: Johnny Kahlert, Ib Krag Petersen, Anthony D. Fox, Mark Desholm & Ib Clausager
Department: Department of Wildlife Ecology and Biodiversity
Serial title: NERI report
Publisher: National Environmental Research Institute Ministry of the Environment
Year of publication: 2004
Editor: Karsten LaursenReferee: Hans OhrtProofreading: Else-Marie NielsenLayout: Annie LaursenFigures: Tinna Christensen
Energi E2 A/S

Information NoteThis information note summarises the framework for the three annual statusreports for 2003, concerning bird studies in relation to the offshore wind farmsat Nysted in the Baltic Sea and Horns Rev in the North Sea.
The three reports are:
Christensen, T. K., Hounisen, J. P., Clausager, I. & Petersen, I. K., 2004: Visual andradar observations of birds in relation to collision risk at the Horns Rev offshore windfarm. Annual status report 2003. - 48 pp.
Kahlert J., Petersen I. K., Fox A. D., Desholm M. & Clausager I. 2004: Investigations ofbirds during construction and operation of Nysted offshore wind farm at Rødsand. -Annual status report 2003. – 82 pp.
Petersen, I. K., Clausager, I. & Christensen, T. K., 2004. Bird numbers and distri-bution in the Horns Rev offshore wind farm. - Annual status report 2003. - 36 pp.
Bird studies are to be carried out at Nysted and Horns Rev during the period1999-2006 under the permitting tems for wind farm construction at the twosites, granted by the Danish authorities. The bird studies are carried out before,during and after construction of both wind farms.
The installation of wind turbines was finished in autumn 2002 (Horns Rev) andsummer 2003 (Nysted). Hence, the annual status reports for 2003 merely repre-sent data from one year or less during the initial operational phase of the windfarms. Thus, natural variation between years, seasons, species and sites and thepossible habituation effects during the operational phase could not be consid-ered. Therefore, it must be emphasised that the tendencies, suggested by theresults in all three annual status reports are to be considered as preliminary,and must await further compilation of data, before firm conclusions can bedrawn with respect to impact on birds.
The final environmental impact assessment for the two wind farms is plannedto be undertaken upon termination of the environmental monitoring pro-grammes in 2006.

[Blank page]

Contents
Synopsis 5
1 Introduction 91.1 Background 91.2 Base-line investigations 111.3 Monitoring programme 12
2 Methods 132.1 Study area 132.2 Monitoring of migratory birds 2003 14
2.2.1 Lateral change in migration routes 152.2.2 Probability of passing the wind farm area 192.2.3 Migration intensity in the wind farm area 212.2.4 Species composition, numbers and flock size 232.2.5 Migration speed 23
2.3 Surveys of staging, moulting and wintering birds 232.4 Weather data 262.5 Quality control 26
3 Results 273.1 Migratory birds 27
3.1.1 Lateral change in migration routes 273.1.2 Probability of passing the wind farm area 361.1.3 Reverse migration 431.1.4 Migration intensity in the wind farm area 441.1.5 Species composition, numbers and flock size 46
1.2 Staging, moulting and wintering birds 511.2.1 Survey coverage 531.2.2 Species account 541.2.3 Bird distributions during base-line versus the construction phase 66
4 Discussion and conclusions 714.1 Patterns of migration 71
4.1.1 Assessing effects during the construction phase 724.1.2 Assessing effects during the operational phase 73
4.2 Staging, moulting and wintering birds 75
References 77
Appendixes 79Appendix 1 79Appendix II 79Appendix III 80Appendix IV 80Appendix V 81

[Blank page]
5
Synopsis
This report presents data on monitoring investigations of birds car-ried out during spring and autumn 2003 in relation to the Nystedoffshore wind farm at Rødsand.
Information presented covers the spring migration period of 2003during which the wind farm was under construction. Observationstherefore reflect the reactions of migrating birds to the presence offoundations and the support ships in the vicinity.
Data are also presented for autumn 2003 by which time all the tur-bines had been erected and were in operation.
Migration routes were mapped using the same techniques as thoseused during the base-line investigations of 1999-2002, combining ra-dar techniques by day and night with specific species identificationduring daylight hours using telescopes. Radar tracks were entered toa GIS platform to compare the base-line with subsequent monitoringresults. Emphasis was placed upon three key variables:
1) the orientation of autumn migration routes for waterbirds and ter-restrial species to measure potential avoidance responses and re-sponse distances,
2) the probability that waterbirds will pass through the wind farmarea during autumn and spring, to measure waterbird responses tothe entire wind farm,
3) migration intensity, measured by the number of bird flocks thatpass the eastern and northern edge of the wind farm area, to measurethe effect of avoidance responses on the volume of migration withinthe wind farm area.
Comparisons of these key variables between individual base-lineyears were undertaken by controlling for various factors such asweather conditions, season and time of day using multi-factorANOVA and regression analyses.
In addition, the distribution and abundance of waterbirds, whichincluded spring migrants and wintering birds, were monitored inand around the wind farm by sequential aerial surveys as during thebase-line years.
The wind farm area is situated on a major waterbird migration route,used by up to 300,000 individuals in autumn. The intense migrationof waterbirds was confirmed by base-line observations in 1999-2002and during the construction and operational phases in 2003.
Autumn migrating waterfowl showed significant differences in theirmean orientation within the approaching area of the wind farm be-tween all four years of investigation. The analyses of the orientationof individual bird flocks in relation to their distance from the windfarm showed that the year-effect differed across years dependent on

6
the distance from the wind farm. Due to small sample sizes and cer-tain wind conditions the wind effects found in the baseline studiescould not be incorporated into the 2003 analyses. It was therefore notpossible to demonstrate a convincing change in migration orientationat a specific distance from the wind farm following construction ofthe wind farm. However, the standard deviation of migration orien-tation increased significantly during the daytime at distances closerthan 3000 m to the wind farm in 2003 and closer than 1000 m duringthe night. These results support the hypothesis that migrating birdsshow a response to the wind farm, specifically reacting by increasedlateral avoidance to the north and south of the wind farm. They alsoconform to the predictions under the hypotheses that (i) the deflec-tion will occur close to the wind farm and (ii) that the deflection willoccur closer to the wind farm at night than during the day.
Observations in autumn 2003 offered no support for a severe avoid-ance response to the wind farm, in terms of a substantial reverse mi-gration of birds turning back eastwards from the eastern edge of thewind farm compared with the base-line.
Base-line studies showed that between 24% (2002) and 48% (2000) oftracks registered in autumn by radar passed the eastern border of theproposed wind farm area. After the wind turbines were erected in2003, significantly less (9%) tracks of waterbird flocks registered byradar passed the eastern border. This result was confirmed control-ling for the effects of cross-winds, time of day (4-7% by day com-pared to 11-24% by night) and latitudinal position.
Generally, the major spring migration route of waterbirds lies northof the wind farm area. During spring 2003, 11% of all migrating wa-terfowl tracks passed the eastern edge of the wind farm area, lessthan in 2001 (16%) and 2002 (25%), but the difference was not signifi-cant during the day. Hence, during daylight hours there was no sup-port for the hypothesis that birds avoided the wind farm area duringthe construction phase in spring 2003.
Data relating to migrating land birds are not discussed in any greatdetail in this report. Temporary suspension of the studies in autumn2002, extremely low spring migration intensities of raptors, pigeonsand passerines in all years provide insufficient information for a fullanalysis of the effects on these species during construction and op-eration of the wind farm.
Waterbird migration intensity within the wind farm area varied con-siderably with weather conditions both locally and on a flyway scalemaking predictions at a local scale difficult to model, and statisticalcomparisons complex. Nevertheless, the results from spring andautumn 2003 clearly demonstrated reduced intensity of migration inthe wind farm area, based on density of radar tracks. These responseswere undoubtedly partly the results of the "shadow effects" cast onthe radar screen by individual turbines. However, because many ofthe tracks appear beyond such turbines shadow and emerge from theouter side of the wind farm, the intensity of migration in the areabetween the erected turbines was considerably less than at outsideand compared with base-line years. This is confirmed from individ-

7
ual tracks identified to species, which showed that many flocks andindividuals take avoidance action and fly around the park withoutever venturing between the turbines. Furthermore, those that do con-tinue into the wind farm adjusted their flight trajectories and tendedto fly down the visually clear corridors between the rows of turbines.Both these features combine to explain the overall reduction in mi-gration track densities within the wind farm.
Despite general support for the hypotheses outlined above, it is im-portant to stress that these results provide little evidence for oragainst the effects of the construction of wind turbines on migratingwaterbirds. The data were collected in just one year and constructionphase of the turbines extended over a relatively short period. It istherefore difficult to draw many reliable conclusions from the singlecase study. Although the results suggest substantial avoidance (andprovide data on the nature of that avoidance) by autumn migratingwaterbirds of the newly constructed wind farm, it is important tostress that these results come from one single monitoring year. Theyare gathered under the particular conditions prevailing in that yearand before any likely effects of longer-term habituation or other be-havioural responses to its presence.
Four aerial surveys of staging and wintering birds were conducted inthe study area in 2003, one in each of the months of January, March,April and December. Thus a total of 25 surveys has been performedsince August 1999.
The main construction phase of the Nysted windfarm was defined tocommence by January 2003 and the operational phase by August2003. Thus the three early surveys of 2003 represented the construc-tion phase data set, while the December survey comprised the firstdata set from the operational phase of the wind farm.
At the time of the January 2003 survey ice cover was observed inlarge parts of the survey area, causing changes in bird distributionpatterns. Therefore data from this survey were excluded from part ofthe data analyses.
The most numerous species recorded in 2003 were Tufted Duck(12,205), Eider (3,142), Mute Swan (2,882) and Long-tailed Duck(2,797). Of these only Eider and Long-tailed Duck occurred fre-quently in the offshore areas.
To ensure maximum compatibility between base-line data and con-struction data only data from March and April of the base-line phasewere used to analyse construction activity impact on bird distribu-tions. Given the small number of surveys during construction, nofirm conclusion can be drawn about the construction phase. How-ever, long-tailed duck and eider showed reduced preference for thewind farm area during construction, whereas the relative number ofherring gulls increased slightly in the wind farm area.
Since only one survey exists during operation of the wind farm re-sults must be supported by further surveys before conclusions con-cerning habitat loss for staging and wintering birds at Nysted WindFarm can be drawn.

[Blank page]

9
1 Introduction
1.1 Background
In June 2001, the Danish Ministry of Energy licensed Energi E2 toconstruct the offshore Nysted wind farm situated in the Baltic Sea,south of Lolland and Rødsand (Fig. 1). The off-shore construction ofthe wind farm commenced in June 2002 when the first excavations forfoundations were carried out. In September 2002, the cabling was laidbetween the offshore transformer station and Lolland. In October2002, the first foundation was placed off-shore. Intensive work onestablishing foundations was carried out during spring 2003. Subse-quently, 72 turbines each with a performance of 2.3 MW were erectedMay to July 2003. Turbines came gradually into operation from Julyto Mid-September. During autumn 2003, an operational test was con-ducted. The test period included frequent servicing of the turbines,which also involved temporary cessation of turbines in one or morerows. The test period terminated by 1 December 2003, when commer-cial operation was initiated.
Falster
Møn
Lolland
Hyllekrog Rødsand
Gedser O
dde
Guldborg Sund
Figure 1. The wind farm area and study area south of Lolland and Falster in southeastern Denmark.Names of locations referred to in the text are indicated. The hatched area represents the wind farm area,thin and thick arrows indicate the schematic direction of terrestrial and waterbird migration, respectively.Blue arrows indicate spring migration and red arrows autumn migration.

10
The entire project has been organised as a demonstration project toassess the technical, economic and environmental constraints on thefuture development of electric power production in Danish offshoreenvironments. For detailed background information, see SEAS Dis-tribution A.m.b.A. (2000).
Within the framework of the environmental programme, bird inves-tigations have been carried out since 1999. Based on the progress andextent of construction activities, bird studies have been divided intothree phases in this report:
1) Base-line investigations before erection of the wind farm, 1999-20022) Monitoring during the main construction phase, January - July 20033) Monitoring during the first provisional operational phase of the
wind farm, August - December 2003.
This report presents results compiled during 2003 and deals with thefirst preliminary analysis of effects on birds present at the Nystedwind farm during construction and operation of the wind farm. Theresults from 2003 will be supported by further studies in the years tocome.
The potential effects of the wind farm on birds are considered underthree main headings:
1) Disturbance effects (displacement, equivalent to habitat loss);2) Physical changes due to construction (physical habitat loss, change
of bottom fauna and new opportunities for resting on the staticsuperstructure);
3) Risk of collision (mortality).
1) The displacement of staging birds as a result of wind farm con-struction has been demonstrated for different bird species (Tulp et al.1999, Larsen & Madsen 2000). In relation to staging waterbirds, theturbines can scare birds away from the immediate vicinity of thewind farm area. This in turn could have two consequences: either aloss of foraging areas which could ultimately reduce the populationsize if feeding areas are limited, or a shift in foraging area with nomeasurable effects on the overall population size if alternative feed-ing areas exist elsewhere.
2) Physical changes of the habitat were judged to be of minimal andtemporal importance, and it was estimated that resettling of bottomfauna on foundations of the turbines would exceed the loss of bottomfauna caused by the establishment of turbines (DHI 2000). Further-more, cormorants and gulls may use the static turbine superstructurefor resting.
3) It is known that wind turbines represent a risk of bird mortality(e.g. Barrios & Rodrígues 2004). Studies of the collision risk were notpossible prior to the construction of the turbines. Nevertheless, thesubject has been given attention in the present report as collision riskis highly dependent on a number of factors, in which insight can begained by compiling data before and after the erection of the windfarm. This includes the avoidance response by flying birds, whichmay either deflect laterally as they approach a wind farm or may

11
climb to attain height to avoid it attitudinally. Such avoidance re-sponses are likely to be species-specific, which may result from thediffering ability of different species to manoeuvre, their sensitivity tothe presence of large offshore constructions and interactions withweather factors. Furthermore, displacement from regular migrationpatterns will indirectly affect the collision risk, as the precise positionof the local migration routes is a major determinant of the number ofpotential encounters.
Collisions increase the mortality of bird populations. At the level of aflyway population, the sensitivity to additional mortality caused bycollisions with wind turbines will depend on the population dynam-ics of the species. Long-lived species with a low reproduction ratesuch as many waterbirds are likely to be more sensitive to smallchanges in adult mortality compared to passerines that suffer a highannual mortality (in some species more than 50%) and have a corre-spondingly high reproductive output (Noer et al. 1996, Morrison etal. 1998).
A separate project, which deals with the development of reliablemethods to estimate collision frequency at the Nysted wind farm, iscurrently being undertaken. So far it has been concluded that re-cordings from video cameras using infrared sensing are likely to be afeasible way to estimate the collision frequency at offshore wind tur-bines (Desholm et al. 2001, Desholm 2003).
1.2 Base-line investigations
Data from the base-line investigations have been collected over anumber of years (1999-2002) to assess the extent of inter-annualvariation. During the construction phase and after the erection of theturbines a 2-3 year monitoring programme is planned, to form thebasis of a comparison with the base-line data in order to determinepossible effects of the construction activities and of the wind farmitself on birds.
The initial base-line study confirmed the importance of the areaaround Rødsand, which holds relatively large numbers of stagingwaterbird species throughout the year. In addition, Gedser Odde,which is situated east of the wind farm area, acts as a geographicalbarrier during autumn where migrating waterbirds and terrestrialbird species concentrate as they pass through the area. During spring,substantial numbers of birds (mostly waterbirds) pass along thesouthern coastline of Lolland and Falster and thus through the windfarm area (see Fig. 1). The significance of the area for staging and mi-grating waterbirds has been confirmed through extensive studies,carried out since 1999 by the National Environmental Research In-stitute (NERI) (Kahlert et al. 2000, Desholm et al. 2001, Kahlert et al.2002, Desholm et al. 2003), and commissioned by SEAS Wind EnergyCentre (SEAS) on behalf of Energi E2.
During the autumns of 1999-2002, the majority of terrestrial bird spe-cies migrated from the tip of Gedser Odde and Lolland in southerlydirections, whereas the waterbirds rounded Gedser Odde heading

12
west and southwest (Kahlert et al. 2000, Desholm et al. 2001, Kahlertet al. 2002, Desholm et al. 2003; see Fig. 1). Time of day, season andwind direction had significant effects on the migration pattern in thestudy area.
Of the total waterbird migration at Gedser Odde, 16-48% passed theeasternmost edge of the wind farm area in 1999-2002, dependent onseason.
An area is recognised as being of international importance to a spe-cies if 1% of its flyway population is present regularly at a site atsome time during the annual cycle (Prater 1981, and see alsohttp://www.ramsar.org/key_criteria.htm). Based on this 1%-criterionthe selected study area around Rødsand was classified as being ofinternational importance to staging cormorants Phalacrocorax carbo,red-breasted merganser Mergus serrator and moulting mute swansCygnus olor (Desholm et al. 2001).
In the autumns of 2000 and 2002, analyses of the distribution of thethree species for which the study area was considered of internationalimportance showed that red-breasted merganser occurred in ex-tremely small numbers. Cormorants and mute swans significantlyavoided the wind farm area although cormorants visited it duringsocial foraging movements. These movements consisted of flocks ofup to 5,000 cormorants, which may make up a potential high-risk ofcollisions with wind turbines in the future.
1.3 Monitoring programme
The bird investigations carried out during the monitoring of the con-struction and operation of the wind farm in 2003 followed the proce-dures used in the base-line investigations (Desholm et al. 2001,Kahlert et al. 2002, Desholm et al. 2003). However, adjustment of themonitoring programme was done in accordance with the conclusionsobtained during the base-line study. The study of spring migration ofdark-bellied brent geese Branta bernicla in late May was not carriedout in 2003 as in previous years. Three years of base-line results didnot show any significance of the wind farm area for this species as themigration route was consistently situated north of the wind farm areaclose to the mainland coasts (Desholm et al. 2003). In addition, aerialcount surveys were not carried out during autumn 2003, as the areaduring this season was shown to be of little importance for stagingwaterbirds, except for cormorant. However, monitoring of cormo-rants was continued under the studies of migratory birds (radarstudies), which included counts and description of flight trajectories.
In accordance with the base-line studies three variables were derivedto analyse potential lateral changes in migration routes for birds ap-proaching the wind farm area. The three variables are: 1) orientationof migration (only during autumn), 2) probability of passing throughthe wind farm area, and 3) migration intensity in the wind farm area.Aerial counts of staging waterbirds were carried out during Decem-ber - April to cover the winter and spring period, which appeared tobe of greatest importance for staging waterbirds.

13
2 Methods
2.1 Study area
The wind farm is located south of Rødsand, ca. 10.5 km west-southwest of Gedser Odde and ca. 11.5 km south of Lolland at waterdepths of 6-9.5 m (Fig. 2). The wind farm comprises 72 turbinesplaced in 8 north-south orientated rows with 9 turbines in each row.The distance between rows is 850 m, whereas the distance betweenturbines within a row is 480 m. The upper tips of the wings reach 110m whereas the lower tips start at 30 m.
For flight safety reasons, synchronised red flashing lights have beenmounted on top of turbines at the fringe of the wind farm. Light in-tensity is 32 Cd at visibilities more than 5 km and 2000 Cd when lessthan 5 km. Permanent red lights with an intensity of 32 Cd are placedon the inner turbines. For ship navigation the wind farm was fittedwith flashing lights on each of the corner turbines, on two turbines atthe northern and southern fringe, respectively, and on one turbine atthe eastern and western border of the wind farm. All flashing lightsare synchronised and should be visible at a distance of 5 nauticalmiles. For further description of the wind farm see SEAS DistributionA.m.b.A. (2000).
The observations of migrating birds at Rødsand were conducted froman observation tower placed 6 km south-west of Gedser Odde and 5km north-east of the wind farm area. From this position it was possi-ble to monitor bird migration by performing both visual and radarobservations. Visual observations of birds were undertaken along atransect south of the observation tower. Registration of bird flocks byradar was done within a circular area of 388 km2 around the observa-tion tower (see Fig. 2). In Fig. 2 and the following figures related toradar observations, are only turbines within the radar range depicted.
Study areaBuoy-transectRadar rangeObservation towerWind turbines
Figure 2. Location of theRødsand study area coveredby aerial surveys, theobservation tower on whichthe radar was mounted,radar range, wind farm areaand the Buoy-transect.

14
The study area for mapping of staging waterbirds using aerial sur-veys extended over an area of ca. 1,350 km2 including the plannedwind farm of ca. 23 km2 (see Fig. 2).
The total study area is referred to as the reference area, whereas thearea in which the turbines were erected subsequently will be calledthe wind farm area.
The Rødsand sandbars cover an area of between 0.1 and 6.3 km2, de-pending on the highly variable water level.
The eastern parts of the bay have shallow, sheltered waters with anumber of islets. The offshore parts range to water depths of ap-proximately 30 m.
2.2 Monitoring of migratory birds 2003
Observations of the bird migration intensity, species composition,flock size and migration routes were performed day and night during16 March - 15 April (four weeks) and 30 August - 31 October (eightweeks). These periods coincide with the main migration period of asubstantial number of the species of waterbirds and raptors. Twodays of effective observations were conducted each week from theobservation tower where two observers were present to ensuremaximum effectiveness, and for safety reasons.
During 2003, visual data were collected during the day based uponthe 6.9 km long transect (referred to as the Buoy-transect) placedbetween the observation tower and the buoy ’Schönheyders-Pulle’(see Fig. 2). A telescope (30x) was used, and data were recorded by15-minute periods.
To compile spatial data on bird migration at long distance and duringperiods of poor visibility due to fog or darkness a ship-radar (FurunoFR2125) was used. Each echo on the radar monitor corresponded to aflock of birds in the study area, and in this way the spatial migrationpattern could be described both during day and night. Sunset andsunrise defined the grouping of bird data into day and night. Thedistance from the observation tower to the periphery of the studyarea covered by the radar was 11 km. Data were provided as the lat-eral position of objects, their migration speed and course. Duringautumn, the westerly-orientated migration of waterbirds was fol-lowed in the area between Gedser Odde and the wind farm area, andthe southerly-orientated migration of terrestrial species was followedin the area between southeast Lolland and Gedser Odde (see Fig. 1).During spring, the easterly-orientated migration of waterbirds wasmonitored from the wind farm area to Gedser Odde. No significantmigration of terrestrial bird species occurred during spring.
The migration routes were mapped by tracing the course of birdflocks from the radar monitor on to a transparency. Only trackslonger than 5 km (arbitrary value) were included in the analysis,thereby excluding short tracks of local movements. When possible,species and flock size were recorded. Afterwards, the transparencieswere digitised and entered into a GIS-database.

15
Time of day, season and wind direction have previously been shownto have significant effects on the migration patterns in the study area(Kahlert et al. 2000, Desholm et al. 2001, Kahlert et al. 2002). In addi-tion, the response pattern of birds to operating wind turbines washypothesised to be affected by visibility. However, in this prelimi-nary assessment of effects caused by the Nysted wind farm, the ef-fects of restricted visibility were only analysed in comparisons be-tween daylight and darkness. Periods with fog or severe haze oc-curred at a very low frequency in the study area during the base-line(1999-2002) and 2003 was no exception to this pattern (Fig. 3). Forexample, less than 1% of the time visibility was less than 3 km duringautumn 2003. Periods of poor visibility occurred at a higher fre-quency during spring (visibility was lower than 3 km during 11% ofthe time). Nevertheless, it has proven extremely difficult to make lo-cal predictions on visibility and plan radar observation bouts to coin-cide with foggy weather conditions. For this reason, little bird datacould be compiled during periods of poor visibility in 2003. How-ever, it may still be possible to gather sufficient data by compilingdata over several years under the monitoring programme to makereliable assessments on this particular issue.
2.2.1 Lateral change in migration routesHypothesis: In previous studies, lateral avoidance has been consid-ered the most frequent bird response to established wind farms(Winkelman 1992). An alternative hypothesis would be that birds areattracted for example by illumination of wind turbines (for a reviewon the illumination topic, see Lensink et al. 1999), a phenomenon thatonly relates to nocturnal migrants. It is also possible that gulls andcormorants will use the static turbine superstructure as a resting plat-form during both day and night, resulting in relatively high numbersof radar tracks of birds moving towards and into the wind farm. Thepresent study of migration routes is, however, designed as to detectattraction effects also.
Based on the main hypothesis that migratory birds show a lateralavoidance response to the wind farm, the following predictions aremade:
1) A gradual and systematic deflection of the migration route willoccur with significant changes in the flight direction close to thewind farm after the turbines have been erected;
0
20
40
60
80
100
0 5 10 15 20 25
Visibility (km)
Cum
ulat
ive
perc
enta
ge
Autumn SpringFigure 3. Cumulativepercentage of observationsin relation to visibility (km)measured at Gedser.Observations were madeevery six hours during thespring period 15 March – 15April and the autumnperiod 25 August – 31October, 2003.

16
2) The change in flight direction will occur closer to the wind farm atnight and during periods of poor visibility than during daytimeand periods with good visual conditions;
3) In case of a severe avoidance response to the wind farm in autumn,it may be predicted that the proportion of eastward-migratingbirds (reversed migration) at the Buoy-transect south of the obser-vation tower would increase after the erection of turbines due to ahigher number of individuals returning either to gain altitude be-fore passing the wind farm or to find alternative migration routeslateral to the wind farm area.
Based on the alternative hypothesis that migratory birds show a lat-eral attraction response to the wind farm the following prediction ismade:
4) A gradual and systematic deflection towards the wind farm willoccur with significant changes in the flight directions close to thewind farm area after the turbines have been erected.
Methods: During autumn, westward-directed waterbird migrationtracks were traced by use of radar from just south of the observationtower and until they had passed the wind farm area to determine themigratory routes of waterbirds. Of 3,098 migration tracks recordedduring autumn 2003 (Fig. 4), 46 were extracted for the analysis oflateral change in migration routes. This was the result of removal ofall those tracks that did not pass the 15 transects placed in parallelwith and east of the most easterly row of turbines (Fig. 5a), and thosethat crossed the north and south lines depicted in Fig. 5a. This selec-tion of data ensured that the analysis focused on bird flocks ap-proaching and passing through the wind farm area at the easterlyrow of turbines, and the associated response distance of migratorybirds towards individual wind turbines. In total 486 tracks were in-cluded in the analysis for 2000, 2001, 2002 (base-line) and 2003 (op-eration of the wind farm).
Figure 4. Radar registrationsof 3,098 waterbird flocksmigrating at Rødsandduring autumn 2003. Flocksthat were not determinedvisually to species wereclassified as waterbirds onthe basis of their radarsignal and/or migrationspeed exceeding 50km/hour. All flockspresented were migrating ina westerly direction.
Radar rangeObservation towerWind turbines
Waterfowl tracks

17
In 2003, the positions of turbines as they appeared on the radarmonitor were used as a reference to the tracks of migratory birds. Thetransects used during the base-line study were also used in the pres-ent report and referred to the geographical coordinates of the tur-bines. This led to some minor discrepancy between the eastern gate ofthe wind farm and the most westerly transect, which may possiblyderive from distortion of the radar-image and from the digitalisationprocess of tracks and turbines.
For this reason five tracks appeared as if they passed south of thewind farm in Fig 5a, which may not necessarily be the case or if sothey passed very close to the most southeasterly turbine. Hence, theaim of the analysis to investigate the response patterns of birds toindividual turbines was not compromised.
A parallel analysis was carried out on the flocks (N = 288), whichhave passed the two easternmost transects 5 and 6 km east of thewind farm but definitely passed either north or south of the wind
G H I J K L M NF
ED
ABC
Observation towerWaterfowl tracks
Wind turbines
A
B
Figure 5. Tracks of autumnmigrating waterbird flocks,which were used in theanalyses of the orientationof migration routes at theobservation tower and theRødsand, wind farm area.The letters A - N indicate the14 sectors between thetransects. Flocks thatcrossed the eastern border ofthe wind farm (A) andflocks that passed north orsouth of the wind farm (B).

18
farm. This parallel analysis was carried out to investigate whetherthose flocks, that did not cross the wind farm area in 2003 (operationof wind farm), showed any change in flight pattern compared to2000, 2001 and 2002 (base-line) (Fig. 5B). In this analysis it was as-sessed that no response towards the wind farm occurred at a distance5-6 km from the wind farm.
In both analyses, the 15 transects were positioned 0, 50, 100, 200, 300,400, 500, 1,000, 1,500, 2,000, 2,500, 3,000, 4,000, 5,000 and 6,000 metresfrom the most easterly row of turbines, respectively, and had thesame orientation and length as this row. For each track 14 migrationcourses were calculated, one for each interval between two adjacenttransects, as the course between the intersections of the migrationtrack and the two adjacent transects. For each transect interval themean migration course of the tracks was calculated.
The unequal intervals between the transects were originally consid-ered to be a provisional solution, aiming in the first instance at de-tecting all the possible changes in migration routes and to estimatethe response distance to the wind farm, even if it is very short or verylong (e.g. A versus C in Fig. 6).
The mapping of migration routes gives the opportunity to test poten-tial changes in the mean orientation at different distances from thewind farm area, and to test whether a systematic change in migrationroute has occurred. For example, if most birds avoid the wind farmby making lateral adjustments to the north, the mean track orienta-tion will differ as a result of this lateral reorientation. If data from allsectors are normally distributed and show equal variance, the differ-ences in the mean course at a specific distance can be tested using at-test after establishment of the wind farm. However, if birds showlateral response differences in the distributions of migration courseswith respect to distance to the wind turbines, e.g. a deflection of indi-viduals both to the north and to the south of the wind turbines, thiscould result in a bimodal distribution close to the wind farm, but anunimodal distribution further away where the deflection has not yet
AB
C
Observation towerRadar range
Wind turbines
Figure 6. Schematicpresentation of possiblelateral avoidance responsesshown by flocks of autumnmigrating waterbirds to theNysted wind farm: A)deflection with a shortavoidance distance, B) nodeflection and C) deflectionwith a long avoidancedistance.

19
begun. In this case, one could expect no significant difference in meanorientation, but a significant increase in the standard deviation of themean.
Northerly and southerly winds can displace westward-migratingflocks to the south and north, respectively. Time of day (day andnight) may affect the spatial placement of migration routes, especiallyafter the wind turbines have been erected (cf. predictions from thehypothesis). The effects of wind direction, time of day, distance to thewind farm and year on the orientation of migration was tested usingrepeated measures ANOVA.
Reversed migration, which may be a relevant factor in the case of asevere response from the birds to the wind farm, was studied bydaytime telescope observations. These observations included re-cordings of species, number of birds and flock size, and were carriedout simultaneously with radar observations to derive species specificdata on the migration patterns through the study area. The observa-tions by telescope were undertaken along the first 6.9 km of the Buoy-transect (measured from the north; see Fig. 2), which covered theautumn migration approach routes of waterbirds. For each observa-tion it was noted whether the birds were flying towards the west orthe east, and hence, the proportion of the east migrating flocks couldbe computed on the species level.
‘Orientation of migration’ and ‘proportion of reverse migration’ areonly relevant for bird flocks approaching the area designated for thewind farm during autumn. The approach of bird flocks during springmigration could not be described, as the area to be covered was be-yond the maximum range (Fig. 7), which is appropriate to use fordetection of bird flocks with the present radar equipment.
2.2.2 Probability of passing the wind farm areaHypothesis: In relation to the main hypothesis, that migratory birdsshow a lateral avoidance response to the wind farm, it is further hy-pothesised that the probability of passing the wind farm area after
Radar rangeWaterfowl tracks
Observation towerWind turbines
Figure 7. Radar registrationsof 1,599 waterbird flocksmigrating at Rødsandduring spring 2003. Flocksthat were not determinedvisually to species wereclassified as waterbirds onthe basis of their radarsignal and/or migrationspeed exceeding 50km/hour. All flockspresented were migrating inan easterly direction.

20
erection of turbines will decrease. Following the methods of the base-line study, data were collected in 2003 for both autumn migratingbird flocks flying south of Rødsand towards the west and for springmigrating bird flocks south of Lolland flying in an easterly direction.
Methods used for autumn analysis: Of the 3,098 migration tracks re-corded during autumn 2003, 779 were extracted for analysis by ex-cluding those that were orientated in westerly direction and did notpass the line due south of the observation tower and the eastern tran-sect (the Buoy-transect; see Fig. 2), as these radar tracks represent thebird flocks which may show a lateral avoidance response to the windfarm.
Flocks (radar echoes) were followed to see whether they crossed theeastern edge of the wind farm area or not, and the proportion offlocks that actually did so was calculated. Thus, the grouping offlocks has been slightly changed. During the base-line study, propor-tions of flocks, which crossed the wind farm area at any place, werecalculated, i.e. birds that crossed the northern or southern edges ofthe wind farm area were also included. However, the northern andsouthern edges are parallel with the main orientation of bird migra-tion and particularly during the base-line flocks may have crossedthese edges by coincidence as a result of minor adjustments of theflight direction and inflicted data with some random variation. Inaddition, radar detection of flocks may in particular be reduced at thesouthern edge of the wind farm because the radar beam has to crossthe entire wind farm before it reaches the southern edge (shadoweffect). For this reason, it has been considered to be a more robustapproach to estimate the proportions of flocks crossing the easternedge, exclusively. It must be emphasised that estimates, which werecalculated during the base-line study, were only slightly changed(less than 3%) using the revised method. In order to describe the mi-gration pattern in detail, logistic regression models were used to de-scribe the probability of passing the wind farm area incorporating thefollowing four factors:
1) north-south placement of the track (latitudinal), measured as thedistance from the observation tower to the intersection betweenthe migration track and the Buoy-transect,
2) time of day (day and night),3) wind (northerly and southerly winds), and4) year (2000, 2001, 2002 and 2003).
Methods used for spring analysis: Of 1,599 migration tracks recordedduring spring 2003 (see Fig. 7), 1,055 were extracted for analysis byexcluding the observations that did not pass the transect due south ofLolland (Fig. 8).
The proportion of migration tracks that passed the eastern edge of thewind farm area in 2003 was calculated and compared with the situa-tion before the erection of the wind turbines. The effect of cross winds(classified into northerly and southerly wind directions) and time ofthe day (day and night) were analysed using a logit model, i.e. theresponse variable was binary (presence/absence at the eastern edge),

21
and the explanatory variables were all assigned to categories (Kris-tensen et al. 1986)
2.2.3 Migration intensity in the wind farm areaHypothesis: In relation to the main hypothesis, that migratory birdsshow a lateral avoidance response to the wind farm, it is further hy-pothesised that migration intensity in the wind farm will decreaseafter erection of the turbines. Assuming that it will be more difficultfor migrating birds to detect the wind farm at night than by day (de-pending on the attraction effect of turbine illuminations), it is pre-dicted that the decrease in migration intensity in the wind farm willbe most pronounced during the day.
Methods: Systematic counts of the number of bird flocks per 15-minute period were carried out using radar (see Kahlert et al. 2000).During autumn 2003, bird flocks that entered the wind farm areafrom the north or east were counted at the two transects simultane-ously (Fig. 9). One transect was positioned between the north-westand north-east corner of the wind farm (northern gate), the othertransect between the north-east and the south-east corner (easterngate). It has previously been concluded that migration tracks passingthe northern gate from the north were mainly terrestrial birds andpotentially geese migrating from the mainland areas. Tracks passingthe eastern gate from the east could mainly be ascribed to migratorywaterbirds, mainly eiders (Kahlert et al. 2000). Only flocks flying intothe wind farm area with the main heading of autumn migration (to-wards the west and south) were included in the analysis.
During spring 2003, the number of individuals passing per 15-minuteperiod was counted on the same transects as during autumn. Becausethe main heading of migration during spring is towards the east andnorth, only bird flocks that flew out of the wind farm area at the east-ern and northern gates were analysed.
Figure 8. The 1,055 tracks ofspring migrating waterbirdflocks at Rødsand, whichwere used in the analysis ofthe probability of passingthe wind farm area in 2003.
Transect
Observation towerWind turbines
Radar rangeWaterfowl tracks

22
As previous studies (Kahlert et al. 2000) have demonstrated that mi-gration intensity is influenced by several abiotic factors, it was de-cided to split the data set in relation to season and wind conditionsbased on those divisions, which had the highest explanatory powerfor changes in the migration intensity. The migration intensity datawere divided into two periods: spring (16 March - 15 April) andautumn (30 August – 31 October). In the present report, between-yearvariation of the average number of flocks per 15-minute period waspresented for each season, time of day and wind direction. Windconditions were divided into four categories also to include head-and tailwinds to the prevailing orientation of the migration: 1) north-easterly winds (1°-90°), 2) southeasterly winds (91°-180°), 3) south-westerly winds (181°-270°) and 4) northwesterly winds (271°-360°).
Also based on radar observations, the lengths of radar tracks (birdflocks) were calculated in squares of 0.1 km2. In 2003, lengths of tracksdivided by total number of tracks were compared in the eastern part ofthe wind farm area (Fig. 10) with the results obtained during the base-line study (2000-2002). By dividing the length of tracks with total num-ber of tracks in each year (onwards referred to as track density), thebetween year variance in observation effort was taken into account.The area of comparison (10.8 km2) was arbitrarily chosen. However, itwas set as criteria that the area should be of limited extent (to reduceeffects of the distance-related variation in detection rate) and that anappropriate reference area of the same size just outside the wind farmarea could be defined. Since the same tracks of waterbirds may occurboth in the reference area and in the eastern part of the wind farm arearepeated measures were included in the Analysis-of-Variance.
It must be recognised that the variation in migration intensity in thewind farm area may be influenced by the overall migration volume(data not available). Hence, conclusions should be drawn with cau-tion, in so far as a decrease in the overall volume of migration in asingle year should not affect the conclusions made for the local mi-gration patterns at Rødsand.
Figure 9. Location of thenorthern and eastern gatesat the Nysted wind farmused for estimating themigration intensity in thewind farm area.
Radar rangeEastern gateNorthern gate
Observation towerWind turbines

23
2.2.4 Species composition, numbers and flock sizeThe results obtained from the daytime telescope observations madepossible a species specific description of the abundance and phenol-ogy. The telescope observations thereby contributed importantly inthe assessment of potential impacts and their consequences at a spe-cies level. Information on species specific abundance and phenologycan also be used in the decisions about the design of the future birdprogramme in the years to come. The mean number of birds passingthe Buoy-transect per 15-minute period (migration intensity) duringfive periods are presented for: early September (1-15 September), lateSeptember (16-30 September), early October (1-15 October), late Oc-tober (16-31 October) and spring (16 March - 15 April). As the speciesspecific distributions of migration intensity and flock sizes differedmarkedly from normal distributions, log-transformation of data wasundertaken when calculating the mean migration intensity and the95% confidence limits. This approach is generally less sensitive toextreme observations of very large flocks, which may occur at a verylow frequency, compared to calculation of simple averages.
2.2.5 Migration speedMethods: Data on ground speed of migrating birds will not be in-cluded directly in any before-and-after study, and thus, no hypothe-sis on this subject is put forward. However, this parameter is a usefultool for species determination in radar investigations. No results fromthis part of the investigation are presented in this report (but see De-sholm et al. 2001, Kahlert et al. 2002 and Desholm et al. 2003).
2.3 Surveys of staging, moulting and winteringbirds
The presence (number and species composition) and distribution ofstaging and wintering birds in the study area (see Fig. 11) was re-corded by four aerial surveys during January – December 2003. Thedata were collected to detect possible impacts of the wind farm on
Figure 10. Location of theeastern wind farm area (red)and the reference area (blue)used for comparisons oftrack densities.
Radar rangeObservation towerWind turbines

24
birds during the construction phase and subsequently the operationalphase. The number of recorded birds during the four surveys wasused to describe distribution and relative numbers of the most nu-merously appearing bird species in the survey area.
The survey area was covered by 26 north-south orientated, paralleltransects separated by a distance of 2 km and a total length of 579 km.Transect endpoints were entered into the aircraft GPS as waypoints,used for navigation along the transect tracks.The surveys were con-ducted from a high winged, twin-engine Partenavia P-68 Observer,designed for general reconnaissance purposes with a flight altitude of76 m (250 feet) and a cruising speed of approximately 180 km/h (100knots).
At the time of the December survey in 2003 the wind turbines wereinstalled. With a survey altitude of 76 m, collision with the turbineshad to be avoided by slightly modifying the survey track lines. Thiswas done by creating way points along the original track lines ap-proximately 3 km north and south of the wind farm area, and fromthese positions adjust the track lines through the wind farm half waybetween turbine rows. Once through the wind farm area the trackline was adjusted back to the original track line. Thus, the track lineadjustment increased the length by only 89 m.
During the surveys, two observers covered one side of the aircrafteach. All observations were continuously recorded on a dictaphone,including information on species, number, transect band and time(see Kahlert et al. 2000). The majority of the observations were con-sidered accurate within four seconds, i.e. each observation was giventhe exact time ± 4 seconds, and consequently, the positional accuracyon the longitudinal axis was within 206 m (see Kahlert et al. 2000).
After completion of each survey, tables of observation data (species,number, time, transect band and side of aircraft) and flight track datawere created from the transcription. A combination of GIS tools andTurbo Pascal software was used to add a position to each record ofobservation data.
0.0 - 2.52.5 - 5.05.0 - 7.57.5 - 10.0
10.0 - 12.512.5 - 15.015.0 - 17.517.5 - 20.0
Study areaTrack linesWind turbines
20.0 - 22.522.5 - 25.025.0 - 27.527.5 - 30.030.0 - 32.532.5 - 35.035.0 - 37.5
37.5 - 40.040.0 - 42.542.5 - 45.0
Figure 11. The Rødsandstudy area for aerial surveyswith positions of the windturbines, and with the idealsurvey transect lines andbathymetric profile shown.

25
Distribution maps were produced for each of the relevant bird spe-cies showing the location and relative size of the observed bird flocks.
The comparative analysis to be conducted by the end of the before-and-after study is likely to be based on pooled data from the aerialsurveys. A total of 21 surveys conducted between August 1999 andAugust 2002 comprises the base-line phase. Three surveys from Janu-ary to April 2003 comprise the construction phase, while a survey inDecember 2003 comprised the first survey under the operationalphase of the wind farm.
The development of spatial modelling tools to generate estimates ofdensities and total numbers of birds in the survey area is in a finalstage (Fox et al. 2003). The data requirements for the survey data aredifferent from the present format, and the data from this study areahas not yet been through this process. Therefore survey data from2003 will be presented in the same general format as in the previousreports. In order to correct for the coverage of the study area, data arepresented as the number of individuals observed, by species, relativeto the covered transect length in a grid net of cells 2x2 km each.
Jacobs selectivity index (Jacobs 1974) was adopted to describe thewaterfowl (staging, moulting and wintering) preference for differentzones in or around the wind farm area compared to their preferencefor the whole study area. The waterfowl preference for the followingzones were computed: 1) the wind farm area, 2) the wind farm area +a 2 km zone around it, and 3) the wind farm area + a 4 km zonearound it. Previously a zone comprising the wind farm + a 275 mzone around it was included in this analysis. This zone was combinedwith the wind farm + 2 km zone in the present report.
The D-value which expresses Jacobs selectivity index varies within –1(no birds inside the wind farm area) and +1 (all birds inside the windfarm area), and was calculated as:
)2(
)(
rppr
prD
−+−=
(1),
where r = percentage of birds in the area of interest compared to thebirds in the whole study area, and p = the percentage of the transectlength in the area of interest compared to the total transect length inthe whole study area. The difference between the two percentageswas tested as the difference between the observed number of birds inthe wind farm area and the expected number in the area of interestrelative to the share of the length of transects in the wind farm area(one-sample χ2-test).
In January 2003 large parts of the study area was ice covered. Thisobviously caused a change in the distribution of most bird species inthe area. Therefore, data from this survey was omitted from compari-sons between base-line and construction phase. The two surveys per-formed during the construction phase in March and April were com-

26
pared to data from the base-line period. The construction zone in thewind farm area was defined for individual surveys, according to con-struction progress.
Based on the surveys in March and April 2003, a distance to nearestwind turbine or wind turbine foundation was calculated for each birdrecord to calculate frequency distributions of birds for each 500 mintervals. Frequency distributions were generated for 1999, 2000, 2001and 2002 (base-line) and 2003 (construction) and compared.
For further details on the methods of the aerial surveys, see Kahlert etal. (2000), Noer et al. (2000).
2.4 Weather data
Weather conditions were included in the documentation of effects ofthe wind farm on migration routes to increase confidence of the con-clusions. Energy E2 collected data on wind force (at 7.9 m a.s.l.) andwind direction (at 25 m a.s.l.) every 10 minutes at a weather stationpositioned (54°32.372 N, 11°44.554 E) in the wind farm area. Beforethe study period in 2003, the Danish Meteorological Institute ceasedto compile data on visibility at Gedser Odde. Hence, data on visibilitywere kindly provided by Gedser Havudkik. Data from the Meteoro-logical Institute and Gedser Havudkik were compatible, althoughdata were compiled less intensively in 2003 (every 6 hours). As dur-ing the base-line study, an observation of visibility was assigned tobird observations 1½ hour before and after the time of measurement.
2.5 Quality control
All observations were recorded either in a notebook, on transparen-cies (investigations of migrating birds) or on a dictaphone (investiga-tions of staging birds). Unusual data were underlined or commentedto make a later exclusion of erroneous data possible. After havingstored data in databases the original data were checked once again.Analysis of data was performed mainly by using the statistical pack-age (SAS 1999) and ArcView (GIS).
The following quality control procedures were imposed on this re-port:
• External review• Internal editorial and linguistic revision• Internal proof-reading• Layout followed by proofreading• Approval by project managers.

27
3 Results
3.1 Migratory birds
The total distribution of autumn migration tracks of all birds (Fig. 4)and waterbirds (Fig. 12) are presented here. Where migrating water-birds have been visually determined to species or species groups,these have been plotted separately (common eider Fig. 13, pin-tail/wigeon Fig. 14, ducks not determined to species Fig. 15 andgeese Fig. 16). The grid-based relative density of tracks (expressed asthe total sum of track metres within each grid cell) is shown in Fig.17. The high concentration of westbound tracks rounding GedserOdde and the general patterns observed in autumn 2003 closely re-sembled those observed during the base-line study. It is evident,however, that the density of tracks was lower in the wind farm areacompared to previous years (Fig. 17) – for further analysis, see section3.1.4.
In 2003, the eastbound spring migration (mainly waterbirds) in thestudy area complied with the patterns observed in 2001 and 2002(Kahlert et al. 2000), (Fig. 7, but see also Fig. 18 for eider migrationspecifically). The main route occurred north of the wind farm area,but in general massive eastward migration all took place within theentire radar range (Fig. 19). Density of tracks in the wind farm areatended to be lower than during the base-line study (Fig.19a-c) eventhough only the foundations had been established at the time of thespring bird observations. However, intense ship traffic occurred inthe wind farm area during this period.
In the following sections the patterns of flight trajectories from 2003are analysed in further detail.
3.1.1 Lateral change in migration routesIn this section, overall lateral responses of bird flocks as they ap-proached the wind farm were tested to determine the preliminaryresponse distance where avoidance occurs. Two parallel analyses offlight trajectories were carried out: 1) those passing the eastern gate ofthe wind farm, and 2) those passing north or south of the wind farm.
Firstly, for waterbirds migrating towards the wind farm in a westerlydirection (hereafter referred to as approach area) and passing theeastern gate, the mean orientation varied between 264.1 and 268.7degrees in 2003 (a range of 4.6 degrees difference - see Fig. 20). Thispattern was generally consistent with the results observed during thebase-line study in 2002 (e.g. Fig. 18 in Desholm et al. 2003), which wasmore southerly compared to observations in 2000 and 2001 (Desholmet al. 2001, Kahlert et al. 2002). An overall analysis (repeated meas-ures ANOVA including year and time of the day) showed a signifi-cant difference between four years of the investigation (Table 1). Bothfactors (year and day/night) and the interaction between the twoterms (Table 1) explained some of the variation in orientation.
Autumn migration ofwaterbirds

28
Radar rangeObservation towerWind turbines
Waterfowl tracks
Radar rangeObservation towerWind turbines
Eider tracks
Radar rangeObservation towerWind turbines
Pintail/wigeon tracks
Figure 12. Radarregistrations of 508waterbird flocks determinedvisually migrating atRødsand during autumn2003.
Figure 13. Radarregistrations of 84 flocks ofmigrating eiders determinedvisually at Rødsand duringautumn 2003.
Figure 14. Radarregistrations of 9 flocks ofmigrating pintail or wigeondetermined visually atRødsand during autumn2003.

29
In addition, a repeated measurement analysis on the orientation ofindividual bird flocks in relation to their distance to the wind farm inthe approach area showed that the year-effect differed across years,dependent on the distance to the wind farm (Table 2). Note that thewind effects found in earlier studies could not be incorporated intothis analysis, since during the course of 2003, there were only threeobservations available during the day with southerly wind condi-tions. Hence, in this particular year it was not possible to include bothtime of the day and wind in the analysis in order to elucidate theirpotential effects on migration routes caused by the wind farm. Thepreferred model included the parameter time of the day, as this factorwas more likely to affect the response of bird flocks towards the windfarm. In order to investigate specific effects of the operation of thewind farm, a comparison between the orientation of the flight trajec-tories in 2003 and the base-line years 2000-2002 was carried out.
Radar rangeObservation towerWind turbines
Duck sp. tracks
Radar rangeObservation towerWind turbines
Goose tracks
Figure 15. Radarregistrations of 143 flocks ofmigrating ducks determinedvisually (but not to species)at Rødsand during autumn2003.
Figure 16. Radarregistrations of 16 flocks ofmigrating geese determinedvisually (but not to species)at Rødsand during autumn2003.

30
Radar range
2-470471-13981399-24302431-35943595-51195120-68816882-90189019-1176311764-1490414905-20987
Relative density
Observation towerWind turbines
C D
BA
Figure 17. Spatial migration density of waterbird flocks migrating at Rødsand during autumn. The densityis indicated by the total length of tracks in metres within each grid cell. Maps are presented for 2000 (A),2001 (B), 2002 (C) and 2003 (D).
Radar rangeObservation towerWind turbines
Eider tracks
Figure 18. Radar registrations of flocks of migrating eiders determined visu-ally at Rødsand during spring 2003.

31
The observations showed that birds adjusted their orientation to lat-erally avoid the wind farm both to the north and to the south as theyapproached the wind farm, hence, comparisons of the means wasunlikely to be the most sensitive variable (Figs. 4 and 21A and 21B). Itwas apparent that although the distributions showed enhanced vari-ance between 1000 m and 500 m in front of the wind farm, the overallmean direction did not change.
Because of this, rather than compare means, standard deviation (s.d.)was considered as a more appropriate variable to test in order todemonstrate a significant change in direction of migration and thedistance at which it occurred.
Table 1. Repeated measures analysis of variance of the mean orientation ofwaterbird flocks approaching the wind farm and the effect of year, time(day/night) and the combined effect of the two factors (between term ef-fects, N = 478).
Factor DF F P
Year 3 7.43 <0.001
Time 1 9.13 0.003
Year*Time 3 3.32 0.020
1-876876-18001800-28022802-38563856-50035003-63776377-80778077-1056410564-1417414174-19666
Relative density
Observation towerWind turbines
2-553553-11171117-17151715-23432343-30363036-38323832-47284728-58695869-73727372-10326
Relative density
Observation towerWind turbines
0.3-972.4972.4-20592059-3220.43220.4-4462.84462.8-5745.75745.7-7102.17102.1-8562.48562.4-10255.110255.1-12801.512801.5-19062.3
Relative density
Observation towerWind turbines
A
C
B
Figure 19. Spatial migration density of waterbird flocks migrating at Rødsand during spring. The densityis indicated by the total length of tracks in metres within each grid cell. Maps are presented for 2001 (A),2002 (B) and 2003 (C).

32
Per
cent
age
180
200
220
240
260
280
300
320
340
180
200
220
240
260
280
300
320
340
180
200
220
240
260
280
300
320
340
Degrees
DegreesDegrees
0
10
20
30
40
50
60
0
10
20
30
40
50
0
10
20
30
40
50
0
10
20
30
40
50
0
10
20
30
40
50
C
F
I
L
A
D
G
J
M
B
E
H
K
N
100-200 m
400-500 m
1500-2000 m
3000-4000 m
0-50 m
200-300 m
500-1000 m
2000-2500 m
4000-5000 m
50-100 m
300-4000 m
1000-1500 m
2500-3000 m
5000-6000 m
Mean: 264.1˚SD: 32.7
Mean: 265.7˚SD: 33.8
Mean: 265.6˚SD: 25.6
Mean: 266.9˚SD: 15.9
Mean: 266.6˚SD: 10.7
Mean: 264.6˚SD: 35.2
Mean: 268.7˚SD: 29.6
Mean: 265.7˚SD: 17.5
Mean: 266.7˚SD: 14.0
Mean: 265.0˚SD: 10.0
Mean: 265.4˚SD: 33.4
Mean: 264.8˚SD: 30.4
Mean: 265.4˚SD: 16.0
Mean: 266.1˚SD: 11.4
Figure 20. Frequency distributions of the orientation of the autumn migrating waterbird flocks at Rødsandfor each of the 14 sectors A-N (see Fig. 5). Mean course and standard deviation for each sector are given inthe graphs.
33
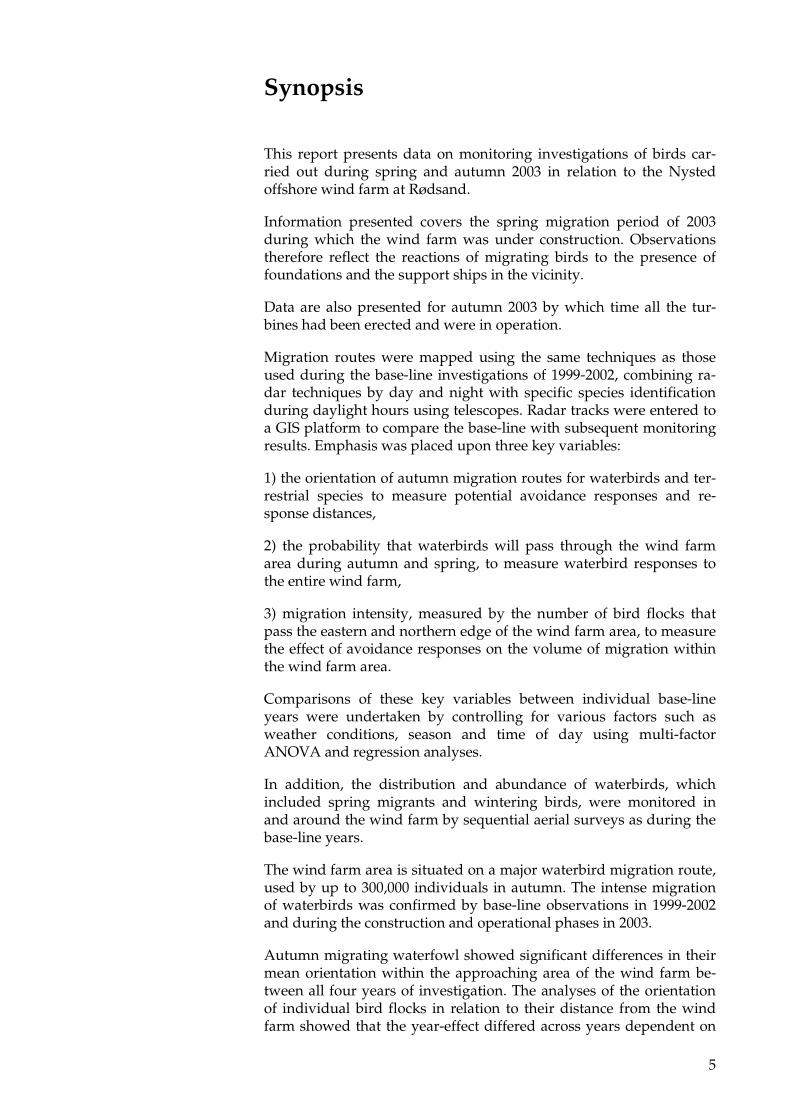
This variable was considered more sensitive to changes in migrationcourse when birds show simultaneous adjustment in both a northerlyand southerly direction. S.d. of the orientation changed dramaticallyacross the approach area in 2003 (Fig. 21C and 21D). At distancesbetween 4,000 m and 6,000 m there was no difference in s.d. between2003 data and those obtained during the base-line study by day or bynight, i.e. the 95% confidence limits of the base-line s.d. overlappedwith the s.d. in 2003. However, daytime observations showed morethan twice the s.d. at distances closer than 3000 m to the wind farm in2003 than during the base-line (well above 95%-confidence limits),and in particular at distances closer than 1,000 m s.d. was markedlyhigher during operation of the wind farm compared to the resultsobtained during the base-line study.
Table 2. Repeated measures analysis of variance of the mean orientation ofwaterbird flocks approaching the wind farm at various distances and theeffect year, time (day/night) and the combined effect of the three factors(within term effects, N = 478).
Factor DF F P
Distance 13 1.55 0.090
Distance*year 39 1.70 0.004
Distance*time 13 1.71 0.053
Distance*year*time 39 1.21 0.170
Sta
ndar
d de
viat
ion
of o
rient
atio
n(d
egre
es)
A (Daytime)
C (Daytime)
B (Nighttime)
D (Nighttime)
Mea
n of
orie
ntat
ion
(deg
rees
)
Distance from wind farm (m) Distance from wind farm (m)
2000 2001 2002 2003 95% conf. limit
Mea
n of
orie
ntat
ion
(deg
rees
)
0 1000 2000 3000 4000 5000 6000 7000
245
250
255
260
265
270
275
280
285
290
245
250
255
260
265
270
275
280
285
290
0
5
10
15
20
25
30
35
0
5
10
15
20
25
30
35
0 1000 2000 3000 4000 5000 6000 7000S
tand
ard
devi
atio
n of
orie
ntat
ion
(deg
rees
)
Figure 21. Orientation of tracks of autumn migrating waterbird flocks, which crossed the eastern edge ofthe wind farm at Rødsand during 2000-2003. Annual mean values with upper and lower 95% confidencelimits for the base-line period 2000-2002 are presented for each distance class out from the eastern gateduring daytime(A) and nighttime (B). Annual standard deviation values with upper and lower 95% confi-dence limits for the base-line period 2000-2002 are presented for each distance class out from the easterngate during daytime (C) and nighttime (D).

34
This suggests that bird flocks changed their orientation as they ap-proached the wind farm at such distances, and this may represent thefirst observed response of migrating waterbirds at the Nysted windfarm. During the night, the response distance over which a significantincrease in s.d. occurred was at 1,000 m (Fig. 21D). This suggestedthat birds came markedly closer to the wind farm at night before theyadjusted their course.
It is therefore concluded that mean values of bird flock orientation asthey approach a wind farm may not be an adequate measure of aresponse per se or the response distance. The results from 2003 atNysted Wind Farm show that it is extremely important to considerchanges in the variance as well as the mean direction taken by mi-grating birds at different distances from the wind farm.
The second analysis included those bird flocks that passed eithernorth or south of the wind farm. Mean orientation during daytimevaried little between the years 2000, 2001 and 2003 (Fig. 22A) – notethat only eight tracks were available in 2002, and for this reason day-time observations were omitted from this year and no confidencelimits for the base-line study was calculated. During nighttime, birdswere orientated further to the southwest (225°) compared to the base-line study (Fig. 22B).
Sta
ndar
d de
viat
ion
of o
rient
atio
n(d
egre
es)
A (Daytime)
C (Daytime)
B (Nighttime)
D (Nighttime)
Mea
n of
orie
ntat
ion
(deg
rees
)
Distance from wind farm (m) Distance from wind farm (m)
2000 2001 2002 2003 95% conf. limit
Mea
n of
orie
ntat
ion
(deg
rees
)
0 1000 2000 3000 4000 5000 6000 7000 0 1000 2000 3000 4000 5000 6000 7000S
tand
ard
devi
atio
n of
orie
ntat
ion
(deg
rees
)
0
50
100
150
200
250
300
350
240
245
250
255
260
265
270
0
5
10
15
20
0
5
10
15
20
25
30
35
Figure 22. Orientation of tracks of autumn migrating waterbird flocks which passed north or south of thewind farm in autumn at Rødsand during 2000-2003. Annual mean values with upper and lower 95% con-fidence limits for the base-line period 2000-2002 are presented for each distance class out from the easterngate during daytime(A) and nighttime (B). Annual standard deviation values with upper and lower 95%confidence limits for the base-line period 2000-2002 are presented for each distance class out from theeastern gate during daytime (C) and nighttime (D).

35
S.d. of orientation, which was suggested to be a measure of responsedistance, tended to be higher during daytime at distances closer than1,000 m to the wind farm compared to s.d. further east of the windfarm (Fig. 22C). However, this pattern was not as marked as for thebirds, which crossed the eastern gate (see Fig. 21C). During night-time, s.d. converged to values which in 2003 was approx. twice thebase-line results (2000-2002) at distances closer than 1,000 m to thewind farm (Fig. 22D). This suggested that birds adjusted their courseto a larger extent within this distance to the wind farm during opera-tion of the wind farm than they did before the wind farm waserected.
Hence, the results from the data set, only including those birds,which had a course towards the wind farm at a distance of 5-6 km,but passed either north or south of the wind farm tended to supportthe results obtained from the birds which passed the eastern gate ofthe wind farm. Thus, at a distance of 3,000 m but most markedly at1,000 m birds adjusted their flight course likely to be a response to-wards the wind farm.
Autumn migration orientated towards the northern gate of the windfarm was assumed mainly to represent terrestrial bird species such aspasserines and raptors. So far, data collection of radar tracks fromterrestrial birds has proven difficult. In 2003, only 20 radar tracks cor-responded with the definition established for terrestrial bird tracks.Only in one year during the base-line (2001) were sufficient numbersof tracks (130) compiled to carry out further analysis. The small sizeof most terrestrial birds, especially passerines, is likely the main rea-son why terrestrial birds are difficult to detect on the radar. Estab-lishing an observation platform closer to the northern gate of thewind farm could enhance detectability. Although this was consideredduring the base-line, there were several other factors that constrainedthe position of the observation platform to its present one. It wastherefore decided to focus upon waterbirds and their approach at theeastern gate of the wind farm, because this particular group of birdswas considered to be most sensitive to the extra mortality, which thewind turbines may impose on bird populations. There was also anumber of practical and logistical reasons for using the present posi-tion of the observation platform. Evidently, terrestrial birds may becited as a major issue in future offshore wind farms. In such cases, thedistance between the proposed wind farm and the main observationarea is an important key factor to be considered in the design of abird programme.
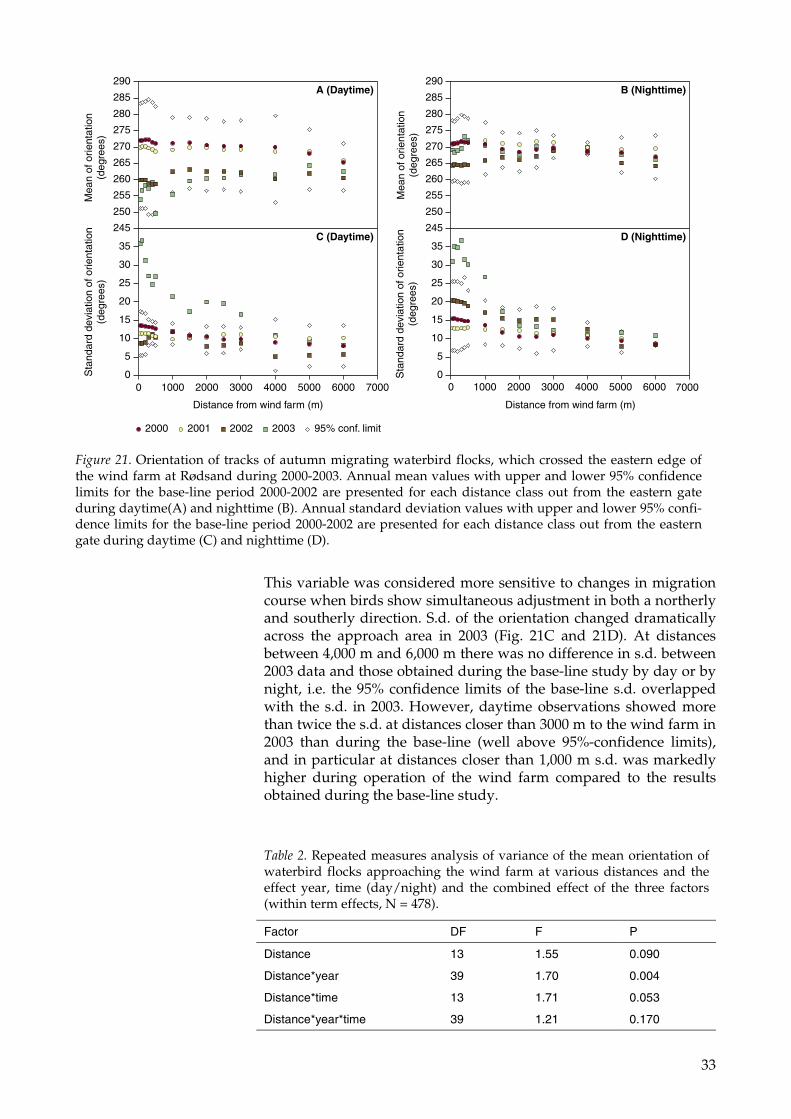
As a result of the low number of tracks the flight trajectories can onlybe reviewed in a descriptive manner and conclusions should only beconsidered as tentative and preliminary (Fig. 23). The few availablesouthbound tracks at the northern gate of the wind farm showed thatbird flocks assumed to be terrestrial birds were able to discern thewind turbines and pass through in the corridors between the north-south orientated rows of turbines. The suggestion that birds are ca-pable of detecting the turbines at some distance and adjust their mi-gration route accordingly is supported by at least some of the tracks,which showed fine-grained adjustments as they approached the windfarm. However, it cannot be excluded that some of the straight south-
Autumn migration ofterrestrial birds
36
bound tracks were actually flocks which migrated at high altitudeabove the upper tips of the turbine blades (> 110 m) and could there-fore take the optimal straight course without any adjustments.
3.1.2 Probability of passing the wind farm areaIn order to describe the probability of bird flocks passing the windfarm area in further detail, logistic regression models for differentyears (2000-2003), wind situations (northerly and southerly) and byday and night were computed incorporating distance to the observa-tion tower when passing the Buoy-transect. The last measure corre-sponded to the spatial distribution of the westerly-orientated migra-tion route taken by waterbirds along a north-south longitudinal axisas they approached the wind farm area.
All factors incorporated into the model could significantly explain thevariation in the probability that bird flocks would pass the easterngate except for time of the day (day/night) (Table 3). However, timeof the day would be allowed entry in the model at P = 0.07, i.e. veryclose to the applied significance level (P = 0.05)
The year effect indicated that the probability that bird flocks wouldpass the eastern gate differed between years (Table 3). Overall, theprobabilities were in 2000: 48.1%, 2001: 35.2% and 2002: 23.9% and2003: 8.9%). This means that after the wind turbines were erected in2003, a flock of birds that approached the wind farm was significantlyless likely to pass the eastern gate compared to base-line years (i.e. inthe absence of turbines). Note that estimates were slightly changeddue to use of a revised method (see section 2.2.2). Radar observationsof flocks approaching from the east in the vicinity of the eastern gatealso showed flight patterns, which suggested that avoidance of thewind farm occurred (Fig. 24).
Radar rangeObservation towerWind turbines
Tracks of terrestrial birds
Figure 23. Radarregistrations of 20 flocks ofmigrating terrestrial birds atRødsand during autumn2003.
Autumn migration ofwaterbirds

37
The distance effect confirmed the results from previous years thatbirds (Table 3), which migrated at the same latitude as the wind farm,would have a higher probability of passing the eastern gate thanbirds approaching at a latitude north and south of the wind farm(Desholm et al. 2001, Kahlert et al. 2002, Desholm et al. 2003).
The wind effect was consistent with that of previous years, i.e. mi-gration routes were positioned further to the north during periodswith winds from the south compared to situations with northerlywinds (Table 3). During northerly winds, 6.8% of tracks were de-tected in the northernmost sector of the buoy-transect (distance totower 0-3 km) compared to 16.2% during southerly winds (averagesduring the period 2000-2003). The further to the north (equivalent to ashorter distance to the tower) the lower the probability of crossing theeastern edge of the wind farm (Desholm et al. 2001, Kahlert et al.2002, and Figs. 25C and 25D this report).
Table 3. Significance of Maximum Likelihood Estimates of parameters in astepwise logistic regression model, predicting the probability that birdflocks pass the wind farm area as a function of year (2000-2003), the dis-tance in metres to the observation tower, wind direction (northerly/southerly), and first order interactions between the factors. Only signifi-cant factors are presented entry and stay in model at P = 0.05. ModelGoodness-of-Fit Tests were carried out according to Hosmer &Lemeshow (SAS 1999). N = 2,179).
Factor DF χ2 P
Year 3 301.36 < 0.001
Distance 1 558.57 < 0.001
Wind 1 9.09 0.003
Distance*Year 3 18.71 <0.001
Distance*Wind 1 80.59 < 0.001
Year*Wind 3 8.70 0.034
Goodness-of-Fit 8 56.91 < 0.0001
Radar rangeObservation towerWind turbines
Waterfowl tracks
Eastern gateBuoy-transect
Figure 24. Radar tracks ofmigrating waterbirds atRødsand during autumn2003. For a track havingcrossed the buoy-transect,there was a probability of8.9% of passing the easterngate of the wind farm.

38
Given the predominant westbound migration the two cross windscenarios evidently affected the probability that bird flocks wouldpass through at the eastern gate of the wind farm. In addition, thecrosswind effect varied between years (i.e. the significant combinedyear and wind effect in Table 3).
The effect of distance also differed between years (combined year anddistance effect in Table 3). Finally, the magnitude of the distance ef-fect was dependent on wind direction (combined year and wind ef-fect in Table 3).
On the basis of the flight trajectories compiled during 2000-2003, itcan be concluded that the main migration route of waterbirds ap-peared to be relatively constrained, showing a main heading to thewest. However, when the course of the flight trajectories was investi-gated on a more fine-grained scale, i.e. compared to the position ofthe wind farm area, the nature of flight corridors turned out to bequite complex and influenced by several factors.
For this reason, more detailed analysis has been carried out, in par-ticular to determine whether any general avoidance response oc-curred during autumn 2003 after the erection of the wind turbines.This analysis showed that the probability that bird flocks would passthe eastern gate in 2003 was reduced considerably compared to thebase-line years (2000-2002). This result was obtained under all com-binations of cross wind regimes and time of the day when controllingfor their latitudinal position as the bird flocks approached the windfarm (distance to tower) (see Figs. 25A-E).
With one exception, the differences in probabilities between 2003 andthe base-line years were significant (Tables 4 and 5). The insignificantresult was obtained in the comparison between 2001 and 2003, duringdaytime at southerly winds at distance intervals between 0 and 4,000m (Tables 4 and 5). This comparison held the lowest sample size of allcomparisons (N = 42), and this may explain why a marked graphicaldifference (see Fig. 25c) failed to attain statistical significance. In ad-dition, most first-order interactions (comparisons of slopes) were sig-nificant in the model, indicating that the rate of change in probabilityover distances was markedly different in 2003. Graphically, the mostnotable examples can be found in Fig. 25d.
Model fit to observations was poor during southerly winds at night(Table 5, Fig. 25e), suggesting that other factors may have influencedthe probability of flocks passing the eastern edge of the wind farm.
It can therefore be concluded that bird flocks avoided the wind farmconsistently irrespective of the time of the day and during variouscrosswinds. In summary, less than 4-7% of the tracks passed the east-ern edge during daytime in 2003, compared to 11-24% at night, de-pendent on the wind (Fig. 26).

39
00.10.20.30.40.50.60.70.80.91.0
00.10.20.30.40.50.60.70.80.91.0
00.10.20.30.40.50.60.70.80.91.0
Pro
babi
lity
of p
assi
ng w
ind
park
2000200120022003
0 2000 4000 6000 8000 1000012000
Distance to tower (m)
Northerly winds during daytime Northerly winds during nighttime
Southerly winds during daytime, < 4000 m Southerly winds during daytime, > 3000 m
Southerly winds during nighttime
0 2000 4000 6000 8000 1000012000
Distance to tower (m)
A B
C
E
D
Figure 25. Probability thatbird flocks flying in awesterly direction atRødsand will pass theeastern edge of the windfarm area as a logisticfunction of their position ona transect south of theobservation tower. Logisticfunctions are presentedunder five sets ofconditions: A) northerlywind during the day (N =862), B) northerly wind atnight (N = 631), C) southerlywind during the day (< 4000m from the tower; N = 140),D) southerly wind duringthe day (> 3000 m from thetower; N = 241) and E)southerly wind during thenight (N = 365). Observationpoints appeared by dividingdata sets in distancecategories of equal size (3, 5or 10 categories). Anobserved probability and amean distance wascalculated for each category.
Figure 26. Probability ofwaterbirds passing throughthe Nysted wind farm in theautumns of 2000, 2001 and2002 (base-line) and 2003(operation) in relation today/night and windconditions (northerly orsoutherly). Nd: no availabledata. 0
10
20
30
40
50
60
70
Daytime northerlywind
Daytime southerlywind
Nighttimenortherly wind
Nighttimesoutherly wind
Pro
babi
lity
of p
assi
ng th
e w
ind
farm
(%)
2000 2001 2002 2003
Nd

40
Table 4. Significance of Maximum Likelihood Estimates of parameters in logistic regression models com-paring the probability that bird flocks pass the wind farm area in autumn 2003 (operation) with 2000, 2001and 2002 (base-line) as a function of the distance in metres to the observation tower at northerly winddirections and during daytime and nighttime. Goodness-of-Fit Tests were carried out according to Hos-mer & Lemeshow (SAS 1999).
Winddirection
Distance interval(m) Period Factor χ2
P
North 0-11,000 Day Intercept
Year 2000
Year 2001
Year 2002
Distance
Distance*Year 2000
Distance*Year 2001
Distance*Year 2002
0.64
47.49
15.76
4.70
14.77
19.91
6.50
1.65
0.42
< 0.0001
< 0.0001
0.03
0.0001
< 0.0001
0.01
0.20
Goodness-of-Fit 6.76 0.56
0-11,000 Night Intercept
Year 2000
Year 2001
Year 2002
Distance
Distance*Year 2000
Distance*Year 2001
Distance*Year 2002
3.74
12.31
12.51
6.85
38.34
4.22
6.29
2.17
0.05
0.0005
0.0004
0.0089
< 0.0001
0.04
0.01
0.14
Goodness-of-Fit 17.27 0.03

41
During the construction phase in spring 2003, the overall percentage ofwaterbird tracks passing the eastern edge of the wind farm area was11%, i.e. after flocks may have passed through the entire wind farm,due to the prevailing orientation during spring. This was a lower per-centage compared to the base-line study (16% in 2001, and 25% in2002). The percentage of bird flocks, which passed the eastern edge ofthe wind farm, may also be dependent on wind direction (north-erly/southerly) and time of the day (day/night) (e.g. Desholm et al.2003). An analysis including these factors showed that year, time of theday and wind direction all had a significant effect on the relative num-ber of flocks that passed the eastern edge of the wind farm area (Table6). In addition, the magnitude of the year-effect was dependent on timeof the day and wind direction (combined effects in Table 6). For thisreason comparisons across years were performed separately duringspecific wind directions and during day and night (Figs. 27A-D).
Table 5. Significance of Maximum Likelihood Estimates of parameters in logistic regression models com-paring the probability that bird flocks pass the wind farm area in autumn 2003 (operation) with 2000, 2001and 2002 (base-line) as a function of the distance in metres to the observation tower at southerly winddirections and during daytime and nighttime. Note that during daytime a segmented model provided thebest fit of data due to an avoidance response both north and south of the wind farm. Note also that in2002, the number of tracks registered during daytime and southerly winds was too small for any meaning-ful analysis. Goodness-of-Fit Tests were carried out according to Hosmer & Lemeshow (SAS 1999).
Winddirection
Distance interval(m) Period Factor χ2
P
South 0-4,000 Day Intercept
Year 2000
Year 2001
Distance
Distance*Year 2000
Distance*Year 2001
0.02
7.60
0.71
0.53
11.35
3.43
0.89
0.006
0.40
0.47
0.0008
0.06
Goodness-of-Fit 6.13 0.63
3,000-11,000 Day Intercept
Year 2000
Year 2001
Distance
Distance*Year 2000
Distance*Year 2001
1.61
8.71
8.37
0.14
5.85
6.08
0.20
0.003
0.004
0.71
0.02
0.01
Goodness-of-Fit 3.25 0.92
0-11,000 Night Intercept
Year 2000
Year 2001
Year 2002
Distance
Distance*Year 2000
Distance*Year 2001
Distance*Year 2002
0.01
8.87
15.07
5.66
3.41
1.83
9.72
3.86
0.92
0.003
0.0001
0.0174
0.06
0.18
0.0018
0.049
Goodness-of-Fit 36.85 < 0.0001
Spring migration ofwaterbirds

42
During daytime, the majority (more than 60%) of the bird flockspassed on the transect north of the wind farm and less than 18%passed the transect at the eastern edge. During daytime, there was nosupport for the hypothesis that birds avoided the wind farm area inthe construction phase (spring 2003). In northerly winds, the percent-age passing the eastern edge was within the range measured duringthe base-line study (Fig. 27A). During southerly winds, the propor-tion passing the eastern edge was lowest in 2003 (7.9%) compared to2001 (9.7%) and 2002 (17.1%). However, the difference to 2001 wasminor and not significant (χ2 = 0.75, DF = 1, P = 0.39).
During night, the main migration route was also north of the windfarm area (see Figs. 27C and 27D), although this route was less fre-quently used compared to during daytime. More flocks passed theeastern edge of the wind farm during the night (10-39% compared to< 18% during the day). However, there were some indicatives that
A B
C D
Daytime, northerly winds
0
20
40
60
80
100200120022003
Daytime, southerly winds
Nighttime, northerly winds
0
20
40
60
80
100P
roba
bilit
y of
pas
sing
the
east
ern
gate
(%
)
Nighttime, southerly winds
North of wind farm
Wind farm South of wind farm
North of wind farm
Wind farm South of wind farm
Figure 27. Probability ofwaterbirds passing theeastern wind farm gate inthe springs of 2001 and 2002(base-line) and 2003(construction) at Rødsand.Data are presented for A)daytime, northerly winds, B)daytime, southerly winds,C) night, northerly windsand D) night, southerlywinds.
Table 6. Maximum Likelihood Analysis of Variance of effects from winddirection (Wind), time of the day (Time), year (2001, 2002 and 2003) andthe combined (*) effects of the three factors on the presence of tracks atthe eastern gate of the wind farm area during spring 2001, 2002 (base-line)and 2003 (operation) (N = 2,744 tracks).
Factor χ2 (df = 1) P
Wind 3.96 0.05
Time 77.34 < 0.0001
Year 53.77 < 0.0001
Year*Time 11.33 0.0035
Year*Wind 6.76 0.03
Wind*Time 2.00 0.15

43
birds avoided the wind farm area at night during the constructionphase. The percentage passing the eastern edge was consistentlysmaller (9-24%) during spring 2003 compared to the base-line study.The reduction in relative number of flocks passing the eastern edgewas highly significant (χ2 -tests, P < 0.00001), except in the compari-son between 2001 and 2003 at northerly winds (χ2 = 2.39, DF = 1, P =0.12). The lower proportion of tracks at the eastern border of the windfarm mainly resulted in a higher proportion of tracks north of thewind farm area. This area already constituted the main migrationroute prior to construction activities.
It may be hypothesised that the observed changes in migration routesduring night may result from changes in species composition, i.e.different species may have different migration routes. Unfortunately,species determination was impossible during night. However,ground speed of migratory birds can be used to indicate whether adramatic change in species composition had occurred during night-time migration in 2003. As a reference, the verified ground speeds ofdifferent species were used from observations made during daytime,when species could be determined. In addition, head- and tailwindwas taken into consideration. For eiders average ground speed was55 km/h (range: 50-78, N = 43) during headwind and 71 km/h(range: 54-122, N = 132) during tailwind. Average ground speed dif-fered during head- and tailwind whereas the lower end of the rangesconverged to a similar value.
This information was used to give a crude estimate of the proportionof eider and similar species (waterbirds), which occurred at night in2001, 2002 and 2003. On this basis, the data set was divided in flockswith ground speeds above and below 50 km/h. It was previouslyshown that birds likely to be terrestrial birds generally had groundspeeds below 50 km/h (Desholm et al. 2003).
Analysis showed that the proportion of flocks with a ground speedgreater than 50 km/h amounted to 88% during the constructionphase in 2003 compared to 94% in 2001 and 73% in 2002. The differ-ence across years did not differ significantly (χ2 = 3.56, DF = 2, P =0.17). Although the analysis should be considered with caution, itmay be taken to indicate that the composition of species groups oc-curring in the wind farm area did not change markedly in spring2003.
3.1.3 Reverse migrationIn autumn, eider and geese occurred in such large numbers that itwas possible to study the extent of potential reverse migration (i.e. inan eastbound direction), if a severe barrier effect of the wind farmoccurred. The test investigated whether a higher percentage of east-ern orientated migration was observed at the Buoy-transect, (whichruns north-south and lies 5.29 km east of the northeastern most tur-bine and 5.15 km east of the southereastern most turbine). Hence,only long distance reverse migration (i.e. not just those birds turningback from the immediate vicinity of the eastern gate) is dealt with inthis analysis.
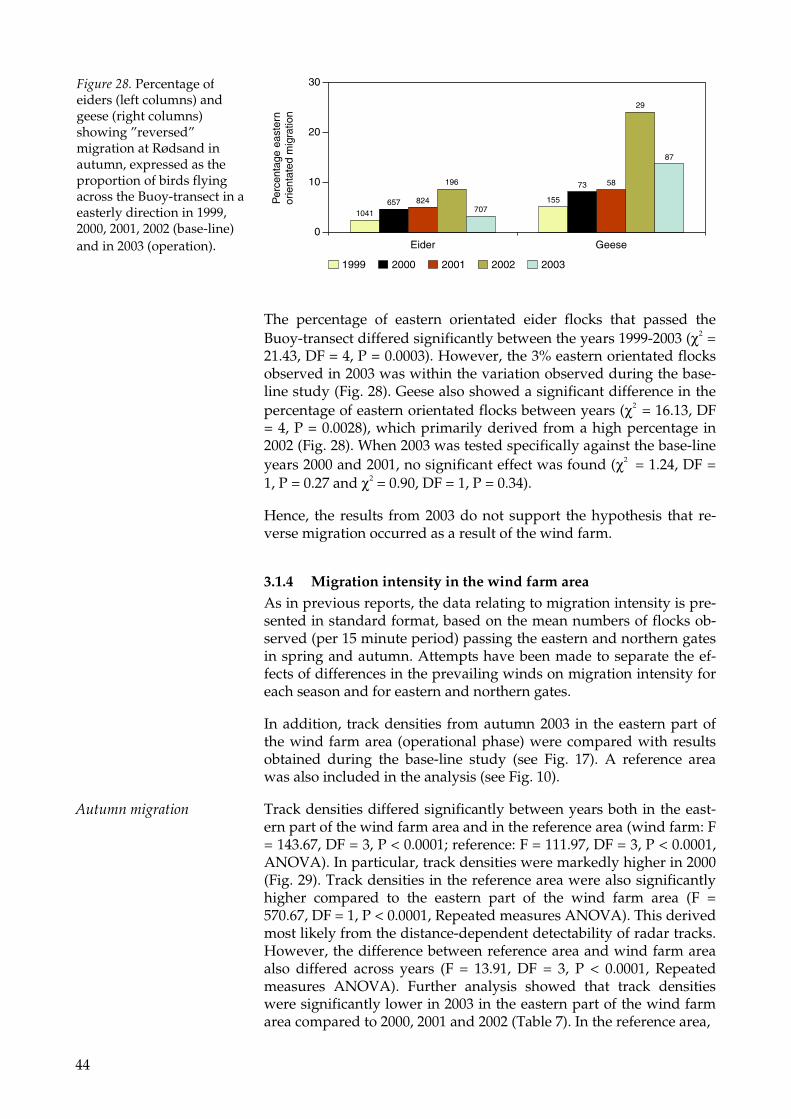
44
The percentage of eastern orientated eider flocks that passed theBuoy-transect differed significantly between the years 1999-2003 (χ2 =21.43, DF = 4, P = 0.0003). However, the 3% eastern orientated flocksobserved in 2003 was within the variation observed during the base-line study (Fig. 28). Geese also showed a significant difference in thepercentage of eastern orientated flocks between years (χ2 = 16.13, DF= 4, P = 0.0028), which primarily derived from a high percentage in2002 (Fig. 28). When 2003 was tested specifically against the base-lineyears 2000 and 2001, no significant effect was found (χ2 = 1.24, DF =1, P = 0.27 and χ2 = 0.90, DF = 1, P = 0.34).
Hence, the results from 2003 do not support the hypothesis that re-verse migration occurred as a result of the wind farm.
3.1.4 Migration intensity in the wind farm areaAs in previous reports, the data relating to migration intensity is pre-sented in standard format, based on the mean numbers of flocks ob-served (per 15 minute period) passing the eastern and northern gatesin spring and autumn. Attempts have been made to separate the ef-fects of differences in the prevailing winds on migration intensity foreach season and for eastern and northern gates.
In addition, track densities from autumn 2003 in the eastern part ofthe wind farm area (operational phase) were compared with resultsobtained during the base-line study (see Fig. 17). A reference areawas also included in the analysis (see Fig. 10).
Track densities differed significantly between years both in the east-ern part of the wind farm area and in the reference area (wind farm: F= 143.67, DF = 3, P < 0.0001; reference: F = 111.97, DF = 3, P < 0.0001,ANOVA). In particular, track densities were markedly higher in 2000(Fig. 29). Track densities in the reference area were also significantlyhigher compared to the eastern part of the wind farm area (F =570.67, DF = 1, P < 0.0001, Repeated measures ANOVA). This derivedmost likely from the distance-dependent detectability of radar tracks.However, the difference between reference area and wind farm areaalso differed across years (F = 13.91, DF = 3, P < 0.0001, Repeatedmeasures ANOVA). Further analysis showed that track densitieswere significantly lower in 2003 in the eastern part of the wind farmarea compared to 2000, 2001 and 2002 (Table 7). In the reference area,
1999 2000 2001 2002 2003
0
10
20
30
Eider Geese
Per
cent
age
east
ern
orie
ntat
ed m
igra
tion
1041657 824
196
707155
73 58
29
87
Figure 28. Percentage ofeiders (left columns) andgeese (right columns)showing ”reversed”migration at Rødsand inautumn, expressed as theproportion of birds flyingacross the Buoy-transect in aeasterly direction in 1999,2000, 2001, 2002 (base-line)and in 2003 (operation).
Autumn migration

45
track densities only differed between 2003 and 2000. Interpretation oftrack densities should be drawn with caution because they may beaffected by several factors such as overall migration volume, trackdetectability and flight altitude. Nevertheless, the results support theprediction that birds undertake avoidance responses as suggestedfrom other data (see sections 3.1.1 and 3.1.2).
The intensity of migration at the eastern gate was similar to that wit-nessed in 2001 and 2002, showing highest intensities during thenortheasterly winds which prevailed in 2000 (Fig. 30A). This effectwas not apparent by night, although again, patterns in 2003 fellwithin the variation observed in the base-line years (Fig. 30B). North-easterly and southeasterly winds apparently affected daytime migra-tion in 1999-2001 (Fig. 30C), but less so by night (Fig 30D). The inten-sity of migration in 2003 fell within the range of variation of the over-all base-line years.
The intensity of migration by daytime in 2003 at the eastern andnorthern gates was generally less than that witnessed in 2000, 2001and 2002 (Fig. 30E, 30F and 30G), There were no obvious difference innighttime migration intensity between the base-line years and 2003,which was less affected by wind direction than during the day (Figs.30G and 30H).
Trac
k de
nsity
(m p
er g
rid/to
tal n
o. o
f tra
cks)
0
2
4
6
8
10
12
14
1999 2000 2001 2002 2003 2004
Eastern wind farm area Reference area
Figure 29. Mean trackdensities (±95% confidenceintervals) from 108 gridsquares in the eastern partof the wind farm area andan adjacent reference area in2000, 2001, 2002 and 2003.
Spring migration
Table 7. Statistical comparisons of track densities in the eastern part of thewind farm area and an adjacent reference area (t-test with Satterthwaite’sapproximation due to unequal variances.)
Area Comparison t DF P
Wind farm 2003 v. 2000 16.04 113 < 0.0001
2003 v. 2001 9.15 149 < 0.0001
2003 v. 2000 7.39 135 < 0.0001
Reference 2003 v. 2000 12.23 113 < 0.0001
2003 v. 2001 0.53 155 0.5969
2003 v. 2000 0.19 136 0.8459

46
3.1.5 Species composition, numbers and flock sizeOverall the west bound autumn migration observed during daytimewas predominantly comprised of eiders (45%), but cormorants werealso observed in substantial numbers (31%), as they undertook theirdaily foraging bouts (Fig. 31A). The eastbound spring migration wasdominated by eider (86%) to an even greater extent than in autumn(Fig. 31B).
Cormorant Phalacrocorax carboA total of 13,520 cormorants was registered during autumn 2003.Cormorants observed during the visual migration studies were local
A B
C D
E F
G H
Ave
rage
num
ber
of fl
ocks
(pe
r 15
-min
ute
perio
d)
Autumn, eastern gate, daytime
0
1
2
3
4
5
6
7NWNESWSE
Autumn, eastern gate, nighttime
Autumn, northern gate, daytime
0
1
2
3
4
5
6
7
0
1
2
3
4
5
0
1
2
3
4
5
Autumn, northern gate, nighttime
1999 2000 2001 2002 20031999 2000 2001 2002 2003
Spring, eastern gate, daytime Spring, eastern gate, nighttime
Spring, northern gate, daytime Spring, northern gate, nighttime
Figure 30. Average numberof flocks per 15-minuteperiod crossing the eastern(A, B, E, F) and northern (C,D, G, H) gate in situationswith different winddirections at Rødsand. Thegraphs are depicted forautumn (A, B, C, D) andspring (E, F, G, H), and byday (A, C, E, G) and night(B, D, F, H).

47
birds, roosting at Rødsand during non-foraging periods (Kahlert et al.2000). Movements between the roost and the foraging areas in theBaltic Sea showed a relative consistent intensity in September andearly October, with between 2.2 and 2.3 individuals per 15 minuteperiod passing the Buoy-transect in a westerly direction. In late Octo-ber, the mean passage fell to only 0.37 individuals, consistent with thedeparture of the majority of birds to wintering areas in the Mediter-ranean region. Previous results have shown that more than 90% ofthe flocks comprised less than 10 individuals each (Desholm et al.2003), explaining the relatively small mean flock size of 1.71 indi-viduals (Appendices I and II). Mean flock size never exceeded 2.1individuals during the base-line study. On some occasions largeflocks of more than 1,000 individuals were observed during theleaving and returning from the communal roost at Rødsand in 2003.The maximum number recorded was 4,390 individuals. Social forag-ing events were monitored by radar (Fig. 32). During autumn, therewas no evidence that cormorants have changed their habit, using thecommunal roost at Rødsand. Anecdotal information from staff asso-ciated with construction and maintenance of the wind turbines con-firmed that new permanent roosts have not been established in the
Autumn – migration west Spring – migration east
Eider EiderCormorant
Duck sp.
Duck sp.Geese
Passerines Others Others
Figure 31. Relative speciescomposition of all visualobservations of birdspassing west in autumn2003 and passing east inspring 2003 at Rødsand.
Radar rangeObservation towerWind turbines
Social foraging eventsof cormorants
OperationBase-line
Figure 32. Social foragingevents of cormorantsregistered by radar from theobservation tower in 2000,2001, 2002 (base-line) and2003 (operation).

48
wind farm area, neither on the foundations nor on the transformerstation (information Energi E2). On one occasion in 2003, social for-aging of 3,700 individuals was observed by radar in the southeasternpart of the wind farm (Fig. 32). On two other occasions in 2003 socialforaging (2,150 and 1,500 individuals) occurred close to the windfarm area (within approx. 1 km). Foraging cormorants were also ob-served by staff working in the wind farm area.
A total of 123 cormorants and a mean migration intensity of 0.32 in-dividuals per 15-minute period during spring 2003 confirmed resultsderived from previous years (Appendix III; Kahlert et al. 2000, De-sholm et al. 2001, Kahlert at al. 2002). Migration intensity of cormo-rants was again higher in autumn than in spring. The mean overallflock size of 1.15 individuals in spring 2003 showed that the majorityof the cormorants were observed as solitary migrants (Appendix IV).During spring, anecdotal information suggested that flocks of cormo-rants roosted on the foundations before turbines were erected (infor-mation Energi E2). The general impression from construction work-ers was that cormorants did not use foundations as turbines wereerected, although there was one observation of a cormorant sitting onthe fence of a foundation with an operating turbine.
Geese AnseriniThe total number of geese registered during autumn 2003 was 1,521individuals (see Appendix I). The majority of geese could not beidentified to species, however, four species were identified: greylaggoose Anser anser, barnacle goose Branta bernicla, white-fronted gooseAnser albifrons and brent goose. Goose migration peaked in early Oc-tober, showing a mean migration intensity of 2.90 individuals per 15minute period. In previous years goose migration either peaked lateSeptember or early October. The mean flock size was 7.74 (see Ap-pendix II). Compared to other species, only eiders migrated in largerflocks than geese. During the entire study period 1999-2003, meanflock size of geese varied between 7 and 11 individuals (Fig. 33).
During the period 16 March - 15 April, migration was markedlylower than during autumn (15 flocks in 2003). The spring migrationof dark-bellied brent goose in late May was not monitored in 2003.
Dabbling ducks Anas sp.The total number of dabbling ducks registered during autumn 2003was 878 (see Appendix I), close to the average of the base-line study(837 individuals). As in previous years, wigeon Anas penelope was the
0
5
10
15
20
1998 1999 2000 2001 2002 2003 2004
Flo
ck s
ize
Geese Dabbling ducks
Figure 33. Mean flock size(±95% confidence intervals)of all visual observations ofgeese (solid symbols) anddabbling ducks (opensymbols) in the autumns of1999-2002 (base-line) andautumn 2003 (operation) atRødsand.

49
most numerously occurring dabbling duck species (61%). The meanflock size was 7.51 individuals in 2003. Except for 1999, mean flocksize of dabbling ducks varied between 5 and 10 (Fig. 33). The migra-tion peaked with a mean of 0.89 individuals per 15-minute period inearly October which was later than during the base-line study (SeeAppendix I). Spring migration of dabbling ducks was negligible in2003 (12 individuals), as was the case in previous years.
Eider Somateria mollissimaDuring autumn 2003, a total of 19,208 eiders was observed (see Ap-pendix I). This was the lowest number recorded during the entirestudy except for 2002 when the observations were suspended duringthe main migration period of eider. In 2003, migration peaked inearly October with a mean of 218 individuals per 15 minute period.This was the most intense migration activity recorded during thestudy. By contrast, during other periods in September and Octobermigration intensity was markedly lower, i.e. less than 3 eiders per 15minute period. In 3 out of 5 autumns eider migration peaked between1 and 15 October. The eider had the largest flock size with a mean of14.64 individuals in 2003 (see Appendix II). This was slightly lowerthan during the period 1999-2001 but about double the flock size of2002 when the main migration period was not covered (Fig. 34).
During spring 2003, a total of 9,848 eiders was counted, the dominantspecies in spring (see Appendix III). The number of eiders duringspring migration varied considerably throughout the study (range:5,750-26,569). However, the mean number of spring migrating eidersper 15-minute period has been quite consistent in the springs of 2000,2001, 2002 and 2003 (13.58, 13.40, 13.96 and 13.58 individuals, respec-tively). The mean flock size was 5.28 individuals (see Appendix IV).Flock size varied between approximately 4 and 8 during the studyand was only about one third of the flock sizes observed duringautumn (Fig. 34).
Other diving ducksDuring autumn 2003, a total of 337 diving ducks of other species thanthe eider was registered (see Appendix I), of these 299 (88%) werered-breasted merganser Mergus serrator. It was previously assessedthat many of the red-breasted mergansers observed at Rødsand arelocal birds staging in the area, because a large proportion were ori-entated against the prevailing direction of migration (Kahlert et al.2000) and 2003 was no exception to this pattern.
0
5
10
15
25
20
1998 1999 2000 2001 2002 2003 2004
Flo
ck s
ize
Eider, autumn Eider, spring
Figure 34. Mean flock size(±95% confidence intervals)of all visual observations ofeider in springs (solidsymbols) and autumns(open symbols) of 1999-2002(base-line) and spring 2003(construction) and autumn2003 (operation) at Rødsand.

50
The mean flock size of other diving ducks was 2.12 (see Appendix II),which confirms previous results that other diving ducks migrate inconsiderably smaller flock sizes than the eider (Kahlert et al. 2000,Desholm et al. 2001, Kahlert et al. 2002). Migration intensity of otherdiving ducks peaked in early October with a mean of 0.67 individualsper 15-minute period as was the case with the other duck species (seeAppendix I).
During spring 2003, a total of 223 diving ducks other than eider wasobserved. Red-breasted merganser constituted the vast majority(76%). Markedly fewer long-tailed ducks were observed duringspring 2003 (44 individuals) compared to the base-line study whennumbers varied between 185 and 644. A mean flock size of 1.61 and1.67 individuals for red-breasted merganser and long-tailed duckcomplied with previous results (Appendix IV). The mean number ofmigrating individuals per 15-minute period was 0.46 and 0.10 for thetwo species (see Appendix III), and it was generally lower than in theprevious years of the study.
Gulls LaridaeDuring autumn 2003, a total of 449 gulls was registered (see Appen-dix I), which was close to the number observed in 2000 and 2001,when 369 and 494 were observed. In 1999, 843 gulls were observed.However, the most intensive gull migration occurred in November(Kahlert et al. 2000), a period that was not covered in 2003. In total 7species were identified: little gull Larus minutus, black-headed gullLarus ridibundus, lesser black-backed gull Larus fuscus, greater black-backed gull Larus marinus, common gull Larus canus, herring gullLarus argentatus and mediterranean gull Larus melanocephalus. Herringgull was the most abundant occurring species.
During autumn 2003, the mean flock size of gulls was 1.19 individu-als (see Appendix II), which was comparable to those of the autumnsof 1999 (1.27), 2000 (1.15), 2001 (1.16) and 2002 (1.10) and confirmsthat gulls in many cases occur as solitary individuals. Movements ofgulls at the Buoy transect was most intense in early October with amean of 1.63 individuals per 15 minute period. However, as duringthe base-line study, no clear trend in terms of phenology was de-tected, probably because most of the gulls were local birds staging inthe area for longer periods (Desholm et al. 2002).
During spring 2003, a total of 249 gulls were counted (see AppendixIII), of which 90% could not be identified to species. The mean num-ber of migrating gulls per 15-minute period was 0.65 individuals,which was the lowest number during the entire study. The meanflock size of 1.02 individuals (see Appendix IV) indicated that themajority of the gulls were observed as solitary also during spring.
Sandwich tern Sterna sandvicensisDuring autumn 2003, a total number of 663 sandwich terns was reg-istered (see Appendix I). This was the highest number registeredduring an autumn observation bout and almost twice as many as in2001, when the second highest number was recorded (356 individu-als). The mean flock size of 1.35 individuals (see Appendix II) wascomparable to the results in the previous years. Migration intensity

51
peaked early September with a mean of 2.10 individuals per 15-minute period (see Appendix I), which makes sandwich tern the mostcommonly occurring species in early September. The vast majority ofsandwich terns have left Danish waters by the end of September. Inearly October, a mean of 0.04 individuals occurred per 15 minute ob-servation period and in late October sandwich tern was not observedin the study area.
During spring 2003, a total of 95 sandwich terns was observed (seeAppendix III). This was the lowest number recorded during springobservations 2000 (304 individuals), 2001 (223) and 2002 (112). Themean migration intensity was 0.23 individuals per 15-minute periodin 2003. The mean flock size of 1.20 (see Appendix IV) was within the95% confidence limits of the mean flock size in 2001 and 2002(Kahlert et al. 2002, Desholm et al. 2003). In 2000 mean flock size wasslightly higher (1.30 individuals).
Passerines PasseriformesDuring autumn 2003, the total number of passerines recorded was1,177 individuals (see Appendix I). During the base-line study, num-bers fluctuated between 180 and 7,164 individuals. The lowest num-ber was observed in 2002 when the bird programme was temporarysuspended (Desholm et al. 2003). The highest number was recordedin 2001 when an intense migration of swallows Hirundinae was ob-served in September. No particular species occurred in outstandingnumbers in autumn 2003. Numbers peaked in late September with amean of 2.85 individuals per 15 minute period (Appendix I). Themean flock size was 2.44 individuals (see Appendix II). Flock size ofpasserines migrating westwards varied between 1.84 and 3.02 duringthe base-line study, suggesting that the area around the tower onRødsand is of minor importance compared to the Gedser Odde area,where for example several thousand finches Fringillidae are observeddaily during peak migration (e.g. Nielsen 2000).
Other speciesThe category ‘other species’ covers wood pigeons Columba palumbusand species that were observed in numbers <100 individuals on theobservation transect. Species such as grebes Podicipediae and diversGaviidae (which were described in the EIA report by Kahlert et al.2000) are not dealt with in this report. No species or groups of spe-cies, which have not been described above, occurred in numbers ex-ceeding 100 individuals during spring or autumn 2003 and thereforewill not be analysed further in this report.
3.2 Staging, moulting and wintering birds
This section describes the presence and distribution of the most nu-merously occurring species in the study area. The data originate fromaerial surveys, primarily the four conducted during 2003, but com-bined with data from 21 previous surveys from the period August1999 – August 2002. Details on each of the 25 surveys are given inTable 8.

52
Table 8. Summary details of the 25 aerial surveys carried out in the study area, August 1999-December 2003.Table shows the dates when the surveys were carried out, the transect widths used on different aerial surveydates, and the total distance of transect surveyed (including counts from both sides of the aircraft).
SurveyNumber
DATE Band A Band B Band C Km TransectCovered
1 19990829 44-250 m >250 m 1005
2 19991115 44-163 m 163-432 m 432-1,000 m 1093
3 19991213 44-163 m 163-432 m 432-1,000 m 1027
4 20000114 44-163 m 163-432 m 432-1,000 m 1175
5 20000214 44-163 m 163-432 m 432-1,000 m 597
6 20000404 44-163 m 163-432 m 432-1,000 m 1165
7 20000426 44-163 m 163-432 m 432-1,000 m 1164
8 20000911 44-163 m 163-432 m 432-1,000 m 1102
9 20001007 44-163 m 163-432 m 432-1,000 m 1078
10 20001127 44-163 m 163-432 m 432-1,000 m 1081
11 20010110 44-163 m 163-432 m 432-1,000 m 1035
12 20010210 44-163 m 163-432 m 432-1,000 m 1169
13 20010316 44-163 m 163-432 m 432-1,000 m 1165
14 20010420 44-163 m 163-432 m 432-1,000 m 1138
15 20010815 44-163 m 163-432 m 432-1,000 m 1164
16 20010928 44-163 m 163-432 m 432-1,000 m 569
17 20011114 44-163 m 163-432 m 432-1,000 m 1168
18 20020103 44-163 m 163-432 m 432-1,000 m 1162
19 20020213 44-163 m 163-432 m 432-1,000 m 1163
20 20020326 44-163 m 163-432 m 432-1,000 m 1145
21 20020822 44-163 m 163-432 m 432-1,000 m 1163
22 20030110 44-163 m 163-432 m 432-1,000 m 919
23 20030304 44-163 m 163-432 m 432-1,000 m 1160
24 20030424 44-163 m 163-432 m 432-1,000 m 1164
25 20031209 44-163 m 163-432 m 432-1,000 m 1150

53
3.2.1 Survey coverageThe spatial coverage of the four aerial surveys in 2003 was almost fullfor March, April and December surveys (Fig. 35 B, C, D), while thetwo westernmost and the four easternmost transects of the January2003 survey were abandoned due to poor light conditions (Fig. 35 A).Ice cover extended unusually south of the Rødsand sandbars duringthe January 2003 survey, influencing the distribution and abundanceof a number of bird species (Fig. 35 A). The overall survey coveragein the study area, based on all 25 surveys, was highest in the centralparts, including the wind farm area (Fig. 35 E).
A B
C D
E A) Ice coverage B+C) Wind turbines
Windfarm area
E) Survey coverage (km) A-E) Survey tracks
Ice-coveredHeavy drift iceDrift iceNo ice
FoundationNothing visibleErosion prot
WindfarmWindfarm + 2 kmWindfarm + 4 km
3-2929-5959-8686-9696-103
Single sideBoth sidesWindturbinesSandbar
0 10 20 km
N
Figure 35. Survey track lines for the four surveys conducted in 2003 on 10 January with ice cover (A), 4March (B), 24 April (C) and 9 December (D) and the overall survey coverage for all 25 surveys, expressedas kilometer of covered transect by 2 x 2 km grids (E). The extent of the corresponding 2 and 4 km zonesaround erected turbines is shown in B and C. Wind farm construction progress for each survey is illus-trated by differentiated wind turbine icons (A, B, C, D and E).

54
3.2.2 Species account
Red- and black-throated diver Gavia stellata/arcticaA total of 43 divers were recorded in 2003, most of which (20) wereseen in December 2003 (Table 9). In 2003, the distribution gravity wassouth and east of the wind farm area, with few observations northand west of the site (Fig. 36). This distribution pattern differed fromthe general distribution pattern found when pooling data from sur-veys performed between August 1999 and August 2002, where theareas northeast and east of the wind farm had higher densities (Fig.37). No divers were recorded closer than 1,400 m from a wind turbinein 2003.
In 2003, 33% of the observed divers were identified to species. Of the43 birds recorded 28% were red-throated diver, while 5% were black-throated diver.
123
4 - 6
Observations0 10 km
Study areaSandbarWind turbines
0.012 - 0.0170.017 - 0.0290.029 - 0.0710.071 - 0.1750.175 - 0.307
Wind turbines
Relative density(no./transect km)
0 10 km
Figure 36. Distribution ofdiver sp. in the study areaduring four aerial surveysconducted in 2003.
Figure 37. Cumulativedistribution map of diverobservations in the studyarea, based on 21 aerialsurveys between August1999 and August 2002. Dataare expressed as relativedensities measured asobservations per kilometreof flown transect coveragefor each survey in each 2 x 2km grid square.

55
Table 9. Number of birds recorded at the four aerial surveys carried out in2003.
Species Total 10 Jan.2003
4 March2003
24 April2003
9 Dec.2003
Diver sp. 43 7 9 7 20
Red-necked grebe 24 0 6 2 16
Crested grebe 2 0 1 1 0
Grebe sp. 2 1 0 0 1
Cormorant 101 1 11 62 27
Mute swan 2882 842 911 455 674
Greylag goose 136 0 69 62 5
Brent goose 154 0 0 141 13
Canada goose 40 24 0 0 16
Shelduck 55 0 29 26 0
Mallard 2371 1019 97 32 1223
Teal 73 0 0 18 55
Wigeon 64 0 0 64 0
Shoveler 4 0 0 4 0
Pochard 120 0 120 0 0
Tufted duck 12205 12025 80 100 0
Scaup 10 0 0 0 10
Golden-eye 1285 198 94 5 988
Long-tailed duck 2797 798 1423 371 205
Eider 3142 191 447 2126 378
Common scoter 128 16 46 23 43
Velvet scoter 24 18 5 0 1
Red-breasted merganser 1061 105 278 142 536
White-tailed eagle 1 0 1 0 0
Coot 1290 1200 90 0 0
Herring gull 1737 589 564 260 324
Great black-backed gull 148 89 38 5 16
Little gull 41 9 0 32 0
Auk/guillemot 2 1 0 0 1

56
Cormorant Phalacrocorax carboA total of 101 cormorants was recorded during the four surveys in2003, which was considerably less than in previous years (Table 9 andAppendix V). This was mainly due to the fact that no surveys wereperformed in autumn, when cormorant occurred in large numbers inthe study area.
The majority of cormorants was observed close to the sandbars be-tween Gedser and Hyllekrog, or in shallow waters north of this area.Birds were recorded in scattered flocks in open sea, south of thesandbars (Fig. 38). The general distribution pattern observed in 2003was similar to that based on data from surveys performed betweenAugust 1999 and August 2002 (Fig. 39, Desholm et al. 2003).
123 - 45 - 12
13 - 17
Observations0 10 km
Study areaSandbarWind turbines
0.012 - 1.7231.723 - 5.0175.017 - 13.563
13.763 - 25.47425.474 - 51.032Wind turbines
Relative density(no./transect km)
0 10 km
Figure 38. Distribution ofcormorant in the study areaduring four aerial surveysconducted in 2003.
Figure 39. Cumulativedistribution map ofcormorant observations inthe study area, based on 21aerial surveys betweenAugust 1999 and August2002. Data are expressed asrelative densities measuredas observations perkilometre of flown transectcoverage for each survey ineach 2 x 2 km grid square.

57
Mute Swan Cygnus olorA total of 2,882 mute swans was recorded during the four surveys,which was considerably lower than during previous years (Table 9and Appendix V). The main reason for this is the lack of autumn sur-veys in 2003, when mute swans were occurring numerously in thesurvey area. In addition, the January ice conditions in the area wasbelieved to have influenced the number of birds recorded.
In 2003, the majority of mute swans were observed north of the sand-bars between Gedser and Hyllekrog, but with more observationssouth of this line than during the surveys of the previous years (Fig.40). Most of these southern occurring observations were made inJanuary 2003, when the preferred habitat for mute swans was cov-ered with ice. This led to higher numbers of mute swan around theRødsand islet in that month than previously observed. Apart fromthis change the distribution of mute swan in 2003 resembled the dis-tribution pattern based on surveys performed between August 1999and August 2002 (Fig. 41, Desholm et al. 2003).
1 - 89 - 22
23 - 4546 - 9091 - 150
Observations0 10 km
Study areaSandbarWind turbines
0.012 - 4.5784.578 - 14.527
14.527 - 27.24727.247 - 48.09848.098 - 81.763
Wind turbines
Relative density(no./transect km)
0 10 km
Figure 40. Distribution ofmute swan in the study areaduring four aerial surveysconducted in 2003.
Figure 41. Cumulativedistribution map of muteswan observations in thestudy area, based on 21aerial surveys betweenAugust 1999 and August2002. Data are expressed asrelative densities measuredas observations perkilometre of flown transectcoverage for each survey ineach 2 x 2 km grid square.

58
Mallard Anas platyrhynchosA total of 2,371 mallards was recorded during the four surveys in2003 (Table 9 and Appendix V), which is similar to the numbers ob-served in the previous years, except for 2000, when more than 5,000mallards were recorded (Desholm et al. 2001).
The distribution pattern of mallard for 2003 was similar to that ob-served in previous years. Most birds were recorded along the Rød-sand sandbars in the western parts of the lagoon north of Rødsand(Figs. 42 and 43).
1 - 1213 - 4041 - 120
120 - 200201 - 500
Observations0 10 km
Study areaSandbarWind turbines
0.012 - 0.6690.669 - 2.3252.325 - 6.1676.167 - 12.557
12.557 - 38.536Wind turbines
Relative density(no./transect km)
0 10 km
Figure 42. Distribution ofmallard in the study areaduring four aerial surveysconducted in 2003.
Figure 43. Cumulativedistribution map of mallardobservations in the studyarea, based on 21 aerialsurveys between August1999 and August 2002. Dataare expressed as relativedensities measured asobservations per kilometreof flown transect coveragefor each survey in each 2 x 2km grid square.

59
Goldeneye Bucephala clangulaA total of 1,285 goldeneyes were recorded during the four surveys in2003, and occurred most numerously in December, when 988 birdswere encountered (Table 9). In previous years, January and Februaryhave had most goldeneyes. In 2003, comparatively few goldeneyeswere recorded in January, probably caused by the ice conditions inthe area.
The distribution in 2003 resembled the distribution of previous years(Fig. 44), though with some observations in the open sea south of theRødsand sandbars. The general distribution pattern based on surveysmade between August 1999 and August 2002 was similar to the re-sults of the 2003 surveys, when most birds were present in the shal-low parts of the lagoon north of the sandbars (Fig. 45).
1 - 78 - 15
16 - 3536 - 8586 - 140
Observations0 10 km
Study areaSandbarWind turbines
0.012 - 0.2470.247 - 0.7490.749 - 1.9571.957 - 4.7884.788 - 13.705
Wind turbines
Relative density(no./transect km)
0 10 km
Figure 44. Distribution ofgoldeneye in the study areaduring four aerial surveysconducted in 2003.
Figure 45. Cumulativedistribution map ofgoldeneye observations inthe study area, based on 21aerial surveys betweenAugust 1999 and August2002. Data are expressed asrelative densities measuredas observations perkilometre of flown transectcoverage for each survey ineach 2 x 2 km grid square.

60
A B
C D
Ice coverage Survey tracks ObservationsIce-coveredHeavy drift iceDrift iceNo ice
Single sideBoth sidesWindturbinesSandbar
1 - 34 - 15
16 - 3031 - 6061 - 180 0 10 20 km
N
Figure 46. Distribution of Long-tailed Duck in the study area for each of four aerial surveys conducted in2003, 10 January (A), 4 March (B), 24 April (C) and 9 December (D).

61
Long-tailed duck Clangula hyemalisA total of 2,797 long-tailed ducks were recorded during the four sur-veys conducted in 2003, most in January and March (Table 9). Thiscomplied with the observations in previous years, when the vastmajority of long-tailed ducks was recorded during the period fromJanuary to April (Appendix V).
The distribution pattern in 2003 resembled the pattern observed inprevious years, when the majority of birds were recorded at GedserRev during late winter and early spring (Fig. 46 A, B, C and D). An-other concentration was found along the coast south of the Rødsandsandbars between Gedser and Hyllekrog, and extended through thewind farm area. Particularly in January and March, many birds wererecorded in this part of the study area, while in April and Decemberfew long-tailed ducks were seen here. The January distribution waslikely to have been influenced by the ice conditions. The general dis-tribution pattern based on data from surveys performed betweenAugust 1999 and August 2002 showed highest concentrations werefound at Gedser Rev and in a band, which extended west towardsHyllekrog, similar to the distribution found in 2003 (Fig. 47).
0.012 - 0.4520.452 - 1.2211.221 - 3.4973.497 - 7.3227.322 - 11.271
Wind turbines
Relative density(no./transect km)
0 10 kmFigure 47. Cumulativedistribution map of long-tailed duck observations inthe study area, based on 21aerial surveys betweenAugust 1999 and August2002. Data are expressed asrelative densities measuredas observations perkilometre of flown transectcoverage for each survey ineach 2 x 2 km grid square.

62
Eider Somateria mollissimaA total of 3,142 eiders were recorded during the four surveys in 2003,showing a maximum of 2,126 birds in April (Table 9). During previ-ous years most eiders have been recorded from January to April.However, high numbers were also recorded in November 1999 (Ap-pendix V).
In 2003, eiders were concentrated west and east of the wind farm areaas well as at Gedser Rev (Fig. 48). Few eiders were recorded in thewind farm area. This followed the pattern observed in previous yearsof survey. Thus, the general distribution pattern based on data fromsurveys performed between August 1999 and August 2002 was simi-lar to the distribution found in 2003 (Fig. 49).
1 - 67 - 18
19 - 3536 - 8081 - 200
Observations0 10 km
Study areaSandbarWind turbines
0.012 - 0.9140.914 - 2.7682.768 - 5.8145.814 - 22.595
22.595 - 47.665Wind turbines
Relative density(no./transect km)
0 10 km
Figure 48. Distribution ofeider in the study areaduring four aerial surveysconducted in 2003.
Figure 49. Cumulativedistribution map of eiderobservations in the studyarea, based on 21 aerialsurveys between August1999 and August 2002. Dataare expressed as relativedensities measured asobservations per kilometreof flown transect coveragefor each survey in each 2 x 2km grid square.

63
Common scoter Melanitta nigraA total of 128 common scoters were recorded in the study area in2003 (Table 9). This is the lowest number recorded in one surveyyear, apart from 1999, when 67 individuals were observed. In theprevious years most common scoters were registered in late winterand spring (Appendix V).
In 2003 most common scoters were observed north and east of thewind farm and at Gedser Rev (Fig. 50). A flock of 12 birds were seenflying between the wind turbines during the December survey. Thegeneral distribution pattern based on surveys performed betweenAugust 1999 and August 2002 was similar to the distribution foundin 2003 (Fig. 51, Desholm et al. 2003).
1 - 23 - 45 - 78 - 9
10 - 15
Observations0 10 km
Study areaSandbarWind turbines
0.012 - 0.2500.250 - 0.6400.640 - 1.3241.324 - 2.3562.356 - 10.680
Wind turbines
Relative density(no./transect km)
0 10 km
Figure 50. Distribution ofcommon scoter in the studyarea during four aerialsurveys conducted in 2003.
Figure 51. Cumulativedistribution map of commonscoter observations in thestudy area, based on 21aerial surveys betweenAugust 1999 and August2002. Data are expressed asrelative densities measuredas observations perkilometre of flown transectcoverage for each survey ineach 2 x 2 km grid square.

64
Red-breasted merganser Mergus serratorA total of 1,061 red-breasted mergansers was recorded in 2003, ofwhich most (536 individuals) were recorded in December (Table 9).The number of red-breasted mergansers recorded in the study areafrom 1999 up to the present time varied considerably (Appendix V).The highest number recorded was 1,685 in November 1999.
In 2003, most red-breasted mergansers were recorded in the shallowwaters of the lagoon, with few birds recorded south of the Rødsandsandbars and particularly in the area south of the peninsula of Hyl-lekrog (Fig. 52). The general distribution pattern based on surveysperformed between August 1999 and August 2002 was similar to thefindings of 2003. However, more birds were recorded in the north-eastern areas of the lagoon, north of Hyllekrog (Fig. 53).
1 - 23 - 89 - 20
21 - 5051 - 120
Observations0 10 km
Study areaSandbarWind turbines
0.012 - 0.2460.246 - 0.6420.642 - 1.8561.856 - 3.7073.707 - 5.421
Wind turbines
Relative density(no./transect km)
0 10 km
Figure 52. Distribution ofred-breasted merganser inthe study area during fouraerial surveys conducted in2003.
Figure 53. Cumulativedistribution map of red-breasted merganserobservations in the studyarea, based on 21 aerialsurveys between August1999 and August 2002. Dataare expressed as relativedensities measured asobservations per kilometreof flown transect coveragefor each survey in each 2 x 2km grid square.

65
Herring gull Larus argentatusA total of 1,737 herring gulls was recorded in 2003, most of which inJanuary (589) and in March (564) (Table 9). This was considerablylower numbers than observed during the period 1999 to 2002, both astotal numbers and when compared to numbers of the same months inprevious years (Appendix V).
In 2003 herring gulls were distributed throughout the study area, butmost birds were observed in the offshore southwestern part of thearea as well as the waters south of Gedser. Groups of roosting herringgulls were seen on the Rødsand sandbars between Gedser and Hyl-lekrog (Fig. 54). Herring gulls gathered around active fishing vessels,leading to discrete observations of high numbers of birds in differentparts of the study area. The general distribution pattern of herringgull based on data collected between August 1999 and August 2002was similar to the distribution pattern found in 2003, although therelative density in the southwestern parts of the study area increasedslightly in 2003 (Fig. 55).
1 - 23 - 78 - 20
21 - 5051 - 100
Observations0 10 km
Study areaSandbarWind turbines
0.013 - 0.9840.984 - 2.9962.996 - 7.4047.404 - 15.975
15.975 - 142.506Wind turbines
Relative density(no./transect km)
0 10 km
Figure 54. Distribution ofherring gull in the studyarea during four aerialsurveys conducted in 2003.
Figure 55. Cumulativedistribution map of herringgull observations in thestudy area, based on 21aerial surveys betweenAugust 1999 and August2002. Data are expressed asrelative densities measuredas observations perkilometre of flown transectcoverage for each survey ineach 2 x 2 km grid square.

66
Other speciesA total of 28 grebes was recorded in 2003. Of these 24 were red-necked grebe Podiceps griseigena, two crested grebe Podiceps cristatusand two unidentified. Three goose species were recorded, 136 Grey-lag Geese, 154 Brent Geese and 40 Canada Geese Branta canadensis. Atotal of 12,205 Tufted Ducks Aythya fuligula was recorded. Of these12,025 were observed in January 2003, when ice covered a great partof the study area and other preferred roosting areas of this species.This is believed to be the reason for the unusual high number of thisspecies in the study area. Finally, 41 Little Gulls were recorded in2003, 32 of these in March.
3.2.3 Bird distributions during base-line versus the constructionphase
The wind farm base-line phase was covered by a total of 21 surveysof birds. Three surveys were performed during the constructionphase (January, March and April 2003). Of these the January surveyhad unusual ice conditions, which are believed to have influenced thedistribution of birds in the area considerably. Therefore data fromthis survey was not used in this analysis of possible impact on birddistributions from the wind farm construction work.
To ensure compatibility between base-line data and construction dataonly data from March and April of the base-line period were used (4and 26 April 2000, 16 March and 20 April 2001 and 26 March 2002).Likewise, the wind farm area and the 2 and 4 km zones around itwere defined according to the progress of the construction work (seeFig. 35).
An analysis of the selectivity index of all species confirmed that themajority of waterbirds avoided the wind farm area. Only three spe-cies occurred with any abundance at the construction site and which,analysed on the basis of the above mentioned survey data, indicatedsome spatial changes in the area (Tables 10-13). For long-tailed duckand eider, selectivity indices for the wind farm area, the wind farm +2 and + 4 km zones decreased during the construction phase surveys,indicating a reduced preference for these areas. This was true whenanalysing on both the number of individuals (Tables 10 and 11) andon the number of observed flocks (Tables 12 and 13). Herring gullshowed a slight increase in preference of the wind farm area and thezones around it.

67
Table 10. Percentage of bird numbers for three species encountered in thewind farm area (MA) based on five base-line aerial surveys compared to theentire survey area, and in the wind farm area and zones of 2 and 4 km ra-dius from the wind farm site (MA+2 and MA+4). Also shown are the totalnumbers of birds for each species recorded throughout the surveys from thetotal study area from the base-line period (N). For each species and area, theJacobs Index value (D) is given which varies between -1 (complete avoid-ance) and 1 (complete selection).
Species MA D forMA
MA+2 D forMA+2
MA+4 D forMA+4
N
Long-tailed duck 3.00 0.46 13.63 0.46 23.10 0.40 5966
Eider 0.12 -0.81 4.26 -0.13 12.27 0.04 21020
Herring gull 0.25 -0.64 1.23 -0.65 5.50 -0.38 4779
% of total surveycoverage
1.14 5.51 11.47
Table 11. Percentage of bird numbers for three species encountered in thewind farm area (MA) based on two construction phase aerial surveys com-pared to the entire survey area, and in the wind farm area and zones of 2and 4 km radius from the wind farm site (MA+2 and MA+4). Also shownare the total numbers of birds for each species recorded throughout the sur-veys from the total study area from the construction phase (N). For eachspecies and area, the Jacobs Index value (D) is given which varies between -1 (complete avoidance) and 1 (complete selection).
Species MA D forMA
MA+2 D forMA+2
MA+4 D forMA+4
N
Long-tailed duck 0.06 -0.91 4.46 -0.13 10.20 -0.10 1794
Eider 0.00 -1.00 1.59 -0.58 9.06 -0.16 2573
Herring gull 0.36 -0.52 1.21 -0.66 11.17 -0.05 824
% of total surveycoverage
1.14 5.66 12.14
Table 12. Percentage of birds flocks (clusters) for three species encounteredin the wind farm area (MA) based on five base-line aerial surveys comparedto the entire survey area, and in the wind farm area and zones of 2 and 4 kmradius from the wind farm site (MA+2 and MA+4). Also shown are the totalnumbers of clusters for each species recorded throughout the surveys fromthe total study area from the base-line period (N). For each species and area,the Jacobs Index value (D) is given which varies between -1 (completeavoidance) and 1 (complete selection).
Species MA D forMA
MA+2 D forMA+2
MA+4 D forMA+4
N
Long-tailed duck 5.01 0.64 23.32 0.68 37.70 0.65 939
Eider 0.87 -0.14 7.02 0.13 17.50 0.24 1154
Herring gull 0.64 -0.29 3.18 -0.28 8.76 -0.15 1416
% of total surveycoverage
1.14 5.51 11.47

68
D-values for long-tailed duck changed from 0.46 (MA), 0.46 (MA+2)and 0.40 (MA+4) during the base-line period to -0.91, -0.13 and -0.10for the same three zones during the construction, when calculationswere based on the number of individuals. When the number of flockswas used for the analysis, the same pattern was observed.
The eider had much lower preference of the wind farm area thanlong-tailed duck during the base-line phase. The reduced preferencefor the wind farm area and the two zones around it during the con-struction phase, was more moderate than for long-tailed duck.
The herring gull was recorded less than expected, assuming an evendistribution of the observed birds prior to construction. This was alsothe case during construction of the wind farm, indicated by slightincreases of D-values for all zones analysed.
A calculation of the cumulative percentage of the number of long-tailed ducks in distance intervals of 500 m from the wind farm werecarried out for the March and April surveys in 2000, 2001, 2002 (base-line) and 2003 (construction). Preliminary analysis showed that atdistances 16-24 km from the wind turbines, dramatic changes oc-curred in the cumulative percentages caused by the high number ofbirds recorded at Gedser Rev (Fig. 56). At distances 0-15 km from theturbines, 2001 and 2002 showed higher percentages of birds in thevicinity of the turbines, while the percentages were lower in 2000 and2003 (Fig. 56).
When analysing the same data only within the wind farm area andthe 2 and 4 km zones around the farm a slightly different pattern wasfound (Fig. 57). 2001 and 2002 had highest percentages of birds fromthe first distance band of 500 m, while 2000 and 2003 had lower per-centages.
It must be born in mind that the construction phase was only coveredby two surveys adequate for use in this context.
Table 13. Percentage of birds flocks (clusters) of three species encountered inthe wind farm area (MA) based on two construction phase aerial surveyscompared to the entire survey area, and in the wind farm area and zones of2 and 4 km radius from the wind farm site (MA+2 and MA+4). Also shownare the total numbers of clusters for each species recorded throughout thesurveys from the total study area from the construction phase (N). For eachspecies and area, the Jacobs Index value (D) is given which varies between -1 (complete avoidance) and 1 (complete selection).
Species MA D forMA
MA+2 D forMA+2
MA+4 D forMA+4
N
Long-tailed duck 0.25 -0.64 7.27 0.13 18.55 0.24 399
Eider 0.00 -1.00 3.55 -0.24 10.64 -0.07 282
Herring gull 0.74 -0.21 2.48 -0.40 7.44 -0.26 403
% of total surveycoverage
1.14 5.66 12.14

69
Distance intervals (km)C
umul
ativ
e %
0 5 10 15 20 25 30 350
20
40
60
80
100
2000 2001 2002 2003
Distance intervals (km)
Cum
ulat
ive
%
0
20
40
60
80
100
0 1 2 3 4
2000 2001 2002 2003
Figure 56. Cumulativepercentage of numbers oflong-tailed duck in distanceintervals of 500 m from thewind turbines to the borderof the study area, based ondata from March and Aprilfrom all survey years. Datafrom 2003 represent thewind farm constructionphase.
Figure 57. Cumulativepercentage of numbers oflong-tailed duck in distanceintervals of 500 m from thewind turbines to 4 km fromthe wind farm, based ondata from March and Aprilfrom all survey years. Datafrom 2003 represent thewind farm constructionphase.

[Blank page]

71
4 Discussion and conclusions
4.1 Patterns of migration
The data collected in 2003 reconfirmed the importance of the Rød-sand area as a migration corridor for waterbirds in spring andautumn. The area remains the point of entry and departure for manywaterbirds migrating from the Baltic to wintering areas further west.The intensity of spring and autumn passage did not differ markedlyfrom the spread of migration intensity data gathered in the years1999-2002 during the base-line investigations. The predominant wa-terbird species was still the eider, since the study area lies on the ma-jor spring and autumn migration route to and from its Baltic breedingareas. Eider numbers were generally less in 2003 than in previousyears, linked in all probability to the general decline in this popula-tion, which is thought to be continuing (Desholm et al. 2002). In someaspects, data from 2002 tend to deviate from the data compiled dur-ing the other base-line years. In autumn 2002, data were only col-lected during the first three weeks of September due to a temporarysuspension in the programme. During the first weeks of Septembereider migration is less intense than during October (see Appendix I).This may explain why flock size of eiders was markedly lower inautumn 2002 compared to the other base-line years, as flock size andmigration intensity is likely to be correlated. In addition, the generalconsequence of a confined observation period in autumn 2002 is areduced sample size for most of the variables used in the analyses.Evidently, this reduces the power of the statistical comparisons with2002. Interpretation of comparisons with this particular year shouldtherefore be drawn with caution and be supported by other aspects.
Following base-line observations in spring during 2001 and 2002,waterbird migration observations from 2003 generally confirmed theoverall patterns from the base-line period. The main spring migrationpassage occurred to the north of the wind farm area in all years (seeFig. 19). As in previous years, tracks were divided into two groups bythe island of Rødsand and the west coast of Falster also channelledmovements. The density of tracks in the wind farm area tended to belower than during the base-line study (Fig. 19). Although only someof the foundations were established at the time of the spring observa-tions, there was an intense ship traffic associated with the wind farmarea during this period, which could have contributed to displace-ment from the general area.
As the observations in 2001 and 2002 indicated a very low likelihoodof dark-bellied brent geese passing through the proposed wind farmarea, specific May observations of this species were not undertaken in2003.
As in the base-line years, despite the major migration of passerines,pigeons and raptors through the Gedser Odde/Hyllekrog area north-east and northwest of the wind farm, it proved extremely difficult tostudy this movement in the vicinity of the wind farm. Because of the

72
relative small body size of many passerines, they are difficult to de-tect by radar, and of the very few radar tracks that have been com-piled, still less extended over a sufficient distance to enable meaning-ful interpretation of the data. Only in 2001, when 130 tracks werecompiled, were data sufficient to offer some interpretation of the mi-gration pattern.
For this reason, the present report has, by necessity concentratedupon the description of the substantial and highly significant water-bird migration that occurs in this region, not least because their largebody size and aggregated flocking nature provide clear radar tracksover extended distances. The visual verification of species and num-bers of individuals gives a reasonable assessment of the species spe-cific migration patterns of the radar tracks during daylight hours.However, in the absence of visual verification of the species involvedduring the hours of darkness, our ability is limited with respect to domore than estimate the absolute volume by species based on the ra-dar observations, measurement of flight speed and possibly usinginfra-red camera technology.
4.1.1 Assessing effects during the construction phaseEffects of the construction work on migration patterns of birds werestudied during spring 2003. Due to the prevailing eastward directionof migratory birds during this period, the results from the easternedge of the wind farm area were used to describe the relative occur-rence of flocks after they had passed the wind farm area.
In spring 2003, construction activities had commenced on site, andcontinued day and night. During the construction phase at night, therelative number of flocks, which traversed the eastern edge of thewind farm area, was lower than during the base-line period, althoughnot consistently significant. Such a trait was not found during day-time. Hence, construction activities during daytime, which includedthe presence of several ships and work associated with the develop-ing foundations as well as occasional noisy activity, did not appear toaffect the flight trajectories of birds. Thus, the flight patterns in spring2003 suggested that construction work could have affected the flightcorridors of the birds at night, when the most conspicuous differenceto construction activities during the day was the strong lights usedduring the hours of darkness. Birds generally navigate in relation tonatural sources of light such as the sun and the stars. However, theyare also attracted towards light, e.g. to lighthouses, illuminated oilrigs and other man-made structures (see review in Wiese et al. 2001),in contrast to what the results from the Nysted windfarm suggest.However, general attraction effects seem to occur predominantlyduring periods of drizzle and fog (Weir 1976). It has been suggestedthat the illuminated area is increased during such conditions becauseof refraction of light on air droplets (Wiese et al. 2001). This may cre-ate an environment in which migratory birds loose their orientation,leading to circular flights around a well-lit man-made structure(Bourne 1979).
Our observations were carried out almost exclusively at good visibil-ity (> 1 km) at nighttime. Therefore, we would not necessarily expect

73
such an attraction effect. It may be hypothesised that sources of lightmounted at the construction site could displace migratory water-birds, which were likely to constitute the majority of spring migra-tory birds during the night. Hence, as waterbirds approached theconstruction site in good visibility they may have had several otherpoints of reference by which to navigate, and at a distance they mayhave associated the lights at the construction site with a city or land.Many waterbirds, which undertake nocturnal migration, would usu-ally avoid crossing land areas unless flying at high altitude (cf. springmigration of common scoter across Jutland, Pedersen 1988)
Even if the migration route through the wind farm was less used atnight, (possibly as a result of the construction work) it must be con-cluded that the effects on the flight behaviour were minor, temporaland of relative short duration. Thus, the main construction periodwas terminated by summer 2003 and lasted only one spring migra-tion season.
Indeed, the overall flight trajectories did not change dramatically inspring 2003, i.e. the main migration route was located north of thewind farm area just as was observed during the base-line study.
With regard to potential for collisions with structures associated withthe construction work, the apparent avoidance response observedwould actually reduce this potential risk, at least under conditions ofgood visibility. However, given that flying birds may be attracted tolights during foggy conditions we cannot exclude the possibilities ofelevated collision risk during such periods.
The design of the effects during the construction phase is not as ro-bust as the studies undertaken during the subsequent operationalphase. Construction coincided only with spring observations, and forwhich only two years of base-line studies existed with respect toflight trajectories. In addition, the construction phase was of veryshort duration, confined to a single spring season. Hence, the resultsduring construction cannot be replicated at the Nysted wind farm.Nevertheless, valuable information was compiled on aspects aboutwhich little are currently known, but which will contribute to knowl-edge compiled from other European countries in the future.
4.1.2 Assessing effects during the operational phaseThe evidence for effects of the operation of the wind farm presentedhere is based on the observations of migration tracks passing throughthe eastern gate of the wind farm of waterbirds derived from the ra-dar observations. The populations of migration tracks from the threebase-line years were compared with those from autumn 2003, afterthe wind turbines had been erected and commenced electricity gen-eration. These results suggest that although the mean migration routeof waterbirds at night showed no significant change, the standarddeviation of the mean increased significantly from 1000 m from theeastern gate. In daylight, there was a lateral change in migrationroute towards the south in 2003, which was significant from 3000 mdistance from the eastern gate, and the same was true for the increasein standard deviation over the same distance. Although these results
Lateral change in migrationroutes

74
need cautious interpretation, given that they are based on a singleyear, they offer some support for the hypothesis that waterbirds ad-justed their migratory routes to the south and north as a result of thevisual presence of the turbines over an approach distance of 3000 munder conditions of good visibility by day. The lack of clear direc-tional response by night, but the associated increase in the variabilityof track orientation within 1000 m of the eastern gate suggests a re-duced response and shorter response distance at night. This againprovides support for one of the main predictions under the main hy-pothesis, namely that under dark conditions at night, reaction dis-tances, in terms of lateral deflection, will occur at shorter distances tothe wind farm. However, these tentative preliminary conclusionsneed confirmation by testing in future years allowing for difference inmigration volume and wind conditions.
For the reasons outlined in the results chapter, emphasis has beenplaced upon waterbirds in this analysis because of the difficulties ofobtaining sufficient data of sufficient quality to make any meaningfulbefore and after construction comparisons of migration patterns ofpasserines and other landbirds.
The overall percentage of waterbirds migration that passed throughthe eastern gate of the wind farm area in autumn 2003 (8.9%) waslower than that in the three base-line years (48.1%, 35.2% and 23.9%in 2000-2002 respectively). This result was consistent even when con-trolling for the effects of wind, time of day (i.e. day versus night) andfor their latitudinal position as they approached the wind farm. Byday, 4-7% of tracks passed the eastern gate compared to 11-24% bynight. These results from logistic regression analyses suggest an ac-tive avoidance of entering the eastern gate compared to the base-lineresults that is not explained by prevailing wind conditions. Thesepreliminary results also suggest that because of this avoidance, thepotential collision risk is reduced at the site by waterbirds reacting atsome distance from the wind farm to adjust their migration trajecto-ries. However, it is important to stress again that these data originatefrom only one single season in operation, and firmer conclusionsmust await replication of these results in future years. Furthermore,there was no full commercial operation of the wind farm throughoutthe autumn 2003. As stressed in previous reports, even those birdsentering the wind farm are not necessarily at risk from collision, sincethe tracks clearly show that many waterbirds are moving along theopen corridors between the rows of turbines.
In addition, part of the flocks observed by lateral radar may actuallyfly below or above the sweeping area, and hence, the proportion offlocks which are potentially at risk of colliding with the wings of theturbines is likely to be lower than indicated by the present estimatedproportions. In the initial environmental impact assessment, the re-sults showed that the proportion of eiders, which flew within the riskaltitude (30-110 m, varied considerably (10-53%) dependent on windconditions and season (Kahlert et al. 2000). However, it may be criti-cised that these measurements were carried out under conditions,which did not comply with the environment at Nysted wind farm.For example, the measurements from Gedser Odde could be affected
Probability of passing thewindfarm area

75
by the presence of land, which is known to increase the flight altitudeof waterbirds.
However, to gain further insight in the nature of flight altitudes andto estimate the proportion of flocks actually undertaking verticalavoidance, it was suggested that measurements of flight altitudes arecarried out in 2004. Given that the lateral distribution of flight trajec-tories has now been described during operation of the wind farm,valuable information has been compiled to help designing an in situmeasurement of flight altitude at various distances to the wind farm.
Waterbird migration intensities vary considerably with weather con-ditions both locally and on a flyway scale, making predictions at alocal scale difficult to model and comparisons difficult to make withstatistical certainty. Nevertheless, even a superficial examination ofthe density of tracks in the eastern part of the wind farm area com-pared to the reference area east of the eastern gate and in the gridsquares demonstrate a response (Fig. 17). These responses are un-doubtedly overestimated in Fig. 17 because of the “shadow effects”caused by individual turbines, which cause the loss of clear radarsignatures directly behind their positions on the screen. Nevertheless,this is considered not to be a major problem in interpretation of thedata, because many of these tracks appear on the other side of theturbine shadow.
Furthermore, it is clear from the tracks identified to species, thatmany of the flocks or individuals do indeed take avoidance actionand fly around the park, or adjust their flight trajectories to fly downthe visually “clear” corridors that will be evident to them between therows of turbines. Both these features clearly contribute to the overallreductions in relative densities of tracks from the area immediatelyoutside of the wind farm compared to within it.
4.2 Staging, moulting and wintering birds
Following the decision in 2002 to reduce the aerial survey to monthlycoverage between December and April, surveys were undertaken inJanuary, March, April and December 2003. Although aerial surveysduring the moult period had been undertaken during the base-lineperiod, these were also discontinued, since no waterbird species oc-curred in sufficient numbers to warrant extended monitoring. Thisenabled concentration of coverage during the construction and op-erational phases to be confined to the most important periods for thekey species of the area, namely long-tailed duck, eider, common sco-ter and red-breasted merganser (Desholm et al. 2003).
Peak numbers of cormorant derived from aerial surveys were lessthan in previous years because coverage was restricted to the wintermonths when most cormorants have moved to wintering areas out-side Danish waters. Similarly, maximum numbers of mute swan wereless in 2003 than in previous years, because no survey was carried outin August or September when peak numbers have tended to occur inthe past (Desholm et al. 2003). As in previous years, the majority of theswans remained north of the Rødsand sandbars in shallow inshore wa-
Migration intensity in thewind farm area
76
ters, so there were no indicatives of a change in distribution related tothe construction of the wind farm. There was no evidence of any subse-quent persistent effects on swan distributions following the cable-layingoperations (completed in October/November of 2002, but not moni-tored that winter because of suspension of the bird surveys).
Peak winter numbers of red-breasted mergansers counted in 2003 (536individuals) exceeded those of the base-line, (131, 258 and 269 individu-als in 2000-2002) in all years except 1999 (when 1,600 individuals wereencountered, Kahlert et al. 2000, 2002, Desholm et al. 2001, 2003). The2003 count failed to attain the level recognised for international impor-tance (>1,200 individuals), but suggested construction activities had noobvious effect on local abundance which is likely to vary in response tolocal feeding opportunities. Previous surveys demonstrated that most ofthe mergansers did not occur in the wind farm area even prior to con-struction, and surveys in 2003 showed that most birds again were dis-tributed in small groups north of the sandbars of the area.
Eiders also showed significant avoidance of the vicinity of the windfarm prior to construction. Peak numbers in 2003 (2,126 individuals)were less than in the base-line years (3,097 individuals in 1999, 8,706 in2000, 2,214 in 2001 and 5,362 in 2002).
By contrast, previous surveys showed that common scoter and long-tailed duck occurred in the proposed wind farm area more than on av-erage throughout the survey area. Common scoter numbers varied con-siderably within and between years, but the maximum of 46 individualsduring the first operation period was less than in all base-line years (358individuals in 2000, 182 in 2001 and 412 in 2002). Peak number of long-tailed ducks in 2003 (1,423 individuals) was less than in the last year ofthe base-line (3,053 individuals in 2002), but slightly higher than in thetwo previous years (1,308 individuals in 2001, 1,324 in 2000).
A comparison of the distributions of long-tailed duck, eider and herringgull during the base-line period and construction phase showedchanges, though data set did not allow for firm conclusions on the im-pact of the wind farm construction. Taken into consideration the lownumber of surveys for comparison the indications were that long-tailedduck and eider had decreased preference of the wind farm area duringconstruction, while the relative number of herring gull increasedslightly.
It is thus difficult at this stage to conclude about the effects of the con-struction phase on the distribution and abundance of wintering water-birds in the vicinity of the Nysted wind farm because of the short dura-tion of the construction activities involved. Although construction ac-tivities started in June 2002 (excavations for foundations) and continueduntil after the survey April 2003, much of the period of peak construc-tion activity during spring 2003 was not covered by aerial surveys.Similarly, given that there was only one winter survey during operationin 2003 (December) it is at present impossible to draw firm conclusionsrelating to the effects of the construction of the Nysted wind farm onwintering waterbird distribution and abundance in the vicinity.

77
References
Barrios, L. & Rodrígues, A. (2004) Behavioural and environmental cor-relates of soaring bird mortality at on-shore wind turbines. Journal ofApplied Ecology 41: 72-81.
Bourne, W.R.P. (1979): Birds and gas flares. Marine Pollution Bulletin 10,124-125.
Desholm, M., Kahlert, J., Petersen, I.K. & Clausager, I. (2001): Base-lineinvestigations of birds in relation to an offshore wind farm at Rødsand:results and conclusions, 2000. - Report from NERI, 42 pp.
Desholm, M., Christensen, T.K., Scheiffarth, G., Hario, M., Andersson,Å., Ens, B.,Camphuysen, C.J., Nilsson, L., Waltho, C.M., Lorentsen, S.-H.,Kuresoo, A., Kats, R.K.H., Fleet, D.M. & Fox, A.D. (2002) Status of theBaltic/Wadden Sea population of the Common Eider Somateria m. mol-lissima. Wildfowl 53: 167-204.
Desholm, M., Petersen, I.K., Kahlert, J. & Clausager, I. (2003): Base-lineinvestigations of birds in relation to an offshore wind farm at Rødsand:Results and conclusions, 2002. - Report from NERI, 64 pp.
Desholm, M. (2003): Thermal Animal Detection System (TADS) - Devel-opment of a method for estimating collision frequency of migratingbirds at offshore wind turbines. - NERI Technical Report, No. 440, 25 pp.
DHI (2000): VVM-redegørelse for havvindmøllepark ved Rødsand. Tek-nisk rapport vedrørende marinbiologiske forhold (bundvegetation ogbundfauna) i parkområdet. - Rapport, DHI, Institut for vand og miljø, 52pp. (In Danish).
Fox, A.D, Petersen, I.K. & Hedley, S.L. (2003): Calculating density esti-mates for sea birds based upon aerial survey transect counts. A progressreport on development of techniques. - Report from NERI, 41 pp.
Jacobs, J. (1974): Quantitative measurement of food selection. - Oecologia14: 413-417.
Kahlert, J., Desholm, M., Clausager, I. & Petersen, I.K. (2000): Environ-mental impact assessment of an offshore wind farm at Rødsand: Techni-cal report on birds. - Report from NERI, 65 pp.
Kahlert, J., Desholm, M., Petersen, I.K. & Clausager, I. (2002): Base-lineinvestigations of birds in relation to an offshore wind farm at Rødsand:results and conclusions, 2001. - Report from NERI, 50 pp.
Kristensen, K., Madsen, H. & Mortensen, P.S. (1986): Analyse af kvalita-tive data – en grundbog for samfundsvidenskaberne. Systime, Herning,Pp. 112. (In Danish).
Larsen, J.K. & Madsen, J. (2000): Effects of wind turbines and otherphysical elements on field utilization by pink-footed geese (Anser brachy-rhynchus): A landscape perspective. - Landscape Ecology 15: 755-764.
78
Lensink, R., Camphuysen, C.J., Jonkers, D.A., Leopold, M.E., Schekker-man, H. & Dirksen, S. (1999): Falls of migrant birds, an analysis of cur-rent knowledge. - Report from Bureau Waardenburg bv, Culemborg,The Netherlands, 117 pp.
Morrison, M.L., Pollock, K.H., Oberg, A.L. & Sinclair, K.C. (1998): Pre-dicting the Response of Bird Populations to Wind Energy-RelatedDeaths. - Presented at 1998 ASME/AIAA Wind Energy SymposiumReno, NV, January 12-15, 1998, 10 pp.
Nielsen, U.B. (2000): Fugleiagttagelser på Lolland-Falster 96-97. – DanskOrnitologisk Forening i Storstrøms Amt, 107 pp.
Noer, H., Christensen, T.K., Clausager, I. & Petersen, I.K. (2000): Effectson birds of an offshore wind park at Horn Rev: Environmental impactassessment. Commissioned by Elsamprojekt A/S 2000. National Envi-ronmental Research Institute, 112 pp.
Noer, H., Fox, A.D., Clausen, P., Petersen, B.M., Kahlert, J. & Christen-sen, T.K. (1996): Effects of the construction of a fixed link across Øresundon waterfowl populations: Environmental Impact Assessment - NERIReport, 123 pp.
Pedersen, M.B. (1988): Spring migration of common scoters acrossSouthwest Jutland. Dansk Ornitologisk Tidsskrift 82: 51-53.
Prater, A.J. (1981): Estuary Birds of Britain and Ireland. - British Trust forOrnithology. T. & A. D. Poyser, Calton, 440 pp.
SAS (1999): SAS Institute, INC. CARY, NC, USA. Software vers. 8 (TSmo).
SEAS Distribution A.m.b.A. (2000): Havmøllefarm ved Rødsand. Vur-dering af virkninger på miljøet - VVM-redegørelse. - SEAS DistributionA.m.b.A., Haslev, 173 pp.
Tulp, I., Schekkerman, H., Larsen, J.K., van der Winden, J., van deHaterd, R.J.W., van Horssen, P., Dirksen, S. & Spaans, A.L. (1999): Noc-turnal flights of sea ducks near the wind farm Tunø Knob in the BalticSea. - Bureau Waardenburg proj. nr. 98.100, report nr. 99, 69 pp.
Weir, R.D. (1976) Annotated bibliography of bird kills at man-made ob-stacles: a review of the state of the art and solutions. Department of Fish-eries and the Environment, Canadian Wildlife Service, Ontario Region,Ottawa.
Wiese, F.K., Montevecchi, W.A., Davoren, G.K., Huettmann, F., Dia-mond, A.W. & Linke, J. (2001): Seabirds at Risk around Offshore OilPlatforms in the North-west Atlantic. Marine Pollution Bulletin 42, 1285-1290.
Winkelman, J.E. (1992): De invloed van de Sep.proefeindcentrale teOosterbierum (Fr.) op vogels. - 1-4 (RIN-report 92/2-5) DLO-Instituutvoor Bos. en Natuuronderzoek, Arnhem, 120 pp. (In Dutch).

79
Appendixes
Appendix 1
Mean number (M) of birds per 15-minute period with 95% lower (L)and upper (U) confidence limits, and the total number of individuals(N) for ten species or groups of species observed during autumn 2003passing the Buoy-transect from east to west early September (1-15),late September (16-30), early October (1-15) and late October (16-31).Only species or groups of species of which > 100 individuals wererecorded are included. The data set was log-transformed before themeans and confidence limits were calculated.
Appendix II
Mean flock size (M) with 95% lower (L) and upper (U) confidencelimits, and total number of flocks (N) observed during autumn 2003.Data were log-transformed before the means and confidence limitswere calculated.
Early Sept. Late Sept. Early Oct. Late Oct.Species L M U L M U L M U L M U N
Cormorant 1.58 2.32 3.28 1.31 2.23 3.52 1.01 2.21 4.12 0.19 0.37 0.58 13,520Geese . 0 . 0.09 0.31 0.58 1.27 2.90 5.70 0.22 0.52 0.89 1,521Dabbling ducks 0.28 0.55 0.88 0.31 0.69 1.17 0.32 0.89 1.71 -0.01 0.08 0.16 878Eider 0.96 1.58 2.40 1.60 2.54 3.83 150.26 218.42 317.31 1.59 2.88 4.82 19,208Other divingducks
0.11 0.23 0.38 0.17 0.33 0.53 0.31 0.67 1.13 0.33 0.58 0.88 337
Duck sp 0.41 0.75 1.17 0.77 1.27 1.90 11.45 18.97 31.04 2.27 3.66 5.65 4,609Waders 0.05 0.14 0.23 -0.04 0.04 0.13 0.09 0.47 0.98 -0.02 0.12 0.29 392Gulls 0.51 0.70 0.92 0.39 0.60 0.84 1.04 1.63 2.40 0.47 0.71 0.97 449Sandwich tern 1.52 2.10 2.82 0.05 0.13 0.23 -0.04 0.04 0.13 . 0 . 663Passerines 0.03 0.09 0.15 1.76 2.85 4.38 . 0 . 0.03 0.19 0.38 1,177Total migration 14.80 19.11 24.60 15.90 22.23 30.95 266.75 340.53 434.63 9.83 15.00 22.64
Species/species group L M U N
Cormorant 1.56 1.71 1.87 554
Geese 5.77 7.74 10.38 75
Dabbling ducks 5.73 7.51 9.86 67
Eider 13.25 14.64 16.17 684
Other diving ducks 1.82 2.12 2.46 112
Duck sp 5.31 5.96 6.70 402
Gulls 1.14 1.19 1.25 334
Sandwich tern 1.26 1.35 1.45 320
Passerines 2.20 2.44 2.71 272

80
Appendix III
Mean number (M) of birds per 15-minute period with 95% lower (L)and upper (U) confidence limits, and the total number of individuals(N) of nine species or groups of species observed during spring 2003passing the Buoy-transect from west to east during 16 March - 15April. Only species or groups of species of which > 40 individualswere recorded in spring 2003 are included. The data set was log-transformed before the means and confidence limits were calculated.
Appendix IV
Mean flock size (M) with 95% lower (L) and upper (U) confidencelimits, and the total number of flocks (N) of eight species or groups ofspecies observed during spring 2002. Data were log-transformed be-fore the means and confidence limits were calculated.
Species/species group L M U N
Cormorant 0.23 0.32 0.42 123
Eider 10.46 13.59 17.58 9,848
Long-tailed duck 0.05 0.10 0.16 44
Red-breasted merganser 0.34 0.46 0.60 170
Duck sp. 1.29 1.67 2.10 775
Gulls 0.49 0.65 0.83 249
Sandwich tern 0.15 0.23 0.32 95
Total migration 19.20 23.62 29.00
Species/species group L M U N
Cormorant 1.02 1.15 1.29 75
Geese 2.34 3.89 6.44 15
Eider 4.97 5.28 5.61 1,074
Long-tailed duck 1.25 1.67 2.23 21
Red-breasted Merganser 1.43 1.61 1.82 88
Duck sp. 2.08 2.30 2.53 241
Gulls 1.01 1.02 1.04 240
Sandwich tern 1.10 1.20 1.32 72

Appendix V: Bird numbers for all species counted during 26 aerial surveys, August 1999 – December 2003.
Species Total 1999 1999 1999 2000 2000 2000 2000 2000 2000 2000 2001 2001 2001 2001 2001 2001 2001 2001 2002 2002 2002 2002 2003 2003 2003 200329.08 15.11 13.12 14.01 14.02 04.04 26.04 11.09 07.10 27.11 10.01 10.02 16.03 20.04 15.08 16.08 28.09 14.11 03.01 13.02 26.03 22.08 10.01 04.03 24.04 09.12
Diver sp. 299 7 12 6 3 9 2 2 45 42 15 4 2 11 52 27 31 7 3 3 16Red-throated Diver 19 3 3 1 4 4 4Black-throated Diver 2 2Red-necked Grebe 204 14 65 19 4 3 1 2 19 8 8 14 7 13 3 6 2 16Crested Grebe 43 1 13 3 15 1 8 1 1Grebe sp. 36 1 17 4 8 4 1 1Gannet 1 1Cormorant 15717 1063 72 5 38 27 63 389 5224 2519 404 160 245 97 292 1463 91 198 365 21 19 49 2812 1 11 62 27Grey Heron 26 5 4 1 2 2 3 1 1 2 2 1 1 1Anseridae 20 1 1 16 2Mute Swan 49901 7157 1154 351 1148 467 262 1146 5097 3259 955 1052 1273 870 671 9529 162 1523 339 1192 402 623 8387 842 911 455 674Whooper Swan 26 3 1 22Yellow-billed Swan sp. 42 42Greylag Goose 3635 161 2 2 276 6 131 360 294 345 300 3 24 685 185 6 361 84 274 69 62 5Brent Goose 1913 270 2 2 63 63 301 6 121 2 23 386 58 283 25 33 13 108 141 13Canada Goose 504 18 90 1 2 15 91 10 6 11 159 46 15 24 16Shelduck 629 8 8 72 47 53 103 11 9 23 122 40 10 2 13 47 6 29 26Mallard 15064 561 1320 336 755 426 30 40 636 2207 1269 822 309 123 120 81 11 42 1333 1118 912 61 181 1019 97 32 1223Garganey 2 2Teal 646 70 2 10 257 4 2 4 7 202 15 18 55Wigeon 1735 11 453 218 48 62 25 205 88 154 20 22 2 127 13 8 21 159 35 64Shoveler 13 2 5 2 4Pochard 185 65 120Tufted Duck 14081 6 20 75 1775 12025 80 100Scaup 10 10Golden-eye 9966 255 71 952 122 173 7 25 37 1898 2291 328 55 386 1529 360 192 198 94 5 988Long-tailed Duck 12466 166 68 582 77 1324 157 76 554 1308 1055 377 82 393 397 3053 798 1423 371 205Eider 35353 595 3097 92 410 169 3340 8706 950 2173 96 399 1301 2214 1398 156 27 747 180 221 457 5362 121 191 447 2126 378Scoter 2219 38 29 358 83 310 92 122 136 45 182 4 106 1 25 44 14 81 412 9 16 46 23 43Velvet Scoter 85 4 2 18 2 5 6 5 2 17 18 5 1Diving Duck sp. 2002 1 1 2000Goosander 244 3 5 1 2 1 26 113 9 9 60 4 2 9Red-breasted Merganser 4386 45 1685 15 102 131 60 24 26 18 12 258 140 102 44 1 21 38 253 80 269 1 105 278 142 536

Appendix V continuedSpecies Total 1999 1999 1999 2000 2000 2000 2000 2000 2000 2000 2001 2001 2001 2001 2001 2001 2001 2001 2002 2002 2002 2002 2003 2003 2003 2003
29.08 15.11 13.12 14.01 14.02 04.04 26.04 11.09 07.10 27.11 10.01 10.02 16.03 20.04 15.08 16.08 28.09 14.11 03.01 13.02 26.03 22.08 10.01 04.03 24.04 09.12Marsh Harrier 1 1Osprey 1 1White-tailed Eagle 2 1 1Coot 6163 30 70 430 320 13 198 225 1 230 1000 200 251 1705 200 1200 90Oystercatcher 44 4 4 3 5 1 1 6 14 4 2Lapwing 34 1 33Grey Plover 3 2 1Golden Plover 20 10 10Ringed Plover 2 2Whimbrel 16 16Curlew 17 6 3 1 1 2 4Bar-tailed Godwit 100 75 25Redshank 49 4 2 42 1Greenshank 4 3 1Knot 38 13 15 10Dunlin 731 5 25 30 7 300 1 25 300 38Ruff 15 15Avocet 31 6 25Small Wader sp. 85 40 1 27 2 15Common Gull 744 21 13 34 10 1 251 67 13 3 3 59 6 2 1 228 11 2 4 5 1 9Herring Gull 20355 482 1028 688 1141 235 1048 633 380 763 235 1520 3217 965 1261 127 246 130 144 1248 1776 872 479 589 564 260 324Lesser black-backed Gull 17 15 2Black-backed Gull 1080 68 34 41 178 5 13 9 52 31 31 78 238 9 7 10 2 7 29 40 34 9 7 89 38 5 16Black-headed Gull 3221 221 135 52 47 9 120 38 223 213 487 171 17 25 32 269 69 334 170 20 10 97 342 5 3 34 78Little Gull 484 1 1 2 1 51 84 11 3 3 259 24 3 9 32Kittiwake 5 5Gull sp. 485 1 105 306 11 4 50 8Common Tern 6 6Arctic Tern 58 1 1 1 42 13Arctic/Common Tern 22 1 1 1 2 13 1 3Little Tern 1 1Sandwich Tern 20 7 3 1 3 5 1Tern sp. 4 1 3Auk 2 2Auk/Guillemot 103 22 10 3 1 1 1 11 1 1 8 26 4 12 1 1Guillemot 2 1 1Black Guillemot 1 1

[Blank page]

National Environmental Research InstituteMinistry of the Environment
Investigations of birds during construction and operation ofN
ysted offshore wind farm
at Rødsand