investigations of intermediates appearing in the
TRANSCRIPT

Photosynthesis Research 75: 235–248, 2003.© 2003 Kluwer Academic Publishers. Printed in the Netherlands.
235
Regular paper
Investigations of intermediates appearing in the reassociation of thelight-harvesting 1 complex of Rhodospirillum rubrum
Anjali Pandit1,∗, Ivo H. M. van Stokkum2, Sofia Georgakopoulou2, Gert van der Zwan2 & Rienkvan Grondelle2
1Department of Structural Biology, Faculty of Earth and Life Sciences and Division of Physics and Astronomy,2Faculty of Sciences, Vrije Universiteit Amsterdam, De Boelelaan 1087, 1081 HV Amsterdam, The Netherlands;∗Author for correspondence (e-mail: [email protected]; fax +31-20-4447999)
Received 11 July 2002; accepted in revised form 9 December 2002
Key words: B820 subunit, circular dichroism, octylglucoside, polarized fluorescence spectroscopy, spectral globalanalysis, spectroscopy
Abstract
We investigated the temperature-mediated reassociation of the B820 subunit of Rs. rubrum to form a light-harvesting 1 complex (LH 1). By combining several spectroscopic techniques with global spectral data analysisfitting, we present evidence for the occurence of two spectral intermediates that appear during the reassociationprocess. At high temperatures, halfway the reassociation reaction, a prominent intermediate appears that has anabsorption maximum around 850 nm, a fluorescence maximum around 860–867 nm, a high anisotropy (0.3 to 0.4)and a circular dichroism spectrum with three or four bands with alternating signs. At lower temperatures, moretowards the end of the reassociation process, a second intermediate tends to appear that has an absorption maximumaround 860 nm, a fluorescence maximum around 885 nm, a medium to high anisotropy (0.1 to 0.3) and a circulardichroism spectrum with two bands with alternating signs. The latter circular dichroism spectrum has a blueshiftedzero-crossing compared to the spectrum of the LH 1 complex. Both intermediates have the spectroscopic featuresof a small oligomer. In the Qy region, the fluorescence anisotropy of both intermediates slightly increases at longerexcitation wavelengths, indicative for energy transfer among the pigments within the intermediate oligomers.
Abbreviations: BChl – bacteriochlorophyll; CD – circular dichroism; CMC – critical micelle concentration;LDAO – lauryldimethylamine N-oxide; LH 1 – the core light-harvesting complex; LH 2 – the peripheral light-harvesting complex; OG – n-octyl-β-D-glucopyranoside; RC – photosynthetic reaction center
Introduction
In purple non-sulfur bacteria the capture of light andcharge separation for conversion into chemical energyis performed by two highly organized transmembranepigment-protein complexes. These are the peripheralantenna (LH 2) and the core antenna (LH 1) thatsurrounds the reaction center (RC) where charge sep-aration takes place (van Grondelle et al. 1994). ForLH 2 the structure has been resolved to high resol-ution for the strains Rhodopseudomonas acidophila(McDermott et al. 1995) and Rhodospirillum molis-
chianum (Koepke et al. 1996). This structure appearsto consist of a ring of nine or eight pigment-proteinsubunits respectively. Its subunits are heterodimers ofthe so called α and β polypeptides and form ligandsto three bacteriochiorophyll a pigments: two BChlsabsorbing at 850 nm and oriented perpendicular to themembrane plane, and a third BChl absorbing around800 nm and oriented parallel to the membrane plane.For LH 1 only a low resolution structure exists thathas been resolved for the strain Rs. rubrum (Karraschet al. 1995). Knowledge of the low-resolution strucureof LH I combined with the high-resolution of LH 2

236
has stimulated detailed modelling (Hu and Schulten1998). According to these models, the LH 1 consists ofa ring of 16 pigment-protein subunits, which encirclesthe RC. Its subunits, called B820, are also heterodi-mers of α and β polypeptides, but each binds one BChla pigment. It is still under discussion whether the LH1 complex completely encircles the RC in vivo. Hypo-theses are that in vivo the LH 1–RC complex is shapedlike a ‘horseshoe’, or that it consists of stacked LH1–RC dimers (Frese et al. 2000; Jungas et al. 1999;Francia et al. 1999).
The LH 1 complexes of the purple bacteria strainsRs. rubrum, Rps. marina, Rps. viridis and Rb.sphaeroides can be dissociated into their subunits bytreatment with detergent and extraction of the caroten-oids (Miller et al. 1987; Visschers et al. 1992; Meck-enstock et al. 1992). For Rs. rubrum a mutant strain,called G9, exists that produces LH 1 antenna com-plexes lacking carotenoids: isolated LH complexesof this strain can be reversibly dissociated into theB820 subunits, absorbing at 820 nm, and furtherinto monomeric pigment-ligated α or β polypeptides,called B777 and absorbing at 777 nm (Ghosh et al.1988; Miller et al. 1987; Chang et al. 1990; Loachand Parkes-Loach 1995; Pandit et al. 2001). The LH1 complexes from this strain form a suitable modelsystem for the study of the B820 antenna buildingblocks, for reconstitution experiments and for study ofthe assembly of photosynthetic antenna complexes or,more general, assembly properties of transmembraneprotein complexes. Its bacteriochlorophyll pigmentsare intrinsic spectroscopic probes that sense the stateof assembly, which in its turn can be modulated byvarying such parameters as detergent concentration,temperature or protein concentration.
The B820 antenna subunit has been studied in-tensively. It appears to contain one dimer of BChl amolecules that are excitonically coupled (van Mouriket al. 1991). The Qy absorbance band of B820 isinhomogeneously broadened and no energy transferoccurs among the pigments within the B820 dimers,resulting in a high anisotropy over the whole Qy re-gion (Visschers et al. 1991, 1993). Compared to LH1, the B820 subunit has a small Stark signal anda large non-conservative CD signal (Beekman et al.1997; Koolhaas et al. 1997). The B820 subunit canreversibly be dissociated into monomeric B777 and forthis reaction the thermodynamics have been determ-ined (Sturgis and Robert 1994; Pandit et al. 2001).Several studies have been conducted to find the re-quirements for in vitro reconstitution of the B820
subunit from its separated components. It appears that,whereas in vivo the B820 subunit consists of an αβ-heterodimer, the subunit can also be formed from onlyβ-polypeptides but not from α-peptides only (Mead-ows et al. 1995; Parkes-Loach 1988). Stability of thesubunit originates from ion-pairing and/or hydrogenbonding interactions between the polypeptides in thecore region (Bustamante and Loach 1994; Meadowset al. 1995) and it is proposed that the BChl pigmentbound to the α-peptide is hydrogen-bonded to the Hisresidue of the β-polypeptide and vice versa (Olsen etal. 1997). Furthermore, the central Mg atom in thebacteriochlorophyll rings is a structural requirementfor BChl binding to form the subunit complex andLH 1 of Rs. rubrum and Rb. sphaeroides (Davis etal. 1996). Successful reconstitution of B820 from sep-arated BChl as and α- and β-polypeptides has beendemonstrated by absorption and CD spectroscopy ofreconstituted subunits, which show spectra similar tospectra of isolated B820 subunits (Meadows et al.1995; Davis et al. 1997; Parkes-Loach et al. 1988).Recently it has been demonstrated that the B820 sub-unit in octylglucoside can exist not only as a dimeric,but also a tetrameric form dependent on the detergentconcentration (Arluison et al. 2002).
Other studies have been conducted to find the re-quirements for reconstitution of the full LH 1 complex.For reconstitution of the LH 1 complex from separ-ated components the α-peptide is required, in contrastto requirements for reconstitution of the B820 subunit(Parkes-Loach et al. 1988). For each subunit, the C31carbonyl groups of the pigments are hydrogen-bondedwith the Trp 11 residue of the α-peptides of the pre-ceding subunit (Davis et al. 1997; Parkes-Loach et al.1990; Sturgis et al. 1997). Spectroscopy of reconsti-tuted LH 1 complexes shows native-like complexeswith absorption maxima equal to or slightly blueshif-ted compared to native complexes and CD spectrathat either resemble native CD spectra or are inver-ted (Bustamante and Loach 1994; Chang et al. 1988;Miller et al. 1987; Ghosh et al. 1988; Parkes-Loachet al. 1988). The LH 1 complex has been reconsti-tuted together with isolated RCs, demonstrating thatphotosynthetic units can be reassembled in which ex-citation energy is successfully transferred to the RC(Bustamante and Loach 1994). In the latter study,reconstitution of the RC-LH 1 complex was carriedout in the presence of liposomes, proving that thewhole photosynthetic unit can be reconstituted fromseparated components in a native-like environment.

237
In several reconstitution experiments, it has beendemonstrated that the dissociation reaction of theLH 1 complex into subunits and further into B777monomers is reversible (Chang et al. 1990; Miller etal. 1987; Loach et al. 1985; Ghosh et al. 1988). Upontreatment with OG, direct dissociation of B873 intoB820 subunits has been observed (Loach et al. 1985;Miller et al. 1987). Lowering the detergent concen-tration again (from 0.8% OG to 0.36% OG) showeda B873-like complex absorbing at 865 nm, but withan inverted CD signal compared to the native com-plex in chromatophores (Miller et al. 1987). Similarly,isolated B873 complexes also showed reversible dis-sociation into B777 monomers upon treatment withLDAO. Upon addition of Na-Cholate to the LDAO-treated protein a B873-like complex was reformed thatabsorbed at 860 nm and that had an inverted CD signalcompared to native LH 1 (Ghosh et al. 1988). In thelatter reassociation experiment the 860 nm-absorbingcomplex was formed within hours via discrete transi-tory states. In other studies similar intermediates havealso been observed upon reassociation of the LH 1from B820 subunits (Loach and Parkes-Loach 1995;Visschers and van Grondelle 1992; Beekman et al.1997; van Mourik et al. 1992; Pandit et al. 2001). VanMourik et al. (1992) investigated for the first time thefast kinetics of the B820–B873 reassociation reaction,by using a diode-array coupled stopped-flow appar-atus. They could fit the B820–B873 reassociationkinetics assuming a two-step reaction, but structuredresiduals and a blueshifted spectrum for reassociatedB873 compared to native LH 1 suggested that moreintermediates might be present in the reaction.
In an earlier study we investigated the reversibledissociation of the LH 1 of Rs. rubrum G9 into B820subunits as a function of temperature and detergentconcentration (Pandit et al. 2001). We found that,whereas the dissociation of LH 1 into B820 sub-units by temperature always seemed to be a one-stepprocess, the reassociation of B820 into LH 1 wouldalways occur via one or more intermediate states (Pan-dit et al. 2001). The most characteristic intermediateform occurred as an absorption band around 850 nm,halfway through the reassociation process. On thebasis of simulated absorption spectra of ‘arcs’ of theLH 1 ring of varying size, it was proposed that thisintermediate state most likely corresponds to a te-trameric aggregate consisting of two B820 subunits.Furthermore we observed intermediates with absorp-tion bands a few nanometers blueshifted from B873that might represent large incomplete rings.
This study is a further characterization of the in-termediates occuring during the B820–B873 reasso-ciation reaction. By combining several spectroscopictechniques such as absorbance, polarized fluorescenceand circular dichroism (CD) more information is ob-tained about the oligomeric states of these complexesand the possible organization of their pigments.
Materials and methods
n-Octyl-β-D-glucopyranoside (OG) was obtainedfrom Calbiochem (San Diego, California). The pur-ified B820(OG) complexes were prepared from thecarotenoidless strain Rs. rubrum G9 as described pre-viously (Pandit et al. 2001). Samples were prepared bydiluting stock solutions in buffer containing 50 mMpotassium phosphate, pH 7.5, and 0.8% OG. Buf-fers were flushed with nitrogen and cuvettes tightlysealed to prevent oxidation of samples. Absorptionspectra were measured on a Perkin Elmer Lambda40 UV/VIS Spectrophotometer using a resolution of 4nm. For fluorescence emission spectra, either a tunableTi:Sa laser (excitation power 200 µW) pumped by an8W Arglaser or a halogen tungsten light bulb with a595 nm interference filter was used as an excitationsource. Emission light was detected by a spectrograph(Chromex). For anisotropy measurements, a Glan-Thompson polarizer was used in the excitation pathand an IR sheet polarizer in the detection path. Allfluorescence spectra have been corrected for the de-tector sensitivity. For CD measurements, a home-builtCD spectrophotometer was used containing an opto-acoustic modulator (Hinds) and two lock-in amplifiers(EG&G and Ithaco). All samples were measured in1×1 cm quartz cuvettes in a temperature-controlledcuvette holder.
Global analysis fitting of the CD, absorption andpolarized fluorescence spectra was performed using athree-component and four-component spectral model(van Stokkum et al. 1995) with constraints on someof the amplitudes. CD and absorption spectra as afunction of temperature were fitted simultaneouslyusing the measured CD and absorption spectrum ofB820, B873 and one or two intermediate fitspectra,each consisting of two skewed gaussians with vari-able skewness, widths and peak locations. Polarizedfluorescence spectra as a function of temperature werefitted using a three- or four-component spectral model,

238
Figure 1. Magic-angle fluorescence spectra upon excitation of theQx band (595 nm) of a sample thermostated at stepwise loweredtemperatures.
according to: (IVV(T)
IHV(T)
)=
(�N
i=1(1 + 2ri)IMA,i(T)
�Ni=1(1 − ri)IMA,i(T)
)(1)
In this equation IVV and IHV are the parallelly andperpendicularly polarized fluorescence intensities, Tis the temperature, N is the number of spectral com-ponents, and IMA,i is the magic-angle fluorescenceand ri the anisotropy of the i-th component. Spectralcomponents consisted of the fluorescence spectrumof B820, B873 and one or two intermediates, eachformed by a skewed gaussian with variable skewness,width, peak location and anisotropy.
Polarized fluorescence spectra as a function of theexcitation wavelength (exciting in the Qy region) wereanalyzed using the global-analysis results from fittingof the temperature-dependent polarized fluorescencespectra. The latter spectra were obtained upon excitingat 830 nm. Fluorescence emission spectra as a func-tion of excitation wavelength were assumed to consistof a linear combination of the fluorescence compon-ents revealed from the temperature-analysis (excitedat 830 nm), correcting for the change in extinction foreach component upon scanning through the absorptionband: (
IVV(λexc)
IHV(λexc)
)=
�Ni=1
εi(λexc)
εi(830)[1 + ri(λexc)]IMA,i(830)
�Ni=1
εi(λexc)
εi(830)[1 − ri(λexc)]IMA,i(830)
(2)
Figure 2. Magic-angle fluorescence spectra upon blue-edge excita-tion of the Qy band (830 nm) of a sample thermostated at stepwiselowered temperatures. The sharp peak at 830 nm is scattered excita-tion light. Inset: the fluorescence emission anisotropy at 880 nm vstemperature.
In which λexc is the excitation wavelength and εiis the extinction coefficient of the i-th component. Forthe shapes of the intermediate spectra, the fitspectraresults from the temperature analysis were taken. Theanisotropies of B820 and B873 were considered tobe constant over the excitation range (rB820(λexc) =rB820 and rB873(λexc) = rB873). For a three-componentmodel, the amplitude and anisotropy of the intermedi-ate component at each excitation wavelength were ob-tained by straightforward calculation (subtracting thefractional contributions of B820 and B873 from eachmeasured spectrum). For a four-component model, theamplitudes and anisotropies of the two intermediatecomponents were resolved using MatLab (MathWorksInc., Natic, Massachusetts).
Results
Temperature-dependent fluorescence polarization
Polarized or magic-angle fluorescence emission spec-tra were obtained from samples prepared in 0.8% OGand thermostated at temperatures from 301 K downto 281 K. Figure 1 shows the magic-angle emissionspectra upon excitation in the Qx region (595 nm)upon lowering the temperature from 293 to 281 K.The fluorescence spectra show the same trend as de-scribed earlier for temperature-dependent absorptionmeasurements (Pandit et al. 2001): upon loweringthe temperature, the fluorescence peak shifts from thefluorescence maximum of B820 (830 nm) to the max-imum of B873 (890 nm) without an isosbestic point,

239
Figure 3. (A) The absorption spectrum of an LH 1 sample equilibrated half-way the B820–B873 reassociation process, with arrows indicatingthe excitation wavelength. Dotted spectra are the absorption spectra of B820 (peak 820 nm) and B873 (peak 873 nm). (B) The magic-anglefluorescence spectra, with in the inset the fluorescence emission anisotropy spectrum upon excitation at 848 nm. The spikes are due to scatteredexcitation light.
Figure 4. (A) The absorption spectrum of an LH 1 sample equilibrated towards the end of the B820–B873 reassociation process, with arrowsindicating the excitation wavelength. Dotted spectra are the absorption spectra of B820 (peak 820 nm) and B873 (peak 873 nm). (B) Themagic-angle fluorescence spectra, with in the inset the fluorescence emission anisotropy spectrum upon excitation at 848 nm. The spikes aredue to scattered excitation light.
indicating the appearance of one or more intermedi-ate forms during the reassociation. Figure 2 showsthe magic-angle emission spectra upon excitation inthe Qy region (830 nm) and successively lowering thetemperature from 301 K to 281 K. The inset shows theanisotropy detected at 880 nm versus the temperature.Upon lowering the temperature, the anisotropy of theemission decreased from 0.4 to 0.05. The fluorescenceemission maximum shows a redshift of the emissionmaximum from 830 nm towards 895 nm. Taking thespectrum at 296 K, it is clear that the spectral shape de-viates from the spectrum of B820. The corresponding
anisotropy spectrum has an anisotropy around 0.32,which is much higher than the anisotropy of B873(around 0.05). Hence, the shoulder around 870 nm inthis polarized fluorescence spectrum probably origin-ates from one or more intermediate structures that havea high anisotropy.
Excitation wavelength-dependent fluorescence po-larization was measured for two types of samples. Thefirst type (further referred to as sample 1) consistedof a sample prepared in 0.8% OG the temperatureof which was lowered until a clear band around 850nm appeared in the absorption spectrum. The second
240
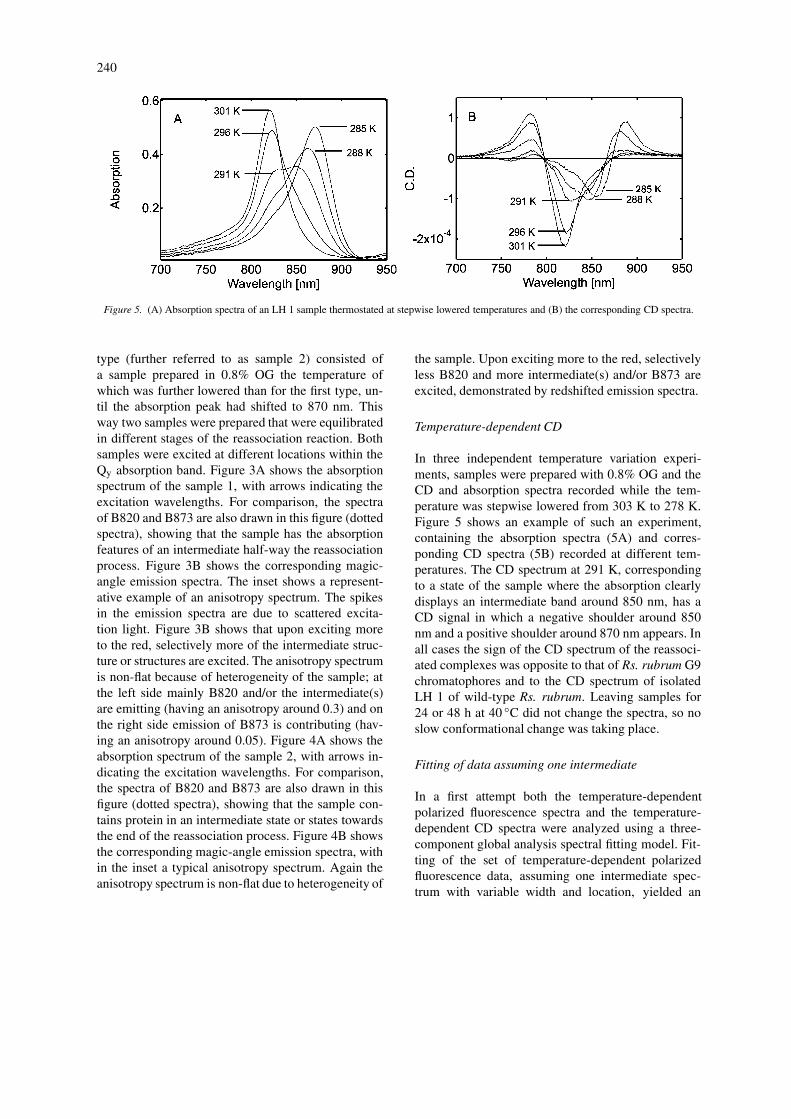
Figure 5. (A) Absorption spectra of an LH 1 sample thermostated at stepwise lowered temperatures and (B) the corresponding CD spectra.
type (further referred to as sample 2) consisted ofa sample prepared in 0.8% OG the temperature ofwhich was further lowered than for the first type, un-til the absorption peak had shifted to 870 nm. Thisway two samples were prepared that were equilibratedin different stages of the reassociation reaction. Bothsamples were excited at different locations within theQy absorption band. Figure 3A shows the absorptionspectrum of the sample 1, with arrows indicating theexcitation wavelengths. For comparison, the spectraof B820 and B873 are also drawn in this figure (dottedspectra), showing that the sample has the absorptionfeatures of an intermediate half-way the reassociationprocess. Figure 3B shows the corresponding magic-angle emission spectra. The inset shows a represent-ative example of an anisotropy spectrum. The spikesin the emission spectra are due to scattered excita-tion light. Figure 3B shows that upon exciting moreto the red, selectively more of the intermediate struc-ture or structures are excited. The anisotropy spectrumis non-flat because of heterogeneity of the sample; atthe left side mainly B820 and/or the intermediate(s)are emitting (having an anisotropy around 0.3) and onthe right side emission of B873 is contributing (hav-ing an anisotropy around 0.05). Figure 4A shows theabsorption spectrum of the sample 2, with arrows in-dicating the excitation wavelengths. For comparison,the spectra of B820 and B873 are also drawn in thisfigure (dotted spectra), showing that the sample con-tains protein in an intermediate state or states towardsthe end of the reassociation process. Figure 4B showsthe corresponding magic-angle emission spectra, within the inset a typical anisotropy spectrum. Again theanisotropy spectrum is non-flat due to heterogeneity of
the sample. Upon exciting more to the red, selectivelyless B820 and more intermediate(s) and/or B873 areexcited, demonstrated by redshifted emission spectra.
Temperature-dependent CD
In three independent temperature variation experi-ments, samples were prepared with 0.8% OG and theCD and absorption spectra recorded while the tem-perature was stepwise lowered from 303 K to 278 K.Figure 5 shows an example of such an experiment,containing the absorption spectra (5A) and corres-ponding CD spectra (5B) recorded at different tem-peratures. The CD spectrum at 291 K, correspondingto a state of the sample where the absorption clearlydisplays an intermediate band around 850 nm, has aCD signal in which a negative shoulder around 850nm and a positive shoulder around 870 nm appears. Inall cases the sign of the CD spectrum of the reassoci-ated complexes was opposite to that of Rs. rubrum G9chromatophores and to the CD spectrum of isolatedLH 1 of wild-type Rs. rubrum. Leaving samples for24 or 48 h at 40 ◦C did not change the spectra, so noslow conformational change was taking place.
Fitting of data assuming one intermediate
In a first attempt both the temperature-dependentpolarized fluorescence spectra and the temperature-dependent CD spectra were analyzed using a three-component global analysis spectral fitting model. Fit-ting of the set of temperature-dependent polarizedfluorescence data, assuming one intermediate spec-trum with variable width and location, yielded an

241
Figure 6. Intermediate magic-angle fluorescence spectrum, result-ing from a three-component spectral global analysis on a seriesof temperature-dependent polarized fluorescence spectra. The insetshows the residual of the fit. The anisotropy associated with theintermediate is 0.35.
Figure 7. Intermediate CD spectrum, resulting from athree-component spectral global analysis on a series oftemperature-dependent absorption and CD spectra. The insetshows the residual of the fit.
intermediate fluorescence spectrum located at 867 nmwith an anisotropy of 0.35. Figure 6 shows the in-termediate magic-angle fluorescence spectrum with inthe inset the residual of the fit. Note that the spec-trum is broad (full width at half maximum of 60 nm)and that the residual has some structure. Simultaneousfitting of the CD and absorption spectra yielded anintermediate absorption spectrum with a maximum at850 nm and an intermediate CD spectrum with fouralternating bands. Figure 7 shows a result for an inter-mediate CD spectrum with in the inset the residual ofthe fit. The fit residuals had similarly structured shapesfor the three independent experiments and they had anegative contribution to the fits at high temperaturesand a positive contribution at low temperatures. This
Figure 8. The resolved magic-angle fluorescence spectra of the in-termediate structure(s) in the LH 1 sample equilibrated half-way theB820–B873 reassociation, for excitation at different wavelengthsin the Qy region. The insets shows a the fluorescence emissionanisotropy spectrum upon excitation at 848 nm.
strongly suggests that in the CD spectra actually twospectral intermediates appear during the reassociationinstead of one, which are linear combinations of theintermediate found and the residual.
The two sets of excitation-dependent polarizedfluorescence spectra were linked to the temperature-dependent fluorescence spectra as described in ‘Ma-terials and methods’ (see above). Taking the fractionalcontributions of B820 and B873 to the fluorescencespectra excited at 830 nm, the fractional contributionsof B820 and B873 to fluorescence spectra upon excit-ation at other wavelengths were calculated, correctingfor the change in extinction upon scanning throughthe excitation band. Subtraction of the contributions ofB820 and B873 from each spectrum unraveled the ver-tically and horizontally polarized fluorescence spectraof the intermediate at each excitation wavelength. Fig-ure 8 shows some of the thus obtained intermediatemagic-angle fluorescence spectra of sample 1, within the inset an example of an anisotropy spectrum.Upon exciting more to the red, the maxima of theintermediate spectra shift to the red, suggesting thatin reality more than one intermediate is present. Alsothe anisotropy spectra are again not flat, suggestingheterogeneity instead of one intermediate species.
Fitting of data assuming two intermediates
The fitresults obtained with the three-component spec-tral analysis, assuming one intermediate, stronglyindicate that more intermediates are indeed presentduring the reassociation of B873, because of the struc-

242
Figure 9. The two intermediate magic-angle fluorescence spectraresulting from a four-component spectral global analysis on a seriesof temperature-dependent fluorescence spectra. Dotted lines: thefluorescence spectrum of B873 and the shoulder of the fluorescencespectrum of B820. Solid line: the most blueshifted intermediate,appearing at high temperatures. Dash-dotted line: the second in-termediate appearing at lower temperatures. The inset shows theresidual of the fit. The associated anisotropy values of the inter-mediate spectra are 0.34 (solid spectrum) and 0.27 (dash-dottedspectrum).
Figure 10. The two intermediate CD spectra resulting from afour-component spectral global analysis on a series of temperat-ure-dependent absorption and CD spectra. Dotted lines: the CDsignal of B820 and of B873. Solid line: the most blueshifted in-termediate, appearing at high temperatures. Dash-dotted line: thesecond intermediate appearing at lower temperatures. The insetshows the residual of the fit.
tured shapes of the residuals of the CD and polarizedfluorescence fits, the broad width of the intermediatefluorescence fitspectrum, the redshift of the interme-diate fluorescence maximum upon scanning throughthe excitation band and the non-flat anisotropy fluor-escence emission spectra of the intermediate. There-fore, in a second step, the data was analyzed as-
Figure 11. The fractions of the B820 (crosses), B873 (triangles),the most blueshifted intermediate (closed circles) and the secondintermediate (open circles) as a function of the temperature.
suming two intermediates instead of one. Both thetemperature-dependent polarized fluorescence spectraand the temperature-dependent CD spectra were ana-lyzed using a four-component global analysis spectralfitting model as described in ‘Materials and methods’.Fitting of the temperature-dependent polarized fluor-escence spectra yielded two intermediate fluorescencespectra with maxima at 859 nm and at 885 nm andanisotropy values of 0.34 and 0.27, respectively. Theresults are shown in Figure 9. Note that the solid fit-spectrum is still relatively broad, but the residual ofthe fit is less structured. Fitting with two intermediatesinstead of one further improved the fit by 15%, redu-cing the standard deviation (rms) from 45.6 to 38.0.The signal to noise ratio, defined as the the absolutemaxima of the polarized fluorescence spectra dividedby the rms, was in the order of 50 to 100.
Simultaneous fitting of the temperature-dependentCD and absorption series of three independent exper-iments showed some variation in the fitting results.Fits yielded two intermediate CD spectra of which theone occuring at high temperatures typically displayedfour bands with alternating signs, and the second one,occuring at lower temperatures, had two bands with al-ternating signs. Figure 10 shows an example of the es-timated intermediate CD spectra, with in the inset theresidual of the fit. The two corresponding intermedi-ate absorption fitspectra have maxima located around853 nm (corresponding with the CD spectrum withfour bands) and around 859 nm (corresponding withthe CD spectrum with two bands). The residual stillshows structure. In contrast to the three-componentfitting, the residuals of four-component fits of the three

243
Figure 12. The fractions of B820 (crosses), B873 (triangles), themost blueshifted intermediate (closed circles) and the second inter-mediate (open circles) as a function of the excitation wavelength, ina sample equilibrated halfway the B820–B873 reassociation process(see Figure 3).
different sets of CD experiments had different shapes(not shown). Fitting with two intermediates instead ofone did not significantly improve the fits and the rmsin both cases was in the order of 1 · 10−5, giving asignal to noise ratio of 10 to 20. Figure 11 shows thecalculated fractional contributions of B820, B873 andof the two intermediates as a function of temperature.
The two sets of excitation-dependent polar-ized fluorescence spectra were again linked to thetemperature-dependent fluorescence spectra, now us-ing the results of the four-component global-analysisfitting of the temperature-dependent polarized fluor-escence series: vertically and horizontally polarizedfluorescence spectra upon exciting at 830 nm wereassumed to consist of a linear combination of thepolarized B820 spectrum, polarized B873 spectrum,and the two polarized intermediate spectra resultingfrom the global spectral analysis on the set of temper-aturedependent fluorescence spectra. The amplitudesof the four components were calculated by MatLab(see ‘Materials and methods’). Using the fractionalcontributions of B820 and B873 to the fluorescencespectra at 830 nm, the fractional contributions ofB820 and B873 to fluorescence spectra upon excita-tion at other wavelengths were calculated, correctingfor the change in extinction upon scanning throughthe excitation band. Subtraction of the contributionsof B820 and B873 from each spectrum left the vertic-ally and horizontally polarized fluorescence spectra ofthe combination of the two intermediates at each ex-citation wavelength. The relative contribution of each
intermediate to these spectra and corresponding aniso-tropy was resolved using MatLab. Figure 12 showsthe fractional contributions of the four components asa function of the excitation wavelength for sample 1.According to Figure 12, the 859-nm fluorescing in-termediate has an absorption maximum around 850nm and the 885-nm fluorescing intermediate has anabsorption maximum located around 866 nm. The an-isotropy values of the 859-nm fluorescing intermediateincreased from 0.27 to 0.37 over the excitation rangeof 820–886 nm and the anisotropy values of the 885-nm fluorescing intermediate increased from 0.09 to0.29 (not shown).
Discussion
Characterization of two intermediates in theB820–B873 reassociation process
The measured polarized fluorescence, CD and absorp-tion spectra as a function of temperature all showthe appearance of a spectral intermediate during therecooling process. Whereas the appearance of thisprominent intermediate, which features are describedby the results of the three-component analysis fitting,is clear by eye looking at the measured spectra, theappearance of a second intermediate is more speculat-ive. Motives that more than one intermediate appearsduring the reassociation process are given by the res-ults of the three-component spectral analysis fittingand by analyses of the excitation-dependent polarizedfluorescence spectra. First, analyses of excitation-wavelength dependent fluorescence spectra from twosamples, equilibrated in different stages of the B820–B873 reassociation process, both yield an interme-diate fluorescence spectrum with a redshifting peakfor increasing excitation wavelengths and non-flatanisotropy spectra, when only one intermediate istaken into account. Second, the residuals of globalanalysis of three temperature-dependent CD experi-ments have pronounced structures with similar shapesfor the three independent experiments, when onlyone intermediate is taken into account. Third, alsothe three-component global-analysis residuals of thetemperature-dependent polarized fluorescence experi-ment show some structure. These arguments stronglysuggest that the sets of spectra contain spectral con-tributions of more intermediates, that can be ana-lyzed spectroscopically by introducing more spectralfit components. Indeed, a second intermediate com-

244
ponent could be extracted by expanding the fittinganalyis to a four-component fit. The spectroscopicfeatures of this intermediate in terms of absorption,fluorescence, polarization and CD consistently showthe features of a second small oligomer, that is some-what larger than the prominent intermediate. To someextent the introduction of a second intermediate im-proves the fitting. The global-analysis residuals of thetemperature-dependent polarized fluorescence spectrashow less structure and the rms is reduced, whilethe residuals of the temperature-dependent CD spectraseem to contain more random fluctuations than pro-nounced structures. It is not unlikely that in reality arange of differently sized aggregates coexists in thedifferent equilibria. In this paper, however, we attemp-ted to get an overview of the spectroscopic parametersof the intermediate(s). Therefore our fitting approach,in which the shapes of the fitspectra in terms of widthsand peak locations are fitting parameters, is limited bya small number of components to reduce the numberof free parameters. In an alternative approach, thisproblem could be handled by fitting a distribution ofintermediates with defined spectral shapes to the setsof spectra to focus on the relative contributions of eachform as a function of temperature.
Because of their relatively blueshifted absorptionand high anisotropy, both intermediates most likelyrepresent small oligomers. The increase of aniso-tropy for longer excitation wavelengths (from 0.3to 0.4 for the most blueshifted and from 0.09 to0.29 for the second) suggests that energy transfertakes place between the pigments within the inter-mediate oligomers. The second intermediate has asteeper increase of anisotropy for increased excita-tion wavelengths and a more redshifted absorption andfluorescence spectrum than the first one. This suggeststhat the second intermediate, appearing at lower tem-peratures (further in the reassociation process), is alarger oligomer, consistent with the idea of a step-wise oligomerization process. In the modelling studyof Westerhuis et al. (1999) who computated polarizedfluorescence Qy excitation spectra for diferently-sized‘arcs’ of an LH 1 ring under low temperature condi-tions, an increase of polarization upon exciting moreto the red also was found, that was a more steepincrease for larger oligomers.
Earlier we presented a reaction model in which thereassociation of B820 into B873 could be described bya moderately cooperative association reaction (Panditet al. 2001). Such a reaction would yield equilibriain which B873 and B820 can coexist together with
Figure 13. A schematic picture of the two BChls within one dimerwith the coordinate basis used in the CD/absorption simulation.
very small or very large aggregates of B820. Thisagrees with our findings of two intermediates in thisstudy, if both are considered small aggregates. Asthe most blueshifted intermediate (assumed dimerizedB820) coexists mainly with B820 in equilibrium (Fig-ure 3A shows a clear absorption band of B820), isseems likely that further in the reassociation reactionthis intermediate will associate with B820 subunits orwill dimerize, forming structures that might be rep-resented by the second intermediate. The results heredescribe intermediates that are formed in a thermo-dynamic equilibrium and might differ from interme-diates that are temporarily formed during a kineticreassociation process. The results of van Mourik etal. (1992), who followed the B820–B873 reasoci-ation process kinetically, could distinguish a kineticintennediate step that was partly attributed to protein-detergent interactions. Their fitting analysis showsfitresiduals that have structure around 850 nm, sug-gesting the formation an 850-nm intermediate duringthe kinetic reassociation reaction. Complementary toequilibrium experiments, more expanded kinetic ex-periments on the B820–B873 association/dissociationprocess should be performed to adress the questionwhether the here presented spectral intermediates alsoappear in a kinetic reassociation process.
The CD spectra of reassociated B873 in our ex-periments have an opposite sign compared to theCD spectrum of Rs. rubrum G9 chromatophores and

245
to the CD spectrum of isolated wildtype LH 1 (notshown). Also in other reassociation studies sometimesinverted CD spectra are observed for the reassociatedLH 1 complexes (Miller et al. 1987; Ghosh et al.1988). Parkes-Loach et al. showed that the sign ofthe CD spectrum strongly depends on BChla bind-ing site (Parkes-Loach et al. 1990) and observed thatB873 complexes reconstituted with BChla ethyl orphytyl derivatives had inverted CD spectra. We did notobserve any slow reconformation towards a ‘native-like’ CD spectrum. However, we have some evidencethat reconstituted LH 1 complexes in Rs. rubrum G9chromatophores have an inverted CD signal that insome cases slowly (within days) will change sign. Thismight indicate that reassociated B873 complexes withinverted CD signal are intermediates of which the pig-ments slowly refold towards the native conformation.It is also possible that, depending upon the condi-tions for reassociation, both native-like and non-nativeaggregates are formed.
Simulated CD and absorption spectra of arcs of anLH 1 ring
In a preliminary modelling study (Georgakopoulou etal., in preparation) the CD and absorption spectrum ofan LH 1 ring are simulated, using the electron-densitymap structure of Rs. rubrum as a template and usingthe αβ-heterodimer structure of Rs. molischianum forpositioning of the α- and β-BChls. In this model twotransitions (Qy and Qx) of each chromophore are al-lowed. The template for the LH 1 ring consists in factof two rings about 0.1 A separated: the α-BChls arepositioned on the upper ring and the β-BChls on thelower ring. Figure 13 shows a schematic picture ofthe two BChls within one dimer in this model. Thedipole moments of each chromophore are positionedon the template and each given a certain rotation inthe plane of the BChl (i.e., the Qx dipole momentsare not perpendicular to the radius of the LH 1 ringand the Qy, dipole moments of the α- and β-BChlwithin one dimer are not parallel and not in the planeof the α, resp. β ring). For simulation of the CD andabsorption spectrum, the Hamiltonian for this systemis calculated, taking into account all excitonic interac-tions between the chromophores. Diagonal disorder isadded to include inhomogeneous broadening. In thenext step, the Hamiltonion is diagonalized and theabsorption and CD spectra are calculated.
In all our reassociation experiments, the CD spec-tra of reassociated B873 are inverted compared to
‘native’ CD spectra of isolated wild-type LH 1 and LH1 in chromatophores. We found that in the simulation,inversion of the CD signal was achieved by switchingthe orientation of the µy-dipole moments of the α-and β-BChls in the dimers. For α- and β-BChls po-sitioned on one ring, inversion of signal would simplybe induced by rotation of the α- or β-BChl µy-dipolemoment through the plane of the ring. In our model itis less easy to give a geometrical explanation, becausepresumably two planes have to be taken into acount ifinteraction between neighbouring dimers contributesto the CD. In that case one plane is spanned by thevector connecting the centers of the two BChls withinthe dimer and the µy-dipole moments, and a differentplane is spanned by the vector connecting the β- andα-BChls of two neighbouring dimers.
Although we did not investigate the full parameterspace of possible dipole orientations that lead to an in-version of CD, some interesting remarks can be madeabout this finding. Firstly, this demonstrates that smallchanges of the direction of the dipole moments cancause an inversion of CD. This means that easily re-associated LH 1 complexes can be formed of whichthe CD signal differs from the native CD spectrum,by small differences in pigment orientation. Secondly,this finding suggests that in our reassociation ex-periments B873 complexes are formed in which theorientation of the α- and β-BChls within the dimers isa mirror image of the orientation in native dimers. Pos-sibly, more stable complexes are formed by mirroredorientations of the and β-BChls.
We applied the above explained model to calculateCD and absorption spectra of increased-sized ‘arcs’of an LH 1 ring, for comparison with the interme-diate absorption and CD spectra found in this study.Because CD spectra of reassociated B873 had an in-verted CD compared to native LH 1, LH 1 spectrawere simulated in which the CD spectrum of LH 1either resembled the native CD signal, or had this in-verted sign. The BCh1 site-energies of the Qy wereset to 800 nm, the site-energies of the Qx to 600 nm,a homogeneous broadening of 350 cm−1 and inhomo-geneous broadening of 550 cm−1 was assumed and theenergy difference between the α and β BChls was setto 300 cm−1. The Qy and Qx dipole moments wereset to 6.3 and 1.9 Debye, respectively. For simulationof a native-like CD spectrum, the α and β µy dipolemoments were rotated 7◦ and 5◦ out of the plane ofthe ring respectively, and for an inverted CD spectrumthe rotation angles were switched to 5◦ and 7◦ respect-ively. The α-BCh1 was rotated 19.18 degrees around

246
Figure 14. Simulated absorption and CD spectra of increased-sized arcs of an LH 1 ring with inverted sign compared to native LH 1. Spectraare drawn of B820, (B820)2 (2N), (B820)4 (4N), (B820)8 (8N) and of the LH 1 ring (B873). Dotted line: CD spectrum of (B820)2, which ispart of a native-like LH 1 ring.
the x-axis. Simulations would yield an interaction en-ergy around 255 cm−1 between the α- and β-BChlwithin the dimers and an energy around 214 cm−1
between the BChls on adjacent dimers. The CD spec-trum of the dimer would have alternating a positiveand and negative peak, as observed experimentally, forboth types of simulations and only for larger aggreg-ates the signs would be inverted by switching the α-and β-BCh1 dipole orientations.
Figure 14 shows the obtained simulated absorptionand CD spectra of arcs of an ‘inverted’ LH 1 ring. Thedotted spectrum is the simulated CD signal of (B820)2from part of a native-like LH 1 ring. Note that the ab-sorption of B873 is around 844 nm in this simulation,instead of 873 nm, and that the CD signal of B820 isconservative, instead of non-conservative as observedexperimentally. In both types of simulations (seriesof inverted and non-inverted CD spectra compared towild-type LH 1) the CD spectrum of B820 had thesame sign as observed experimentally, although its rel-ative size compared to CD spectra of larger aggregateswas changed if rotations of the α- and β-BChls wereinverted. The higher excitonic band at 777 nm is morepronounced in both the absorption and CD simulationsthan in measured spectra. Probably in reality, the siteenergies and the angles of the dipole moments changefor each intermediate, i.e., by increasing the anglebetween the Qy dipole moments. Such changes werenot introduced in the modelling to keep the processsimple and get a clear view of the effect that only ringparts of different size have on the absorption and CDspectra without interference of other parameters.
Figure 14A shows a rapid redshift of the absorptionupon increasing the aggregation size. The most blue-shifted intermediate we found, appearing half-way thereassociation process, therefore matches best with theabsorption characteristics ofa B820 dimer ((B820)2).An interesting result from the CD simulations is thatfor arcs of an LH 1 with inverted CD, all aggregateshave only two bands (plus the higher excitonic bandaround 777 nm). For arcs of a native LH 1 ring, thiswas also the case for aggregates larger than (B820)2.In fact, the CD spectrum of (B820)2 in that simulationshows four alternating bands reminding ona of the CDintermediate fit spectra obtained by global-analysisfiting of our temperature-dependent CD series. Thissuggests that the B820 subunits can dimerize, havingtheir pigments oriented as in native LHI, whereas lar-ger aggregates are formed with an inverted pigmentorientation.
The simulations show how the CD spectral shapesmight change with increased oligomeric states. Ac-cording to the simulated spectra, a transition fromB820 to (B820)2 is accompanied by the rise of twoor four alternating bands (of which the signs are re-versed compared to the nearest B820 peaks) whereasa transition from (B820)2 towards larger aggregates(including the full LH 1 ring) induces a redshift of thespectra. Although the absorption spectra show only avery small redshift for aggregates larger than (B820)2upon increase of the aggregate size, the CD signalsshift significantly to the red as the zero-crossings areless blueshifted compared to the absorption maximafor larger aggregates. The simulations demonstrate

247
that inverting rotation of the α and β pigments in theBCh1 plane results in a similarly shaped, but inver-ted, CD spectrum for the whole ring and for largeaggregates, but in differently shaped CD spectra for(B820)2.
Conclusion
We applied a combination of spectroscopic techniquesto investigate the spectral properties of intermedi-ates appearing in the B820–B873 association reaction.Independently, results from different spectroscopic ex-periments could be explained consistently assumingthat at least one, but probably two, intermediatesare present in the reassociation process. In case datawas fitted assuming one intermediate component, thisspectral intermediate appears to have an absorptionmaximum around 850 nm, a fluorescence maximumaround 867 nm, an anisotropy of 0.3 to 0.4 and aCD spectrum with four bands with alternating signs.In case data was fitted with two intermediates, thefluorescence spectrum of the prominent intermediateis more blueshifted with a maximum around 860 nm.The second, more redshifted, intermediate appears fur-ther on in the B820–B873 reassociation reaction, andhas an absorption maximum around 866 nm, fluores-cence maximum around 885 nm, an anisotropy of 0.1to 0.3 and two alternating peaks in the CD. Both inter-mediates display a slow rise of anisotropy as functionof the excitation wavelength, indicating that energytransfer takes place between the pigments within theoligomers. The spectral features of both intermedi-ates match best with the spectroscopic properties ofa small oligomers, for instance a B820 dimer andB820 trimer respectively. This suggests that the firststeps towards formation of the LH 1 complex fromB820 subunits in vitro might consist of the stepwiseaggregation of B820 into small complexes that haveexcitonic interaction and energy transfer among thepigments, leading to the formation of a functionallight-harvesting antenna complex.
Acknowledgements
This work was financially supported by The Nether-lands Organization of Scientific Research (NWO) viathe Foundation of Earth and Life Sciences (ALW).
References
Arluison V, Seguin J and Robert B (2002) The reaction order ofthe dissociation reaction of the B820 subunit of Rhodospirillumrubrum light-harvesting I complex. FEBS Lett 516: 40–42
Beekman LMP, Steffen M, van Stokkum IHM, Olsen JD, HunterCN, Boxer SG and van Grondelle R (1997) Characterizationof the light-havesting antennas of photosynthetic purple bac-teria by stark spectroscopy. 1. LH1 antenna complex and theB820 subunit from Rhodospirillum rubrum. J Phys Chem B 101:7284–7292
Bustamante PL and Loach PA (1994) Reconstitution of a functionalphotosynthetic receptor complex with isolated subunits of corelight-harvesting complex and reaction centers. Biochemistry 33:13329–13339
Chang MC, Callahan PM, Parkes-Loach PS, Cotton ThM and LoachPA (1990) Spectroscopic characterization of the light-harvestingcomplex of Rhodospirillum rubrum and its structural subunit.Biochemistry 29: 421–429
Davis ChM, Parkes-Loach PS, Cook ChK, Meadow KA, Ban-dilla M, Scheer H and Loach PA. (1996) Comparison of thestructural requirements for bacteriochlorophyll binding in thecore light-harvesting complexes of Rhodospirillum rubrum andRhodobacter sphaeroides using reconstitution methodology withbacteriochlorophyll analogs. Biochemistry 35: 3072–3084
Davis ChM, Bustamante PL, Todd JB, Parkes-Loach PS, McGlynnP, Olsen JD, McMaster L, Hunter CN and Loach PA (1997)Evaluation of the structure-function relationships in the corelight-harvesting complexes of photosynthetic bacteria by recon-stitution with mutant polypeptides. Biochemistry 36: 3672–3679
Francia F, Wang J, Venturoli G, Melandri BA, Barz WP and Oes-terhelt D (1999) The reaction center-LH1 antenna complex ofRhodobacter sphaeroides contains one PufX molecule whichis involved in dimerization of this complex. Biochemistry 38:6834–6845
Frese RN, Olsen JD, Branvall R, Westerhuis WHJ, Hunter CN andvan Grondelle R (2000) The longe-range supraorganization ofthe bacterial photosynthetic unit: A key role for PufX. Proc NatlAcad Sci USA 97: 5197–5202
Ghosh R, Hauser H and Bachofen R (1988) Reversible dissoci-ation of the B873 light-harvesting complex from Rhodospirillumrubrum G9+. Biochemistry 27: 1004–1014
Hu X and Schulten K (1998) Model for the Light-HarvestingComplex I B875 of Rhodobacter sphaeroides. Biophys 1 75:683–694
Jungas C, Ranck J-L, Rigaud J-L, Joliot P and Verméglio A (1999)Supramolecular organization of the photosynthetic apparatus ofRhodobacter sphaeroides. EMBO J 18: 534–542
Karrasch S, Bullough PA and Ghosh R (1995) The 8.5 A projec-tion map of the light-harvesting complex I for Rhodospirillumrubrum reveals a ring composed of 16 subunits. EMBO J 14:631–638
Koepke J, Hu X, Muenke C, Schulten K and Michel H (1996) Thecrystal structure of the light-harvesting complex II (B800-850)from Rhodospirillum molischianum. Structure 4: 581–597
Koolhaas MHC, van der Zwan G, van Mourik F and van GrondelleR (1997) Spectroscopy and structure of bacteriochlorophyll di-mers: structural consequences of non-conservative CD spectra.Biophys 172: 1828–1841
Loach PA and Parkes-Loach PS (1995) Structure-Function Relation-ships in Core Light-Harvesting Complexes (LHI) as Determinedby Characterization of the Structural Subunit and by Reconstitu-tion Experiments. In: Madigan MT, Bauer CD and Blankenschip

248
RE (eds), Anoxygenic Photosynthetic Bacteria, pp 437–471.Kluwer Academic Publishers, Dordrecht, The Netherlands
Loach PA, Parkes-Loach PS, Miller JF, Hinchigeri S andCallahan PM (1985) Structure-Function Relationships ofthe Bacteriochlorophyll-Protein Light-Harvesting Complex ofRhodospirillum rubrum. In: Arntzen C, Bogorad L, Bonitz Sand Steinback K (eds) Molecular Biology of the PhotosyntheticApparatus, pp 197–209. Cold Spring Harbor Laboratory, ColdSpring Harbor, New York
McDermott, G, Prince SM, Freer AA, Hawthornthwaite-LawlessAM, Papiz MZ, Cogdell RJ and Isaacs NW (1995) Crystal-structure of an integral membrane light-harvesting complex fromphotosynthetic bacteria. Nature 374: 517–521
Meadows KA, Iida K, Tsuda K, Recchia PA, Heller BA, AntonioB, Nango M and Loach PA (1995) Enzymatic and chemicalcleavage of the core light-harvesting polypeptides of photosyn-thetic bacteria: determination of the minimal polypeptide sizeand structure required for subunit and light-harvesting complexformation. Biochemistry 34: 1559–1574
Meckenstock RU, Krusche K, Brunisholz RA and Zuber H (1992)The light-harvesting core complex and the B820 subunit fromRps. Marina. I. Purification and characterization. FEBS Lett 311:128–134
Miller JF, Hinchigeri SB, Parkes-Loach PS, Callahan PM, SprinkleJR, Riccobono JR and Loach PA (1987) Isolation and charac-terization of a subunit form of the light-harvesting complex ofRhodospirillum rubrum. Biochemistry 26: 5055–5062
Olsen JD, Sturgis JN, Westerhuis WHJ, Fowler GJS, Hunter CNand Robert B (1997) Site-directed modification of the ligandsto the bacteriochlorophylls of the light-harvesting LH1 andLH2 complexes of Rhodobacter sphaeroides. Biochemistry 36:12625–12632
Pandit A, Visschers RW, van Stokkum IHM, Kraayenhof R andvan Grondelle R (2001) Oligomerization of light-harvesting Iantenna peptides of Rhodospirillum rubrum. Biochemistry 40:12913–12924
Parkes-Loach PS, Sprinkle HJR and Loach PA (1988) Reconstit-ution of the B873 light-harvesting complex of Rhodospirillumrubrum from the separated isolated α and β-polypeptides andBacteriochlorophyll a. Biochemistry 27: 2718–2727
Parkes-Loach PS, Michalski TJ, Bass WJ, Smith U and LoachPA (1990) Probing the bacteriochlorophyll binding site by re-constitution of the light-harvesting complex of Rhodospirillumrubrum with bacteriochlorophyll a analogues. Biochemistry 29:2951–2960
Sturgis J and Robert B (1994) Thermodynamics of membranepolypeptide oligomerization in light-harvesting complexes andassociated structural changes. J Mol Biol 238: 445–454
Sturgis JN, Olsen JD, Robert B and Hunter CN (1997) Functions ofconserved tryptophan residues of the core light-harvesting com-plex of Rhodobacter sphaeroides. Biochemistry 36: 2772–2778
Visschers RW, Chang MC, van Mourik F, Parkes-Loach PS, HellerBA, Loach PA and van Grondelle R (1991) Fluoresence polariz-ation and low-temperature absorption spectroscopy of a subunitform of light-harvesting complex I from purple photosyntheticbacteria. Biochemistry 30: 2951–2960
Visschers RW, Nunn R, Calkoen F, van Mourik F, Hunter CN,Rice DW and van Grondelle R (1992) Spectroscopic charac-terization of B820 subunits from light-harvesting complex I ofRhodospirillum rubrum and Rhodobacter sphaeroides preparedwith the detergent n-octyl-rac-2,3-dipropylsulfoxide. BiochimBiophys Acta 1100: 259–266
Visschers RW, van Mourik F, Monshouwer R and van Grondelle R(1993) Inhomogeneous spectral broadening of the B820 subunitform of LH1. Biochim Biophys Acta 1141: 238–244
Westerhuis WHJ, Hunter CN, van Grondelle R and Niederman RA(1999) Modeling of oligomeric-state dependent spectral hetero-geneity in the B875 light-harvesting complex of Rhodobactersphaeroides by numerical simulation. J Phys Chem B 103:7733–7742
van Grondelle R, Dekker JP, Gillbrö T and Sundström V (1994) En-ergy transfer and trapping in photosynthesis. Biochim BiophysActa 1187: 1–65
van Mourik F, van der Oord CJR, Visscher KJ, Parkes-Loach PS,Loach PA, Visschers RW and van Grondelle R (1991) Excitoninteractions in the light-harvesting antenna of photosyntheticbacteria studied with triplet-singlet spectroscopy and singlet-triplet annihilation on the B820 subunit form of Rhodospirillumrubrum. Biochim Biophys Acta 1059: 111–119
van Mourik F, Corten EPM, van Stokkum IHM, Visschers RW,Loach PA, Kraayenhof R and van Grondelle R (1992) Selfassembly of the LH-1 antenna of Rhodospirillum rubrum, a time-resolved study of the aggregation of the B820 subunit form. In:Murata N (ed) Research in Photosynthesis, pp 101–104. KluwerAcademic Publishers, Dordrecht, The Netherlands
van Stokkum IHM, Linsdell H, Hadden JM, Hans PI, Chapman Dand Bloemendal M (1995) Temperature-induced changes in pro-tein structures studied by fourier transform infrared spectroscopyand global analysis. Biochemistry 34: 10508–10518