investigations of power quality problems in modern buildings
TRANSCRIPT
i
INVESTIGATIONS OF POWER QUALITY
PROBLEMS IN MODERN BUILDINGS
A thesis presented for the degree of Master of Philosophy
By
Abraham Olatoke
Brunel University
School of Engineering and Design
January 2011
ii
ABSTRACT
This thesis presents the results of measurements made in a typical office building
(Tower A) and a Residential building (Kilmorey Hall), all located in the campus of
Brunel University, West London for period of one week. The collected data were
statistically treated to establish the best period that characterizes the harmonic
distortions and other disturbances in these buildings. The chosen period was considered
as best to get the correct harmonic distortions in the day, and at a specific interval. One
phase was also chosen to represent the others after some considerations.
The frequency of measurement was also noted. All the data collected were evaluated
based on the limits proposed by International Standards: European, IEEE, and G4/5
Recommendations. Comparisons of the collected data were made between these two
buildings. For the purpose of this project, the statistical treatment of the collected data
characterizing the voltage harmonics was considered. The period of 9am to 5pm on a
week day (Tuesday 26th
October) was best for Tower A as it had the highest loading
pattern for the week. This is a day-load establishment, because it is an office building.
The period for Kilmorey Hall was Monday 1st November between the hours of 6pm up
to 11pm, being considered as wholly residential building. All readings were spaced at
8minutes interval for frequency of measurement.
The methodology presented in this project is useful for quantification and qualification
of the harmonic distortion of voltage and current. It is estimated that more than 30% of
the power currently being drawn from the utility companies is now consumed by
sensitive non- linear load, and still increasing, both industrially and commercially [20].
Non- linear load is steadily increasing in residential areas also. The effect of
continuous overvoltage was also considered even though the overvoltage was within the
International Standards. The result was proved to cause unnecessary and unwanted
overconsumption. This could not be helping to reduce carbon emission.
Effects of Compact Fluorescent Lamps with electronic gears (CFLs) were also
investigated as a rising source of harmonic production in Modern buildings.

iii
ACKNOWLEGEMENTS
The author of this work is greatly indebted to his supervisor, Dr. Mohamed Darwish,
for his untiring advice and encouragement.
I thank the staff and my colleagues at the Brunel research group, especially members of
Room 306 for their technical support and friendship.
Finally I thank my family for their support morally and financially.

iv
CONTENTS
Chapter 1 Introduction 1
1.1 Overview 2
1.2 Why is the concern about electric power quality 2
1.3 The main aim and the objectives of this research work 3
Chapter 2 Literature review 4
2.1 Power quality problems Overview 5
2.2 Types of power quality problems (voltage variation) 6
2.2.1 Transients 6
2.2.2 Short duration voltage variations 8
2.2.2.1 Interruption 9
2.2.2.2 Sag waveform 10
2.2.2.3 Swells 10
2.2.3 Long-duration voltage variation Steady state variation 11
2.2.3.1 Long-duration (sustained) interruption 11
2.2.3.2 Undervoltages 12
2.2.3.3 Overvoltages 12
2.2.4 Other steady state waveform variations 13
2.2.4.1 Harmonics 13
2.2.4.2 Origin of harmonics 16
2.2.4.3 Effect of Compact Fluorescent Lamps (CFLs) 17
2.2.5 Flicker 18
2.3 Power quality problems (disturbances) 18
2.3.1 Categorising some of the power quality problems 19

v
2.3.2 International characteristics for voltage control 19
2.3.3 Effects of harmonics in Modern Buildings 21
2.4 An Overview of International Power Quality Standards 22
2.4.1 EN50160 23
2.4.2 IEC (61000-2-2; 61000-2-3; 61000-3-2; 61000-3-4) 23
2.4.3 Comparison of different International Standards 24
2.4.3.1 Scope and Coverage of respective Standards 24
2.4.3.2 Evaluation of Voltage Distortion 25
2.4.3.3 Evaluation of Current Distortion 26
2.5 Mitigation techniques of Power System harmonics 27
2.5.1 Passive Filters 27
2.5.2 Active Harmonic Filters 28
2.5.3 Hybrid „Passive/Active‟ Harmonic Filters 29
2.6 Redefining types of Power Quality (PQ) problems 31
2.6.1 Introduction 31
2.6.2 Electromagnetic Definitions of PQ problems 31
2.7 Power consumption in different types of load 35
2.7.1 Power consumption in Passive load 35
2.7.2 Power consumption in Gas Discharge Lamp load 35
2.7.3 Power consumption in Electromagnetic load 36
2.7.4 Power consumption in Active load 37
2.7.5 Summary of the effect of Power consumption in different load 37
2.8 Power Factor analysis 38
2.8.1 Power Factor analysis in Linear systems 39
2.8.2 Power Factor analysis in non-linear systems 40
vi
2.9 Power Quality Analyzer 44
2.10 Typical single-line diagram of a feeder circuit 45
2.11 Summary 46
Chapter 3 Power Quality in Buildings (Case Studies No. 1 - Tower ‘A’ &
Howell building-Brunel University) 47
3.1 Introduction 48
3.2 Types of loads in all modern buildings 48
3.3 Power quality in Tower „A‟ & Howell Buildings 49
3.3.1 Real, Apparent, and Reactive power analysis 50
3.3.2 Current waveform analysis 51
3.3.3 Line voltage waveform analysis 54
3.3.4 Phase voltage waveform analysis 55
3.3.5 Total harmonic distortions voltage waveform analysis 57
3.3.6 Total harmonic distortions current waveform analysis 57
3.3.7 The Reactive loading of Tower A office building 59
3.4 Summary 60
Chapter 4 Power Quality in Buildings (Case Studies No. 2 - Kilmorey Residence
Hall building-Brunel University) 62
4.1 Introduction 63
4.2 Line voltage analysis 64
4.3 Current Total Harmonic Distortion 66
4.4 Voltage and Current Variations 68
vii
4.4.1 Voltage Variations 68
4.4.2 Current Variations 69
4.5 Active, Reactive and Apparent Power 70
4.6 Harmonic Distortions in Kilmorey Hall 71
4.6.1 Current Harmonic Distortion 72
4.6.2 Voltage Harmonic Distortion 73
4.7 Short-term Flicker 74
4.8 Summary 75
Chapter 5 Characterizing the THD of Tower ‘A’ (Office) &
Kilmorey (Residential) Buildings 76
5.1 Introduction 77
5.2 Statistical Comparison of Tower „A‟ and Kilmorey Hall 77
5.2.1 Phase Similarity – Graphic Comparison 78
5.2.2 Mean Value and Standard Deviation Analysis 79
5.2.3 P 95% Analysis 80
Chapter 6 Conclusions and Future Work
6.1 Conclusions 83
6.2 Future Work 85
References 86
Appendix A: C.A 8335 Power quality Analyser 92
Appendix B: List of International Power Quality Standards 96

viii
ABBREVIATIONS
AC Current Alternating
PQ Power Quality
THD Total Harmonic Distortion
THDV Voltage Total Harmonic Distortion
THDI Current Total Harmonic Distortion
MV Medium Voltage
PCC Point of Common Coupling
LV Low Voltage
CFLs Compact Fluorescent Lamps
ASD Adjustable Speed Drive
ATM Automated Tele Machine
Vrms Single phase supply voltage
RMS Root Mean Square
Urms Three phase supply voltage
UPS Uninterrupted Power Supply
PFtrue True Power Factor
ix
PF Power Factor
PFC Power Factor Correction
PFdisp Displacement Power Factor
PFdist Distortion Power Factor
DG Distributed Generation
KVAR Reactive Power
SMPS Switch Mode Power Supply
EPRI Electric Power Research Institute
IEEE Institute of Electrical Electronic Engineering
IEC International Electrotechnical Engineering
ANSI American National Standards Institute
NEMA National Electrical Manufacturers‟ Association
µs microsecond
ns nanosecond
ms millisecond
sec second
p.u. per unit values
f frequencies
f1 fundamental frequency (50Hzs)

1
Chapter 1
Introduction
2
1.1 Overview
Almost all modern commercial buildings take their supplies at 415 volts from the
secondary of the delta/ star connected 11kV/415V transformers. In recent years a large
number of distorting, non-linear load such as computer equipments have been
extensively used in commercial buildings. The result of using such highly non-linear
load is that the current waveform is distorted, causing excessive harmonic voltages to
be generated. Although modern non-linear loads such as computer equipments are
small in size (power consumption), but they are large in number. For example a 3 floor
building could have as many as 300 PCs. Also the close proximity of many of these
commercial buildings (Hotels, offices, departmental stores, shopping centres, and
hospitals) will definitely contribute to the distortion of the electric power quality of
feeder which supplies these buildings.
1.2 Why is the concern about electric power quality?
According to a Copper Development Association survey, it is estimated that power
quality problems cost industry and commerce in the EU about €10 billion per year [1].
This figure goes to $ 50 billion per year in the USA as a result of power quality
breakdown [2]. For example, a manufacturing company lost more than $ 3 million in
one day in the summer of 1999 in Silicon Valley when the “lights went out” [3].
Another example, a Voltage sag in a paper mill can waste a whole day of production of
about $ 250,000 loss [4]. Also half of all computer problems and one-third of all data
loss can be traced back to the power line [5]. Another important issue is that the
electric utility is concerned about power quality issues because meeting customer
expectations and maintaining customer confidence are strong motivators in particularly
with the movement toward deregulation and the fierce competition between utilities.
3
1.3 The Main aim and objectives of this research work
With such high cost of poor power quality as shown in section 1.2, researchers have
developed so many technical solutions to eliminate or at least to reduce the impacts of
poor power quality on modern buildings. Such solutions consist of the design of
passive and active filters as well as designing switching regulators for computer power
supplies. However, to install such power quality correction devices, people working in
the building industry must first be aware of the problem and appreciate the cost of the
problem as well as knowing the cost of the solutions. They should also be aware of the
power quality components and the regulations for each of these components. The main
aim of this research work is to look at the power quality problems in modern
commercial buildings so that building designers can be aware of the challenges required
in such buildings. Once they are aware of the problem, the decision to install or not
install correction devices could be clearly made.
In order to achieve this main aim, the following objectives are followed:
- Understanding the power quality terminology; this is covered in the literature
review in chapter 2.
- Two case studies are introduced in chapters 3 and 4. The data of the power quality
in a typical office building were measured and analysed in chapter 3. Some
statistical investigations applied to these data are analysed. Chapter 4 contains
measurements and analysis of a residential university building. The two case
studies give a balance picture of power quality in modern buildings, or to be more
precise, in buildings with modern loads.
- The characterisation of the data analysed in chapters 3 and 4 is presented in chapter
5 with some recommendations.
- The conclusions and future work are presented in chapter 6.
4
Chapter Two
Literature Review

5
2.1 Power Quality Problems Overview
Power is the product of voltage and current. The grid system has control over the
voltage quality only and not on the current that a customer demands. The monitoring of
Electric Power Quality has become an important tool to detect problems affecting
electrical installation and equipments alike. Effective power quality monitoring can
prevent future problems that could cause damage of equipments or premature aging of
the electrical parts like transformers, circuit breakers and the wiring cables. Therefore,
power quality standards concern the supply voltage being maintained within certain
limits only from the Utility point of view. AC power systems are designed to operate at
a sinusoidal voltage of 50Hz or 60Hz. The power frequency in Europe is 50Hz and it is
60Hz in America. Frequency variations are very rare in modern interconnected
systems, but are more likely in isolated generation where the generator‟s governor
cannot respond as quickly to the load variations. Any unacceptable deviation in the
waveform magnitude, frequency or purity is regarded as a power quality problem. The
current is the real vital component (since power is a product of voltage and current),
there is need to address problems of current when considering power quality problems,
since the voltage is usually dictated by Utility system which is beyond the control of the
end-user. Poor Power Quality leads to increased electricity consumption and equipment
failure. Symptoms like equipment overheating may be due to different causes like
harmonics, unbalance, and overloading apart from consistent overvoltage. Focus is
now on efficient operations, and reducing energy costs, which is the reason for
Renewable Energy; Power Quality should be treated with the greatest attention. This
chapter deals with the different types of power quality problems as they affect modern
commercial buildings. There are two types of PQ variations, Disturbances and Steady
State Characteristics.
6
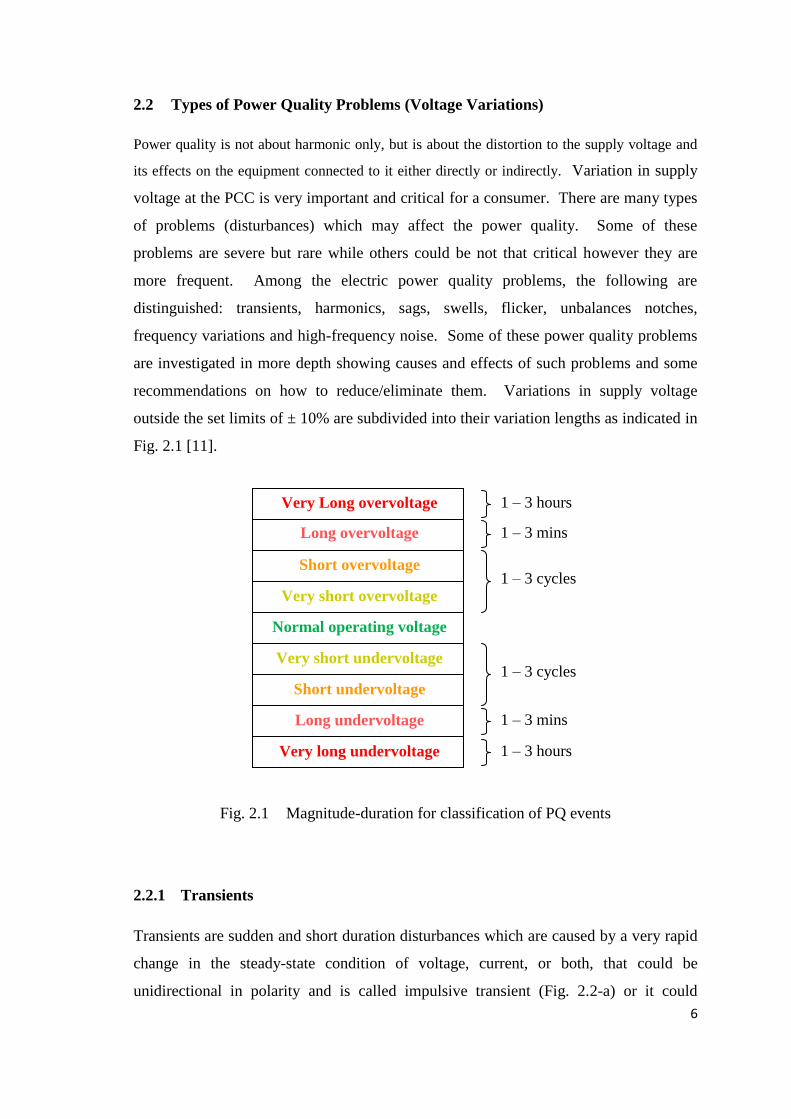
2.2 Types of Power Quality Problems (Voltage Variations)
Power quality is not about harmonic only, but is about the distortion to the supply voltage and
its effects on the equipment connected to it either directly or indirectly. Variation in supply
voltage at the PCC is very important and critical for a consumer. There are many types
of problems (disturbances) which may affect the power quality. Some of these
problems are severe but rare while others could be not that critical however they are
more frequent. Among the electric power quality problems, the following are
distinguished: transients, harmonics, sags, swells, flicker, unbalances notches,
frequency variations and high-frequency noise. Some of these power quality problems
are investigated in more depth showing causes and effects of such problems and some
recommendations on how to reduce/eliminate them. Variations in supply voltage
outside the set limits of ± 10% are subdivided into their variation lengths as indicated in
Fig. 2.1 [11].
Fig. 2.1 Magnitude-duration for classification of PQ events
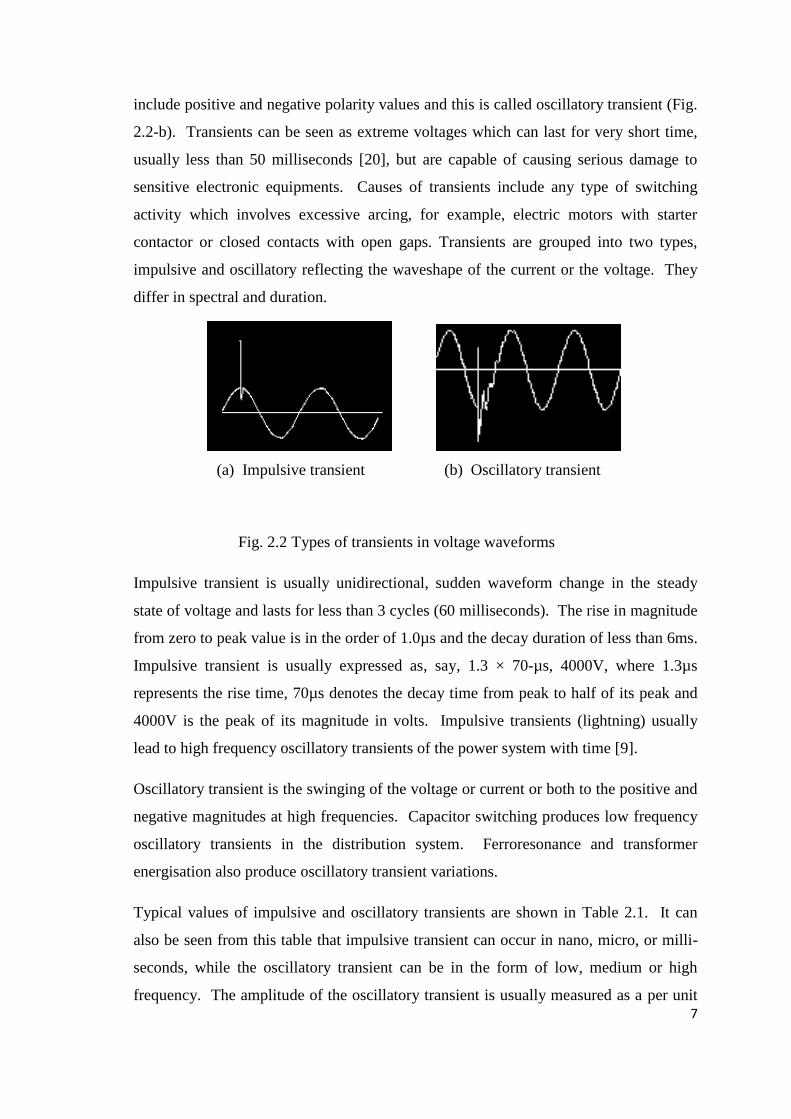
2.2.1 Transients
Transients are sudden and short duration disturbances which are caused by a very rapid
change in the steady-state condition of voltage, current, or both, that could be
unidirectional in polarity and is called impulsive transient (Fig. 2.2-a) or it could
Normal operating voltage
Very short undervoltage
Short undervoltage
Long undervoltage
Very long undervoltage
1 – 3 cycles
1 – 3 cycles
1 – 3 mins
1 – 3 mins
1 – 3 hours
1 – 3 hours
Very Long overvoltage
Long overvoltage
Short overvoltage
Very short overvoltage
7
include positive and negative polarity values and this is called oscillatory transient (Fig.
2.2-b). Transients can be seen as extreme voltages which can last for very short time,
usually less than 50 milliseconds [20], but are capable of causing serious damage to
sensitive electronic equipments. Causes of transients include any type of switching
activity which involves excessive arcing, for example, electric motors with starter
contactor or closed contacts with open gaps. Transients are grouped into two types,
impulsive and oscillatory reflecting the waveshape of the current or the voltage. They
differ in spectral and duration.
Fig. 2.2 Types of transients in voltage waveforms
Impulsive transient is usually unidirectional, sudden waveform change in the steady
state of voltage and lasts for less than 3 cycles (60 milliseconds). The rise in magnitude
from zero to peak value is in the order of 1.0µs and the decay duration of less than 6ms.
Impulsive transient is usually expressed as, say, 1.3 × 70-µs, 4000V, where 1.3µs
represents the rise time, 70µs denotes the decay time from peak to half of its peak and
4000V is the peak of its magnitude in volts. Impulsive transients (lightning) usually
lead to high frequency oscillatory transients of the power system with time [9].
Oscillatory transient is the swinging of the voltage or current or both to the positive and
negative magnitudes at high frequencies. Capacitor switching produces low frequency
oscillatory transients in the distribution system. Ferroresonance and transformer
energisation also produce oscillatory transient variations.
Typical values of impulsive and oscillatory transients are shown in Table 2.1. It can
also be seen from this table that impulsive transient can occur in nano, micro, or milli-
seconds, while the oscillatory transient can be in the form of low, medium or high
frequency. The amplitude of the oscillatory transient is usually measured as a per unit
(a) Impulsive transient (b) Oscillatory transient

8
(p.u) of the nominal voltage value, while the amplitude of the impulsive is given as a
direct rms voltage or current.
(1) Impulsive Typical Spectral
Content Typical Duration
Typical Voltage
Magnitude
(a) Nanosecond
(b) Microsecond
(c) millisecond
5ns rise
1µs rise
0.1ms rise
< 50 ns
50ns – 1ms
> 1ms
In rms voltage or
current at power
frequency
(2) Oscillatory
(a) Low
(b) Medium
(c) High frequency
< 5kHz
5 – 500kHz
0.5 – 5MHz
0.3 – 50ms
20µs
5µs
0 – 4pu
0 – 8pu
0 – 4pu
Table 2.1 Transient Categorization (1) Impulsive and (2) Oscillatory
2.2.2 Short-Duration Voltage Variations
Short duration interruptions are less than 1minute, while Long duration interruptions are
longer than 1minute. There are three types of short-duration variations, Instantaneous
(0.5-30cycles), momentary (30cycles-2seconds), and temporary (2senconds-2minutes)
as defined by IEEE-1159 [9]. Other Institutions call these types of variations „voltage
dips‟ and „short interruptions.‟ Each of the three types is subdivided into „interruption‟,
„sag‟ and „swell.‟ Causes of short-duration voltage variations could include loose
connections, faults and load switching [11]. All the three types are further subdivided
into interruption, sag and swell, usually in the duration domain and magnitudes. Table
2.2 shows the duration of the interruption, sags and swells and how they are classified
as instantaneous, momentary and temporary. In general sag can be classified as any

9
amplitude between 0.1 and 0.9 p.u., less than 0.1 p.u is known as interruption and more
than 1.1 p.u is classified as swell.
(a) Interruption (b) Sag (c) Swell
Instantaneous 0.5 – 30cycles
< 0.1pu
0.5 – 30cycles
0.1 – 0.9pu
0.5 – 30cycles
1.1 – 1.8pu
Momentary 0.5 – 3secs
<0.1pu
30 cycles – 3secs
0.1 – 0.9pu
30 cycles – 3secs
1.1 – 1.4pu
Temporary 3secs – 1min
<0.1pu
3secs – 1min
0.1 – 0.9pu
3secs – 1min
1.1 – 1.2pu
Table 2.2 Types of short duration variation
2.2.2.1 Interruption
Fig. 2.3 Interruption waveform
Interruption could be for short period (either very short or temporary), or could be for a
longer period which is discussed in section 2.2.3. Fig. 2.3 shows a very short and
temporary interruptions which could last for any period up to 3 seconds (very short
interruption) or up to 60 seconds (temporary). Causes of very short or temporary
(a) Very short interruption (b) Temporary interruption
10
interruptions include temporary faults that last for a short time and these usually result
in computer and other electronic equipment shutting down.
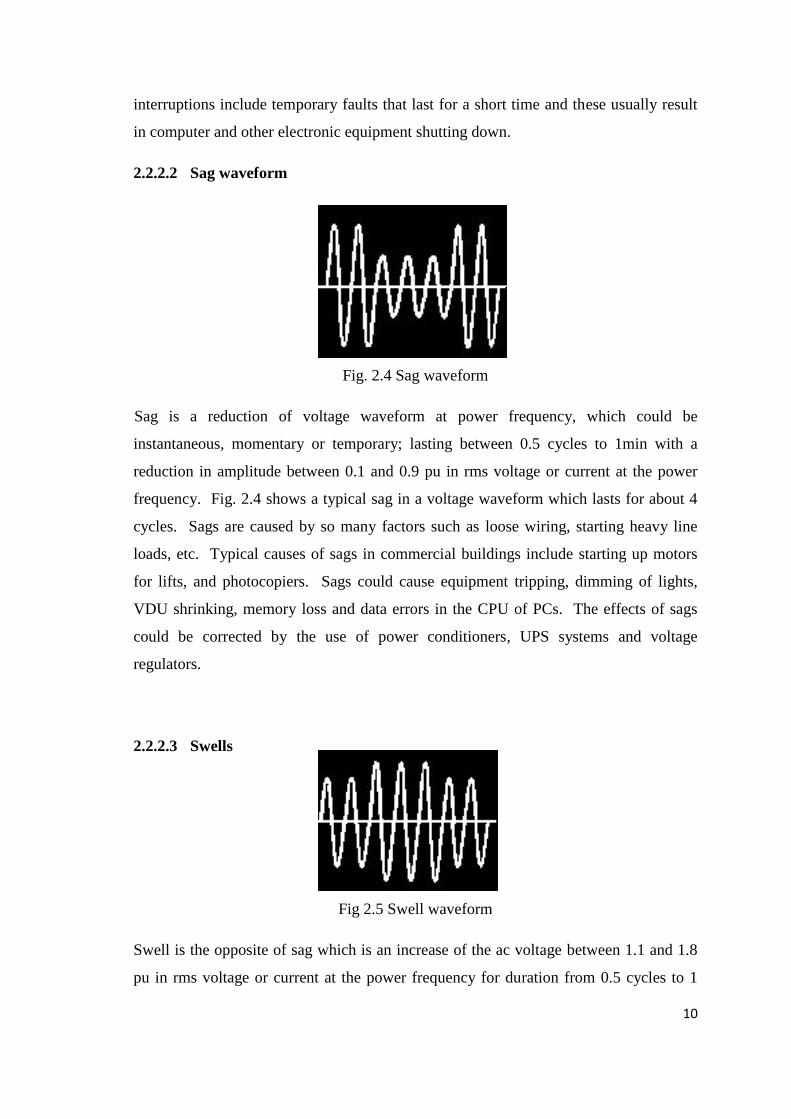
2.2.2.2 Sag waveform
Fig. 2.4 Sag waveform
Sag is a reduction of voltage waveform at power frequency, which could be
instantaneous, momentary or temporary; lasting between 0.5 cycles to 1min with a
reduction in amplitude between 0.1 and 0.9 pu in rms voltage or current at the power
frequency. Fig. 2.4 shows a typical sag in a voltage waveform which lasts for about 4
cycles. Sags are caused by so many factors such as loose wiring, starting heavy line
loads, etc. Typical causes of sags in commercial buildings include starting up motors
for lifts, and photocopiers. Sags could cause equipment tripping, dimming of lights,
VDU shrinking, memory loss and data errors in the CPU of PCs. The effects of sags
could be corrected by the use of power conditioners, UPS systems and voltage
regulators.
2.2.2.3 Swells
Fig 2.5 Swell waveform
Swell is the opposite of sag which is an increase of the ac voltage between 1.1 and 1.8
pu in rms voltage or current at the power frequency for duration from 0.5 cycles to 1
11
min. Swell can also last between 0.5 cycles to 1minute as shown in Fig. 2.5. Causes
include single line to ground faults; loose wiring, sudden large load dropping, and
inrush current are other forms of causes of swell. Problems caused by swell are very
few, but if prolonged it becomes over-voltage. Equipment damage results if voltage
rises above 6 to 10% of the normal voltage, affecting motors electronic loads,
transformers and florescent lights over-humming. Lighting becomes over – bright,
VDU display shrinks and data errors results. Sensitive equipments could equally
shutdown. Solutions to swells also could include the use of power conditioners, UPS
systems and voltage regulators.
2.2.3 Long – Duration Voltage Variations – Steady State Variations
There are three types of long duration voltage variations as classified by IEEE and IEC
[25]. They are sustained interruption, undervoltages and overvoltage. The IEEE
regards any interruption longer than 1minute as long duration, while the IEC takes it to
be 3minutes. Mostly all long duration variations are caused by system switching
operations. Two of the most common PQ standards in use today are EN 50160 [16] and
IEC 61000-4 [13],
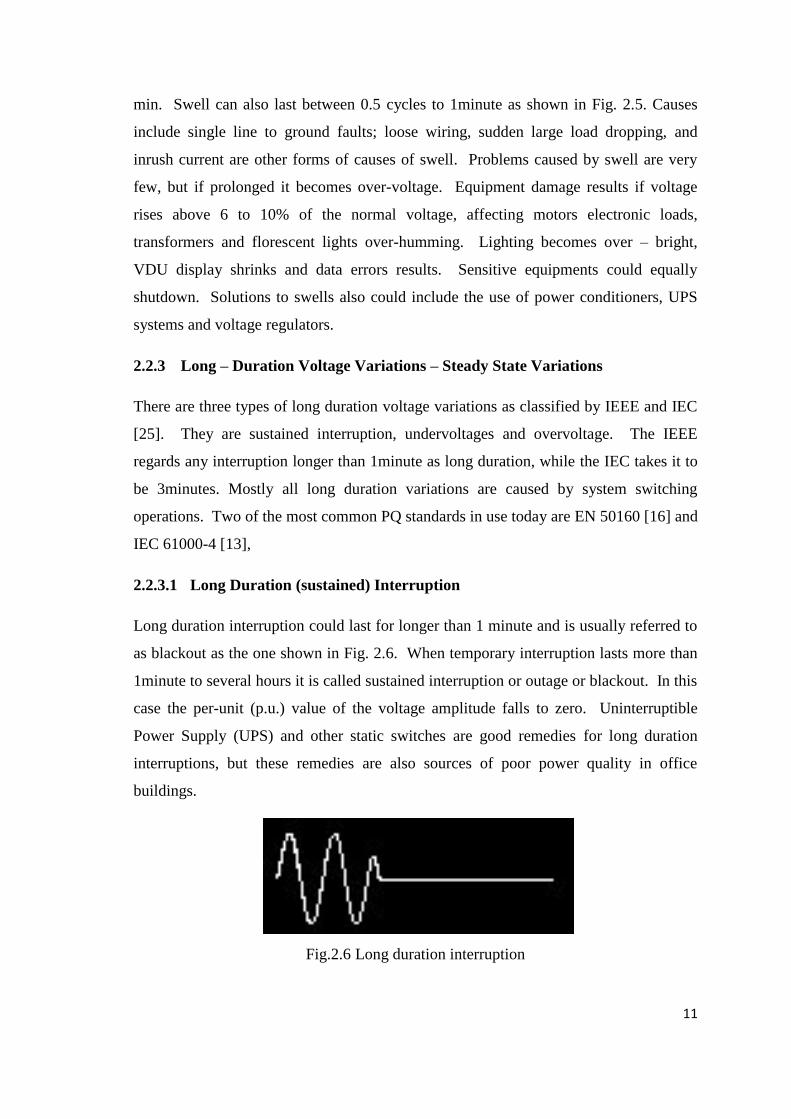
2.2.3.1 Long Duration (sustained) Interruption
Long duration interruption could last for longer than 1 minute and is usually referred to
as blackout as the one shown in Fig. 2.6. When temporary interruption lasts more than
1minute to several hours it is called sustained interruption or outage or blackout. In this
case the per-unit (p.u.) value of the voltage amplitude falls to zero. Uninterruptible
Power Supply (UPS) and other static switches are good remedies for long duration
interruptions, but these remedies are also sources of poor power quality in office
buildings.
Fig.2.6 Long duration interruption
12
Long or sustained interruption occurs when the system fails to return automatically after
interruption until it is helped by external means, for example, circuit breakers. This
type of interruption is caused by forced or planned outages in the system.
2.2.3.2 Undervoltages
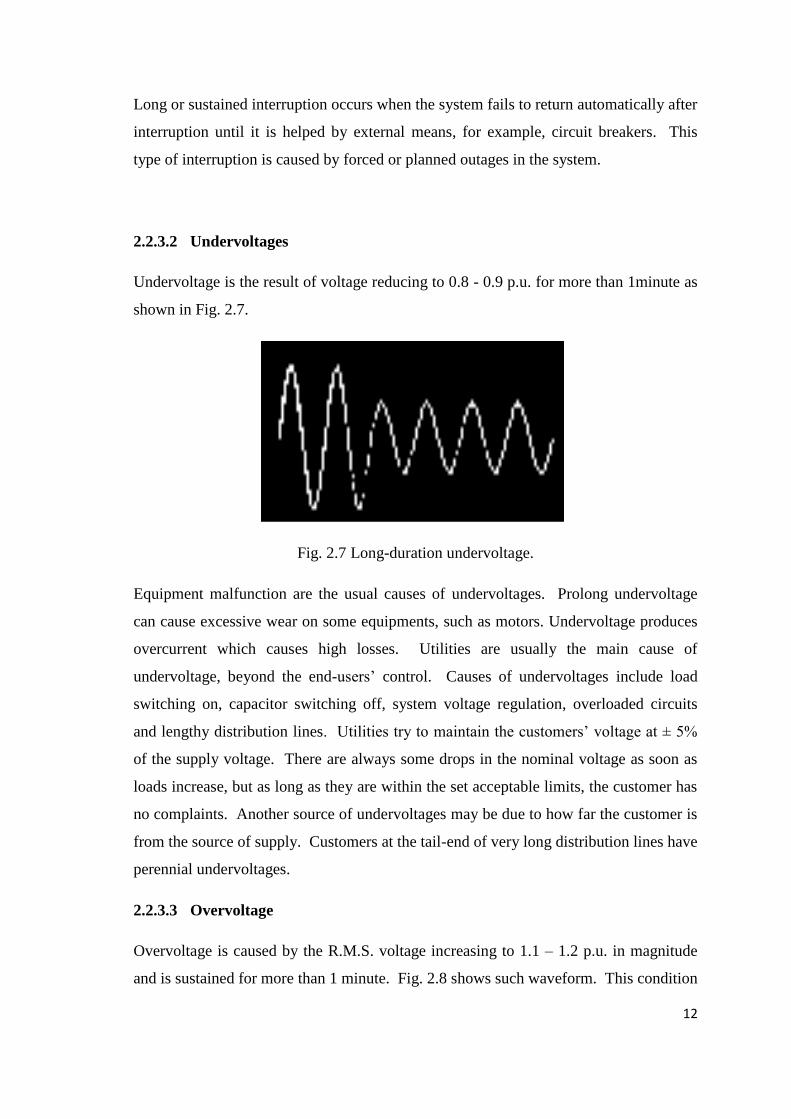
Undervoltage is the result of voltage reducing to 0.8 - 0.9 p.u. for more than 1minute as
shown in Fig. 2.7.
Fig. 2.7 Long-duration undervoltage.
Equipment malfunction are the usual causes of undervoltages. Prolong undervoltage
can cause excessive wear on some equipments, such as motors. Undervoltage produces
overcurrent which causes high losses. Utilities are usually the main cause of
undervoltage, beyond the end-users‟ control. Causes of undervoltages include load
switching on, capacitor switching off, system voltage regulation, overloaded circuits
and lengthy distribution lines. Utilities try to maintain the customers‟ voltage at ± 5%
of the supply voltage. There are always some drops in the nominal voltage as soon as
loads increase, but as long as they are within the set acceptable limits, the customer has
no complaints. Another source of undervoltages may be due to how far the customer is
from the source of supply. Customers at the tail-end of very long distribution lines have
perennial undervoltages.
2.2.3.3 Overvoltage
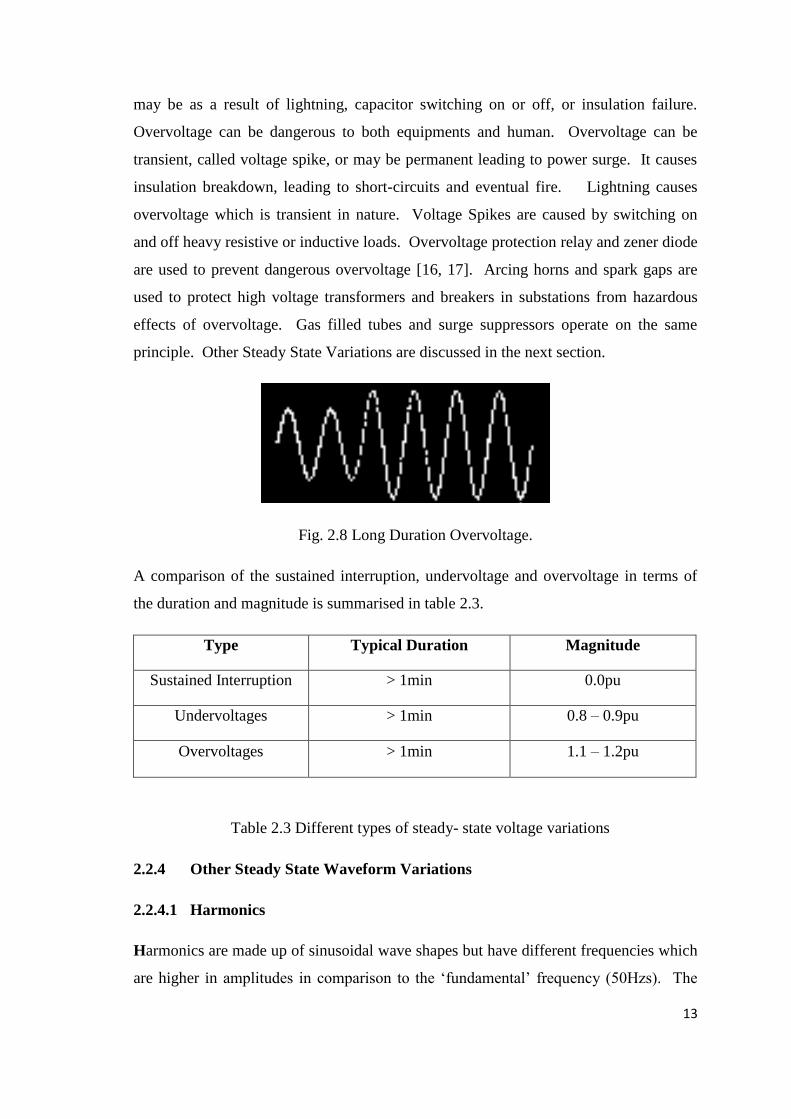
Overvoltage is caused by the R.M.S. voltage increasing to 1.1 – 1.2 p.u. in magnitude
and is sustained for more than 1 minute. Fig. 2.8 shows such waveform. This condition
13
may be as a result of lightning, capacitor switching on or off, or insulation failure.
Overvoltage can be dangerous to both equipments and human. Overvoltage can be
transient, called voltage spike, or may be permanent leading to power surge. It causes
insulation breakdown, leading to short-circuits and eventual fire. Lightning causes
overvoltage which is transient in nature. Voltage Spikes are caused by switching on
and off heavy resistive or inductive loads. Overvoltage protection relay and zener diode
are used to prevent dangerous overvoltage [16, 17]. Arcing horns and spark gaps are
used to protect high voltage transformers and breakers in substations from hazardous
effects of overvoltage. Gas filled tubes and surge suppressors operate on the same
principle. Other Steady State Variations are discussed in the next section.
Fig. 2.8 Long Duration Overvoltage.
A comparison of the sustained interruption, undervoltage and overvoltage in terms of
the duration and magnitude is summarised in table 2.3.
Type Typical Duration Magnitude
Sustained Interruption > 1min 0.0pu
Undervoltages > 1min 0.8 – 0.9pu
Overvoltages > 1min 1.1 – 1.2pu
Table 2.3 Different types of steady- state voltage variations
2.2.4 Other Steady State Waveform Variations
2.2.4.1 Harmonics
Harmonics are made up of sinusoidal wave shapes but have different frequencies which
are higher in amplitudes in comparison to the „fundamental‟ frequency (50Hzs). The
14
fundamental frequency is generated by all electrical utilities and this is what carries all
useful power. Harmonic distortion is measured using a term called Total Harmonic
Distortion (THD) of current or voltage. This gives an indication of how much
distortion is present in terms of a percentage of the fundamental.
The worst waveform distortions are the Harmonics. Other forms are, Interharmonics,
Notching, Noise, and DC offset. The way harmonics interfere with networks need be
studied to avoid dangerous resonant frequencies with power factor correction capacitors
in the network. Increased losses are also noted when harmonic currents flow in the
network, which makes equipments to age faster due to insulation breakdown.
Harmonic currents usually lead to voltage harmonics because of system impedances as
V= iR and since current does no useful work it only leads to losses. Power factor
deteriorates when harmonics are present because apparent power increases while the
real useful power remains constant. Interference with control and communication
systems is likely. The voltage and current quality in the steady state are determined by
the different harmonics present. The sources of harmonic currents are increasing as
non-linear equipments are varied and wide- spread. [35]
Harmonics formation is the summation of many frequency waveforms, Fig. 2.9 is made
up of three frequencies but may contain up to 50 frequencies or more, for example, the
International Standards EN50160 frequency measurement stops at 40th
harmonic level.
All these frequencies are the odd-multiples of the fundamental as the even harmonics
do not exist because they cancel out because of the natural symmetry of the ac system,
except when there is a dc offset.
Each of these harmonic frequencies is sinusoidal in waveform having different cycles
per second, but their summation is not sinusoidal but periodic.

15
Fig. 2.9 Waveforms showing the fundamental, 3rd
& 5th
harmonics [48]
Most recently, non-linear loads are designed to have low distortion values. Harmonic current
sources are these non-linear loads and their limit is based on the type and size of the load with
respect to the source to which they are connected.
Fig. 2.10 Summation of the harmonic frequencies [48].
The sum of the harmonic frequencies, fundamental, 3rd
and 5th
are shown in Fig. 2.10.
This is a distorted waveform and any equipment that are sensitive to distorted
waveform will malfunction. The summation of the harmonic frequencies originate
from the currents drawn by the non-linear load which are non sinusoidal but periodic,
but the fundamental frequency is generated by the Utility (suppplier). It is this
fundamental that carries all the useful power. Each harmonic waveshape is sinusoidal,
having different frequency and amplitudes in comparison to the fundamental frequency
(50Hz) but the summation is not. Harmonic distortion is measured, using the term
known as Total Harmonic Distortion (THD) of current and voltage. This gives an
16
indication of how much distortion is present in terms of a percentage of the
fundamental.
2.2.4.2 Origin of Harmonics
The main cause of harmonics is the non-linear loads in the user‟s premises. The current
waveshape is not sinusoidal like the supplied voltage, but periodic (Fig. 2.10). The
usual element in the non-linear load is the power rectifier, which pulls current in sharp,
irregular (non-linear) pulses instead of smooth linear way [33] [35]. The computer is a
typical example of harmonic generator, and the computers are increasing in leaps and
bonds in mordern office buildings. Other sources include fax machines, photocopiers
and laser printers. All these equipments contain switch mode power supplies (SMPS)
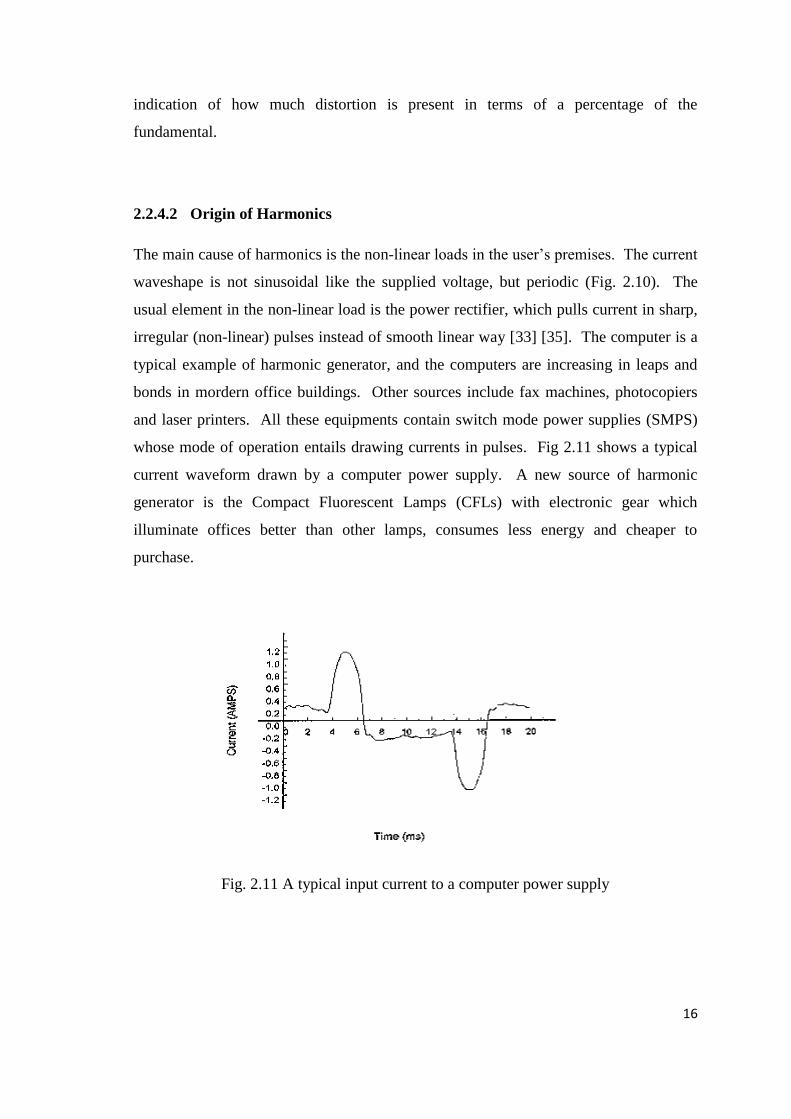
whose mode of operation entails drawing currents in pulses. Fig 2.11 shows a typical
current waveform drawn by a computer power supply. A new source of harmonic
generator is the Compact Fluorescent Lamps (CFLs) with electronic gear which
illuminate offices better than other lamps, consumes less energy and cheaper to
purchase.
Fig. 2.11 A typical input current to a computer power supply

17
2.2.4.3 Effect of Compact Fluorescent Lamps (CFLs)
A well lit Modern building should be discussed at this stage. One of the major power
quality problems of a modern building is the use of CFLs. The effect of other big non-
linear loads has been well studied over a long time. CFLs with electronic gear are new
on the scene of harmonic generators characterised by extremely distorted current with
high THDI. They cause a significant distortion in electrical installations, when large
quantities are installed in Commercial buildings. Their maximum permissible share of
the total installed load in commercial establishment must be characterised to follow
International Standards. Their maximum permissible share should not exceed the 10%
limit as laid down by the International Standards. [36]. Therefore the quantity of CFLs
would be restricted or the use of filters must be adopted. It is a well known fact that
CFLs are long-lasting and they consume less energy than incandescent lamps with
equivalent luminous output. The greatest problem that they cause for the network is
voltage distortion, when used as a major source of illumination in Commercial
establishments. The summation of the effect of CFLs in large group of residential
homes, connected to an 11kv feeder could cause THDV higher than the accepted level
of 6.5% [36]. This could be another future case study.
Generally, IEEE – 519 recommends the limits of 5% to 20% maximum harmonic
distortion in % of the load current. The size of the harmonic load to the total load
should be determined periodically to make sure that the International Standards are not
transgressed [10, 35].
The International Electrotechnical Commission IEC 555-2 sets the highest limits on
current harmonic distortion generated by equipment connected to the public supply
system at 5%. [15, 32]
Power factor correction capacitors are not designed to reduce harmonic distortion.
Usually specifically designed harmonic passive or/and active filters are used. The
presence of high harmonic currents, in particular, the 3rd
harmonic causes current
increase in the neutral wire (in star connection). This could result in neutral conductor
overheating if it is not sized properly. [35]
18
International Standards protect the Utilities, giving the limits that harmonic currents
produced by the customers can be imposed on the supply. IEC 61000-3-2 [28] provides
the maximum allowable limits of harmonic currents that equipment can draw with the
input current.
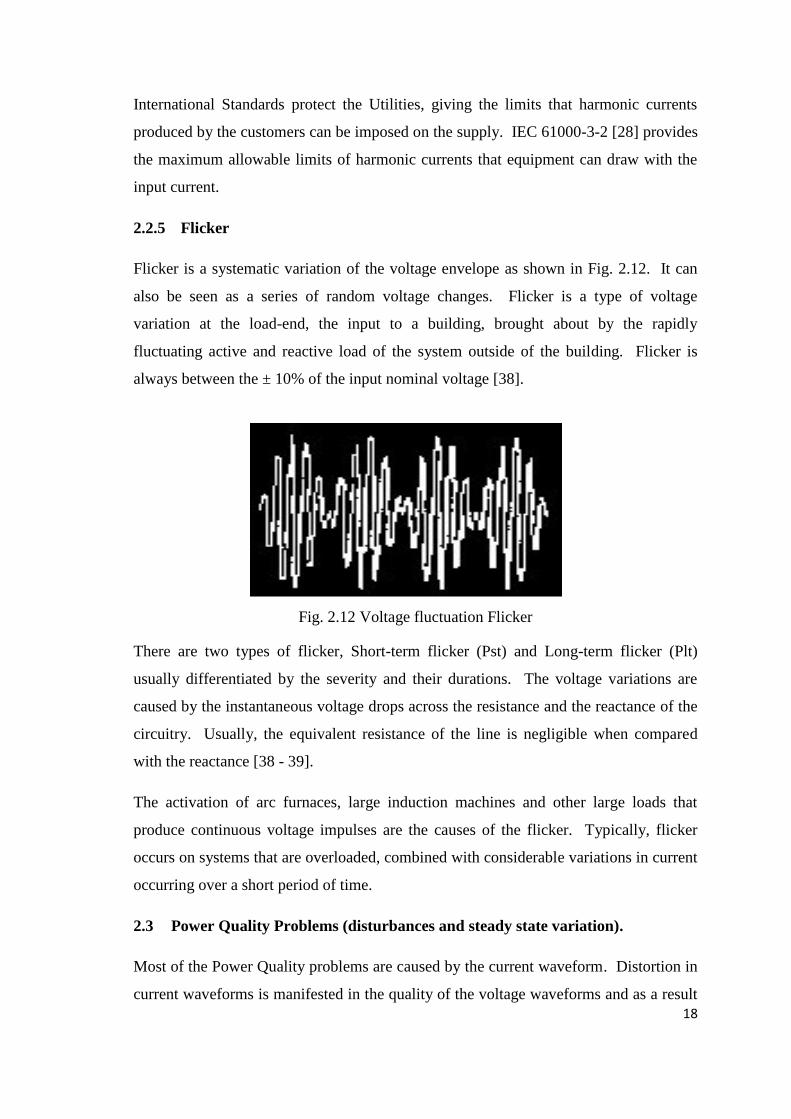
2.2.5 Flicker
Flicker is a systematic variation of the voltage envelope as shown in Fig. 2.12. It can
also be seen as a series of random voltage changes. Flicker is a type of voltage
variation at the load-end, the input to a building, brought about by the rapidly
fluctuating active and reactive load of the system outside of the building. Flicker is
always between the ± 10% of the input nominal voltage [38].
Fig. 2.12 Voltage fluctuation Flicker
There are two types of flicker, Short-term flicker (Pst) and Long-term flicker (Plt)
usually differentiated by the severity and their durations. The voltage variations are
caused by the instantaneous voltage drops across the resistance and the reactance of the
circuitry. Usually, the equivalent resistance of the line is negligible when compared
with the reactance [38 - 39].
The activation of arc furnaces, large induction machines and other large loads that
produce continuous voltage impulses are the causes of the flicker. Typically, flicker
occurs on systems that are overloaded, combined with considerable variations in current
occurring over a short period of time.
2.3 Power Quality Problems (disturbances and steady state variation).
Most of the Power Quality problems are caused by the current waveform. Distortion in
current waveforms is manifested in the quality of the voltage waveforms and as a result

19
this causes a power quality problem. To investigate the problems of power quality,
either for new design or existing system, it is necessary to evaluate the problems in the
following general formation.
2.3.1 Categorising some of the power quality problems
In order to categorise a specific power quality problems the following three steps are
taken:
(a) Identifying the type of problems
i. Voltage Regulation/Unbalance
ii. Voltage Sags/Interruptions
iii. Flicker
iv. Transients
v. Harmonic Distortion
(b) Problem characterization
i. Measurements/Data Collection
ii. Causes
iii. Characteristics
iv. Equipment Impacts
(c) Identify the type of solutions
i. Utility Transmission System
ii. Utility Distribution System
iii. End-Use Customer Interface
iv. End-Use Customer System
v. Equipment/Design Specifications
2.3.2 International characteristics for voltage control
The International characteristics for voltage control are a set of guidance for suppliers,
consumers and manufacturers. Tables 2.4 and 2.5 refer to some of these international

20
standards, the types of voltage variation categories, the method of characterization, the
probable causes and the suggested power conditioning solutions [17, 37]
No Parameter Supply voltage characteristics
according to EN 50160
Low voltage characteristics
according to EMC standard
EN 61000
EN 61000-2-2 Other parts
1 Power frequency
LV, MV: mean value of fundamental
measured over 10secs.
±1% (49.5 – 50.5 Hz) for 99.5% of week
-6% to + 4%(47-52Hz)for 100% of week
2%
2 Voltage magnitude
variations
LV, MV: ±10% for 95% of the week,
mean 10 minutes RMS values
±10% applied for
15 minutes
3 Rapid voltage
changes
LV: 5% normal;
10% infrequently
Plt ≤ 1 for 95% of week
MV: 4% normal
6% infrequently
Plt ≤ for 95% of week
3% normal
8% infrequently
Pst ≤ 1.0
Plt < 0.8
3% normal
4% maximum
Pst ≤ 1.0
Plt < 0.65
(EN61000-3-3)
3% (IEC 61000-
2-12)
4 Supply voltage dips
Majority: duration < 1s, depth < 60%
Locally limited dips caused by load
switching on:
LV: 10 – 50%, MV: 10 – 15%
Urban:
1 – 4 months
up to 30% (10ms)
up to 60% 100ms
EN61000-6-1,6-2
Up to 60% 1000m
EN 61000-6-2
5 Short interruptions of
supply voltage
LV, MV: (up to 3 minutes) few tens to
few hundred/year.
Duration 70% of them < 1s
95% reduction
for 5s
EN61000-6-1, 6-2
6 Long interruption of
supply voltage
LV, MV: (longer than 3 minutes)
< 10 – 50/year.
7
Temporary; power
frequency
overvoltages
LV: < 1.5 kV rms
MV: 1.7 Uc (solid or impedance earth)
2.0 Uc (unearth resonance earth
8 Transient
overvoltages
LV: generally < 6kV, occasionally higher
rise time: ms to µs.
MV: not defined
±2kV, line – earth
±1kV, line – line
1.2/50(8/20)
Tr/Th(µs)
EN61000-6-1, 6-2
9 Supply voltage
unbalance
LV, MV: up to 2% for95% of week,
mean 10minutes rms values, up to 3% in
some locations
2% 2%
IE C61000-2-12
10 Harmonic voltage LV, MV:
6% for 5th
5% for 7th
3.5% for 11th
3% for 13th
THD < 8%
5% for 3th
6% for 5th
5% for 7th
1.5% for 9th
3.5% for 11th
3% for 13th
0.3% for 15th
2% for 17th
EN 61000-3-2
11 Interharmonic
voltage LV, MV: under consideration 0.2%
Table 2.4: Comparison of supply voltage requirements according to EN 50160[37]
21
2.3.3 Effects of Harmonics in Modern Buildings
Almost all Modern buildings have non – linear loads which are of the following types:
a) Fluorescent lights (CFLs with magnetic and electronic ballasts).
b) Computer power supplies with Switched Mode Power Supply (SMPS).
c) Variable speed drives as in HVAC.
d) UPS.
One of the major power quality problems in Modern Buildings is the harmonics which
could take the form of current and/or voltage harmonics. Usually harmonic currents are
generated by the non - linear loads connected to the system which invariably lead to
voltage harmonics in the system. Majority of harmonic problems affecting a building
are generated within the building. But neighbouring buildings with substantial
harmonic generation can affect the harmonics of the building under consideration,
hence the formulation of power quality standards evolved.
Symptoms of harmonic voltage distortions in modern buildings include:
1) Transformers may overheat without necessarily being overloaded.
2) Cables may get too hot and insulation can breakdown.
3) Induction motors may get too hot and become noisy.
4) Capacitors can overheat or form tuned circuits that resonate.
5) Circuit breakers can trip and fuses blow unnecessarily and incessantly.
6) Computers fail.
7) Metering may give false readings.
8) Electronic displays and lighting may flicker.
All these voltage distortions cause accelerated equipment ageing and metering error
over a long period of high accumulated harmonic levels. Other forms of
22
malfunctioning of sensitive electronics equipments could be caused by short bursts
voltage waveforms. As mentioned earlier, power quality problems caused by an end –
user can adversely affect another end – user. In order to prevent this and to set
standards for sensitive electronic equipments, International Standards were set up to
which power suppliers, end-users and manufacturers have to comply.
2.4 An Overview of International Power Quality Standards.
International Power Quality Standards were set up to give guidelines, and have been
adopted in Europe USA and other parts of the world; the advent of deregulation which
produces the „buyers‟ market‟ climate has intensified the application of the
International Standards.
Interpretation of power quality recommendations from different International guidelines
has become problematic, even local benchmarking could become problematic. The
methodologies employed by each Standard for the same problem mitigation differ
widely. This overview tries to give comparative overview of harmonic limits in
different International Standards.
Voltage quality is an indication of the quality of the supply system dictated by the
supplier and the user alone controls the current consumed. Harmonic distortion is
considered to be the most problematic in recent years that has taken the attention of
power quality engineers because of the ever-increasing non-linear loads added to the
system. These harmonic problems have led to the development of standards that
Utilities and End-users are involved in the mitigation processes. The Utility is
responsible for the supplied voltage, while the end-user is to control the level of
harmonic currents produced from the loads into the Utility network. Differences are
noticed in the ways harmonics have been treated by International Standards guidelines
to minimize the harmonic effects. These guidelines have caused misinterpretations and
misquotations of these standards in their specifications.
Attempts are made in this section to examine and compare the differences and
similarity of the widely accepted International harmonic standards such as:
1) EN 50160 (appendix B3) [16, 24]
23
2) IEC 61000- 2- 2 and IEC 61000-2-4
3) IEEE 519-1992 [10]
4) ER G5/4-1
2.4.1 EN 50160
This standard covers flicker, inter-harmonics, voltage deviations and others as shown in
Table 2.4 [37]. It specifies the voltage characteristics of electricity supplied by public
distribution systems as input to buildings in Europe. Point of Common Coupling (PCC)
is the reference point for measurement. Equipment manufacturers have also adopted
the same standards to set the limits over which their equipment will operate a standard
for voltage at the point of equipment connection. The complete characteristics covered
by this standard are as shown in Appendix B3. Moreover the THD of the supply
voltage for all harmonics shall be less than or equal to 8%, with acceptance of 95%
[Appendix B3]. It is conventional to sum the harmonics to the 40th
harmonic when
considering the frequency response that is 2500Hz. Detecting voltage transients require
that the changes in voltage of less than one millisecond is required, therefore frequency
response of at least 10 kHz is required.
2.4.2 IEC 61000-2-2; 61000-2-3; 61000-3-2 and 61000-3-4
The IEC 61000-2-2 and IEC 61000-2-3 are standards connected with the low voltage
(LV) system harmonic limits.
The IEC 61000-3-2 (≤16A/phase), IEC 61000-3-4 (>16A/phase) and IEC 61000-3-12
(16A<current/phase≤75A) are different classes of standards that deal with different
harmonic current levels injected by individual equipment into the public supply system.
[50]
The different International Standards are compared in the following forms:
a) Scope, coverage and the maximum harmonic order (N) for respective
standards.
b) Voltage distortion limits.
c) Current distortion limits.

24
d) Other measurement parameters (duration, hmax, and PCC )
2.4.3 Comparison of Different International Standards
Analyzers from different manufacturers should give the same results. The two most
common PQ standards in use today are IEC 61000-4-30 and EN 50160. [49]
IEC 61000-4 sets accuracy levels, defines aggregation levels, provides measurement
methods and measurement formulas are well defined.
EN 50160 provides recommended levels for different power quality parameters and the
percentage of the time for which these levels must be complied with. The averaging
period of 10 minutes and the 95% compliance are set for EN 50160.
2.4.3.1 Scope and coverage for respective standards.
The scope of the standards is summarized in table 2.5. The level for low voltage
distribution systems is further examined in this thesis since almost all modern buildings
take their supply at this level.
Table 2.5: Scope and Coverage of Harmonic Distortions Limits for LV systems [50]
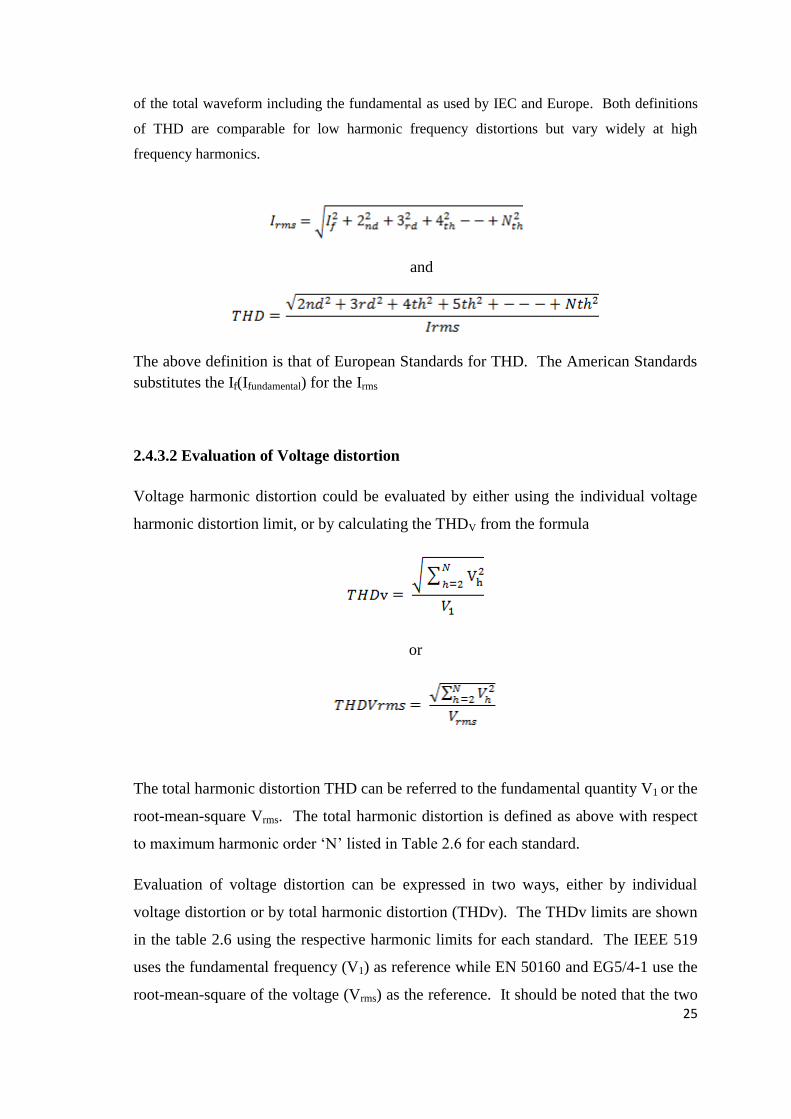
Total Harmonic Distortion (THD) is one measure of total distortion. It quantifies the thermal
effect of all the harmonics. It is the RMS sum of the individual harmonics excluding the
fundamental, divided by either the fundamental as used by IEEE in America, or the RMS value
25
of the total waveform including the fundamental as used by IEC and Europe. Both definitions
of THD are comparable for low harmonic frequency distortions but vary widely at high
frequency harmonics.
and
The above definition is that of European Standards for THD. The American Standards
substitutes the If(Ifundamental) for the Irms
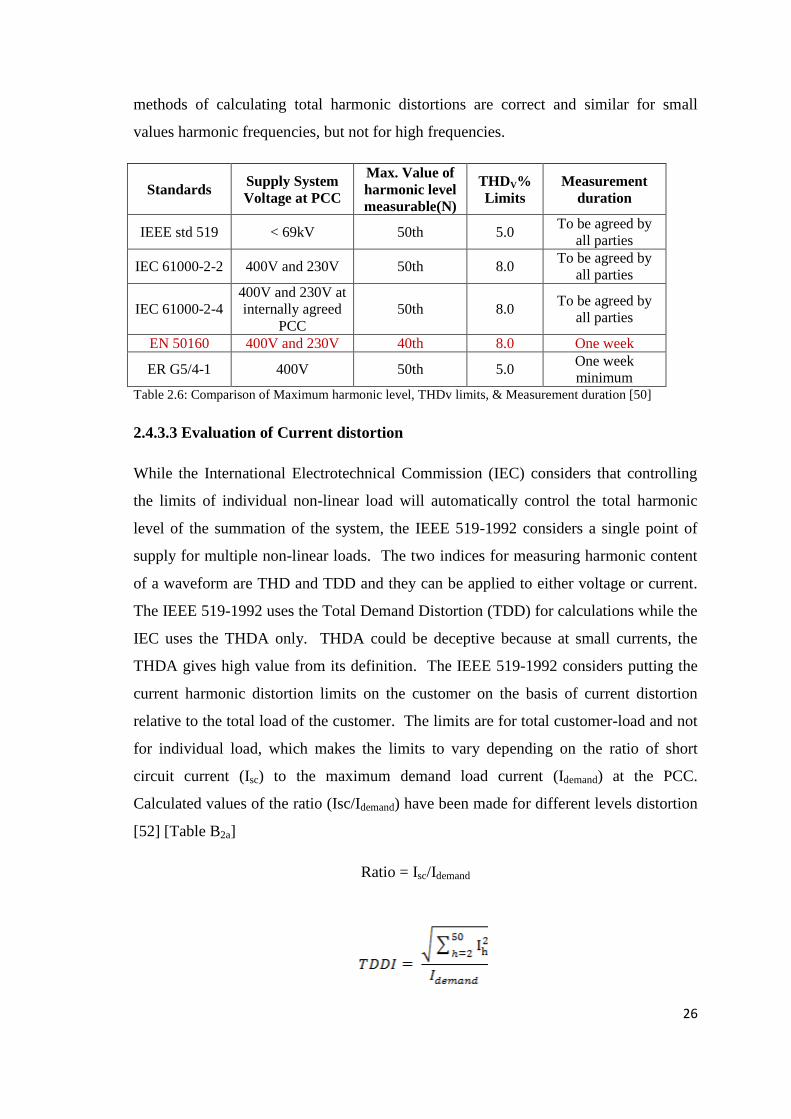
2.4.3.2 Evaluation of Voltage distortion
Voltage harmonic distortion could be evaluated by either using the individual voltage
harmonic distortion limit, or by calculating the THDV from the formula
or
The total harmonic distortion THD can be referred to the fundamental quantity V1 or the
root-mean-square Vrms. The total harmonic distortion is defined as above with respect
to maximum harmonic order „N‟ listed in Table 2.6 for each standard.
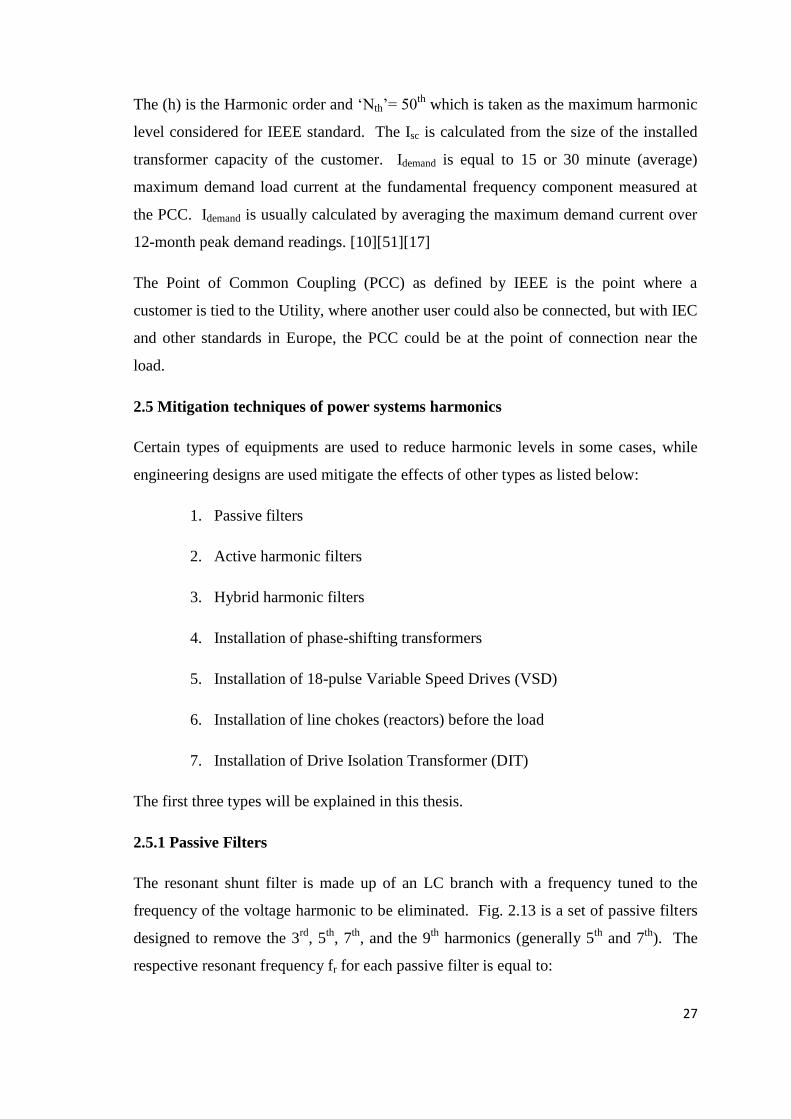
Evaluation of voltage distortion can be expressed in two ways, either by individual
voltage distortion or by total harmonic distortion (THDv). The THDv limits are shown
in the table 2.6 using the respective harmonic limits for each standard. The IEEE 519
uses the fundamental frequency (V1) as reference while EN 50160 and EG5/4-1 use the
root-mean-square of the voltage (Vrms) as the reference. It should be noted that the two
26
methods of calculating total harmonic distortions are correct and similar for small
values harmonic frequencies, but not for high frequencies.
Standards Supply System
Voltage at PCC
Max. Value of
harmonic level
measurable(N)
THDV%
Limits
Measurement
duration
IEEE std 519 < 69kV 50th 5.0 To be agreed by
all parties
IEC 61000-2-2 400V and 230V 50th 8.0 To be agreed by
all parties
IEC 61000-2-4
400V and 230V at
internally agreed
PCC
50th 8.0 To be agreed by
all parties
EN 50160 400V and 230V 40th 8.0 One week
ER G5/4-1 400V 50th 5.0 One week
minimum Table 2.6: Comparison of Maximum harmonic level, THDv limits, & Measurement duration [50]
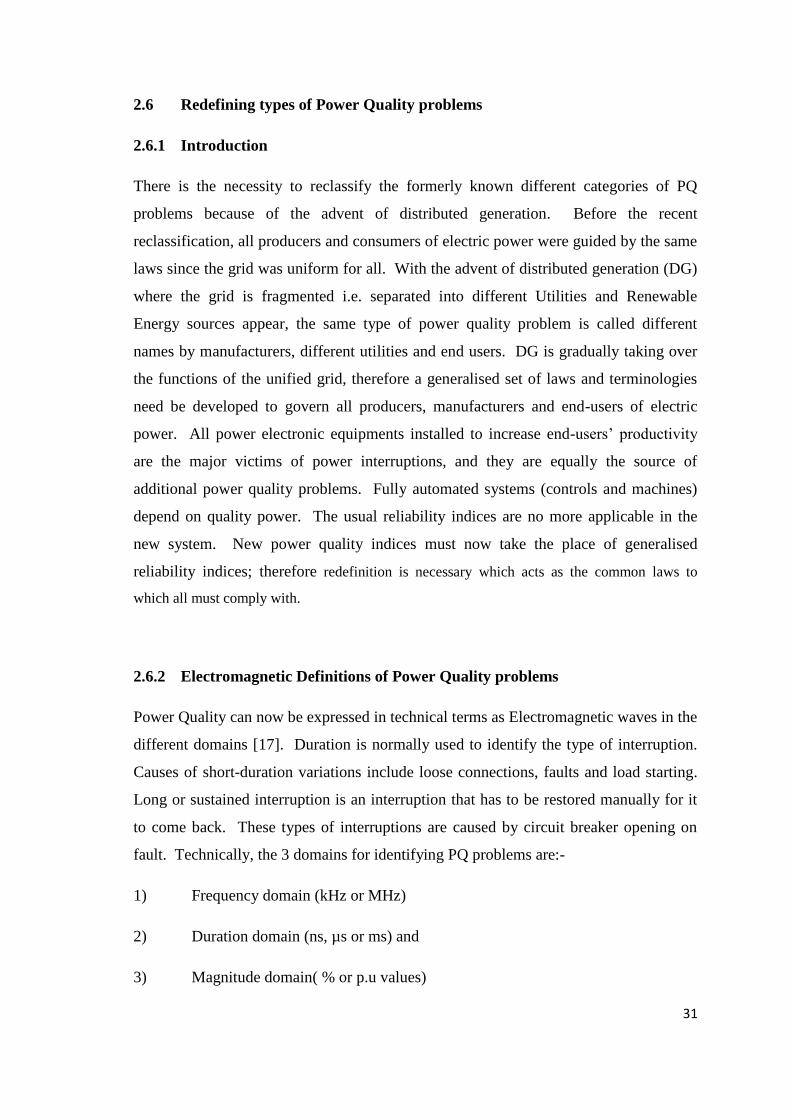
2.4.3.3 Evaluation of Current distortion
While the International Electrotechnical Commission (IEC) considers that controlling
the limits of individual non-linear load will automatically control the total harmonic
level of the summation of the system, the IEEE 519-1992 considers a single point of
supply for multiple non-linear loads. The two indices for measuring harmonic content
of a waveform are THD and TDD and they can be applied to either voltage or current.
The IEEE 519-1992 uses the Total Demand Distortion (TDD) for calculations while the
IEC uses the THDA only. THDA could be deceptive because at small currents, the
THDA gives high value from its definition. The IEEE 519-1992 considers putting the
current harmonic distortion limits on the customer on the basis of current distortion
relative to the total load of the customer. The limits are for total customer-load and not
for individual load, which makes the limits to vary depending on the ratio of short
circuit current (Isc) to the maximum demand load current (Idemand) at the PCC.
Calculated values of the ratio (Isc/Idemand) have been made for different levels distortion
[52] [Table B2a]
Ratio = Isc/Idemand
27
The (h) is the Harmonic order and „Nth‟= 50th
which is taken as the maximum harmonic
level considered for IEEE standard. The Isc is calculated from the size of the installed
transformer capacity of the customer. Idemand is equal to 15 or 30 minute (average)
maximum demand load current at the fundamental frequency component measured at
the PCC. Idemand is usually calculated by averaging the maximum demand current over
12-month peak demand readings. [10][51][17]
The Point of Common Coupling (PCC) as defined by IEEE is the point where a
customer is tied to the Utility, where another user could also be connected, but with IEC
and other standards in Europe, the PCC could be at the point of connection near the
load.
2.5 Mitigation techniques of power systems harmonics
Certain types of equipments are used to reduce harmonic levels in some cases, while
engineering designs are used mitigate the effects of other types as listed below:
1. Passive filters
2. Active harmonic filters
3. Hybrid harmonic filters
4. Installation of phase-shifting transformers
5. Installation of 18-pulse Variable Speed Drives (VSD)
6. Installation of line chokes (reactors) before the load
7. Installation of Drive Isolation Transformer (DIT)
The first three types will be explained in this thesis.
2.5.1 Passive Filters
The resonant shunt filter is made up of an LC branch with a frequency tuned to the
frequency of the voltage harmonic to be eliminated. Fig. 2.13 is a set of passive filters
designed to remove the 3rd
, 5th
, 7th
, and the 9th
harmonics (generally 5th
and 7th
). The
respective resonant frequency fr for each passive filter is equal to:

28
At the specific resonant frequency fr, the resonant shunt filter presents a low minimum
impedance with respect to the resistance (R) of the reactor. Virtually all the harmonic
currents (ir) of frequency fr injected by non-linear load are removed, and the
corresponding low harmonic voltages are also removed since (v = iR). However, when
the loads are not in operation, the passive filter becomes power factor correction
capacitor if it is not completely isolated from the load. The passive filter then injects
excessive reactive power (KVAR) causing voltage regulation problem to the network at
light or no load. [43]
Fig. 2.13 Shunt resonant filter bank for removing specific harmonics (fo =fr) [43]
2.5.2 Active Harmonic Filters
All active harmonic filters generate currents or voltages which are used to oppose the
harmonics created by non-linear loads. There are different types of active harmonic
filters, for example „shunt‟ or parallel types and the series type, but the shunt types are
the most commonly used. Assuming that the non-linear load produces the fundamental,
the 3rd
, 5th
, 7th
and the 9th
harmonics as showed Fig. 2.14. The principle of Active filters
is that the harmonics present are used to cancel themselves out. The current
transformer (C.T) passes a sample of the distorted waveform to low pass filter, which
removes the 50Hz fundamental component as this carries the useful power and passes
the harmonics to the amplifier after inverting all the harmonics to the same value as the
main line. The amplified current waveform is passed back to the main line through a
transformer or an inductor (not shown in the diagram) through the magnetic flux only.

29
Fig. 2.14 Basic Idea of a Typical Active Filter with the frequency spectrum.
2.5.3 Hybrid ‘Passive/Active’ harmonic filters
The hybrid harmonic filter is a combination of passive and active harmonic filter where
the passive filter part is tuned to the predominant harmonic frequency; this part supplies
the requested reactive energy. The active component removes the other harmonic
frequency waveforms; the combination provides the benefits over the individual filter.
The installation must be designed in such a way to prevent interaction between the two
different types of filters. [55], Figure 2.15 shows the harmonic filter principle where
two passive filters (FP1 and FP2) are tuned to remove two different harmonic orders (5th
and 7th
), and the active harmonic filter part.
Fig. 2.15 Hybrid harmonic filter principle [55]

30
Table 2.6 Summary of Power Quality Variation Categories (17)
PQ Variation
Category
Method of
Characterisation Type of Causes
Power Conditioning
Solutions
Impulsive
Transients
Peak magnitude
Rise time
Duration
Lightning
Electrostatic
discharge
Load Switching
Surge Arresters
Filters
Isolation Transformers
Oscillatory
Transients
Wave forms
Peak magnitude
Frequency Components
Line/Cable
Switching
Capacitor
Switching
Load Switching
Surge Arresters
Filters
Isolation Transformers
Sags/Swells
Interruptions
RMS v Time
Magnitude, Duration
Duration
Remote System
faults
System
Protection Mtc.
(Breakers &
Fuses)
Ferroresonant Transformers
Energy Storage
Technology(UPS/Standby
supply
Energy Storage
Technology(UPS)
Backup Generators
Undervoltages
and
Overvoltages
RMS v Time
Statistics
Motor Starting
Load variations
Voltage Regulators
Ferroresonant Transformers
Harmonic
Distortion
Voltage
Flicker
Harmonic Spectrum
THD
Statistics
Variation Magnitude,
Frequency of
Occurrence,
Modulation Frequency
Non-linear
loads
System
Resonance
Intermittent
Loads,
Motor Starting,
Arc Furnaces
Filters(Active & Passive)
Transformers(cancellation of
zero sequence components
Static Var Systems
31
2.6 Redefining types of Power Quality problems
2.6.1 Introduction
There is the necessity to reclassify the formerly known different categories of PQ
problems because of the advent of distributed generation. Before the recent
reclassification, all producers and consumers of electric power were guided by the same
laws since the grid was uniform for all. With the advent of distributed generation (DG)
where the grid is fragmented i.e. separated into different Utilities and Renewable
Energy sources appear, the same type of power quality problem is called different
names by manufacturers, different utilities and end users. DG is gradually taking over
the functions of the unified grid, therefore a generalised set of laws and terminologies
need be developed to govern all producers, manufacturers and end-users of electric
power. All power electronic equipments installed to increase end-users‟ productivity
are the major victims of power interruptions, and they are equally the source of
additional power quality problems. Fully automated systems (controls and machines)
depend on quality power. The usual reliability indices are no more applicable in the
new system. New power quality indices must now take the place of generalised
reliability indices; therefore redefinition is necessary which acts as the common laws to
which all must comply with.
2.6.2 Electromagnetic Definitions of Power Quality problems
Power Quality can now be expressed in technical terms as Electromagnetic waves in the
different domains [17]. Duration is normally used to identify the type of interruption.
Causes of short-duration variations include loose connections, faults and load starting.
Long or sustained interruption is an interruption that has to be restored manually for it
to come back. These types of interruptions are caused by circuit breaker opening on
fault. Technically, the 3 domains for identifying PQ problems are:-
1) Frequency domain (kHz or MHz)
2) Duration domain (ns, µs or ms) and
3) Magnitude domain( % or p.u values)
32
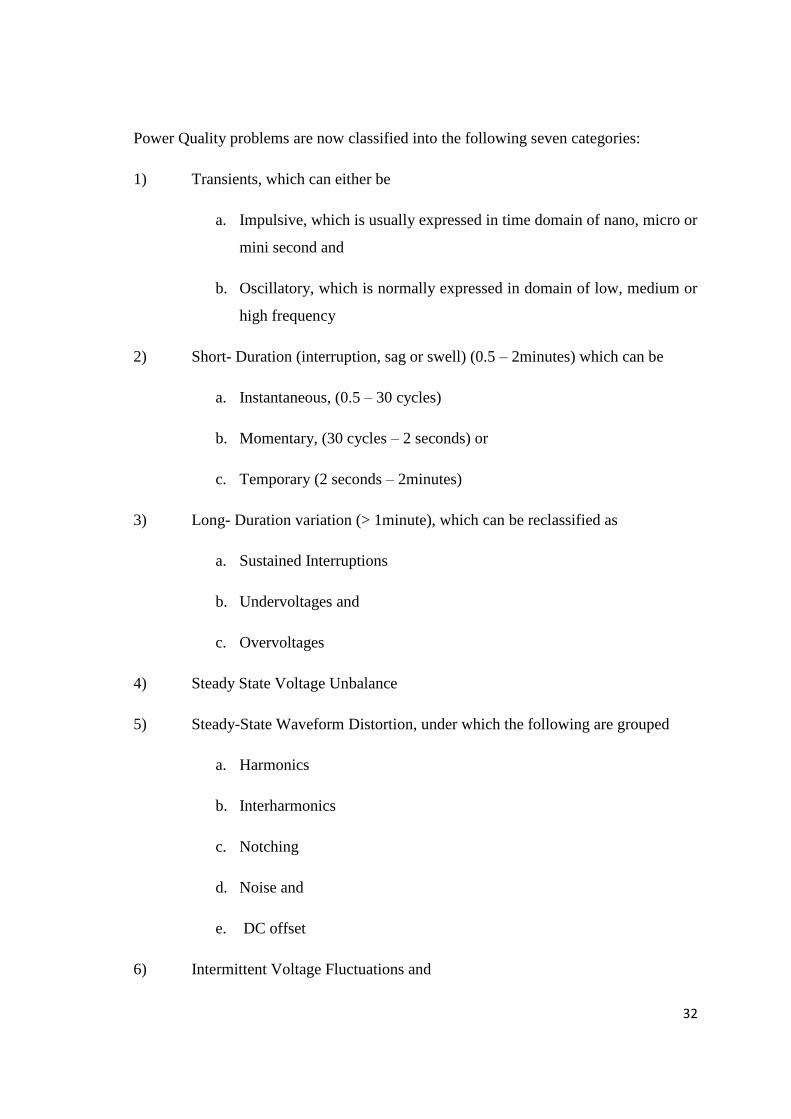
Power Quality problems are now classified into the following seven categories:
1) Transients, which can either be
a. Impulsive, which is usually expressed in time domain of nano, micro or
mini second and
b. Oscillatory, which is normally expressed in domain of low, medium or
high frequency
2) Short- Duration (interruption, sag or swell) (0.5 – 2minutes) which can be
a. Instantaneous, (0.5 – 30 cycles)
b. Momentary, (30 cycles – 2 seconds) or
c. Temporary (2 seconds – 2minutes)
3) Long- Duration variation (> 1minute), which can be reclassified as
a. Sustained Interruptions
b. Undervoltages and
c. Overvoltages
4) Steady State Voltage Unbalance
5) Steady-State Waveform Distortion, under which the following are grouped
a. Harmonics
b. Interharmonics
c. Notching
d. Noise and
e. DC offset
6) Intermittent Voltage Fluctuations and

33
7) Variations of the Power Frequency from the fundamental frequency (50Hz)
When expressed in these three domains and categories, any power quality problem can
be analysed and grouped in the classifications listed above [16, 17].
It could be seen that PQ problems are caused by the introduction and increased use of
power electronics equipments in distribution networks and recently by Inverters and
Converters.
Renewable Energy generation and transmission introduce more of Harmonics into the
systems during their mode of operations; this is also a major PQ problem. These
problems should be controlled at the source, the Utilities, the End-Users and the
Manufacturers. The recent increase in non-linear loads at the Industrial and Residential
levels cause abnormal increase in harmonic currents. Recently High-rise Commercial
buildings are full of power electronic equipments, which are the main sources of their
own power quality problems. This leads to losses of sensitive equipments and operating
time. Therefore, measuring and analysing the PQ problems and mitigating techniques
need be applied to these commercial buildings. These will be considered in the next
part. Power Quality has become a major issue in today‟s electricity supply to both the
power suppliers and the end-users. Power equipments have become more of power
electronic devices, wide spread and still on the increase. All these devices have non-
linear characteristics (drawing non-sinusoidal currents from sinusoidal voltage source
and consequently affecting the source itself), which easily deteriorate power quality. IT
devices, Adjustable speed drives and computes are notorious for their sensitivity to
power quality because they suffer failure, mal-operation, or hardware damage during
poor power quality events. But these same equipments are the major causes of power
quality problems because of their non-linear characteristics.
The present day Industrial growth has witnessed massive increase in automation
brought about by power-electronics equipments, for example adjustable speed drives
(ASD) which cannot tolerate surges, spikes, over or under voltages and frequencies.
Reliability is now in the order of sub-cycles in designing for zero down-time in service
centres and industries. The suppliers, the end-users and the manufacturers of power-
34
electronic equipments are all involved in the design. The quality and reliability of
power supply have changed as civilisation tends towards power-electronics equipments.
The facility manager working hard to prevent costly downtime at the load end, and the
utility engineer whose work is to improve the quality of power supply at the sending
end are continually looking for solutions to power quality problems. Poor power
quality has bad effects on economic operations of industries because of unwanted
down-time and resultant losses in production. The number of consumers with power
quality sensitive processes is increasing, therefore the improvements in PQ for both the
Medium Voltage (MV) and the Low Voltage (LV) grid is dependent on power
electronic conversion technique. Tall modern (commercial) buildings, hospitals and
ships have standby power supply, generators, which provide emergency power supply
when the grid fails. These generators are subject to frequency variations which are
absent in the grid. Such isolated generating systems can be characterised by the short
distances between generators and loads. The major feature of the isolated generation is
the „weak grid‟, because the loads are usually big and ever increasing in comparison
with the installed generator capacity. These situations give rise to a large voltage dip
at the start of large induction loads. There is no „infinite bus‟ situation, therefore the
voltage and frequency cannot remain constant. The types of frequency deviations from
50HZs or 60HZs also have steady-state and non-steady-state character. The deviations
should be within the limits of frequency deviations as laid down in IEC 60092-101
standard that governs such installations. The standard says that „The long duration of
frequency deviation should be less or equal to ±5% of the rated frequency, and the short
duration of frequency deviation should be less or equal to ±10% of the rated frequency
for isolated generation systems [22].
The economic growth of all developing countries is adversely affected by power quality
problems. The commercial activities in these new mega cities are expanding at a fast
rate, high rise buildings are springing up faster than envisaged. Electronic equipments
multiply in all the banks and other commercial houses at a fast rate. These are major
sources of harmonics, and other power quality problems such as voltage sags and short
interruptions. Almost all the banks complain of incessant malfunctioning of their
sensitive electronic equipments (ATMs) every day, giving rise to fraud and loss of
35
customers‟ money. Almost all communication and electronic media problems usually
referred to as „Network problems‟ are caused by Power Quality problems. These
problems have led to the special study conducted and analysed in the subsequent
chapters. Power quality problems have been classified into two main groups, Steady
State Variations and Disturbances. Disturbances require longer periods of monitoring,
for example six months or more, but steady state variations can be conducted within a
limited time frame of, say, one week. Values of voltages, currents, apparent power,
active power, reactive power, voltage, transients and the Total Harmonic distortions
(THDV and THDI) that form the steady state variations were taken and analysed.
2.7 Power Consumption in different types of loads
This section shows how the power consumption is dictated by both type of load and the
supplied voltage.
2.7.1 Power Consumption in Passive Loads
Passive loads are resistive loads. Examples of this type of load are cookers, heaters,
boilers and kettles, incandescent lights, etc, but not gas discharge (fluorescent) lights.
In this type of load the amount of power consumed (for a constant value of load) is
directly proportional to (v2). So an increase of, 10% in a supply voltage of 230V will
result in an increase of power consumption of 21%, even where resistance varies or
load is partially inductive or capacitive, this is still broadly true.
2.7.2 Power Consumption in Gas Discharge Lamp Loads
Examples of this type of load are fluorescent lights and high-pressure sodium lamps.
Gas discharge lamps show a decrease in resistance with voltage. This is often called
„negative resistance‟. It is particularly unstable, and additional components are required
to limit the current. This may be a simple inductor, or may be a complex electronic
circuit. While the behaviour of any one model of lamp can only be determined by
measurement, the overall behaviour of a large number of gas discharge lamps is
predictable. It is largely the same as for resistive loads. However, almost all designs
suffer marked reduction in life with over voltage.

36
In this type of load the amount of power consumed (for a constant value of load) is
directly proportional to (v2). So an increase of, say, 10% in a supply voltage of 230V
will result in an increase of power consumption of 21% as calculated below. The 10%
increase brings the voltage to 253V
R is constant; therefore P is proportional to V2
If 230V is the supply voltage, it is then regarded as 100% of supply voltage
When the upper voltage of 253V is considered, its % becomes
= 121%
This is 21% above the power consumed at 230V
The reverse is also true. If the supply voltage of 230V decreases by 10% to 207V, the
consumption drops to 81% i.e. 19% lower than at supply voltage. However, the
sensitivity of the load needs be considered.
2.7.3 Power Consumption in Electromagnetic Loads
Equipment with motors or transformers comes under this category. In this type of load
the amount of power consumed in doing useful work is the primary factor in
determining power demand and a small amount of over-voltage will result in only a
slight increase in power consumption. Generally the power consumed is approximately
proportional to (v). However, as voltage increases, the magnetic materials approach
saturation, leading not only to increased losses in the iron core, but also to increased
losses in the copper windings. At this point, the power consumption increases much
more rapidly than (v2). If the voltage rises to the level that causes saturation, the power
consumed will continue to rise until catastrophic failure occurs. This applies regardless
of the amount of useful work done.
37
Many types of mains driven motors are affected by over-voltage in another way: They
commonly operate at a low percentage of full load (partly because they cannot start if
the load exceeds 34% of their maximum capability). The power consumed increases
with the voltage, even though there is no increase in useful work done. While they are
very efficient at full load (over 90% is possible), typically, the efficiency at loads of less
than 20% is very poor (under 50% is common), and most of the power drawn is
attributable to losses. The power consumed by the losses increases with (v2). In the
special case of refrigeration and some types of air conditioning, additional cooling is
required to cope with heat produced by over-voltage. This in turn causes increased
power requirement leading to a vicious circle of decreasing efficiency. The power
consumed increases more rapidly than with (v2) for almost all levels of useful work
done, and failure due to saturation is also possible.
2.7.4 Power Consumption in Active Loads
In this type of loads the amount of power consumed is delivered in response to the load
demand. All types of electronic equipment or equipment with switch-mode power
supplies come under this category. Examples of this type of load are computers,
printers, fax machines, TV etc.
The power requirement of this type of load is the main factor in the value of the power
consumed. The relationship between efficiency and applied voltage is determined by
the design of the electronics. Although over-voltage results in a small increase of
power consumption, other effects of over-voltage include the reduction in the lifespan
of various components (e.g. capacitors). Most active loads have internal transformers
which are susceptible to saturation (even if they are not operating at mains frequency),
and high voltage transistors, whose losses increase with voltage faster than (v2).
2.7.5 Summary of the Effects of Power Consumption in Different Types of Loads
There is no doubt that overvoltage will result in increased consumption of power;
particularly in linear and non-linear loads (lights, heaters, office appliances, HVAC
systems, computers, etc). Overvoltage decreases the lifespan of electronic component
due to overheating of transformers at moderate loads and causes unnecessary excessive
power consumption leading to overbilling. Overheating of conductors due to skin
38
effect caused by harmonics at high frequencies for example 7th
harmonic (350Hz)
presents more reactance than the resistance of conductor. Considering the relationship
between voltage level and power consumption, efforts must be made to look further
than contributions of active and reactive power only, as far as the International
standards indicate. It has been shown that voltage level increase can cause and do cause
unwanted power consumption.
The voltage level dropping by 2% could cause power consumed to drop by as much as
3.96%. Continuous higher voltage than the normal voltage level supplied to the
University could make the Institution to pay higher bills to the supply Utility. The
unnecessary high increase in active and reactive power demand could be avoided.
A high tolerance for voltage level of the range of 5% as given by most International
Institutions should not be the basis for maintaining a continuously high level.
2.8 Power Factor Analysis.
Voltage variation is another important characteristic derivable from the data collected.
Most receiving end equipments are not very sensitive to these voltage variations as long
as they are within these acceptable standards. However if the variations exceed these
limits in magnitude for over 1 minute, long duration variations are considered to be
present as indicated in ANSI, C 84.1[20].
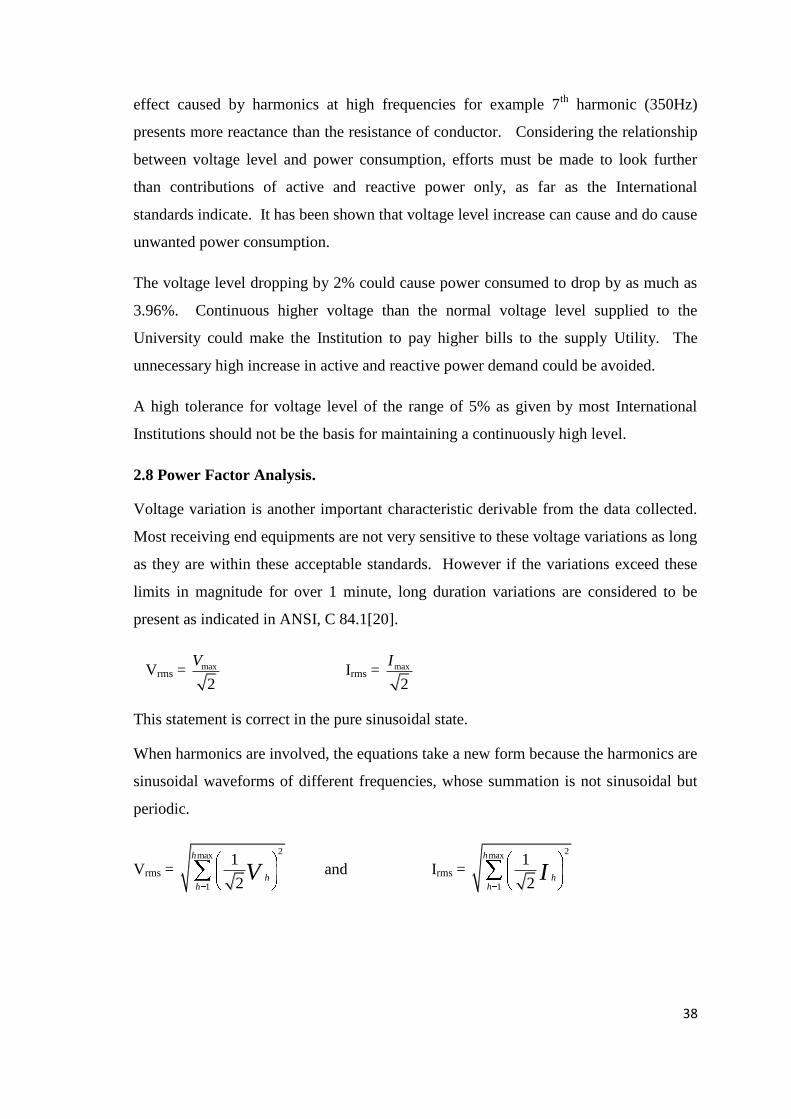
Vrms = max
2
V Irms = max
2
I
This statement is correct in the pure sinusoidal state.
When harmonics are involved, the equations take a new form because the harmonics are
sinusoidal waveforms of different frequencies, whose summation is not sinusoidal but
periodic.
Vrms =
2max
1
1
2
h
hh
V and Irms =
2max
1
1
2
h
hh
I
2 2 2 2
1 2 3 max
1
2rms hV V V V V

39
1
2 2 2 2
2 3 max
1
2rms hI I I I I
are the amplitudes of voltage and current waveforms
respectively.
2.8.1 Power Factor Analysis in linear loads
Linear reactive loads are inductive or capacitive and they draw current from source at
source frequency of 50 Hz. For linear systems, the relative angle between the voltage
and the current is represented by θ as shown in Fig. 3.14.
If the instantaneous voltage and current are represented as vt and it then
vt = Vmaxsin( t) and
i(t) = Imaxsin( t + θ) then the instantaneous power (p) is
p = vt it = VmaxImaxsin ( t) sin ( t + θ). Therefore the
Average power P = 1/2VmaxImaxcos (θ)
P = Vrms Irmscos (θ)
Where cos (θ) is the power factor (pf) in linear systems
Apparent power S = Vrms x Irms in (KVA)
Active power P = Scos (θ) in (KW)
Reactive power Q = S sin (θ) in (KVAR)
Phase angle θ = power factor angle
S = √ (P2 +Q
2)
cos (θ) = displacement power
factor (PF) for linear systems
Fig. 3.14 Displacement PF for linear systems

40
When Reactive power (Q) is very high, PF is very low. Q must be improved upon by
reducing angle θ in order to improve on the PF. Q, which is inductive, can be improved
upon by adding Capacitors (capacitive loads) to the circuit. It can be seen that the
bigger the inductive load the bigger the reactive power and the lower the power factor.
Large inductive loads cause large lagging currents and large KVAR, thus reducing the
PF. Such loads are Induction motors and Transformers. Power Factor affects the cost
of electricity. The lower the PF, the more the factory pays in electricity bills to the
Utility Company. Low PF causes low efficiency and therefore the power quality is said
to be poor. When PF is lower than 0.94, the losses is on the high side. The use of
Capacitors and Synchronous motors will improve the PF, and the load losses reduce and
the bills to be paid to the Utility reduce. The carbon emission also reduces. Low PF
also leads to increase in power losses and this leads to large voltage drop leading to
overheating and loss of transformers and other inductive equipments.
2.8.2 Power Factor Analysis in non - linear Systems.
The modern day computers are designed to have improved PF from 0.6 or 0.65 to 0.98
by the use of Switch Mode Power Supply (SMPS). The power factor of non- linear
loads is not the same as those of linear loads, as shown below. Another element is
brought into the calculation as a result of the load current not being sinusoidal but
periodic. The power factor is now made of two components, the true power factor
(PFtrue) and the displacement power factor (PFdisp).
For pure sinusoidal PFtrue = PFdisp = cos (θ) ≤ 1 and
For non-linear loads PFdist = 1 1
2 2 2 2
1 2 3
100
1 Trmsn
I Ix
II I I I where I1 =
fundamental current and ITrms = rms value of total input current.
The displacement factor is for linear systems only which is equal to cos = 1
1
KW
KVA and

41
Total or PF true for non – linear systems = T
T
KW
KVA where
KWT = total power input in kilowatts and
KVAT = total kilo volt-amperes (rms) input.
The Distortion harmonic factor, usually called Total Harmonic Distortion (THD) is
defined as
THD =
2 2 2 2
2 3 4
1
100
1
nI I I Ix
I =
1
HtotalI
I all of which are in RMS values.
For practical purposes Total Harmonic Distortion can be defined as
THD = 1
1
TotalP P
P it is easier to measure Power than all the different types of harmonic
currents and voltages.
The relationships between the load current and the supply voltage are no more uniform
when non–linear loads are present because the current drawn by the load is not
sinusoidal like the supply voltage but periodic.
P represents the Actual Power and S represents the Apparent Power. It is seen that PF
is a ratio, the highest value is 1. When this ratio is less than 1, the useful power is less
than the apparent power. Linear loads can have PF that are as high as 0.98. This is
called the displacement power factor. For uncompensated non-linear loads, the PF can
be as low as 0.65 because of power consumed by frequencies other than the
fundamental not as a result of reactive power only. This type of PF is called the true
power factor. These affect the quality of power a consumer experiences. The apparent
power is much bigger than the real power when the PF is low because of the non-linear
loads. The cost of poor PF is enormous for a consumer, as he is made to pay for what
he has not consumed. The current is not proportional to the applied voltage in a non-
linear device, since the wave is periodic. There is no real work done when the current
is not in phase with the voltage.
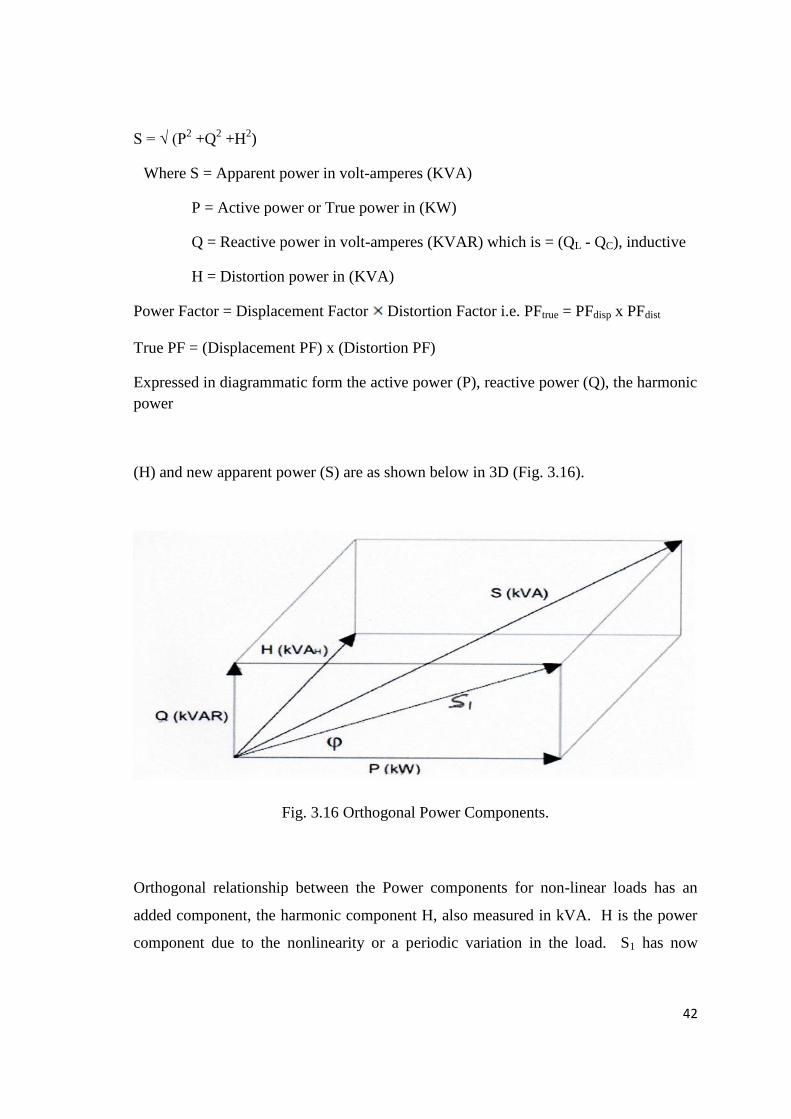
42
S = √ (P2 +Q
2 +H
2)
Where S = Apparent power in volt-amperes (KVA)
P = Active power or True power in (KW)
Q = Reactive power in volt-amperes (KVAR) which is = (QL - QC), inductive
H = Distortion power in (KVA)
Power Factor = Displacement Factor Distortion Factor i.e. PFtrue = PFdisp x PFdist
True PF = (Displacement PF) x (Distortion PF)
Expressed in diagrammatic form the active power (P), reactive power (Q), the harmonic
power
(H) and new apparent power (S) are as shown below in 3D (Fig. 3.16).
Fig. 3.16 Orthogonal Power Components.
Orthogonal relationship between the Power components for non-linear loads has an
added component, the harmonic component H, also measured in kVA. H is the power
component due to the nonlinearity or a periodic variation in the load. S1 has now

43
increased to the new and bigger apparent power, S. The new PF has decreased as a
result of the non-linear loads.
Assuming the instantaneous voltages and currents of a non-linear load is represented as
in Fig. 3.17, the frequency bar –chart of the fundamental and the harmonics are as
shown. The upper chart represents instantaneous voltage (v) while the lower chart
represents the current. The fundamentals and 3rd
harmonics of voltage (v) and current
(i) represented in the 1st and 3
rd positions are present. All the even harmonics have
cancelled out. The 5th
harmonic is absent in (v), but present in (i). The 7th
harmonic is
present in (v), but absent in (i) and so on.
„n‟ represents all the frequencies where both (v) and (i) are present.
„m‟ represents all the frequencies where (v) is present but (i) is absent.
„k‟ represents all the frequencies where (v) is absent but (i) present.
Fig. 3.17 Harmonic bar – chart of instantaneous voltages (v) and current (i)
It can be shown from Fig. 3.17 that the real power only exists if the voltage and current
have the same frequency. For example the real power in this figure is delivered at the
fundamental, third and the 11th
harmonics. Although the voltage waveform contains 7th
Voltage harmonics, v(t)
Current harmonics, i(t)
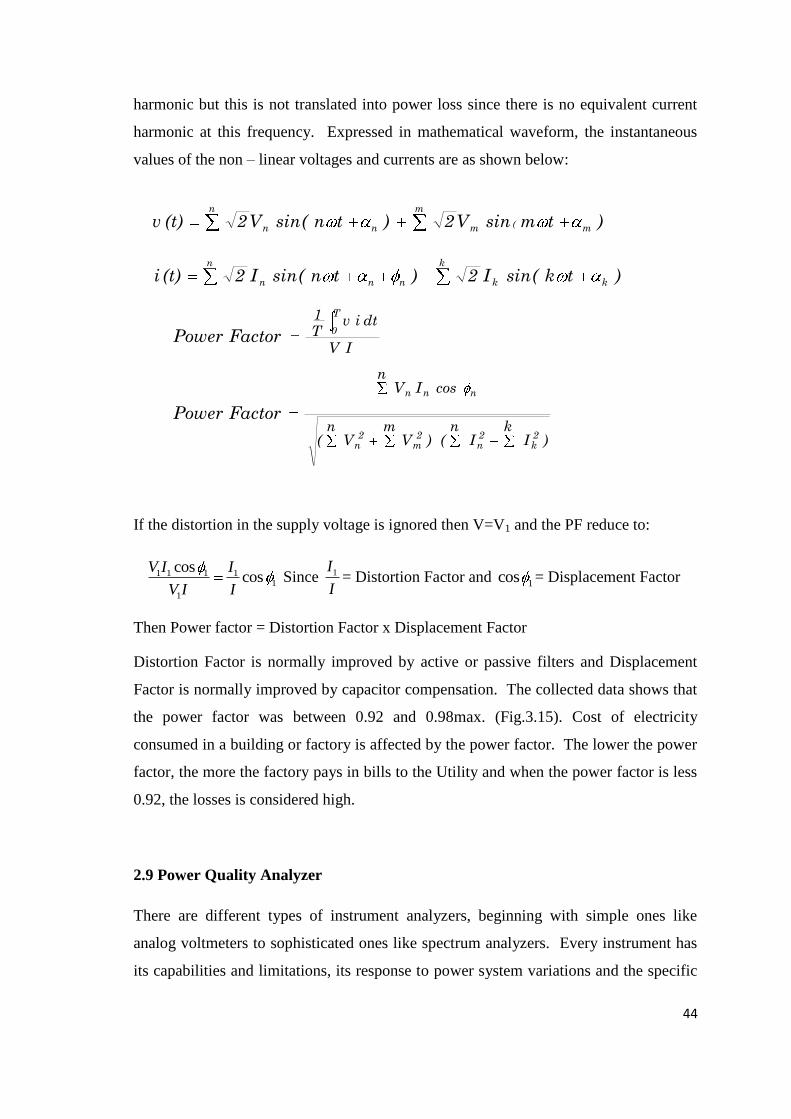
44
harmonic but this is not translated into power loss since there is no equivalent current
harmonic at this frequency. Expressed in mathematical waveform, the instantaneous
values of the non – linear voltages and currents are as shown below:
If the distortion in the supply voltage is ignored then V=V1 and the PF reduce to:
1 1 1 11
1
coscos
V I I
V I I Since 1I
I= Distortion Factor and
1cos = Displacement Factor
Then Power factor = Distortion Factor x Displacement Factor
Distortion Factor is normally improved by active or passive filters and Displacement
Factor is normally improved by capacitor compensation. The collected data shows that
the power factor was between 0.92 and 0.98max. (Fig.3.15). Cost of electricity
consumed in a building or factory is affected by the power factor. The lower the power
factor, the more the factory pays in bills to the Utility and when the power factor is less
0.92, the losses is considered high.
2.9 Power Quality Analyzer
There are different types of instrument analyzers, beginning with simple ones like
analog voltmeters to sophisticated ones like spectrum analyzers. Every instrument has
its capabilities and limitations, its response to power system variations and the specific
)tk(sinI2)tn(sinI2(t)i
)tmsinV2)tn(sinV2(t)v
kk
k
nnn
n
mm
m
nn
n
(
)Ik
In()V
mV
n(
cosIVn
IV
dtivT1
2k
2n
2m
2n
nnn
T
0
FactorowerP
FactorowerP
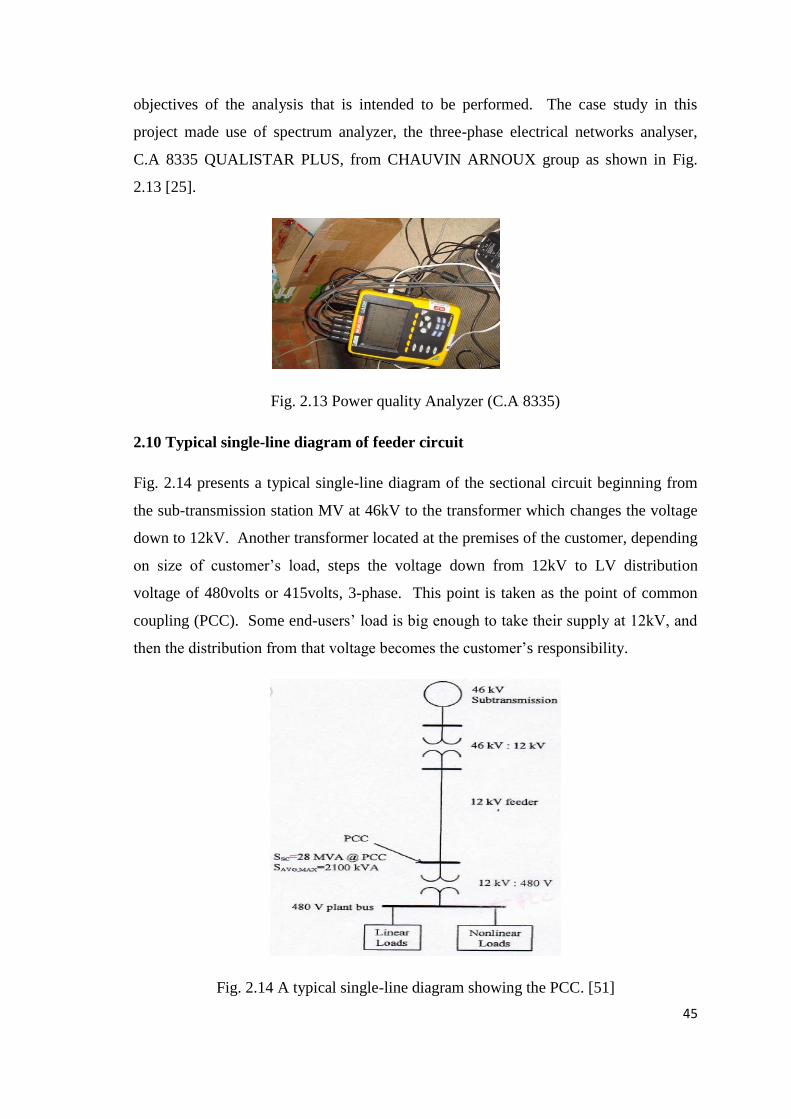
45
objectives of the analysis that is intended to be performed. The case study in this
project made use of spectrum analyzer, the three-phase electrical networks analyser,
C.A 8335 QUALISTAR PLUS, from CHAUVIN ARNOUX group as shown in Fig.
2.13 [25].
Fig. 2.13 Power quality Analyzer (C.A 8335)
2.10 Typical single-line diagram of feeder circuit
Fig. 2.14 presents a typical single-line diagram of the sectional circuit beginning from
the sub-transmission station MV at 46kV to the transformer which changes the voltage
down to 12kV. Another transformer located at the premises of the customer, depending
on size of customer‟s load, steps the voltage down from 12kV to LV distribution
voltage of 480volts or 415volts, 3-phase. This point is taken as the point of common
coupling (PCC). Some end-users‟ load is big enough to take their supply at 12kV, and
then the distribution from that voltage becomes the customer‟s responsibility.
Fig. 2.14 A typical single-line diagram showing the PCC. [51]

46
2.11 Summary
In this chapter the importance of the power quality is identified and each of the terms is
classified and discussed in some depth. Although power quality can be seen as one
integrated issue but from the mathematical, prevention and correction point of views it
is much easier to classify in a separate categories. Power quality has assumed a
strategic issue for Utilities, End-users and Equipment manufacturer as well. Even the
International Standards Organisations are involved in these problems. In this present
day of economic downturn the consequences of power quality disturbances could not be
taken lightly. Regular monitoring of installations and application of correct mitigation
techniques should be intensified. Power quality monitoring is required now for
technical reasons that is, for investment and planning. Deregulation will soon play a
major role in market economic. Harmonic distortion is increasing rapidly day by day.
It is not only the industrial consumers that produce harmonics, but commercial and
residential consumers have joined in the same also. All modern building engineers
need to study power quality problems and the mitigation technique. The energy loss
due to residential load harmonics in the country can be calculated. Malfunctioning of
very sensitive equipment and the loss of time and finance to put it right should also be
considered. There is need to know the contribution of harmonic problems that
residential load adds to the harmonic problems, (the computers and the Compact
Fluorescent Lamps (CFL) and other domestic electronic load). So much advertisement
on CFL‟s energy saving advantages is published every day without considering the
power quality problems it brings along with it. Next chapter looks at the study of the
power quality in an office building at Brunel University with some analysis of this
study. The International Standards have been compared and for the purposes of this
thesis, the EN50160 is adopted.
47
Chapter Three
Power Quality in Buildings (Case Studies No. 1)
Tower ‘A’ & Howell Building - Brunel University
48
3.1 Introduction
In Chapter 2, definitions of power quality as well as the main causes of poor power
quality were discussed. In this Chapter, two buildings fed from the same LV board
with the incomer breaker taken as the PCC were taken as a one of the case studies in
this thesis. The two buildings are academic office/lab buildings where the maximum
power consumption occurs during the day time. The power quality analyser was
installed at the PCC to these two buildings and it was observed for five working days.
The data were analysed based on the definitions covered in Chapter 2. Before
analysing the data, some specific points related to office/lab or modern buildings in
general need to be covered.
3.2 Type of loads in modern (commercial) buildings
It has been observed that the greatest power quality problem encountered in modern
commercial buildings is the harmonics which is considered to be steady state variation.
This is as a result of increasing number of non-linear loads connected to the circuits in
the building, as earlier pointed out. Computers (the highest polluter), printers, TVs and
other power electronics equipments (mostly single phase) are the main sources of such
problems.
Some modern commercial buildings have more than 300 PCs. These problems are
internally generated causing the neutral to carry an excessive current which burns the
neutral, resulting in downtime and consequently fire outbreak. The presence of
harmonics in such buildings affects not only themselves but also adjacent consumers.
These buildings require power quality compensators. Traditional old cables used to
have neutrals of smaller sizes because it was noted that they carry little or no currents
[for balanced 3 phase loads]. The advent of massive non-linear loads has changed the
design principles drastically nowadays. Neutrals are now designed to be 1.5 times
bigger than the current carrying phases.
Other Power Quality problems, like Transients [impulsive and oscillatory], Short
duration [instantaneous, momentary or temporary in form of interruptions, sags and
swells] are mostly externally generated. Harmonics are usually internally caused by
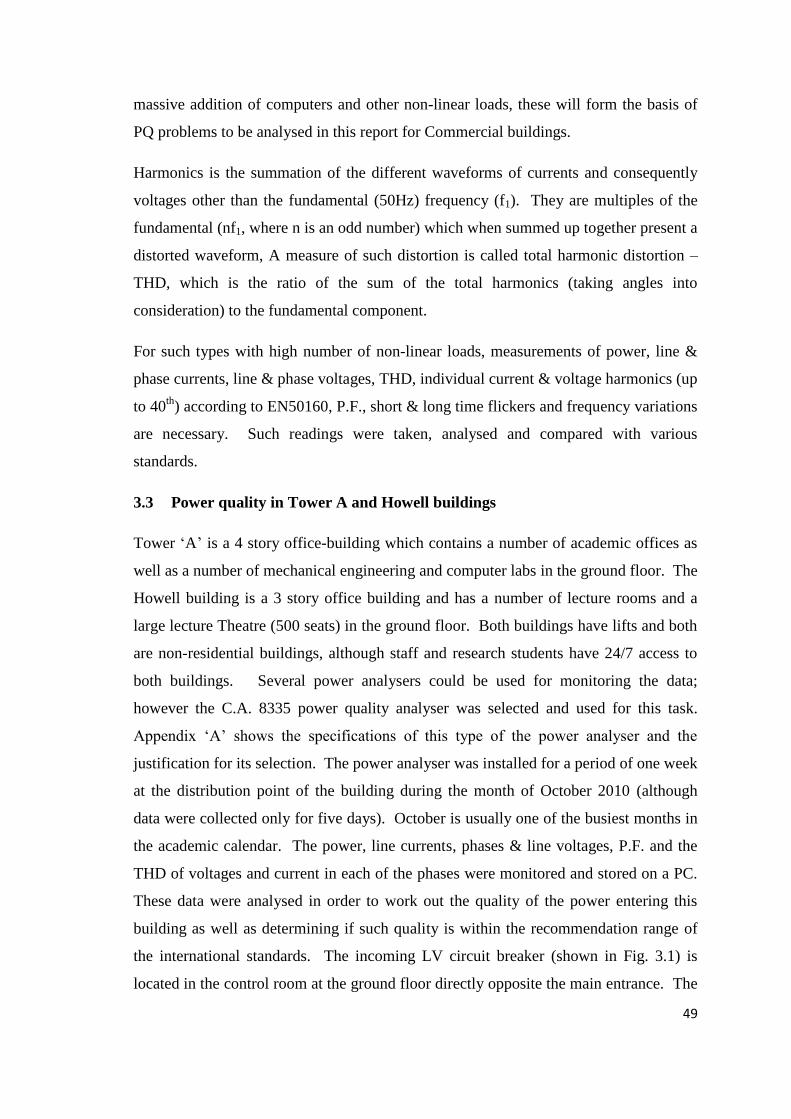
49
massive addition of computers and other non-linear loads, these will form the basis of
PQ problems to be analysed in this report for Commercial buildings.
Harmonics is the summation of the different waveforms of currents and consequently
voltages other than the fundamental (50Hz) frequency (f1). They are multiples of the
fundamental (nf1, where n is an odd number) which when summed up together present a
distorted waveform, A measure of such distortion is called total harmonic distortion –
THD, which is the ratio of the sum of the total harmonics (taking angles into
consideration) to the fundamental component.
For such types with high number of non-linear loads, measurements of power, line &
phase currents, line & phase voltages, THD, individual current & voltage harmonics (up
to 40th
) according to EN50160, P.F., short & long time flickers and frequency variations
are necessary. Such readings were taken, analysed and compared with various
standards.
3.3 Power quality in Tower A and Howell buildings
Tower „A‟ is a 4 story office-building which contains a number of academic offices as
well as a number of mechanical engineering and computer labs in the ground floor. The
Howell building is a 3 story office building and has a number of lecture rooms and a
large lecture Theatre (500 seats) in the ground floor. Both buildings have lifts and both
are non-residential buildings, although staff and research students have 24/7 access to
both buildings. Several power analysers could be used for monitoring the data;
however the C.A. 8335 power quality analyser was selected and used for this task.
Appendix „A‟ shows the specifications of this type of the power analyser and the
justification for its selection. The power analyser was installed for a period of one week
at the distribution point of the building during the month of October 2010 (although
data were collected only for five days). October is usually one of the busiest months in
the academic calendar. The power, line currents, phases & line voltages, P.F. and the
THD of voltages and current in each of the phases were monitored and stored on a PC.
These data were analysed in order to work out the quality of the power entering this
building as well as determining if such quality is within the recommendation range of
the international standards. The incoming LV circuit breaker (shown in Fig. 3.1) is
located in the control room at the ground floor directly opposite the main entrance. The
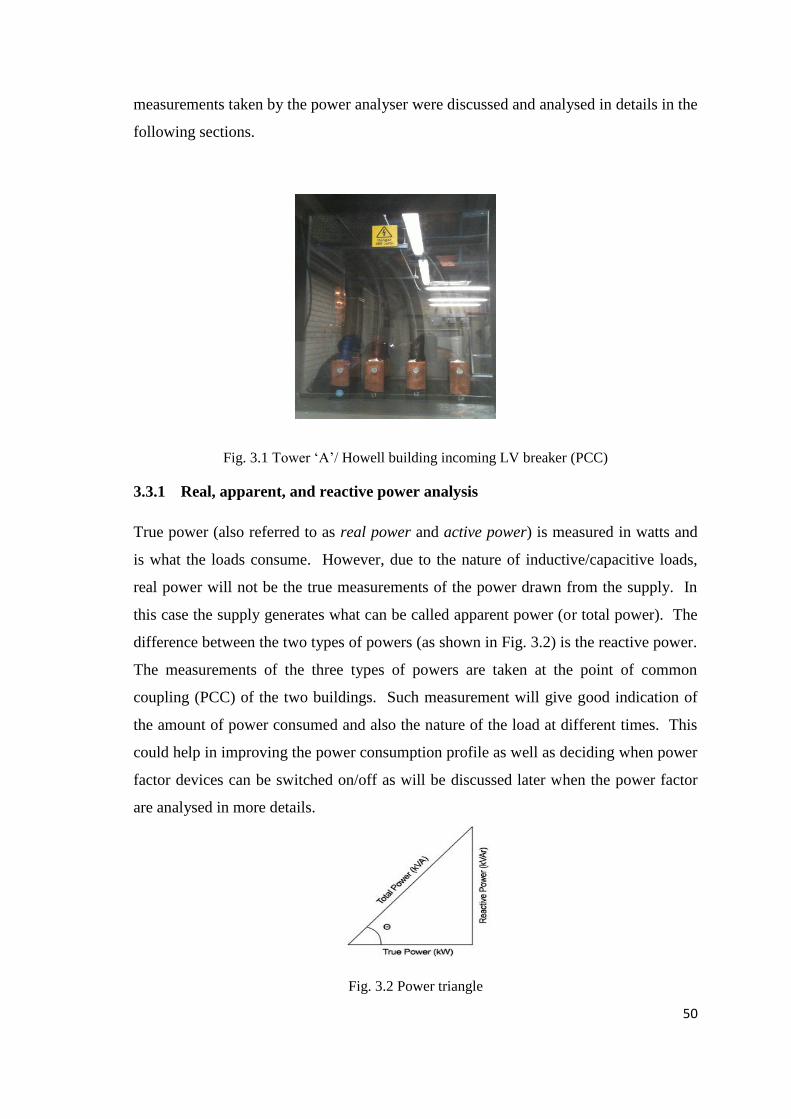
50
measurements taken by the power analyser were discussed and analysed in details in the
following sections.
Fig. 3.1 Tower „A‟/ Howell building incoming LV breaker (PCC)
3.3.1 Real, apparent, and reactive power analysis
True power (also referred to as real power and active power) is measured in watts and
is what the loads consume. However, due to the nature of inductive/capacitive loads,
real power will not be the true measurements of the power drawn from the supply. In
this case the supply generates what can be called apparent power (or total power). The
difference between the two types of powers (as shown in Fig. 3.2) is the reactive power.
The measurements of the three types of powers are taken at the point of common
coupling (PCC) of the two buildings. Such measurement will give good indication of
the amount of power consumed and also the nature of the load at different times. This
could help in improving the power consumption profile as well as deciding when power
factor devices can be switched on/off as will be discussed later when the power factor
are analysed in more details.
Fig. 3.2 Power triangle

51
Fig. 3.3 illustrates the total power consumption for a typical week day. As expected the
maximum power was consumed during the peak „academic‟ time which is between
10:00 am and 4:30 p.m. The figure also illustrated the difference between the real and
apparent powers. It should be noted that there are power factor correction capacitors
installed at the PCC and therefore the reactive power shown in Fig. 3.3 is after the PF
correction, hence its low level. The figure also shows that even when the power
consumption is at minimum there is still certain amount of reactive power drawn.
F
i
g
Fig.3.3 The pattern of the powers in a typical working day
3.3.2 Current Waveform Analysis
Fig. 3.4 showed that the line currents varied widely because of unbalanced loading.
Percentage unbalance is the maximum deviation from the average of the 3-phase
voltages or currents, divided by the average of the 3-phase voltages or currents
expressed in percent. The highest current unbalance loading was noticed to be 15% as
shown in Fig. 3.6. The current unbalance occurs because the installation is constituted
mainly by single phase loads and these loads are not distributed properly on the three
phases. Poor load distribution may cause the system to become overloaded in a
particular phase and have another phase underloaded. High neutral current leads to
increase in power losses and overheating of equipments. The graph Fig. 3.6 gives an
idea of the possibilities to correct the problem, informing the times of the unbalance,
making it easier to interchange loads between phases. The 100A minimum on line A1
Tower A Load Curves Tue. 26th Oct.
0
50
100
150
200
250
300
350
00:0
5:08
01:2
1:56
02:3
8:44
03:5
5:32
05:1
2:20
06:2
9:08
07:4
5:56
09:0
2:44
10:1
9:32
11:3
6:20
12:5
3:08
14:0
9:56
15:2
6:44
16:4
3:32
18:0
0:20
19:1
7:08
20:3
3:56
21:5
0:44
23:0
7:32
Times of the day
KW
; KV
AR
; KV
A
KW
KVAR
KVA

52
of the 28th
and 200A maximum on line A3 of the 29th
might be as a result of little or no
activities during the nights in the buildings. The weekdays of Wednesday and Thursday
were not as high as that of Tuesday the 26th
. The highest neutral current was observed
to be 116Amps, Fig. 3.5. The high level of neutral current was due to the unbalanced
loading between the phases and the harmonics caused by the non-linear loads in these
buildings as noted in Fig. 3.6.
Fig. 3.4 Line and Neutral currents of Tower „A‟ office building
Fig. 3.5 Trend graph of RMS current in neutral of Tower A/Howell buildings.
Fig. 3.6 Graph of the percent unbalance of average current Tower A/Howell buildings.

53
The Tuesday 26th
was noticed to be the highest working day of the week (250A min on
A2 and 450A max on A1) as shown Fig. 3.7. The neutral current was quite high (about
116A) on that Tuesday, because of unbalanced loading of the phases and most of the
loads in these buildings are nonlinear loads, such as PCs, laser printers, adjustable-
speed motor drives, UPS etc. All these electronic devices present non-linear
characteristics, as they draw non-sinusoidal wave-forms of current from the supply.
These devices have become the main cause of current unbalance and consequently
voltage distortion. The neutral current, which is supposed to be zero or negligible for
balanced 3-phase load, was high and this could make to neutral cable becoming hot and
the link joint becoming severely burnt. This could lead to floating neutral, fluctuation
in the supply voltage and a possible fire outbreak. However, the neutral conductor was
noticed to be of the same size as the line conductors in this building. Even when the
loading on the three phases looked balanced between 00:05:08 to 09:02:44 (Fig. 3.7)
the neutral current was not zero. This is as a result of non-linearity of the load which
consists of so many PCs. Although PCs should be turned off at night but the majority
of the staff/students leave them on the sleep mode. PCs still draw distorted the current
in the sleep mode as shown in Fig. 3.8.
The loading between 9:11:16 and 17:09:08 was above 300A, the phase-1 load was
about 400A during the period (between 12:36:44 and 14:00:00), and this was the time
that the neutral current reached the highest peak of 116A (Fig. 3.7)
Fig. 3.7 Current waveform of Tuesday Oct. 26th
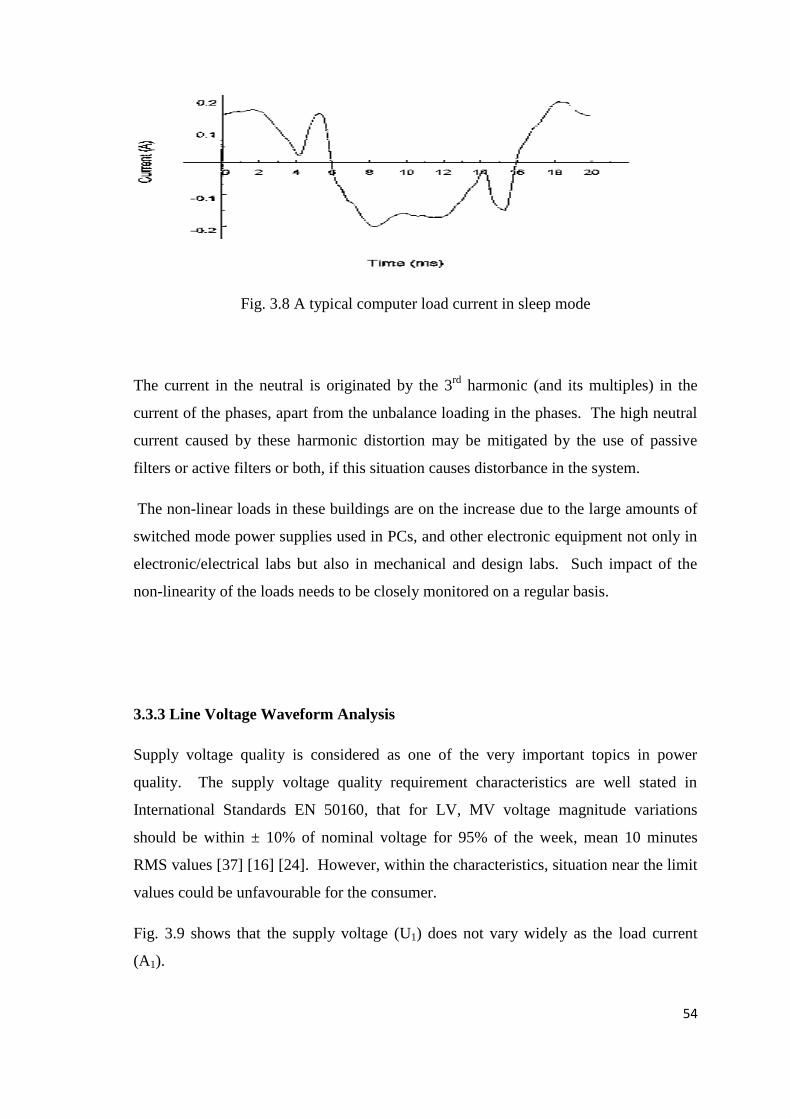
54
Fig. 3.8 A typical computer load current in sleep mode
The current in the neutral is originated by the 3rd
harmonic (and its multiples) in the
current of the phases, apart from the unbalance loading in the phases. The high neutral
current caused by these harmonic distortion may be mitigated by the use of passive
filters or active filters or both, if this situation causes distorbance in the system.
The non-linear loads in these buildings are on the increase due to the large amounts of
switched mode power supplies used in PCs, and other electronic equipment not only in
electronic/electrical labs but also in mechanical and design labs. Such impact of the
non-linearity of the loads needs to be closely monitored on a regular basis.
3.3.3 Line Voltage Waveform Analysis
Supply voltage quality is considered as one of the very important topics in power
quality. The supply voltage quality requirement characteristics are well stated in
International Standards EN 50160, that for LV, MV voltage magnitude variations
should be within ± 10% of nominal voltage for 95% of the week, mean 10 minutes
RMS values [37] [16] [24]. However, within the characteristics, situation near the limit
values could be unfavourable for the consumer.
Fig. 3.9 shows that the supply voltage (U1) does not vary widely as the load current
(A1).

55
Fig. 3.9 Supplied Voltage (U1) & Drawn Current (A1)
The supplied line voltages (U1, U2, and U3) are shown in Fig. 3.10. The minimum
supply voltage of 427.4 volts (U3) occurs on 25th
October, and the highest was 445.1
volts on 29th
October. Though these voltages are within the ±10% of the EN50160
Standard limits [17, 23, 37], but they are consistently on the high side, which is
unfavourable to the consumer. This statement is proved in the later part of this thesis.
The nearer a user is to the injection substation, the higher the supplied voltage. The
Uxbridge campus of Brunel University is located close to the Transmission Injection
Substation, and as such, the supply voltage would be on the high side. The size of the
load is also a major factor, as the load moment along the line affects supply voltage.
Fig. 3.10 Supply line voltages U1, U2, U3 for the week
3.3.4 Phase Voltage Waveform Analysis.
The phase voltages in Fig. 3.11 has the highest value of 257.5V (V3rms) on the 27th
and
minimum of 245.9V (V1rms) of the same day.
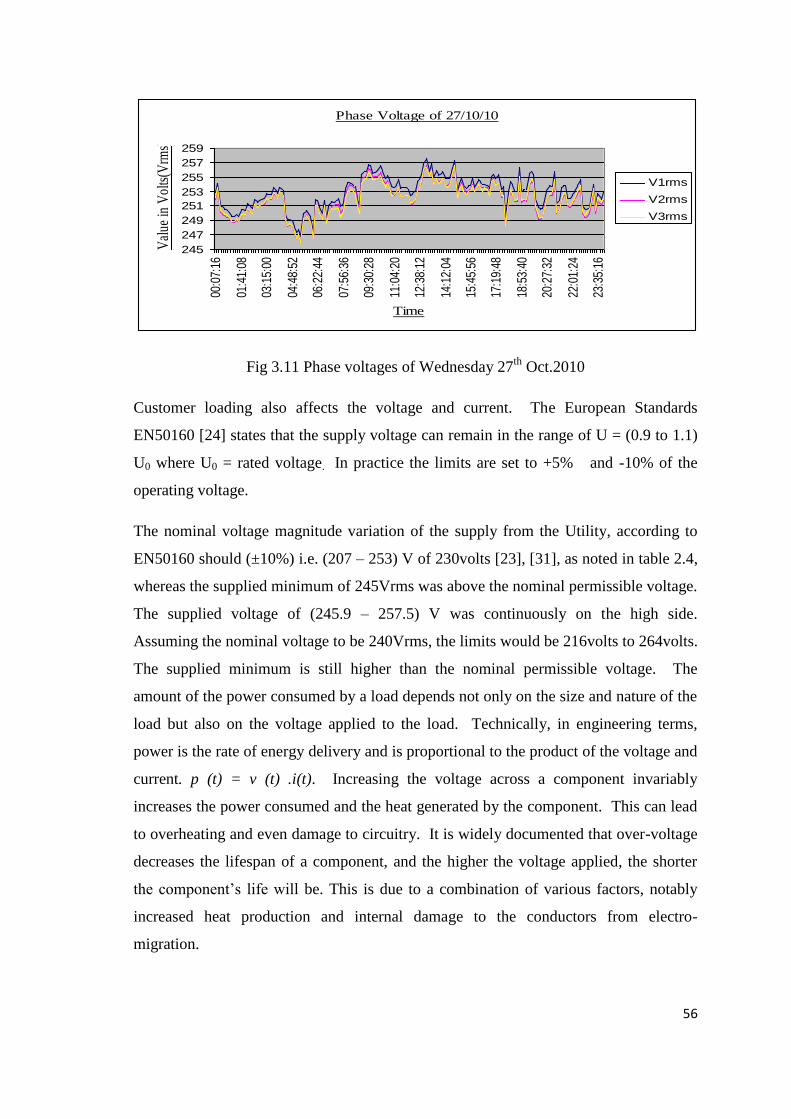
56
Phase Voltage of 27/10/10
245
247
249
251
253
255
257
259
00:0
7:16
01:4
1:08
03:1
5:00
04:4
8:52
06:2
2:44
07:5
6:36
09:3
0:28
11:0
4:20
12:3
8:12
14:1
2:04
15:4
5:56
17:1
9:48
18:5
3:40
20:2
7:32
22:0
1:24
23:3
5:16
Time
Val
ue in
Vol
ts(V
rms)
V1rms
V2rms
V3rms
Fig 3.11 Phase voltages of Wednesday 27th
Oct.2010
Customer loading also affects the voltage and current. The European Standards
EN50160 [24] states that the supply voltage can remain in the range of U = (0.9 to 1.1)
U0 where U0 = rated voltage. In practice the limits are set to +5% and -10% of the
operating voltage.
The nominal voltage magnitude variation of the supply from the Utility, according to
EN50160 should (±10%) i.e. (207 – 253) V of 230volts [23], [31], as noted in table 2.4,
whereas the supplied minimum of 245Vrms was above the nominal permissible voltage.
The supplied voltage of (245.9 – 257.5) V was continuously on the high side.
Assuming the nominal voltage to be 240Vrms, the limits would be 216volts to 264volts.
The supplied minimum is still higher than the nominal permissible voltage. The
amount of the power consumed by a load depends not only on the size and nature of the
load but also on the voltage applied to the load. Technically, in engineering terms,
power is the rate of energy delivery and is proportional to the product of the voltage and
current. p (t) = v (t) .i(t). Increasing the voltage across a component invariably
increases the power consumed and the heat generated by the component. This can lead
to overheating and even damage to circuitry. It is widely documented that over-voltage
decreases the lifespan of a component, and the higher the voltage applied, the shorter
the component‟s life will be. This is due to a combination of various factors, notably
increased heat production and internal damage to the conductors from electro-
migration.
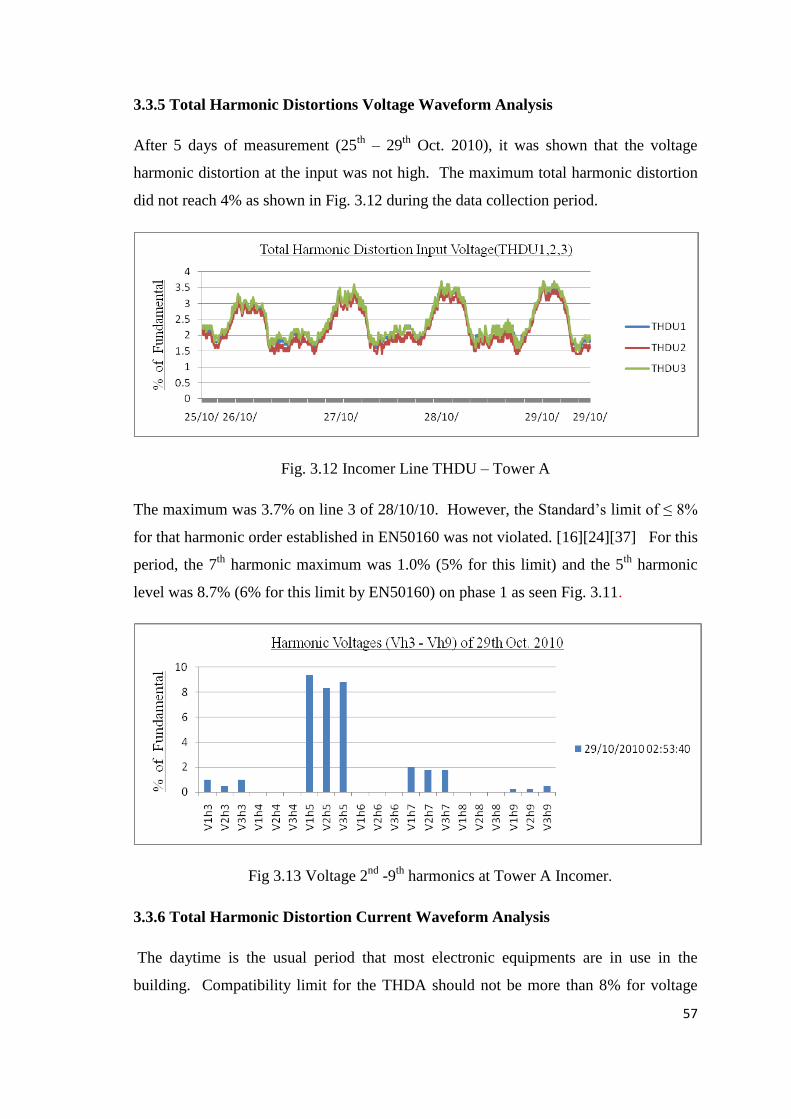
57
3.3.5 Total Harmonic Distortions Voltage Waveform Analysis
After 5 days of measurement (25th
– 29th
Oct. 2010), it was shown that the voltage
harmonic distortion at the input was not high. The maximum total harmonic distortion
did not reach 4% as shown in Fig. 3.12 during the data collection period.
Fig. 3.12 Incomer Line THDU – Tower A
The maximum was 3.7% on line 3 of 28/10/10. However, the Standard‟s limit of ≤ 8%
for that harmonic order established in EN50160 was not violated. [16][24][37] For this
period, the 7th
harmonic maximum was 1.0% (5% for this limit) and the 5th
harmonic
level was 8.7% (6% for this limit by EN50160) on phase 1 as seen Fig. 3.11.
Fig 3.13 Voltage 2nd
-9th
harmonics at Tower A Incomer.
3.3.6 Total Harmonic Distortion Current Waveform Analysis
The daytime is the usual period that most electronic equipments are in use in the
building. Compatibility limit for the THDA should not be more than 8% for voltage

58
and 20% for current THD, as established in EN-50160 standard [16]. The building has
many electronic types of equipment which are the main sources of harmonic distortion
especially the 3th
harmonic level. These are air-conditioning systems and elevator,
many PCs and terminals, several printers, copiers and other power electronic gadgets
like microprocessor – based control and instrumentation devices. Switch Mode Power
Supply (SMPS) produce a lot of harmonics, especially problematic in commercial
buildings due to many computers and office equipments. The highest total harmonic
distortion for current was less than 20% as shown in Fig. 3.12. This value has not
trangressed the standard of 20% [23].
Fig. 3.14 Total Harmonic Distortions of current for Tower A
Fig. 3.13 of different odd harmonics( 3rd
5th
and 7th
) showed that the harmonic levels
are under the EN50160 standard limits, as they were less than the stipulated 20% limits.
The highest level was 15.5% on A1h3 of 26/10/10 [10].
Fig. 3.15 (3rd
, 5th
, & 7th
) Current harmonic distortion of Line1

59
3.3.7 The Reactive Loading of Tower ‘A’/ Howell Building.
The reactance (KVAR) of the inductive loads is 180% out of phase with the installed
capacitors and the resultant sum is reduction in the reactive load and improvement of
the PF. Fig. 3.14 shows the period of the night that the reactive load were negative
indicating that the fixed capacitors over-compensated for the inductive load.
Fig. 3.16 Tower A Reactive loading of 28th October 2010
The power factor in each of the 3 phases is shown in Fig. 3.15. The power factor
shown in the figure is the product of the displacement and the distortion factors. It can
be seen that the phase 2 has the poorest PF compared to the other two phases. This
could be due to the fact that this phase feeds most of the non-linear loads (e.g.
computers). The phase 1 could be the one that feeds the lift and other linear loads
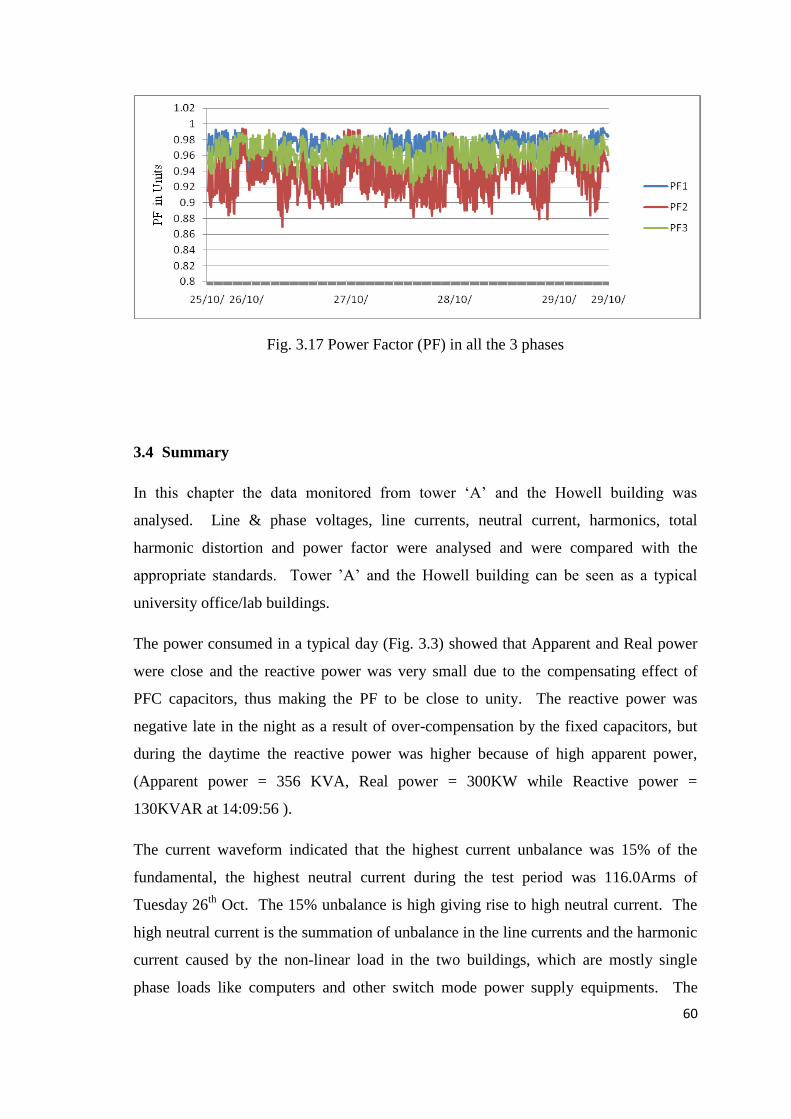
60
Fig. 3.17 Power Factor (PF) in all the 3 phases
3.4 Summary
In this chapter the data monitored from tower „A‟ and the Howell building was
analysed. Line & phase voltages, line currents, neutral current, harmonics, total
harmonic distortion and power factor were analysed and were compared with the
appropriate standards. Tower ‟A‟ and the Howell building can be seen as a typical
university office/lab buildings.
The power consumed in a typical day (Fig. 3.3) showed that Apparent and Real power
were close and the reactive power was very small due to the compensating effect of
PFC capacitors, thus making the PF to be close to unity. The reactive power was
negative late in the night as a result of over-compensation by the fixed capacitors, but
during the daytime the reactive power was higher because of high apparent power,
(Apparent power = 356 KVA, Real power = 300KW while Reactive power =
130KVAR at 14:09:56 ).
The current waveform indicated that the highest current unbalance was 15% of the
fundamental, the highest neutral current during the test period was 116.0Arms of
Tuesday 26th
Oct. The 15% unbalance is high giving rise to high neutral current. The
high neutral current is the summation of unbalance in the line currents and the harmonic
current caused by the non-linear load in the two buildings, which are mostly single
phase loads like computers and other switch mode power supply equipments. The
61
unbalance loading on all the three phases has made neutral current to be high (Fig 3.5).
The neutral current for a balanced 3-phase and linear load should be zero. High neutral
current cause overheating heating and the triple-N harmonic currents could pass over to
the delta side of the delta-star transformer and circulate there, thus causing overheating
even when the transformer is not overloaded. The current THDA was 18.7% on the
29th
on phase 1 (Fig. 3.12). The 3rd
harmonic was the highest, 15.5% (Fig. 3.13)
The neutral current An was very high as shown in Fig.3.7, as the phase current was as
high as 116A on the 26th
October. This could be due to unbalanced loading of the
different phases and harmonic distortion. The unbalance was due to single-phase load
in the buildings, which could be corrected by rebalancing the loads between the phases.
The supply voltage (U1, U2, and U3) was high, as it varied between 427volts and
445volts on line 3 (U3) during the test period. This high voltage level could lead to
unnecessary high consumption of energy even if the limits fall within the stipulated
International Standards EN50160. The phase voltages varied between 257.5volts
highest and 245.9volts minimum on 27th
October as noted in Fig. 3.9, this high voltage
is unnecessary and leads to higher billing.
The THDV at the input was not high, it was 3.7% (Fig.3.10), and EN50160 puts this
limit at ≤ 8%. But the individual harmonics presented different results; the 5th
harmonic
distortion of voltage was 8.7% instead of 6% limit as stipulated by EN50160, which
showed that this limit was violated. The 7th
harmonic distortion level was 1% and the
standard limit is 5% all on phase 1. (Fig.3.11) This limit was not violated. All other
harmonic levels were not violated. Mitigation of the high 5th
harmonic should be by
installation of passive filter tuned to that frequency.
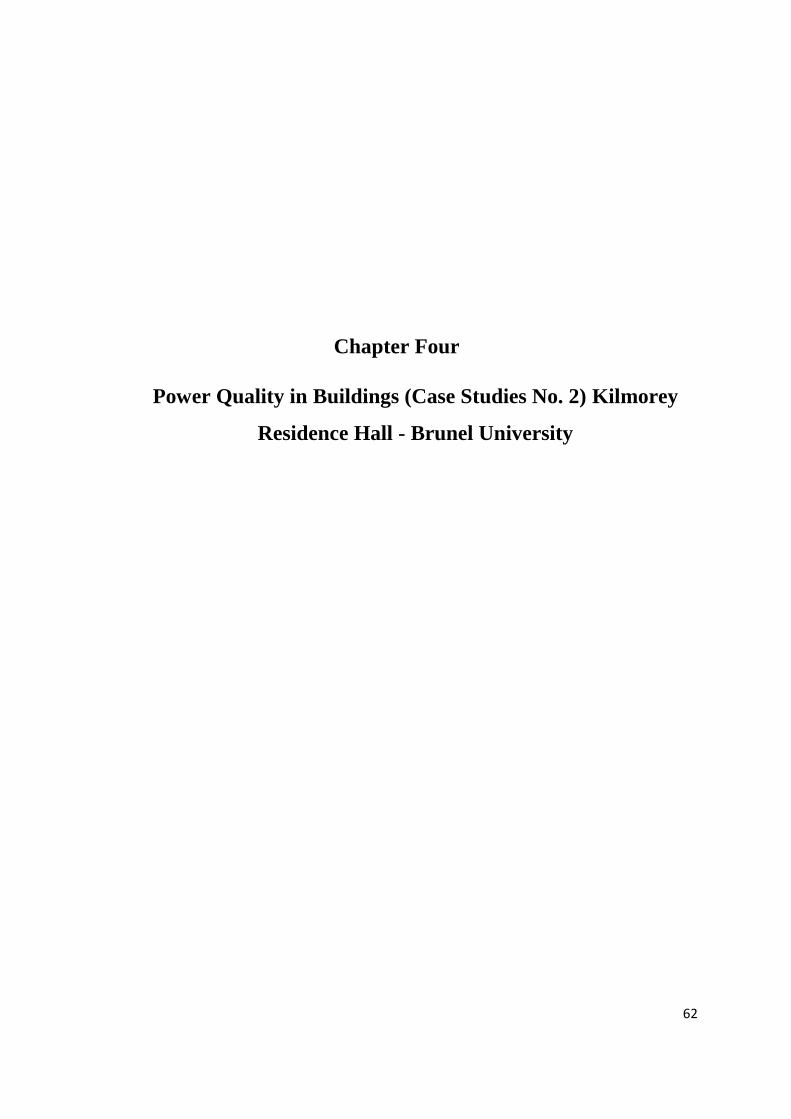
62
Chapter Four
Power Quality in Buildings (Case Studies No. 2) Kilmorey
Residence Hall - Brunel University

63
4.1 Introduction
In chapter 2 the power quality has been reviewed and different terminologies of power
quality were introduced. International professional bodies have established standards
by which PQ could be defined as mentioned earlier on. One of such bodies is the
European Standard EN-50160 [24]. What may be considered as quality power to one
customer may not meet the standard required by another end user. Therefore
Benchmarking indices serving as metrics came to be developed. Benchmark levels for
electricity suppliers, consumers and even manufacturers have been introduced. Some
of these International bodies include Electric Power Research Institute (EPRI), Institute
of Electrical Electronics Engineering (IEEE), International Electrotechnical
Commission (IEC), American National Standards Institute (ANSI) and National
Electrical Manufacturers‟ Association (NEMA). Quality of service is determined by
first selecting the metrics to be used, deciding on what PQ data to be collected and then
determining the pattern of the data with predetermined target level set by both the
power supplier and the consumer. The supplier, the consumer and the regulatory
agencies need to reach a compromise. Another level considered to be very important is
the Performance Level introduced by a specific consumer, which is different but always
higher or equal to the Benchmark values.
In this chapter, a residential case study was introduced and investigated. The case study
consists of real data which was collected over a period of one week for Kilmorey
Residential Hall in the same academic Institution. The building consists of equipments
associated with wholly residential building, probably with more computers, TVs,
florescent lighting with magnetic and electronic ballasts, as well as the usual electric
loads (boilers, electric heaters, etc.). The data was then analysed for each of the phases,
the results critically analysed and some recommendations proposed for improvement of
the quality.

64
4.2 Line Voltage Analysis
A nominal „rms‟ voltage in UK is 240V phase to neutral (Vrms), and 415V phase to
phase (Urms). The graph shown in Fig 4.1 illustrates the variation in the line voltages at
different times of the test period (29th
Oct. – 5th
Nov. ‟10). The data were collected
during the one week with a sampling period of 8 minutes. It could be seen from this
graph that the voltages were not balanced. They vary from 427.0 Urms on phase 1 and
445.0 Urms on phase 3. These recorded data at the input showed that the upper limit is
outside the limits on the upper side (±10%) i.e. between 373.5Vrms and 435.75Vrms of
the nominal line of 415.0 Vrms. The upper limit was exceeded for this building, for
more than 95% of one week, the acceptance time, according to the European Standard –
EN50160 as indicated in appendix B3 [24],[16]
Fig 4.1 Line Voltages to Kilmorey Hall
The voltages in this building continually change as the load currents change leading to
variations in the voltage, normally referred to as voltage variations. If the variations are
within the acceptable limits, it is considered to be alright, but if it is outside the
acceptable limits it becomes short or long duration voltage variation. Long duration
variations can be overvoltage or undervoltage or sustained interruption depending on
the specific circuit magnitude conditions. Short duration variations are for less than
3minutes and could be Instantaneous, Momentary or Temporary for interruption, sag or
swell as defined internationally [9, 37].
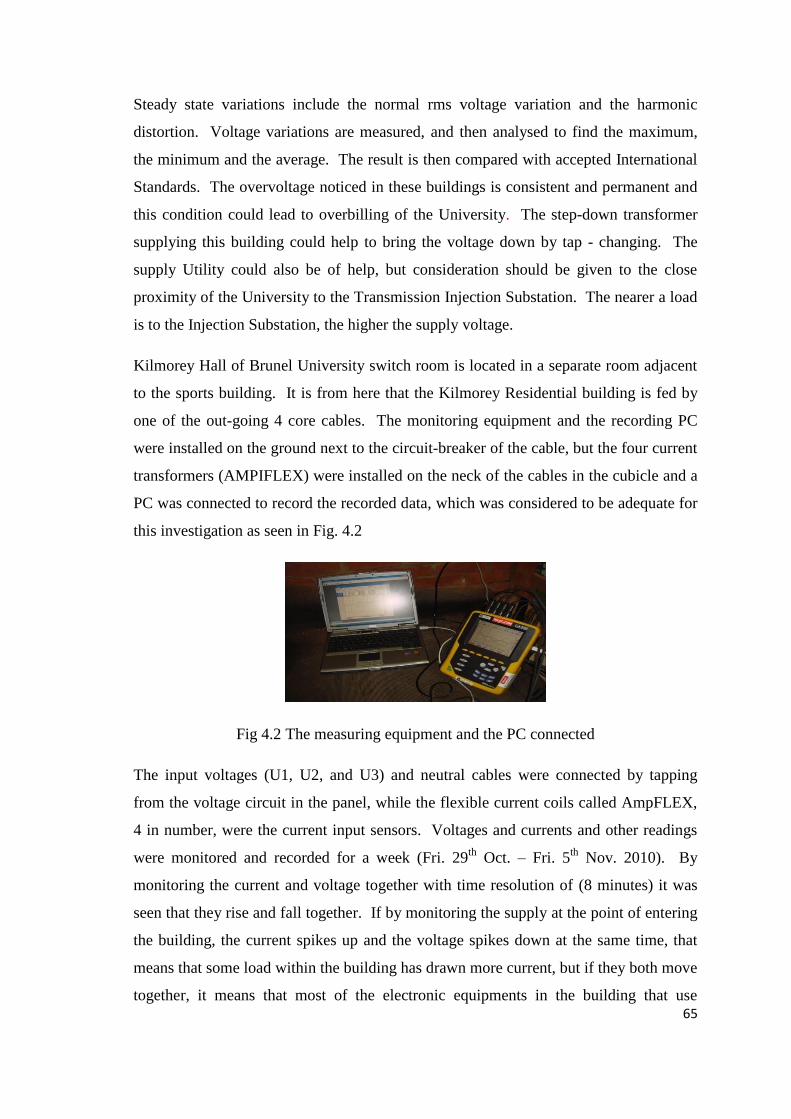
65
Steady state variations include the normal rms voltage variation and the harmonic
distortion. Voltage variations are measured, and then analysed to find the maximum,
the minimum and the average. The result is then compared with accepted International
Standards. The overvoltage noticed in these buildings is consistent and permanent and
this condition could lead to overbilling of the University. The step-down transformer
supplying this building could help to bring the voltage down by tap - changing. The
supply Utility could also be of help, but consideration should be given to the close
proximity of the University to the Transmission Injection Substation. The nearer a load
is to the Injection Substation, the higher the supply voltage.
Kilmorey Hall of Brunel University switch room is located in a separate room adjacent
to the sports building. It is from here that the Kilmorey Residential building is fed by
one of the out-going 4 core cables. The monitoring equipment and the recording PC
were installed on the ground next to the circuit-breaker of the cable, but the four current
transformers (AMPIFLEX) were installed on the neck of the cables in the cubicle and a
PC was connected to record the recorded data, which was considered to be adequate for
this investigation as seen in Fig. 4.2
Fig 4.2 The measuring equipment and the PC connected
The input voltages (U1, U2, and U3) and neutral cables were connected by tapping
from the voltage circuit in the panel, while the flexible current coils called AmpFLEX,
4 in number, were the current input sensors. Voltages and currents and other readings
were monitored and recorded for a week (Fri. 29th
Oct. – Fri. 5th
Nov. 2010). By
monitoring the current and voltage together with time resolution of (8 minutes) it was
seen that they rise and fall together. If by monitoring the supply at the point of entering
the building, the current spikes up and the voltage spikes down at the same time, that
means that some load within the building has drawn more current, but if they both move
together, it means that most of the electronic equipments in the building that use

66
switch–mode power supply (SMPS), and the corresponding harmonics have been
compensated for by filtering.
4.3 Current Total Harmonic Distortion (THDA).
The non – linear loads and devices that cause harmonics can be represented as current
sources of harmonics. The system voltage appears stiff to individual loads but the loads
draw distorted current waveforms.
Harmonics are also sine-waves but at frequencies that are multiples of the mains
frequency, that is, fundamental frequency. Any non-linear measurements on the AC
mains supply can be analysed and it will be found to comprise lots of harmonic
frequencies, some predominant and some not, depending upon the nature of the circuit
and the components that are connected together. The problem with harmonics is that
they do not contribute any useful power. They are undesirable because they distort the
fundamental sine-wave shape which the supplier are obliged to maintain and
furthermore, they draw excessive currents caused by the displacement power factor plus
the combined harmonic power factors. The Kilmorey Hall current harmonic distortions
are as shown below. The prominent were the 3rd
, 5th
and 7th
harmonics, the 9th
and
other harmonics were very small (Fig. 4.3).
The dominant 5th
harmonic‟s maximum was 20% on Sat. 31st October (Fig. 4.3). The
6% compatibility limit for that harmonic order established in EN50160 standard was
violated [27]. The 7th
harmonic was equally high. The most likely cause for this high
level of 5th
harmonic would be the numerous electronic equipments in load. This would
need further investigations because there have been complaints about some outages of
this circuit breaker recently which may be due to nuisance tripping by the Residual
current circuit breaker (RCCB), which operates by summing up the current in the phase
and neutral conductors and if the result is not within the rated limit, the circuit breaker
could trip. Even the THDA maximum was 28.4% on phase 2 of 31st October and this
violated the 20% established limit for the entire installation [25].
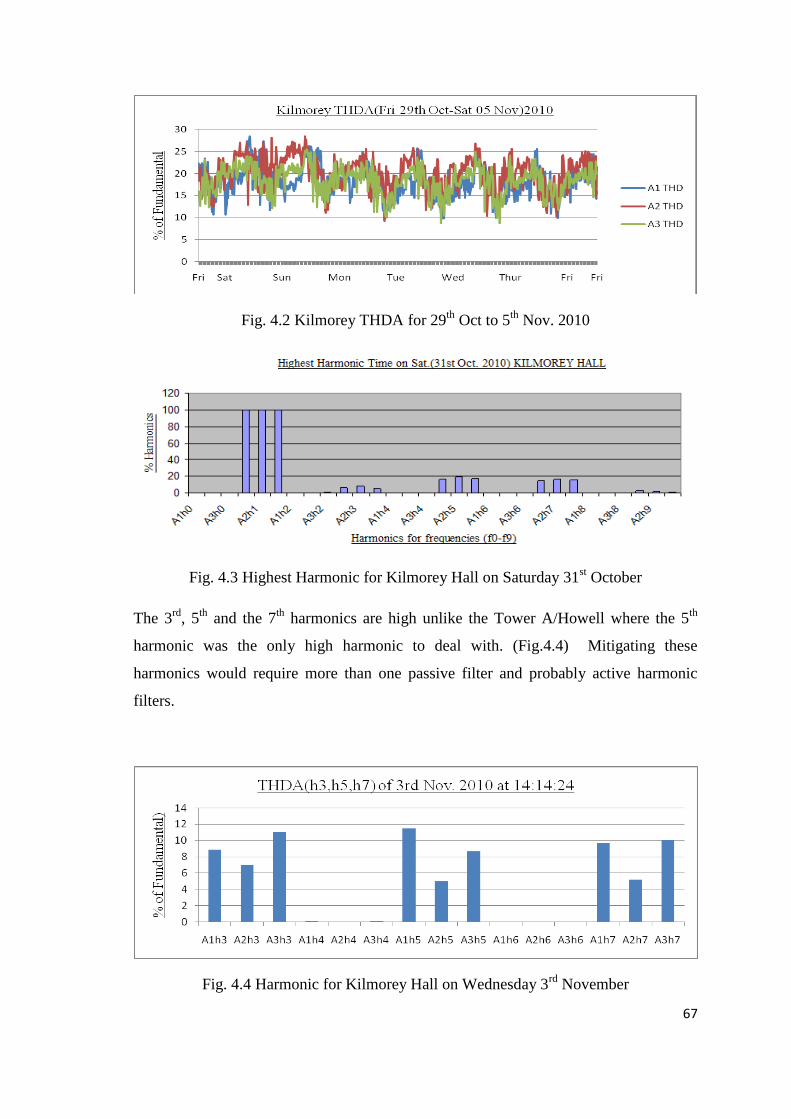
67
Fig. 4.2 Kilmorey THDA for 29th
Oct to 5th
Nov. 2010
Fig. 4.3 Highest Harmonic for Kilmorey Hall on Saturday 31st October
The 3rd
, 5th
and the 7th
harmonics are high unlike the Tower A/Howell where the 5th
harmonic was the only high harmonic to deal with. (Fig.4.4) Mitigating these
harmonics would require more than one passive filter and probably active harmonic
filters.
Fig. 4.4 Harmonic for Kilmorey Hall on Wednesday 3rd
November
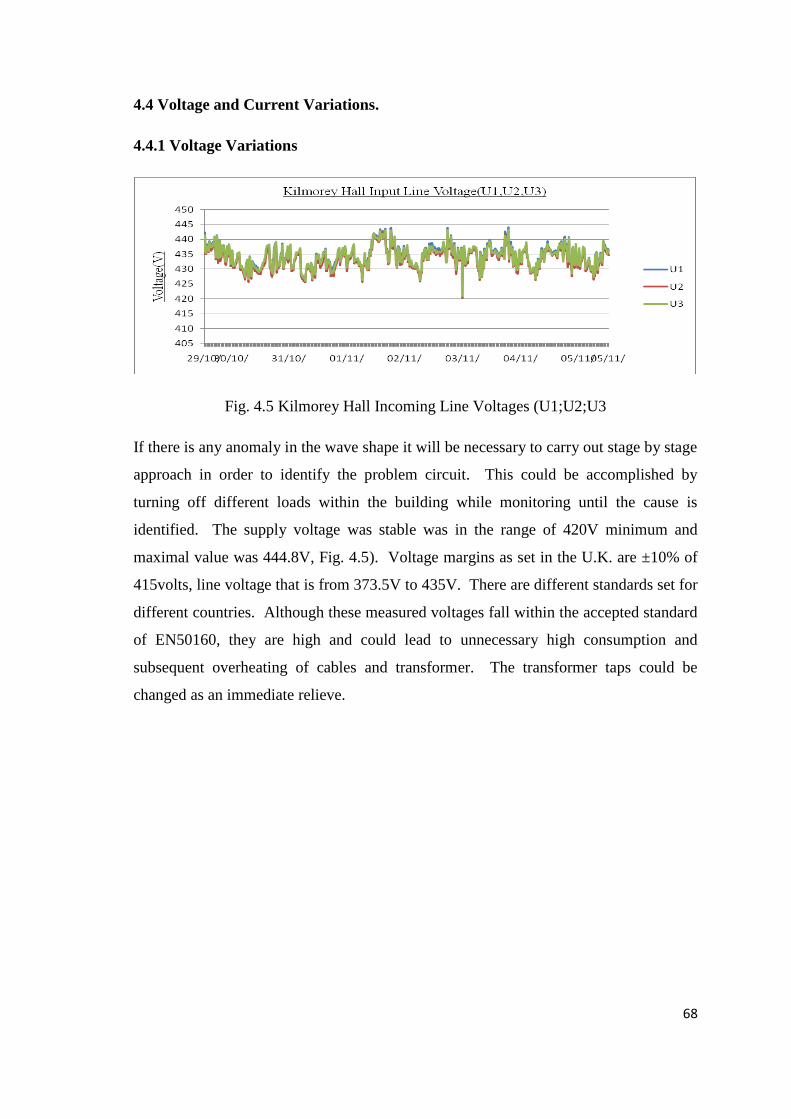
68
4.4 Voltage and Current Variations.
4.4.1 Voltage Variations
Fig. 4.5 Kilmorey Hall Incoming Line Voltages (U1;U2;U3
If there is any anomaly in the wave shape it will be necessary to carry out stage by stage
approach in order to identify the problem circuit. This could be accomplished by
turning off different loads within the building while monitoring until the cause is
identified. The supply voltage was stable was in the range of 420V minimum and
maximal value was 444.8V, Fig. 4.5). Voltage margins as set in the U.K. are ±10% of
415volts, line voltage that is from 373.5V to 435V. There are different standards set for
different countries. Although these measured voltages fall within the accepted standard
of EN50160, they are high and could lead to unnecessary high consumption and
subsequent overheating of cables and transformer. The transformer taps could be
changed as an immediate relieve.
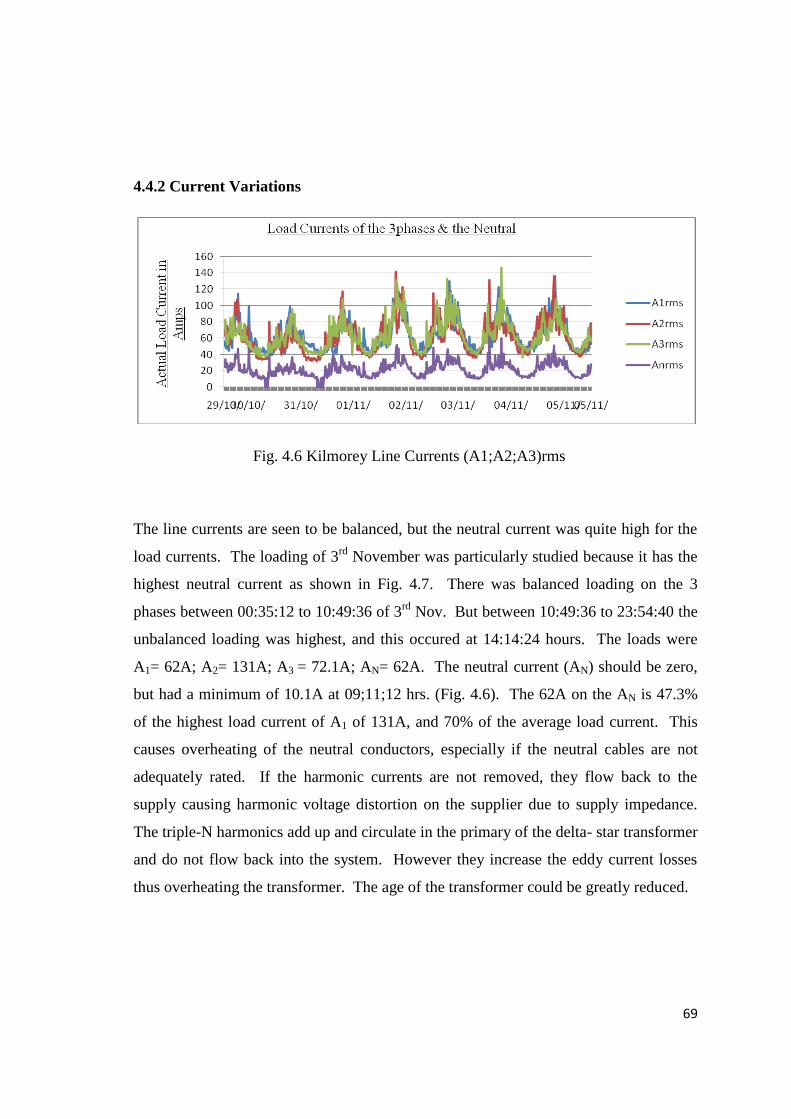
69
4.4.2 Current Variations
Fig. 4.6 Kilmorey Line Currents (A1;A2;A3)rms
The line currents are seen to be balanced, but the neutral current was quite high for the
load currents. The loading of 3rd
November was particularly studied because it has the
highest neutral current as shown in Fig. 4.7. There was balanced loading on the 3
phases between 00:35:12 to 10:49:36 of 3rd
Nov. But between 10:49:36 to 23:54:40 the
unbalanced loading was highest, and this occured at 14:14:24 hours. The loads were
A1= 62A; A2= 131A; A3 = 72.1A; AN= 62A. The neutral current (AN) should be zero,
but had a minimum of 10.1A at 09;11;12 hrs. (Fig. 4.6). The 62A on the AN is 47.3%
of the highest load current of A1 of 131A, and 70% of the average load current. This
causes overheating of the neutral conductors, especially if the neutral cables are not
adequately rated. If the harmonic currents are not removed, they flow back to the
supply causing harmonic voltage distortion on the supplier due to supply impedance.
The triple-N harmonics add up and circulate in the primary of the delta- star transformer
and do not flow back into the system. However they increase the eddy current losses
thus overheating the transformer. The age of the transformer could be greatly reduced.
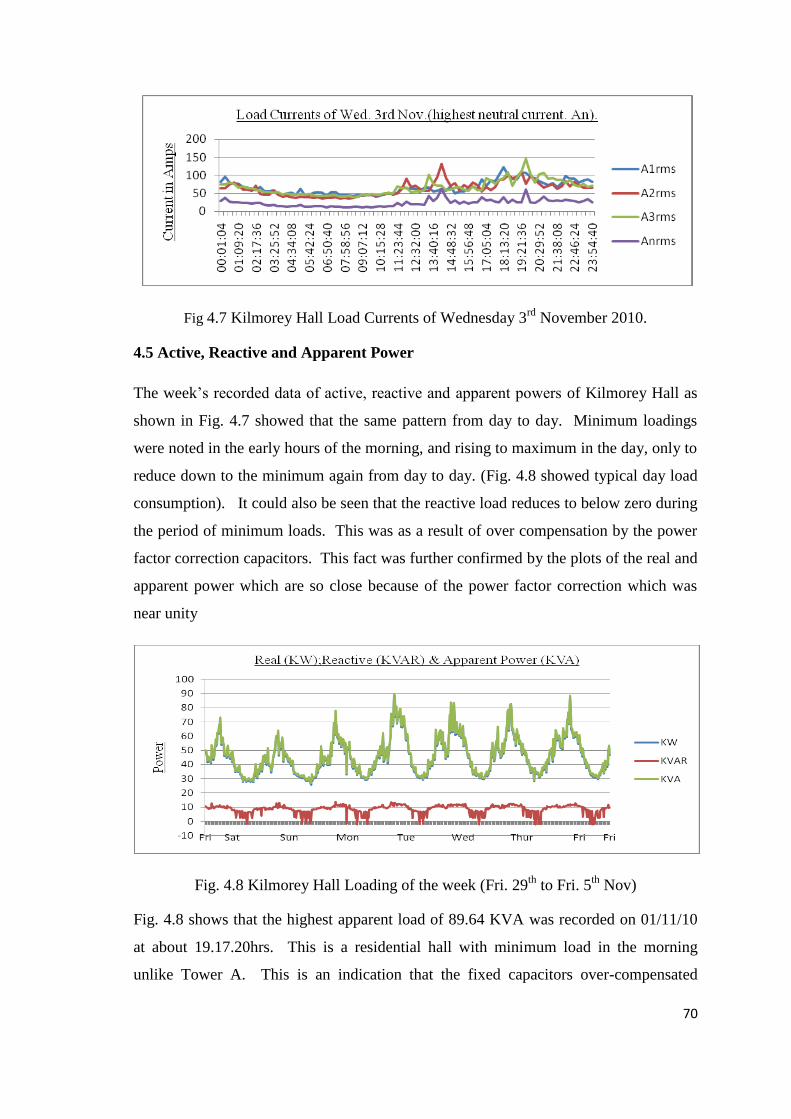
70
Fig 4.7 Kilmorey Hall Load Currents of Wednesday 3rd
November 2010.
4.5 Active, Reactive and Apparent Power
The week‟s recorded data of active, reactive and apparent powers of Kilmorey Hall as
shown in Fig. 4.7 showed that the same pattern from day to day. Minimum loadings
were noted in the early hours of the morning, and rising to maximum in the day, only to
reduce down to the minimum again from day to day. (Fig. 4.8 showed typical day load
consumption). It could also be seen that the reactive load reduces to below zero during
the period of minimum loads. This was as a result of over compensation by the power
factor correction capacitors. This fact was further confirmed by the plots of the real and
apparent power which are so close because of the power factor correction which was
near unity
Fig. 4.8 Kilmorey Hall Loading of the week (Fri. 29th
to Fri. 5th
Nov)
Fig. 4.8 shows that the highest apparent load of 89.64 KVA was recorded on 01/11/10
at about 19.17.20hrs. This is a residential hall with minimum load in the morning
unlike Tower A. This is an indication that the fixed capacitors over-compensated
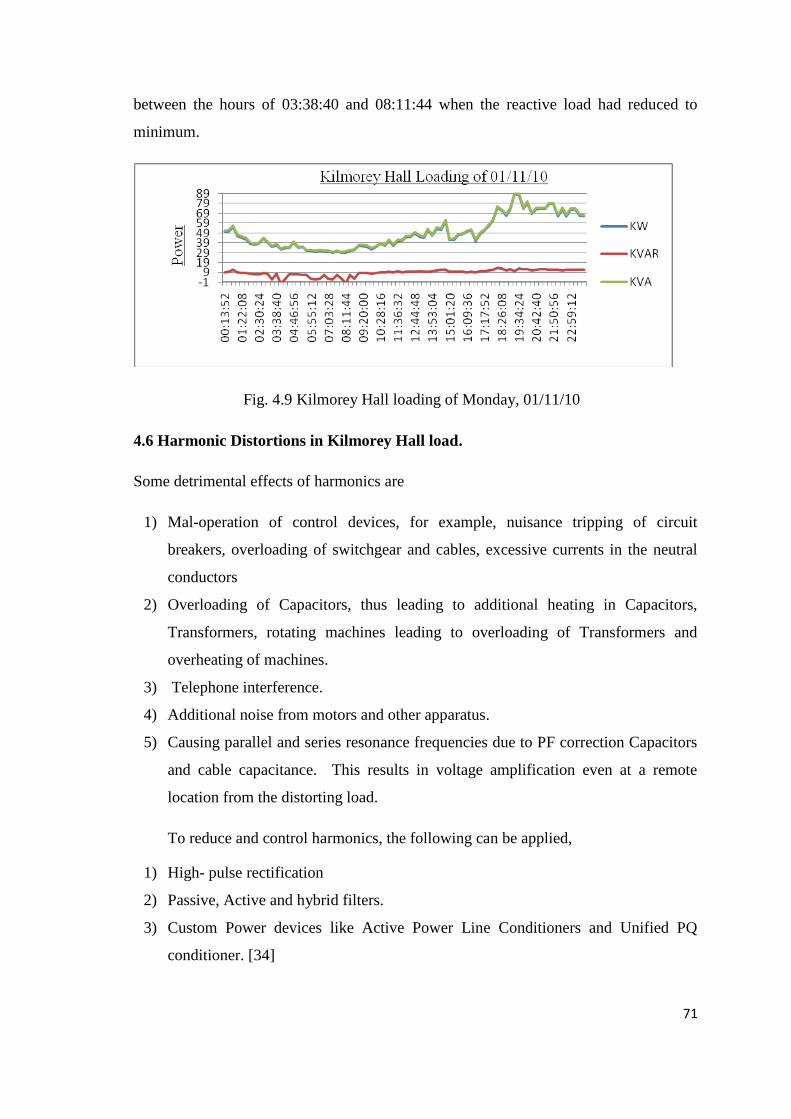
71
between the hours of 03:38:40 and 08:11:44 when the reactive load had reduced to
minimum.
Fig. 4.9 Kilmorey Hall loading of Monday, 01/11/10
4.6 Harmonic Distortions in Kilmorey Hall load.
Some detrimental effects of harmonics are
1) Mal-operation of control devices, for example, nuisance tripping of circuit
breakers, overloading of switchgear and cables, excessive currents in the neutral
conductors
2) Overloading of Capacitors, thus leading to additional heating in Capacitors,
Transformers, rotating machines leading to overloading of Transformers and
overheating of machines.
3) Telephone interference.
4) Additional noise from motors and other apparatus.
5) Causing parallel and series resonance frequencies due to PF correction Capacitors
and cable capacitance. This results in voltage amplification even at a remote
location from the distorting load.
To reduce and control harmonics, the following can be applied,
1) High- pulse rectification
2) Passive, Active and hybrid filters.
3) Custom Power devices like Active Power Line Conditioners and Unified PQ
conditioner. [34]
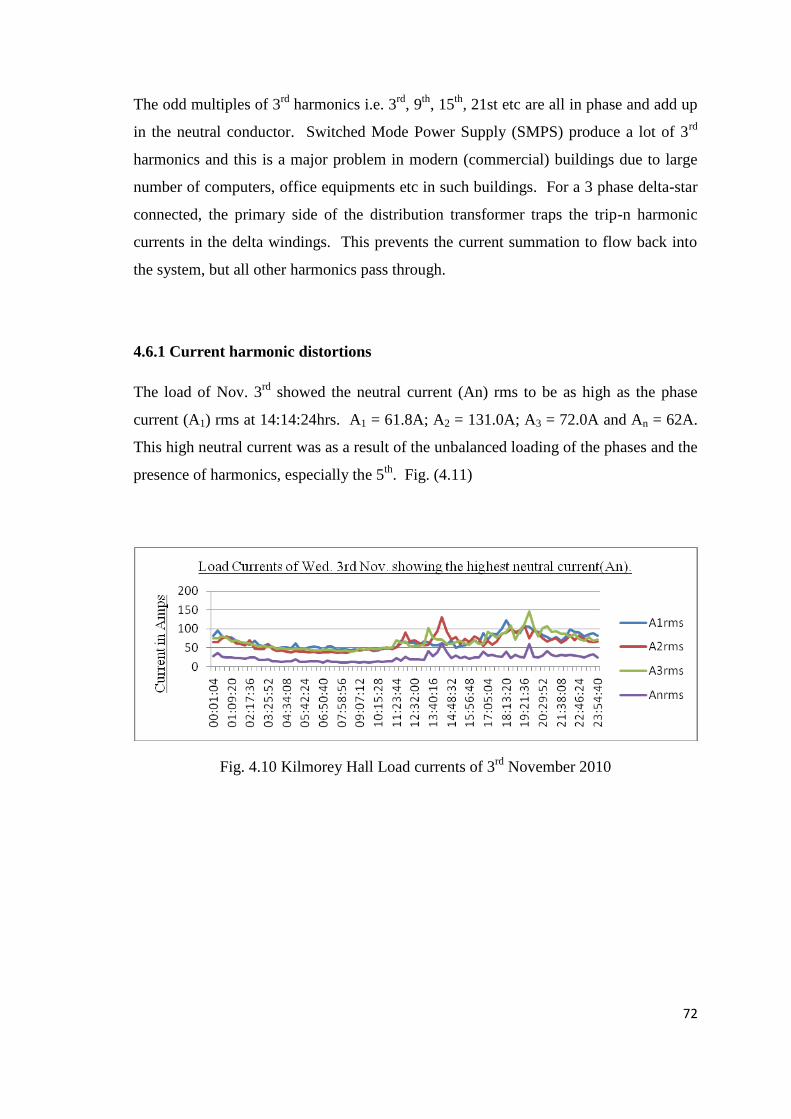
72
The odd multiples of 3rd
harmonics i.e. 3rd
, 9th
, 15th
, 21st etc are all in phase and add up
in the neutral conductor. Switched Mode Power Supply (SMPS) produce a lot of 3rd
harmonics and this is a major problem in modern (commercial) buildings due to large
number of computers, office equipments etc in such buildings. For a 3 phase delta-star
connected, the primary side of the distribution transformer traps the trip-n harmonic
currents in the delta windings. This prevents the current summation to flow back into
the system, but all other harmonics pass through.
4.6.1 Current harmonic distortions
The load of Nov. 3rd
showed the neutral current (An) rms to be as high as the phase
current (A1) rms at 14:14:24hrs. A1 = 61.8A; A2 = 131.0A; A3 = 72.0A and An = 62A.
This high neutral current was as a result of the unbalanced loading of the phases and the
presence of harmonics, especially the 5th
. Fig. (4.11)
Fig. 4.10 Kilmorey Hall Load currents of 3rd
November 2010
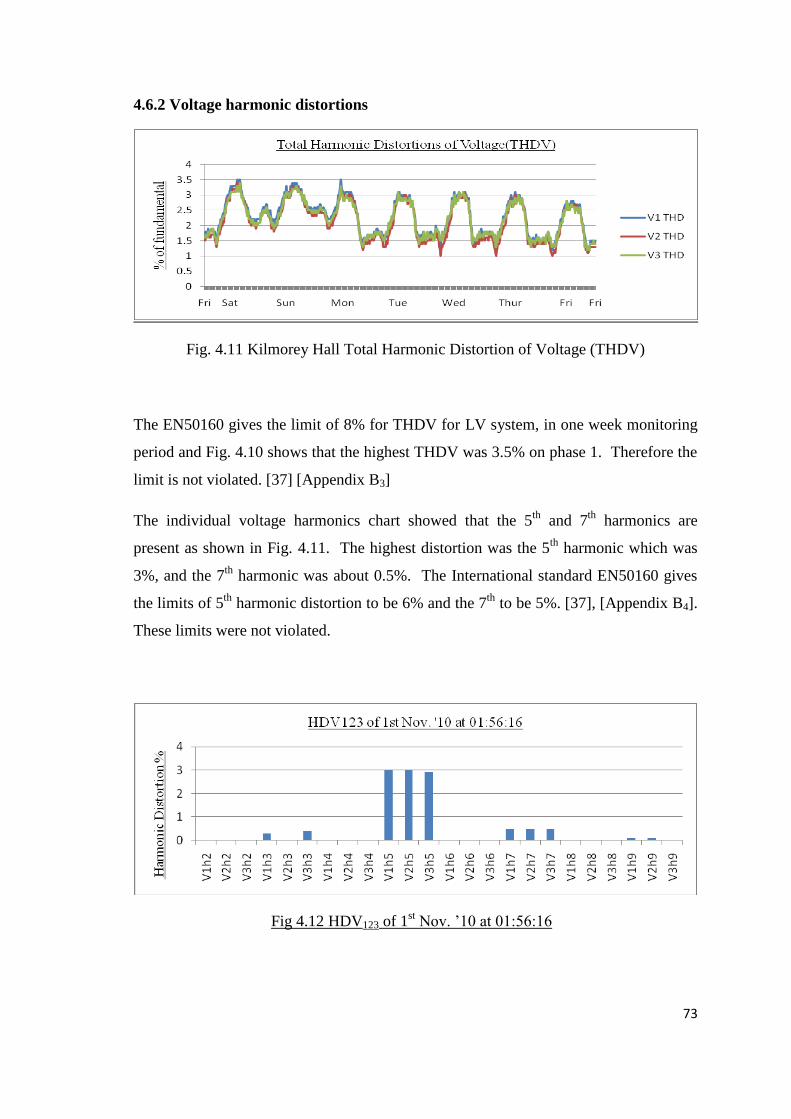
73
4.6.2 Voltage harmonic distortions
Fig. 4.11 Kilmorey Hall Total Harmonic Distortion of Voltage (THDV)
The EN50160 gives the limit of 8% for THDV for LV system, in one week monitoring
period and Fig. 4.10 shows that the highest THDV was 3.5% on phase 1. Therefore the
limit is not violated. [37] [Appendix B3]
The individual voltage harmonics chart showed that the 5th
and 7th
harmonics are
present as shown in Fig. 4.11. The highest distortion was the 5th
harmonic which was
3%, and the 7th
harmonic was about 0.5%. The International standard EN50160 gives
the limits of 5th
harmonic distortion to be 6% and the 7th
to be 5%. [37], [Appendix B4].
These limits were not violated.
Fig 4.12 HDV123 of 1st Nov. ‟10 at 01:56:16
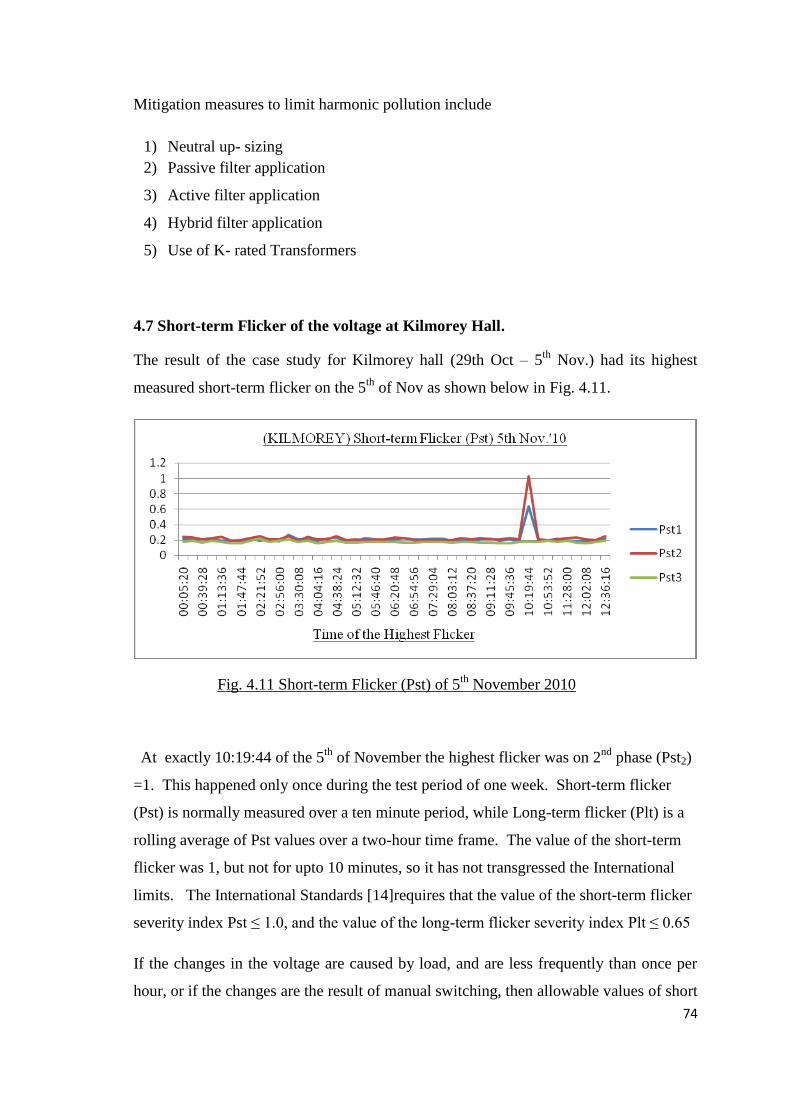
74
Mitigation measures to limit harmonic pollution include
1) Neutral up- sizing
2) Passive filter application
3) Active filter application
4) Hybrid filter application
5) Use of K- rated Transformers
4.7 Short-term Flicker of the voltage at Kilmorey Hall.
The result of the case study for Kilmorey hall (29th Oct – 5th
Nov.) had its highest
measured short-term flicker on the 5th
of Nov as shown below in Fig. 4.11.
Fig. 4.11 Short-term Flicker (Pst) of 5th
November 2010
At exactly 10:19:44 of the 5th
of November the highest flicker was on 2nd
phase (Pst2)
=1. This happened only once during the test period of one week. Short-term flicker
(Pst) is normally measured over a ten minute period, while Long-term flicker (Plt) is a
rolling average of Pst values over a two-hour time frame. The value of the short-term
flicker was 1, but not for upto 10 minutes, so it has not transgressed the International
limits. The International Standards [14]requires that the value of the short-term flicker
severity index Pst ≤ 1.0, and the value of the long-term flicker severity index Plt ≤ 0.65
If the changes in the voltage are caused by load, and are less frequently than once per
hour, or if the changes are the result of manual switching, then allowable values of short

75
term flickers could be increased by 33%. The conditions above have assumed that the
network voltage is constant at no-load without voltage fluctuation.[39, 40].
4.8 Summary
In this chapter the data monitored from 29th
October to 5th
November indicated that
input voltage was consistently high (445.0V). This high input voltage could lead to
overheating and unnecessary excessive power consumption. It was also noted that the
dominant 5th
harmonic distortion was 20% at the highest point. The 5th
harmonic is
caused by computer connections and other SMPS. The THDA maximum was 28.4%
when it should have been less than 20% [27]. There was high neutral current AN, which
was as high as line current at one instant. This was an indication that there was
unbalanced loading between the phases and the presence of harmonics. Highest
apparent load was 89.4 KVA recorded on 01/11 at 19.17hrs unlike the office building
where the peak was in the morning. Reactive compensation was by fixed capacitors,
the difference between the apparent power (KVA) and the active power (KW) was
unnoticeable because of the capacitor compensation. The nuisance tripping reported on
this breaker was as a result of the unbalanced loading; therefore mitigation should by
load balancing and installation of passive filters for the 5th
and the 7th
harmonics.
Lastly, there was short-term flicker was up to the maximum permissible level of 1, but
for less than 10minutes, this has not violated the EN50160 standards on short-term
flicker.
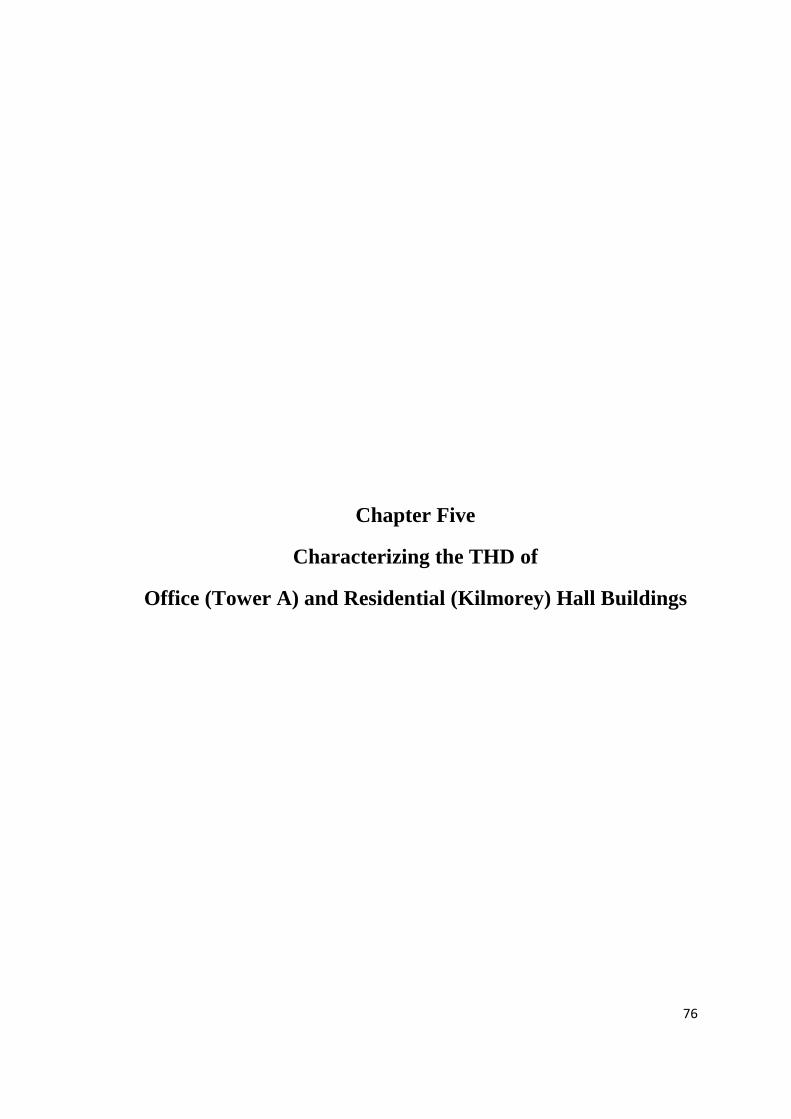
76
Chapter Five
Characterizing the THD of
Office (Tower A) and Residential (Kilmorey) Hall Buildings
77
5.1 Introduction.
Quantification and qualification of the harmonic distortion of voltage and current were
carried out by statistical method of analysis, to establish the limits. Tower A, an office
complex and Kilmorey Hall, a Residential Hostel are located in the same campus.
This chapter presents the results of measurement made in both buildings within one
week. The statistical methods of analysis of the data allowed the establishment of the
correct period to characterize the harmonic distortion. Statistical method was used
because of the following reasons:
It provides other alternative methods to solving the power quality problems by correctly
qualifying and quantifying the degree of distortion. The present method of applying the
International Standards could not be adapted easily to measurements of harmonic
distortions. The rate of increase in harmonic pollution in any electrical establishment is
on rapid increase as almost all electrical appliances newly connected have one form of
harmonic distortion or other thereby causing power quality problems. Statistical
method would be able to cope with the volume of data involved. Therefore the
statistical method could be a good alternative in characterizing the harmonic distortions
in buildings. The objective of this chapter was to establish proceedings to guide efforts
of measuring voltage harmonics distortions [32]. The statistical analysis helped to
show that the best period to characterize the harmonic distortions for the office building
like Tower A was between the hours of 08.00 hrs. - 18.00 hrs, whereas the Kilmorey
Hall was best characterized between 12.00 hrs – 01.00 hrs of the second day.
5.2 Statistical Comparison of the Tower A and Kilmorey Hall.
The two buildings were compared in the following ways from the collected data:
1) Phase similarity.
2) Data frequency Acquisition Analysis.
Four different methods were employed:
a) Graphic Comparison.
b) Mean value and Standard Deviation analysis.
c) P95% Analysis. [32]

78
5.2.1 Phase Similarity. - Graphic Comparison.
The load curves for the two buildings are shown below in figs. 5.1 and 5.2. The Fig 5.1
has a typical office profile while Fig. 5.2 showed a typical hostel residential profile.
Tuesday 26th
Oct. 2010 was the highest loading day of the week for Tower A. Tuesday
2nd
Nov. 2010 was chosen for Kilmorey Hall. Hours of operation of Tower A were
from 08.00 to 18.00, while Kilmorey Hall had minimum loading between the hours of
04.00 to 09.00. The usual early morning peak of any residential building was absent in
this case.
Tower A Load Curves Tue. 26th Oct.
0
50
100
150
200
250
300
350
00:0
5:0
8
01:2
1:5
6
02:3
8:4
4
03:5
5:3
2
05:1
2:2
0
06:2
9:0
8
07:4
5:5
6
09:0
2:4
4
10:1
9:3
2
11:3
6:2
0
12:5
3:0
8
14:0
9:5
6
15:2
6:4
4
16:4
3:3
2
18:0
0:2
0
19:1
7:0
8
20:3
3:5
6
21:5
0:4
4
23:0
7:3
2
Times of the day
KW
; K
VA
R;
KV
A
KW
KVAR
KVA
Fig. 5.1 Load curve of Tower A Lecture and Office Building
Kilmorey Load Curves Tue 2nd Nov.
0102030405060708090
00:0
7:2
8
01:1
5:4
4
02:2
4:0
0
03:3
2:1
6
04:4
0:3
2
05:4
8:4
8
06:5
7:0
4
08:0
5:2
0
09:1
3:3
6
10:2
1:5
2
11:3
0:0
8
12:3
8:2
4
13:4
6:4
0
14:5
4:5
6
16:0
3:1
2
17:1
1:2
8
18:1
9:4
4
19:2
8:0
0
20:3
6:1
6
21:4
4:3
2
22:5
2:4
8
Times of the day
KW
;KV
AR
;KV
A
KW
KVAR
KVA
Fig. 5.2 Load curves Kilmorey Residence Hall
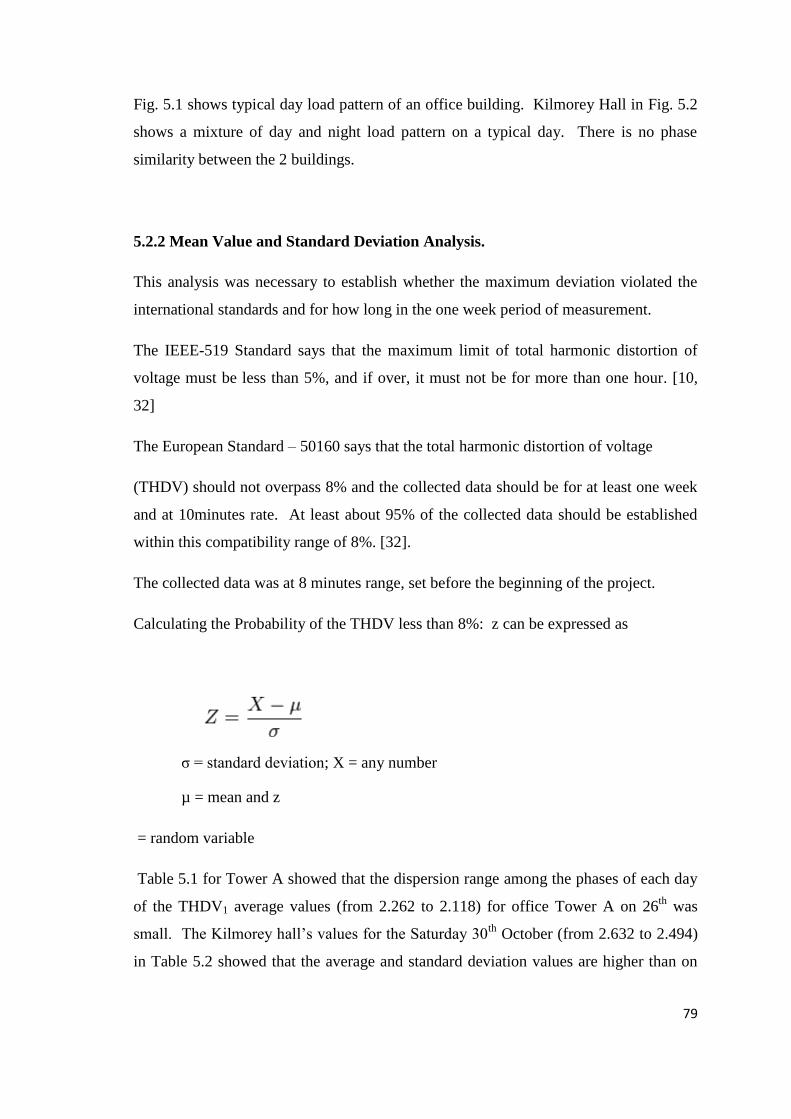
79
Fig. 5.1 shows typical day load pattern of an office building. Kilmorey Hall in Fig. 5.2
shows a mixture of day and night load pattern on a typical day. There is no phase
similarity between the 2 buildings.
5.2.2 Mean Value and Standard Deviation Analysis.
This analysis was necessary to establish whether the maximum deviation violated the
international standards and for how long in the one week period of measurement.
The IEEE-519 Standard says that the maximum limit of total harmonic distortion of
voltage must be less than 5%, and if over, it must not be for more than one hour. [10,
32]
The European Standard – 50160 says that the total harmonic distortion of voltage
(THDV) should not overpass 8% and the collected data should be for at least one week
and at 10minutes rate. At least about 95% of the collected data should be established
within this compatibility range of 8%. [32].
The collected data was at 8 minutes range, set before the beginning of the project.
Calculating the Probability of the THDV less than 8%: z can be expressed as
σ = standard deviation; X = any number
µ = mean and z
= random variable
Table 5.1 for Tower A showed that the dispersion range among the phases of each day
of the THDV1 average values (from 2.262 to 2.118) for office Tower A on 26th
was
small. The Kilmorey hall‟s values for the Saturday 30th
October (from 2.632 to 2.494)
in Table 5.2 showed that the average and standard deviation values are higher than on
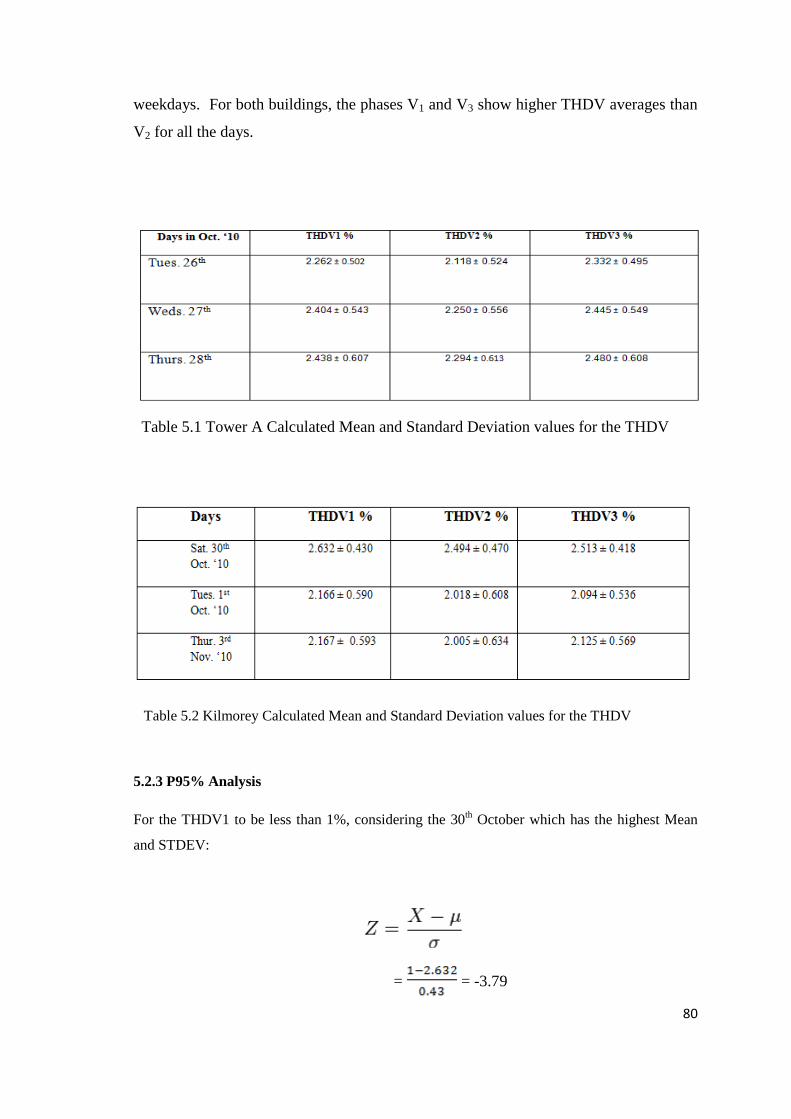
80
weekdays. For both buildings, the phases V1 and V3 show higher THDV averages than
V2 for all the days.
Table 5.1 Tower A Calculated Mean and Standard Deviation values for the THDV
Table 5.2 Kilmorey Calculated Mean and Standard Deviation values for the THDV
5.2.3 P95% Analysis
For the THDV1 to be less than 1%, considering the 30th October which has the highest Mean
and STDEV:
= = -3.79
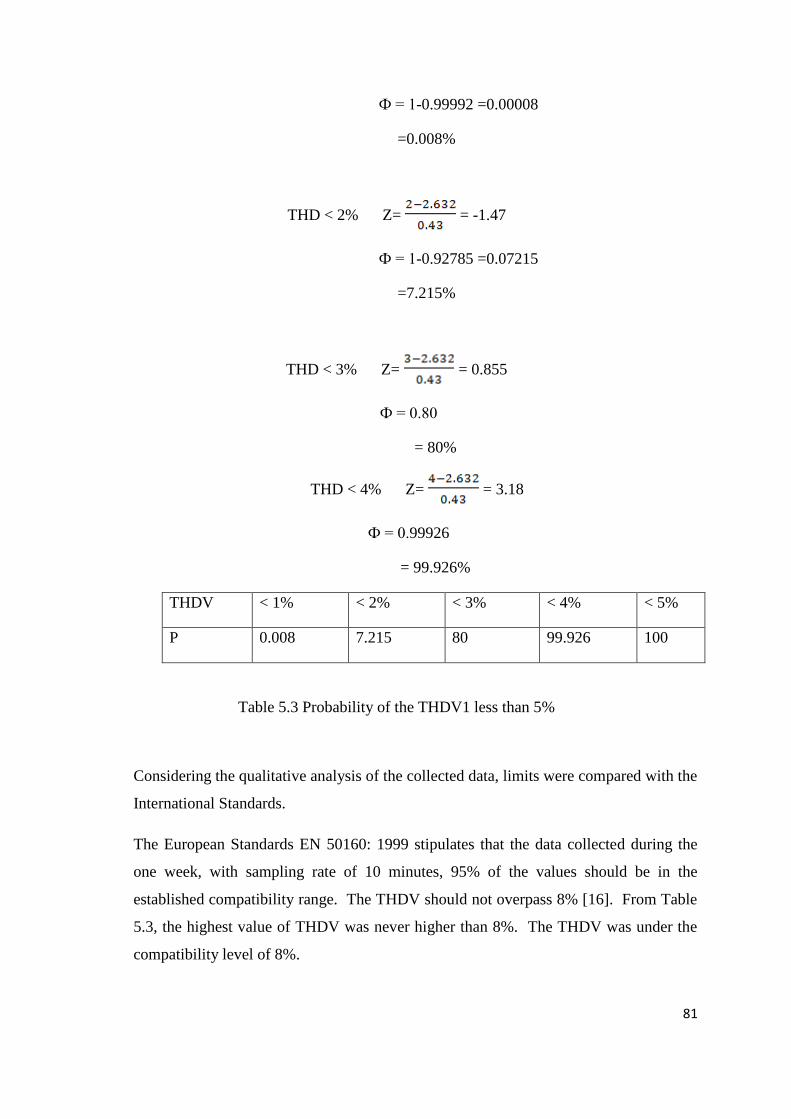
81
Ф = 1-0.99992 =0.00008
=0.008%
THD < 2% Z= = -1.47
Ф = 1-0.92785 =0.07215
=7.215%
THD < 3% Z= = 0.855
Ф = 0.80
= 80%
THD < 4% Z= = 3.18
Ф = 0.99926
= 99.926%
THDV < 1% < 2% < 3% < 4% < 5%
P 0.008 7.215 80 99.926 100
Table 5.3 Probability of the THDV1 less than 5%
Considering the qualitative analysis of the collected data, limits were compared with the
International Standards.
The European Standards EN 50160: 1999 stipulates that the data collected during the
one week, with sampling rate of 10 minutes, 95% of the values should be in the
established compatibility range. The THDV should not overpass 8% [16]. From Table
5.3, the highest value of THDV was never higher than 8%. The THDV was under the
compatibility level of 8%.
82
In conclusion, it was established that both buildings follow the two international
standards and the limits were not trespassed.
83
.
Chapter Six
Conclusions and Future Research

84
6.1 Conclusions
This thesis provided an overview for power quality problems that exist in modern
(commercial and residential buildings). The consequence of electrical disturbance has
become more serious considering the present economic situation. The proliferation of
non linear loads (computers and other electronic equipments) and consequently the
harmonics within such establishments were investigated. The residential load pattern
shows that the neutral current is also a problem.
The massive application of compact fluorescent lamps with electronic gear in modern
buildings could be worse than the computers as they produce harmonic pollution
causing network voltage distortion.
The present approach establishing a relation between voltage and power consumption
both for active and reactive power is not conclusive. It was proved that power
consumption figures would be significantly less at lower voltage level, but more
investigations into residential, commercial and industrial loads are needed to establish
this. When commercial consumers‟ voltage level increases significantly it produces
high unwanted power consumption, because of heavy presence of passive and resistive
loads. This needs further research. The theoretical proof from section 3.1.4 shows that
an increase of 10% in a supply voltage of 230V increases the power consumption by
21%., and reducing the supply voltage by 10% could reduce power consumed by 19%.
Keeping the voltage above the normal voltage (230V / 400V in Europe) should be
avoided because of high increase in active and reactive power demand. If the
international voltage range is observed and the upper limit is kept, unwanted power
consumption would likely result and higher losses will also be incurred. Effect of
higher voltage on load appliances in aging and insulation would need further
investigation. Keeping the voltage slightly below the nominal value is acceptable.
Comparison of the commercial- office with residential buildings showed the changing
load pattern of the residential having increasing harmonics and neutral currents like the
office building. The thesis brought into focus the need to constantly monitor the power
quality for record keeping. A basic understanding of how distortion is created and the
85
effects of circuit impedances on the levels of distortion helps in resolving the problems
created by distortion.
6.2 Future Research
There are many points which can be further investigated in this field. Some of these
points are summarised below:
- The present approach establishing a relation between voltage and power
consumption both for active and reactive power is not conclusive. It was
proved that power consumption figures would be significantly less at lower
voltage level, but more investigations into residential, commercial and
industrial loads are needed to establish this. When commercial consumers‟
voltage level increases significantly it produces high unwanted power
consumption, because of heavy presence of passive and resistive loads. This
needs further research.
- Mass application of Compact fluorescent lamps with electronic gear in modern
and commercial establishments is becoming as bad in generating harmonic
distortions as computers and other SMPS. These CFLs cause network voltage
distortion, occurring due to their distorted currents, with high level of harmonic
components. Further research analyses dealing with the influence of CFLs on
power systems are necessary, especially on massive residential distribution
network intermingled with modern commercial buildings. The production of
harmonic currents causing corresponding system harmonic voltage, mostly the
triple-n harmonics could mean major power quality problems for the MV/LV
sub-transmission transformers of the delta-wye types.

86
References
87
[1] Chapman, D.; Power Quality Application Guide - The Cost of Poor Power Quality;
Copper Development Association; Version 0b November 2001.
[2] The cost of Power Quality Disturbances to Industrial and Digital Economy Companies;
Report by Priment; Consortium for ERlectric Infrastructure to Support a Digital
Society (CEIDS), June 2001.
[3] New York Times, January 2000.
[4] Business Week, June 17 1996.
[5] LAN Times, Category Planning Research, 1997.
[6] Matching Power System Problems with Solutions; (Internet Site) Hawaiian Electric Co.
Inc. Hawaii 1996
[7] Rogers, C. D.; McGranaghan, M. F.; Santoso , S.; Beaty, H.W. ‘’Electrical Power
Systems Quality’’ 2nd Edition. New York. McGraw-Hill 2002
[8] Bollen, M.H.J. ‘’Understanding Power Quality Problems’’ IEEE Press Series on Power
Engineering. 2000
[9] Standard IEEE ---1159; Impulsive transient current caused by lightning strike, result of
PSpice Simulation
[10] IEEE 519:1992, IEEE Recommended Practices and Requirements for Harmonics
Control in Electrical Power Systems 1993
[11] IEEE 1159; IEEE Recommended Practice for Monitoring Electric Power Quality. 1995
[12] IEEE 1250
[13] IEC – 61000-4-3; Testing and measurement techniques – Power quality measurement
methods 2003, pp. 81, 7, 19
[14] IEC 61000-4-15; Testing and measurement techniques – Flickermeter – Functional and
design specifications, edition 1.1, 2003-03
88
[15] IEC 555 – 2; The Impact of IEC 555 on IT equipment – Part 2. Harmonic.
Developments of EMC Standards for information Technology Equipment, IEE
colloquium 1992 pp 6/1 – 6/9
[16] EN 50160:1999; ‘’Voltage characteristics of electricity supplied by public distribution
systems’’
[17] Dugan, R.C.; McGranaghan, M.F.; and Beaty, H.W. 1996; ‘’Electrical Power Systems
Quality’’ 2nd
Edition New York. McGraw-Hill
[18] Arrillaga, J.; Watson, N. R.; and Chen, S.; „‟Power System Assessment‟‟, John Wiley
& Sons. 2000
[19] Ewalk, F.; Masouum, M. A. S.; ‘’Power Quality in Power Systems and Electrical
Machines.’’ Elsevier Academic Press 2008
[20] ANSI C84.1: 1989; ‘’American National Standard for Electric Power Systems and
Equipment-Voltage Ratings
[21] Grady,W. M. ; Gilleskie, R. J.; Proceedings of the EPRI Power Quality Issues and
Opportunities Conference (PQA ’93), San Diego, California Nov. 1993
[22] Mindykowski, J.; Tarasiuk, T.; Rupnik, P.; Problems of Passive Filters application in
system with varying frequency. 9th
International Conference. Electrical Power Quality
and Utilisation. Bacelona, 9- 11 Oct. 2007.
[23] IEEE Standards Description: 1159 – 1995, 2009; Recommended Practice for
Monitoring Electric Power Quality,
[24] EN 50160:2000, Voltage characteristics of electricity supplied by public distribution
systems.
[25] Power & Quality Analyser; Chauvin Arnoux Ltd, C.A. 8335 User Guide, 2005.
[26] Bingham, R. P., Dranetz Technologies, Inc, USA; Conference on Protecting Electrical
Networks and Quality of Supply,22nd
-23rd
Jan 1997; Heathrow, U.K.p9.2.7
[27] Moreno-Munoz , A.; Gonzalez , J . J. ; Analysis of Power Quality in High- Tech
Facilities. Electrical Power Quality and ; Utilization, Magazine Vol. 1.No.2. 2005

89
[28] IEC 61000-3-2 Electromagnetic compatibility (EMC) – Part 3-2; Limits for harmonic
current emissions (equipment input current ≤ 16A per phase), ed. 2.1, 2001, p.10
[29] IET/TR3 61000 -3-6 Electromagnetic compatibility (EMC) – Part 3:Limits –Section 6
Assessment of emission limits for distorting loads in MV and HV power systems – Basic
EMC publication, 1st ed., 1996, p. 10
[30] Lawrence , R.; “Voltage Optimization: Achieving regulated, balanced voltage on 600
V distribution Systems’’ IEEE Industry Applications No. 5, 2006, p. 26--33.
[31] Toomas, Vinnal.; Lauri, Kutt . ; Heljut, Kalda.; Analysis of Power Consumption and
Losses in Relation to Supply Voltage Levels. Tallin University of Technology. 2008
[32] Ferreira-Filho , A. L.; M.de Oliveira; Bonincontro, F. A.; A contribution to establish
proceedings for Quantification of Voltage Harmonic Distortion in Commercial
Buildings. IEEE Proceedings 0-7803-7671-4/02/S17.00 © 2002 pp 21 – 26. DOI =
10.1109/ICHQP.2002.1221399.
[33] Arthur, F.; Non-linear Loads Mean Trouble, EC & M Magazine, March 1988, pp 83
– 90.
[34] Hoevenaar, T. ; Levin, M. ; Ling, P. J. A.; A case study in cutting power system
harmonics. Electrical Systems Engineering Magazine, spring 1990, pp 28 – 34.
[35] Cividino, L.; Power factor, Harmonic distortion, Causes and Consideration
Telecommunications Energy Conference INTELEC ’92. 14th
International Conference
Oct. 1992. pp506-513.
[36] Zoran, R. ; Frangiskos, V. T. ; Miomir- Kostic.; Voltage distortion in low-voltage
networks caused by compact fluorescent lamps with electronic gear. Electric Power
Systems Research 73, 2005 pp129 - 136
[37] Copper Development Association, Leonardo Power Quality Initiative.; Power Quality
Application Guide. Voltage Disturbances, Voltage; Characteristics in Public
Distribution Systems, pp 4-5
90
[38] Zbigniew Hanzelka & Andrzej Bien, Voltage Disturbances Flicker, Copper ;
Development Association - Institution of Engineering and Technology Endorsed
Training Provider, 2006
[39] „Power Quality‟ Working Group wg2, 2000; Guide to Quality of Electrical Supply for
Industrial Installations, Part 5, Flicker and Voltage Fluctuations.
[40] IEC 61000-3-3., Electromagnetic compatibility (EMC) – Part 3: Limits – Section 3:
Limitation of Voltage fluctuations and flicker in low-voltage supply systems for
equipment with rated current ≤ 16A. 1995
[41] Duarte, C. H.; Schaeffer, R.; Economic impacts of power electronics on electricity
distribution systems. Journal from www.elsevier.com/locate/energy and
ScienceDirect-Enery 2010, Energy 35, pp 4010 - 4015
[42] Zhang M.; Li K.; Hu Y.; Classification of Power Quality Disturbances using Wavelet
Packet Energy Entropy and LS – SVM. Energy and Power Engineering, 2010, 2, pp154
– 160.
[43] Copper Development Association, Leonardo Power Quality Initiative; Power Quality
Application Guide. Harmonics – Causes and Effects, Passive Filters, pp1 – 3
[44] Conroy, E., ‘Power monitoring and Harmonic problems in the modern building’ Power
Engineering Journal, vol. 15 Issue, pp.101 – 107, April 2001.
[45] Aintablian, H. ‘The Harmonic Currents of Commercial Office Building due to Non –
linear Electronic Equipment’. Southcon Conference Record, June 1996, pp.610 – 615.
[46] Aintablian, H.O. ,‘Harmonic Currents generated by Personal Computers and their
effects on the Distribution System Neutral Current’. Industry Applications Society
Annual Meeting vol. 2, 1993, pp. 1483 – 1489.
[47] Chiang, T. K.; Law, C. K.; To, V.; Kwan, H. F. ‘Power Quality case studies; CLP
Power’s Experience’. Proceedings of Symposium on Power Quality and You.
Managing pollution in Electric Supply Systems, May 2002

91
[48] Copper Development Association. ‘Electrical Design. A good Practice guide. CDA
Publication 123, 1997, p42
[49] Broshi, A.; Monitoring Power Quality beyond EN 50160 and IEC 61000-4-30. 9th
International Conference, Barcelona. Electric Power Quality and Utilisation. 2007,
pp 9 -11.
[50] Ong, S.J.B.; Cheng, Y.J. An overview of International Harmonics Standards and
Guidelines (IEEE, IEC, EN, ER and STC) for Low Voltage System. IEEE, the 8th
International Power Engineering Conference IPEC, 2007 pp 602-607
[51] Halpin, S.M.; Burch, R.F. IV2 Harmonic Limit Compliance Evaluations Using
IEEE 519-1992
[52] Ellis, R.G.; Eng, P. Power System Harmonics. A reference guide to Causes, Effects and
corrective measures. Allen – Bradley Series of Issues and Answers. Rockwell
Automation.
[53] Bettega. E.; Fiorina. J-N.; Active harmonic Conditioners and Unity Power Factor
Rectifiers. Cahier technique Schneider Electric no. 183. Melin Gerin, Modicon,
Square D, Telemecanique
[54] Collombet, C.; Lupin, J.M.; Schonek, J. Harmonic disturbances in networks and their
treatment. Cahier Technique Schneider Electric no. 152
[55] Lupin, J-M.; Ferracci, P. Power quality: Monitoring and Innovation in Harmonic
filtering. Rectiphase, Schneider Electric
92
Appendix A
C.A 8335
Power & Quality Analyser
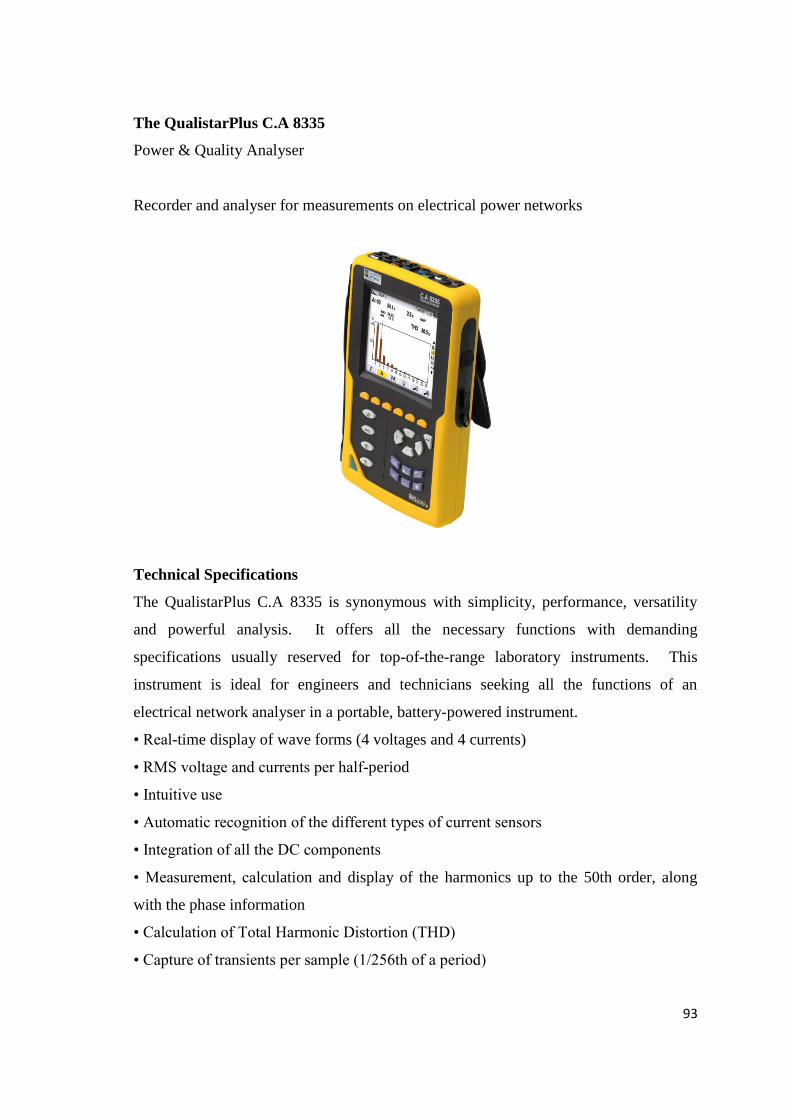
93
The QualistarPlus C.A 8335
Power & Quality Analyser
Recorder and analyser for measurements on electrical power networks
Technical Specifications
The QualistarPlus C.A 8335 is synonymous with simplicity, performance, versatility
and powerful analysis. It offers all the necessary functions with demanding
specifications usually reserved for top-of-the-range laboratory instruments. This
instrument is ideal for engineers and technicians seeking all the functions of an
electrical network analyser in a portable, battery-powered instrument.
• Real-time display of wave forms (4 voltages and 4 currents)
• RMS voltage and currents per half-period
• Intuitive use
• Automatic recognition of the different types of current sensors
• Integration of all the DC components
• Measurement, calculation and display of the harmonics up to the 50th order, along
with the phase information
• Calculation of Total Harmonic Distortion (THD)
• Capture of transients per sample (1/256th of a period)
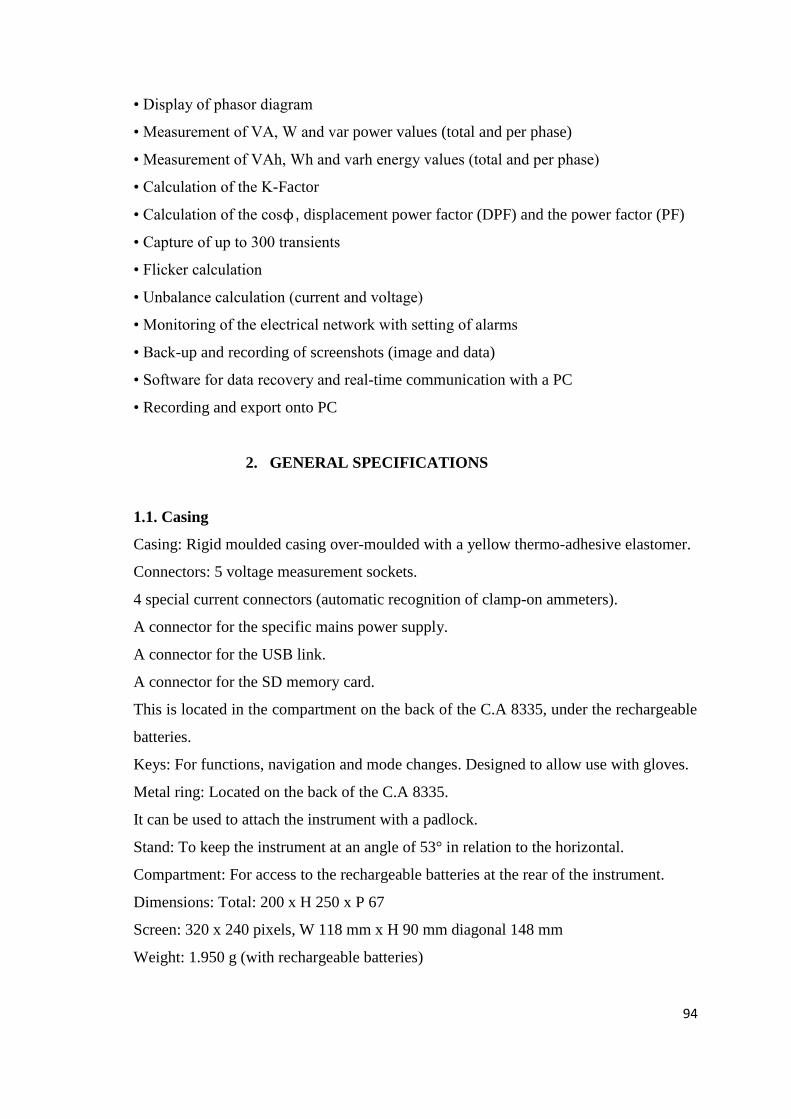
94
• Display of phasor diagram
• Measurement of VA, W and var power values (total and per phase)
• Measurement of VAh, Wh and varh energy values (total and per phase)
• Calculation of the K-Factor
• Calculation of the cosϕ, displacement power factor (DPF) and the power factor (PF)
• Capture of up to 300 transients
• Flicker calculation
• Unbalance calculation (current and voltage)
• Monitoring of the electrical network with setting of alarms
• Back-up and recording of screenshots (image and data)
• Software for data recovery and real-time communication with a PC
• Recording and export onto PC
2. GENERAL SPECIFICATIONS
1.1. Casing
Casing: Rigid moulded casing over-moulded with a yellow thermo-adhesive elastomer.
Connectors: 5 voltage measurement sockets.
4 special current connectors (automatic recognition of clamp-on ammeters).
A connector for the specific mains power supply.
A connector for the USB link.
A connector for the SD memory card.
This is located in the compartment on the back of the C.A 8335, under the rechargeable
batteries.
Keys: For functions, navigation and mode changes. Designed to allow use with gloves.
Metal ring: Located on the back of the C.A 8335.
It can be used to attach the instrument with a padlock.
Stand: To keep the instrument at an angle of 53° in relation to the horizontal.
Compartment: For access to the rechargeable batteries at the rear of the instrument.
Dimensions: Total: 200 x H 250 x P 67
Screen: 320 x 240 pixels, W 118 mm x H 90 mm diagonal 148 mm
Weight: 1.950 g (with rechargeable batteries)

95
1.2. Power supply
1.2.1. Mains power supply
Type: Specific external mains power supply: 600 VRMS category IV – 1,000 VRMS
category III
Operating range:
230 V ± 10 % @ 50 Hz and 120 V ± 10 % @ 50 Hz
Max. power: 40 VA
1.2.2. Battery power supply
The C.A 8335 can be used without a mains power supply.
The battery also allows the Qualistar+ to be used in the event of mains power cuts.
Battery: 8 rechargeable NiMH batteries
Capacity: minimum 4,000 mAh
Rated voltage: 1.2 V per element, 9.6 V in total
Life span: at least 500 recharge-discharge cycles
Recharge current: 1 A
Recharge time: Approximately 5 hours
Operating T°: [0 °C ; 50 °C]
Recharge T° [10 °C ; 40 °C]
Storage T°: Storage for � 30 days:
[-20 °C ; +50 °C]
Storage for 30 to 90 days:
[-20 °C ; +40 °C]
Storage for 90 days to 1 year:
[-20 °C; +30 °C]
1.2.3 Consumption
With 50% brightness: 300 mA
Standby mode without display: 100 Ma
96
Appendix B
List of International Power Quality Standards

97
(B1)IEC Power Quality standards
The IEC Power Quality standards are as follows:
1. IEC 61000-4-7 Harmonic and Interharmonics measurement technique.
2. IEC 61000-4-11 Voltage sag immunity – 16 amps or less.
3. IEC 61000-4-15 Flicker measurement Standards. (formerly IEC 868)
4. IEC 61000-4-34 Voltage sag immunity – more than 16 amps.
5. IEC 61000-4-30 Power Quality measurement methods.
6. General IEC power quality standards.
a. 61000-1-X Definitions and methodology.
b. 61000-2-X Environment (e.g. 61000-2-4 is compatibility levels in
industrial plants).
c. 61000-3-X Limits (e.g. 61000-3-4 is limits on harmonic emissions).
d. 61000-4-X Tests and measurements (e.g.61000-4-30 is power quality
measurements)
e. 61000-5-X Installation and mitigation.
f. 61000-6-X Generic immunity and emissions standards.
7. IEC SC77A: Low frequency EMC Phenomena – essentially equivalent of
„power quality‟ in American terminology, subdivided into:
a. TC 77/ WG 1: Terminology (part of the parent Technical Committee)
b. SC 77A/WG 1: Harmonics and other low-frequency disturbances.
c. SC 77A/WG 2: Voltage fluctuations and other low-frequency
disturbances.
d. SC 77A/WG 6: Low frequency immunity tests.
e. SC 77A/WG 8: Electromagnetic interference related to the network
frequency.
f. SC 77A/WG 9: Power Quality measurement methods.
g. SC 77A/61000-3-1: Electromagnetic Compatibility (EMC) – Part 3-1:
Limits – Overview of emission standards and guides.
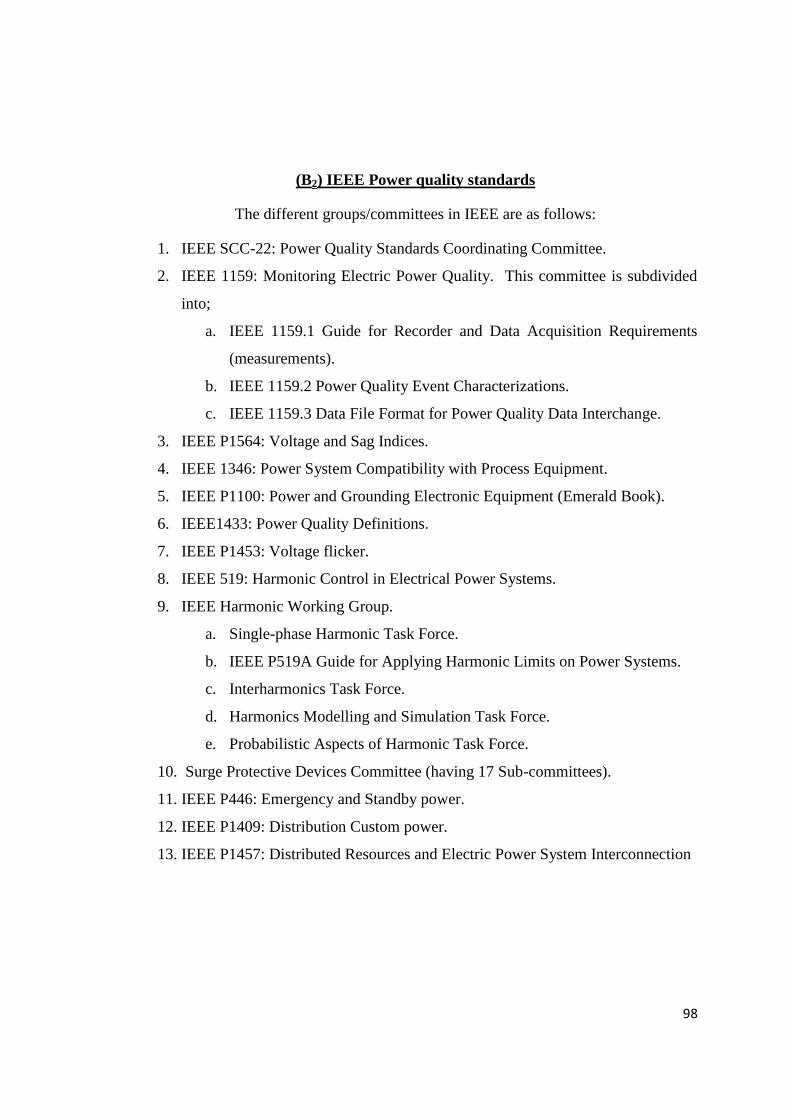
98
(B2) IEEE Power quality standards
The different groups/committees in IEEE are as follows:
1. IEEE SCC-22: Power Quality Standards Coordinating Committee.
2. IEEE 1159: Monitoring Electric Power Quality. This committee is subdivided
into;
a. IEEE 1159.1 Guide for Recorder and Data Acquisition Requirements
(measurements).
b. IEEE 1159.2 Power Quality Event Characterizations.
c. IEEE 1159.3 Data File Format for Power Quality Data Interchange.
3. IEEE P1564: Voltage and Sag Indices.
4. IEEE 1346: Power System Compatibility with Process Equipment.
5. IEEE P1100: Power and Grounding Electronic Equipment (Emerald Book).
6. IEEE1433: Power Quality Definitions.
7. IEEE P1453: Voltage flicker.
8. IEEE 519: Harmonic Control in Electrical Power Systems.
9. IEEE Harmonic Working Group.
a. Single-phase Harmonic Task Force.
b. IEEE P519A Guide for Applying Harmonic Limits on Power Systems.
c. Interharmonics Task Force.
d. Harmonics Modelling and Simulation Task Force.
e. Probabilistic Aspects of Harmonic Task Force.
10. Surge Protective Devices Committee (having 17 Sub-committees).
11. IEEE P446: Emergency and Standby power.
12. IEEE P1409: Distribution Custom power.
13. IEEE P1457: Distributed Resources and Electric Power System Interconnection
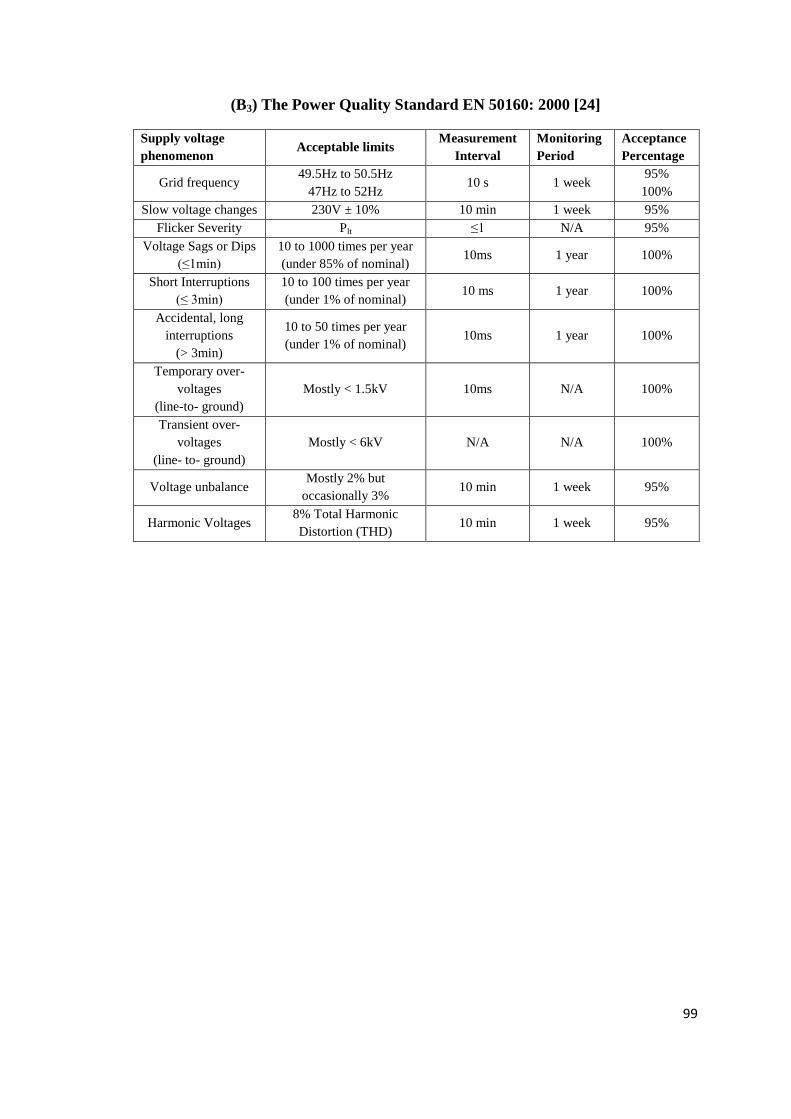
99
(B3) The Power Quality Standard EN 50160: 2000 [24]
Supply voltage
phenomenon Acceptable limits
Measurement
Interval
Monitoring
Period
Acceptance
Percentage
Grid frequency 49.5Hz to 50.5Hz
47Hz to 52Hz 10 s 1 week
95%
100%
Slow voltage changes 230V ± 10% 10 min 1 week 95%
Flicker Severity Plt ≤1 N/A 95%
Voltage Sags or Dips
(≤1min)
10 to 1000 times per year
(under 85% of nominal) 10ms 1 year 100%
Short Interruptions
(≤ 3min)
10 to 100 times per year
(under 1% of nominal) 10 ms 1 year 100%
Accidental, long
interruptions
(> 3min)
10 to 50 times per year
(under 1% of nominal) 10ms 1 year 100%
Temporary over-
voltages
(line-to- ground)
Mostly < 1.5kV 10ms N/A 100%
Transient over-
voltages
(line- to- ground)
Mostly < 6kV N/A N/A 100%
Voltage unbalance Mostly 2% but
occasionally 3% 10 min 1 week 95%
Harmonic Voltages 8% Total Harmonic
Distortion (THD) 10 min 1 week 95%

100
(B4) Other new power quality standards are listed below
UIE: International Union for Electricity Applications
CENELEC: European Committee for Electrotechnical Standards.
UNIPEDE: International Union of Producers and Distributors of Electrical Energy
ANSI: American National Standards Institute. This is sub-divided into:
i. ANSI C62: Guides and standards on surge protection.
ii. ANSI C84.1: Voltage ratings for equipment and power systems.
iii. ANSI C57.110: Transformer derating for supplying non-linear loads.
CIGRE: International Council on Large Electric Systems.
CIRED: International Conference on Electricity Distribution.
CBEMA/ ITIC curve.
Industry specific power quality standards include the Semiconductor Equipment
Manufacturers International (SEMI) which has the sub-divisions of:
1. SEMI F46
2. SEMI F47
3. SEMI E6
4. Samsung Power Vaccine: Samsung‟s voltage sag immunity.
Requirement is more stringent than SEMI.