investigations on the dimensional accuracy and …
TRANSCRIPT
SC
IEN
TIA
RUM POLO
NO
RU
M
ACTA
Acta Sci. Pol.
Silv. Colendar. Rat. Ind. Lignar. 6(4) 2007, 107-122
Corresponding author – Adres do korespondencji: Dr inż. Wiesław Zakrzewski, Department of Woodworking Machinery and Basic Construction of Agricultural University of Poznań, Wojska Polskiego 38/42, 60-627 Poznań, Poland, e-mail: [email protected]
INVESTIGATIONS ON THE DIMENSIONAL ACCURACY
AND SURFACE STRUCTURE OF A TENON JOINT
Wiesław Zakrzewski, Adam Białas, Grzegorz Pinkowski,
Andrzej Krauss
Agricultural University of Poznań
Abstract. The study investigated execution tolerances and profile load capacity curves occurring in industrial conditions. Using graphic images of fits expanded by profile load capacity curves, an attempt was made to explain the effect of the profile load capacity cu-rve on the fitting character of the tenon joint.
Key words: mortise, tenon, fit tolerance, profile load capacity curve
INTRODUCTION
Processing accuracy can be evaluated on the basis of differences that occur between
the shape, dimension and geometrical structure of the nominal surface and that meas-
ured on the processed object.
Quite distinct differences can be observed in the course of the production process
between nominal assumptions and the obtained shape, dimension and surface geometri-
cal structure. Therefore, the accuracy of the processed material should be defined as the
degree of its affinity with the perfection which is impossible to achieve in practice.
In the case of the tenon joints, due to small dimensions of elements to be united, the
most important aspect of accuracy – from the point of view of functionality – is the
dimensional precision as well as the accuracy of the surface geometrical structure. The accuracy of the obtained dimension during the machining process should not
exceed adopted boundaries of allowable deviations from the nominal dimension [Baj-
kowski 1990]. In the case considered in this study, we have to deal with a fit which
represents a mortise and tenon joint. The character of this fit depends on boundary
clearances which can occur between the elements that are to be connected. Therefore,
while analysing the execution accuracy of a fit, it is necessary to examine the occurring
clearance because it is this play that constitutes the measure of cooperation between
individual parts (elements that are being united).

W. Zakrzewski ...
Acta Sci. Pol.
108
Investigations dealing with the proportion of the surface geometrical structure in the
tolerance area of the observed linked elements aim at a better understanding of the co-
operation of elements forming the tenon joint. This makes it easier to explain such phe-
nomena as wood swelling and shrinkage, selection of tolerance fits etc.
It is possible, from the measurements and calculations of the elements obtained in
industrial conditions, to create a definite, specific model of dimensional contact of real
surfaces taking into consideration their irregularities in the tenon joint.
It is clear, both from literature [Nowicki 1991] and experiments, that the current pa-
rameters of the surface geometrical structure – Rz, Rm, Rmax, Ra, Sz – specified in the
standard for surface roughness of wood and wood-based materials BN-84/D-01005, characterize the surface insufficiently because they say nothing about the shape of these
irregularities and their course. This inconsistency of the above-mentioned parameters
with the surface functionality of the united elements makes it necessary to seek other of
its characteristics of which the proportion of the profile load-carrying capacity tp ap-
pears to be the best. The profile load-carrying capacity curve proportion is also referred
to as the outline of surface irregularities and it is the property which describes load
carrying capacities in united elements. The load carrying capacity curve constitutes a
graphic representation of the function dependence of the value of the carrying propor-
tion tp on the intersection level c [Wieczorowski et al. 1996].
The outline of irregularities is a development of a real surface of united elements,
i.e. of the surface restricting the object from the surrounding medium constituting the curve of the load-carrying capacity proportion.
This study constitutes a continuation of investigations carried out at the Department
of Woodworking Machinery and Basis of Machine Construction of August Cieszkowski
Agricultural University of Poznań [Staniszewska et al. 1996, Staniszewska and Za-
krzewski 1999/2000] and concerns elements that were manufactured from pine wood in
industrial conditions.
The authors decided to conduct investigations of the outline irregularities on the real
(non-filtered) profile because the surface waviness developed after milling of mortises
and tenons appears to be more important for the functional characters of the fit than
roughness.
The objective of this research project was to determine the dimensional accuracy of
the execution of the tenon joint taking into consideration the surface geometrical struc-ture of the connected elements.
METHODOLOGICAL ASSUMPTIONS
AND DESCRIPTION OF THE PERFORMED EXPERIMENTS
Experimental material and processing condition
The experimental material comprised elements of the tenon joint, i.e. mortise and te-
non. The choice of this joint was justified by its most difficult utilization conditions. It is
well known that it is the most critical point of the entire construction of the chair because
strong bending moments occur here during its utilization [Staniszewska et al. 1994]. The examined mortises and tenons derived from chairs made of pinewood intended for the
domestic market and manufactured in a Cooperative Enterprise “Postęp” in Pniewy.

Investigations on the dimensional accuracy and surface structure of a tenon joint
Silvarum Colendarum Ratio et Industria Lignaria 6(4) 2007
109
The average moisture content of the examined ele-
ments was about 10%, so it was at the level of the ref-
erence moisture content specified in the BN-81/7140-
-11 standard intended to be used in furniture industry.
The moisture content was measured using a Tanel
digital hygrometer. Tenons of the examined joint were
made on a “Bacci Cascina” tenoning machine with
a tool which consisted of a round cutterhead with 90 mm
diameter and a circular saw of 190 mm diameter. The
mortises were made using a “Renzo-Balestrini” single spindle drilling-milling machine using an end-cylin-
drical milling cutter.
Method of measurement and calculation
of the execution accuracy of joint elements
Measurements of mortises and tenons were con-
ducted on sixty elements. Samples were obtained by
setting the machine tool to the required dimension and correcting it to the value assumed using the test ele-
ment method. Measurements of mortises were made
along their length lo and width so and of tenons – in the
direction of their width sw and thickness gw. Values
derived from three measurements, namely: mortise
width so as well as tenon width sw and thickness gw
were taken for the calculation of statistical parameters.
Fig. 2. Visual presentation of the measurement of the tenon thickness dimension tak-
ing into account surface irregularities: a – mortise, b – tenon Rys. 2. Poglądowy sposób pomiaru wymiaru grubości czopa z uwzględnieniem nie-równości powierzchni: a – gniazda, b – czopa
Fig. 1. Examined tenon joint of the backrest leg with the side underframe Rys. 1. Badane połączenie czo-powe nogi oparciowej z oskrzy-
nią boczną krzesła
W. Zakrzewski ...
Acta Sci. Pol.
110
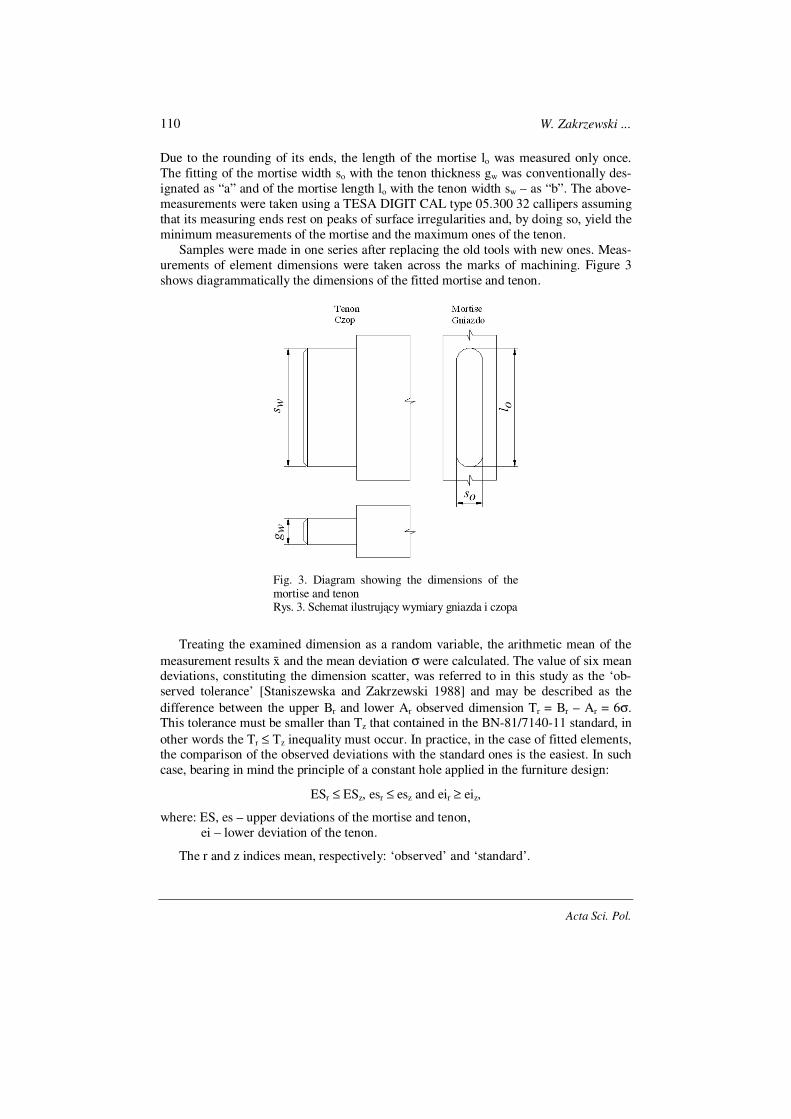
Due to the rounding of its ends, the length of the mortise lo was measured only once.
The fitting of the mortise width so with the tenon thickness gw was conventionally des-
ignated as “a” and of the mortise length lo with the tenon width sw – as “b”. The above-
measurements were taken using a TESA DIGIT CAL type 05.300 32 callipers assuming
that its measuring ends rest on peaks of surface irregularities and, by doing so, yield the
minimum measurements of the mortise and the maximum ones of the tenon.
Samples were made in one series after replacing the old tools with new ones. Meas-
urements of element dimensions were taken across the marks of machining. Figure 3
shows diagrammatically the dimensions of the fitted mortise and tenon.
Fig. 3. Diagram showing the dimensions of the mortise and tenon Rys. 3. Schemat ilustrujący wymiary gniazda i czopa
Treating the examined dimension as a random variable, the arithmetic mean of the
measurement results x̄ and the mean deviation σ were calculated. The value of six mean deviations, constituting the dimension scatter, was referred to in this study as the ‘ob-
served tolerance’ [Staniszewska and Zakrzewski 1988] and may be described as the
difference between the upper Br and lower Ar observed dimension Tr = Br – Ar = 6σ. This tolerance must be smaller than Tz that contained in the BN-81/7140-11 standard, in
other words the Tr ≤ Tz inequality must occur. In practice, in the case of fitted elements, the comparison of the observed deviations with the standard ones is the easiest. In such
case, bearing in mind the principle of a constant hole applied in the furniture design:
ESr ≤ ESz, esr ≤ esz and eir ≥ eiz,
where: ES, es – upper deviations of the mortise and tenon,
ei – lower deviation of the tenon.
The r and z indices mean, respectively: ‘observed’ and ‘standard’.

Investigations on the dimensional accuracy and surface structure of a tenon joint
Silvarum Colendarum Ratio et Industria Lignaria 6(4) 2007
111
The method of fit determination
Following the numerical recording of the observed fit which consisted in recording the basic dimension together with deviations for the mortise and tenon, the type and
class of the fit was determined from standards. Because measurement tolerances, their
deviations as well as allowances and negative allowances are disproportionately small
in comparison with the dimensions of the united elements, the graphic images do not
show the mortise and tenon and present only the zero line which corresponds to the
basic dimension. Instead of dimensions, positive deviations are shown over the zero line
and negative deviations below it. In other words, images of mortises and tenons are
shown as rectangles with their heights equal to dimensional tolerances [Staniszewska
and Zakrzewski 2006]. The position of rectangles representing mortises and tenons
make it possible to infer information about clearances and negative allowances of the
fit. Rectangles representing intervals of the allowance variability, conventionally re-ferred to as observed tolerances Tpr, were placed behind rectangle representing individ-
ual mortises and tenons.
Tpr = Lr max – Lr min = Tro + Trw,
where: Lr max, Lr min – observed maximum and minimum clearance,
Tro, Trw – observed tolerances of mortises (holes) and tenons (rolls).
The observed limiting allowances were calculated from the known deviations,
namely:
Lr max = ESr – eir, Lr min = –esr,
because in the applied principle of a constant hole EIr = 0.
The mean allowance 2
LLL
minrmaxrśrr
−= ,
where: ESr, EIr – observed mortise upper and lower deviations,
esr, eir – observed tenon upper and lower deviations.
The choice of the standard fit results from the knowledge of the observed fit. Its se-
lection is based on the principle that the observed tolerances for the mortise and tenon
should be contained within standard tolerances [Staniszewska and Zakrzewski 1990].
In practice, the setting of the required type of fit assumes the utilization of the al-
lowance variability analysis in industrial conditions taking into consideration the mean
allowance. This allowance can be employed as a parameter controlling the fit quality
capability. In other words, while the dimension control is a technological operation
aiming at bringing the dimension arithmetic mean to the tolerance centre, the allowance control aims at bringing the mean allowance to the fit tolerance centre.
The required fit in the quality capable process 1T
Tc
pr
pzp >= can be achieved by con-
trolling the observed mean allowance Lr śr in such a way that it will take the position of the fit tolerance centre Lz śr. A method was elaborated which makes it possible to con-
trol the observed mean allowance by regulating the arithmetic mean of the tenon dimen-
sion [Zakrzewski and Staniszewska 2002].

W. Zakrzewski ...
Acta Sci. Pol.
112
The value of the fit non-alignment:
∆Lr śr = Lz śr – Lr śr.
The increment of the arithmetical mean of the tenon dimension:
∆x̄w = –∆Lr śr,
where: Lr śr, Lz śr – mean allowance of the observed and standard fit.
Investigations of the outline of irregularities
Measurements of surface irregularities were carried out by the method of contact
profile representation employing a WZI-252 Kalibr type surface analyser. The rounding radius of the gauging point was 10 ±2.5 µm, and its pressure – 0.016 N. The measure-
ment was carried out on surfaces which constituted the length of mortise and the width
of the tenon along a measuring section of 21 mm. The narrowing of the measuring sec-
tion to 21 mm was caused by the shape and dimension of mortises and tenons. Due to
technical restrictions resulting from the shape and dimension of the gauging point of the
surface analyser, the mortises were cut.
In order to take into consideration not only the surface roughness but also its wavi-
ness resulting from the marks left by the cutting edge of the mill on the worked surface,
a non-filtered (real) profile was applied to calculate the carrying proportion of the pro-
file of irregularities along the length of the measurement section. Diagrams and num-
bers referring to the carrying proportion of the surface of all samples were archived in
the computer and later on one correlation was elaborated for the mortise and the tenon which represented averaged Abbott’s curves for mortises and tenons.
Figure 2 shows the mortise width so and the tenon thickness gw together with the ir-
regularities occurring on their respective surfaces constituting the outline of irregulari-
ties. In addition, it shows positions of measuring edges of the callipers’ jaws determin-
ing the minimal dimension of the mortise width and the maximum dimension of the
tenon thickness. It was assumed that, at the moment of taking the measurement, the jaw
edges of the callipers rested on the peaks of irregularities.
In Figure 2 a, symbol 2
1R1 designates the maximum height of the profile of irregu-
larities Rmax for one side of the mortise. Since the cooperation of the mortise with the
tenon during the process of uniting takes place simultaneously on both of the fitted
elements, the authors assumed the double value of the height of irregularities 2Rmax = R1
to determine the outline of irregularities in the tolerance field. Similarly, in Figure 2 b,
symbol 2
1R2 designates the maximum height of the profile of irregularities Rmax for one
side of the tenon and the double value of the height of irregularities of the tenon 2Rmax =
R2 was assumed for further considerations. Measurements of irregularities on surfaces
confining the length of the mortise lo and the width of the tenon sw were neglected due
to the rounding of corners. Measurements in those places were impossible using the
available measurement tools.

Investigations on the dimensional accuracy and surface structure of a tenon joint
Silvarum Colendarum Ratio et Industria Lignaria 6(4) 2007
113
RESEARCH RESULTS AND THEIR ANALYSIS
Calculation results of dimensional accuracy of fitted elements
The results of measurements and calculations of the dimensional execution accuracy
of the “a” and “b” fits are presented in Table 1.
Table 1. Calculation results of fit parameters if the mortise width and tenon thickness as well as
mortise length and tenon width, mm Tabela 1. Wyniki obliczeń parametrów pasowania szerokości gniazda i grubości czopa oraz dłu-gości gniazda i szerokości czopa, mm
Mortise width
Szerokość gniazda
� Tenon thickness
Grubość czopa
(type a – typ a)
Mortise length
Długość gniazda
� Tenon width
Szerokość czopa
(type b – typ b)
Name of the item
Nazwa wielkości
Symbol
Symbol
mortise
gniazdo
tenon
czop
mortise
gniazdo
tenon
czop
Arithmetic mean
Średnia arytmetyczna
x̄ 10.06 10.19 44.26 44.39
Sample size
Wielkość próbki
N 30 30 30 30
Standard deviation
Odchylenie standardowe
Σ 0.046 0.039 0.125 0.247
Observed tolerance
Tolerancja zaobserwowana
Tr 0.276 0.234 0.75 1.482
Upper observed dimension
Górny wymiar zaobserwowany
Br 10.20 10.31 44.63 45.12
Lower observed dimension
Dolny wymiar zaobserwowany
Ar 9.92 10.07 43.87 43.65
Nominal fit dimension
Wymiar nominalny pasowania
Aro = Nr 9.92 9.92 43.87 43.87
Observed upper mortise deviation
Odchyłka górna gniazda zaobserwowana
ESr 0.28 – 0.76 –
Observed lower mortise deviation
Odchyłka dolna gniazda zaobserwowana
EIr 0 – 0 –
Observed upper tenon deviation
Odchyłka górna czopa zaobserwowana
esr – 0.39 – 1.25
Observed lower tenon deviation
Odchyłka dolna czopa zaobserwowana
eir – 0.15 – –0.22
Observed maximum clearance
Luz maksymalny zaobserwowany
Lr max 0.13 0.99
Observed minimum clearance
Luz minimalny zaobserwowany
Lr min –0.39 –1.25
Observed mean clearance
Luz średni zaobserwowany
Lr śr –0.13 –0.13
Observed fit tolerance
Tolerancja pasowania zaobserwowana
Tpr 0.52 2.24
Fit record
Zapis pasowania
9.92 H4/m4 – tightly fitted
9.92 H4/m4 – mocno wci-
skane
43.87 H4/k9 – lightly fitted
43.87 H4/k9 – lekko wciska-
ne
W. Zakrzewski ...
Acta Sci. Pol.
114
The predicted nominal dimension of the “a” type fit was 10 mm and for the “b” type
– 45 mm. It is evident from the values given in Table 1 that the observed execution
tolerance of the mortise width was Tro = 0.28 mm, while that of the tenon thickness –
Trw = 0.23 mm. This gave, respectively, to the mortise and the tenon, the 4th and the 3rd
classes of dimensional execution accuracy [BN-81/7140-11]. On the other hand, the
execution tolerance of the mortise length reached 0.76 mm, which corresponds to the
6th class of accuracy, while that of the tenon width – 1.48 mm which corresponds to the
9th class of accuracy.
The numerical record of the obtained “a” type connection (expressed in millimetres)
assumed the form:
O. 92.928.0
W. 92.939.015.0
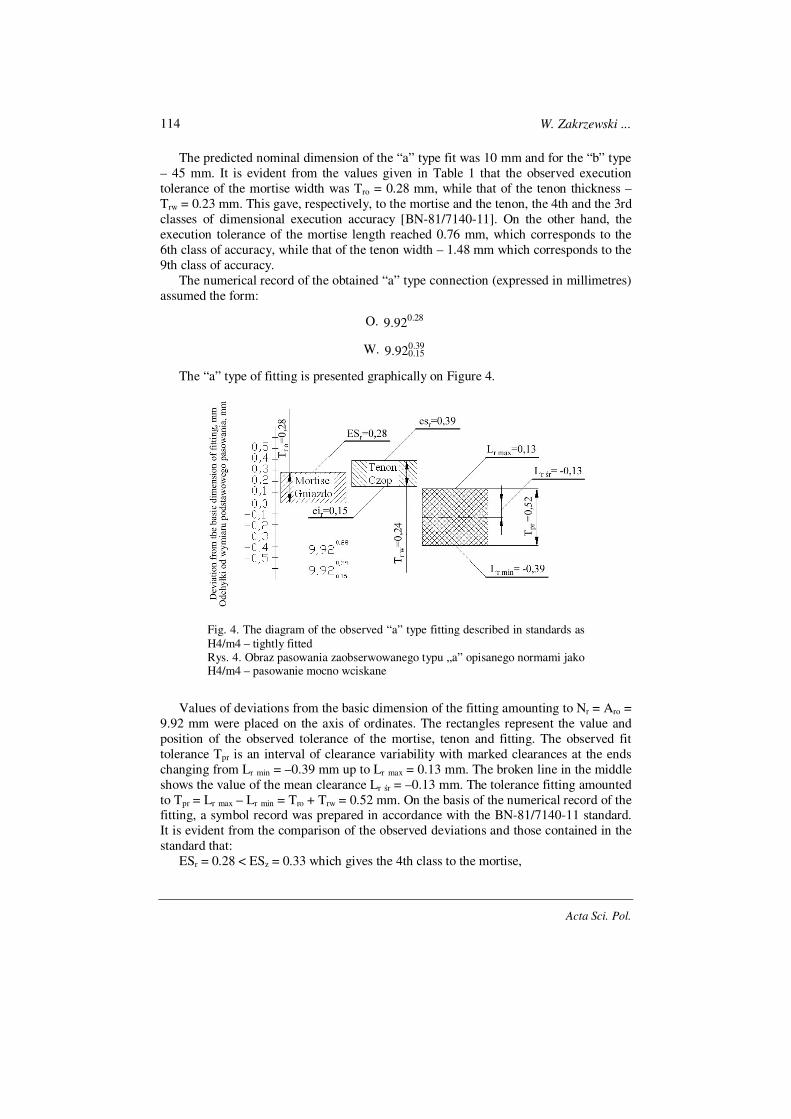
The “a” type of fitting is presented graphically on Figure 4.
Fig. 4. The diagram of the observed “a” type fitting described in standards as
H4/m4 – tightly fitted Rys. 4. Obraz pasowania zaobserwowanego typu „a” opisanego normami jako H4/m4 – pasowanie mocno wciskane
Values of deviations from the basic dimension of the fitting amounting to Nr = Aro =
9.92 mm were placed on the axis of ordinates. The rectangles represent the value and
position of the observed tolerance of the mortise, tenon and fitting. The observed fit
tolerance Tpr is an interval of clearance variability with marked clearances at the ends
changing from Lr min = –0.39 mm up to Lr max = 0.13 mm. The broken line in the middle
shows the value of the mean clearance Lr śr = –0.13 mm. The tolerance fitting amounted
to Tpr = Lr max – Lr min = Tro + Trw = 0.52 mm. On the basis of the numerical record of the fitting, a symbol record was prepared in accordance with the BN-81/7140-11 standard.
It is evident from the comparison of the observed deviations and those contained in the
standard that:
ESr = 0.28 < ESz = 0.33 which gives the 4th class to the mortise,
Investigations on the dimensional accuracy and surface structure of a tenon joint
Silvarum Colendarum Ratio et Industria Lignaria 6(4) 2007
115
esr = 0.39 < esz = 0.44 and eir = 0.15 > eiz = 0.11 which gives the 4th class to the te-
non in the m fitting (values in millimetres).
Taking into consideration the above, the symbolic record of the fitting was estab-
lished as 9.92 H4/m4. This is a mixed tight fitting in which both the mortise and the
tenon are executed in the 4th class of accuracy.
Since both elements of the connection were made in the same class of accuracy, therefore the symbolic record can be arrived at using a different method, namely by the
comparison of the observed limiting clearances with those contained in the standard.
The clearance tables in the standard are elaborated in such a way that they contain only
limiting clearances for the fits of the same execution accuracy of both elements. For the
performed comparison, it follows that: Lr max = 0.13 < Lz max = 0.22 and Lr min = –0.39 >
Lz min = –0.44, and the observed fitting tolerance must be smaller than that contained in
the standard Tpr = 0.52 < Tpz = 0.66. This comparison also corresponds to the 4th class
of accuracy of the fit execution H/m.
Although the 4th class of accuracy is recommended by the standard for the stop
house tenon joint, the m type fitting is less favourable than the l type. That is why, ac-
cording the standard, the optimal fit should be written down as: 9.92 H4/l4. The l type
fitting is characterised by the fact that the lower deviation of the tenon eiz is 0 which means that the limiting clearances are identical with regard to their absolute value, i.e.
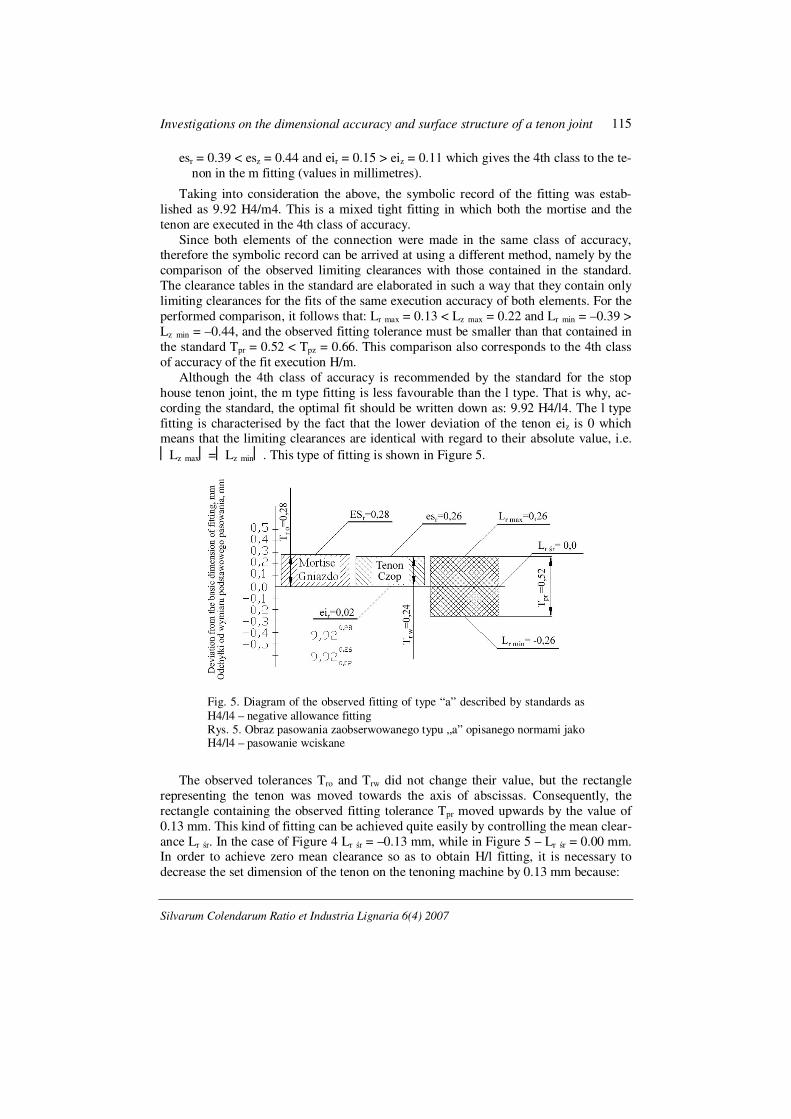
Lz max=Lz min. This type of fitting is shown in Figure 5.
Fig. 5. Diagram of the observed fitting of type “a” described by standards as
H4/l4 – negative allowance fitting Rys. 5. Obraz pasowania zaobserwowanego typu „a” opisanego normami jako H4/l4 – pasowanie wciskane
The observed tolerances Tro and Trw did not change their value, but the rectangle
representing the tenon was moved towards the axis of abscissas. Consequently, the
rectangle containing the observed fitting tolerance Tpr moved upwards by the value of
0.13 mm. This kind of fitting can be achieved quite easily by controlling the mean clear-
ance Lr śr. In the case of Figure 4 Lr śr = –0.13 mm, while in Figure 5 – Lr śr = 0.00 mm. In order to achieve zero mean clearance so as to obtain H/l fitting, it is necessary to
decrease the set dimension of the tenon on the tenoning machine by 0.13 mm because:
W. Zakrzewski ...
Acta Sci. Pol.
116
∆Lr śr = 0.00 – (–0.13) = 0.13 mm,
∆x̄w = –∆Lr śr = –0.13 mm.
In the observed fitting 9.92 H4/l4 obtained in this way, it is possible to compare the
observed deviations with those occurring in the standard:
ESr = 0.28 < ESz = 0.33,
esr = 0.26 < esz = 0.33 and eir = 0.02 > eiz = 0.00.
It is evident from the comparison of clearances that:
Lr max = 0.26 < Lz max = 0.33 and Lr min = –0.26 > Lz min = –0.33
In his experiments, Rybski [1976] found that the tenon joint of type “a” was charac-
terised by a greater strength because the mean clearance Lz śr = 0.1 mm.
If this recommendation were to be followed, the position of the observed tolerance
fit would have to be brought to the situation shown in Figure 6.
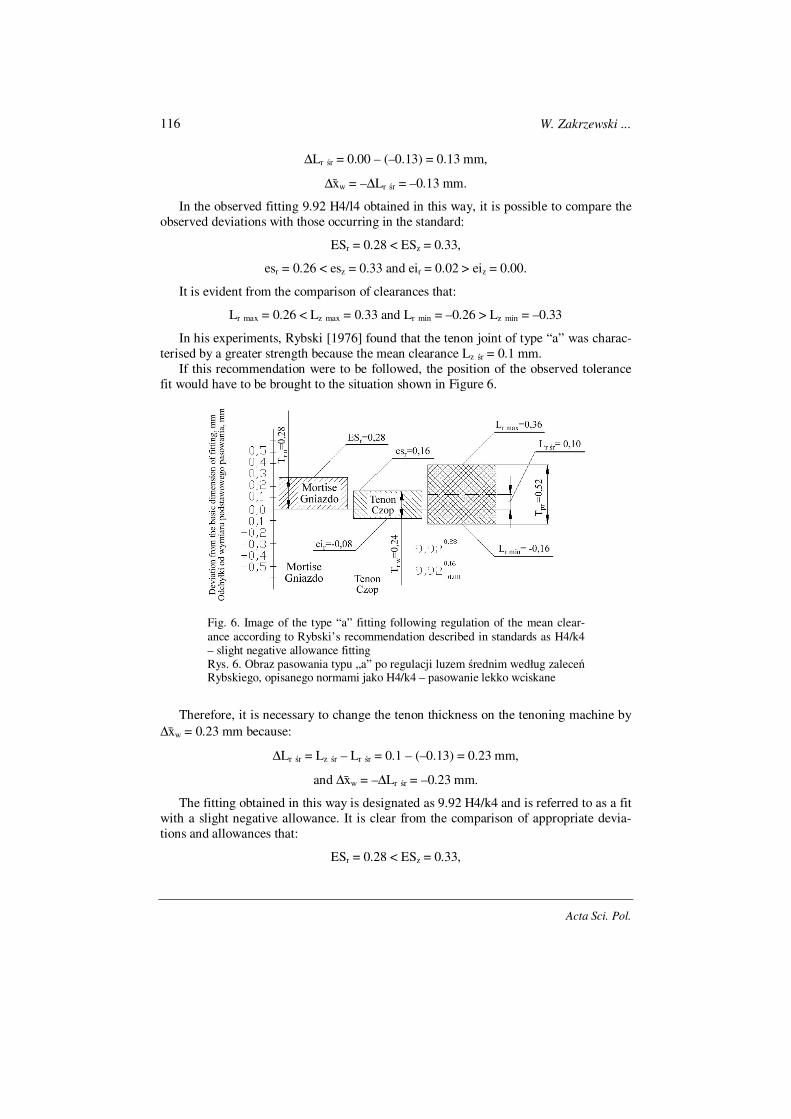
Fig. 6. Image of the type “a” fitting following regulation of the mean clear-
ance according to Rybski’s recommendation described in standards as H4/k4 – slight negative allowance fitting Rys. 6. Obraz pasowania typu „a” po regulacji luzem średnim według zaleceń Rybskiego, opisanego normami jako H4/k4 – pasowanie lekko wciskane
Therefore, it is necessary to change the tenon thickness on the tenoning machine by
∆x̄w = 0.23 mm because:
∆Lr śr = Lz śr – Lr śr = 0.1 – (–0.13) = 0.23 mm,
and ∆x̄w = –∆Lr śr = –0.23 mm.
The fitting obtained in this way is designated as 9.92 H4/k4 and is referred to as a fit
with a slight negative allowance. It is clear from the comparison of appropriate devia-
tions and allowances that:
ESr = 0.28 < ESz = 0.33,

Investigations on the dimensional accuracy and surface structure of a tenon joint
Silvarum Colendarum Ratio et Industria Lignaria 6(4) 2007
117
esr = 0.16 < esz = 0.25 and eir = –0.08 = eiz = –0.08,
Lr max = 0.36 < Lz max = 0.41 and Lr min = –0.16 > Lz min = –0.25.
Figure 7 presents the industrial execution of the “b” type connection. The numerical
record of the fit was:
O. 87.4376.0 ,
W. 87.4325.122.0− .
Fig. 7. Image of the type “b” fitting described in standards as
H6/k9 – slight negative allowance fitting Rys. 7. Obraz pasowania zaobserwowanego typu „b” opisane-go normami jako H6/k9 – pasowanie lekko wciskane
It is evident from the comparison of the observed and standard deviations:
ESr = 0.76 < ESz = 0.88,
esr = 1.25 < esz = 1.45 and eir = –0.22 > eiz = –0.48.
that the mortise length falls within the 6th accuracy class, whereas the tenon width is
contained in the 9th class of type k. Hence, the notation of the manufactured connection
of type “b” has the form 43.87 H6/k9. It can be noticed from the comparison of bound-
ary allowances that: Lr max = 0.99 < Lz max = 1.36 and Lr min = –1.25 > Lz min = –1.45. From the point of view of the standard, this is not qualitatively capable because the
index of the fitting quality capability according to Zakrzewski and Staniszewska [2002]
10.462.24
1.04
T
Tc
pr
pzp <=== . The value of Tpz (Tzo + Tzw) = 0.52 + 0.52 = 1.04 mm for
the 4th fit accuracy class recommended by the standard, while the value Tpr (Lr max –
Lr min) = 0.99 – (–1.25) = 2.24 mm.
W. Zakrzewski ...
Acta Sci. Pol.
118
The lack of the type “b” fitting quality capability can be attributed to a particularly
high tenon observed tolerance visible in Figure 7. It amounts to Trw = 1.47 mm and
exceeds by nearly three times the value of Tzw = 0.52 mm allowable by the standard.
The observed tolerance of the mortise length Tro = 0.76 mm also exceeds the value
allowed by the standard which, for the 4th class accuracy, amounts to Tro = 0.52 mm. In
order to reach the fitting recommended by the standard (H4/l4), the values of the ob-
served tolerances of the tenon Trw = 1.47 mm and mortise Tro = 0.76 mm should be
decreased to the value acceptable in the 4th accuracy class, i.e. Tzo = Tzw = 0.52 mm.
The execution accuracy of the tenon width and mortise length could be improved by
reducing vibrations and clearances which occur in the OPNU systems of the applied machine tools. Later on, by controlling the observed mean clearances, as in the case of
the “a” type of the fit, the observed mean clearance could be moved in such a way that it
would assume the value Lr śr = Lz śr = 0.00 mm.
On the other hand, if the value of the mean clearance were to adopt the value rec-
ommended by Rybski of Lz śr = –0.70 mm (for the strongest fit), the observed mean
clearance would have to be brought to the same value, i.e. Lr śr = Lz śr = –0.70 mm.
Graphic fit image taking into consideration the outline of irregularities
Measurements of surface irregularities were conducted only for the “a” type of fit-
ting. The determined value of the carrying capacity proportion of irregularities on the
individual levels of the intersection c for the measurement section L was somewhat
simplified and treated as the load carrying capacity for the entire surface of the mortise
and tenon.
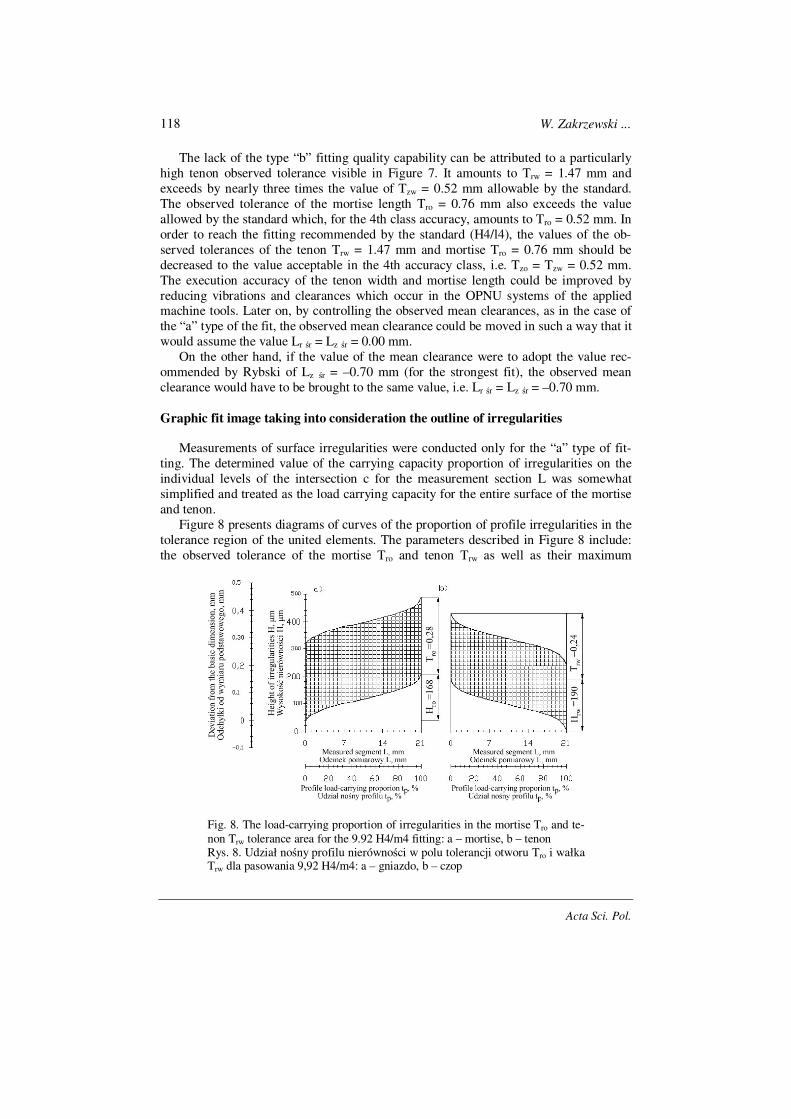
Figure 8 presents diagrams of curves of the proportion of profile irregularities in the
tolerance region of the united elements. The parameters described in Figure 8 include:
the observed tolerance of the mortise Tro and tenon Trw as well as their maximum
Fig. 8. The load-carrying proportion of irregularities in the mortise Tro and te-
non Trw tolerance area for the 9.92 H4/m4 fitting: a – mortise, b – tenon Rys. 8. Udział nośny profilu nierówności w polu tolerancji otworu Tro i wałka Trw dla pasowania 9,92 H4/m4: a – gniazdo, b – czop

Investigations on the dimensional accuracy and surface structure of a tenon joint
Silvarum Colendarum Ratio et Industria Lignaria 6(4) 2007
119
heights of irregularities Hro and Hrw. The maximum height of the irregularity outline
clearance was Hro = 168 µm and this constitutes its 60% proportion in the tenon toler-
ance area, which can be written down as: Hro = 0.60 Tro. On the other hand, this propor-
tion for the tenon was slightly higher and reached 79%, i.e. Hrw = 0.79 Trw.
It is evident from the diagrams presented in Figure 8 that outline of irregularities for
the mortise decrease and for the tenon increase the observed dimension when constant
tolerance value is maintained.
Figure 9 shows tolerance images of areas of connection elements together with the
position of their load carrying capacity profiles for the executed 9.92 H4/m4 fitting. On
the left, limiting clearances Lr min and Lr max, also shown in Figure 4, are visible, whereas on the right – the observed clearances: minimal Lr1 min and maximal Lr1 max corrected by
the maximum proportion of the outline of irregularities can be seen.
Fig. 9. Superimposition of load-carrying capacities in the connection in the
a direction symbolically designated as 9.92 H4/m4 Rys. 9. Połączenie krzywych nośności w połączeniu w kierunku a oznaczone symbolowo 9,92 H4/m4
It is evident, then, that two types of clearances occur, namely: those measured at the
peaks of irregularities and those measured on their bottoms.
Clearance increments result from the proportion of the profile load carrying capaci-
ties along the length of the measured segment. The value of the observed fit tolerance is the same regardless of whether it is measured along peaks of irregularities Tpr or their
bottoms Tpr1, in other words Tpr = Tpr1, because:
Tpr = Lr max – Lr min = 0.13 – (–0.39) = 0.52 mm,
Tpr1 = Lr1 max – Lr1 min = 0.49 – (–0.03) = 0.52 mm,
where:
Lr max = 0.13 mm – maximum clearance measured along peaks of irregularities,

W. Zakrzewski ...
Acta Sci. Pol.
120
Lr1 max = 0.49 mm – maximum clearance measured along bottoms of irregulari-
ties,
Lr min = –0.39 mm – minimum clearance (maximum negative allowance) meas-
ured along peaks of irregularities,
Lr1 min = –0.03 mm – minimum clearance (maximum negative allowance) meas-
ured along bottoms of irregularities.
The outline of irregularities for the fitting created surfaces which are contained be-
tween the maximum mortise 2o and maximum tenon 2w. The D surface designates
wood compression during the assembly process, while C – clearance for glue.
Between the minimum mortise 1o and minimal tenon 1w, there is even a greater area of compression D1 than in place D, and the clearance for glue C1 is significantly
smaller than in place C. On the other hand, the B + C + C1 area, which is contained
between the maximum mortise 2o and minimal tenon 1w, refers to the largest possible
clearance for glue, whereas the B + D + D1 area, which is contained between the mini-
mal mortise 1o and maximum tenon 2w, designates the strongest possible wood com-
pression during assembly.
CONCLUSIONS
The following conclusions can be drawn for the tenon joint of the backrest leg with
the side underframe of a chair manufactured from pinewood in industrial conditions:
1. The case of fitting in the direction of the mortise width and tenon thickness, it is
possible to achieve the 4th class of the fit accuracy which is in keeping with the stan-
dard recommendations. No such accuracy can be achieved in the case of fitting in the
direction of the mortise length and tenon width.
2. In order to accomplish a complete compliance with the fitting standards (fitting
with a slight negative allowance H4/l4) in the direction of the mortise width and tenon
thickness (the executed fit was that of a strong negative allowance H4/m4), a small correction of the tenoning machine by –0.13 mm is sufficient.
3. In order to accomplish a complete compliance with the fitting standards (fitting
with a slight negative allowance H4/l4) in the direction of the mortise length and tenon
width (the executed fit was that of a slight negative allowance H6/k9), first it is neces-
sary to reduce the clearance spread (observed tolerance fit) and then change the type of
fitting by controlling its mean clearance.
4. The value of the highest profile irregularity height reached 168 µm for the mortise which constitutes 60% proportion of its outline clearance of irregularities in the area of
the observed tolerance.
5. The value of the highest profile irregularity height reached 190 µm for the tenon which constitutes 79% proportion of its outline clearance of irregularities in the area of
the observed tolerance.
6. For the mortise width and for the tenon thickness, the proportion of the outline of
irregularities in the area of the tolerance fitting results in the increase of maximum and
minimum clearances by the same value equalling 0.36 mm which constitutes the sum of the greatest profile heights of the united elements.

Investigations on the dimensional accuracy and surface structure of a tenon joint
Silvarum Colendarum Ratio et Industria Lignaria 6(4) 2007
121
7. The graphic fit image extended by the proportion of the outline of irregularities
reveals areas representing wood compressions occurring during the process of assembly
and utilisation. It is also possible to notice other areas representing depressions on the
fitted parts free of material intended for glue.
REFERENCES
Bajkowski J., 1990. Jakie to pasowanie [What kind of fit]. Przem. Drzewn. 41, 16-17 [in Polish]. BN-81/7140-11, 1981. Układ tolerancji i pasowań dla meblarstwa [System of tolerances and fits
for furniture industry]. 1-17 [in Polish]. Czyżewski B., 1992. Metody statystyczne w sterowaniu jakością procesów technologicznych
[Statistical methods in the quality management of technological processes]. Wielk. Korp. Techn. NOT, Pozn. Klub Jak. Poznań, 47-49 [in Polish].
Nowicki B., 1991. Struktura geometryczna – chropowatość i falistość [Geometrical structure – roughness and waviness]. WNT Warszawa [in Polish].
Rybski F.A., 1976. Badania nad kształtowaniem się zależności między rodzajem pasowania a wytrzymałością złączy czopowych krytych [Investigations on interrelationships between the
type of fit and strength of covered tenon joints]. Rozpr. dokt. Bibl. AR Poznań [in Polish]. Staniszewska A., Zakrzewski W., 1988. Statystyczny sposób wyznaczania dokładności wymia-
rów liniowych [Statistical method of determination of accuracy of linear dimensions]. Przem. Drzewn. 39 (4), 5-7 [in Polish].
Staniszewska A., Zakrzewski W., 1990. Przykładowe wyznaczenie rodzaju pasowania na pod-stawie położenia pól tolerancji zaobserwowanych elementów kojarzonych [Illustrations of the determination of the types of fits on the basis of the position of the tolerance fields of the ob-served joined elements]. Przem. Drzewn. 41 (4), 14-16 [in Polish].
Staniszewska A., Zakrzewski W., 1995. Statystyczna kontrola wymiarowej dokładności obróbki
[Statistical control of the process dimensional accuracy]. Przem. Drzewn. 46 (1), 22-25 [in Polish].
Staniszewska A., Zakrzewski W., 1999/2000. Functional evaluation of a tenon joint on the basis of parameters acquired from the load capacity curve. Rocz. AR Pozn. 324, Technol. Drewn. 33, 31-46.
Staniszewska A., Zakrzewski W., 2006. Obróbka cięciem [Processing by cutting]. Wyd. AR Poznań [in Polish].
Staniszewska A., Zakrzewski W., Michalak K., 1994. Określenie rzeczywistego pasowania złącza
czopowo-gniazdowego na podstawie rozrzutu jego wymiarów w produkcji seryjnej [Determi-nation of the real fitting of a tenon-mortice joint of the basis of the scatter of its dimensions in serial production]. Rocz. AR Pozn. 262, Mech. Technol. Drewn. 26, 71-89 [in Polish].
Staniszewska A., Zakrzewski W., Żurek J., 1996. Znaczenie krzywych udziału nośnego w ob-szarze tolerancji połączenia czopowego [Importance of the curve bearing proportion in the tolerance area of the tenon joint]. Folia For. Pol. Ser. B, 27, 5-21 [in Polish].
Wieczorowski M., Cellary A., Chajda J., 1996. Charakterystyka chropowatości powierzchni. [Characteristics of surface roughness]. Inst. Techn. Masz. P. Pozn. 34-41 [in Polish].
Zakrzewski W., Staniszewska A., 2002. Dokładność obróbki drewna cięciem [Processing accu-racy of cutting wood]. Wyd. AR Poznań, 59-92 [in Polish].
W. Zakrzewski ...
Acta Sci. Pol.
122
BADANIA DOKŁADNOŚCI WYMIAROWEJ I STRUKTURY POWIERZCHNI
POŁĄCZENIA CZOPOWEGO
Streszczenie. W pracy badano tolerancje wykonania i krzywe nośności powierzchni połą-czenia czopowego występujące w warunkach przemysłowych. Posługując się obrazami graficznymi pasowań poszerzonymi o udział skrajni zarysu nierówności, podjęto próbę wyjaśnienia wpływu skrajni zarysu nierówności na charakter pasowania.
Słowa kluczowe: gniazdo, czop, tolerancja pasowania, krzywa nośności
Accepted for print – Zaakceptowano do druku: 30.10.2007
For citation – Do cytowania: Zakrzewski W., Białas A., Pinkowski G., Krauss A., 2007. Investiga-
tions on the dimensional accuracy and surface structure of a tenon joint. Acta Sci. Pol., Silv.
Colendar. Rat. Ind. Lignar. 6(4) 2007, 107-122.