investing in microfinance - university meets · pdf filesame results if conducting arima model...
TRANSCRIPT

University Meets Microfinance Workshop Microfinance in crisis? Impact and financial transparency
Frankfurt School of Finance & Management, July 19th - 20th
Ph.D Project Julia Meyer
Center for Microfinance
Investing in Microfinance Benchmarking Microfinance Investment Funds: Index Calculation

Outline
Research Questions
Background
Problem Outline
Empirical Approach
Index Calculation Methodologies
Results
Comparison to SMX and SRI / commercial Indices
2
Research Questions
How to benchmark MFIFs by one or more preferably homogeneous indices?
Might adding microfinance to a commercial portfolio lead to diversification effects?
3

Background: Investment in Microfinance - Growth
Increase in number of MIIs*
*Microfinance Investment Intermediaries (MIIs): MIVs, Holding Companies, Other MIIs, CGAP (2010)
MIV Asset Growth*
*US$ Mio.; Source: MicroRate 2011, 80 participating MIVs
*
4
4058
8090
23 25 29 34 40
61
35
35
31
32
0
20
40
60
80
100
120
140
2000 2001 2002 2003 2004 2005 2006 2007 2008 2009
Survey Respondents All MIIs
1'195
1'964
3'864
4'931
6'0236'420
705
1'476
3'053
3'8144'246
4'749
0
1'000
2'000
3'000
4'000
5'000
6'000
7'000
2005 2006 2007 2008 2009 2010
Total MIV Assets (Mio. US$) Total MF Assets (Mio. US$)
Growth in MIIs and assets invested Increasing number of investors Transparency and disclosure
important
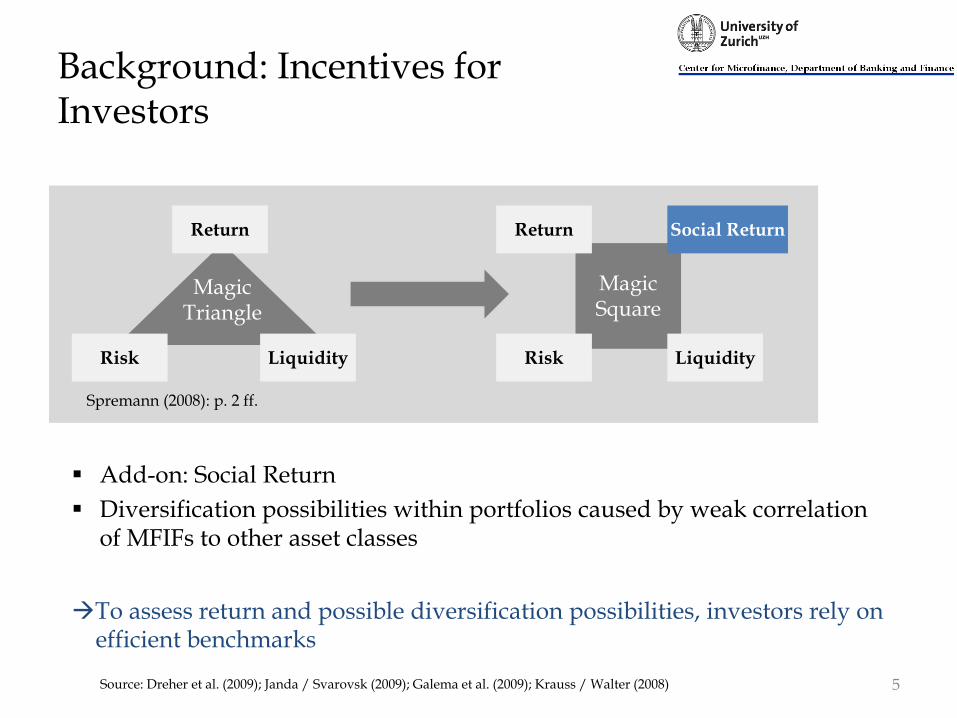
Add-on: Social Return
Diversification possibilities within portfolios caused by weak correlation of MFIFs to other asset classes
To assess return and possible diversification possibilities, investors rely on efficient benchmarks
Source: Dreher et al. (2009); Janda / Svarovsk (2009); Galema et al. (2009); Krauss / Walter (2008)
Background: Incentives for Investors
Return
Risk Liquidity
Magic Triangle
Magic Square
Liquidity Risk
Return Social Return
Spremann (2008): p. 2 ff.
5

Problem Outline
New market, not well established to date
No structured information available for investors
Missing benchmarks
Existing Index SMX: Symbiotics 2005
Index Debt (2-7 Funds)
Index Equity (5 MFIs)
SMX shows shortcomings
Only self-managed funds included
Limited picture of the market
Equal weighting of the funds
SMX might overestimate the performance of the microfinance universe
6
Empirical Approach – Data Situation
Current Situation:
Most MFIFs do not publicly disclose performance information
Data-bases and existing surveys include only few MFIFs and only provide yearly data
Even these yearly data are not easy to access
Elaboration of excel based survey and distribution to all MFIFs
7
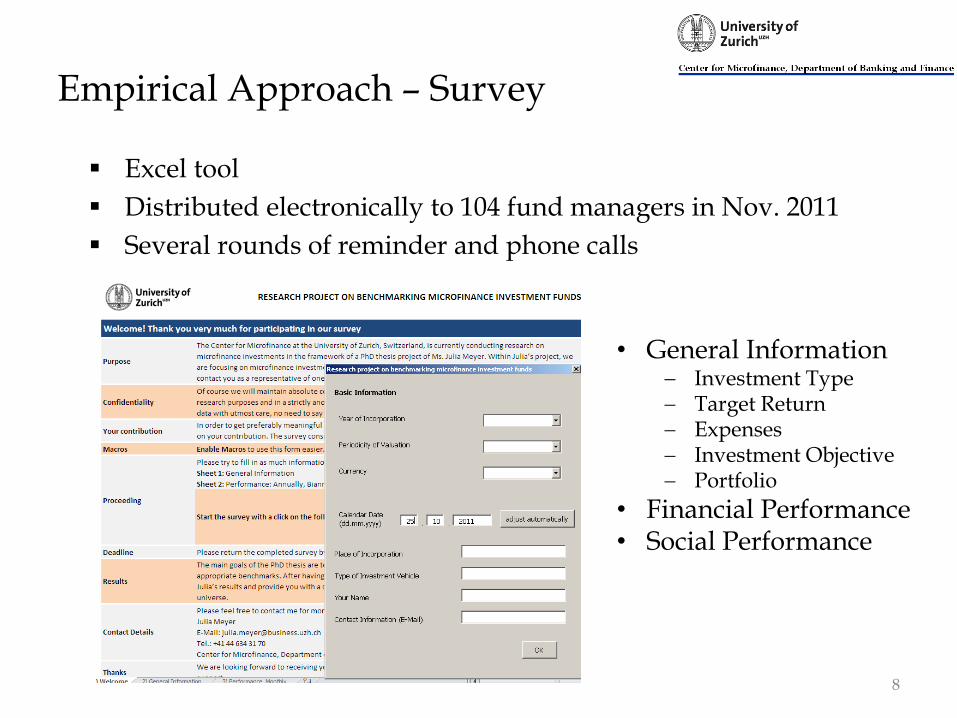
Empirical Approach – Survey
Excel tool
Distributed electronically to 104 fund managers in Nov. 2011
Several rounds of reminder and phone calls
• General Information Investment Type Target Return Expenses Investment Objective Portfolio
• Financial Performance • Social Performance
8

Empirical Approach – Feedback
9
Mostly comparable funds mainly invested in debt provide monthly performance data
Calculation of two debt indices: USD and EUR
Description Number of Funds
Surveys distributed 104
Responses 28 (27%)
Providing Performance Information 20
Performance on a monthly Basis 13
Data in USD 5
Data in EUR 8
Data from Bloomberg (USD) 1
Data from Bloomberg (EUR) 5
Total Funds for Index Calculation USD 6
Total Funds for Index Calculation EUR 13
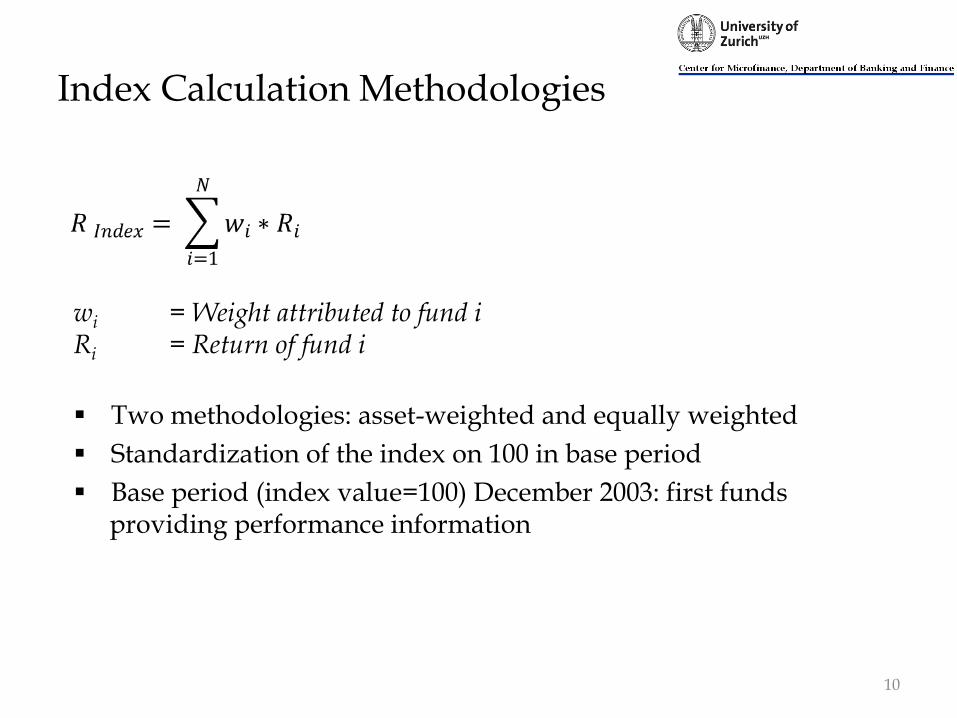
Index Calculation Methodologies
10
wi = Weight attributed to fund i Ri = Return of fund i
Two methodologies: asset-weighted and equally weighted
Standardization of the index on 100 in base period
Base period (index value=100) December 2003: first funds providing performance information
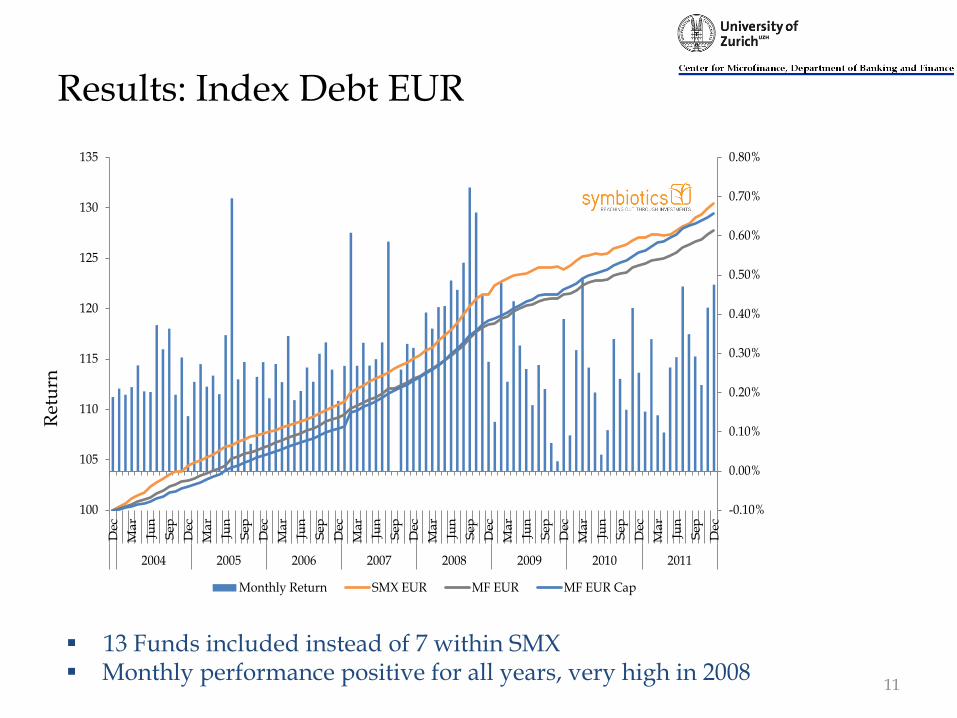
Results: Index Debt EUR
11
Ret
urn
13 Funds included instead of 7 within SMX Monthly performance positive for all years, very high in 2008
100
105
110
115
120
125
130
135
Dec
Ma
r
Jun
Sep
Dec
Ma
r
Jun
Sep
Dec
Ma
r
Jun
Sep
Dec
Ma
r
Jun
Sep
Dec
Ma
r
Jun
Sep
Dec
Ma
r
Jun
Sep
Dec
Ma
r
Jun
Sep
Dec
Ma
r
Jun
Sep
Dec
2004 2005 2006 2007 2008 2009 2010 2011
-0.10%
0.00%
0.10%
0.20%
0.30%
0.40%
0.50%
0.60%
0.70%
0.80%
Monthly Return SMX EUR MF EUR MF EUR Cap
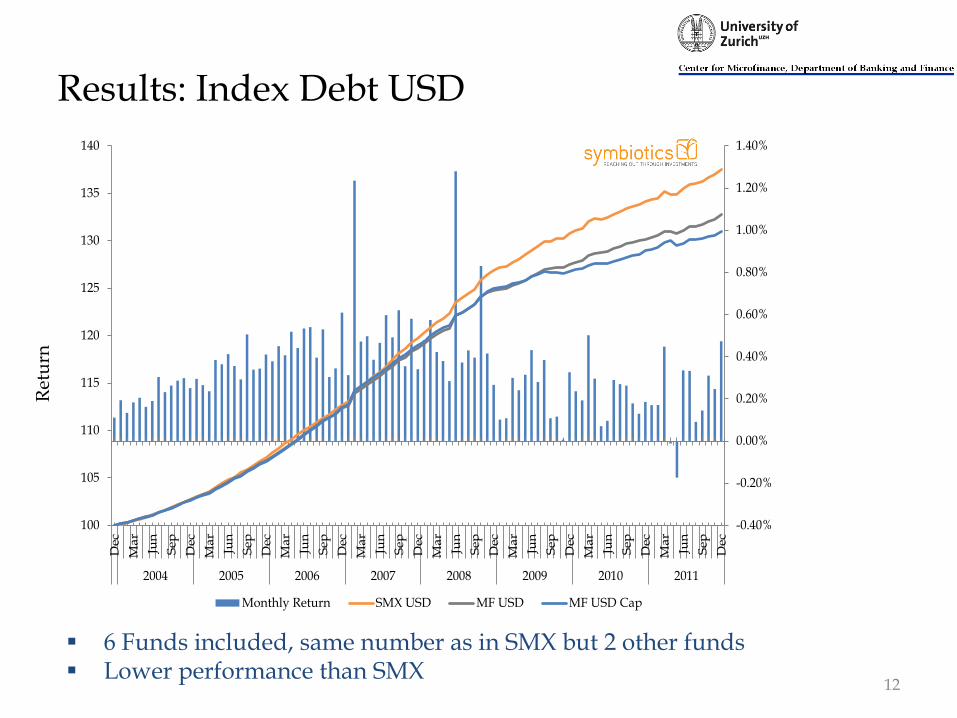
Results: Index Debt USD
12
Ret
urn
6 Funds included, same number as in SMX but 2 other funds Lower performance than SMX
-0.40%
-0.20%
0.00%
0.20%
0.40%
0.60%
0.80%
1.00%
1.20%
1.40%
100
105
110
115
120
125
130
135
140
Dec
Ma
r
Jun
Sep
Dec
Ma
r
Jun
Sep
Dec
Ma
r
Jun
Sep
Dec
Ma
r
Jun
Sep
Dec
Ma
r
Jun
Sep
Dec
Ma
r
Jun
Sep
Dec
Ma
r
Jun
Sep
Dec
Ma
r
Jun
Sep
Dec
2004 2005 2006 2007 2008 2009 2010 2011
Monthly Return SMX USD MF USD MF USD Cap
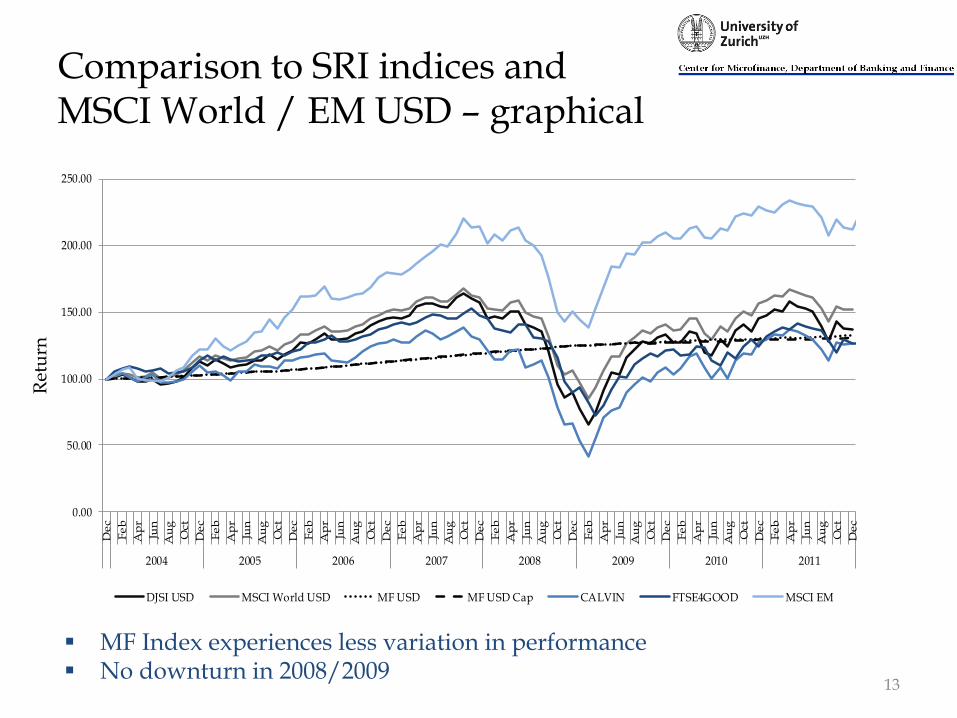
Comparison to SRI indices and MSCI World / EM USD – graphical
13
Ret
urn
0.00
50.00
100.00
150.00
200.00
250.00
De
c
Fe
b
Ap
r
Jun
Au
g
Oct
De
c
Fe
b
Ap
r
Jun
Au
g
Oct
De
c
Fe
b
Ap
r
Jun
Au
g
Oct
De
c
Fe
b
Ap
r
Jun
Au
g
Oct
De
c
Fe
b
Ap
r
Jun
Au
g
Oct
De
c
Fe
b
Ap
r
Jun
Au
g
Oct
De
c
Fe
b
Ap
r
Jun
Au
g
Oct
De
c
Fe
b
Ap
r
Jun
Au
g
Oct
De
c
2004 2005 2006 2007 2008 2009 2010 2011
DJSI USD MSCI World USD MF USD MF USD Cap CALVIN FTSE4GOOD MSCI EM
MF Index experiences less variation in performance No downturn in 2008/2009
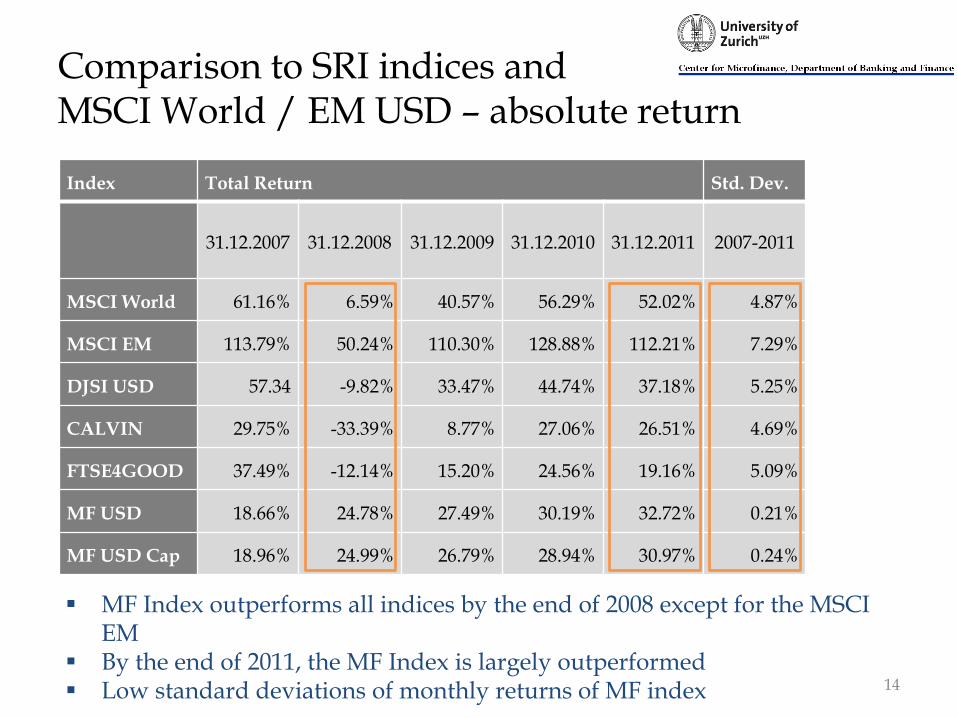
Comparison to SRI indices and MSCI World / EM USD – absolute return
Index Total Return Std. Dev.
31.12.2007 31.12.2008 31.12.2009 31.12.2010 31.12.2011 2007-2011
MSCI World 61.16% 6.59% 40.57% 56.29% 52.02% 4.87%
MSCI EM 113.79% 50.24% 110.30% 128.88% 112.21% 7.29%
DJSI USD 57.34 -9.82% 33.47% 44.74% 37.18% 5.25%
CALVIN 29.75% -33.39% 8.77% 27.06% 26.51% 4.69%
FTSE4GOOD 37.49% -12.14% 15.20% 24.56% 19.16% 5.09%
MF USD 18.66% 24.78% 27.49% 30.19% 32.72% 0.21%
MF USD Cap 18.96% 24.99% 26.79% 28.94% 30.97% 0.24%
14
MF Index outperforms all indices by the end of 2008 except for the MSCI EM
By the end of 2011, the MF Index is largely outperformed Low standard deviations of monthly returns of MF index

Equity index (SMX Equity)
15
0
50
100
150
200
250
De
c
Jan
Fe
b
Mar
Ap
r
May Jun
Jul
Au
g
Sep Oct
No
v
De
c
Jan
Fe
b
Mar
Ap
r
May Jun
Jul
Au
g
Sep Oct
No
v
De
c
Jan
Fe
b
Mar
Ap
r
May Jun
Jul
Au
g
Sep Oct
No
v
De
c
Jan
Fe
b
Mar
Ap
r
May Jun
Jul
Au
g
Sep Oct
No
v
De
c
Jan
Fe
b
Mar
Ap
r
May Jun
Jul
Au
g
Sep Oct
No
v
De
c
2007 2008 2009 2010 2011
USD Equity SMX DJSI USD MSCI World USD CALVIN FTSE4GOOD MSCI EM
Ret
urn
Different picture for equity index Seems to perform similar to other indices but clearly outperforms all of them Most probably overstates the performance of MF equity funds by only
accounting for five publicly listed MFIs (Brière/Szafarz, 2011)
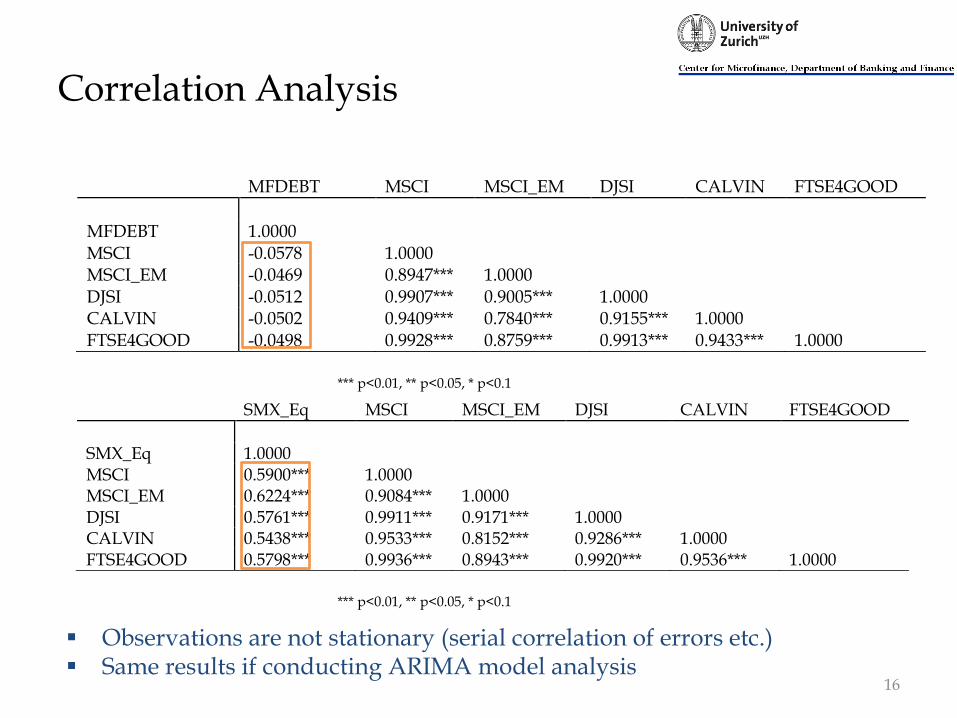
Correlation Analysis
16
SMX_Eq MSCI MSCI_EM DJSI CALVIN FTSE4GOOD
SMX_Eq 1.0000 MSCI 0.5900*** 1.0000 MSCI_EM 0.6224*** 0.9084*** 1.0000 DJSI 0.5761*** 0.9911*** 0.9171*** 1.0000 CALVIN 0.5438*** 0.9533*** 0.8152*** 0.9286*** 1.0000 FTSE4GOOD 0.5798*** 0.9936*** 0.8943*** 0.9920*** 0.9536*** 1.0000
MFDEBT MSCI MSCI_EM DJSI CALVIN FTSE4GOOD
MFDEBT 1.0000 MSCI -0.0578 1.0000 MSCI_EM -0.0469 0.8947*** 1.0000 DJSI -0.0512 0.9907*** 0.9005*** 1.0000 CALVIN -0.0502 0.9409*** 0.7840*** 0.9155*** 1.0000 FTSE4GOOD -0.0498 0.9928*** 0.8759*** 0.9913*** 0.9433*** 1.0000
*** p<0.01, ** p<0.05, * p<0.1
*** p<0.01, ** p<0.05, * p<0.1
Observations are not stationary (serial correlation of errors etc.) Same results if conducting ARIMA model analysis
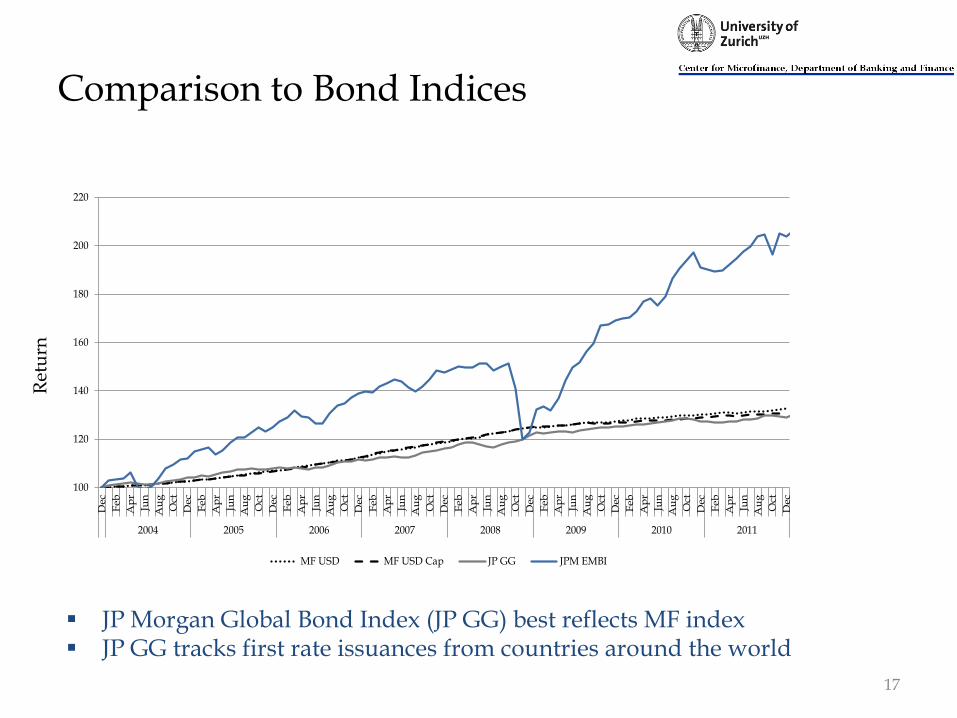
Comparison to Bond Indices
17
100
120
140
160
180
200
220
Dec
Feb
Ap
r
Jun
Au
g
Oct
Dec
Feb
Ap
r
Jun
Au
g
Oct
Dec
Feb
Ap
r
Jun
Au
g
Oct
Dec
Feb
Ap
r
Jun
Au
g
Oct
Dec
Feb
Ap
r
Jun
Au
g
Oct
Dec
Feb
Ap
r
Jun
Au
g
Oct
Dec
Feb
Ap
r
Jun
Au
g
Oct
Dec
Feb
Ap
r
Jun
Au
g
Oct
Dec
2004 2005 2006 2007 2008 2009 2010 2011
MF USD MF USD Cap JP GG JPM EMBI
Ret
urn
JP Morgan Global Bond Index (JP GG) best reflects MF index JP GG tracks first rate issuances from countries around the world

Conclusions
• Funds providing performance information are all rather comparable debt funds
• Index shows lower performance than SMX, especially USD
• SMX seems to overestimate microfinance return with only analyzing own managed funds
• Asset weighted or equally weighted: no big difference between large and small funds regarding performance
• Large differences between debt MF index and SRI / commercial indices indication for diversification possibilities
• Equity investments more correlated to SRI / commercial indices
• JP GG best reflecting MF index
18
Appendix
19
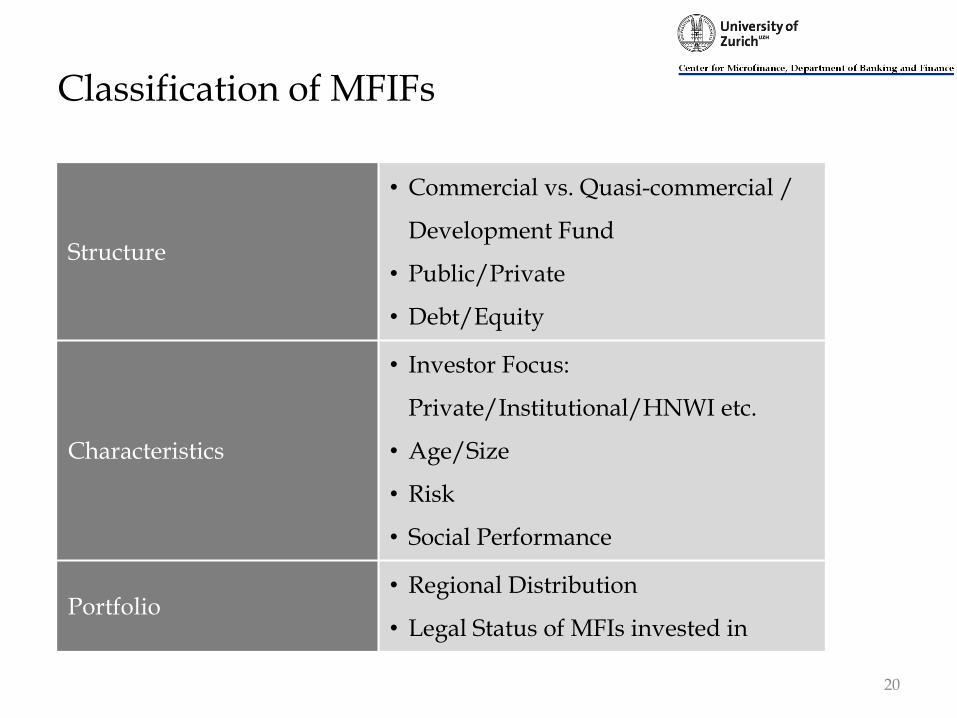
Classification of MFIFs
Structure
• Commercial vs. Quasi-commercial /
Development Fund
• Public/Private
• Debt/Equity
Characteristics
• Investor Focus:
Private/Institutional/HNWI etc.
• Age/Size
• Risk
• Social Performance
Portfolio • Regional Distribution
• Legal Status of MFIs invested in
20
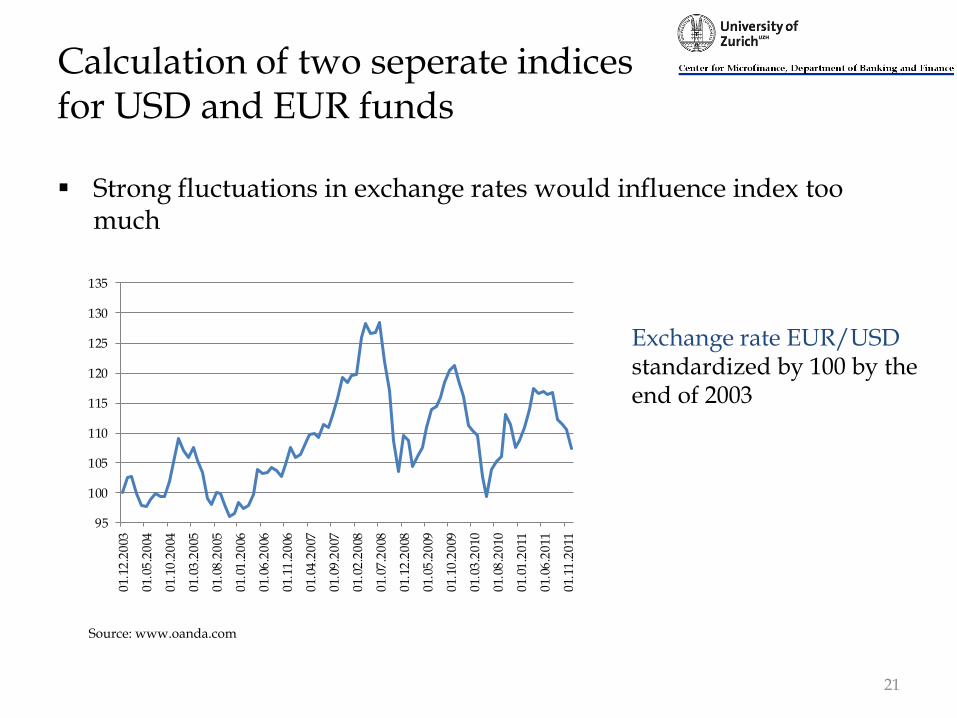
Calculation of two seperate indices for USD and EUR funds
Strong fluctuations in exchange rates would influence index too much
21
95
100
105
110
115
120
125
130
135
01.
12.2
003
01.
05.2
004
01.
10.2
004
01.
03.2
005
01.
08.2
005
01.
01.2
006
01.
06.2
006
01.
11.2
006
01.
04.2
007
01.
09.2
007
01.
02.2
008
01.
07.2
008
01.
12.2
008
01.
05.2
009
01.
10.2
009
01.
03.2
010
01.
08.2
010
01.
01.2
011
01.
06.2
011
01.
11.2
011
Exchange rate EUR/USD standardized by 100 by the end of 2003
Source: www.oanda.com

Comparison to SRI indices and MSCI World / EM EUR
22
0
20
40
60
80
100
120
140
160
180
De
c
Fe
b
Ap
r
Jun
Au
g
Oct
De
c
Fe
b
Ap
r
Jun
Au
g
Oct
De
c
Fe
b
Ap
r
Jun
Au
g
Oct
De
c
Fe
b
Ap
r
Jun
Au
g
Oct
De
c
Fe
b
Ap
r
Jun
Au
g
Oct
De
c
Fe
b
Ap
r
Jun
Au
g
Oct
De
c
Fe
b
Ap
r
Jun
Au
g
Oct
De
c
Fe
b
Ap
r
Jun
Au
g
Oct
De
c
2004 2005 2006 2007 2008 2009 2010 2011
DJSI EUR MSCI World EUR MF EUR MF EUR Cap ING Socially Responsible