investing in people - world bank
TRANSCRIPT

Supported by funding from the Australian Government (Department of Foreign Affairs and Trade, DFAT), under the Support for Enhanced Macroeconomic and Fiscal Policy Analysis (SEMEFPA) program.
December 2019
Investing in People
Pub
lic D
iscl
osur
e A
utho
rized
Pub
lic D
iscl
osur
e A
utho
rized
Pub
lic D
iscl
osur
e A
utho
rized
Pub
lic D
iscl
osur
e A
utho
rized

INDONESIA ECONOMIC QUARTERLY Investing in People
December 2019


Preface The Indonesia Economic Quarterly (IEQ) has two main aims. First, it reports on the key developments in Indonesia’s economy over the past three months, and places these in a longer-term and global context. Based on these developments and on policy changes over the period, the IEQ regularly updates the outlook for Indonesia’s economy and social welfare. Second, the IEQ provides a more in-depth examination of selected economic and policy issues and an analysis of Indonesia’s medium-term development challenges. It is intended for a wide audience, including policy makers, business leaders, financial market participants, and the community of analysts and professionals engaged in Indonesia’s evolving economy. The IEQ is a product of the World Bank’s Jakarta office and receives editorial and strategic guidance from an editorial board chaired by Rodrigo A. Chaves, Country Director and Rolande Simone Pryce, Acting Country Director for Indonesia. The report is prepared by the Macroeconomics, Trade and Investment (MTI) Global Practice team, under the guidance of Ndiame Diop (Practice Manager) and Frederico Gil Sander (Lead Economist). Led by Derek H. C. Chen (Senior Economist and lead author), the core project team comprises of Dwi Endah Abriningrum, Magda Adriani, Arsianti, Yus Medina, Juul Pinxten, Ratih Dwi Rahmadanti, Alief Aulia Rezza, and Virgi Agita Sari. Excellent administrative support is provided by Deviana Djalil. The launch event and dissemination is organized by Keshia Eneki Chloe Pieters, Nugroho Sunjoyo, Jerry Kurniawan, and GB Surya Ningnagara under the guidance of Lestari Boediono Qureshi and Derek H. C. Chen. This edition of the IEQ includes contributions from Alief Aulia Rezza (Part A1); Magda Adriani, Gita Febriyanti, Iwan Gunawan, Muhammad Farman Izhar, Rubi Mangunsong, Rahmadi, Andhyta Firselly Utami (Box A.1), with contributions from Pandu Harimurti, Azrin Rasuwin and Dinesh Aryal. Agus Wibowo and Suprapto (Badan Nasional Penanggulangan Bencana, BNPB), Agustan, Roby Arifandri and Mega Novetrihska (Badan Pengkajian and Penerapan Teknologi, BPPT), and Supriyanto (University of Indonesia, UI) assisted with the geospatial data compilation; Magda Adriani, Dwi Endah Abriningrum and Ratih Dwi Rahmadanti (Part A2); Dwi Endah Abriningrum (Box A.2, Box B.2); Yus Medina (Part A3, A4, Box A.3); Juul Pinxten, Wendy Cunningham, Maria M. Wihardja and Abor T. Perdana (Part A.5); Virgi Agita Sari (Part A.6); Derek H.C. Chen (Part A7); Alief Aulia Rezza and Mochamad Pasha (Box A.4), and Camilla Holmemo, Pablo A. Acosta, Robert J. Palacios, Philip O’Keefe, Juul Pinxten, Shonali Sen, with inputs from Margaret Grosh, Tina George, Ilsa Meidina, Tanya Adi Putri, Imam Setiawan, Anissa Rahmawati and Nurzanty Khadijah (Part B), Kathleen Victoria Tedi and Magda Adriani (Appendix). The report also benefited from discussions with, and in-depth comments from Ekaterina T. Vashakmadze (Senior Country Economist, EPGDR, World Bank) and Andrew D. Mason (Lead Economist, EAPCE, World Bank), Ergys Islamaj (Senior Economist, EAPCE, World Bank) and Janani Kandhadai (editorial assistant). This report is a product of the staff of the International Bank for Reconstruction and Development/the World Bank, supported by funding from the Australian government under the Support for Enhanced Macroeconomic and Fiscal Policy Analysis (SEMEFPA) program. The findings, interpretations, and conclusions expressed in this report do not necessarily reflect the views of the Executive Directors of the World Bank or the governments they represent, or the Australian government. The World Bank does not guarantee the accuracy of the data included in this work. The data cut-off date for this report was December 3, 2019. The boundaries, colors, denominations, and other information shown on any map in this work do not imply any judgment on the part of the World Bank concerning the legal status of any territory or the endorsement or acceptance of such boundaries. Photographs on the cover and Part B are copyrights of Dokumentasi Humas Linjamsos Kementerian Sosial and Part A is World Bank. All rights reserved. This report is available for download in English and Indonesian via: worldbank.org/ieq. Previous editions:
• June 2019: Oceans of Opportunity • December 2018: Strengthening Competitiveness • September 2018: Urbanization for All
To receive the IEQ and related publications by email, please email [email protected]. For questions and comments, please email [email protected]. For information about the World Bank and its activities in Indonesia, please visit:
www.worldbank.org/id
@BankDunia #IEQBankDunia
BankDunia
instagram.com/worldbank
www.linkedin.com/company/the-world-bank

Abbreviations AEOI Automatic Exchange of Information LGST Luxury Goods Sales Tax APBN Anggaran Pendapatan & Belanja Negara LNG Liquefied natural gas APRINDO Asosiasi Pengusaha Ritel Indonesia LPFR Labor Force Participation Rate AMC Aspiring Middle Class LTV Loan-to-Value ASLUT Asistensi Sosial Lanjut Usia Terlantar MoF Ministry of Finance ATM Automated Teller Machine/Anjungan Tunai
Mandiri MoHA Ministry of Home Affairs
BI Bank Indonesia MoSA Ministry of Social Affairs BLSM Bantuan Langsung Sementara Masyarakat MSME Micro, Small and Medium Enterprises BLT-PBI Bantuan Langsung Tunai-Penerima Bantuan
Iuran MTP Major Trading Partners
BLU Badan Layanan Umum NCPA National Center for Policy Analysis BOP Balance of Payment NIK Nomor Induk Kependudukan BPJS Badan Penyelenggara Jaminan Sosial
Kesehatan NOAA National Oceanic and Atmospheric
Administration BNPB Badan Nasional Penanggulangan Bencana NPL Non-Performing Loan BPNT Bantuan Pangan Non Tunai NTI Net-weighted Trade Index BPPT Badan Pengkajian dan Penerapan Teknologi O&G Oil and Gas BPS Badan Pusat Statistik PIP Program Indonesia Pintar CAD Current Account Deficit CAR Capital Adequacy Ratio PKH Program Keluarga Harapan CAMS Copernicus Atmosphere Monitoring Service PMK Peraturan Menteri Keuangan CPI Consumer Price Index PTKP Penghasilan Tida Kena Pajak CPO Crude Palm Oil Raskin Beras Miskin DAU Dana Alokasi Umum Rastra Beras Sejahtera DTPPFM/BDT Data Terpadu untuk Program Penanganan
Fakir Miskin/Basis Data Terpadu SA Sosial Assistance
EAP East Asia Pacific SD Sekolah Dasar ECB European Central Bank SI Sosial Insurance ECLAC Economic Commission for Latin America
and the Caribbean SITC Standard International Trade Classification
EMBI Emerging Market Bond Index SIKS-NG Sistem Informasi Kesejahteraan Sosial-Next Generation
EMCI Emerging Market Currency Index SJSN Sistem Jaminan Sosial Nasional EU European Union SMA Sekolah Menengah Atas F&B Food and Beverages SMK Sekolah Menengah Kejuruan FDI Foreign Direct Investment SNG Sub National Government FOMC Federal Open Market Committee SOE State-Owned Enterprises GAPKI Gabungan Pengusaha Kelapa Sawit
Indonesia SP Social Protection
GDP Gross Domestic Product SUN Surat Utang Negara GFCF Gross Fixed Capital Formation TNP2K Tim Nasional Percepatan Penanggulangan
Kemiskinan GOI Government of Indonesia TORA Tanah Obyek Reforma Agraria HIMBARA Himpunan Bank milik Negara ToT Terms of Trade IEQ Indonesia Economic Quarterly UDB Unified Data Base ITRC International Tripartite Rubber Council UI University of Indonesia JHT Jaminan Hari Tua UNEP United Nations Environment Programme JK Jaminan Kematian UU Undang-Undang JKK Jaminan Kecelakaan Kerja VAT Value Added Tax JKN Jaminan Kesehatan Nasional WHO World Health Organization JP Jaminan Pensiun WRI World Resource Institute KK Kartu Keluarga YoY Year-on-year KKS Kartu Keluarga Sejahtera KLHK Kementerian Lingkungan Hidup dan
Kehutanan
KTP Kartu Tanda Penduduk

Table of Contents PREFACE ................................................................................................................................... I
ABBREVIATIONS ..................................................................................................................... II
TABLE OF CONTENTS .......................................................................................................... III
EXECUTIVE SUMMARY: INVESTING IN PEOPLE ................................................................. 1
A. ECONOMIC AND FISCAL UPDATE ..................................................................................... 4
1. Economic growth eased in Q3 as domestic demand weakened ................................................................................ 4 2. The current account deficit narrowed while the capital and financial account surplus widened ............................. 10 3. Food inflation picked up transitorily in Q3 .............................................................................................................. 16 4. Weaker commodity prices and imports weigh on revenue collection amid muted expenditure growth .................. 16 5. Labor market conditions continued to improve ....................................................................................................... 19 6. Poverty continues to decline in Indonesia ............................................................................................................... 22 7. Economic growth outlook and risks ........................................................................................................................ 24
B. INVESTING IN PEOPLE: SOCIAL PROTECTION FOR INDONESIA’S 2045 VISION....... 34
1. A modern social protection system is key to achieve Indonesia’s high-income, zero-poverty vision ..................... 34 2. Indonesia has, over the past two decades, laid a solid foundation for its future social protection system .............. 37 3. Social Protection for Indonesia’s Future: A coherent, consolidated, and coordinated SP system to serve a
changing country in a changing world ................................................................................................................... 44 4. Moving towards a Social Protection system for the future ...................................................................................... 46 5. Implementing and Financing Indonesia’s Social Protection System ...................................................................... 52 6. Concluding remarks ................................................................................................................................................ 56
BIBLIOGRAPHY ...................................................................................................................... 59
APPENDIX: A SNAPSHOT OF INDONESIAN ECONOMIC INDICATORS ........................... 65

FIGURES Figure ES.1: GDP growth remained remarkably stable ................................................................................................. 3 Figure ES.2: Investment growth slowed amid lingering uncertainty ............................................................................ 3 Figure ES.3: A wide goods trade surplus led to a small reduction in the current account deficit ................................. 3 Figure ES.4: The Rupiah continued to strengthen against the U.S. Dollar .................................................................. 3 Figure ES.5: Food prices spiked in Q2, but lower administered prices kept headline inflation stable ......................... 3 Figure ES.6: Revenue collections slowed amid lower commodity prices and shrinking imports ................................. 3 Figure A.1: GDP growth slowed in Q3 in line with continued external headwinds ...................................................... 4 Figure A.2: Faster growth in the manufacturing sector offset the moderation in the agriculture sector ...................... 5 Figure A.3: Private consumption growth eased ............................................................................................................. 6 Figure A.4: High frequency indicators for private consumption point to a mixed picture ........................................... 6 Figure A.5: Investment growth slowed considerably as political uncertainty lingered ................................................. 6 Figure A.6: After shrinking for two consecutive quarters, exports stopped contracting… ........................................... 7 Figure A.7: … while imports continued to contract ...................................................................................................... 7 Figure A.8: Forest and land fires reached a new record since 2015 this year, partly due to dry season ......................... 7 Figure A.9: Agricultural, transportation, trade, and industry recorded the highest economic losses from forest fires . 8 Figure A.10: Central Kalimantan and South Kalimantan are the most affected provinces relative to size of their
economy ................................................................................................................................................................... 8 Figure A.11: Goods exports continued to deteriorate… ................................................................................................ 10 Figure A.12: Exports volumes of coal and metals rose while exports of other key commodities fell ........................... 11 Figure A.13: Key commodity prices weakened compared to a year ago, except rubber ............................................... 11 Figure A.14: Goods imports contracted further in all categories. ................................................................................. 12 Figure A.15: The current account deficit narrowed with a larger good trade surplus .................................................. 12 Figure A.16: Capital and financial account surplus widened, partly driven by large portfolio investment .................. 13 Figure A.17: …on the back of foreign purchase in government bonds… .................................................................... 13 Figure A.18: …with FDI continuing to be moderate .................................................................................................... 13 Figure A.19: Global energy and non-energy indices fell in Q3, continuing the trend that began in 2018 .................... 15 Figure A.20: Prices of LNG, CPO, and base metals remained stable while prices of other key commodities declined
................................................................................................................................................................................. 15 Figure A.21: Headline inflation rose slightly in Q3 2019 due to higher inflation of raw food and gold prices ............. 16 Figure A.22: Higher education prices contributed to the increase of core inflation in Q3 2019 ................................... 16 Figure A.23: Cumulative revenue growth declined due to the contraction of O&G and VAT revenues ...................... 17 Figure A.24: Government expenditures growth was mainly driven by higher personnel and social spending ............ 18 Figure A.25: Lower execution of subsidy spending was offset by higher disbursements of personnel and social
spending .................................................................................................................................................................. 18 Figure A.26: The rate of employment saw a further increase while unemployment fell to a record low in August 2019
................................................................................................................................................................................ 20 Figure A.27: Underemployment has risen slightly, driven by an increase in voluntary unemployment ..................... 20 Figure A.28: While earnings growth and minimum wage growth are correlated ......................................................... 21 Figure A.29: …an increasing share of workers are earning less than provincially mandated minimum wages ........... 21 Figure A.30: Poverty continued to be recorded at a single digit, despite the slowing pace ........................................ 22 Figure A.31: The middle-class continues to expand, yet vulnerability remains high .................................................. 22 Figure A.32: Although poverty declined nationally, the reduction was not uniform across the provinces .................. 23 Figure A.33: Indonesia’s net weighted price index (NTI) is projected to continue weakening this and next year… 25 Figure A.34: The current account deficit is projected to gradually narrow. ................................................................ 25 Figure A.35: Headline inflation projected to ease at 3.1 percent in 2019 ..................................................................... 26 Figure A.36: Lower commodity prices are projected to lead to a wider budget deficit in 2019 ................................... 26 Figure A.37: Total revenues in the Budget 2020 is targeted to grow double digits, higher than the historical average
................................................................................................................................................................................ 29 Figure A.38: More priorities on capital and social spending while less spending on subsidies in 2020 ...................... 30 Figure A.38: In countries where data is available, reduction in plastic consumption is positively correlated with level
of levies/tax ............................................................................................................................................................. 31 Figure B.1: Age Structure of Population over time ...................................................................................................... 34 Figure B.2: Number, Type, and Damage from Disasters (1996–2017) ........................................................................ 36 Figure B.3: “De jure” value of social assistance benefits for households with children, 2019 ..................................... 39 Figure B.4: The de jure value of social assistance benefits for the poorest 40% of households without children
receiving two of the main programs, 2019 .............................................................................................................. 39 Figure B.5: Value of benefits and coverage of main Social Assistance programs 2019 ............................................... 40 Figure B.6: Total pension coverage among people aged 65+ by decile, 2018 .............................................................. 41 Figure B.7: Social assistance spending as a share of GDP (%) – selected countries .................................................... 41

Figure B.8: Withdrawals have risen sharply since Regulation 60 was issued in 2015 .................................................. 43 Figure B.9: Cross country pension coverage rates and income level ........................................................................... 43 Figure B.10: Vision 2025 .............................................................................................................................................. 45 Figure B.11: Vision 2045 .............................................................................................................................................. 46 Figure B.12: Estimated total cost of pension expansion and reform ........................................................................... 52 Figure B.13: Spending on energy subsidies has been partially redirected towards social assistance… ...................... 54 Figure B.14: …but remains substantial at 1.0 percent of GDP .................................................................................... 54 Figure B.15: Government tax expenditures through VAT exemptions are enjoyed more by the middle and upper
class ........................................................................................................................................................................ 55
TABLES Table ES.1: Real GDP growth is projected to recover to 5.1 percent in 2020 with recovering investment growth while
the external sector remains weak ............................................................................................................................. 2 Table A.1: Indonesia’s Balance of Payments (BOP) .................................................................................................... 14 Table A.2: The wholesale and retail trade, accommodation and food and beverage, and manufacturing industries
accounted for 96 percent of job creation in the year to August 2019 ...................................................................... 20 Table A.3: The fall in inequality at the national level was driven by increases in the consumption shares of the
Bottom and Middle 40 percent ............................................................................................................................... 23 Table A.4: Key economic indicators ............................................................................................................................ 24 Table A.5: …as prices for all its major commodities, except rubber, are expected to continue to ease...................... 25 Table A.6: World Bank Fiscal Budget Projections ...................................................................................................... 28 Table A.7: Results from statistical analyses indicate that there were no detectable changes in employment resulting
from the plastic bag charge levied in 27 cities in Indonesia in 2016 ....................................................................... 32 Table B.1: Main Social Assistance Programs in Indonesia ......................................................................................... 38 Table B.2: Main Social Insurance Programs ............................................................................................................... 42 Table B.3: Cumulative estimated impacts of social assistance reforms ...................................................................... 48 Table B.4: Cost of expanding Social Protection coverage as percent of GDP under various options .......................... 51 Table B.6: Projected annual impact of reforms ........................................................................................................... 55 Table B.6: Average change in regulated minimum retail prices and excise tariff levels of tobacco products............. 56 Table B.7: Average minimum regulated retail prices, excise tariffs, and excise tax burdens ..................................... 57
APPENDIX TABLES
Appendix Table 1: Budget outcomes .......................................................................................................................... 65 Appendix Table 2: Balance of payments ..................................................................................................................... 65 Appendix Table 3: Indonesia’s historical macroeconomic indicators at a glance ...................................................... 66 Appendix Table 4: Indonesia’s development indicators at a glance (USD billion) ..................................................... 67
BOXES
Box A.1: An economic analysis of the 2019 forest and land fires and haze1 .................................................................. 7 Box A.2: Commodity prices continued declining in Q3 ............................................................................................... 15 Box A.3: State Budget 2020 – Government sets optimistic growth targets for revenue and expenditure amidst global
slowdown ................................................................................................................................................................ 29 Box A.4: Reducing plastic bag pollution in Indonesia ................................................................................................. 31 Box B.1: Recommendations for JKN sustainability .................................................................................................... 50 Box B.2: Higher tobacco taxation in Indonesia .......................................................................................................... 56

I n v e s t i n g i n P e o p l e I n d o n e s i a E c o n o m i c Q u a r t e r l y
D e c e m b e r 2 0 1 9 T H E W O R L D B A N K | B A N K D U N I A
1
Executive Summary: Investing in People Amid challenging global economic conditions and a substantial deterioration of its terms-of-trade (ToT), Indonesia’s economic growth decelerated to 5.0 percent in the third quarter of 2019, from 5.1 percent in Q2 (Figure ES.1). Domestic drivers of growth slowed. Fixed investment growth weakened further in Q3 given the significant decline in commodity prices, and as political uncertainty lingered prior to the announcement of the new cabinet (Figure ES.2). Total consumption also slowed, with Government consumption decelerating markedly. This weakness in domestic demand was mirrored by a large contraction of import volumes, which together with flat exports meant that net exports made a large contribution to growth.
On the production side, growth in the mining, manufacturing and financial sectors accelerated. In contrast, growth in the agriculture sector declined in part because of the adverse weather conditions associated with dry conditions due to El Nino.
The negative ToT shock led to a smaller improvement in the current account compared to the contribution from net exports to GDP growth. The current account deficit narrowed to 2.9 percent of GDP for the four quarters through Q3 2019 from 3.1 percent in Q1 and Q2 (Figure ES.3). The goods trade surplus improved, driven by a sharp fall in oil imports, partly attributed to lower oil prices and the Government policy of expanding domestic capacity to produce biofuel. The narrower income deficit was due to seasonal patterns of lower dividend payments and service interest payments on external debt.
With easier global monetary policy nudging capital flows to emerging markets with good fundamentals, including Indonesia, portfolio inflows rose in Q3, contributing to a wider surplus in the financial account. Despite the narrower CAD and a larger financial account surplus, the balance of payments remained in deficit in Q3. International reserves rose nevertheless to USD 124.3 billion at the end of September, sufficient to finance 6.9 months of imports and government external debt service. Capital inflows also supported the Rupiah, while bond yields fell (Figure ES.4). Inflation remained stable. El Nino conditions led to higher food prices, which accelerated to 5.4 percent yoy in Q3 2019 from 3.8 percent in the previous quarter.
However, slower inflation in domestic energy prices meant that headline consumer price inflation remained relatively muted and close to the midpoint of Bank Indonesia (BI)’s inflation target range (Figure ES.5). Global monetary easing and strong capital inflows increased interest rate differentials between Indonesia and advanced economies. This, in addition to muted inflation, created space for BI to cut the policy rate by a cumulative 100 bps from July to October. Lower commodity prices and contracting imports have taken a toll on total revenue collection, and the Government is likely to exceed its budget deficit target of 1.8 percent of GDP for 2019. After reaching an eleven-year high of 23.0 percent yoy last year, total Government revenue collection growth posted a modest gain of 1.7 percent year-to-October this year (Figure ES.6). Contracting capital and subsidy spending contributed to slower expenditure growth through October, but the Government expects to accelerate spending in the last two months of the year. The fiscal deficit is estimated to reach 2.1 percent of GDP in 2019, still well within Indonesia’s conservative ceiling of 3.0 percent. Labor market indicators sent mixed signals. On the one hand, Indonesia’s economy created 2.5 million new jobs, taking the employment rate to 63.9 percent in August 2019, up from 63.6 percent in August 2018. The labor force participation also rose to a four-year high of 67.4 percent. On the other hand, nominal wage growth was muted, coming in at 3.0 percent yoy, implying a decline in real wages. Consistent with sustained economic growth, strong job creation, subdued inflation and the recent expansion in social assistance programs, Indonesia’s poverty rate reached another record low of 9.4 percent in March 2019 from 9.8 percent in March 2018. Predicated on the gradual tapering of international trade tensions and reduced domestic political uncertainty, real GDP growth is projected to improve gradually from next year. Indonesia’s economic growth is expected to come in at 5.0 percent in 2019 from the five-year high of 5.2 percent in 2018, picking up to 5.1 percent in 2020 (Table ES.1).

T i t l e I n d o n e s i a E c o n o m i c Q u a r t e r l y
D e c e m b e r 2 0 1 8 T H E W O R L D B A N K | B A N K D U N I A
2
Table ES.1: Real GDP growth is projected to recover to 5.1 percent in 2020 with recovering investment growth while the external sector remains weak
2018 2019f 2020f
Real GDP (Annual percent change) 5.2 5.0 5.1
Consumer price index
(Annual percent change) 3.2 3.1 3.5
Current account balance
(Percent of GDP) -2.9 -2.7 -2.6
Government budget balance
(Percent of GDP) -1.8 -2.1 -2.1
Source: Bank Indonesia; Central Bureau of Statistics; Ministry of Finance; World Bank staff calculations Note: 2018 actual outcome; f stands for World Bank forecast
With gradually easing international trade tensions, reduced political uncertainty on the formation of the new cabinet, lower borrowing costs, and improved business sentiment due to the proposed economic reforms, fixed investment growth is expected to accelerate next year, albeit remaining lower than last year’s five-year high. With investments and wages recovering, private consumption growth is projected to be broadly stable, though easing modestly in 2020 on account of the higher inflation with the removal of electricity tariff subsidies for a substantial number of households and the waning impact of the high base effect associated with the elections in 2019. Growth of government consumption is also expected to be relatively conservative given tepid revenue receipts in light of weak commodity prices and lackluster imports, despite ongoing tax reforms. Amid global policy uncertainty and the weak recovery in global trade and economic growth, Indonesia’s export growth is forecast to be muted. Imports are also projected to be weak with the current contraction easing gradually in light of the recovery in investment growth. The current account deficit is expected to narrow in the near term from 2.7 percent of GDP in 2019 to 2.6 percent of GDP in 2020. Downside risks to the growth outlook continue to be severe, with protracted trade tensions posing additional risks to commodity prices, international trade flows, global business sentiment and investment growth, and China’s growth outlook. Further escalation of trade tensions is likely to further weigh on regional growth
and commodity prices, and therefore on Government revenues, the current account balance through weaker export receipts, and economic growth. Investing in people Looking beyond 2020, the Government’s vision for Indonesia is to achieve high income status and reduce poverty to near zero. To realize this vision, Indonesia will require a modern, inclusive and efficient social protection (SP) system. In a context characterized by demographic changes and ageing, technological advancements, shifts in where and how people work and persistent vulnerability to disasters, SP systems need to evolve. They also play a key role in building, employing, and protecting Indonesia’s human capital. This edition discusses which elements such a “future-ready” social protection system should include to provide adequate protection and facilitate sustained economic growth that is more widely shared and equitable. Current social protection programs form a solid base on which Indonesia can build a system that addresses the risks and challenges that the future is likely to bring. Emerging demographic, technological and environmental trends will require rethinking the social contract to ensure that it can promote prosperity for all and enable Indonesia to achieve the poverty reduction, human capital, and inclusive growth targets that it has set out for 2045. The future social protection system should be accessible to all Indonesians regardless of where and how they make a living, and should extend protection to the large and growing share of elderly poor and people with disabilities. To achieve this, the Government could consider a system that provides a minimum level of protection through all stages of a person’s natural life. This guaranteed minimum can be achieved with a combination of social assistance programs, most already in existence. The guaranteed minimum can then be complemented with a coherent set of social insurance programs that protect family incomes when earners reach old age, find themselves ill or without a job.

I n v e s t i n g i n P e o p l e I n d o n e s i a E c o n o m i c Q u a r t e r l y
D e c e m b e r 2 0 1 9 T H E W O R L D B A N K | B A N K D U N I A
3
Figure ES.1: GDP growth remained remarkably stable (contribution to growth yoy, percentage points)
Figure ES.2: Investment growth slowed amid lingering uncertainty (contributions to growth yoy, percentage points)
Source: Central Bureau of Statistics (BPS); World Bank staff calculations Source: BPS; World Bank staff calculations
Figure ES.3: A wide goods trade surplus led to a small reduction in the current account deficit (USD billion)
Figure ES.4: The Rupiah continued to strengthen against the U.S. Dollar (index, Jan 1, 2018 = 100)
Source: Bank Indonesia (BI), World Bank staff calculations Source: Bank Indonesia, JP Morgan, Institute of International Finance,
and World Bank staff calculations
Figure ES.5: Food prices spiked in Q2, but lower administered prices kept headline inflation stable (change yoy, percent)
Figure ES.6: Revenue collections slowed amid lower commodity prices and shrinking imports (January–Oct revenue contribution to growth, yoy, percentage points)
Source: BPS; World Bank staff calculations Source: Source: Ministry of Finance; World Bank staff calculations
-2
0
2
4
6
8
Sep-17 Mar-18 Sep-18 Mar-19 Sep-19
Change in inventories Stat. discrepancyNet exports InvestmentGovernment consumption Private consumptionGDP
-1012345678
Sep-17 Mar-18 Sep-18 Mar-19 Sep-19
Buildings & Structures Machine & Equipment Vehicles Other Equipments Cultivated Bio. Res. Intellectual PropertyInvestment
-15
-10
-5
0
5
10
Sep-16 Sep-17 Sep-18 Sep-19
Goods ServicesPrimary income Secondary incomeCurrent account
-200
-150
-100
-50
0
50
100
150
200
250
60
70
80
90
100
110
120
Mar-18 Jul-18 Nov-18 Mar-19 Jul-19 Nov-19
USD/IDR
JP Morgan EMCI
Portfolio flows (RHS)
0
1
2
3
4
5
6
7
8
Jan-18 Apr-18 Jul-18 Oct-18 Jan-19 Apr-19 Jul-19 Oct-19
Administered Volatile
Core
Headline10.8
-9.7-0.6
10.4
23.0
1.7
-15-10-505
10152025
2014 2015 2016-TA 2017-TA 2018* 2019
O&G related revenues Income taxes N-O&GVAT/LGST ExcisesInternational trade taxes OtherTotal revenues

I n v e s t i n g i n P e o p l e I n d o n e s i a E c o n o m i c Q u a r t e r l y
D e c e m b e r 2 0 1 9 T H E W O R L D B A N K | B A N K D U N I A
4
A. Economic and Fiscal Update
1. Economic growth eased in Q3 as domestic demand weakened
Indonesia’s real GDP grew at 5.0 percent with slower domestic demand being cushioned by recovering exports
Indonesia’s real GDP growth eased modestly to 5.0 percent yoy in Q3 2019, in line with consensus forecasts, from 5.1 percent in Q2 (Figure A.1). The contribution of domestic demand to GDP declined with slower consumption, especially by the Government. Fixed investment growth also softened in Q3. The weakness in domestic demand was mirrored by a large contraction of import volumes, which together with flat exports meant that net exports made a larger contribution to growth. On the production side, the mining, manufacturing and financial sectors1 reported faster growth, while agriculture and other service sectors2 grew considerably slower.
Figure A.1: GDP growth slowed in Q3 in line with continued external headwinds (contribution to growth yoy, percentage points)
Source: BPS; World Bank staff calculations
1 Including banking, insurance, investment, tax and accounting services. 2 Including services for government administration, defense, social insurance administration, health and education.
-2
0
2
4
6
8
Sep-17 Mar-18 Sep-18 Mar-19 Sep-19
Change in inventories Stat. discrepancyNet exports InvestmentGovernment consumption Private consumptionGDP

I n v e s t i n g i n P e o p l e I n d o n e s i a E c o n o m i c Q u a r t e r l y
D e c e m b e r 2 0 1 9 T H E W O R L D B A N K | B A N K D U N I A
5
On the production side, growth was driven mainly by the manufacturing sector
In gross value-added terms, growth also edged down from 5.0 percent in Q2 to 4.9 percent in Q3 (Figure A.2). Most service sectors saw stronger growth compared to Q2.3 After contracting for the first time in 9 quarters in Q2, the mining sector saw a recovery and booked positive growth, partly driven by the front loading of nickel mining activities ahead of the nickel export ban that comes into effect in January 2020. The manufacturing sector, driven partly by higher demand for Indonesian furniture products from abroad,4 also recorded an uptick in activity5. In contrast, growth in the agriculture sector eased sharply to 3.1 percent, partly due to the adverse effects of the El Nino drought season6. Similarly, in line with the deceleration in investment activity, particularly in building and structures, the construction sector growth slowed modestly.
Figure A.2: Faster growth in the manufacturing sector offset the moderation in the agriculture sector (contributions to growth yoy, percentage points)
Source: CEIC; World Bank staff calculations Note: Gross Valued Added is derived as the sum of the value added in the agriculture, industry and services sectors. If the value added of these sectors is calculated at purchaser values, gross value added is derived by subtracting net indirect taxes from GDP.
Total consumption growth eased as the fillip provided by Q2’s festive and election-related spending dissipated
Total consumption slowed substantially from an increase of 5.7 percent in Q2 to 4.6 percent as both private and government consumption slowed. After reaching a 5-year high in Q2, private consumption growth moderated to 5.1 percent, on par with its 3-year average. Household consumption growth pulled back to 5.0 percent from 5.2 percent in Q2 (Figure A.3), as the boost from the Muslim festive season and electoral cycle dissipated and consumption activities were curtailed by the forest fires (Box A.1). Albeit less than half of the 15.3 percent increase in Q2, spending by political parties still grew to 7.4 percent in Q3, as large political parties hosted conventions. Real government consumption growth slowed to 1.0 percent from the nearly 5-year high of 8.3 percent in Q2. After significant spending for personnel and security during the Idul Fitri holidays and the general election7 in Q2, nominal personnel spending grew only 0.6 percent yoy in Q3 after surging 21.7 percent in Q2. At the same time, monthly indicators associated private consumption point to a mixed picture. Growth of motorcycle sales and retail sales corroborate with some slowing in private consumption over Q3, but are signaling a recovery after bottoming out earlier in the year (Figure A.4). Meanwhile, consumer confidence continues to ease.
3 Service sectors include utilities, trade and hotel, transport and communication and financial sectors. 4 Bisnis (September 30, 2019). 5 RR.com (November 5, 2019). According to BOP data, furniture export values rose 5.1 percent in Q3, higher than the 2.9 percent increase in Q2. 6 Swarna news (November 6, 2019). 7 This includes the disbursement of IDR 40 trillion for Idul Fitri allowances for government employees and bonuses in the form of the 13-month salaries.
-1
0
1
2
3
4
5
6
Sep-16 Sep-17 Sep-18 Sep-19
Other services Financial servicesTransport & communication Trade, hotels & restaurantsConstruction Electricity, gas & waterManufacturing Mining & quarryingAgriculture Gross Value Added*

I n v e s t i n g i n P e o p l e I n d o n e s i a E c o n o m i c Q u a r t e r l y
D e c e m b e r 2 0 1 9 T H E W O R L D B A N K | B A N K D U N I A
6
Figure A.3: Private consumption growth eased (contribution to growth yoy, percentage points)
Figure A.4: High frequency indicators for private consumption point to a mixed picture (retail sales: yoy, percent; Motorcycle sales: 3mma yoy, percent, LHS; consumer confidence index; RHS)
Source: CEIC; World Bank staff calculations Source: BPS; World Bank staff calculations
Fixed investment recorded sluggish growth in Q3
Gross fixed capital formation (GFCF) slowed to 4.2 percent yoy in Q3 from 5.0 percent in Q2 (Figure A.5). The latest outturn was in line with slower investment growth, lower commodity prices, a maturing mining investment cycle, lingering external and domestic uncertainty prior to the announcement of the new cabinet, and weak public investment8. Growth of investment on building and structures (75 percent of total GFCF) remained robust at 5.0 percent, but slower than the 5.5 percent in Q2. Partly because of the tailing-off of capex cycles in the mining and infrastructure sectors and continued declines in the prices of the country’s key commodity exports, growth of investment in machinery, equipment and vehicles slowed.
Figure A.5: Investment growth slowed considerably as political uncertainty lingered (contribution to growth yoy, percentage points)
Source: BPS; World Bank staff calculations
Exports recovered while imports continued contracting in Q3, supporting overall growth
Despite slowing global trade, export volumes were flat after shrinking 2.0 percent in Q2, as oil and gas (O&G) exports declined less than in Q2, while non-O&G exports continued to post modest growth (Figure A.6). Meanwhile, import volumes contracted for the third consecutive quarter, declining 8.6 percent after falling 6.8 percent in Q2, in line with slowing investment (Figure A.7). O&G imports fell as the Government continued with a series of policies to manage imports9. Consumption good imports have also been declining in line with the governmental
8 Nominal government capital expenditures contracted 6.1 percent year-to-October, compared to an increase of 1.3 percent seen in 2018 over the same period. See Section A6. 9 After mandating the use of B20 in September 2018, the Government has initiated policies of encouraging the use of B30, conversion of diesel power plants to palm oil-based power, as well as feeding refineries with palm oil to produce diesel fuel. In addition, the Government issued a mandate for oil and gas contractors to offer their share of crude oil production for domestic consumption rather than for export. See Box A2 in World Bank (2019b).
0
2
4
6
Sep-17 Mar-18 Sep-18 Mar-19 Sep-19
Non-Profit Institutions Others Restaurant & Hotel Transportation & Comm Health & Education Equipments App, Footwear & Maintenance F&B, Other than RestaurantPrivate Consumption
100
110
120
130
-10
-5
0
5
10
15
20
Oct-18 Jan-19 Apr-19 Jul-19 Oct-19
Consumer Confidence Index
Retail Sales Index
Motorcycle sales
-1012345678
Sep-17 Mar-18 Sep-18 Mar-19 Sep-19
Buildings & Structures Machine & Equipment Vehicles Other Equipments Cultivated Bio. Res. Intellectual PropertyInvestment

I n v e s t i n g i n P e o p l e I n d o n e s i a E c o n o m i c Q u a r t e r l y
D e c e m b e r 2 0 1 9 T H E W O R L D B A N K | B A N K D U N I A
7
policies to reduce imports of selected consumer goods. In line with slowing investment in machine, equipment and vehicles, nominal capital goods imports fell 1.9 percent in Q3. Net exports thus contributed to overall economic growth for the third consecutive quarter.
Figure A.6: After shrinking for two consecutive quarters, exports stopped contracting… (contribution to growth yoy, percentage points)
Figure A.7: … while imports continued to contract (contribution to growth yoy, percentage points)
Source: BPS; World Bank staff calculations Source: BPS; World Bank staff calculations
Box A.1: An economic analysis of the 2019 forest and land fires and haze1
2019 recorded the most extensive manmade forest and land fires in Indonesia since the 2015 fire crisis (Figure A.8), which released a thick haze and blanketed at least eight provinces2 and hampered economic activities both domestically and abroad. As of September 2019, over 900,000 people had reported respiratory health diseases,3 12 national airports had halted operations, and hundreds of schools in Indonesia, Malaysia, and Singapore had to temporarily close. Overall, the total damage and economic loss in eight affected provinces throughout June-October 20194 is estimated at USD 5.2 billion, equivalent to 0.5 percent of GDP,5 mainly through the agriculture, transportation, trade, industry, and environmental sectors. Unlike wildfires in the boreal forests of North America, fires in Indonesia’s rainforests and lands are manmade and have become a chronic problem annually since 1997. Fires are considered the cheapest option among all methods to prepare lands for cultivation, or to claim lands in areas with disputes, where landownership is uncertain and where enforcement is weak.6 Without measures to contain burning, fires can spread uncontrollably and are worsened by dry weather. In total, 44 percent of the areas burned this year were located in peatlands, where, unlike mineral soil, fires are harder to suppress once started and release thick haze and carbon emissions into the atmosphere. Peatland composition accounts for the fact that the carbon emissions from 2019 forest and land fires in Indonesia are estimated to be almost double the emissions from the fires in the Brazilian Amazon this year.7 Official estimates suggest that 620,201 hectares8 of forest and land burned in eight affected provinces between January–September 2019, more than 9 times the size of DKI Jakarta. This figure is more than double the average of areas burned throughout 2016-2018 (Figure A.8) and would likely to have increased throughout October and November. The spike in forest and land fires this year can be attributed to the prolonged dry season due to climate phenomena such as the El Niño, which causes reduced rainfall roughly every four years9, as well as a phase in the Indian Ocean
Figure A.8: Forest and land fires reached a new record since 2015 this year, partly due to dry season (total annual burned areas, million hectares & Ocean Nino Index, indicating likelihood of dry season that year)
Source: Ministry of Environment and Forestry, 2019 & NOAA Climate.gov, 2019
-10
-5
0
5
10
15
20
Sep-17 Mar-18 Sep-18 Mar-19 Sep-19
ServicesGoods: Oil & GasGoods: Non-Oil & GasExport of Goods and Services
-10
-5
0
5
10
15
20
Sep-17 Mar-18 Sep-18 Mar-19 Sep-19
ServicesGoods: Oil & GasGoods: Non-Oil & GasImport of Goods and Services
-1.5-1-0.500.511.522.53
0
0.4
0.8
1.2
1.6
2
2.4
2.8
2015(Dec)
2016(Dec)
2017(Dec)
2018(Dec)
2019(Sept)
Total burned areas2016-2018 Average Burned AreaOceanic Nino Index (RHS)

I n v e s t i n g i n P e o p l e I n d o n e s i a E c o n o m i c Q u a r t e r l y
D e c e m b e r 2 0 1 9 T H E W O R L D B A N K | B A N K D U N I A
8
Dipole which leads to higher sea-surface temperatures, which also occurred during the 2015 fire crisis. The largest share of the burned areas was in Central, South, and West Kalimantan provinces, where almost 390,000 ha of areas burned.
The forest and land fires, as well as the resulting haze, led to significant negative economic impacts,10 estimated at USD 157 million in direct damage to assets and USD 5.0 billion in losses from affected economic activities (Figure A.9).11 This figure is estimated from, among others, the infrastructure, agriculture, industry, trade, tourism, transportation, and environmental sectors. Combined, the agriculture and environmental sectors make up over half of the estimated loss, because fires damaged valuable estate crops and released significant greenhouse gas emissions to the atmosphere. Furthermore, the negative impacts of forest and land fires are predicted to have consequences beyond this quarter, because production of affected commodities such as perennial crops and timber require at least 2-5 years to harvest. Hence, the economic growth in 2019 and 2020 is predicted to be lower by 0.09 and 0.05 percentage points, respectively.
However, the above loss estimate does not include the longer-term effects of repeated exposure to haze on human capital, such as acute respiratory illnesses and reduced quality of education due to affected health of teachers and students, and trade relations particularly for the palm oil sector, which provides direct and indirect jobs for at least 16.2 million Indonesians12. Recurring fires and haze also further exacerbate the negative global perception toward Indonesia’s palm oil production13 that had led to declining demand from European countries, as well as the European Union’s (EU) plan to phase out palm-oil based biofuel by 2030. This year’s spike in fire activities are unlikely to help Indonesia’s bilateral negotiations with the EU through the World Trade Organization. Figure A.9: Agricultural, transportation, trade, and industry recorded the highest economic losses from forest fires (USD million, excluding losses from carbon emissions)
Figure A.10: Central Kalimantan and South Kalimantan are the most affected provinces relative to size of their economy
Source: World Bank staff analysis, 2019 Source: World Bank staff analysis, 2019 The negative economic impacts from fires and haze are even more severe at the provincial level.14 Based on early assessments, regional GDP growth in affected provinces may decline in the range of 0.3 to 1.5 percentage points in 2019, depending on the economic size and the local magnitude of fires. Beyond this year, some longer-term effects are likely to linger in the form of reduced consumption and lowered investment levels. Among affected provinces, Central Kalimantan and West Kalimantan suffered the most, with losses estimated at 7.9 percent and 6.1 percent of their respective regional GDPs (Figure A.10). As the affected eight provinces’ regional GDP make up roughly 18 percent of national GDP, the reduced regional GDP growth due to forest fires this year would likely weigh on the national GDP growth.
Since 2015, the Government of Indonesia (GoI) had devised several policies aimed at reducing forest and land fires, such as the moratorium policy to stop primary forests and peatland conversions, tenurial reforms to address underlying land conflict and boundary uncertainties, and restoration target of 2.5 million hectares of damaged peatlands. Since then, there was a 40-60 percent drop in the deforestation rate in 2017-2018, as well as a decline in areas burned from 2016 to 2017.15 However, these positive outcomes could not be fully attributed to the implementation of GoI’s policies because climate dynamics also affected the spread of fires.
0
200
400
600
800
1,000Damage Losses
200
400
600
800
1,000
0%
2%
4%
6%
8%
10%
Damage and Loss in USD million (RHS)
Damage and Loss, percentage RGDP

I n v e s t i n g i n P e o p l e I n d o n e s i a E c o n o m i c Q u a r t e r l y
D e c e m b e r 2 0 1 9 T H E W O R L D B A N K | B A N K D U N I A
9
Meanwhile, spatial analyses on the fire patterns have indicated that the effectiveness of these policies could be further improved, even after taking into account changes in climate condition. For example, over 270,000 ha burned inside areas under the moratorium policy. Similarly, over 320,000 ha burned in and around peatland restoration priority areas, although further studies are required to better understand the counterfactuals. Fires also continue to take place in villages already identified as fire-prone by the GoI in 2015, as well as 400 new villages. Finally, less than 3 percent of the indicative map for GoI’s land redistribution program (Tanah Obyek Reforma Agraria or TORA) covers areas affected by the fires this year, which signals a potential mismatch in addressing the underlying land tenure issues linked to fires. Furthermore, preliminary assessments by authorities at the local level highlighted the combination of intensified enforcement and lack of alternative land clearing methods as causes of increased fires. Fire perpetrators who were deterred to from burning during the day began starting fires at night to avoid detection and left the sites without taking any effort to contain the fires, resulting in the fires spreading. This indicates that fragmented solutions could lead to worse outcomes. The continued challenges with manmade fires and the haze disaster over the past two decades not only endanger human well-being and the sustainability of natural resources, but also erode the branding and value of palm oil, one of Indonesia’s primary export commodities. Therefore, investing in transforming the economy toward a low-haze regime should be the priority of the GoI over the next five years. Policies to be considered include:
(1) A strong fire prevention policy and program through a deepening of the implementation of the current moratorium, restoration, and land tenure settlement policies;
(2) Focusing tenurial settlement and restoration programs to the 700-1,200 fire-prone villages, with specific interventions determined based on mapping of fire behavior and risk;
(3) Providing land-dependent communities with the appropriate tenurial status to allow relevant public extension services to assist them in practicing controlled burning and other low haze alternatives;
(4) Strict enforcement and market disincentives for commercial land users who deliberately use fires to usurp public lands or clear their concession estates;
(5) Revitalization of overly drained peatlands through improved drainage system that can serve as water storage; (6) Transitioning livelihoods in affected communities, especially in peatland areas, towards a water-based local
economy such as aquaculture and natural asset-based services such as ecotourism; (7) Improving sustainable commodity certification schemes as an instrument to signal to the market about these ongoing
reforms toward a low-haze and low-carbon trajectory. 1 Analysis of 2014 Riau and 2015 Indonesia forest fires impact also available in World Bank (2014) and World Bank (2015). 2 Fire-prone provinces include Riau, Jambi, South Sumatra, Central Kalimantan, East Kalimantan, South Kalimantan and West Kalimantan 3 BNPB (2019) via CNN Indonesia. https://www.cnnindonesia.com/nasional/20190923160933-20-433052/penderita-ispa-akibat-karhutla-tembus-919-ribu-orang. More than 60 percent are in Riau and South Sumatra. 4 The Damage and Loss Assessment estimate includes areas burned until November 3, 2019 for South Sumatera and until end of September for the other seven provinces, calculated based on remote sensing data. 2019 GDP is estimated based on historical data. 5 Based on estimated 2019 GDP. 6 World Bank (2015). 7 The Copernicus Atmosphere Monitoring Service (CAMS) estimated that Indonesia’s forest and land fires emit at least 708 mtCO2e, almost double the estimation of emissions from the Brazilian Amazon fires of 366 mtCO2e. Nicholas, Hans, “Indonesia fires emitted double the carbon of Amazon fires, research shows”, Mongabay, November 25, 2019 8 Official data from Ministry of Environment and Forestry (2019). 9 Although the El Niño this year was moderate compared to 2015. 10 The analysis uses a disaster assessment methodology developed by the UN Economic Commission for Latin America and the Caribbean (ECLAC). The amount of financing needed for reconstruction and rehabilitation is a proxy for damage, while the losses represent the reduction in economic activities and income that arise in the following months or years as the result of the disaster. Please see ECLAC (2014) for further details. 11 Damage is defined as the destruction of physical assets during the disaster event (measured in physical units and valued at replacement cost). Loss is defined as changes in economic flows that occur after the natural event, and over a relatively longer time period (valued at current prices). 12 GAPKI (2019). 13 Palm oil amounted to USD 16.5 billion of exports and contributed to 10.3 percent of total non-O&G exports in 2018. 14 Covered burned areas in provinces of Riau, Jambi, South Sumatra, Central Kalimantan, East Kalimantan, South Kalimantan, and West Kalimantan. 15 WRI, 2018 (Global Forest Watch dataset, https://www.wri.org/blog/2018/08/indonesias-deforestation-dropped-60-percent-2017-theres-more-do)

I n v e s t i n g i n P e o p l e I n d o n e s i a E c o n o m i c Q u a r t e r l y
D e c e m b e r 2 0 1 9 T H E W O R L D B A N K | B A N K D U N I A
10
2. The current account deficit narrowed while the capital and financial account surplus widened
Goods exports continued to shrink, partly due to lower commodity prices and domestic factors
The goods trade surplus increased significantly to USD 1.3 billion from USD 0.5 billion in Q2. In line with the moderation in global trade,10 lower commodity prices, and domestic factors, Indonesia’s goods exports values shrank further by 8.5 percent yoy in Q3 after falling 8.1 percent in Q2 (Figure A.11)11. The contraction of goods exports values was broad-based, mainly due to the subdued prices of Indonesia’s key export commodities,12 which fell 22.5 percent in Q313 (Box A.2). Lower export values of O&G, coal, processed commodities14, and textile, clothing and footwear were partially offset by higher export values of motor vehicles, computers, furniture, and gold articles15.
Figure A.11: Goods exports continued to deteriorate… (contribution to growth yoy, percentage points)
Source: Bank Indonesia; World Bank staff calculations
Oil products and palm oil exports suffered partly due to domestic factors
The export volume of almost all Indonesia’s key commodities contracted in Q3 compared to Q2, due to a combination of weaker global demand and domestic factors. Among energy commodities, the volumes of O&G exports contracted 39.5 percent in Q3 slightly less than the 44.6 percent contraction in Q2, as a combined result of several factors: the depleting gas fields and the lack of new upstream projects, the transition of operatorship of key blocks to Pertamina, the prioritization of the use of crude oil for domestic demand16, and weaker global demand. Despite tighter emission standards in Europe and China, coal exports expanded 4.0 percent in Q3, slower than the 10.9 percent increase in Q2, partly supported by demand from India for its rapid electrification program.17
Exports of rubber and palm oil contracted while exports of metals were rosy partly due
For non-energy commodities, rubber export volumes remained in contraction territory, partly due to the export cutting policy declared by the world’s top natural rubber producers at the end of the first quarter, in an effort to prop up the prices of the commodity.18 Similarly, volumes of exported palm oil contracted 3.0 percent, driven by headwinds from the European Union’s
10 Global trade activity has remained subdued in Q3 including in East Asia and Pacific countries (East Asia and Pacific Economic Update, October 2019) with exports and imports growth declining across most large economies. 11 This corroborates with total exports in national accounts which contracted 9.1 percent in Q3 after falling 5.4 percent in Q2. 12 Prices of Indonesia’s main commodity exports, which include coal, crude oil, palm oil, rubber, and base. See Box A.2. 13 Computed using export value and volume data from BPS. 14 Processed commodities category includes wood, palm oil, base metals, and rubber. The ‘other manufacturing’ category includes paper, paper materials, furniture, plastics, processed foods, chemicals, and other goods. 15 Laporan Neraca Pembayaran Indonesia Q3 2019 16 See Box A.2 of World Bank (2019b). 17 Quartz India (September 2019). 18 The International Tripartite Rubber Council (ITRC), which comprises of Thailand, Indonesia, and Malaysia, agreed in March to implement curbs of around 240,000 tons of rubber exports over four months in a bid to prop up rubber prices, see Reuters (August 19, 2019). This policy seemed to have achieved its expected objective as price of natural rubber grew by 8.5 percent in Q2 2019.
-30
-20
-10
0
10
20
30
Sep-17 Mar-18 Sep-18 Mar-19 Sep-19
OthersAutomotive & computersTextile, clothing & footwearProcessed commoditiesOther miningCoalOil and gasGoods exports
I n v e s t i n g i n P e o p l e I n d o n e s i a E c o n o m i c Q u a r t e r l y
D e c e m b e r 2 0 1 9 T H E W O R L D B A N K | B A N K D U N I A
11
to strong nickel exports
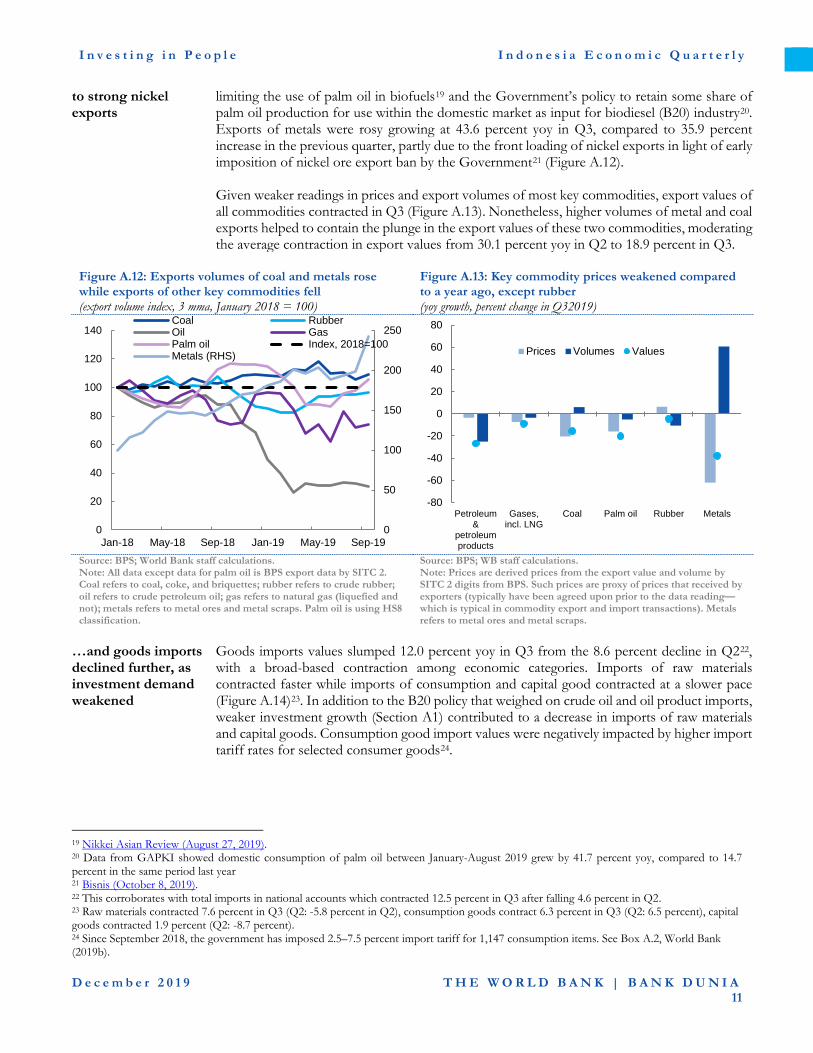
limiting the use of palm oil in biofuels19 and the Government’s policy to retain some share of palm oil production for use within the domestic market as input for biodiesel (B20) industry20. Exports of metals were rosy growing at 43.6 percent yoy in Q3, compared to 35.9 percent increase in the previous quarter, partly due to the front loading of nickel exports in light of early imposition of nickel ore export ban by the Government21 (Figure A.12). Given weaker readings in prices and export volumes of most key commodities, export values of all commodities contracted in Q3 (Figure A.13). Nonetheless, higher volumes of metal and coal exports helped to contain the plunge in the export values of these two commodities, moderating the average contraction in export values from 30.1 percent yoy in Q2 to 18.9 percent in Q3.
Figure A.12: Exports volumes of coal and metals rose while exports of other key commodities fell (export volume index, 3 mma, January 2018 = 100)
Figure A.13: Key commodity prices weakened compared to a year ago, except rubber (yoy growth, percent change in Q32019)
Source: BPS; World Bank staff calculations. Note: All data except data for palm oil is BPS export data by SITC 2. Coal refers to coal, coke, and briquettes; rubber refers to crude rubber; oil refers to crude petroleum oil; gas refers to natural gas (liquefied and not); metals refers to metal ores and metal scraps. Palm oil is using HS8 classification.
Source: BPS; WB staff calculations. Note: Prices are derived prices from the export value and volume by SITC 2 digits from BPS. Such prices are proxy of prices that received by exporters (typically have been agreed upon prior to the data reading—which is typical in commodity export and import transactions). Metals refers to metal ores and metal scraps.
…and goods imports declined further, as investment demand weakened
Goods imports values slumped 12.0 percent yoy in Q3 from the 8.6 percent decline in Q222, with a broad-based contraction among economic categories. Imports of raw materials contracted faster while imports of consumption and capital good contracted at a slower pace (Figure A.14)23. In addition to the B20 policy that weighed on crude oil and oil product imports, weaker investment growth (Section A1) contributed to a decrease in imports of raw materials and capital goods. Consumption good import values were negatively impacted by higher import tariff rates for selected consumer goods24.
19 Nikkei Asian Review (August 27, 2019). 20 Data from GAPKI showed domestic consumption of palm oil between January-August 2019 grew by 41.7 percent yoy, compared to 14.7 percent in the same period last year 21 Bisnis (October 8, 2019). 22 This corroborates with total imports in national accounts which contracted 12.5 percent in Q3 after falling 4.6 percent in Q2. 23 Raw materials contracted 7.6 percent in Q3 (Q2: -5.8 percent in Q2), consumption goods contract 6.3 percent in Q3 (Q2: 6.5 percent), capital goods contracted 1.9 percent (Q2: -8.7 percent). 24 Since September 2018, the government has imposed 2.5–7.5 percent import tariff for 1,147 consumption items. See Box A.2, World Bank (2019b).
0
50
100
150
200
250
0
20
40
60
80
100
120
140
Jan-18 May-18 Sep-18 Jan-19 May-19 Sep-19
Coal RubberOil GasPalm oil Index, 2018=100Metals (RHS)
-80
-60
-40
-20
0
20
40
60
80
Petroleum&
petroleumproducts
Gases,incl. LNG
Coal Palm oil Rubber Metals
Prices Volumes Values

I n v e s t i n g i n P e o p l e I n d o n e s i a E c o n o m i c Q u a r t e r l y
D e c e m b e r 2 0 1 9 T H E W O R L D B A N K | B A N K D U N I A
12
Figure A.14: Goods imports contracted further in all categories. (contribution to growth yoy, percentage points)
Figure A.15: The current account deficit narrowed with a larger good trade surplus (USD billion)
Source: Bank Indonesia; World Bank; World Bank staff calculations Source: Bank Indonesia; World Bank staff calculations The current account deficit narrowed due to a higher goods trade surplus and lower income deficit
The current account deficit shrank to USD 7.7 billion in Q3 from USD 8.2 billion in Q2. This was due to a significantly wider trade goods surplus together with a narrower income deficit which together outweighed a larger services trade deficit (Figure A.15). On a four-quarter rolling sum basis, the current account deficit narrowed to 2.9 percent of GDP in Q3 from 3.1 percent of GDP posted for the first two quarters of the year. The goods trade surplus jumped nearly three-fold to USD 1.3 billion in Q3, partly driven by a sharp fall in oil imports, attributed to the Government policy of expanding oil refinery capacities to produce domestic biofuel and limiting imports of refined fuels25,26. The narrower income deficit was driven by seasonal patterns of lower dividend payments and service interest payments on external debt. In contrast, the services trade deficit widened in Q3 to USD 2.3 billion from USD 1.9 billion in Q2, on the back of a larger deficit in transportation services due to increased import freight service costs and a larger number of Indonesians going abroad27.
The financial account surplus widened on the back of larger portfolio inflows and smaller other investment outflows
The financial account surplus rose to USD 7.6 billion in Q3 from USD 6.5 billion in Q2, driven by a rise in portfolio investments and smaller outflows of other investment, partially offset by weaker net direct investment (Figure A.16). Net direct investment fell from USD 5.4 billion in Q2 to USD 4.8 billion partly supported by inflows for toll road construction from foreign investors. At 1.7 percent of GDP, net direct investment remains insufficient to finance the current account deficit. Meanwhile, other investment saw smaller outflows of USD 2.1 billion in Q3 from USD 3.5 billion in Q2, driven by net inflows in private sector liabilities, specifically from corporate loan drawings.
Portfolio flows rose partly driven by issuance of energy
In line with the global monetary easing nudging capital flows to emerging countries with good fundamentals, including Indonesia, as investors searched for yield, portfolio flows increased to USD 4.8 billion in Q3 from USD 4.6 billion in the previous quarter, largely supported by the
25 The government’s measures to control imports by issued a regulation to increase the income tax rate of imported goods, the Biodiesel 20 policy, and mandate for production sharing contractors to sell crude oil to Pertamina. See Box A.2, World Bank (2019b). 26 See Box A.2, World Bank (2019b). 27 Freight cost increased in Q3 to USD 1.9 billion, up from USD 1.8 billion in Q2, as goods imports increased. In addition, the season for the Haj pilgrimage to Mecca fell in August 2019, during which around 220,000 Indonesians participated.
-30
-20
-10
0
10
20
30
Sep-17 Mar-18 Sep-18 Mar-19 Sep-19
OtherFuelCapitalRaw materials net of fuelConsumer goods net of fuelGoods Imports -12
-9
-6
-3
0
3
6
9
Sep-17 Mar-18 Sep-18 Mar-19 Sep-19
Goods ServicesPrimary income Secondary incomeCurrent account

I n v e s t i n g i n P e o p l e I n d o n e s i a E c o n o m i c Q u a r t e r l y
D e c e m b e r 2 0 1 9 T H E W O R L D B A N K | B A N K D U N I A
13
corporate global bonds
issuance of corporate global bonds in the energy sector28. However, the higher debt inflows were partially offset by equity outflows (Figure A.17).29 While equity outflows continued in October and November, portfolio inflows from government bonds surged in October partly due to positive investor sentiment following President Jokowi’s announcement of the new cabinet.
Figure A.16: Capital and financial account surplus widened, partly driven by large portfolio investment (USD billion)
Figure A.17: …on the back of foreign purchase in government bonds… (USD billion)
Source: Bank Indonesia; World Bank staff calculations Source: Bank Indonesia; World Bank; World Bank staff calculations
Foreign direct investment (FDI) was broadly stable at 2.0 percent of GDP in Q3
FDI was broadly stable at USD 5.7 billion in Q3 compared to USD 5.8 billion in Q2 (Figure A.18). The marginally smaller FDI inflows resulted from smaller investments into mining, quarrying, and financial intermediation. The manufacturing sector remained the main destination for FDI flows30, followed by wholesale and retail trade and agriculture, with the three sectors accounting for 82.2 percent of total FDI flows.
Figure A.18: …with FDI continuing to be moderate (USD billion)
Source: Bank Indonesia; World Bank staff calculations
28 Q3/2019 Indonesia’s Balance of Payments Report, see Bank Indonesia (November 8, 2019). 29 In line with decline in Indonesia’s composite index which was closed at 6,168 at the end of September down from 6,359 at the end of June 2019. 30 Direct investment into manufacturing sector was driven by automotive and electronics activities.
-5
0
5
10
15
20
Sep-17 Mar-18 Sep-18 Mar-19 Sep-19
Other investmentPortfolio investmentDirect investmentCapital and Financial Account
-4
-3
-2
-1
0
1
2
3
4
5
Nov-18 Feb-19 May-19 Aug-19 Nov-19
Gov. global bonds SUNSBI EquitiesMain net portfolio inflows
-5
-3
-1
1
3
5
7
9
Sep-17 Mar-18 Sep-18 Mar-19 Sep-19
Other Financial IntermediationWholesale and retail trade ManufacturingMining and Quarrying Agricultre and forestry

I n v e s t i n g i n P e o p l e I n d o n e s i a E c o n o m i c Q u a r t e r l y
D e c e m b e r 2 0 1 9 T H E W O R L D B A N K | B A N K D U N I A
14
Indonesia’s BOP improved in Q3 2019 as current account deficit narrowed and financial account surplus expanded
With a narrower current account deficit and a wider financial account surplus, the Balance of Payments (BOP) deficit shrank to USD 46 million in Q3 from USD 2.0 billion (Table A.1). Nevertheless, Indonesia’s international reserves increased from USD 123.8 billion at the end of June 2019 to USD 124.3 billion at the end of September 2019, sufficient to finance government external debt repayments and imports for 6.9 months.
Table A.1: Indonesia’s Balance of Payments (BOP) (USD billion unless otherwise indicated)
2018 Q3-2018 Q4-2018 Q1-2019 Q2-2019 Q3-2019 Overall Balance of Payments (7.1) (4.4) 5.4 2.4 (2.0) (0.05) As percent of GDP (0.7) (1.7) 2.1 0.9 (0.7) (0.0) As percent of GDP, four-quarter rolling sum (0.7) (1.1) (0.7) (0.1) 0.1 0.5 Current Account (30.5) (8.5) (9.2) (6.7) (8.2) (7.7) As percent of GDP (2.9) (3.2) (3.6) (2.5) (2.9) (2.7) As percent of GDP, four-quarter rolling sum (2.9) (2.6) (2.9) (3.1) (3.1) (2.9) Goods trade balance (0.4) (0.5) (2.6) 1.2 0.5 1.3 Services trade balance (6.5) (1.8) (1.6) (1.6) (1.9) (2.3) Income (23.6) (6.2) (5.0) (6.3) (6.7) (6.6) Capital and Financial Accounts 24.9 4.0 15.6 10.1 6.5 7.6 As percent of GDP 2.4 1.5 6.1 3.8 2.3 2.7 As percent of GDP, four-quarter rolling sum 2.4 1.6 2.4 3.1 3.4 3.6 Direct Investment 13.3 4.5 1.6 5.8 5.4 4.8 Portfolio Investment 9.3 (0.1) 10.5 5.2 4.6 4.8 Other Investment 2.2 (0.5) 3.6 (1.1) (3.5) (2.1) Source: Bank Indonesia; World Bank staff calculations
With stable capital inflows, the Rupiah appreciated and bonds yields fell
With stronger capital inflows, the Rupiah appreciated in nominal terms against the U.S. Dollar by an average of 0.9 percent in Q3, compared with a 0.9 percent depreciation in Q2. The currency also performed better than other EM currencies, with the JP Morgan’s EMCI depreciating 1.1 percent in Q3. In real effective terms31, the Rupiah has also strengthened the most among regional peers in Q3, appreciating 3.1 percent during Q3, and 5.7 percent year-to-date. In light of increased investor appetite, government bond (Surat Utang Negara, SUN) yields across all tenures have also continued to fall in Q3, after briefly rising in May on account of the heightened uncertainty surrounding U.S.-China trade tensions.
Bank Indonesia embarked on an easing cycle to support investment and growth
Stable capital inflows and benign inflation (Section A.3) have provided the necessary space for BI to embark on an easing cycle. Consequently, BI lowered the 7-Day Reverse Repo Rate by a cumulative 100 basis points in four consecutive board meetings, from 6.00 percent in June to 5.00 percent in October, to support growth.32 The rate cuts are intended to spur domestic economic activity in light of the global slowdown.33
31 Real effective exchange rates are based on trade weighted averages of bilateral exchanges rates and adjusted by consumer prices. 32 BI eased the policy rate in July, August, September, and October by 25 bps each, to reach 5.00 percent in October, then held in November. 33 Despite the cumulative one percentage point cut, average lending rates have remained broadly stable. The lending rates considered are for consumption, working capital, and investment loans. Working capital loans are short-term credits given to finance the working capital needs of a debtor, e.g., property or agribusiness loans; investment loans are medium- to long-term credits to purchase capital goods and services required for a new business or project. In addition, credit growth has eased sharply to an average of 8.8 percent yoy in Q3 from 10.7 percent in Q2.

I n v e s t i n g i n P e o p l e I n d o n e s i a E c o n o m i c Q u a r t e r l y
D e c e m b e r 2 0 1 9 T H E W O R L D B A N K | B A N K D U N I A
15
Box A.2: Commodity prices continued declining in Q3
Global commodity prices continued declining in Q3. International commodity prices continued to fall in Q3 2019, with both the World Bank Energy and Non-energy price indexes declining (Figure A.19). Global energy prices contracted further in Q3 plunging 21.2 percent yoy, nearly double the contraction in Q2, largely driven by weaker natural gas and coal prices as global demand shrank amid ample supplies. Average international coal and natural gas prices in Q3 were 15.7 and 37.7 percent lower than in Q2, respectively. Meanwhile, average crude oil prices were recorded at USD 59.8/barrel in Q3, 8.2 percent lower than in Q2. At the same time, non-energy prices also declined, particularly for base metals and iron ore, due to escalated concerns around trade tensions and the easing of supply bottlenecks.1 Most agricultural commodity prices also fell in Q3, due to abundant global stocks and the upward revision of production expectations.2 Global economic downturn and deteriorating vehicle sales weighed on the prices of Indonesia’s key export commodities. The contraction of Indonesia’s key export commodity prices in Q3 was notably more severe for coal and crude oil, which contracted at 42.0 and 18.2 percent yoy, respectively, compared to the 22.9 and 8.9 percent in Q2. This was driven by the broad-based downturn in global economic activity, tighter emission standards in Europe and China and deteriorating global vehicle sales.3 In contrast, LNG prices remained relatively stable on the back of continued robust demand from Japan, where extremely hot weather lingered, sustaining gas demand (Figure A.20).4 Figure A.19: Global energy and non-energy indices fell in Q3, continuing the trend that began in 2018 (price index, based on nominal USD, January 2018=100)
Figure A.20: Prices of LNG, CPO, and base metals remained stable while prices of other key commodities declined (price index, January 2018 = 100)
Source: World Bank Pink Sheet, WB staff calculations. Note: Global energy prices include price indices for: Australian coal; European, US, and Japanese liquified natural gas; and average crude oil. Global non-energy prices include price indices for: agriculture, fertilizer, metal and minerals, and precious metals.
Source: World Bank Pink Sheet; World Bank staff calculations Note: LNG stands for Liquified Natural Gas; CPO stands for Crude Palm Oil; Base metals excluding iron ore.
Among non-energy commodities, palm oil prices contracted less in Q3 than in the previous quarter due to sustained demand from China and India, as well as demand for biodiesel in Indonesia, while global production growth slowed.5 Prices for base metals remained subdued in Q3 due to a combination of weak global industrial demand, U.S.-China trade tensions, and the easing of supply bottlenecks in Brazil and China. Nonetheless, the contraction in Q3 is cushioned by a surge in nickel prices, on account of an unanticipated early imposition of the nickel ore export ban by Indonesian authorities.6 In contrast, rubber prices grew 6.5 percent in Q3 moderating from the 8.5 percent growth in Q2, as demand waned due to a decline in vehicle production in the European Union.7 1 Supply of alumina bounced back in Q3 2019 as the alumina refinery plant in Brazil resumed operations, and as the effect of the mud spill in China’s major
producing district retreated. Meanwhile, as the impact of Vale dam accident in Brazil eased, supply of iron ore also resumed (World Bank, 2019a). 2 World Bank (2019a). 3 Global vehicle sales contracted by 7.6 percent in Q2, compared to the 5.2 percent contraction in Q1 2019. Meanwhile, China’s vehicle sales declined by 8.7 and
4.5 percent in Q3 and Q2, respectively (Bloomberg, October 28, 2019). 4 CNBC (August 23, 2019). 5 Mongabay (August 23, 2019). 6 Bloomberg (October 28, 2019). 7 Commodity Markets Outlook. World Bank (October 2019).
70
80
90
100
110
120
Jan-18 Apr-18 Jul-18 Oct-18 Jan-19 Apr-19 Jul-19 Oct-19
EnergyNon-energyIndex (Jan 2018 = 100)
405060708090
100110120130
RubberBase metalsCoalCrude oilLNG

I n v e s t i n g i n P e o p l e I n d o n e s i a E c o n o m i c Q u a r t e r l y
D e c e m b e r 2 0 1 9 T H E W O R L D B A N K | B A N K D U N I A
16
3. Food inflation picked up transitorily in Q3
Headline inflation rose in Q3 due to higher inflation of raw food and gold prices
Headline consumer price inflation reached an average of 3.4 percent yoy in Q3 2019 (Q2: 3.1 percent; Figure A.21) mainly due to higher prices of raw food and gold. Higher raw food prices emerged due to the unusually longer El Nino-related dry season this year. Following an extended period of low price increases and buoyed by larger increases in gold34 and education prices, core inflation, which excludes volatile and administered goods, rose modestly from 3.1 percent yoy in Q2 to an average of 3.3 percent in Q3, the highest since Q1 2017 (Figure A.22).
Figure A.21: Headline inflation rose slightly in Q3 2019 due to higher inflation of raw food and gold prices (change yoy, percent; last observation November 2019)
Figure A.22: Higher education prices contributed to the increase of core inflation in Q3 2019 (change yoy, percent; last observation November 2019)
Source: BPS; World Bank staff calculations. Note: Clothing includes gold Administered price inflation fell in Q3 following the deflation in energy prices
Meanwhile, administered price inflation continued to decrease from an average of 2.8 percent yoy in Q2 to 2.0 percent in Q3, following the deflation of domestic energy prices by an average of 0.1 percent in Q3 from 0.6 percent in Q2. Moreover, the inflation of transportation prices slowed, partly due to the recent Government announcement encouraging airlines to provide discounted airfares during the off-peak season.35
Inflation in November 2019 continued to decline as core and administration inflation ease
Headline inflation continued to decrease from 3.1 percent in October to 3.0 percent in November, due lower core and administered price inflation. Core inflation ticked down to 3.1 percent in November from 3.2 percent in October driven by lower inflation among housing and clothing. Administered price inflation also fell from 1.6 percent in October to 1.1 percent in November, as the deflation of domestic energy prices persisted and inflation of transport prices declined, partly due to lower airfares.
4. Weaker commodity prices and imports weigh on revenue collection amid muted expenditure growth
Weaker growth of both Government revenues and expenditures were
After reaching an eleven-year high of 23.0 percent yoy last year, supported by a cyclical upturn in commodity prices and the impact of tax reforms, growth of total Government revenue collection posted a modest 1.7 percent year-to-October this year, driven by the high base effect, and a cyclical downturn with lower commodity prices and contracting imports, which weighed
34 Gold prices constitute a relatively substantial weight in the core inflation basket or about 1.4 percent of total headline inflation basket. Gold prices have been rapidly increasing since June 2019, surging by an average of 19.1 percent yoy to reach an average of USD 1,475/ounce in Q3 2019, after decreasing by an average of 0.8 percent in Q2. 35 CNN Indonesia (September 23, 2019).
0
1
2
3
4
5
6
7
8
Jan-18 Apr-18 Jul-18 Oct-18 Jan-19 Apr-19 Jul-19 Oct-19
AdministeredVolatile
Core
Headline
Housing
0
1
2
3
4
5
6
Jan-18 Apr-18 Jul-18 Oct-18 Jan-19 Apr-19 Jul-19 Oct-19
HealthEducation
Clothing
Raw Food
Transportation
Prepared food

I n v e s t i n g i n P e o p l e I n d o n e s i a E c o n o m i c Q u a r t e r l y
D e c e m b e r 2 0 1 9 T H E W O R L D B A N K | B A N K D U N I A
17
partly due to high base effects of strong revenue and expenditure realizations from last year
on both tax and non-tax revenues. Partly due to the high base effect in 2018, total Government expenditure growth was also weaker, reaching less than half of the five-year high increase in 2018. Growth was driven by personnel spending offset by contracting capital and subsidy spending. Overall, the fiscal deficit is expected to reach 2.2 percent of GDP in 2019, still well below the deficit threshold of 3.0 percent of GDP.
By October 2019, revenue growth slowed sharply, mainly due to falling VAT collection and O&G related revenues
Total revenue growth plummeted to 1.7 percent yoy for the first 10 months of 2019, after reaching 23.0 percent over the same period last year (Figure A.23).36 The weak revenue outturn was in part due to the high base effect, weak commodity prices (Section A2), contracting imports (Section A1), and policy changes.37 As a consequence of the muted commodity prices, O&G related revenues, including O&G tax and natural resources non-tax revenues, contracted 10.0 percent. In addition, reduced import levels led to a reduction in value added tax and luxury goods sales tax (VAT/LGST), which fell 4.3 percent and contributed to a reduced growth in income tax.38 More generally, total tax revenue from the manufacturing and mining sector contracted 3.5 percent and 22.1 percent yoy respectively. Finally, increased refunds on domestic VAT and income tax due to a policy change for streamlining VAT and income tax refunds led to a one-off reduction in net tax collection.39 In contrast, cumulative revenues from excises rose 15.2 percent yoy over the first 10 months of this year, the highest since 2012, due to the permitted deferment of 2018 payments,40 but unchanged tobacco excise tariffs. Other non-tax revenue, which mainly consists of profits from Government entities, such as like SOEs and BLUs (Badan Layanan Umum/Public Service
Figure A.23: Cumulative revenue growth declined due to the contraction of O&G and VAT revenues (January–Oct revenue contribution to growth, yoy, percentage points)
Source: Ministry of Finance; World Bank staff calculations Note: O&G related revenues refer to oil and gas income tax, dividends and royalties (non-tax revenues), N-O&G stands for non-oil and gas income tax; VAT/LGST stands for value-added tax/luxury goods sales tax; “Other” includes: land/property taxes, other tax revenues; non-oil and gas non-tax revenues; other non-tax revenues (profits of public enterprises, revenues from Public Service Agency [BLU], and other non-tax revenues [PNBP]); and grants. 2017-TA means that total revenues exclude redemption fees collected under the Tax Amnesty Program. 2018* is a yoy comparison against 2017-TA.
36 As of October 2019, total Government revenue reached 69.7 percent of revenue target, significantly lower compared to 78.3 percent in 2018 for the same period. 37 The average crude oil price (Brent, Dubai, and WTI) ytd 2019 is USD 61.3 per barrel, down from the average of USD 70.4 in 2018 for the same period and lower than Government 2019 Budget assumption of USD 70 per barrel. The average coal Australia ytd 2019 is USD 80.1 per metric ton, down from the average of USD 108.2 in 2018 for the same period. The average natural gas of United States ytd 2019 is USD 2.5 per million British thermal unit (mmbtu), down from the average of USD 3.0 in 2018 for the same period. (See Section A.2) 38 Part of non-oil & gas income tax is related to imports through Income Tax law article 22. 39 Domestic VAT, including VAT refunds, decreased by 2.4 percent yoy between January and October 2019. Excluding VAT refunds, domestic VAT is estimated to have grown 5.3 percent over this period, according to the Ministry of Finance’s monthly budget execution report (APBN KITA, November 2019). The streamlining of refunds for trusted tax payers was introduced through MoF regulation 38/2018 and expanded to more sectors through MoF regulation 117/2019. 40 As permitted by GR 57/2017, which stipulates that selected tobacco industries can defer excise payments up to 90 days. Kumparan (July 17, 2019).
10.8
-9.7-0.6
10.4
23.0
1.7
-15-10-505
10152025
2014 2015 2016-TA 2017-TA 2018* 2019
O&G related revenues Income taxes N-O&GVAT/LGST ExcisesInternational trade taxes OtherTotal revenues

I n v e s t i n g i n P e o p l e I n d o n e s i a E c o n o m i c Q u a r t e r l y
D e c e m b e r 2 0 1 9 T H E W O R L D B A N K | B A N K D U N I A
18
Entities), also increased 18.5 percent yoy. This was mainly driven by the one-time payment made by Bank Indonesia from its residual surplus from last year.41
Figure A.24: Government expenditures growth was mainly driven by higher personnel and social spending (Jan-Oct expenditure contribution to growth, yoy, percentage points)
Figure A.25: Lower execution of subsidy spending was offset by higher disbursements of personnel and social spending (Jan-Oct expenditure as percent of budget allocation, percent)
Source: Ministry of Finance, World Bank staff calculations Notes: * Energy subsidies excludes arrears payments of fuel and gas subsidies for 2018 and 2019, which are added back to the “Others” spending category as per the budget classification. *Others from 2017 onwards includes arrears payments from previous energy subsidies.
Government expenditure slowed partly due to contracting capital and subsidy spending
In part due to a high base effect, growth of total Government expenditures reached 4.5 percent yoy for the year-to-October, less than half of the 12.0 percent registered over the same period in 2018, which was the highest in 4 years. Capital expenditures contracted 6.1 percent, compared to an increase of 1.3 percent seen in 2018 (Figure A.24), partly due to its lower budget allocation. At the same time, total subsidies excluding arrear payments shrank by 15.9 percent in 2019 compared to last year’s 39.0 percent increase, partly due to lower commodity prices and the appreciation of the Rupiah. Apart from transfers to subnational governments (SNGs) and village funds42, personnel spending and social assistance spending were still the main contributors to total expenditure growth. Mainly driven by increases in civil servant basic salaries43, personnel spending rose 11.0 percent, slightly higher compared than the 10.7 percent in 2018. Cumulative social assistance spending still surged 32.7 percent following the higher benefits under the PKH (Family Hope/Program Keluarga Harapan) program as well as frontloaded payments and a larger number of beneficiaries of PBI JKN-Health (Subsidized Health Premium).
Lower expenditure disbursement was partly driven by a much lower realization of current
From January through October, the total expenditure disbursed was approximately 73 percent of the approved budget, lower than the 77 percent disbursed over the same period in 2018. This lower execution rate was partly explained by the slower disbursement of current energy subsidies, largely due to lower commodity prices and the stronger Rupiah (Figure A.25). In contrast, execution of the budget for social assistance rose significantly to 89.9 percent this year, from the 85.1 percent in 2018, due to the faster disbursements of PKH and JKN-Health
41 In condition where the ratio of capital and general reserves (30 percent aside of BI surplus) to liabilities is more than 10 percent, BI surplus (after deduction) must be deposited to Government account as part of the Government non-tax revenue. Bisnis (September 30, 2019). 42 The allocated budget for transfers to SNGs and village funds in 2019 was set to grow at 10.0 percent higher than the growth of 2.1 in 2018 partly due to additional DAU for Dana Kelurahan about IDR 3 trillion. Moreover, this year DAU disbursement is becoming final, different to last year which depended on revenue realization. Kontan (December 10, 2018). 43 Tempo (March 20, 2019).
5.2 5.6
12.0
4.5
-5
0
5
10
15
2016 2017 2018 2019
Personnel MaterialCapital Interest PaymentsEnergy Subsidies Non Energy SubsidiesSocial Transfers to SNGOthers* Total Expenditures
7384
6953 58
90 82
2542
68
020406080
100120140
Tota
l Exp
endi
ture
s
Pers
onne
l
Mat
eria
l
Cap
ital
Non
Ene
rgy
Subs
idie
s
Soci
al
Tran
sfer
s to
SN
G
Oth
ers*
Fuel
& g
as*
Elec
trici
ty*
2017 2018

I n v e s t i n g i n P e o p l e I n d o n e s i a E c o n o m i c Q u a r t e r l y
D e c e m b e r 2 0 1 9 T H E W O R L D B A N K | B A N K D U N I A
19
energy subsidy spending
(Jaminan Kesehatan Nasional) programs.44 Capital spending execution was still half of the budgeted amount, similar to the average disbursement rate for the last six years, driven by delays in land settlement and late submission of payment requests from companies.
Slower revenue collection led to higher budget shortfall as of October 2019 and is predicted to continue up to the end of the year
Partly due to weaker-than-expected revenue growth, the budget deficit for the year-to-October reached IDR 289.1 trillion or 97.7 percent of the targeted budget shortfall. Moreover, the total net financing increased to IDR 373.4 trillion or 126.1 percent of the budget target. Total Government debt stock reached IDR 4,756.13 trillion by October or 29.9 percent of GDP,45 which is still half of the 60 percent legal threshold. Meanwhile, the debt stock in domestic currency was dominant at 61.5 percent, compared 59.9 percent at end-2018. As mentioned in Section A9, the World Bank projects a 2019 fiscal deficit of 2.1 percent of GDP, wider than the Government 2019 Outlook projection of 1.9 percent. Total revenue is projected to come in at 12.3 percent of GDP, lower than Government’s projection of 12.6 percent, partly due to lower commodity prices and slower imports. Meanwhile, expenditure is expected to reach 14.5 percent of GDP, in line with the Government projection.
5. Labor market conditions continued to improve
Amidst stable economic growth, broad labor market indicators continued to improve
In the year to August 2019, Indonesia created 2.5 million jobs. Employment growth reached 2.0 percent yoy, faster than the labor force expansion of 1.9 percent. Consequently, the employment rate notched up 0.3 percentage points, to reach 63.9 percent. The unemployment rate edged down by 0.1 percentage point in the period to 5.3 percent (Figure A.26).46,47 As expected with typical economic development, progress has been slowing over the past several years, with changes in employment growth and labor force growth narrowing to 3.1 to 2.0 percentage points and from 2.5 to 1.9 percentage points between 2016 and 2019, respectively48. Underemployment, defined as workers who work less than full-time, has increased slightly, driven by an increase in voluntary underemployment (Figure A.27). This trend is likely driven by the changing nature of jobs, with more workers choosing independent, shorter-term jobs with more flexible work arrangements. Economic structural transformation49 continues with the share of employment in the agricultural sector declining by 1.5 percentage points between August 2018 and August 2019. The largest contributors to job creation were the wholesale and retail trade and accommodation/food service industries which saw 730,000 and 800,000 new jobs, respectively. (Table A.2).
Youth unemployment remains high
Urban unemployment has declined by 0.14 percentage points to 6.3 percent but remains above the national average. Youth unemployment also remains high, although it has fallen from 19.7 to 18.6 percent since August last year. Although 1.2 percentage points lower than in the year-to-August 2018, vocational school (SMK) graduates display the highest rate of unemployment of all workers, at 10.4 percent versus 2.4, 4.7, 7.9, and 5.6 percent for primary, junior secondary,
44 As the two biggest components of social assistance spending, the PKH & JKN programs disbursed 100 and 99.7 percent of their allocated budgets, respectively. These higher execution rates were driven by changes in the disbursement period for the PKH program which was moved one month in advance, while faster disbursement of PBI-JKN program was partly to relief liquidity issues faced by BPJS-Health. APBN Kita November (2019). 45 Using the Ministry of Finance’s GDP projection for 2019. 46 Indonesian labor market statistics are published twice a year in February and August. However, comparisons between February and August data are avoided as there are seasonal differences, such as differences in crop seasons, which would affect workforce employment and other labor market statistics. 47 The employment rate is the number of employed workers divided by the total working-age population. Its recorded value tends to be higher in the February Sakernas than the August Sakernas. 48 To maintain higher rates of employment, employment growth needs to exceed labor force growth; while this has been the case over the last decade, the difference between employment growth and labor force growth has been narrowing. 49 Defined as the shift of employment away from the agricultural sector.

I n v e s t i n g i n P e o p l e I n d o n e s i a E c o n o m i c Q u a r t e r l y
D e c e m b e r 2 0 1 9 T H E W O R L D B A N K | B A N K D U N I A
20
senior secondary, and university-level graduates, respectively. This indicates a continuing disconnect between the supply of the SMK-trained workforce and the demand from employers.50
Figure A.26: The rate of employment saw a further increase while unemployment fell to a record low in August 2019 (percent)
Figure A.27: Underemployment has risen slightly, driven by an increase in voluntary unemployment (percent)
Source: National Labor Force Survey (Survei Angkatan Kerja Nasional, Sakernas), WB staff calculations Note: Includes August readings only. August 2019 data updated from the BPS August 2019 Labor Press release.
Table A.2: The wholesale and retail trade, accommodation and food and beverage, and manufacturing industries accounted for 96 percent of job creation in the year to August 2019
Industries August 2018 Employment
Share
August 2018 Employment Growth Rate
August 2018 Job creation (millions)
August 2019 Employment
Share
August 2019 Employment Growth Rate
August 2019 Job creation (millions)
Total Employment 100 2.5% 2.9 100 2.0% 2.5 Wholesale/Retail Trade; Vehicle Repair 19 2.5% 0.57 18.8 3.2% 0.7 Accommodation/Food Service Activities 6.2 11% 0.76 6.7 10% 0.8 Construction 6.7 2.0% 0.16 6.7 2.5% 0.2 Manufacturing 15 3.9% 0.69 15 3.7% 0.7 Education 4.9 1.5% 0.09 5.0 4.0% 0.2 Business Activities 1.3 0.6% 0.01 1.5 15.% 0.3 Transportation and Storage 4.5 6.7% 0.3 4.4 3.0% 0.2 Financial/Insurance Activities 1.5 4.7% 0.08 1.4 -2.8% -0.05 Real Estate Activities 0.3 30% 0.09 0.3 2.6% 0.01 Mining and Quarrying 1.2 4.3% 0.06 1.1 -2.1% -0.03 Water Supply/Sewerage/Waste Management/Remediation 0.4 15% 0.06 0.4 4.3% 0.02
Human Health/Social Work Activities 1.5 3.9% 0.07 1.5 5.4% 0.10 Electricity and Gas 0.3 13% 0.04 0.3 5.9% 0.02 Information and Communication 0.7 9.8% 0.08 0.7 1.1% 0.01 Public Admin/Defense/Compulsory Social Sec 3.8 2.2% 0.10 3.9 4.1% 0.19
Agriculture, Forestry, Hunting/Fishery 29 -0.6% -0.2 27 -3.1% -1.12 Other Services Activities 4.9 0.2% 0.01 5.0 4.7% 0.28
Source: BPS 2019 August Labor Press release and World Bank Staff calculations
50 August 2019 labor market data is from the BPS August 2019 Labor Press release.
-20-100102030405060708090100
(2.0) (1.0)
- 1.0 2.0 3.0 4.0 5.0 6.0
1998
1999
2000
2001
2002
2003
2004
Nov
-05
Aug-
06Au
g-07
Aug-
08Au
g-09
Aug-
10Au
g-11
Aug-
12Au
g-13
Aug-
14Au
g-15
Aug-
16Au
g-17
Aug-
18Au
g-19
Employment growth (LHS)Labor Force growth (LHS)Working age population growth (LHS)Employment rate (RHS)Unemployment rate (RHS)
0
5
10
15
20
25
30
35
40
UnderemploymentInvoluntarily underemployedVoluntarily underemployed

I n v e s t i n g i n P e o p l e I n d o n e s i a E c o n o m i c Q u a r t e r l y
D e c e m b e r 2 0 1 9 T H E W O R L D B A N K | B A N K D U N I A
21
Gender disparity in labor market participation persists
The labor force participation rate (LPFR) is at a 4-year high of 67.4 percent in August 2019. However, the increases were borne almost solely through men entering the labor force. The LFPR for males stands at 83 percent, an increase of 0.5 percentage point yoy; the female LFPR increased by just 0.01 percentage point over the same period, with only 51 percent of women in the working-age population participating in the labor market.
Figure A.28: While earnings growth and minimum wage growth are correlated (mean and median real earnings index versus mean real minimum wage index, 2001-2018)
Figure A.29: …an increasing share of workers are earning less than provincially mandated minimum wages (share of workers earning below provincial minimum wages, 2006-2008 versus 2016-2018 average)
Source: National Labor Force Survey (Survei Angkatan Kerja Nasional, Sakernas), WB staff calculations
Minimum wages and earnings are weakly correlated, yet a large share of workers reportedly still earn less than the minimum wage
In the year to August 2019, nominal wages increased by 3.0 percent, slightly slower than the 3.2 percent increase the year before. With an inflation rate of 3.1 percent, this implies that real wages declined, despite an increase in minimum wages. Trends in minimum wages and earnings have actually diverged in the last decade. Historical wage data has shown there to be only weak correlation and even de-coupling between changes in both mean and median earnings to changes in the minimum wage. Over the period of 2001 to 2018; average real median earnings increased by just 50 percent while the average real minimum wage increased 152 percent (Figure A.28). In the period 2016-2018, 46 percent of all workers earned less than the mandated provincial minimum wage. Indeed, the share of sub-minimum wage earners in each sector increased in the 2016-2018 period (Figure A.29).
0
0.5
1
1.5
2
2.5
3
0
0.5
1
1.5
2
2.5
3
2001
2002
2003
2004
2005
2006
2007
2008
2009
2010
2011
2012
2013
2014
2015
2016
2017
2018
Average Real Earnings (LHS)Median Real Earnings (LHS)Average Real Minimum Wage (RHS)
0% 20% 40% 60% 80% 100%
Agriculture, forestry, livestock, andfishing
Wholesale and retail trade,restaurants and hotels
Community, social, and personalservices
Transport, storage, andcommunication
Mining and quarrying
Manufacturing
Construction
Electricity, gas, and water supply
Finance, insurance, real estate,and business services
Economy-wide average
Average 2016-2018
Average 2006-2008

I n v e s t i n g i n P e o p l e I n d o n e s i a E c o n o m i c Q u a r t e r l y
D e c e m b e r 2 0 1 9 T H E W O R L D B A N K | B A N K D U N I A
22
6. Poverty continues to decline in Indonesia
The poverty rate reached another record low of 9.4 percent in March 2019
In line with stable economic growth and strong labor market conditions and relative low inflation, the poverty rate based on the national poverty line declined from 9.8 percent in March 2018 to another record-low of 9.4 percent in March 2019 (Figure A.30). Correspondingly, the number of poor people fell from 25.9 million to 25.1 million. Meanwhile, the poverty gap51 fell from 1.7 percent to 1.6 percent over the same period.
Figure A.30: Poverty continued to be recorded at a single digit, despite the slowing pace (poverty rate, percent, LHS; change in poverty, percentage points, RHS)
Figure A.31: The middle-class continues to expand, yet vulnerability remains high (share of national consumption, percent)
Source: National Socio-Economic Survey (Survei Sosial Ekonomi Nasional, Susenas). Notes: M=March, S=September. World Bank (2019d) grouped individuals based on their expenditure levels into five welfare classes: the poor (living below poverty line), the vulnerable (living between 1.0-1.5x poverty line), the Aspiring Middle Class (AMC, living between 1.5-3.5x poverty line), the Middle Class (MC, living between 3.5–17x poverty line), and the Upper Class (UC, living above 17x poverty line)
A high share of individuals remains vulnerable to shocks and lacks the economic security to move up to the middle class
In the past two decades, Indonesia’s middle class (MC)52 has grown by threefold from 7 percent in 2002 to 23 percent in 2018. In 2018, 1 in 4 Indonesians belonged to the middle-class (MC). However, the majority remain as the aspiring middle class (AMC)53(Figure A.31). In September 2018, 126.6 million individuals belonged to the AMC, which reached up to 47.6 percent out of the total population. When including the vulnerable, this means that more than half of the population in Indonesia are not poor and yet still lacks the economic security to move up the ladder into the middle-class. Furthermore, 77.4 million individuals, equivalent to 29.1 percent of the population, remain poor or are vulnerable to falling back into poverty. This highlights a high share of population in Indonesia remains vulnerable to economic shocks, despite the continued progress in reducing poverty. Thus, anti-poverty and inclusive growth policies including social protection for the poor and vulnerable remain important.
51 The poverty gap measures how far below is the expenditure of poor households from the poverty line. A falling poverty gap indicates that on average, the poor households in March 2019 are less poor than those in March 2018. 52 Individuals that have escaped from poverty and has economic security 53 Defined as individuals living 1.5 times to 3.5 times above the poverty line.
-1.5-1-0.500.511.522.5
0
5
10
15
20
25
2006
M20
07M
2008
M20
09M
2010
M20
11M
2011
S20
12M
2012
S20
13M
2013
S20
14M
2014
S20
15M
2015
S20
16M
2016
S20
17M
2017
S20
18M
2018
S20
19M
Change in National Poverty Rate, yoy (RHS)National Poverty Rate (LHS)Urban Poverty Rate (LHS)Rural Poverty Rate (LHS)
0%
20%
40%
60%
80%
100%
2002
F20
03F
2004
F20
05F
2006
F20
07F
2008
F20
09F
2010
M20
11M
2012
M20
13M
2014
M20
15M
2016
M20
17M
2017
S20
18M
2018
S
Poor VulnerableAspiring middle class Middle ClassUpper class

I n v e s t i n g i n P e o p l e I n d o n e s i a E c o n o m i c Q u a r t e r l y
D e c e m b e r 2 0 1 9 T H E W O R L D B A N K | B A N K D U N I A
23
Consequently, the next challenge is to ensure the upward economic mobility among aspiring middle class to not only escape poverty, but also to enjoy and maintain economic security
Between March 2018-19, the share of consumption of the bottom and middle-40 increased. The gains at the middle of the income distribution indicates the growing AMC in the country (Table A.3). In March 2018, the AMC accounted for 92.6 percent of the middle 40 consumption, while the MC accounted for only 7.4 percent. Whilst the growing share of AMC and MC contribute to the moderate fall of inequality over March 2018-19, this also highlights the next challenge. This is to ensure the upward economic mobility among the AMC to not only escape poverty, but also enjoy and maintain economic security – that is, to climb up the ladder into the middle-class.
Table A.3: Consumption shares of the Bottom and Middle 40 percent increased (share of national consumption, percent)
Period Bottom 40 Middle 40 Top 20 National March 2018 17.3 36.6 46.1
March 2019 17.7 36.8 45.5 Δ 2019-2018 +0.4 +0.2 -0.6
Urban March 2018 16.5 36.9 46.6 March 2019 16.9 37.1 46.0 Δ 2019-2018 +0.4 +0.2 -0.6 Rural March 2018 20.2 39.6 40.3 March 2019 20.6 39.7 39.7 Δ 2019-2018 +0.4 +0.1 -0.6
Source: Susenas March rounds
Figure A.32: Although poverty declined nationally, the reduction was not uniform across the provinces (poverty rate, percent; decrease in poverty, percentage points)
Source: National Socio-Economic Survey (Survei Sosial Ekonomi Nasional, Susenas), March rounds Spatially balanced development remains a challenge as the geographical differences in poverty and overall welfare levels persist
Balancing development progress across regions also remains a challenge, as trends in poverty reduction varies across regions in Indonesia (Figure A.32). The urban-rural divide remains the key feature of poverty in the country. In March 2019, the share of poor individuals in rural areas was 12.9 percent, 6 percentage points higher than of poverty rate in urban areas. In the year to March 2019, the share of poor individuals in urban areas fell by 0.33 percentage point and there was less than a 0.35 percentage point-decrease in rural areas, signaling some urban-rural convergence. In addition, the gap between provinces with the lowest and highest poverty rates is wide. In March 2019, DKI Jakarta has the lowest poverty rate, at 3.5 percent, whilst the share of poor individuals in Papua reached 27.5 percent. In addition, two provinces (North Maluku and South Kalimantan) experienced an increase in the share of individuals living below the poverty line over March 2018-19. The highest fall in poverty was also not observed in areas where poverty is highly concentrated. More than half of the poor lives in Java and Bali, yet the largest declines
-1.4-1.2-1-0.8-0.6-0.4-0.200.20.4
0
5
10
15
20
25
30Poverty rate (March 2019), % (LHS) Change in poverty rate, yoy (RHS)

I n v e s t i n g i n P e o p l e I n d o n e s i a E c o n o m i c Q u a r t e r l y
D e c e m b e r 2 0 1 9 T H E W O R L D B A N K | B A N K D U N I A
24
in poverty was recorded elsewhere, such as in Gorontalo, Papua Barat, and Aceh. This implies that spatially balanced development and growth remains a challenge for Indonesia, as the geographical differences in poverty and overall welfare levels will tend to persist.
7. Economic growth outlook and risks
Growth is expected to pick up in 2020
Predicated on the gradual tapering of international trade tensions, broadly stable commodity prices, and reduced domestic political uncertainty, real GDP growth is projected to improve gradually. Indonesia’s economic growth is expected to come in at 5.0 percent in 2019 from the five-year high of 5.2 percent in 2018, picking up to 5.1 percent in 2020 (Table A.4).
Table A.4: Key economic indicators (growth yoy, percent, unless otherwise indicated)
Annual Revision from previous IEQ 2018 2019e 2020f 2019 1. Main economic indicators
Gross Domestic Product (GDP) 5.2 5.0 5.1 -0.1 Private consumption 5.1 5.2 5.1 0.0 Government consumption 4.8 3.5 3.7 -1.6 Gross fixed capital formation 6.7 4.5 5.0 -0.5 Exports of goods and services 6.5 -1.0 1.5 -3.6 Imports of goods and services 12.0 -6.0 0.5 -6.0 2. Other economic indicators Consumer price index 3.2 3.1 3.5 0.1 3. Economic Assumptions
Exchange rate (IDR/USD) 14237 14160 14165 -26 Indonesian crude price (USD/bbl) 67.5 60.0 58.0 -4.3
Source: BPS; Bank Indonesia; CEIC; World Bank staff projections Note: 2018 figures are actual outcomes; e stands for estimate and f for forecast. Statistical discrepancies and changes in inventories are not presented in this table. All GDP components are based on the latest GDP data. Exchange rate and crude oil price assumptions are average annual data. Revisions are relative to projections in the December 2018 edition of the Indonesia Economic Quarterly.
Investment is
expected to strengthen on reduced political uncertainty and reform dividends
With gradually easing international trade tensions, reduced political uncertainty on the formation of the new cabinet, lower borrowing costs, and improved business sentiment due to the proposed reforms, domestic investment growth is expected to accelerate next year, albeit remaining lower than last year’s five-year high. With investments and wages recovering, private consumption growth is projected to be broadly stable, though easing modestly in 2020 on account of the higher inflation with the removal of electricity tariff subsidies for a substantial number of households next year and the waning of the impact of elections in the first half of the year. Growth of government consumption is also expected to be relatively conservative given tepid revenue receipts in light of weak commodity prices and lackluster imports, despite ongoing tax reforms.
Exports and imports
are both expected to be subdued on trade headwinds
Amid global policy uncertainty, subdued global growth, and international trade, Indonesia’s export growth is forecast to be muted, despite several new avenues for higher exports.54 Imports are also projected to be weak with the current contraction easing gradually in light of the recovery in investment growth.
54 Potential new pathways for higher exports volumes for Q4 2019 onwards include increased palm oil exports to India because of a 5-percentage-point reduction in tariffs, Antara News (September 11, 2019), increased copper exports due to a more than three-fold increase in the export quota, The Jakarta Post (September 13, 2019), increased steel exports to China as Chinese domestic steel production slows amid tighter emission restrictions, Reuters ( August 14, 2019), and the possibility of Pertamina beginning to export jet fuel, Reuters (August 26, 2019).

I n v e s t i n g i n P e o p l e I n d o n e s i a E c o n o m i c Q u a r t e r l y
D e c e m b e r 2 0 1 9 T H E W O R L D B A N K | B A N K D U N I A
25
The terms-of-trade have deteriorated in 2019
Prices of Indonesia’s major export commodities declined sharply in 2019
Prices of Indonesia’s key export commodities are expected to decline this year and in 2020. Coal prices are projected to plunge by more than 25 percent yoy this year and another 10 percent next year (Table A.5). Similarly, palm oil and base metals are project to fall 10 percent this year, and oil prices are also expected to decline this year and in 2020. However, as Indonesia is a net oil importer, weaker oil prices tend to strengthen its ToT. Overall, the country’s commodity ToT in 2019 is projected to decline by 16 percent this year and another 4 percent in 2020 (Figure A.33)55.
Figure A.33: Indonesia’s net weighted price index (NTI) is projected to continue weakening this and next year… (index 2015=100)
Table A.5: …as prices for all its major commodities, except rubber, are expected to continue to ease (prices, historical and forecast)
2017 2018 2019f 2020f
Rubber, SGP/MYS (USD/kg) 2.0 1.6 1.7 1.7 Base metals, excl. iron ore (index) 84.9 90.6 81.7 82.1 Coal, Australian (USD/mt) 88.5 107.0 79.0 71.0 Crude oil, average (USD/bbl) 52.8 68.3 60.0 58.0 LNG, Japan (USD/mt) 8.6 10.7 10.7 9.8 Palm oil (USD/mt) 751 639 575 575
Source: BPS; WB staff calculations. Source: World Bank Commodity Market Outlook, October 2019. Note: f stands for forecast.
The current account deficit is expected to narrow
The current account deficit is projected to narrow to 2.7 percent and 2.6 percent of GDP in 2019 and 2020, respectively
Despite the slower growth of major trading partners (MTPs) and weaker commodity ToT, Indonesia’s current account deficit is forecast to narrow to 2.7 percent and 2.6 percent of GDP in 2019 and 2020, respectively, partly due to a smaller trade deficit. Import values are projected to be growing more slowly than export values due to slower O&G import growth as a result of government policies to manage imports continuing to gain traction in the near term (Figure A.34).
Figure A.34: The current account deficit is projected to gradually narrow. (USD billion) (USD billion)
Source: Bank Indonesia; World Bank staff calculations
55 The Net Trade-Commodity Price Index (NTI) is defined as follows: 𝑁𝑁𝑁𝑁𝑁𝑁𝑡𝑡 = 𝑊𝑊𝑊𝑊𝑊𝑊𝑊𝑊ℎ𝑡𝑡𝑖𝑖,𝑝𝑝 𝑥𝑥𝑃𝑃𝑃𝑃𝑊𝑊𝑃𝑃𝑊𝑊𝑖𝑖,𝑡𝑡
𝑃𝑃𝑃𝑃𝑊𝑊𝑃𝑃𝑊𝑊𝑖𝑖,𝑡𝑡 where 𝑊𝑊𝑊𝑊𝑊𝑊𝑊𝑊ℎ𝑡𝑡𝑊𝑊,𝑝𝑝 = �𝐸𝐸𝑖𝑖,𝑡𝑡�−(𝐼𝐼𝑖𝑖,𝑡𝑡)
∑(𝐸𝐸𝑁𝑁,𝑡𝑡)− ∑𝐼𝐼𝑁𝑁,𝑡𝑡 and i=
commodity type; t= month; p=period (e.g. 5 year average); N = number of commodities; T= base year; E=value of export; I=value of import
80
100
120
140
160
20172018
2015
20162019
2020
-3.5
-3.0
-2.5
-2.0
-1.5
-1.0
-0.5
0.0
2013 2014 2015 2016 2017 2018 2019 2020

I n v e s t i n g i n P e o p l e I n d o n e s i a E c o n o m i c Q u a r t e r l y
D e c e m b e r 2 0 1 9 T H E W O R L D B A N K | B A N K D U N I A
26
Consumer price inflation is expected to inch up in 2020 due to changes in administered prices
Inflation will remain modest this year but increase over the next two years with electricity subsidy reform
Consumer price inflation for 2019 is estimated to average 3.1 percent, the lowest on record, largely on the back of relatively muted food price and administered price inflation. In 2020, inflation is projected to increase to 3.5 percent following the recently announced Government policy to revoke electricity tariffs subsidies from non-poor 900VA households, increases in the BPJS health insurance premia and the hike in the tobacco excise.56(Figure A.35)
Figure A.35: Headline inflation projected to ease at 3.1 percent in 2019 (Monthly inflation and annual average inflation, change yoy, percent)
Source: BPS; World Bank staff calculations
The Government budget deficit is set to widen in 2019 and narrow again in 2020
The budget deficit is expected to widen to 2.1 percent 2019
In line with the macroeconomic outlook for 2019, the budget deficit is projected to reach 2.1 percent of GDP from the 1.8 percent in 2018 (Figure A.36). While larger, the estimated deficit is still below the average of 2.4 percent that it had reached in 2015-2018. The primary fiscal deficit is expected to widen to 0.4 percent of GDP, up from 0.1 percent of GDP in 2018. Government revenue is projected to reach 12.4 percent of GDP, mainly because of lower commodity prices, slower imports, and increased tax refunds. Total Government expenditure is projected to reach 14.6 percent of GDP, 0.7 percentage point lower than in 2018, with smaller capital and subsidy spending. Total central government debt is expected to reach IDR 4.8 trillion or 30.1 percent of GDP at end-2019, up slightly from 29.8 percent of GDP at end-2018.
Figure A.36: Lower commodity prices are projected to lead to a wider budget deficit in 2019 (percent of GDP)
Source: Ministry of Finance, World Bank staff calculations
The budget deficit is expected to be 2.1 of GDP in 2020
In 2020, revenue is projected to grow to 12.8 percent of GDP, with the share of tax revenue projected to increase due to dividends from implemented tax reforms. The share of non-tax revenue is expected to decline due to muted commodity prices (Table A.6: ). Total expenditure is projected to reach 14.8 percent of GDP, leading to a primary fiscal deficit of 0.4 percent of GDP and fiscal deficit of 2.1 percent of GDP. Central government debt is projected to increase slightly to 30.2 percent of GDP by end-2020 (See Box A.3 on Budget 2020).
56 Republika (November 19, 2019).
2.0
2.5
3.0
3.5
4.0
Dec-17 Dec-18 Dec-19 Dec-20 Dec-21
Forecast
3.5% 3.5%
3.1%
3.2%
13.1 13.512.4 12.8 12.8
14.9 15.3 14.6 14.6 14.8
-1.8 -1.8 -2.1 -1.8 -2.1
-3.0
0.0
3.0
6.0
9.0
12.0
15.0
18.0
Budget World Bank Budget World Bank
2018 2019 2020
Revenue Expenditure Fiscal balance

I n v e s t i n g i n P e o p l e I n d o n e s i a E c o n o m i c Q u a r t e r l y
D e c e m b e r 2 0 1 9 T H E W O R L D B A N K | B A N K D U N I A
27
Downside risks have recently increased with renewed and escalating trade tensions
External risks remain severe with protracted trade tensions
Downside risks to the growth outlook continue to be severe with protracted trade tensions posing additional risks to international trade flows and China’s growth outlook. Further escalation of trade tensions is likely to continue weighing heavily on China and regional economies that partake in regional supply chains, thus further dampening regional growth, which will consequently impact Indonesia’s Government revenues and economic growth through weaker exports and commodity prices.
Global business sentiment and investment is also at risk of being dampened in the medium term
Relatedly, the escalating trade tensions along with the disruption of supply chains are also taking a toll on global business confidence and hence investment. Should this drag on investment growth be prolonged to the medium-term, countries’ potential growth could be diminished, further endangering the subdued growth prospects worldwide, in the region, and for Indonesia.
Unfavorable external conditions can trigger another emerging market asset selloff
As recently experienced, heightened external risks can trigger an emerging market selloff intensifying capital outflows. Emerging market currencies could be under pressure again as investors rebalance their portfolios with traditional safe-haven assets such as U.S. treasuries in lieu of emerging market assets. The Rupiah could depreciate sharply and bond yields could jump, leading to higher borrowing costs and dampened private investment and economic growth.
An earlier-than-expected resolution of U.S.-China trade disagreement poses an upside risk to Indonesia’s growth outlook
With the “Phase One” trade agreement between the United States and China seemingly near completion, a sooner-than-expected normalization of international trade relations, along with a rapid rollback of trade tariffs, could spur a recovery in global trade and lift global economic activity, which could support global commodity prices and stronger world trade and investment flows. These could in turn re-energize Indonesia’s revenue collection, external sector and domestic investment, lifting economic growth.
In the face of heightened global economic risks, Indonesian need to boost its global competitiveness to reap the opportunities …
In the face of heightened global economic risks, it is crucial that Indonesia focuses on strengthening its domestic economy and enhancing longer term growth. Despite the 16 economic policy packages released by the Government since September 2015, substantial structural bottlenecks remain in the labor and product markets. These include limited human capital development and associated skills mismatches (World Bank 2019c); complex regulations especially at the level of sub-national governments; restrictions on FDI (World Bank 2017); and a strong presence of SOEs that limits competition. Reforms to address these growth impediments, such as policies to encourage more FDI and increasing the productivity of investment (World Bank 2018), will support growth and job creation. The beginning of President’s Jokowi second term provides a new window of opportunity to push ahead with structural reforms which the Government has capitalized through initiation of various structural reforms57.
… and strengthen social assistance and insurance measures to help people building and maintain their human capital
Apart from investing on hard capital, it is also essential for the country to focus on enhancing and protecting human capital through an inclusive and efficient social protection system. With 28 million Indonesians below the poverty line, and a further 68 million less than 50 percent above it, vulnerable households need strengthened social assistance and insurance measures to ensure their resilience to adverse shocks. Part B of this report discusses the importance of having an inclusive and efficient social protection system that will enable such investments and thereby achieve sustained economic growth that is more equitable and widely shared.
57 The Jakarta Post (December 2, 2019).

I n v e s t i n g i n P e o p l e I n d o n e s i a E c o n o m i c Q u a r t e r l y
D e c e m b e r 2 0 1 9 T H E W O R L D B A N K | B A N K D U N I A
28
Table A.6: World Bank Fiscal Budget Projections (IDR Trillion, unless otherwise indicated)
2019 Budget
2019 MoF Outlook
2020 Budget
2019 World Bank
2020 World Bank
2019 MoF Outlook vs 2019 Budget (% realization)
2019 MoF Outlook vs 2018 Actual (% growth)
2019 World Bank vs 2018 Actual (% growth)
A. Revenues 2,165 2,031 2,233 1,975 2,178 93.8 4.5 1.6 1. Tax revenues 1,786 1,643 1,866 1,553 1,769 92.0 8.2 2.3 Oil & Gas Income taxes 66 57 57 59 56 86.8 -11.2 (9.5) Non-Oil & Gas Taxes, o/w: 1,511 1,380 1,585 1,265 1,454 91.3 10.5 1.3
Non-Oil & Gas Income taxes 828 761 872 715 812 91.9 11.1 4.4 VAT/LGST 655 593 686 522 614 90.4 10.3 (2.9) Land and building tax 19 19 19 21 22 98.7 -3.0 8.3 Other taxes 9 7 8 6 7 85.0 10.3 (5.1)
Excises 166 166 181 189 217 100.2 3.9 18.7 International trade taxes 43 40 43 41 42 91.8 -13.3 (11.0) 2. Non-tax revenues 378 386 367 420 405 102.1 -5.6 2.6 Natural resources revenues 191 152 160 158 154 79.8 -15.7 (12.3) Oil & Gas 160 119 127 124 118 74.8 -16.3 (13.1) Non-Oil & Gas 31 33 33 34 37 105.6 -13.5 (9.4) Other non-tax revenues 188 234 207 262 251 124.8 2.4 14.5 3. Grants 0 1 0 2 3 307.8 -91.4 (90.4) B. Expenditures 2,461 2,342 2,540 2,312 2,529 95.1 5.8 4.5 1. Central government 1,634 1,527 1,683 1,505 1,638 93.4 4.9 3.4 Personnel 382 376 416 382 411 98.7 8.5 10.0 Material 345 334 360 340 365 96.8 -3.8 (2.1) Capital 189 173 187 178 220 91.6 -5.9 (3.5) Interest payments 276 276 295 276 289 100.1 7.0 7.0 Subsidies 224 212 188 179 170 94.7 -2.1 (17.4)
Energy 160 143 125 117 103 89.1 -7.1 (23.6) Fuel 101 90 71 59 49 89.7 -6.9 (39.0) Electricity 59 52 55 58 54 88.2 -7.4 2.8
Non-energy 64 70 62 62 67 108.4 10.1 (2.4) Grants 2 8 2 2 2 405.2 417.1 27.6 Social 102 100 108 101 130 97.6 18.1 19.8 Other 114 47 128 47 51 41.4 192.3 191.8 2. Transfers to regions 827 814 857 807 891 98.5 7.5 6.5 C. Overall Balance -296 -311 -307 -337 -352 15.4 25.0 D. Financing 296 311 307 337 352 1.7 1. Debt financing 359 374 352
2. Investment financing -76 -76 -74
3. Lending -2 -2 5
4. Guarantee obligation 0 0 -1
5. Other financing 15 15 25
Memo items (as % of GDP)
Total Revenues 13.5 12.6 12.8 12.4 12.8
Tax Revenues 11.1 10.2 10.7 9.8 10.4
Non-Tax Revenues 2.4 2.4 2.1 2.6 2.4
Total Expenditure 15.3 14.5 14.6 14.6 14.8
CG Expenditure 10.2 9.5 9.6 9.5 9.6
Transfer to regions and Village Fund 5.1 5.1 4.9 5.1 5.2
Overall Balance -1.8 -1.9 -1.8 -2.1 -2.1
Assumptions:
Real GDP growth rate (%) 5.3 5.2 5.3 5.0 5.1
CPI/GDP Deflator* 3.5 3.5 3.1 2.0 2.1
Exchange rate (IDR/USD) 15,000 14,250 14,400 14,160 14,165
Crude-oil price (USD/barrel) 70.0 63.0 63.0 60.0 58.0

I n v e s t i n g i n P e o p l e I n d o n e s i a E c o n o m i c Q u a r t e r l y
D e c e m b e r 2 0 1 9 T H E W O R L D B A N K | B A N K D U N I A
29
Box A.3: State Budget 2020 – Government sets optimistic growth targets for revenue and expenditure amidst global slowdown
Prior to the conclusion of their term, the 2014-19 Parliament approved the 2020 Budget on September 24, 2019 which would serve as the first budget of President Jokowi’s second term reflecting the continuity of Government programs. The key macroeconomic assumptions included a GDP growth rate of 5.3 percent, an inflation rate of 3.1 percent, a crude oil price of USD 63 per barrel, an oil lifting projection of 755 thousand barrels per day and an exchange rate of IDR 14,400 per USD.
A relatively optimistic revenue growth target for 2020
Despite sluggish revenues in 2019, the Government’s target for total revenues and grants is IDR 2,233.2 trillion in 2020 equivalent to 12.8 percent of GDP and 10.0 percent higher than the 2019 Outlook.1 This is also significantly higher than the estimated total revenue growth of 4.5 percent yoy in 2019 and the annual average increase of 6.5 percent (excluding revenues from the tax amnesty program) between 2014 and 2018 (Figure A.37).
Tax revenues, the largest source of total revenues, is targeted to grow by 13.5 percent yoy, higher than the predicted tax revenue growth of 8.2 percent in 2019, despite the introduction of new tax incentives to attract investment.2 The tax revenue growth in 2020 is expected to be driven by higher VAT collections, excises, and non-O&G income tax revenues, suggesting the expected impact of tax administration and tax policies reforms underway.3
Excise taxes are also targeted to grow by 9.0 percent yoy due to higher tobacco excise taxes (Box A.2) and a new plastic bag excise (Box A.4). On the other hand, the Government is projecting a decline in O&G income tax revenues by 4.2 percent in 2020, significantly better than the expected decline of 11.2 percent in 2019, partly due to the higher economic growth projection for 2020 compared to this year.4 Moreover, non-tax revenues are also projected to decrease by 5.0 percent in 2020, lower than the decline of 5.6 percent in 2019, partly due to lower profits from Government separated assets, such as SOEs and other Government institutions.5 Overall, the Government still aims for a higher tax-to-GDP ratio of 10.7 percent in 2020, compared to the projected 10.2 percent of GDP for 2019.
An improved quality of spending while maintaining a low deficit
Total nominal expenditure in 2020 is budgeted to grow moderately compared to 2019, with the Government continuing to expand capital and social spending while reducing subsidy expenditures. The Government submitted a budget of IDR 2,540.1 trillion or 14.6 percent of GDP, which includes interest payments, transfers to regions, and the Village Fund.6 This represents an increase of 8.5 percent compared to 2019, above the projected 5.8 percent growth in 2019 and the annual average growth rate of 6.1 percent in 2014-2018. The Government budget deficit-to-GDP ratio is set to be narrower in 2020 at 1.8 percent or 0.1 percentage point lower than 2019, partly due to the relatively optimistic revenue collection projections. After a low projected growth of 1.1 percent in 2019,7 infrastructure expenditure is budgeted to have a higher growth of 5.9 percent in 2020, yet still slower than the annual average growth of 21.9 percent for the years 2014-18. The stronger growth is partly driven by Central Government capital spending for the development of tourism destinations, such as Lake Toba, Borobudur Temple, Labuan Bajo and Mandalika. In contrast, below-the-line infrastructure spending in the form of capital injections to BLU-LMAN (State Asset Management) and infrastructure-related SOEs, which has been occurring since 2017, is projected to be lower than in 2019, following the Government policy to allow for more private investment for infrastructure financing.8 Meanwhile, the infrastructure spending of SNGs, constituting nearly half of total infrastructure spending, is expected to grow at 4.1 percent, slightly lower than the growth of 4.5 percent in 2018 in part due to the slower growth of total transfers to SNGs.9
Figure A.37: Total revenues in the Budget 2020 is targeted to grow double digits, higher than the historical average (yoy growth, percent)
Source: Ministry of Finance and staff calculation Note: Up to 2018 refers to actual budget; 2019 refers to Outlook; 2020 refers to approved budget. TA refers to the Government’s tax amnesty program in 2016-2017
5.38.2
-5.6
10.013.5
-5.0 -10
0
10
20
30
-10
0
10
20
30
Total revenue Tax revenue Non-tax revenue
2016 2017 2018 20192020 2016-TA 2017-TA 2018-TA

I n v e s t i n g i n P e o p l e I n d o n e s i a E c o n o m i c Q u a r t e r l y
D e c e m b e r 2 0 1 9 T H E W O R L D B A N K | B A N K D U N I A
30
Social assistance spending is targeted to grow by 8 percent (Figure A.38), significantly slower than its expected growth of 18 percent in 2019.10 This growth is driven in part by the benefit increase of Kartu Sembako (Cheap Basic Food card), which is namely as Bantuan Pangan Non-Tunai (BPNT) or non-cash food aid program. Under the Kartu Sembako program, the range of eligible food products will be extended to improve the nutrition of the targeted families.11 In addition, there will be a benefit increase in some components of the PKH program specific to pregnant women and young children, while keeping constant the number of beneficiaries.12 Also, the number of university scholarship beneficiaries will be doubled with the same benefits, and the vocational/training card (Kartu Pra-Kerja)13 will be initiated in 2020.
Energy subsidy spending will decline further by 12.1 percent yoy in 2020 after an expected decline of 7.1 percent in 2019, mainly due to the reduction of the fuel subsidy bill for diesel, kerosene and LPG. In particular, the fixed diesel subsidy of IDR 2000 will be cut by half following the expected lower oil prices and improved targeting of LPG distribution due to the adoption of a closed distribution.14 On the other hand, the electricity subsidy bill will grow modestly by 4.7 percent, partly due to a low base in 2019 with a decline of 7.4 percent as well as an expected increase in the electrification rate in 2020. To reduce further pressure on the subsidy bill, the Government will revoke electricity subsidies to non-poor households or most of the 900VA subscribers in 2020 and only provide subsidies to the customers who are listed in the unified poverty database (DTPPFM/BDT).15
Overall, the 2020 Government approved Budget projects a narrower deficit target of 1.8 percent of GDP compared to 2019, still below the legal threshold of 3 percent. 1 2019 Outlook refers to Government Budget Outlook numbers released by the Government in its Semester I 2019 Budget Implementation report published in July 2019. All references to 2019 numbers in this box refer to the 2019 Outlook numbers. 2 The additional (new) income tax incentives include super deduction for supporting vocational and R&D activities, a mini tax holiday for new investment up to IDR 500 billion, and investment allowances for human capital-intensive industries, as well as subsidized income tax for certain sectors such as geothermal and foreign Government bonds. In addition, VAT will be exempted will be enacted for transportation rental services (ships, aircrafts, and train) to improve competitiveness. 3 One of the reforms was the implementation of Automatic Exchange of Information (AEoI), which will broaden the tax base and reduce tax avoidance. Further, the Government has created a risk management unit within the Directorate General of Taxes that is equipped with technical staff and IT systems to improve overall voluntary compliance. Meanwhile, the Government supports the expansion of general income tax base by introducing a sunset clause for MSME final tax and allowing the MSME taxpayers to opt for general regime tax. Finally, the Government developed a model tax treaty and has been actively using it to renegotiate tax treaties which is poised to enhance revenue collection. 4 CNBC Indonesia (August 16, 2019). 5 Profit from Government’s separated assets, one component of “other non-tax revenues”, is expected to decrease by 38.5 percent in 2020 compared to the 2019 mostly due to base effect from the revenue of Bank Indonesia’s surpluses. Unlike previous years, as of September 2019 Bank Indonesia has deposited its remaining surplus to the Government’s account about IDR 30 trillion or almost half of the non-tax revenue from the Government’s separated assets, which increase the total non-tax revenue from the Government’s assets by 76.8 percent compared to 2018. (Bisnis, September 30 2019) 6 The Village Fund is a Government transferred fund to villages to finance the operational of villages’ governance, physical development, as well as community empowerment. 7 Infrastructure spending is particularly low in 2019 in part due to efforts to avoid a wider current account deficit through the reduced imports of capital goods that is associated with infrastructure investment. 8 Media Indonesia (October 3, 2019). 9 To enforce compliance with the mandate of allocating 25 percent of the DAU (general allocation fund) and DBH (shared revenue) to infrastructure, the Government (in this case the Ministry of Finance), will impose sanctions, such as withholding the disbursement of the DAU transfers, for those SNGs who do not submit the infrastructure budget plan or are not planning to meet the 25 percent infrastructure spending requirement. 10 The doubling of PBI premium or the subsidized health insurance premium for the poor that is beginning in 2020 is being recorded as reserved funds under “other spending” category, and not yet under the social assistance spending category in Budget 2020. The growth of social assistance spending therefore will increase faster when these expenditures are recategorized as social assistance expenditures. 11 The monthly amount of the Kartu Sembako increases from IDR 110,000 to IDR 150,000 per month with the same number of target beneficiaries of 15.6 million households. 12 Antara News (August 22, 2019). 13 The vocational/training card is one of Government solutions to tackle the issue of mismatched skills. This card will be given to current workers or job seekers to access vocational training either (both skilling and re-skilling), either from regular training centers (off-line) or online (digital training). The program has a target of close to 2 million subscribers. 14 There have been some simulations conducted by TNP2K for trying a closed LPG distribution system which shows that a biometric and e-voucher system could be better alternatives than a card system. (Bisnis. May 26, 2019.) 15 Merdeka (September 4, 2019).
Figure A.38: More priorities on capital and social spending while less spending on subsidies in 2020 (growth)
Note: Up to 2018 refers to actual budget; 2019 refers to Outlook; 2020 refers to approved budget. *others including interest payment, grants and other spending such as reserve funds
10 11 19
(12)
30
52
19
2 6 9
(4) (6) (2)
18 20
7 8 11 8 8
(12)
8
28
5
-20-10
0102030405060
Tota
l Exp
endi
ture
Pers
onne
l
Mat
eria
l
Cap
ital
Subs
idie
s
Soci
al
Oth
ers*
Tran
sfer
s to
SN
Gs
2017 2018 2019 2020

I n v e s t i n g i n P e o p l e I n d o n e s i a E c o n o m i c Q u a r t e r l y
D e c e m b e r 2 0 1 9 T H E W O R L D B A N K | B A N K D U N I A
31
Box A.4: Reducing plastic bag pollution in Indonesia
The world generated 242 million tons of plastic waste - 12 percent of all global municipal solid waste1 - in 20162. This plastic waste primarily originated from East Asia and the Pacific (57 million tons), followed by Europe and Central Asia (45 million tons), and then North America (35 million tons). The visibility of plastic waste is increasing because of its accumulation in recent decades and its negative impact on the environment and human health. Unlike organic waste, plastic can take hundreds to thousands of years to naturally decompose. Plastic waste is clogging drains and causing floods, instigating respiratory issues when burnt, shortening animal lifespans when consumed, and contaminating water bodies when dumped into canals and oceans3. In oceans, plastic is accumulating in swirling gyres that are miles wide. Under ultraviolet light from the sun, plastic degrades into “microplastics” that are nearly impossible to recover and tend to contaminate food chains and natural habitats4. It is anticipated that if no corrective measures are undertaken, there will be more plastic in the oceans than fish by 2050.5 A 2015 study revealed that Indonesia is the world’s second largest producer of marine plastic pollution, generating up to 1.3 million tons every year6, behind China, but ahead of the Philippines, Vietnam, Thailand, and Malaysia. Plastic bags, packaging, and other types of plastics, such as rubber sandals, toys, and cups were found in the waste sampled from the waterways in Indonesia. Plastic bags were found to be the most prevalent type of plastic found in the samples, at an average of 16 percent of all types of plastic waste across all cities7. Overall, marine plastic pollution represents a significant risk to Indonesia’s ocean economy that includes fisheries and tourism8. In addition, a recent study estimated that plastic bag pollution alone causes revenue losses of USD 140 million annually to Indonesia’s tourism sector, with USD 55 million from Bali alone9. In their attempts to reduce plastic waste, as of July 2018, at least 127 countries10 have adopted some form of legislation to curb the use of plastic bags11. These policies range from outright bans as in the Marshall Islands, to progressive phase-outs in countries like Moldova and Uzbekistan, to laws in Romania and Vietnam that incentivize the use of reusable bags. Some jurisdictions have implemented total bans of plastic bag use. San Francisco implemented a plastic bag ban that led to a 72 percent decrease in plastic litter on local beaches from 2010 to 2017.12 In Kenya, plastic bag bans have been implemented effectively with financial and other legal penalties.13,14 Another increasingly prevalent policy is levying an excise on plastic bags. Such excises, initially implemented in Germany in 1991 where customers were charged €0.05-€0.10 for each plastic bag they consumed, have been implemented in a number of countries15. Indonesia is one of those countries that has attempted to discourage plastic bag use by charging consumers. Over three months in 2016, while awaiting formal regulations from various ministries16, the Indonesian Retailers Association (APRINDO)17 charged customers at least IDR 200 per plastic shopping bag in 27 cities across Indonesia. As a result, plastic shopping bags use from retail shops affiliated with the Association declined by 55 percent18. Moreover, the GoI has affirmed its commitment to reducing marine debris, including plastic production and use, by 70 percent by 2025 in its National Action Plan on Marine Debris19. Accordingly, the Ministry of Finance has tabled a draft regulation to the Parliament to levy a national excise of IDR 30,000 (USD 2) on each kilogram of single-use plastic bags20, equivalent to IDR 200 (USD 0.02) for each plastic bag21. Simple statistical analysis of the available data from countries that have implemented an excise or levy on plastic shopping bags, along with the corresponding reduction in plastic bag use, sheds some light on the effectiveness of such excises on plastic bag use (Figure A.39). The results indicate that:
• a positive excise, regardless of how small, should lead to a reduction of plastic bag consumption by around 50 percent22. The strong reduction could be partly attributed to the increase in awareness for plastic bag pollution.
• there is a positive relationship between the size of the excise imposed and the reduction in plastic bag use. This implies that a larger excise should lead to a greater reduction in plastic bag use.
Figure A.39: In countries where data is available, reduction in plastic consumption is positively correlated with level of levies/tax (excise per kg (USD) vs. level of reduced consumption, percent, by countries)
Source: Various sources; World Bank staff calculations Note: Reduction in plastic bag use was measured over a period of 6 months to a year after implementation.
France (2014)
Portugal (2016)
Catalonia, Spain (2008)
Belgium (2007) Ireland
(2002)
Denmark (1994)
South Africa (2003)
Wales, UK (2011)
Indonesia (2016)
y = 51.4 + 1.7x
0
20
40
60
80
100
0 5 10 15 20 25
Red
uctio
n in
%
Excise in USD

I n v e s t i n g i n P e o p l e I n d o n e s i a E c o n o m i c Q u a r t e r l y
D e c e m b e r 2 0 1 9 T H E W O R L D B A N K | B A N K D U N I A
32
• despite imposing the smallest levy,23 the reduction in plastic bag use in Indonesia was greater than that of South Africa, Denmark, and Catalonia (Spain), all of which imposed higher levies.
Apart from the effectiveness of a plastic bag excise on curbing plastic bag use, it is common for policymakers to also be concerned about the potential employment ramifications of such an excise. This is because reductions in plastic bag consumption from such an excise could lead to lower production and job losses in the plastic bag industry. Most empirical studies on plastic bag excises focus on the effects of the bans or levies and excises on the use of such bags.24 Other economic effects, such as the employment effects of policies on plastic bag producers have yet to be fully explored.25 Utilizing the historical episode of the imposition of the IDR 200 charge per bag by APRINDO in 2016 and linking the timing of the episode with labor and industry data26, the impact of the plastic bag excise on employment was statistically analyzed.27 The analysis focused on the 18 of the 27 cities that not only implemented the plastic bag charge in 2016, but also had plastic bag manufacturing plants operating within the city. Employment likelihood in these 18 cities were compared with employment likelihood in cities that did not implement the plastic bag charge, both with and without plastic bag manufacturing plants. The results suggest that the plastic bag charge did not affect the likelihood of employment in cities with plastic bag manufacturing plants (Table A.7), indicating that there were no detectable employment changes due to the imposition of the plastic bag charge in 2016. Table A.7: Results from statistical analyses indicate that there were no detectable changes in employment resulting from the plastic bag charge levied in 27 cities in Indonesia in 2016
(1) (2) (3) (4)
Employed Employed Employed in Manufacturing
Employed in Manufacturing
Post 2016 0.006 0.009 0.046 0.042*
(0.006) (0.005) (0.021) (0.016)
District with Plastic Tax x Post 2016 0.000 -0.001 -0.025 -0.033 (0.005) (0.004) (0.018) (0.015)
Initial Exposure to Plastic Industry 0.000 0.000 0.000 0.000 (0.000) (0.000) (0.000) (0.000)
District with Plastic Tax x Initial Exposure to Plastic Industry
0.000 0.000 0.000 0.000 (0.000) (0.000) (0.000) (0.000)
Post 2016 x Initial Exposure to Plastic Industry -0.335 -0.453 -3.339 -2.892
(0.574) (0.650) (1.990) (1.634)
District with Plastic Tax x Post 2016 x Initial Exposure to Plastic Industry
0.816 0.696 3.070 3.806 (0.537) (0.534) (2.881) (2.258)
Linear Combination 0.481 0.241 -0.294 0.880
(0.337) (0.313) (2.56) (2.384) Observations 167717 167717 38318 38318 R-squared 0.007 0.104 0.065 0.243 Time Trend Yes Yes Yes Yes District Fixed Effects Yes Yes Yes Yes Controls variables No Yes No Yes *** p<0.01, ** p<0.05, * p<0.1. Linear Probability Model (LPM) estimations. Standard errors in parentheses, clustered at the district year level. Estimations use data from Sakernas 2014, 2015, 2017, and 2018. In 2016, 18 districts in Indonesia, where plastic plants are located, implemented a "pay for plastic" program. These 18 districts are the treatment districts, while control districts are neighboring districts with common borders (25 districts) that did not implement the plastic bag charge. Control variables are age, gender, living in urban area, highest education, marital status, indicator for household head, and an indicator to denote if the respondent completed firm provided training and became certified.
1 Commonly known as trash or garbage or rubbish, this is a waste type comprising everyday items that are discarded by the public. 2 Kaza, et al (2018). 3 Baconguis (2018). 4 (United States NOAA n.d.). 5 By weight, study was undertaken by The Ellen MacArthur Foundation (2016).
I n v e s t i n g i n P e o p l e I n d o n e s i a E c o n o m i c Q u a r t e r l y
D e c e m b e r 2 0 1 9 T H E W O R L D B A N K | B A N K D U N I A
33
6 Jambeck et al. (2015). 7 Shuker et al (2018) 8 Further discussion on the impact of marine plastic debris to Indonesia’s ocean can be found in the World Bank (2019). 9 Making Oceans Plastic Free Initiative (2017). 10 Out of 192 countries reviewed. 11 UNEP (2019). 12 Mercury News (2017). 13 For example: anyone found manufacturing, importing or selling a plastic carrier bag could be fined up to USD 40,000 or face a prison sentence of up to four years. Using the banned bags carries a fine of more than USD 500 or a jail term of up to a year 14 de Freytas-Tamura (2017). 15 Earth Policy Institute (2014). 16 Includes the Ministry of Forestry and Environment, Ministry of Industry, Ministry of Trade and Ministry of Finance. 17 Founded in 1994 and it currently has 150 members that operate around 45,000 retail shops across Indonesia. 18 PPID.KLHK. (July 3, 2018). 19 World Bank (2019b). 20 1 kilogram is equivalent to 500 plastic shopping bags. 21 The regulation is currently waiting for approval from the Indonesian Parliament. 22 This is represented by the y-intercept of the estimated regression line. 23 This is relative to the other countries for which data are available. 24 See, for instance, Taylor and Villas-Boas (2015), and Homonoff (2018). 25 See, for instance, Convery et al. (2007), BIO Intelligence Service (2011) for the negligible impact of the levies to employment, or NCPA (2012) for adverse effect of the policy. 26 Labor data was from Sakernas while industrial data was from the Statistik Industri survey. 27 The statistical analysis was conducted using a difference-in-differences (DD) approach, which is used to estimate the impact of policy or treatment (e.g. enactment of plastic bag excise) by comparing changes in the outcomes between a group receiving treatment (i.e. cities imposing plastic bag excise) and a group that is not receiving the treatment (control group, i.e., cities without plastic bag excise). A measure of initial exposure to plastic plants is included in the regression to better isolate the effect of single-use plastic tax on employment. The initial exposure is measured as the share of employment in plastic plants to the employment in the manufacturing sector in the cities in 2014.

I n v e s t i n g i n P e o p l e I n d o n e s i a E c o n o m i c Q u a r t e r l y
D e c e m b e r 2 0 1 9 T H E W O R L D B A N K | B A N K D U N I A
34
B. Investing in People: Social Protection for Indonesia’s 2045 Vision
1. A modern social protection system is key to achieve Indonesia’s high-income, zero-poverty vision
Achieving sustained and equitable growth in Indonesia will require an inclusive and efficient social protection system
The Government of Indonesia’s vision for 2045, when Indonesia will celebrate 100 years of independence, is to achieve high income status and reduce poverty to nearly zero.58 A modern, inclusive and efficient social protection (SP) system will be essential to meet these goals in the context of demographic, technological and environmental trends over the next decades. SP systems are important in ensuring that nobody is left behind by economic growth, and these emerging trends mean that they will also play an increasingly important role to build, employ, and protect Indonesia’s human capital59.
Indonesia has achieved a sustained
decline in poverty rates, from 19.1 percent of the population in 2000 to 9.4 percent of the population in 2019.60 However, this progress contrasts sharply with Indonesia’s performance in shared prosperity. Inequality, as measured by the Gini coefficient, rose from its lowest value of 30 points in 2000 to 41 points in 2014, declining to 38.2 in March 2019. While Indonesia is experiencing a rapid expansion of its middle class, comprising about 23 percent of Indonesians, the 127 million
Figure B.1: Age Structure of Population over time (percent)
Source: UN Population Data and World Bank calculations
58 Bappenas (2019). 59 World Bank (2019a). 60 This section draws on the following sources: World Bank (2019c) and (2016).
I n v e s t i n g i n P e o p l e I n d o n e s i a E c o n o m i c Q u a r t e r l y
D e c e m b e r 2 0 1 9 T H E W O R L D B A N K | B A N K D U N I A
35
Indonesians, or 47 percent of the population, that make up the aspiring middle class (AMC) has yet to achieve economic security61. Nearly one-fifth of the AMC in 1993 had become vulnerable to poverty by 2014. Two-thirds also suffer deprivation on at least one non-monetary dimension of welfare.62 Vulnerability is also high: while 25 million Indonesians live below the poverty line, an additional 52 million live less than 50 percent above it. Inequality and vulnerability can have significant adverse consequences for growth as well as for social and political stability, and without adequate protection, small shocks can easily send the vulnerable back into poverty.
Reaping the demographic dividend will require Indonesia to create the adequate number and types of jobs for the millions that join the labor force every year
Indonesia is undergoing a period of demographic transition that will impact labor market dynamics and human capital in the coming decades (Figure B.1). The number of older Indonesians will increase significantly, with important implications for health care and pension systems. Moreover, Indonesia will need an increasingly skilled labor force with the right level and mix of skills for the requirements of the job market of the future63. Social protection systems can play a key role in building human capital – and especially ensuring that the potential of all Indonesians is maximized. Social assistance programs can build human capital by providing consumption support and ensuring all citizens are able to get adequate nutrition and schooling. They can be designed to incentivize the demand for, use of, and access to education, health, nutrition, and other services. Social assistance programs are already core parts of the Government’s commitment to accelerate investments in human capital, including the Strategy to Accelerate Stunting Reduction (STRANAS Stunting). Strong and comprehensive social protection empowers people to be healthy, pursue education, and seek opportunities to lift their families out of poverty.
Technology will continue to change the nature of labor markets and work itself…
Technology and automation will reshape the skills needed for work, but also how people work. Indonesia will need an increasingly skilled labor force with the right level and mix of skills – including advanced cognitive skills and skill combinations that are predictive of adaptability, such as reasoning and self-efficacy – that are required in the job market of the future. Moreover, it is likely that a larger share of the workforce will move away from traditional one-job-per-career patterns to having many sources of employment over the course of their careers, including periods of non-wage or self-employment. The informal sector in Indonesia still employs more than 50 percent of the total workers (70 percent in rural areas), and it is likely that a high level of informality will persist given the trend of growth of the gig economy and e-commerce
…requiring effective programs to develop skills and provide protection for workers
Effective social protection programs will be key to help all Indonesians employ their human capital in the context of the transitions brought about by the changing nature of work. Social assistance programs can include skills upgrading and linking the unskilled poor and vulnerable with wage and self-employment opportunities. A modern and inclusive social insurance system that is available to all and not tied to how or where people work (i.e., formal wage employment) promotes labor force participation and employment, and accommodate changes in the labor market from technology, automation, and the emergence of the gig economy. Social insurance and labor market programs contribute to a modern and effective labor market with adequate provisions for pensions, unemployment support and access to productive work through active labor market interventions such as employment services and targeted training or skills development programs.
61 Aspiring Middle Class (AMC): those no longer living in poverty or vulnerability but who are not yet economically secure, with consumption between Rp 531,000 and Rp 1.2 million per person per month (US$3.30-7.75 per person per day). 62 53 percent suffer from lower-quality housing, 30 percent lack access to proper sanitation, and 7 percent do not have access to clean water.. 63 This section draws on the following: World Bank (2019b) and World Bank (2016b).

I n v e s t i n g i n P e o p l e I n d o n e s i a E c o n o m i c Q u a r t e r l y
D e c e m b e r 2 0 1 9 T H E W O R L D B A N K | B A N K D U N I A
36
Indonesians – especially the poorest – are particularly vulnerable to disaster and climate change
Indonesia is vulnerable to disaster risk and climate change. The World Risk Index64 ranks Indonesia’s exposure to natural hazard-related risk at the highest level. The annual economic impact of natural disasters between 2000 and 2016 was estimated at IDR 22.8 trillion (or USD 1.4 billion) or about 0.3 percent of Indonesia’s GDP (Figure B.2). This excludes the estimated direct damages and losses from the West Nusa Tenggara (Lombok) earthquakes and the Central Sulawesi (Palu) earthquake and tsunami in 2018, which are estimated to be at least USD 1.8 billion (0.2 percent of GDP).
Figure B.2: Number, Type, and Damage from Disasters (1996–2017)
Number of disasters by type, 1996–2017
Significant Disaster Events in Indonesia Disaster type Location Year Direct impacts on
People
Financial Damage (USD billion)
Indian Ocean Tsunami
Aceh 2004 167,000 fatalities 7
Earthquake Yogyakarta 2006 6,000 fatalities, 3.2 million affected 2.3
Flood Jakarta 2007 68 fatalities, 2.2 million affected 0.56
Earthquake Padang 2009 1,195 fatalities, 2.5 million affected 2.1
Volcanic Eruption Mt Merapi 2010 322 fatalities,
137,000 affected 0.400
Flood Jakarta 2013 34 fatalities, 250,000 affected 0.826
Earthquake West Nusa Tenggara 2018 564 fatalities,
396,000 affected 0.854
Earthquake and Tsunami
Central Sulawesi 2018 2,256 fatalities, 1.5
million affected 1.3
Source: BNPB. https://dibi.bnbp.go.id/dibi The poor and vulnerable are disproportionately affected by disasters.65 This is because they are
often more exposed from living in vulnerable areas like flood-prone land and steep hillsides or in poorly designed and constructed housing settlements. Shocks can also force poor households to resort to negative or damaging coping strategies such as liquidating savings and assets, reducing nutrition levels, taking children out of school to work, and postponing or neglecting health needs. In all these cases, limited ability to respond and recover quickly pushes already poor households deeper into poverty, and the vulnerable into poverty. It is thus common for households to transition in and out of poverty due to disaster and climate change-related shocks.
Social protection also plays a key role in protecting Indonesia’s most valuable assets: its people
Social protection programs protect human capital from disease and disasters and build resilience by insuring against adverse impacts from shocks and allow individuals to invest in their assets and livelihoods, instead of saving for precautionary reasons. Adequate coverage and benefit levels of social assistance programs can play a key role to protect human capital and build resilience. A well-functioning, adaptive, and responsive social protection system can protect the poor and vulnerable households against risks and shocks along the lifecycle. This minimizes negative coping behaviors (e.g., sacrificing productive investment to maintain minimum consumption) and contributes to beneficiaries’ human and financial capital in the long run.
Indonesia’s future social protection system needs to
Indonesia’s future social protection system needs to adapt and respond to a changing world and evolving objectives. In particular, technological change, changes in how and where people work, and demographic developments will impact the type of social protection system and programs
64 Only five common natural hazards are considered—earthquakes, cyclones, floods, droughts, and rise in sea levels. 65 Estimates from Rush, J. V. (2013) suggest that, at the district level, a 1-standard deviation increase in disaster harm can increase the poverty rate by 0.8 percent and the poverty gap by 2.3 percent.
7976
4458
636301
5354
1875
625
3973 47
119
Flood
Landslide
Flood and Landslide
Tidal Wave Abrasion
Cyclone
Drought
Forest and Land Fire
Earthquake
Tsunami
Earthquake andTsunami

I n v e s t i n g i n P e o p l e I n d o n e s i a E c o n o m i c Q u a r t e r l y
D e c e m b e r 2 0 1 9 T H E W O R L D B A N K | B A N K D U N I A
37
adapt and respond to a changing world
needed. This will require rethinking the social contract that can promote prosperity for all and enable Indonesia to achieve the poverty reduction, human capital, and inclusive growth targets that it has set out for 2045. What do these opportunities and risks imply for Indonesia’s social protection system, including social assistance and social insurance programs?
2. Indonesia has, over the past two decades, laid a solid foundation for its future social protection system
2.1 Building and Protecting Human Capital: Indonesia’s Social Assistance Programs Indonesia’s social assistance programs are key policy instruments to reduce poverty and inequality and to build, employ and protect human capital
Indonesia’s social assistance system was only introduced in the late 1990s, yet it has already undergone significant expansion and achieved important results. It has evolved from providing temporary support in times of need such as with subsidy reform (BLSM/BLT)66, to implementing a set of core permanent programs that today include the conditional cash transfer program (Program Keluarga Harapan - PKH), an education subsidy (Program Indonesia Pintar - PIP), food security assistance (Rastra/BPNT), and subsidized health insurance premiums (JKN-PBI). These programs are targeted to the poor and vulnerable, and aim to support their consumption and reduce poverty. Today, the social assistance system also plays an important role in building and protecting Indonesia’s human capital.
Program Keluarga Harapan (PKH) is a conditional cash transfer program for poor households,
aimed to alleviate short-term poverty and improve human capital through consumption support combined with investments in education, health and nutrition. Families are also encouraged to participate in Family Development Sessions that raise awareness on nutrition, early childhood education, financial literacy, and other relevant topics. As of 2019, 10 million families are enrolled in the program. To be eligible, a family must be included in the Unified Data Base (UDB, now called SIKS-NG) and ranked below a certain poverty cutoff point. They must also have either a pregnant or lactating mother or have one or more children of pre-school or schooling age.
Program Indonesia Pintar (PIP) is a cash transfer given to school-age children from the poorest
25 percent of households. Financial cost is a key constraint restricting poor household’s access to education services. Enrolling a student is costly: out-of-pocket costs (including transportation) range from around IDR 1 million to more than IDR 3 million per year depending on school level. Secondary education (SMA and SMK) can be prohibitively expensive for the poorest households: regular costs to send one child to senior secondary school consume about 18 percent of a poor household’s overall budget. PIP lowers the net cost of access to education by providing cash transfers.
Responding to persistent food insecurity, one of the earliest social assistance programs launched
in Indonesia was Raskin, now renamed Rastra a food distribution program that is currently being absorbed into a food voucher program called BPNT. BPNT aims to cover 15.6 million families by the end of 2019, where targeted households can exchange a monthly IDR 110,000 voucher for 10 kilograms of rice or eggs at controlled distribution points called E-Warung.67 The Government has also begun preparations for broadening the scope of BPNT by including several new nutritious items for purchase and increasing the benefit amount to allow the purchase of those items.
66 Bantuan Langsung Tunai and Bantuan Langsung Sementara Masyarakat were targeted unconditional cash transfer programs that were launched to compensate for the effects of energy subsidy reform; BLSM was last used in 2015, at the same time as the reduction of the fuel subsidy. 67 BPNT will likely be renamed into Kartu Sembako in 2020. World Bank (2017).

I n v e s t i n g i n P e o p l e I n d o n e s i a E c o n o m i c Q u a r t e r l y
D e c e m b e r 2 0 1 9 T H E W O R L D B A N K | B A N K D U N I A
38
The Penerima Bantuan Iuran (PBI) component of the National Health Insurance scheme, JKN, subsidizes insurance premiums for poor and vulnerable households and renders the use of all available healthcare services and facilities free, in accordance with PBI-JKN regulations. Recognizing that poor and vulnerable households have lower rates of utilization, higher rates of preventable conditions, and more frequent income losses due to adverse health events68, a core focus of Indonesia’s social protection policy is healthcare access, healthy behaviors, and healthy outcomes for all citizens.
Table B.1: Main Social Assistance Programs in Indonesia
Program Purpose Targeted Coverage
Budget (IDR billion)
Benefit (nominal or average values)
Adequacy (% of median monthly consumption of the poorest 10%)
Coverage of the poorest eligible 10%
Beneficiary incidence to the poorest eligible 10% *
Implementing Agency
PKH
Poverty reduction, strengthened human capital
10 million families 34,300
Conditional cash transfers – IDR 315,000/ month
21% 47% 24% Ministry of Social Affairs
PIP Lower costs of attending school
15 million households/20 million students
11,200 Cash transfers –IDR 100,000/month
7% 56% 19%
Ministry of Education and Ministry of Religious Affairs
BPNT / Rastra
Boost food security and improve nutrition
15.6 million households (end 2019 target for BPNT)**
20,800
IDR 110,000/month/HH for rice + eggs
7% 42% 17% Ministry of Social Affairs
PBI-JKN Preventing health shocks
96.8 million people 26,700 Health service
fee waiver 7% 54% 15% BPJS & MoH
Source: World Bank calculations based on data from Ministry of Social Affairs and Ministry of Finance. Notes: Coverage and incidence to the poorest 10% of eligible beneficiaries is constructed using Susenas 2018 March data. Adjustments made to reflect actual coverage of the PKH and BPNT programs. *Beneficiary incidence is defined as share of total program beneficiaries found in the poorest 10% of the targeted population. **Rastra is set to be absorbed completely by BPNT by the end of 2019. BPNT coverage was approximately 12 million households (HH) as of mid-2019. The current “de-jure” social assistance package shows that poor families with children are well covered
Figure B.3 depicts the “de-jure” adequacy of the benefit to the households targeted by social assistance programs along a welfare distribution. The depiction is de jure in the sense that the cut-off points along the horizontal axis represent what share of the population the government aims to reach with each program, though actual allocations stretch further along the distribution due to inclusion errors.
By design, the social assistance benefit package for households with children provides adequate protection
In particular, households entitled to PKH should receive an average of 21 percent of median consumption69 in direct cash transfers. Thus, if a household receives PKH, they are by design receiving the minimum level of protection.70 Adding on PIP, BPNT, and PBI-JKN to PKH renders a very adequate package of protection for the poorest 15 percent of households with children, at an average of 36 percent of median consumption. PIP and BPNT benefits each constitute an average of 7 percent median consumption; thus, receiving PIP and BPNT/Rastra
68 Harimurti et all (2013). 69 Median household consumption refers to the consumption level by a given household where half of the households consume more and half consume less 70 The minimum level of protection here is defined relatively as the minimum level of consumption required to bring an average household that is poor up to the poverty line, also defined as the poverty gap index. A potential concern would be labor disincentive effects among recipients. However, the literature has shown that in countries (including Indonesia) delivering cash transfers representing no more than a quarter of median consumption for beneficiaries, these effects are not present (Banerjee et al, 2017).

I n v e s t i n g i n P e o p l e I n d o n e s i a E c o n o m i c Q u a r t e r l y
D e c e m b e r 2 0 1 9 T H E W O R L D B A N K | B A N K D U N I A
39
for households in the poorest 15 percent of the population
only (approximately 14 percent of consumption budget supported) or just one of the other, does not provide an adequate package of assistance. The population beyond the poorest 20 percent thus receive a minimal package of protection, and those beyond the poorest 40 percent receive no assistance, by design.
Figure B.3: “De jure” value of social assistance benefits for households with children, 2019 (in percent)
Figure B.4: The de jure value of social assistance benefits for the poorest 40% of households without children receiving two of the main programs, 2019 (in percent)
Source: Susenas 2018 and authors calculations Source: Susenas 2018 and authors calculations In contrast, de-jure poor and vulnerable households without children are not adequately protected
Households without children are only eligible to receive PBI-JKN and BPNT/Rastra, not PIP or PKH (Figure B.4). Households in BPNT receive the equivalent of about 1 week of basic food support through the provision of 10 kg of rice and eggs. The value is approximately 7 percent of median consumption expenditure and therefore provides only partial food security. With an increase planned for 2020, the benefit value will increase to around 9 percent. Health services under JKN for fee waiver recipients (PBI) helps protect covered households from health-related shocks.
The “de-facto” coverage of programs is different from the de-jure design
There are errors of inclusion and exclusion along the welfare distribution, meaning that some households are included even if they are not eligible, while other households that meet the eligibility criteria are excluded. In reality, very few households with children receive all these benefits.71 As seen in Figure B.5, when tracking coverage along the consumption distribution, the actual allocation of programs stretches well beyond the poorest 40 percent.72 PBI-JKN covers the highest share of non-poor and vulnerable households, followed by PIP, BPNT/Rastra and then PKH. PBI-JKN’s large coverage beyond its target group is a function of its large program size (Rastra had similarly high inclusion error rates before it was reduced in coverage) and the ability of local governments to nominate beneficiaries under the previous scheme, Jamkesda. A similar arrangement is in place for PIP, which also likely explains, in part, its current rate of inclusion errors. It is worth noting, however, that while such targeting errors exist, their severity is minimal. While exclusion errors are still high, they have declined through coverage expansion. Inclusion of those in percentile 40 to 70 is in some sense admissible, as the
71 The adequacy of PKH, BPNT, and PIP is expressed in terms of the value of the cash transfer or food voucher as a share of household expenditure or consumption. The adequacy of PBI-JKN, though it is a fee waiver program with no direct benefits provided, can be thought of in similar terms. Put simply, the value of the PBI fee waiver can be constructed as the value of the premium paid for the household by the Government. This assumes a constant elasticity of demand to PBI-JKN. Another measure of adequacy for PBI-JKN would comprise utilization of health services compared to the presence of out-of-pocket expenditures persisting despite the notion that health service fees are waived under the JKN program. 72 Adjustments are made to reflect administrative coverage over the eligible population fairly (PIP and PKH coverage is expressed as a share of households with at least one child).
0%
5%
10%
15%
20%
25%
30%
35%
40%
45%
1 15 20 25 30 40
Valu
e of
ben
efits
(% o
f med
ian
cons
umpt
ion)
Household percentile (% of population targeted)
PKHBPNTPIPPBI-JKN
0%5%
10%15%20%25%30%35%40%45%
1 15 20 25 30 40Va
lue
of b
enef
its (%
of m
edia
n co
nsum
ptio
n)Household percentile (% of population targeted)
BPNTPBI-JKN

I n v e s t i n g i n P e o p l e I n d o n e s i a E c o n o m i c Q u a r t e r l y
D e c e m b e r 2 0 1 9 T H E W O R L D B A N K | B A N K D U N I A
40
welfare distribution is relatively flat until around percentile 70, suggesting small differences in welfare status among households in this part of the distribution. Household targeted cash transfer programs, in particular the PKH, have been most efficient in allocating benefits to the poor and vulnerable. In 2018, PKH and PIP allocated 71 percent and 63 percent of benefits, respectively, to the poorest 40 percent. Further efforts are needed to improve targeting and ensure full utilization of the Unified Data Base (UDB) to improve the allocation efficiency of social assistance benefits.
Figure B.5: Value of benefits and coverage of main Social Assistance programs 2019 (coverage over eligible population in percent and value of benefits in percent of median income for each decile; consumption decile)
Source: Susenas 2018. Coverage adjustments made: coverage expressed over eligible population and survey coverage inflated to 2019 administrative coverage levels. BPNT coverage is measured using a BPNT or Rastra participation variables. It is expected that future Susenas rounds will show lower BPNT coverage among non-target population groups.
Social assistance contributes significantly to improved human capital as evidenced by positive impacts on household level outcomes in health and education
PKH has been particularly successful in improving human capital. The latest impact evaluation, published in 2018, found that stunting amongst PKH beneficiaries declined by 9 to 11 percentage points (stunting is estimated to affect 28 percent of all children in Indonesia in 2019). Enrollment in primary school increased by 4 percentage points amongst beneficiaries, which is very impressive given that the net primary school enrollment rate is already high at around 93 percent. For junior secondary school, enrollment increased by approximately 8 percentage points – the net enrollment rate in junior secondary school is around 78 percent. Positive impacts of PKH on consumption and healthy behaviors with respect to maternal and neo-natal practices have also been found. 73
There are coverage gaps for certain groups in the social assistance system, primarily the elderly
The elderly in Indonesia are a vulnerable group today (around 36 percent are either poor or vulnerable) and will become increasingly so in the future, given the rapid aging. Although social assistance programs for the elderly to address the risks of old age exist, they are very limited. The disabled are another group that need to be significantly better covered. A final coverage gap relates to social assistance for the poor and vulnerable, adversely affected by natural disasters and climate-related shocks and stresses, as the current social assistance system does not fully accommodate their needs to “bounce back” after such events.
73 Cahyadi et al. (2018).
0%
20%
40%
60%
80%
100%
1 2 3 4 5 6 7 8 9 10
Cov
erag
e ov
er e
ligib
le p
opul
atio
n (%
) and
val
ue o
f ben
efits
(% o
f m
edia
n in
com
e fo
r eac
h de
cile
)
Consumption deciles
PIPPKHBPNT / RastraPBI-JKNValue of Benefits PIPValue of Benefits PKHValue of Benefits BPNT

I n v e s t i n g i n P e o p l e I n d o n e s i a E c o n o m i c Q u a r t e r l y
D e c e m b e r 2 0 1 9 T H E W O R L D B A N K | B A N K D U N I A
41
Aging can pose significant challenges to an economy, including sustainable provision of health, pensions, and long-term care for the elderly. While Indonesia does not face a shrinking work force yet, the country is aging rapidly and is doing so without an adequate set of protective tools in place. Social assistance support for the elderly in Indonesia is low. This, coupled with a low and regressive overall old-age pension coverage (Figure B.6), makes income security for the elderly poor a significant concern. While an elderly assistance program exists, implemented by the Ministry of Social Affairs (MoSA) its coverage is small. At the same time, there has been some progress toward covering elderly and people living with disabilities (PWD) within PKH families; a laudable improvement yet one that is uneven in covering elderly or PWD that do not live in PKH families.
Figure B.6: Total pension coverage among people aged 65+ by decile, 2018 (coverage in percent)
Source: Susenas 2018, including old age pension (JHT) and veterans pension (Pensiun Veteran).
Total spending on social assistance remains low at 0.7 percent of GDP, which is less than the average of lower middle-income countries
Central Government spending on major household targeted social assistance programs excluding subsidies has more than doubled in real terms between 2009 and 2018, reaching IDR 87.5 trillion in 2018. The spending reflects massive increases in coverage; PKH and PIP quadrupled the number of beneficiaries between 2010 and 2017 and PKH now reaches 10 million families with conditional cash transfers. However, total spending on social assistance remains low at 0.7 percent of GDP, which is less than the average of lower middle-income countries globally (Figure B.7). When comparing Indonesia to some of its regional peers in the East Asia and Pacific region (EAP), the share of GDP for social assistance is similar to countries such as Vietnam, Thailand and Malaysia. It is, however, lower than most Latin American (LAC) and East European and Central Asian (ECA) countries. Global evidence shows that aggregate spending of social assistance (social safety nets) averages 1.6 percent of GDP, with the average for lower-income countries at about 1.5 percent of GDP.74
Figure B.7: Social assistance spending as a share of GDP (%) – selected countries (percent)
Source: World Bank (2017b), ASPIRE and World Bank staff calculations 2019. Note: Selection based on data availability. Green highlights indicate countries that have similar revenue collection performance as Indonesia, highlighted in orange.
74 World Bank (2018b). The social assistance spending estimate for Indonesia includes a nominal budget figure for the nascent cash for work program.
0%
5%
10%
15%
20%
25%
30%
35%
40%
1 2 3 4 5 6 7 8 9 10
Dominican Republic,
1.2
Indonesia, 0.7
Malaysia, 0.7
Pakistan, 0.6
Philippines, 0.7
South Africa, 3.3
Sri Lanka, 0.7Thailand, 0.5
0.0
1.0
2.0
3.0
4.0
6 7 8 9 10 11 12
SA s
pend
ing
as a
per
cent
of G
DP
Log GDP per capita in constant PPP terms

I n v e s t i n g i n P e o p l e I n d o n e s i a E c o n o m i c Q u a r t e r l y
D e c e m b e r 2 0 1 9 T H E W O R L D B A N K | B A N K D U N I A
42
2.2 Employing Human Capital: Composition and Performance of Indonesia’s Social Insurance Programs Social insurance can help households and individuals weather major shocks that affect most of the population
Social insurance can help address shocks related to the cost of medical procedures, unemployment, disability, death, and old age. While social assistance aims to lift people out of chronic poverty, effective social insurance allows households to smooth consumption over the life cycle. By pooling risk, it mitigates the impact of shocks at a reasonably low cost relative to alternative coping mechanisms such as self-insurance, borrowing, or selling assets. Furthermore, this protection allows individuals to invest in their human capital and livelihoods instead of saving for precautionary reasons.
Indonesia’s social insurance system is relatively young and the country has made significant
progress in implementation and expanding its coverage, particularly health insurance. There is now a single large national health insurance for all Indonesians (JKN), three separate pension schemes for private formal sector workers, civil servants, and the armed forces, as well as work-related accident benefit (Jaminan Kecelakaan Kerja, JKK) and death benefit (Jaminan Kematian, JKM) for salaried and non-salaried workers. Reforms in 2014 went a long way towards rationalizing the legal framework and institutional arrangements for both the employment and health insurance programs. The increase in the number of people covered by health insurance (JKN) – from 130 to more than 200 million in the last five years – is a major achievement75.
Table B.2: Main Social Insurance Programs
Program Broad purpose Targeted coverage
Coverage of the eligible
Amount of contribution
Benefit description
Implementing Agency
JKN (social health insurance )
Preventing health shocks
268 million people1
223 million; 83% (2019)
5% of monthly income (salaried) or IDR 42,000-IDR 160,000 (non salaried and non-workers
Health service fee waiver BPJS Health
JKK (work-accident benefit)
Health service and cash benefit for work-related injury and/or fatality
120 million people2
17.8 million4; 15% (2017)
0.24%–1.75% of monthly income
Medical treatment and cash benefit5
BPJS Employment
JKM (death benefit)
Cash benefit to beneficiary (heir) in the event of death of the participant
0.3% of monthly income (salaried) or IDR 6,800 (non-salaried)
Death grant, funeral grant, and scholarship worth 36 million in total6
JHT (old-age savings)
Ensuring participant has savings when entering retirement or in the event of total permanent disability.
15.4 million; 12% (2018)
5.7% of monthly income (salaried) or around 2% (non-salaried)
Lumpsum cash payment upon retirement7
JP (pension)
Ensuring decent living conditions for participants post-retirement or in the event of total permanent disability
45 million people3
11.8 million; 26% (2018)
3% of monthly income
Monthly cash payment
Source: Ministry of Finance, BPJS data 1 The number of total population in July 2019 including PBI. 2 Working population in 2018; 3 the number of formal employees excluding civil servants in 2018; 4 2017 data, excluding the number of construction workers; 5 depending on severity of injury (disability) and monthly income; 6 scholarship benefit requires minimum 5 years of participation; 7 regulation enabling early withdrawal includes work termination and resignation as a form of retirement. Note: Article 1 of The Law No 40 2004 on SJSN defines the definitions and boundaries of SJSN. It stipulates that “social insurance is a mandatory fund pooling mechanism which comes from contribution and is used to protect against socio-economic risks” Article 1 (3). Furthermore, the law defines “workers are individuals who are working and who receives salary, wage, or other form of rewards, Article 1 (11).
75 However, while utilization of health insurance is increasing, there are still significant problems in terms of access for the poor, especially in remote areas of the country. There is a need to address the existing gap in coverage, with an estimated 60 million “uncovered middle,” who are not yet covered. Further, the cost of health insurance to the government is increasing and deficits have been rising in the last few years (totaling about 0.1 percent of GDP in 2018).

I n v e s t i n g i n P e o p l e I n d o n e s i a E c o n o m i c Q u a r t e r l y
D e c e m b e r 2 0 1 9 T H E W O R L D B A N K | B A N K D U N I A
43
The expansion of social insurance coverage for other risks has been much slower. By 2018, only 14 and 11 million workers were covered for the old age savings (JHT) and pensions (JP) programs, respectively. Coverage is lower than for health insurance (JKN) partly due to the absence of contribution subsidies for informal sector workers. However, it is also because most formal sector workers are found in enterprises with fewer than 20 employees (small and micro enterprises) and are therefore not mandated to contribute. Further, the adequacy for current workers is low, as evidenced by low replacement rates.
There is currently no unemployment benefit system in Indonesia. This, combined with a
severance pay system with low compliance that is not adequately implemented, has led to a large number of early withdrawals from the old age savings scheme (JHT) after the issuance of Regulation 60 in 201576 (see Figure B.8). This has weakened the function of the old age savings as part of the pension system and instead has it serving as a de-facto unemployment account for many workers.
Figure B.8: Withdrawals have risen sharply since Regulation 60 was issued in 2015 (claims)
Source: BPJS Employment (2019)
As in other emerging East Asian countries, population aging is outpacing the development of traditional contributory pensions in Indonesia
The National Social Security scheme (SJSN), which started operating in 2015, will pay full pensions only after 2050.77 Although coverage is increasing as firms and employees are registered, international experience (Figure B.9) suggests that potential coverage based on formal sector employment is limited. Most workers will continue to be excluded and pensions for the minority that are covered will be low compared to international benchmarks. Without additional measures to bring in informal sector workers and to ensure
Figure B.9: Cross country pension coverage rates and income level (percent)
Source: World Bank pension database.
76 Government Regulation No. 60, 2015 on “The Amendment to The Government Regulations No. 46, 2015 on the Implementation of Old Age Social Security Program”. The regulation has fundamentally changed the JHT withdrawal requirement by allowing withdrawal without having to fulfill the minimum of 10 years of contribution. 77 World Bank (2016a).
0
100000
200000
300000
400000
Janu
ary
Mar
ch
May
July
Sept
embe
r
Nov
embe
r
Janu
ary
Mar
ch
May
July
Sept
embe
r
Nov
embe
r
Janu
ary
Mar
ch
May
July
Sept
embe
r
Nov
embe
r
Janu
ary
Mar
ch
May
July
Sept
embe
r
Nov
embe
r
Janu
ary
Mar
ch
May
July
Sept
embe
r
Nov
embe
r
2014 2015 2016 2017 2018
Reaching retirement age Total permanent disabilityDeath Work terminationWork resignation Leaving Indonesia permanentlyBecoming Civil Servant/Military Officers 10 years of participation (partial withdrawal)
Indonesia
y = -2E-10x2 + 3E-05x + 0.0115R² = 0.8293
0%10%20%30%40%50%60%70%80%90%
100%
0 20000 40000 60000
Con
tribu
tors
as
% o
f wor
king
age
po
pula
tion
US$ Income per capita, PPP-adjusted

I n v e s t i n g i n P e o p l e I n d o n e s i a E c o n o m i c Q u a r t e r l y
D e c e m b e r 2 0 1 9 T H E W O R L D B A N K | B A N K D U N I A
44
that the poor elderly are covered by social assistance, the percentage of the elderly living in poverty will almost certainly rise.
In addition to the short-term fiscal pressure arising from health insurance deficits, the
demographics of the civil service will lead to increased pension spending in the coming decade. Civil service pensions are already financed on a pay-as-you-go basis, so any new spending increases deficits. Meanwhile, the SJSN pension scheme covering the private sector will amass significant reserves but will eventually run deficits.
3. Social Protection for Indonesia’s Future: A coherent, consolidated, and coordinated SP system to serve a changing country in a changing world
Indonesia’s changing demographic profile and nature of work presents a challenge to the social protection policies and programs that should be in place to help people manage risks to their lives and livelihoods
Indonesia has done very well during the past two decades when it comes to economic growth, extreme poverty reduction and socio-economic progress. This could accelerate further if the country capitalizes on current opportunities emerging from the favorable demographics of a young and growing labor force and an expanding middle class, which can support economic growth, accelerate human capital, reduce inequality, and be a source of entrepreneurship and job creation. However, the rapidly changing environment, including Indonesia’s changing demographic profile and nature of work coupled with persistent informality in the labor market, also presents a challenge to the social protection policies and programs that should be in place to help people manage risks to their lives and livelihoods. It is therefore time to re-think risk-sharing in the social contract and for Indonesia to evolve its overall social protection system to adequately meet the changing demands for its services in a rapidly evolving context. Such a system would offer adequate protection for all, regardless of their employment status. While Indonesia has established solid programs and systems in both social assistance and social insurance, there is a need to further strengthen coverage, implementation, and efficiency in both areas and to develop a cohesive system that serves all people in need. More needs to be done to make the overall system inclusive, adequate, sustainable, and efficient for the needs of the future.
The future Indonesian social protection system should support households and individuals during different states of transition
The social protection system should support people in transition. This includes transition from unemployment to employment; from poverty or vulnerability to prosperity; from youth to old-age; from one job to another; between geographic locations; during periods of sickness or injury; or in the aftermath of shocks. In doing so, the system will meet the changing needs of a middle-income country’s population and its expectations that the state and social protection system provide adequate protection in old age, support job search, and provide financial support in the event of shocks. Indonesia’s future social protection system should be one that contributes to national wealth and human capital accumulation, responds to new social dynamics and needs, and actively supports an emerging middle-class. An important element of this system is that it should aspire to be universal and accessible to all the Indonesian population, irrespective of whether they are employed in formal or informal jobs.
A new social contract could provide a guaranteed minimum, combined with a basic universal social insurance that is decoupled from how
To pursue this vision, the Government of Indonesia could consider a comprehensive package of safety nets, insurance, savings, and services that protect people from shocks and gives them the tools to manage risks and uncertainty. The increased risks encountered in the changing nature of work also call for adjustments to worker protection.78 A new social contract could provide a guaranteed minimum, combined with a basic universal social insurance that is decoupled from how or where people work. This new social contract could establish a system that 1) provides its people with a guaranteed minimum protection across the life cycle through a package of programs, and 2) complements the minimum guarantee with a coherent set of mandated and individually financed social insurance programs for consumption-smoothing.
78 Packard et al. (2019).

I n v e s t i n g i n P e o p l e I n d o n e s i a E c o n o m i c Q u a r t e r l y
D e c e m b e r 2 0 1 9 T H E W O R L D B A N K | B A N K D U N I A
45
or where people work
The guaranteed minimum could take many forms, and could be achieved through a series of programs or by expanding individual interventions. Each of these modalities presents different comparative advantages and has fiscal, political, and administrative implications.
In Indonesia, where the social assistance system is relatively mature, the guaranteed minimum
could be achieved by rationalizing current programs and expanding social assistance coverage to households both with and without children, ensuring the elderly and people living with disabilities are covered. This could be complemented by differential and well-targeted subsidies to cover social insurance premiums and contributions for informal sector workers. Existing social insurance programs could be made more efficient by implementing reforms such as a gradual increase to the retirement age in the SJSN pension scheme, and rationalizing the civil service pension scheme and moving younger civil servants into the national program. The social insurance reforms could also incorporate the current severance pay system by prefunding unemployment savings accounts to be managed together with the existing old age savings program and thus introducing an unemployment benefit.
Indonesia could move progressively towards a guaranteed minimum and reach more people by
tapering the benefits for those higher in the income distribution. As shown in Figure B.10, this would entail expanding the needs-based and publicly financed social assistance package to a larger share of the population. With today’s distribution, with a large number of people in the poor, vulnerable, and AMC categories, this could entail potentially covering some households all the way to the 70th percentile. The guaranteed minimum level of protection should be set so that it provides adequate consumption support and protection against household shocks. Here, the guaranteed minimum is set to bring households above the poverty line, with a tapered benefit showing the reduced support to households as their needs decrease when moving up the consumption distribution. The trajectory of programs to offer protection to this population will imply a blurring between the non-contributory and contributory programs over time, and a transition period where the Government finances a contribution subsidy for social insurance for the poorest, as well as for informal workers.
Figure B.10: Vision 2025 (level of protection; class in percent)
Source: Authors’ illustration. Figure and welfare distribution is illustrative. Note: although the protection floor or guaranteed minimum is envisioned as flat, it does not entail an equal level of benefits in absolute terms; for direct transfers under the tapered conditional cash transfer scheme for instance, the value would be set relative to the distance of an average households consumption to the poverty and vulnerability line across different groups in the population.

I n v e s t i n g i n P e o p l e I n d o n e s i a E c o n o m i c Q u a r t e r l y
D e c e m b e r 2 0 1 9 T H E W O R L D B A N K | B A N K D U N I A
46
Over time, as the economy continues to grow and Indonesia progresses further toward becoming a high-income country, the AMC and the share of the population that is poor and vulnerable and will decrease and the middle class will grow larger. The need for the social assistance package will thus continue to diminish, and over time, will likely be needed only for a smaller group of people categorized as poor. At the same time, a larger share of the population will be covered by an adequate social insurance package. By 2045, it is expected that the middle class will have increased significantly, and the share of poor and vulnerable households requiring social assistance will have decreased (Figure B.1179).
Figure B.11: Vision 2045 (level of protection; class in percent)
Source: Authors illustration. Figure and welfare distribution is illustrative.
4. Moving towards a Social Protection system for the future
4.1. Establishing a Guaranteed Minimum to Provide a Protection Floor A “guaranteed minimum” can provide a basic protection floor for all
The policy objective of a core “guaranteed minimum” is to effectively prevent poverty among those vulnerable at/near the poverty line and the further impoverishment of people who are already poor, that is, to provide a basic protection floor for all. In addition, the guaranteed minimum could promote other priority objectives such as human capital acceleration, productivity and labor mobility, and disaster response by continuing to employ instruments such as conditional cash transfers, establishing linkages to employment or skills programs, and by incorporating resilience building and responsive financing mechanisms.
Ensuring more comprehensive social protection in Indonesia through a guaranteed minimum
would entail expanding the needs-based and publicly financed social assistance package to a larger share of the population than is currently covered. Benefit payments could be contingent and progressive, meaning that benefits are available when and where needed. Many benefits may not be needed by many people in a given period or even at all, so what is important is the universality of entitlement for coverage against impoverishing losses. Those who do not suffer such losses may be covered by the guarantee, but never actually receive a payout. This could be achieved by applying universal progression, involving a tapering of the publicly financed benefits for people higher in the income distribution.
79 The distribution in the figure is illustrative only.

I n v e s t i n g i n P e o p l e I n d o n e s i a E c o n o m i c Q u a r t e r l y
D e c e m b e r 2 0 1 9 T H E W O R L D B A N K | B A N K D U N I A
47
A comprehensive system could rationalize current programs and expand social assistance coverage to households without children, especially the elderly.
The range of social assistance programs currently operating in Indonesia provides a solid basis. They could be further consolidated and reformed to include current gaps for the poor/vulnerable disabled, households without children, and the elderly. While the nascent pension scheme (JHT) is designed to protect the current working age population from old age poverty in the future, the 5.4 million elderly and 3.5 million disabled who are poor or vulnerable today will be unprotected from old age–related shocks if proper safety nets are not designed for them. Households without children are also inadequately protected as they are currently eligible to receive just BPNT and PBI-JKN. For this group, raising the adequacy of BPNT, followed by their inclusion under other programs such as skills development, would render a much-needed layer of protection. Finally, considering the remaining coverage gaps and marginally small differences in the levels of consumption between households in the bottom quintiles, there is a clear justification to extend social assistance coverage beyond the current coverage of about 20 percent of the population.
Three options could be considered to meet the guaranteed minimum package, building on
existing programs: (i) Consolidate cash transfer delivery by integrating the PKH and PIP programs; (ii) Extend the safety net by increasing the coverage of PKH and BPNT to the poorest 40 percent and provide a more adequate package of protection80, with tapered benefit levels81; and (iii) Improve protection for the elderly and disabled by providing a cash transfer to the poorest 70 percent of people aged 65 years and above82 and to the disabled.
(i) Integrating the PKH and PIP programs.
The current PKH and PIP programs serve similar population groups and objectives. Integrating the two programs under PKH would strengthen program targeting and delivery. An integrated PKH and PIP would also lead to higher coverage among the poor, and PIP beneficiaries would receive much more adequate support through an increase in the average benefit from 7 percent to 21 percent of median consumption. From an efficiency standpoint, PIP and PKH integration could yield an additional reduction of approximately 0.2 percentage points in the poverty headcount. Administrative costs in running a parallel PIP would also be saved.83
(ii) Increasing the coverage of PKH and BPNT with tapered benefit levels
The welfare distribution in Indonesia is relatively flat, and about 40 percent of households that are poor in a given year were not poor the year before.84 The vulnerable segment of the Indonesian population is therefore only slightly better off than the poor. Better protection could be provided by extending current programs such as PKH and BPNT and adjusting their benefit levels according to where in the welfare distribution a household is. Such a package of cash transfers could comprise an unconditional transfer (BPNT) and a conditional top-up (PKH). Administratively this could be done relatively easily by structuring the benefit amounts into two
80 For the modelling done in this report, BPNT benefit levels were adjusted to IDR 135,000 for existing households that receive PKH and to IDR 220,000 for households that do not receive PKH. It has subsequently been announced that BPNT benefit levels will be increased to IDR 150,000 in 2020. 81 The benefits could be tapered and anchored to welfare levels relative to mean consumption at the vulnerability line. To bring the average vulnerable household above the vulnerability line (1.5 times the poverty line), a cash transfer package worth approximately 60% of the current PKH benefit level could be offered to vulnerable families in consumption decile percentiles 16 to 40. To take into account their mean relative position from the vulnerability line, cash transfers are determined at a two-tier level: the first tier takes into account the value of PKH and BPNT at existing levels, which are sufficient to bring the average poor households above the poverty line. The second tier views the position of the average vulnerable household with respect to the vulnerability line and determines an average package of protection sufficient to bring those households just above the vulnerability line. This would significantly reduce the likelihood of these households falling into poverty. 82 65 will be the final retirement age as set out in the 2003 Labor Law no. 13. 83 An approximately equivalent amount of the budget could potentially be turned into a graduation bonus to children who continue school between SD, SMP, and SMA. This could help the government address lingering dropout rates between these levels of school, which are most pronounced for poor and vulnerable families. 84 World Bank (2016b).

I n v e s t i n g i n P e o p l e I n d o n e s i a E c o n o m i c Q u a r t e r l y
D e c e m b e r 2 0 1 9 T H E W O R L D B A N K | B A N K D U N I A
48
or three levels only. This policy change, combined with the merger of PIP and PKH described above, would render an increased level of protection for households both with and without children. For households without children, a guaranteed minimum could be achieved by increasing—potentially doubling—a poverty-targeted program such as the BPNT. A doubled BPNT benefit could reduce poverty by an additional 0.8 percentage points and vulnerability by 0.5 percentage points. The Government has approved an increase of 36 percent in the BPNT benefit starting in 2020, and to include a wider spectrum of food items, including local staples, meat, and nuts. Over time, the Government may also consider transitioning the BPNT benefit to a cash transfer program, which could promote greater flexibility and generate local economic multipliers. A poverty-targeted base transfer delivered in cash would then form the first layer of a “guaranteed minimum” for all households, regardless of their family composition.
(iii) Improving protection along the life cycle, in particular for the elderly
The elderly will require special measures of social assistance
Special measures would be needed to bring the elderly more comprehensively into the social assistance system and to ensure that they are also protected by a guaranteed minimum and covered by social assistance while the contributory pension scheme matures. There is therefore an urgent need to extend social assistance to more of the poor and vulnerable elderly. This could be done by categorically targeting this group for the BPNT transfer, extending social assistance coverage for elderly in the PKH regardless of whether they live in households with children or not, or designing a separate social assistance program for the elderly.
Table B.3: Cumulative estimated impacts of social assistance reforms
Model Components Poverty rate Vulnerability rate
Inequality (Gini)
A Merging PIP with PKH -4% -1% -0.0 A + B Expand PKH, BPNT to 40% coverage with tapered benefit levels -31% -9% -1.3 A, B + C1 Expand elderly assistance to 70% coverage -41% -12% -1.8 A, B + C2 Expand disability assistance to 70% coverage -32% -10% -1.4
Note: From World Bank CEQ Modelling. The impact estimations for model B, C1, or C2 are cumulative and include the previous models within them. The impacts are indicative and subject to change due to the headline growth, inflation, as well as the incidence of growth and inflation across the welfare distribution. Through successive models A and B and including C1 or C2 in the table, impacts due to increases in adequacy85 and expansion of programs, up to 40 percent of the general population and up to 70 percent of the elderly and disabled population, both existing and new, are modelled. The discussions here concern PKH, BPNT, PIP, and elderly and disability assistance programs. The above reforms could lead to greater inclusion, coverage and adequacy of social assistance programs and to further reductions in poverty, vulnerability and inequality
What are the estimated impacts of these reforms taken together? In comparison to the current situation, where around 60 percent of the poorest 10 percent receive at least one program (PKH or BPNT), the three reforms proposed above would see 90 percent of the poor receive at least one program (among PKH, BPNT, or elderly and disability support). Such a safety net would thus be much more inclusive and protective than the current one. The cumulative estimated impacts of these different scenarios models would be sizeable (Table B.3). Policies which lead to greater inclusion, coverage, and adequacy of social assistance programs could contribute to further reductions in poverty (to around just under half the current level, all else remaining equal), vulnerability (by about 12 percent), and inequality (reduction in Gini coefficient by about 1.8 points).
Benefits should be set at appropriate levels that are fiscally
The benefit value of a guaranteed minimum should be set at appropriate levels that are fiscally sustainable, and ensure that recipients are kept out of poverty but not disincentivized to work. The current value of the combined benefits for the PKH and BPNT programs going to the
85 The adequacy of the simulated package for the poorest 15 percent is kept as it is, at about 28 percent of median consumption, and that for the poorest 16–40 percent is set to comprise 11 percent of median consumption—just the right level of benefits to bring the average household in that group above the vulnerability line.

I n v e s t i n g i n P e o p l e I n d o n e s i a E c o n o m i c Q u a r t e r l y
D e c e m b e r 2 0 1 9 T H E W O R L D B A N K | B A N K D U N I A
49
sustainable, and facilitate that recipients are kept out of poverty but not disincentivized to work
poorest 15 percent is considered adequate as it provides sufficient transfers to bring the average recipient household above the poverty line. The poverty line in annual terms is about IDR 22 million and the annual consumption of the average household in the poorest 10 percent is about IDR 18.7 million. This means that the current estimated annual value of main cash transfers combined, amounting to about IDR 5 million, would bring the average poor household well above the poverty line. The Government could consider indexing the transfers to inflation or regularly assessing them to ensure that transfer sizes remain adequate to achieve the program objectives.
Shocks can result in losses that would overwhelm a guaranteed minimum. This includes costs from health events (lost working time/earnings/costs of medical treatment and medication), disability, death, and natural disasters. The potentially impoverishing impacts of such shocks can affect households along the whole welfare distribution. Indonesia already addresses the health shocks through subsidized premiums of health insurance. In doing so, it extends contingent coverage against large, catastrophic losses by integrating people who cannot afford premiums into the risk-pooling system with everybody else.
Without a disaster-adapted social protection system, disaster-affected households may face prolonged periods of destitution and may not fully recover from loss of their livelihoods
Indonesia’s social protection system is less prepared to respond to natural disasters and to better support disaster victims to meet basic needs and rebuild their lives faster. Without a systematic and timely response, disaster-affected households face prolonged periods of destitution and may not fully recover from the loss of their livelihoods. Current disaster response in Indonesia is designed and operated largely separately from the core social assistance programs and is often not timely due to the required budget reallocation process. For social assistance to be adaptive and scalable in response to disaster, the system should be able to increase benefits to existing recipients, extend benefits to new recipients, and introduce new benefits under the existing programs. These should be implemented under a strong adaptive social protection framework that includes early warning systems, predictable financing, and scalability of key programs to respond to disaster in a timely and predictable manner.
4.2. Consumption smoothing through mandated and individually financed social insurance programs
Social insurance is crucial to help individuals and households weather shocks such as cost of medical procedures, unemployment, disability, death, and old age
Social insurance is crucial to help individuals and households weather shocks that affect most of the population, including those related to the cost of medical procedures, unemployment, disability, death, and old age. A large share of future employment in Indonesia is likely to remain informal and be undertaken without standard work contracts. This means they do not provide the benefits of traditional contributory social insurance schemes such as pensions or mandated worker protection such as severance pay. If Indonesia continues to rely on a traditional contributory social insurance scheme that links coverage with formal labor market status, it will exclude most workers and their families from coverage against short-term risks and may lose the race between pension coverage and population aging. Introducing new incentives to encourage voluntary participation in social insurance, including to cater for the future of work, could help mitigate this risk.
Social insurance programs could be made more efficient and effective by implementing reforms to the SJSN pension scheme, including a gradual increase in the retirement age
Important gaps still exist in the SJSN system in terms of adequacy, sustainability, and coverage. Pension coverage in particular, both current and future, is a matter of concern given the aging of the population. These social insurance programs could be made more efficient and effective by implementing a number of reforms to the SJSN system, including a gradual increase in the retirement age. To ensure sustainability, improvements in adequacy require additional measures such as changes in the valuation of benefits, while coverage should ideally be expanded after measures have been taken to ensure sustainability. Future social insurance should be made accessible to the entire Indonesian population, irrespective of whether they are employed in formal or informal jobs. Over time, the intention should be for all workers, including the self-employed and informal sector, to be covered against these risks.

I n v e s t i n g i n P e o p l e I n d o n e s i a E c o n o m i c Q u a r t e r l y
D e c e m b e r 2 0 1 9 T H E W O R L D B A N K | B A N K D U N I A
50
Contribution rates could be increased to postpone deficits into the distant future, but this would
increase the tax wedge—the gap between labor costs and take-home wages—and could encourage informality. An alternative approach to social insurance coverage is already being implemented for health insurance in Indonesia, namely, to have the government pay the premium for the poor informal sector workers. A similar approach, combined with expanded social assistance coverage for the elderly, would help address this coverage gap just at the time population aging will begin to accelerate. To reach universal social insurance coverage, Indonesia could therefore rely on a combination of self-financed insurance for those who can afford it, and explicit subsidy or redistribution for those who cannot. The self-financed element would be financed by contributions while the contribution subsidy would be covered by the budget. A seamless system like this would allow portability of benefits regardless of employment status and would reduce administrative costs relative to having multiple funds. As with the guaranteed minimum package, the subsidy for contingent coverage can be tapered gradually as peoples’ income or consumption rises.
Reforms to rationalize the civil service pension scheme and move younger civil servants into the national scheme would also be required
Indonesia also needs to implement some reforms to its civil service pension to make it ready for the impending wave of retirements in the next few years. The competing goals of improving adequacy and ensuring fiscal sustainability can be achieved by enacting parametric reforms to the existing scheme and/or longer-term systemic reforms that would apply to new civil servants, such as increasing the earning period for benefit calculation, pension indexation to inflation, and increasing the retirement age. If the government wishes to improve pension benefits while keeping the cost of the civil service pension program unchanged, any viable solution will involve increasing retirement ages and changing to inflation indexing. These two changes create the fiscal room needed for improvements as benefits begin at a later age and benefit increases following retirement are smaller.
Box B.1: Recommendations for JKN sustainability
The framework to improve JKN implementation, and eventually aiming at improving its sustainability, should include: • Raise revenue • Update JKN premiums using robust actuarial analysis • Consider extending subsidy to informal sector to attract healthier members to join the risk pool • Identify and mobilize potential resources especially from tobacco taxation • Manage medical expenditure growth • Strengthen the purchasing role of BPJS-Health, which will empower them to manage resources more efficiently and
enable them to create incentives to influence provider behavior for more effective service delivery, efficient use of resources, and higher quality of care
• Rationalize and make explicit the benefits package • Improve the provider payment design, e.g., address open-ended hospital payments where most spending occurs • Improve the quality and use of data by investing in the quality and interoperability of various information systems
Social insurance reforms could incorporate the current severance pay system by prefunding unemployment savings accounts to be managed together
The current worker protection provisions in Indonesia do not contain insurance against the loss of employment, with the exception of the severance pay system which often provides very limited de-facto protection to workers. The introduction of an unemployment benefit would help manage these risks, and provide better protection to workers. A “mixed” unemployment benefit system could integrate current severance payment obligations and the old-age saving system while reducing the economic burden to workers and employers. A “mixed” unemployment benefit system in Indonesia could consist of an individual savings pillar and a pooled solidarity fund, jointly funded by employers and the state. Upon depletion of the funds in the individual account, unemployed workers could receive access to a solidarity component based on certain conditions. These conditions could involve the participation in active labor

I n v e s t i n g i n P e o p l e I n d o n e s i a E c o n o m i c Q u a r t e r l y
D e c e m b e r 2 0 1 9 T H E W O R L D B A N K | B A N K D U N I A
51
with the existing old-age savings program
market programs, including job counseling, job search, and skills training. Overall, with these reforms, income protection in case of unemployment should be much more effective and adequate than today’s system. Other countries such as Chile and Korea have successfully implemented similar schemes.
4.3. What would these reforms cost?
The cost to provide a more inclusive and effective social protection system would vary depending on the policy options applied as shown in Table B.4. For the guaranteed minimum, estimates show it would cost approximately 1 percent of GDP (about 0.4 percentage point over the existing level of spending for PKH, PIP and BPNT/Rastra86) to a total of IDR 145 trillion per year for the reforms discussed. One approach to manage the required costs would be through a sequenced increase in social assistance benefits over time, while continuing efforts to help households find better livelihoods opportunities.
Table B.4: Cost of expanding Social Protection coverage as percent of GDP under various options
Intervention Program Reform Scenario Total Incremental
Social Assistance
PKH* and BPNT Expanded PKH, BPNT to 40% coverage with tapered benefit levels. 0.77% 0.24%
Elderly assistance Expanded elderly assistance to 70% coverage for elderly 0.17% 0.15%
Disability assistance Expanded disability assistance to 70% coverage for people living with disabilities 0.03% 0.03%
Combined SA 0.97% 0.41%
Social Insurance
Work Accident (JKK) & Death Benefit (JKM)
Offer a contribution subsidy of 0.54% of minimum wage* to all adults 0.12% 0.12%
Pension Offer a pension contribution subsidy of 3% of minimum wage* to all adults 0.71% 0.71%
Combined SI 0.83% 0.83%
SP SA + SI 1.8% 1.2%
Health Health insurance subsidies Offer health insurance subsidy to all adults 0.53% 0.32%
SA+ SI and full health coverage subsidization 2.3% 1.6%
Notes: * * The minimum wage is the observed minimum wage for all workers from LFS 2018. The minimum 'observed' wage for 2018 that we deduced from the data is 2mln IDR per month. The minimum wages are assumed to grow at the rate of wage growth in the economy For social insurance estimates: adults in our calculations include all individuals aged 20–64. JKK and JKM calculations assume subsidy equal to 0.54 percent of average monthly wage of 2 million IDR paid to all adults/the bottom 40 percent of adults. Note that under current law, JKK/JKM/JP cover only a subset of all adults. An increase in health coverage would involve covering the remaining 60 million individuals. Pension contribution subsidy is equal to 3 percent of 2 million IDR monthly and this subsidy would give future retirees a monthly pension equivalent to 200,000 IDR today.
86 Annual social assistance spending when adding PBI -JKN and Cash for Work is 0.7% of GDP.

I n v e s t i n g i n P e o p l e I n d o n e s i a E c o n o m i c Q u a r t e r l y
D e c e m b e r 2 0 1 9 T H E W O R L D B A N K | B A N K D U N I A
52
As a result of the relatively late start of the BPJS pension scheme, contributory pension spending as a share of GDP will also continue to be lower than in many countries at Indonesia’s stage of demographic aging. A universal approach would require significant subsidies to expand the non-contributory portion, at least in the short to medium term. Ultimately, overall spending levels will have to rise to achieve reasonable levels of adequacy and continue to reduce out-of-pocket spending. It will cost a total of 0.71 percent of GDP in year 2019 to pay for contribution subsidies for all workers aged 20-64. It goes up to a total of 0.88 percent by 2050. In aggregate, the total spending requirements on the SP system will be around 2.3 percent of GDP. This is a significant investment in comparison to total general government revenues of around 14.9 percent of GDP in 2018.
Figure B.12: Estimated total cost of pension expansion and reform (percent of GDP)
Source/Authors’ calculations
5. Implementing and Financing Indonesia’s Social Protection System
5.1. Effective implementation of a social protection system
A well-functioning integrated delivery system will be required to provide the guaranteed minimum and to implement a coherent and efficient set of social insurance programs
Effective implementation of social protection programs requires integrated delivery systems for identifying, enrolling, and paying the targeted populations. Modern systems of monitoring and evaluation and adequate error, fraud, and corruption mechanisms are also essential. Indonesia has built a solid foundation and integrated platforms to better deliver multiple programs, including the unified social registry (UDB)87 for identification of beneficiaries, an integrated payment gateway under the collection of state-owned banks (HIMBARA), as well as partnering with local governments to test digital service windows and enable dynamic UDB data updates88 and grievance redressal. Further efforts will be needed to make these and other components become more effective and responsive to the changing needs of the social protection system. It will also be essential for Indonesia to strengthen its currently incomplete and ad hoc data protection and privacy regime.
87 Tohari et al. 2019 find that the UDB improved eligibility and participation in multiple programs substantially – i.e., the chance of participating in 3 core programs rose by 117%. See Tohari et. al.(2019). 88 This is currently being implemented by MoSA through the SIKS-NG social registry.
0.0%
0.2%
0.4%
0.6%
0.8%
1.0%
0.00%
0.20%
0.40%
0.60%
0.80%
1.00%
2019
2021
2023
2025
2027
2029
2031
2033
2035
2037
2039
2041
2043
2045
2047
2049
3% contribution subsidy for social insuranceelderly social assistance to 65+ (inflation indexed)elderly social assistance 65+ (wage indexed)

I n v e s t i n g i n P e o p l e I n d o n e s i a E c o n o m i c Q u a r t e r l y
D e c e m b e r 2 0 1 9 T H E W O R L D B A N K | B A N K D U N I A
53
Indonesia has a well-developed social registry, the UDB, to assess needs and conditions to determine eligibility for social protection programs. The UDB is designed to cover the poorest 40 percent of households. Further, the UDB is currently moving from a static dataset to a more dynamic social registry. While MoSA has initiated local government–led updating activities, a share of the data is still based on a large data collection exercise last conducted in 2015. The data captures information on households at a certain point in time and is not continuously or fully updated based on changes in needs and conditions. Finally, limiting coverage to the poorest 40 percent leaves out a large vulnerable population and the AMC89 who are not yet economically secure and thus are at risk of being pushed into vulnerability or poverty due to shocks. The UDB is therefore of limited use for programs that need to conduct eligibility assessments for people that are poor, vulnerable, and in the AMC, such as for electricity subsidies, skills training programs, health insurance, or in disasters. Even for programs that are meant to cover the poorest 40 percent, the UDB cannot contain a complete and accurate set of people with no errors of inclusion or exclusion.
An expanded UDB would be an essential instrument to increase coverage and targeted of all programs
There would be significant benefits in (i) expanding coverage of the UDB up to 80 percent of the population to help reach the uninsured informal sector and the “uncovered middle”; (ii) facilitate dynamic data updating; (iii) move to an absolute poverty ranking; (iv) make the UDB interoperable with other databases (tax, electricity, land/asset ownership, automobile/motorcycle purchases); and (v) integrate with geographic information systems to enable rapid response to shocks and crises. There is also enormous potential to use more technology to transform business processes and in the delivery of social protection programs.
It is essential to develop a shared payments delivery system for achieving greater effectiveness and efficiency.
Many of Indonesia’s social protection programs now deliver payments through a Government to Persons (G2P) 2.0 model, marking a rapid shift from in-person delivery of cash to payments through bank accounts. This has enabled considerable gains in efficiency and transparency. However, there is still only partial digitization of processes between payments providers and recipients. Program beneficiaries incur significant private transaction costs to withdraw cash, as they may live far away from a bank branch or ATM and have no other means to access or use the cash virtually. Further, not all programs make use of the integrated payment gateway under the collection of state-owned banks (HIMBARA).90 Going forward, it is essential to develop a shared payments delivery system for achieving greater effectiveness and efficiency.
A robust ID system is a crucial input for an integrated SP system, enabling the authentication of beneficiaries’ identity and facilitating sharing of information about beneficiaries across programs
A robust ID system is a crucial input for an integrated SP system, enabling the authentication of beneficiaries’ identity and facilitating sharing of information about beneficiaries (e.g., income, benefit levels) across programs. The social protection system in Indonesia could more systematically use foundational ID systems for identification and authentication. The Ministry of Home Affairs (MoHA) supports the SIAK ID system that issues a unique identification number (NIK) to all registered persons through their family cards (Kartu Keluarga, KK) and national ID cards (KTP), using biometrics to deduplicate individuals. While 95 percent of the population have an NIK in the SIAK system, it is not always used and/or verified. For example, the SJSN employment program does not require the NIK for registration for workers upon registration, but cross verified it at a later stage. Even when individuals have NIKs and other functional program IDs such as Family Welfare Cards (KKS) and BPJS cards, programs offer diverse and sometimes incompatible authentication methods and practices.
89 World Bank (2019c). 90 World Bank (2018b).

I n v e s t i n g i n P e o p l e I n d o n e s i a E c o n o m i c Q u a r t e r l y
D e c e m b e r 2 0 1 9 T H E W O R L D B A N K | B A N K D U N I A
54
5.2. Social Protection Financing
To finance the range of reforms proposed, reallocation of existing and generation of new revenue sources could be considered
Indonesia relies mostly on general revenue, payroll taxes, and compulsory contributions to finance its social protection system. General revenues are used to fund social assistance and the subsidized health insurance component (JKN-PBI), while social security contributions and payroll taxes fund social insurance. To finance its future social protection system, Indonesia should consider a combination of (i) working within the existing revenue and expenditure envelopes to better allocate and use these resources, and (ii) gathering additional resources through improved revenue mobilization.91
The extent of social protection spending is also constrained by the general revenues the
Government can generate. More resources to the social protection sector would entail a consideration of how to most optimally increase fiscal revenues. There are different alternatives in terms of realistic possibilities of increased collection and of fair burden, avoiding measures that place a significant burden on the population intended to benefit from social protection expansion, namely, those at the bottom of the distribution.
Subsidies, including LPG, fertilizer and remaining fuel subsidies for instance, could be further
reduced or removed and budget savings reallocated to social protection. Similarly, reductions in VAT exemptions would increase resources, but can place a significant burden on the poor who tend to consume the most exempted goods. Another promising alternative may be tobacco taxes, which offer the additional public health benefit for the poor, who have higher consumption elasticity. Ultimately, the government would have to match ambition in terms of expanding coverage of the social protection system and fiscal reform that can meet expectations.
One potential area from which additional revenue can be created are from fuel subsidies…
The allocation and efficiency of current social protection spending could be further improved, especially if fuel subsidies are considered. Despite an overall decline since 2014, spending on poorly targeted energy subsidies has recently increased and remain sizeable (IDR 153.5 trillion or 1.0 percent of GDP in 2018 – see Figure B.13 and Figure B.14). Approximately 56 percent of major fuel subsidies are allocated to the middle and upper class. Therefore, further reallocation away from regressive subsidies toward targeted transfers such as PKH and BPNT will improve the overall efficiency of social spending.
Figure B.13: Spending on energy subsidies has been partially redirected towards social assistance… (IDR billion)
Figure B.14: …but remains substantial at 1.0 percent of GDP (percent in GDP)
Source: Ministry of Finance, World Bank staff calculations. Note: For B.13, all years refer to audited central government expenditure data. For SA, 2018 includes a budget figure on the nascent cash for work program (PKT). For B.14 2018 data is budget data as reported by MoF in January 2019.
91 World Bank (2018b).
220.6
97.098.8
56.549.9
87.5
0
50
100
150
200
250
2012-2014average
2015 2016 2017 2018
Fuel subsidiesElectricity subsidiesSocial assistance
3.3
1.0 0.90.7
1.00.60.8 0.7 0.7 0.7
0.0
0.5
1.0
1.5
2.0
2.5
2012-14average
2015actual
2016actual
2017Actual
2018estimate
Fuel subsidy (diesel and LPG)Electricity subsidySocial assistance

I n v e s t i n g i n P e o p l e I n d o n e s i a E c o n o m i c Q u a r t e r l y
D e c e m b e r 2 0 1 9 T H E W O R L D B A N K | B A N K D U N I A
55
…or the removal of some VAT exemptions
Indonesia has implemented a value-added tax (VAT) system since 1984. The statutory rate is set at 10 percent on most goods and services, with many exemptions. In addition, small firms are exempted from paying VAT even for non-exempt goods and services, as the cost of administration required to enforce compliance is deemed to be higher relative to expected revenue. The current structure of VAT exemptions and payment thresholds translates to 90.6 trillion rupiah or USD 21.6 billion (in 2011 PPP terms), which is 0.67 percent of GDP. Exemptions on goods and services may be granted for a variety of reasons, but most commonly they are justified on equity grounds (e.g. food items). However, these exemptions can have a blunt and even regressive impact – just as price subsidies do. Currently, around half of all tax expenditures are in place with the objective to ‘improve the welfare of the people’. However, similar to price subsidies, these exemptions are often enjoyed more by the wealthier classes than by the poor, rendering these tax expenditures regressive in their (absolute) incidence across the welfare distribution (Figure B.15). In relative terms, as a share of household income, VAT exemptions are more important for the poor. The removal of VAT exemptions however would generate significant additional revenues that could finance the proposed social protection reforms discussed above.
Figure B.15: Government tax expenditures through VAT exemptions are enjoyed more by the middle and upper class (VAT incidence or share of total VAT tax expenditure by income decile)
Raising excise taxes on tobacco products represents another promising alternative
For a country with one of the highest prevalence of adult smoking in the world, the burden of taxes on tobacco is still lower than in many countries and is insufficient to have a meaningful influence on consumption behavior.92 While 2020 marks a notable increase in tobacco excise taxes, rates could still be raised further. Increasing such taxes can generate significant additional revenues even with lower consumption and also offer an additional public health benefit for the poor. See Box B.2 for more detail. Given their higher consumption elasticity, the burden of such a tax would fall more proportionally on the middle class. Again, the size of the potential revenue generated would be large enough to compensate those that bear the brunt of additional excise.
Rough estimates suggest that
reallocating LPG, diesel and fertilizer subsidies could yield 0.7 percent of GDP. Removing poorly-targeted VAT exemptions and raising the tobacco excise could yield another 0.6 percent of GDP. The incremental cost of proposed SP reforms is estimated at 1.6 percent of GDP. Therefore, the Government will need to raise an additional 0.3
Table B.5: Projected annual impact of reforms (percent of GDP)
2020-2024 LPG 0.3 Diesel 0.2 Fertilizer 0.2 Gains from tobacco excise reform 0.2 Gains from removal of VAT exemptions 0.4 Other sources 0.4 Total cost of incremental SP reform 1.6
Source: Public Expenditure Review, forthcoming 92 World Bank (2018c).
0%
2%
4%
6%
8%
10%
12%
14%
16%
18%
20%
1 2 3 4 5 6 7 8 9 10

I n v e s t i n g i n P e o p l e I n d o n e s i a E c o n o m i c Q u a r t e r l y
D e c e m b e r 2 0 1 9 T H E W O R L D B A N K | B A N K D U N I A
56
percent of GDP in general revenues. This is well within the Government’s own target in its medium-term revenue strategy of raising an additional 5 percentage points of GDP through a number of tax policy and administration reforms, which include improving compliance, broadening the base for VAT and income taxes, raising personal income taxes, and applying green taxes including on single-use plastics.
6. Concluding remarks
An inclusive and efficient social protection system will be essential to achieving the 2045 vision
The Government of Indonesia’s vision for 2045 is to be a sovereign, fair, and prosperous country, and to move from middle- to high-income status. An inclusive and efficient social protection system will be essential to achieving these goals. Emerging demographic, technological and environmental trends will require rethinking the social contract to ensure it can promote prosperity for all and enable Indonesia to achieve the poverty reduction, human capital, and inclusive growth targets that it has set out for 2045. Current social protection programs form a solid base on which Indonesia can build a system that addresses the risks and challenges that the future is likely to bring. To achieve this, the Government could consider a system that provides a guaranteed minimum level of protection across the life cycle through a combination of social assistance programs and complementing this minimum guarantee with a coherent set of social insurance programs for consumption-smoothing and protection against risks in old age and unemployment. These reforms are not small, and they come with significant costs but they can be done with the right reforms, such as ending subsidies and increasing revenue collection.
This is the right time to consider how to improve social protection in Indonesia and make it
ready for the future. The social protection system in Indonesia can help millions of adults acquire the right skills to compete in today’s changing job market and millions of children with better education and health care to make them ready for the future labor market. Making these investments today will give Indonesia a head-start to ensure it protects and promotes all as it moves towards the achievement of its 2045 targets.
Box B.2: Higher tobacco taxation in Indonesia
Indonesia has increased tobacco excises after a pause in 2018. In late October 2019, the Government issued Minister of Finance Regulation (PMK) No. 152/2019 on Tobacco Excise Tax Rates. The new regulation will result in the average cigarette excise tax rate increasing by 21.2 percent and the minimum retail price increasing by an average of 37.0 percent in 2020. This is the largest adjustment over the past five years (Table B.6 column viii), but follows a year of no change in tariffs and minimum prices1. Indonesia’s tobacco excise tariff increases have been incremental relative to the regulated price increases and has kept tobacco prices highly affordable.2
Table B.6: Average change in regulated minimum retail prices and excise tariff levels of tobacco products
Change in Unweighted average across tiersa
2013 (i)
2014d
(ii) 2015 (iii)
2016 (iv)
2017 (v)
2018 (vi)
2019e
(vii) 2020 (viii)
Regulated minimum price (percent change) 19.0% 0.0% 10.8% 33.3% 20.5% 0.8% 0.0% 37.0% Machine-made cigarettesb 28.0% 0.0% 13.5% 29.5% 19.7% 6.3% 0.0% 52.1%
Hand-made cigarettesc 4.8% 0.0% 7.6% 37.9% 21.2% -7.4% 0.0% 14.3%
Excise tariff (percent change) 4.9% 0.0% 7.5% 11.8% 9.0% 11.3% 0.0% 21.2% Machine-made cigarettes 4.5% 0.0% 8.9% 14.3% 10.6% 12.4% 0.0% 26.7%
Hand-made cigarettes 5.5% 0.0% 5.8% 8.9% 7.4% 9.7% 0.0% 12.8%
Source: MoF Regulations on Tobacco Excise Rates, WB staff calculations. Note: a. Number of tiers: 2018-2020 (10); 2017 (12). Each tier is based on the type of product, production quantity, and the retail price. Unweighted as number of actual cigarettes production by sticks is not available. b. Machine-made refers to white and kretek cigarettes rolled by machine. c. Hand-made refers to white and kretek cigarettes rolled by hand.

I n v e s t i n g i n P e o p l e I n d o n e s i a E c o n o m i c Q u a r t e r l y
D e c e m b e r 2 0 1 9 T H E W O R L D B A N K | B A N K D U N I A
57
d. The Government only revised the excise tariff and retail prices for tobacco products stipulated in the PMK No. 179/2012 through the PMK No. 205/2014, therefore, the tariff and prices specified in 2012 were effective for two years from November 2012 until December 2014. e. See footnote 1 of this Box.
However, tobacco taxation reform is incomplete as tariffs remain relatively low and the current multi-tiered system overly complex. Even with the new excise tariff rates, tobacco excise tax burdens are still below the maximum rate of 57 percent recommended by the Law on Excise (UU Nomor 39 Tahun 2007), and the WHO-recommended minimum of 70 percent of retail price3 (Table B.7 column vi). Moreover, the most recent regulation is silent on the simplification of the tiers among the different types of tobacco products.4 With the number of tiers maintained at 105 in 2020 and a tariff structure which has been in place since 2018, Indonesia’s tobacco taxation system will retain distortionary elements. In particular, multiple tariff tiers are prone to tax evasion risks and to downward substitution6 toward lower-priced products.7
Table B.7: Average minimum regulated retail prices, excise tariffs, and excise tax burdens
Average (IDR/stick) Unweighted average across tiers
2013 & 2014 (i)
2015 (ii)
2016 (iii)
2017 (iv)
2018 & 2019 (v)
2020 (vi)
Regulated price 508.8 574.5 759.5 816.5 887.8 1,233.0 Machine-made cigarettes 554.4 625.0 797.9 891.7 945.4 1,441.3
Hand-made cigarettes 455.7 513.9 713.5 741.3 801.3 920.6
Excise tariff 230.8 250.9 283.6 292.9 363.0 447.5 Machine-made cigarettes 297.1 316.7 362.5 400.8 449.2 568.3
Hand-made cigarettes 153.3 172.0 189.0 185.0 233.8 266.3
Excise tax burden (percent)f 45.4% 43.7% 37.3% 35.9% 40.9% 36.3% Machine-made cigarettes 53.6% 50.7% 45.4% 45.0% 47.5% 39.4%
Hand-made cigarettes 33.7% 33.5% 26.5% 25.0% 29.2% 28.9%
Source: MoF Regulations on Tobacco Excise Rates, WB staff calculations. Note: f Excise tax burden is calculated as the ratio of average nominal excise tariff over average nominal regulated price.
Higher tariffs would bring additional revenues even with lower consumption. Although higher tariffs are intended to discourage and reduce consumption of tobacco, analysis shows that at current levels there is room for the Government to generate more revenue from tobacco taxation while simultaneously reducing consumption.8 Given the relatively inelastic demand for tobacco products across the various tobacco products and income groups, many smokers would continue consuming cigarettes even at higher prices. Estimates show that an increase in tariffs by 47 percent combined with tier simplification into 6 levels, would decrease consumption by 2 percent, and increase excise revenues by 6.4 percent or to IDR 10.9 trillion (Sahadewo, et al., 2018a). Also, given the small number of producers, tobacco taxes are relatively easy to collect and administer compared to value-added and income taxes. In addition to higher government revenues and benefits to the health of smokers themselves, higher tariffs may also particularly benefit women, children and the poor. The prevalence of smoking in Indonesia varies widely by gender. While only 2 percent of women smoke, prevalence among males is 67 percent. Smoking among males leads to second-hand smoking among women, including during pregnancy, and reduces the household budget available for nutritious foods. Indeed, paternal smoking is a predictor of increased probability of short-term and chronic child malnutrition. In households where the father was a smoker, tobacco accounted for 22 percent of weekly per capita household expenditures, with less money spent on food compared with households in which the father was a non-smoker (Semba, et al., 2007). A more recent study (Dartanto, et al., 2018) confirms cigarette consumption is one of the factors driving the high stunting rate in Indonesia, finding that children living with a non-smoking father will grow 1.5 kg heavier than those living with a parent who is a chronic smoker. In addition, out-of-pocket payments for the treatment of tobacco-related diseases will likely to be higher (World Bank, 2016a). With price elasticities higher among the poor, a tax increase could be used as an instrument to improve the expenditure distribution from these households, thus improving welfare over the medium-term.9 The net impact of higher tobacco excises on employment is positive.10 Aligning tobacco taxation with tier simplification would translate into a gross loss of employment, mostly in the hand-rolled kretek industry. However, the spending on tobacco that is diverted to other commodities and more productive sectors would lead to increased output of the economy (Sahadewo, et. al. 2018c). Enabling better access to capital through improved credit schemes and promoting research of alternative crops in major producing districts could help tobacco and clove farmers transition to more profitable crops and economic activity. The Government may implement measures to reduce the impact on the tobacco workers’ livelihoods through cash transfers or expanded access to social safety nets, or alternative occupations such as retraining programs, educational grants, etc. The World Bank estimates that such compensation programs would cost only a small fraction of the revenues that will be generated from tobacco taxation reform.11 Lastly, the

I n v e s t i n g i n P e o p l e I n d o n e s i a E c o n o m i c Q u a r t e r l y
D e c e m b e r 2 0 1 9 T H E W O R L D B A N K | B A N K D U N I A
58
Government can introduce gender redistributive policies, including microcredit loans to help empower displaced female kretek workers and health-related measures to improve women and children’s wellbeing in tobacco households. 1 The Government did not change the excise tariffs and retail prices for tobacco products in PMK 156/2018 for application in 2019, therefore tariffs and prices set in PMK No. 146/2017 were effective for two years from January 2018 until December 2019. 2 Cigarette affordability is defined as the share of income required to buy a pack of cigarettes. When the annual growth rate of the nominal average price is lower than the annual growth rate of nominal GDP per capita, cigarette affordability increases, implying cigarettes become relatively less expensive (Blecher and Walbeek, 2008; Zheng, et al., 2018). 3 The WHO recommends total taxes on tobacco products—specific excise taxes, local taxes, and the value added tax—should be at least 70 percent of the retail price, whereas the estimated average total taxes rate in Indonesia is 57.4 percent. The average total tax rate on tobacco products includes: excise taxes on the cigarettes, the 9.1 percent value added tax—which is collected directly from manufacturers, and 10 percent local cigarette tax which is calculated as 10 percent of the specific excise taxes (Ahsan et.al., 2013). 4 In contrast, the 2017 regulation included a simplification roadmap that was suspended in 2018. 5 In addition, the new PMK also does not describe the production volume in sticks within each production tier. 6 However, it has been documented that cigarette consumption in 2012 trended upwards towards the higher tiers, in-line with economic growth, implying that cigarettes had become relatively more affordable (Zheng, et al., 2018). 7 A multi-tiered system increases the risk of tax evasion owing to incentives it creates for firms to lower the tax burden through application of less-expensive tobacco stamps designated for cheaper quality tobacco products on higher quality tobacco products. 8 See Fuchs and Carmen (2018) and Zheng et al., (2018) for various demand elasticities of cigarettes distinguished by products and income groups, and affordability structure. 9 Fuchs and Del Carmen (2018) estimates the price elasticities associated with tax increases, particularly on hand-rolled cigarettes and consumption by younger individuals. 10 Employment in core-tobacco sectors is directly dependent on tobacco production, such as farming and manufacturing. Historic analyses of the tobacco industry show that the industry has significantly reduced employment over time because the industry has become more capital intensive and farming has become more efficient, and that job losses which have occurred even in the absence of tobacco control measures (NCI-WHO, 2017). 11 Sahadewo, et. al., (2018a and 2018b) estimate that an increase in the excise tariff by an average of 47 percent and simplification into 6 tiers would generate additional revenues of IDR 10.9-12.9 trillion.

I n v e s t i n g i n P e o p l e I n d o n e s i a E c o n o m i c Q u a r t e r l y
D e c e m b e r 2 0 1 9 T H E W O R L D B A N K | B A N K D U N I A
59
Bibliography PART A:
Antara News. August 22, 2019. “Anggaran bansos naik sebesar Rp 3 triliun pada 2020.” https://www.antaranews.com/berita/1024268/anggaran-bansos-naik-sebesar-rp3-triliun-pada-2020
Antara News. September 11, 2019. “ India agrees to reduce export tariff on Indonesia palm oil.” https://en.antaranews.com/news/132544/india-agrees-to-reduce-export-tariff-on-indonesian-palm-oil),
APBN KITA. November 2019. https://www.kemenkeu.go.id/media/13761/apbn-kita-november-2019.pdf
Baconguis, B. 2018. “Stemming the Plastic Flood. A Break Free from Plastic Movement Report.” https://www.breakfreefromplastic.org/wp-content/uploads/2018/04/Stemming-the-plastic-flood-report.pdf
Bank Indonesia. November 8, 2019. “Neraca Pembayaran Indonesia.” https://www.bi.go.id/id/publikasi/neraca-pembayaran/Pages/npitw319.aspx
BIO Intelligence Service. 2011. Assessment of impacts of options to reduce the use of single-use plastic carrier bags. Final Report prepared for European Commission-DG Environment. https://ec.europa.eu/environment/waste/packaging/pdf/report_options.pdf
Bisnis. May 26, 2019. “TNP2K Evaluasi Uji Coba Penyaluran LPG Gas 3Kg.” https://ekonomi.bisnis.com/read/20190526/44/927385/tnp2k-evaluasi-uji-coba-penyaluran-lpg-3kg
Bisnis. September 30, 2019. “Setoran Surplus BI dan Dividen BUMN Topang Kinerja PNBP.” https://ekonomi.bisnis.com/read/20190930/10/1153659/setoran-surplus-bi-dan-dividen-bumn-topang-kinerja-pnbp
Bloomberg. October 28, 2019. “Indonesia Suspends Nickel Ore Exports With Immediate Effect.” https://www.bloomberg.com/news/articles/2019-10-28/indonesia-bans-nickel-ore-exports-with-immediate-effect
CNBC Indonesia. August 16, 2019. “Mengejar Penerimaan Perpajakan Rp 1.819,2 T di 2020, sanggup?” https://www.cnbcindonesia.com/news/20190816172700-4-92623/mengejar-penerimaan-perpajakan-rp-18192-t-di-2020-sanggup
CNBC. August 23, 2019. “Global LNG-Asian prices steady as heat in Japan bolsters demand.” https://www.cnbc.com/2019/08/23/reuters-america-global-lng-asian-prices-steady-as-heat-in-japan-bolsters-demand.html
CNN Indonesia. September 23, 2019. “Penderita ISPA akibat Karhutla tembus 919 ribu orang.” https://www.cnnindonesia.com/nasional/20190923160933-20-433052/penderita-ispa-akibat-karhutla-tembus-919-ribu-orang.
Convery, F., S. McDonnel, and S. Ferreira. 2007. “The Most Popular Tax in Europe? Lessons from the Irish Plastic Bags Levy.” Environmental Resource Economics, 38: pp. 1–11. https://www.researchgate.net/publication/5146973_The_Most_Popular_Tax_in_Europe_Lessons_from_the_Irish_Plastic_Bags_Levy
de Freytas-Tamura, K. 2017. “Public Shaming and Even Prison for Plastic Bag Use in Rwanda.” New York Times. October 28. https://www.nytimes.com/2017/10/28/world/africa/rwanda-plastic-bags-banned.html.
Earth Policy Institute. 2014. “Plastic Bags.” http://www.earth-policy.org/datacenter/xls/update123_all.xlsx
Economic Commission for Latin America and the Caribbean (ECLAC). 2014. Handbook for Disaster Assessment. http://caribbean.eclac. org/content/handbook-disaster-assessment.

I n v e s t i n g i n P e o p l e I n d o n e s i a E c o n o m i c Q u a r t e r l y
D e c e m b e r 2 0 1 9 T H E W O R L D B A N K | B A N K D U N I A
60
Ellen MacArthur Foundation. 2016. The New Plastics Economy—Rethinking the Future of Plastics. Cowes, UK. https://www.ellenmacarthurfoundation.org/assets/downloads/EllenMacArthurFoundation_TheNewPlasticsEconomy_Pages.pdf
Gabungan Pengusaha Kelapa Sawit Indonesia (GAPKI). 2019. “GAPKI & JAPBUSI Berkomitmen Kuat Tingkatkan Kesejahteraan Petani Sawit.” https://gapki.id/news/14768/gapki-japbusi-berkomitmen-kuat-tingkatkan-kesejahteraan-petani-sawit
Homonoff, T. 2018. “Can Small Incentives Have Large Effects? The Impact of Taxes versus Bonuses on Disposable Bag Use.” American Economic Journal: Economic Policy, 10(4): 177–210.
Jambeck, J. R., R. Geyer, C. Wilcox, T. R. Siegler, M. Perryman, A. Andrady, R. Narayan, and K. L. Law. 2015. “Plastic Waste Inputs from Land into the Ocean.” Science 347 (6223): 768–71. https://www.iswa.org/fileadmin/user_upload/Calendar_2011 03 AMERICANA/Science-2015-Jambeck-768-71__2_.pdf
Kaza, S., L. C. Yao, P. Bhada-Tata, F. Van Woerden. 2018. What a Waste 2.0: A Global Snapshot of Solid Waste Management to 2050. Urban Development. Washington, DC: World Bank. https://openknowledge.worldbank.org/handle/10986/30317
Kontan. December 10, 2018. “DAU 2019 bersifat final, berikut gambaran skemanya.” ttps://nasional.kontan.co.id/news/dau-2019-bersifat-final-berikut-gambaran-skemanya
Kumparan. July 17, 2019. “Cukai Rokok Melesat di Semester I 2019, Capai Rp 63,8 Triliun. https://kumparan.com/kumparanbisnis/cukai-rokok-melesat-di-semester-i-2019-capai-rp-63-8-triliun-1rU4lvra2Cv
Making Oceans Plastic Free Initiative. 2017. “The Hidden Cost of Plastic Bag Use and Pollution in Indonesia.” https://makingoceansplasticfree.com/hidden-cost-plastic-bag-use-pollution-indonesia/
Media Indonesia. October 3, 2019. “Porsi Swasta Lebih Besar di Proyek Infrastruktur.” https://mediaindonesia.com/read/detail/263074-porsi-swasta-lebih-besar-di-proyek-infrastruktur
Merdeka. September 4, 2019. “Subsidi Dicabut, Tarif Listrik Pelanggan 900 VA Naik Mulai Januari 2020.” https://www.merdeka.com/uang/subsidi-dicabut-tarif-listrik-pelanggan-900-va-naik-mulai-januari-2020.html
Mongabay. August 23, 2019. “Indonesia eyes palm oil export boost to China amid mounting U.S. trade war.” https://news.mongabay.com/2019/08/indonesia-eyes-palm-oil-export-boost-to-china-amid-mounting-u-s-trade-war/
PPID.KLHK. July 3, 2018. Siaran Pers: “KLHK Gelorakan Pengurangan Sampah Kantong Plastik.” http://ppid.menlhk.go.id/siaran_pers/browse/1320
Quartz India. September 18, 2019. “Coal imports by Indian power plants are growing at the fastest rate in five years.” https://qz.com/india/1710880/indian-coal-imports-rise-as-power-plants-face-cil-output-crunch/
Realita Rakyat (RR.com). November 5, 2019. “Industri Pengolahan Sumbang 19,62 Persen PDB.” https://www.realitarakyat.com/2019/11/05/industri-pengolahan-sumbang-1962-persen-pdb/
Republika. November 19, 2019. “Januari 2020: Iuran BPJS Naik, Subsidi Listrik 900VA Dicabut.” https://nasional.republika.co.id/berita/q17afd409/januari-2020-iuran-bpjs-naik-subsidi-listrik-900va-dicabut
Reuters. August 14, 2019. “China’s July steel output eases on environmental curbs, shringking margins.” https://www.reuters.com/article/us-china-economy-output-steel/chinas-july-steel-output-eases-on-environmental-curbs-shrinking-margins-idUSKCN1V4062
Reuters. August 19, 2019. “UPDATE 1-Top natural rubber producers ending export curbs-sources.” https://www.reuters.com/article/asia-rubber/update-1-top-natural-rubber-producers-ending-export-curbs-sources-idUSL4N25F1MX

I n v e s t i n g i n P e o p l e I n d o n e s i a E c o n o m i c Q u a r t e r l y
D e c e m b e r 2 0 1 9 T H E W O R L D B A N K | B A N K D U N I A
61
Reuters. August 24, 2019. “Indonesia’s Pertamina considers exporting jet fuel due to high stock.” https://af.reuters.com/article/commoditiesNews/idAFL3N25M2Q9
Robert, Roberts, M., F. Gil Sander, S. Tiwari. 2019. “Drivers of Urban and Spatial Exclusion”. In Time to ACT: Realizing Indonesia's Urban Potential. Washington, DC: World Bank
Sahadewo, G. A., P. V. Marquez, R. Iglesias, E. C. Araujo, N. Nargis, P. Harimurti, J. Drope, Q. Li, J. Durazo, F. Witoelar, and B. Sikoki. 2018. “The Economics of Tobacco Taxation and Employment in Indonesia.” Global Tobacco Control Program (June), Washington, DC: World Bank.
Setiawan, T., and S. Rizal. 2018. Economic and Social Mobility in Indonesia.
Shuker, Iain G.; Cadman, Cary Anne. 2018. Indonesia - Marine debris hotspot rapid assessment : synthesis report (English). Washington, D.C. : World Bank Group.
Swarna News. November 6, 2019. “Karhutla ‘Bikin Sakit’ Ekonomi Sosial.” https://www.swarnanews.co.id/2019/11/06/karhutla-bikin-sakit-ekonomi-sumsel/
Taylor, R. L. and S. Villas-Boas. 2015. “Bans vs Fees: Disposable Carryout Bag Policies and Bag Usage.” Applied Economic Perspectives and Policy 38(2): 351–372.
Tempo. March 20, 2019. “Intip Besaran Gaji PNS 2019 Setelah Dinaikkan Jokowi.” https://bisnis.tempo.co/read/1187188/intip-besaran-gaji-pns-2019-setelah-dinaikkan-jokowi/full&view=ok
Mercury News. November 13, 2017. “Success! California’s First in the Nation Plastic Bag Ban Works.” https://www.mercurynews.com/2017/11/13/editorial-success-californias-first-in-the-nation -plastic-bag -ban-works/
The Jakarta Post. September 13, 2019. “Freeport’s copper export quota triples to 700,000 tons.” https://www.thejakartapost.com/news/2019/09/13/freeports-copper-export-quota-triples-to-700000-tons.html
The Jakarta Post. November 22, 2019. “BKPM to take over business licenses.” https://www.thejakartapost.com/news/2019/11/22/bkpm-take-over-business-licenses.html
The Jakarta Post. December 2, 2019. “Reforms to boost economy taking shape.” https://www.thejakartapost.com/news/2019/12/02/reforms-to-boost-economy-taking-shape.html
Tirto. August 28, 2019. “Pendapatan Negara dari Cukai Rokok Sudah Rp77T Per Agustus 2019.” https://tirto.id/pendapatan-negara-dari-cukai-rokok-sudah-rp77-t-per-agustus-2019-ehbv
UNEP. 2019. Single-Use Plastics: A Roadmap for Sustainability. United Nations Environment Programme. https://wedocs.unep.org/bitstream/handle/20.500.11822/25496/singleUsePlastic_sustainability.pdf?isAllowed=y&sequence=1
United States NOAA n.d. What Are Microplastics. United States NOAA (National Oceanic and Atmospheric Administration). Washington, DC. https://oceanservice.noaa.gov/facts/microplastics.html.
Villarreal, P. and B. Feigrnbaum. August 2012. “A Survey on the Economic Effects of Los Angeles County’s Plastic Bag Ban.” National Center For Policy Analysis. Policy Report No.340. http://www.ncpathinktank.org/pdfs/st340.pdf
World Bank. 2014. Indonesia Economic Quarterly: Hard choices. July. Jakarta.
____. 2015. Indonesia Economic Quarterly: Reforming amid uncertainty. December. Jakarta.
____. 2016. The Cost of Fire 2015: An Economic Analysis of Indonesia’s 2015 Fire Crisis. Indonesia Sustainable Landscape Knowledge Note: 1. http://pubdocs.worldbank.org/en/643781465442350600/Indonesia-forest-fire-notes.pdf
____. 2017. Indonesia Economic Quarterly: Upgraded. June. Article 2,”What drives FDI in Indonesia?” December. Jakarta. https://openknowledge.worldbank.org/bitstream/handle/10986/30841/131838.pdf?sequence=1&isAllowed=y

I n v e s t i n g i n P e o p l e I n d o n e s i a E c o n o m i c Q u a r t e r l y
D e c e m b e r 2 0 1 9 T H E W O R L D B A N K | B A N K D U N I A
62
____. 2018. Indonesia Economic Quarterly:Strengthening competitiveness. December. Jakarta
____. 2019a. Commodity Market Outlook. Washington, DC: World Bank.
____. 2019b. Indonesia Economic Quarterly: Oceans of Opportunity. June. Jakarta. http://www.worldbank.org/en/country/indonesia/publication/indonesia-economic-quarterly-reports
____. 2019c. The Promise of Education in Indonesia. Jakarta: World Bank. http://documents.worldbank.org/curated/en/968281574095251918/pdf/Overview.pdf
____. 2019d. Aspiring Indonesia: Expanding the Middle Class. Forthcoming. Jakarta: World Bank.
World Resource Institute (WRI). August 14, 2018. “Indonesia's Deforestation Dropped 60 Percent in 2017, but There's More to Do.” https://www.wri.org/blog/2018/08/indonesias-deforestation-dropped-60-percent-2017-theres-more-do
PART B:
Ahsan, A. Ir. N. Wiyono. 2007. “The impact analysis of higher cigarette prices to employment in Indonesia.” Demographic Institute, Faculty of Economics. University of Indonesia.
Ahsan, A., Nur Hadi Wiyono, Ayke Soraya Kiting, Triasih Djutaharta, and Flora Aninditya. 2013. “Impact of Increasing Tobacco Tax on Government Revenue and Tobacco Consumption.” SEADI Discussion Paper, Support for Economic Analysis Development in Indonesia Project. Washington, D.C.: United States Agency for International Development
Banerjee, V.A., R. Hanna, G.E. Kreindler., and B.A. Olken. 2017. “Debunking the Stereotype of the Lazy Welfare Recipient: Evidence from Cash Transfer Programs.” World Bank Research Observer, Vol. 32 (2): 155-184, August 2017. https://www.researchgate.net/publication/320709235_Debunking_the_Stereotype_of_the_Lazy_Welfare_Recipient_Evidence_from_Cash_Transfer_Programs.
Blecher, E. H., and C. P. van Walbeek. 2008. “An Analysis of Cigarette Affordability.” International Union against Tuberculosis and Lung Disease. Paris.
BNPB. 2019. Jakarta: Badan Nasional Penanggulangan Bencana. http://dibi.bnpb.go.id/
Bappenas. 2019. “Indonesia Vision 2045.” Jakarta: Kementerian Perencanaan Pembangunan Nasional. https://www.bappenas.go.id/id/berita-dan-siaran-pers/jakarta-menteri-ppnkepala-bappenas-bambang-brodjonegoro-berbicara-mengenai-pentingnya-penyelarasan-visi-indonesia-2045-dengan-vi/
Cahyadi, N., R. Hanna, B.A. Olken, R. Adi Prima, E. Setiawan and E. Syamsulhakim. 2018. “The Cumulative Impacts of Conditional Cash Transfer Programs: Experimental Evidence from Indonesia.” NBER Working Paper No. 24670. http://www.nber.org/papers/w24670.pdf
Dartanto, Teguh, Faizal Rahmanto Moeis, Renny Nurhasana, Aryana Satrya, and Hasbullah Thabrany. 2018. “Parent smoking behavior and children’s future development: Evidence from Indonesia Family Life Survey (IFLS).” 14th Annual Conference of the International Society for the Prevention of Tobacco Induced Diseases (October), ISPTID, Izmir, Turkey.
Fuchs, A., and G. Del Carmen. 2018. “The Distributional Effects of Tobacco Taxation: The Evidence of White and Clove Cigarettes in Indonesia.” June 23. Washington, D.C.: World Bank.
Harimurti, P., E. Pambudi, A. Pigazzini, and A. Tandon. 2013. “The nuts and bolts of Jamkesmas - Indonesia's government-financed health coverage program for the poor and near-poor.” Universal Health Coverage (UNICO) studies series, no. 8. Washington, D.C.: World Bank.
National Cancer Institute in collaboration with World Health Organization (NCI-WHO). 2017. The Economics of Tobacco and Tobacco Control. NCI Tobacco Control Monograph Series. US Department of Health and Human Services.

I n v e s t i n g i n P e o p l e I n d o n e s i a E c o n o m i c Q u a r t e r l y
D e c e m b e r 2 0 1 9 T H E W O R L D B A N K | B A N K D U N I A
63
Peraturan Menteri Keuangan Nomor 152/PMK.010/2019 Tahun 2019 tentang Perubahan Kedua atas Peraturan Menteri Keuangan Nomor 146/PMK.010/2017 tentang Tarif Cukai Hasil Tembakau.
Peraturan Menteri Keuangan Nomor 156/PMK.010/2018 Tahun 2018 tentang Perubahan Pertama atas Peraturan Menteri Keuangan Nomor 146/PMK.010/2017 tentang Tarif Cukai Hasil Tembakau.
Peraturan Menteri Keuangan Nomor 146/PMK.010/2017 Tahun 2017 tentang Tarif Cukai Hasil Tembakau.
Packard, T., U. Gentilini, M. Grosh, P. O’Keefe, R. Palacios, D. Robalino, and I. Santor. 2019. Protecting All: Risk-sharing for a Diverse and Diversifying World of Work. Human Development Perspectives. Washington D.C: World Bank. http://documents.worldbank.org/curated/en/997741568048792164/pdf/Protecting-All-Risk-Sharing-for-a-Diverse-and-Diversifying-World-of-Work.pdf
Rush, J. V. 2013. The Impact of Natural Disaster on Poverty in Indonesia. https://pdfs.semanticscholar.org/8888/ebd41d4d478caaebe5b762ede0e67eda9174.pdf
Sahadewo, G.A., P. V. Marquez, R. Iglesias, E.C. Araujo, N. Nargis, P. Harimurti, J. Drope, Qing Li, J. Durazo, F. Witoelar, and B. Sikoki. 2018a. “The Economics of Tobacco Taxation and Employment in Indonesia.” Global Tobacco Control Program. June. Washington, D.C.: World Bank.
_________. 2018b. “The Economics of Kretek Rolling in Indonesia.” Global Tobacco Control Program (June). Washington, D.C.: World Bank.
_________. 2018c. “The Economics of Clove Farming in Indonesia.” Global Tobacco Control Program (June). Washington, D.C.: World Bank.
Semba, Richard D., Leah M. Kalm, Saskia de Pee, and Michelle O. Ricks. 2007. “Paternal smoking is associated with increased risk of child malnutrition among poor urban families in Indonesia.” Cambridge, UK: Cambridge University Press.
Tandon, A., E.S. Pambudi, P. Harimurti, E. Masaki, A.W. Subandoro, P.Y. Chrysanti, V.S. Rajan, D. W. Dorkin, A. Chandra, C. Boudreaux, M. Chew Pei Lyn, and N. Suharno. 2016. “Indonesia - Health financing system assessment : spend more, right, and better.” Washington, D.C. : World Bank Group. http://documents.worldbank.org/curated/en/453091479269158106/Indonesia-Health-financing-system-assessment-spend-more-right-and-better
Tohari, A., C. Parsons, A. Rammohan. 2019. “Targeting poverty under complementarities: Evidence from Indonesia’s unified targeting system.” Journal of Development Economics. Elsevier, Vol.C: 127-144.
Undang-Undang Republik Indonesia Nomor 39 Tahun 2007 tentang Perubahan atas Undang-Undang Nomor 11 Tahun 1995 tentang Cukai.
World Bank. 2016a. Indonesia Health Financing System Assessment: Spend More, Right and Better. Washington, D.C. World Bank Group. Available at: https://openknowledge.worldbank. org/handle/10986/25363.
World Bank. 2016b. Indonesia’s Rising Divide. Washington, D.C. : World Bank Group. http://pubdocs.worldbank.org/en/16261460705088179/Indonesias-Rising-Divide-English.pdf
_________. 2017. Social Assistance Public Expenditure Review Update: Towards a comprehensive, integrated, and effective social assistance system in Indonesia. Washington, D.C. : World Bank Group.
_________. 2018a. The State of Social Safety Nets 2018. Washington, D.C: World Bank.
_________. 2018b. Indonesia Economic Quarterly: Towards inclusive growth. March. Jakarta: World Bank.
_________. 2018c. “Economics of tobacco taxation and employment in Indonesia.” Washington, D.C. : World Bank Group.
_________.2018d. “The Economics of Kretek Rolling in Indonesia.” Global Tobacco Control Program. June. Washington, D.C.: World Bank.

I n v e s t i n g i n P e o p l e I n d o n e s i a E c o n o m i c Q u a r t e r l y
D e c e m b e r 2 0 1 9 T H E W O R L D B A N K | B A N K D U N I A
64
_________. 2018f. “The Economics of Tobacco Farming in Indonesia.” Global Tobacco Control Program. June. Washington, D.C.: World Bank.
_________. 2019a. “Build, Employ and Protect: Using Social Protection to Invest in People in a Changing World.” Blog Post. https://www.worldbank.org/en/news/immersive-story/2019/07/29/build-employ-and-protect-using-social-protection-to-invest-in-people-in-a-changing-world
_________. 2019b. World Development Report 2019: The Changing Nature of Work. Washington, D.C: World Bank. http://documents.worldbank.org/curated/en/816281518818814423/pdf/2019-WDR-Report.pdf
_________. 2019c. Aspiring Indonesia: Expanding the Middle Class. Forthcoming. Jakarta: World Bank.
_________. 2019d. Public Expenditure Review – Overview. Forthcoming. Jakarta: World Bank.
Zheng, Rong, Patricio V. Marquez, Abdillah Ahsan, Yang Wang, and Xiao Hu. 2018. “Cigarette Affordability in Indonesia: 2002–2017.” Global Tobacco Control Program. May. Washington, DC.: World Bank.

I n v e s t i n g i n P e o p l e I n d o n e s i a E c o n o m i c Q u a r t e r l y
D e c e m b e r 2 0 1 9 T H E W O R L D B A N K | B A N K D U N I A
65
APPENDIX: A SNAPSHOT OF INDONESIAN ECONOMIC INDICATORS Appendix Table 1: Budget outcomes (IDR trillion)
2012 2013 2014 2015 2016 2017 2018
Actual Actual Actual Actual Actual Actual Actual
A. State revenue and grants 1,338 1,439 1,550 1,508 1,556 1,666 1,944 1. Tax revenue 981 1,077 1,147 1,240 1,285 1,344 1,519 2. Non-tax revenue 352 355 399 256 262 311 409
B. Expenditure 1,491 1,651 1,777 1,807 1,864 2,007 2,213 1. Central government 1,011 1,137 1,204 1,183 1,154 1,265 1,455 2. Transfers to the regions 481 513 574 623 710 742 758
C. Primary balance -53 -99 -93 -142 -126 -124 -11 D. SURPLUS / DEFICIT -153 -212 -227 -298 -308 -341 -269 (percent of GDP) -1.8 -2.2 -2.1 -2.6 -2.5 -2.5 -1.8
Source: MoF; World Bank staff calculations Note: Budget balance as percentage of GDP uses the revised and rebased GDP
Appendix Table 2: Balance of payments (USD billion)
2016 2017 2018
2018 2019
Q1 Q2 Q3 Q4 Q1 Q2 Q3 Balance of payments 12.1 11.6 -7.1 -3.9 -4.3 -4.4 5.4 2.4 -2.0 0.0
Percent of GDP 1.3 1.1 -0.7 -1.5 -1.6 -1.7 2.1 0.9 -0.7 0.0 Current account -17.0 -16.2 -30.5 -5.0 -7.8 -8.5 -9.2 -6.7 -8.2 -7.7
Percent of GDP -1.8 -1.6 -2.9 -1.9 -3.0 -3.2 -3.6 -2.5 -2.9 -2.7 Trade balance 8.2 11.4 -6.9 0.9 -1.4 -2.3 -4.2 -0.4 -1.4 -1.0 Net income & current transfers -25.2 -27.6 -23.6 -5.9 -6.4 -6.2 -5.0 -6.3 -6.7 -6.6 Capital & Financial Account 29.3 28.7 24.9 2.2 3.1 4.0 15.6 10.1 6.5 7.6
Percent of GDP 3.1 2.8 2.4 0.9 1.2 1.5 6.1 3.8 2.3 2.7 Direct investment 16.1 18.5 13.3 4.8 2.4 4.5 1.6 5.8 5.4 4.8 Portfolio investment 19.0 21.1 9.3 -1.1 0.1 -0.1 10.5 5.2 4.6 4.8 Other investment -5.8 -10.7 2.2 -1.5 0.6 -0.5 3.6 -1.1 -3.5 -2.1 Errors & omissions -0.3 -1.0 -1.5 -1.1 0.4 0.1 -1.0 -0.9 -0.3 0.0 Foreign reserves* 116.4 130.2 120.7 126.0 119.8 114.8 120.7 124.5 123.8 124.3
Source: BI; BPS; World Bank staff calculations Note: *Reserves at end-period

I n v e s t i n g i n P e o p l e I n d o n e s i a E c o n o m i c Q u a r t e r l y
D e c e m b e r 2 0 1 9 T H E W O R L D B A N K | B A N K D U N I A
66
Appendix Table 3: Indonesia’s historical macroeconomic indicators at a glance 2000 2011 2012 2013 2014 2015 2016 2017 2018
National Accounts (% change)1 Real GDP 4.9 6.2 6.0 5.6 5.0 4.9 5.0 5.1 5.2
Real investment 11.4 8.9 9.1 5.0 4.4 5.0 4.5 6.2 6.7 Total consumption 4.6 5.1 5.4 5.7 4.7 4.9 4.3 4.6 5.1
Private 3.7 5.1 5.5 5.5 5.3 4.8 5.0 5.0 5.1 Government 14.2 5.5 4.5 6.7 1.2 5.3 -0.1 2.1 4.8
Real exports, GNFS 30.6 14.8 1.6 4.2 1.1 -2.1 -1.7 8.9 6.5 Real imports, GNFS 26.6 15.0 8.0 1.9 2.1 -6.2 -2.4 8.1 12.0 Investment (% GDP) 19.9 31.3 32.7 32.5 32.4 32.4 32.2 32.6 33.0
Nominal GDP (USD billion) 165 893 918 915 891 861 932 1,015 1,042 GDP per capita (USD) 857 3,688 3,741 3,668 3,532 3,370 3,602 3,877 3,932 Central Government Budget (% GDP)2 Revenue and grants 13.9 15.5 15.5 15.1 14.7 13.1 12.5 12.3 13.1
Tax revenue 7.8 11.2 11.4 11.3 10.9 10.8 10.4 9.9 10.2 Non-tax revenue 6.0 4.2 4.1 3.7 3.8 2.2 2.1 2.3 2.8
Expenditure 15.0 16.5 17.3 17.3 16.8 15.7 15.0 14.8 14.9 Consumption 2.7 3.8 3.9 4.1 4.0 4.5 4.6 4.4 4.7 Capital 1.7 1.5 1.7 1.9 1.4 1.9 1.4 1.5 1.2 Interest 3.4 1.2 1.2 1.2 1.3 1.4 1.5 1.6 1.7 Subsidies 4.2 3.8 4.0 3.7 3.7 1.6 1.4 1.2 1.5
Budget balance -1.1 -1.1 -1.8 -2.2 -2.1 -2.6 -2.5 -2.5 -1.8 Government debt 97.9 23.1 23.0 24.9 24.7 27.5 28.3 29.4 29.8
o/w external government debt 51.4 10.8 10.6 13.6 11.4 12.7 12.3 12.4 12.5 Total external debt (including private sector) 87.1 25.2 27.5 29.1 32.9 36.1 34.3 36.8 39.4 Balance of Payments (% GDP)3 Overall balance of payments .. 1.3 0.0 -0.8 1.7 -0.1 1.3 1.1 -0.7 Current account balance 4.8 0.2 -2.7 -3.2 -3.1 -2.0 -1.8 -1.6 -3.0
Exports GNFS 42.8 23.8 23.0 22.5 22.3 19.9 18.0 19.1 20.0 Imports GNFS 33.9 21.2 23.2 23.2 22.7 19.3 17.1 18.0 20.7 Trade balance 8.9 2.7 -0.2 -0.7 -0.3 0.6 0.9 1.1 -0.7
Financial account balance .. 1.5 2.7 2.4 5.0 2.0 3.1 2.8 2.4 Direct investment -2.8 1.3 1.5 1.3 1.7 1.2 1.7 1.8 1.3
Gross official reserves (USD billion) 29.4 110 113 99 112 106 116 130 121 Monetary (% change)3 GDP deflator1 20.4 7.5 3.8 5.0 5.4 4.0 2.4 4.3 3.8 Bank Indonesia benchmark policy rate (%) .. .. .. .. .. 6.3 4.8 4.3 6.0 Domestic credit (eop) .. 24.6 23.1 21.6 11.6 10.4 7.9 8.2 11.8 Nominal exchange rate (average, IDR/USD) 8,392 8,776 9,384 10,460 11,869 13,389 13,309 13,381 14,238 Prices (% change)1 Consumer price Index (eop) 9.4 3.8 3.7 8.1 8.4 3.4 3.0 3.6 3.1 Consumer price Index (average) 3.7 5.3 4.0 6.4 6.4 6.4 3.5 3.8 3.2 Indonesia crude oil price (USD per barrel, eop)4 28 112 113 107 60 36 51 61 55
Source: 1 BPS and World Bank staff calculations, using revised and 2010 rebased figures. 2 MoF and World Bank staff calculations, 3 BI, 4 CEIC

I n v e s t i n g i n P e o p l e I n d o n e s i a E c o n o m i c Q u a r t e r l y
D e c e m b e r 2 0 1 9 T H E W O R L D B A N K | B A N K D U N I A
67
Appendix Table 4: Indonesia’s development indicators at a glance (USD billion) 2000 2010 2011 2012 2013 2014 2015 2016 2017 2018
Demographics1
Population (million) 212 242 245 248 252 255 258 262 265 268
Population growth rate (%) 1.4 1.3 1.3 1.4 1.3 1.3 1.3 1.2 1.2 1.1
Urban population (% of total) 42 50 51 51 52 53 53 54 55 55
Dependency ratio (% of working-age population) 55 51 51 50 50 49 49 49 48 48 Labor Force2
Labor force, total (million) 98 117 117 120 120 122 122 125 128 131
Male 60 72 73 75 75 76 77 77 79 80
Female 38 45 44 46 45 46 46 48 49 51
Agriculture share of employment (%) 45 38 36 35 35 34 33 32 30 29
Industry share of employment (%) 17 19 21 22 20 21 22 21 22 23
Services share of employment (%) 37 42 43 43 45 45 45 47 48 48
Unemployment, total (% of labor force) 8.1 7.1 7.4 6.1 6.2 5.9 6.2 5.6 5.5 5.4 Poverty and Income Distribution3 Median household consumption (IDR 000 per month) 104 374 421 446 487 548 623 697 765 835 National poverty line (IDR 000 per month) 73 212 234 249 272 303 331 354 375 402 Population below national poverty line (million) 38 31 30 29 28 28 29 28 28 26 Poverty (% of population below national poverty line) 19.1 13.3 12.5 12.0 11.4 11.3 11.2 10.9 10.6 9.8 Urban (% of population below urban poverty line) 14.6 9.9 9.2 8.8 8.4 8.3 8.3 7.8 7.7 7.0 Rural (% of population below rural poverty line) 22.4 16.6 15.7 15.1 14.3 14.2 14.2 14.1 13.9 13.2 Male-headed households 15.5 11.0 10.2 9.5 9.2 9.0 9.3 9.0 8.7 8.0 Female-headed households 12.6 9.5 9.7 8.8 8.6 8.6 11.1 9.8 9.3 8.5 Gini index 0.30 0.38 0.41 0.41 0.41 0.41 0.41 0.40 0.39 0.39 Percentage share of consumption: lowest 20% 9.6 7.9 7.4 7.5 7.4 7.5 7.2 7.1 7.0 7.0 Percentage share of consumption: highest 20% 38.6 40.6 46.5 46.7 47.3 46.8 47.3 46.2 45.7 45.5 Public expenditure on social assistance (% of GDP)4 .. 0.4 0.5 0.5 0.7 0.6 0.8 0.7 0.7 0.7
Health and Nutrition1
Physicians (per 1,000 people) 0.16 0.14 .. 0.31 0.31 .. 0.27 .. 0.38 ..
Under five mortality rate (per 1000 children under 5 years) 52 34 33 32 30 29 28 27 26 25
Neonatal mortality rates (per 1000 live births) 23 18 17 16 16 15 14 14 13 13
Infant mortality (per 1000 live births) 41 28 27 26 25 24 24 23 22 21
Maternal mortality ratio (modeled est., per 100,000 live births) 272 228 221 214 207 199 192 184 177 ..
Measles vaccination (% of children under 2 years) 76 78 80 82 81 75 75 76 75 75
Total health expenditure (% of GDP) 2.0 3.5 3.3 3.4 3.4 3.4 3.3 3.3 .. ..
Public health expenditure (% of GDP) 0.7 0.9 0.9 1.0 1.0 1.1 1.2 1.4 1.4 1.4 Education3
Primary net enrollment rate (%) .. 92 92 93 92 93 97 97 97 98
Female (% of total net enrollment) .. 48 49 49 50 48 49 49 49 49
Secondary net enrollment rate (%) .. 61 60 60 61 65 66 66 79 79
Female (% of total net enrollment) .. 50 50 49 50 50 51 51 49 49
Tertiary net enrollment rate (%) .. 16 14 15 16 18 20 21 19 19
Female (% of total net enrollment) .. 53 50 54 54 55 56 55 53 53
Adult literacy rate (%) .. 91 91 92 93 93 95 95 96 96
Public spending on education (% of GDP)5 .. 3.1 3.3 3.3 3.3 3.3 3.5 3.4 3.1 3.0
Public spending on education (% of spending)5 .. 19.4 18.9 17.9 17.3 17.4 19.3 20.0 20.0 20.0 Water and Sanitation1
Access to at least basic drinking water services (% of population) 75 85 86 87 88 89 90 89 89 ..
Urban (% of urban population) 64 76 77 78 79 80 81 95 95 ..
Rural (% of rural population) 89 94 94 95 96 96 97 81 82 ..
Access to at least basic sanitation facilities (% of population) 44 60 62 64 65 66 68 71 73 ..
Urban (% of urban population) 28 47 49 51 53 55 57 79 80 ..
Rural (% of rural population) 66 74 74 75 76 77 77 62 65 .. Others1
Disaster risk reduction progress score (1-5 scale; 5=best) .. .. 3.3 .. .. .. .. .. .. ..
Proportion of seats held by women in national parliament (%)6 8 18 18 19 19 17 17 17 20 20
Source: 1 World Development Indicators; 2 BPS (Sakernas); 3 BPS (Susenas) and World Bank; 4 MoF and World Bank staff calculations, Social assistance includes spending on Raskin, health insurance for the poor, scholarship for the poor, family hope program (PKH), cash for work (PKT, 2018), and remaining MOSA and social protection function expenditures and actuals; 5 MoF; 6 Inter-Parliamentary Union.

Resilience through reformsJune 2016
Supported by funding from the Australian Government (Department of Foreign Affairs and Trade, DFAT), under the Support for Enhanced Macroeconomic and Fiscal Policy Analysis (SEMEFPA) program.