investing in private equity - dunedinenterprise.com/media/files/d/dunedin... · fsn investing in...
TRANSCRIPT

Investing in private equity
Dunedin Enterprise Investment Trust PLCHalf Year Report 2011

Dunedin Enterprise Investment Trust PLC specialises in the provision of private equity finance. Private equity is medium to long term finance provided in return for an equity stake in established, potentially high growth private companies.
The Company’s investment objective is to achieve substantial long term growth in its assets through capital gains from its investments.
01 Financial Highlights
02 Manager’s Review
05 Ten Largest Investments
06 Overview of Portfolio
08 Consolidated Income
Statement
10 Consolidated Statement
of Changes in Equity
11 Consolidated Balance Sheet
Contents
12 Consolidated Cash Flow
Statement
13 Responsibility Statement
of the Directors
14 Notes to the Accounts
16 Independent Review Report
17 Financial Calendar
18 Corporate Information
Objective
Dunedin Enterprise Investment Trust PLC

1 Dunedin Enterprise Investment Trust PLC
Net asset value per share increased by 5.6% to 525.0p per share in the six months to 30 June 2011
New investment of £6.8 million in the half year
Realisations of £12.2 million in the half year
Comparative Total Return Performance FTSE FTSE Small Cap All Share (ex Inv Cos) (ex Inv Cos) Periods to 30 June 2011 Net Asset value* Share price Index Index
Six months 6.3% 22.4% 2.8% 3.0%
One year 22.4% 40.7% 24.6% 25.7%
Three years 7.2% 11.1% 18.5% 21.0%
Five years 19.5% 3.0% -5.4% 24.3%
Ten years 93.7% 93.3% 22.3% 58.8%
* taken from 30 April for five and ten years
Financial Highlights

2 Dunedin Enterprise Investment Trust PLC
Overview In the six months to 30 June 2011, Dunedin Enterprise’s unaudited net asset value increased from £150.1m at 31 December 2010 to £158.4m. The net asset value per share increased from 497.3p to 525.0p. This is an increase of 5.6% and when dividends paid in the half year are included this equates to a total return of 6.3%.
During the six months to 30 June 2011 the share price of Dunedin Enterprise increased by 21.0% from 300p to 363p. The FTSE Small Cap index rose by 1.0% over the same period. The share price of 363p equates to a discount of 30.9% to net asset value and has reduced from 39.7% at 31 December 2010. Discounts throughout the sector generally remain high.
In the six months to 30 June 2011 Dunedin Enterprise invested a total of £6.8m and realised £12.2m from investments. Realisations in the half year generated a loss of £0.3m over opening valuations.
The Company had outstanding commitments to limited partnership funds of £72.8m at 30 June 2011.
Net asset and cash movements in the half year to 30 June 2011
The movement in net asset value is summarised in the table below:-
£’m
Net asset value at 31 December 2010 150.1
Unrealised value increases 12.6
Unrealised value decreases (3.4)
Realised loss over opening valuation (0.3)
Dividends paid to shareholders (1.1)
Other movements 0.5
Net asset value at 30 June 2011 158.4
Cash movements in the half year to 30 June 2011 can be summarised as follows:-
£’m
Cash and near cash balances at 31 December 2010 29.1
Investments made (6.8)
Investments recognised at 31 December 2010* (6.1)
Investments realised 12.2
Dividends paid to shareholders (1.1)
Operating activities 0.6
Cash and near cash balances at 30 June 2011 27.9
* Investments recognised at 31 December 2010 for which funds drawn post 31 December 2010
Portfolio composition and movementsDunedin Enterprise holds investments in unquoted companies through:-• Dunedinmanagedfunds(includingdirect
investments),• thirdpartymanagedfunds,• Europeanlistedprivateequity
(now realised),• SWIPPrivateEquityFundofFunds,and• legacytechnologyfunds.
Manager’s Review

3 Dunedin Enterprise Investment Trust PLC
In the half year a total of £6.8m was invested by Dunedin Enterprise. The majority of new investment activity was for drawdowns by the European third party managed funds. The most significant drawdowns were made by FSN Capital III (£2.5m), Capiton IV (£2.2m) and Innova/5 (£1.0m). These investments diversify the geographical spread of the portfolio with FSN investing in the Nordic countries, Capiton in Germany and Innova in Central and Eastern Europe.
In the six months to 30 June 2011 a total of £12.2m was realised from investments. As previously noted in the Annual Report to 31 December 2010, the entire remaining holding of European listed securities was realised in January 2011. This generated proceeds of £11.2m, a value £0.4m less than the 31 December 2010 valuation. These holdings were realised to fund new investments by the Dunedin managed and European third party managed funds.
On 2 July 2011 an investment of £8.0m was made in Red Commerce through Dunedin Buyout Fund II LP (“DBFII”). DBFII invested a total of £27.0m for a majority stake in the
company. Red Commerce is a global supplier of SAP experts to international corporations and consultancies. It was founded in 2000, and now has a global footprint with access to over 20,000 SAP experts in 80 countries, and offices in the UK, Germany, France, Scandinavia, Switzerland and Brazil.
Unrealised movements in valuationUnrealised movements in portfolio company valuations in the half year totalled £9.2m. The largest increases within this total were in the valuationofCapula(£3.0m)andWFEL(£2.2m). Capula has benefited from a strong level of new order generation from utility companies for their real time automation systems.WFELhasbenefitedfromstrongcash generation on mature contracts where payment from the customer is back ended.
Thelargestinvestmentintheportfolio,SWIPPrivate Equity Fund of Funds, showed a £1.9m increase in value during the half year. TheSWIPportfolioconsistsofcommitmentsto 72 private equity funds and with an interest in 580 underlying companies. During the half year the net asset value per share increased from €0.76 to €0.82. This increase in net asset
The portfolio movements can be analysed as shown in the table below:-
Valuation Additions Disposals Realised Unrealised Valuation at 31-12-10 in half year in half year movement movement at 30-6-11 £’m £’m £’m £’m £’m £’m
Dunedin managed 87.2 0.8 – 0.1 5.1 93.2
Third party managed 12.5 6.0 (0.9) – 1.8 19.4
European listed private equity 11.6 – (11.2) (0.4) – –
SWIPPrivate Equity Fund of Funds 14.4 – – – 1.9 16.3
Legacy technology funds 1.7 – (0.1) – 0.4 2.0
127.4 6.8 (12.2) (0.3) 9.2 130.9

4 Dunedin Enterprise Investment Trust PLC
value reflected strong revenue and earnings growth from within the portfolio and a number of realisations at meaningful uplifts to carrying values. This holding whilst listed has minimal liquidity and is therefore expected to be held for the foreseeable future.
The other principal valuation increases within the portfolio were at Practice Plan (£1.6m) and within the European funds, Realza (£1.0m) and Egeria (£0.9m). The valuation of one portfolio company within the Realza fund has benefitted from a significant de-gearing leading to a valuation increase. A number of the portfolio companies within Egeria have moved from cost to an earnings based valuation.
The principal valuation decreases were at RSL (£1.7m) and Formaplex (£0.9m). RSL is experiencing challenging market conditions as the NHS continues to exert pricing pressure on its suppliers. Trading at Formaplex has been impacted by inefficiencies in one area of the business which are being addressed. The Manager remains supportive of both these companies.
Foreign exchange movements accounted for £1.3m of the net portfolio valuation movement of £8.9m.
The average earnings multiple applied to the valuation of the Dunedin managed portfolio was 6.6x EBITDA (31 December 2010: 6.4x) or 8.1x EBITA (31 December 2010: 7.8x). These multiples are applied to the maintainable earnings of portfolio companies. WithintheDunedinmanagedportfolio,theweighted average gearing of the companies was 1.5x EBITDA (31 December 2010: 1.7x) or 1.9x EBITA (31 December 2010: 2.1x).
The total value of accrued interest included in valuations at 30 June 2011 was £10.7m (31 December 2010: £8.2m).
The portfolio continues to be valued in accordance with the International Private Equity Venture Capital valuation guidelines.
The principal risks which the Company faces include continued weakness and volatility in the financial markets, currency movements and some portfolio companies facing difficult trading conditions.
The Board and the Manager remain satisfied with the balance between cash resources and outstanding commitments to limited partnership funds given the expected rate of new investment and therefore continues to adopt a going concern basis in preparing the half year report and accounts.
OutlookWhilsttheoutlookfortheeconomyinboththeUK and Europe remains uncertain, the quality and quantity of deal flow is stronger than it was in the corresponding period last year. There still remains however substantial competition for deals from both the Private Equity sector and from well funded trade buyers. The Dunedin managed portfolio is well positioned with 10 out of 13 portfolio companies budgeting for increased profits and the remaining three budgeting for flat profits.
Dunedin Capital Partners Limited3 August 2011
Manager’s Review continued

5 Dunedin Enterprise Investment Trust PLC
Approx. Percentage percentage Cost of Directors’ of net of equity investment valuation assets Company name % £’000 £’000 %
SWIPPrivateEquityFundofFundsIIPLC 4.0 15,025 16,292 10.3
Practice Plan Holdings Limited 26.2 10,402 14,911 9.4
OSS Environmental Holdings Limited 40.2 5,951 11,443 7.2
CitySprint (UK) Group Limited 11.9 9,838 10,755 6.8
WFELHoldingsLimited 23.2 7,340 9,907 6.3
Weldex(International)Offshore Holdings Limited 15.1 9,505 9,765 6.2
Capula Group Limited 37.5 8,419 7,468 4.7
etc.venues Group Limited 27.9 3,388 7,153 4.5
CGI Group Holdings Limited 41.4 8,509 5,962 3.8
U-Pol Group Limited 5.2 5,657 5,787 3.6
84,034 99,443 62.8
Ten Largest Investments (both held directly and via Dunedin managed funds) by value at 30 June 2011

6 Dunedin Enterprise Investment Trust PLC
Analysed by category of investment (including cash)
30 June 2011 31 December 2010 % %
Dunedin managed 59 56
Third party managed 12 8
Listed private equity 10 16
Legacy technology funds 1 1
Cash 18 19
Analysed by valuation method
30 June 2011 31 December 2010 % %
Cost/written down 7 15
Earnings – provision 14 13
Earnings – uplift 67 52
Bid price 12 20
Analysed by geographic location
30 June 2011 31 December 2010 % %
UK 75 72
Rest of Europe 21 24
USA 3* 4
RestofWorld 1* –
*heldviaSWIPPrivateEquityFundofFundsIIPLCandLegacyTechnologyFunds
Overview of Portfolio
7 Dunedin Enterprise Investment Trust PLC
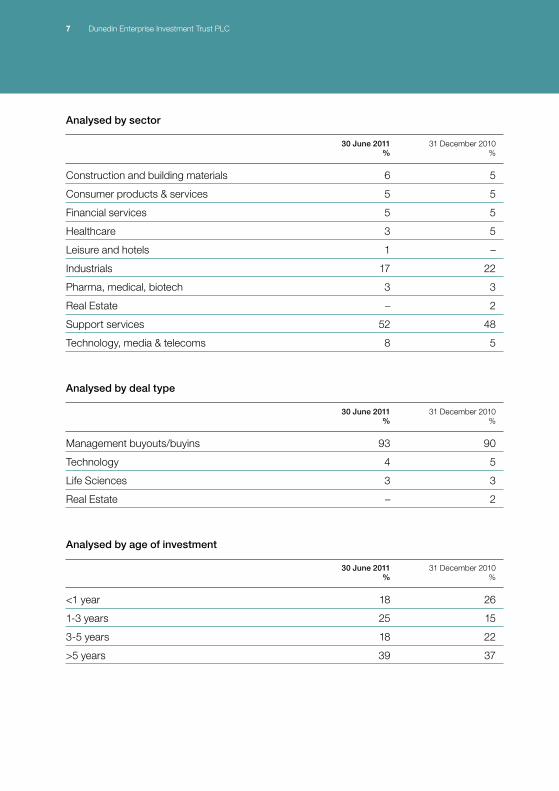
Analysed by sector
30 June 2011 31 December 2010 % %
Construction and building materials 6 5
Consumer products & services 5 5
Financial services 5 5
Healthcare 3 5
Leisure and hotels 1 –
Industrials 17 22
Pharma, medical, biotech 3 3
Real Estate – 2
Support services 52 48
Technology, media & telecoms 8 5
Analysed by deal type
30 June 2011 31 December 2010 % %
Management buyouts/buyins 93 90
Technology 4 5
Life Sciences 3 3
Real Estate – 2
Analysed by age of investment
30 June 2011 31 December 2010 % %
<1 year 18 26
1-3 years 25 15
3-5 years 18 22
>5 years 39 37
8 Dunedin Enterprise Investment Trust PLC
Unaudited Unaudited Audited Six months ended 30 June 2011 Six months ended 30 June 2010 Year ended 31 December 2010
Revenue Capital Total Revenue Capital Total Revenue Capital Total £’000 £’000 £’000 £’000 £’000 £’000 £’000 £’000 £’000
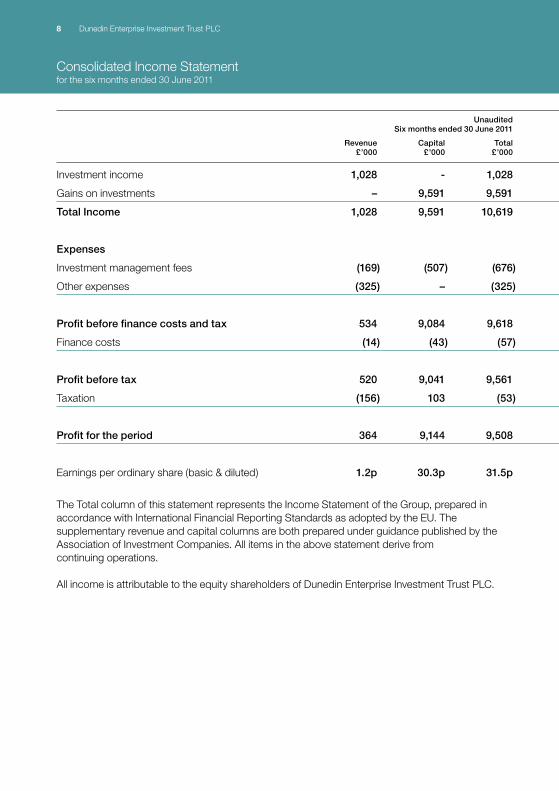
Investment income 1,028 - 1,028 1,242 – 1,242 2,401 – 2,401
Gains on investments – 9,591 9,591 – 7,935 7,935 – 27,325 27,325
Total Income 1,028 9,591 10,619 1,242 7,935 9,177 2,401 27,325 29,726
Expenses
Investment management fees (169) (507) (676) (111) (334) (445) (265) (794) (1,059)
Other expenses (325) – (325) (320) – (320) (641) – (641)
Profit before finance costs and tax 534 9,084 9,618 811 7,601 8,412 1,495 26,531 28,026
Finance costs (14) (43) (57) (22) (66) (88) (22) (66) (88)
Profit before tax 520 9,041 9,561 789 7,535 8,324 1,473 26,465 27,938
Taxation (156) 103 (53) (278) 112 (166) (348) 241 (107)
Profit for the period 364 9,144 9,508 511 7,647 8,158 1,125 26,706 27,831
Earnings per ordinary share (basic & diluted) 1.2p 30.3p 31.5p 1.7p 25.3p 27.0p 3.7p 88.5p 92.2p
The Total column of this statement represents the Income Statement of the Group, prepared in accordance with International Financial Reporting Standards as adopted by the EU. The supplementary revenue and capital columns are both prepared under guidance published by the Association of Investment Companies. All items in the above statement derive from continuing operations.
All income is attributable to the equity shareholders of Dunedin Enterprise Investment Trust PLC.
Consolidated Income Statement for the six months ended 30 June 2011
9 Dunedin Enterprise Investment Trust PLC
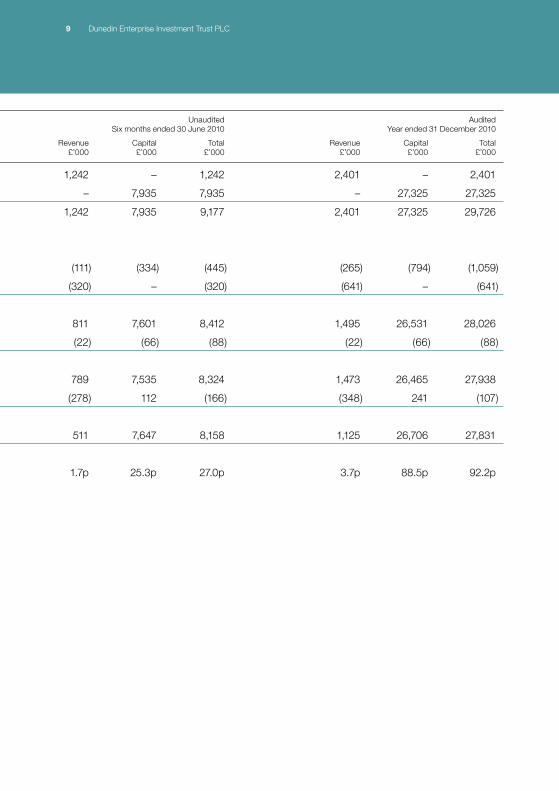
Unaudited Unaudited Audited Six months ended 30 June 2011 Six months ended 30 June 2010 Year ended 31 December 2010
Revenue Capital Total Revenue Capital Total Revenue Capital Total £’000 £’000 £’000 £’000 £’000 £’000 £’000 £’000 £’000
Investment income 1,028 - 1,028 1,242 – 1,242 2,401 – 2,401
Gains on investments – 9,591 9,591 – 7,935 7,935 – 27,325 27,325
Total Income 1,028 9,591 10,619 1,242 7,935 9,177 2,401 27,325 29,726
Expenses
Investment management fees (169) (507) (676) (111) (334) (445) (265) (794) (1,059)
Other expenses (325) – (325) (320) – (320) (641) – (641)
Profit before finance costs and tax 534 9,084 9,618 811 7,601 8,412 1,495 26,531 28,026
Finance costs (14) (43) (57) (22) (66) (88) (22) (66) (88)
Profit before tax 520 9,041 9,561 789 7,535 8,324 1,473 26,465 27,938
Taxation (156) 103 (53) (278) 112 (166) (348) 241 (107)
Profit for the period 364 9,144 9,508 511 7,647 8,158 1,125 26,706 27,831
Earnings per ordinary share (basic & diluted) 1.2p 30.3p 31.5p 1.7p 25.3p 27.0p 3.7p 88.5p 92.2p
The Total column of this statement represents the Income Statement of the Group, prepared in accordance with International Financial Reporting Standards as adopted by the EU. The supplementary revenue and capital columns are both prepared under guidance published by the Association of Investment Companies. All items in the above statement derive from continuing operations.
All income is attributable to the equity shareholders of Dunedin Enterprise Investment Trust PLC.
10 Dunedin Enterprise Investment Trust PLC
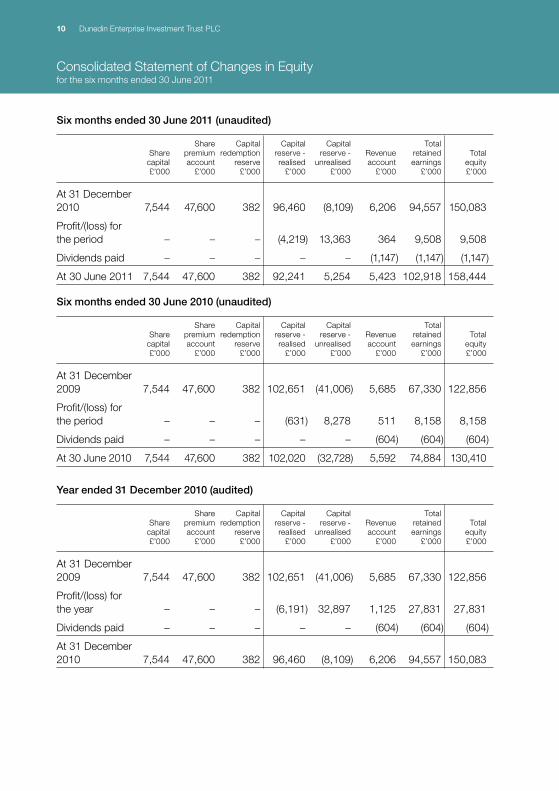
Six months ended 30 June 2011 (unaudited)
Share Capital Capital Capital Total Share premium redemption reserve - reserve - Revenue retained Total capital account reserve realised unrealised account earnings equity £’000 £’000 £’000 £’000 £’000 £’000 £’000 £’000
At 31 December 2010 7,544 47,600 382 96,460 (8,109) 6,206 94,557 150,083
Profit/(loss) for the period – – – (4,219) 13,363 364 9,508 9,508
Dividends paid – – – – – (1,147) (1,147) (1,147)
At 30 June 2011 7,544 47,600 382 92,241 5,254 5,423 102,918 158,444
Six months ended 30 June 2010 (unaudited)
Share Capital Capital Capital Total Share premium redemption reserve - reserve - Revenue retained Total capital account reserve realised unrealised account earnings equity £’000 £’000 £’000 £’000 £’000 £’000 £’000 £’000
At 31 December 2009 7,544 47,600 382 102,651 (41,006) 5,685 67,330 122,856
Profit/(loss) for the period – – – (631) 8,278 511 8,158 8,158
Dividends paid – – – – – (604) (604) (604)
At 30 June 2010 7,544 47,600 382 102,020 (32,728) 5,592 74,884 130,410
Year ended 31 December 2010 (audited)
Share Capital Capital Capital Total Share premium redemption reserve - reserve - Revenue retained Total capital account reserve realised unrealised account earnings equity £’000 £’000 £’000 £’000 £’000 £’000 £’000 £’000
At 31 December 2009 7,544 47,600 382 102,651 (41,006) 5,685 67,330 122,856
Profit/(loss) for the year – – – (6,191) 32,897 1,125 27,831 27,831
Dividends paid – – – – – (604) (604) (604)
At 31 December 2010 7,544 47,600 382 96,460 (8,109) 6,206 94,557 150,083
Consolidated Statement of Changes in Equityfor the six months ended 30 June 2011
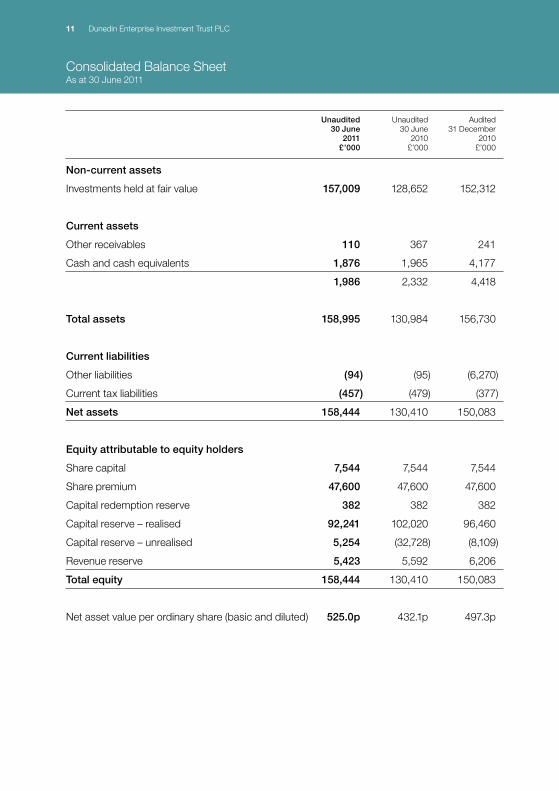
11 Dunedin Enterprise Investment Trust PLC
Unaudited Unaudited Audited 30 June 30 June 31 December 2011 2010 2010 £’000 £’000 £’000
Non-current assets
Investments held at fair value 157,009 128,652 152,312
Current assets
Other receivables 110 367 241
Cash and cash equivalents 1,876 1,965 4,177
1,986 2,332 4,418
Total assets 158,995 130,984 156,730
Current liabilities
Other liabilities (94) (95) (6,270)
Current tax liabilities (457) (479) (377)
Net assets 158,444 130,410 150,083
Equity attributable to equity holders
Share capital 7,544 7,544 7,544
Share premium 47,600 47,600 47,600
Capital redemption reserve 382 382 382
Capital reserve – realised 92,241 102,020 96,460
Capital reserve – unrealised 5,254 (32,728) (8,109)
Revenue reserve 5,423 5,592 6,206
Total equity 158,444 130,410 150,083
Net asset value per ordinary share (basic and diluted) 525.0p 432.1p 497.3p
Consolidated Balance Sheet As at 30 June 2011
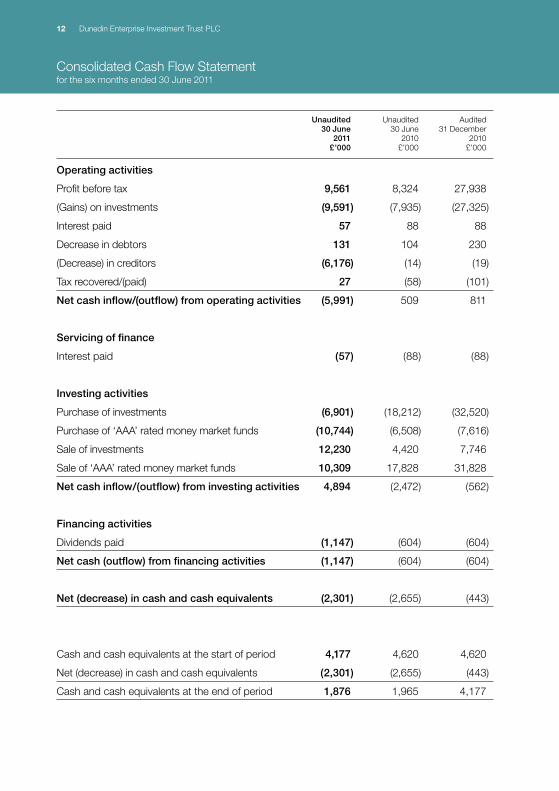
12 Dunedin Enterprise Investment Trust PLC
Unaudited Unaudited Audited 30 June 30 June 31 December 2011 2010 2010 £’000 £’000 £’000
Operating activities
Profit before tax 9,561 8,324 27,938
(Gains) on investments (9,591) (7,935) (27,325)
Interest paid 57 88 88
Decrease in debtors 131 104 230
(Decrease) in creditors (6,176) (14) (19)
Tax recovered/(paid) 27 (58) (101)
Net cash inflow/(outflow) from operating activities (5,991) 509 811
Servicing of finance
Interest paid (57) (88) (88)
Investing activities
Purchase of investments (6,901) (18,212) (32,520)
Purchase of ‘AAA’ rated money market funds (10,744) (6,508) (7,616)
Sale of investments 12,230 4,420 7,746
Sale of ‘AAA’ rated money market funds 10,309 17,828 31,828
Net cash inflow/(outflow) from investing activities 4,894 (2,472) (562)
Financing activities
Dividends paid (1,147) (604) (604)
Net cash (outflow) from financing activities (1,147) (604) (604)
Net (decrease) in cash and cash equivalents (2,301) (2,655) (443)
Cash and cash equivalents at the start of period 4,177 4,620 4,620
Net (decrease) in cash and cash equivalents (2,301) (2,655) (443)
Cash and cash equivalents at the end of period 1,876 1,965 4,177
Consolidated Cash Flow Statement for the six months ended 30 June 2011

13 Dunedin Enterprise Investment Trust PLC
Weconfirmthattothebestofourknowledge:– the condensed set of financial statements has been prepared in accordance with IAS 34
Interim Financial Reporting as adopted by the EU;
– the interim management report includes a fair review of the information required by:
(a) DTR 4.2.7R of the Disclosure and Transparency Rules, being an indication of important events that have occurred during the first six months of the financial period and their impact on the condensed set of financial statements; and a description of the principal risks and uncertainties for the remaining six months of the year; and
(b) DTR 4.2.8R of the Disclosure and Transparency Rules, being related party transactions that have taken place in the first six months of the current financial year and that have materially affected the financial position or performance of the entity during that period; and any changes in the related party transactions described in the last annual report that could do so.
By Order of the BoardEdward DawnayChairman3 August 2011
Responsibility statement of the Directors in respect of the half-yearly financial report
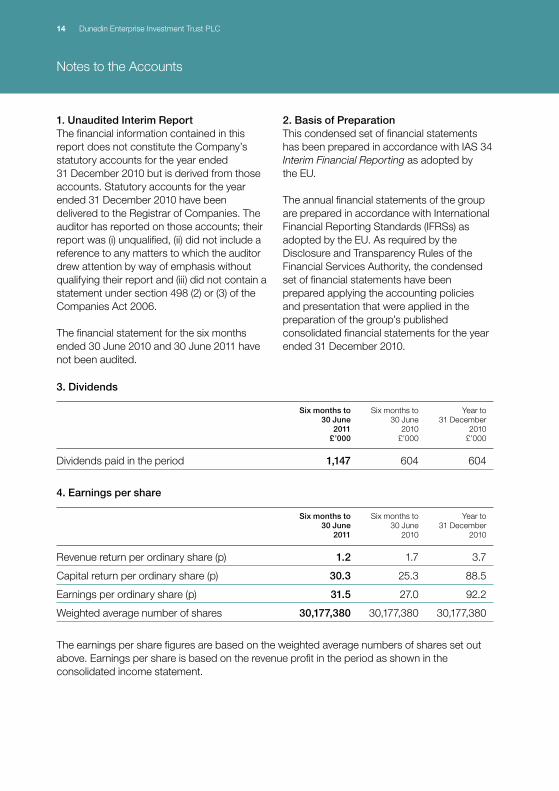
14 Dunedin Enterprise Investment Trust PLC
1. Unaudited Interim ReportThe financial information contained in this report does not constitute the Company’s statutory accounts for the year ended 31 December 2010 but is derived from those accounts. Statutory accounts for the year ended 31 December 2010 have been delivered to the Registrar of Companies. The auditor has reported on those accounts; their report was (i) unqualified, (ii) did not include a reference to any matters to which the auditor drew attention by way of emphasis without qualifying their report and (iii) did not contain a statement under section 498 (2) or (3) of the Companies Act 2006.
The financial statement for the six months ended 30 June 2010 and 30 June 2011 have not been audited.
2. Basis of PreparationThis condensed set of financial statements has been prepared in accordance with IAS 34 Interim Financial Reporting as adopted by the EU.
The annual financial statements of the group are prepared in accordance with International Financial Reporting Standards (IFRSs) as adopted by the EU. As required by the Disclosure and Transparency Rules of the Financial Services Authority, the condensed set of financial statements have been prepared applying the accounting policies and presentation that were applied in the preparation of the group’s published consolidated financial statements for the year ended 31 December 2010.
3. Dividends Six months to Six months to Year to 30 June 30 June 31 December 2011 2010 2010 £’000 £’000 £’000
Dividends paid in the period 1,147 604 604
4. Earnings per share
Six months to Six months to Year to 30 June 30 June 31 December 2011 2010 2010
Revenue return per ordinary share (p) 1.2 1.7 3.7
Capital return per ordinary share (p) 30.3 25.3 88.5
Earnings per ordinary share (p) 31.5 27.0 92.2
Weightedaveragenumberofshares 30,177,380 30,177,380 30,177,380
The earnings per share figures are based on the weighted average numbers of shares set out above. Earnings per share is based on the revenue profit in the period as shown in the consolidated income statement.
Notes to the Accounts

15 Dunedin Enterprise Investment Trust PLC
5. Contingent assetsDiscussions are ongoing regarding the recovery of VAT suffered prior to 2001 and payment of interest on a compound basis. The amount and timing of any recovery remains uncertain and accordingly no amount has been provided for in the financial statements.
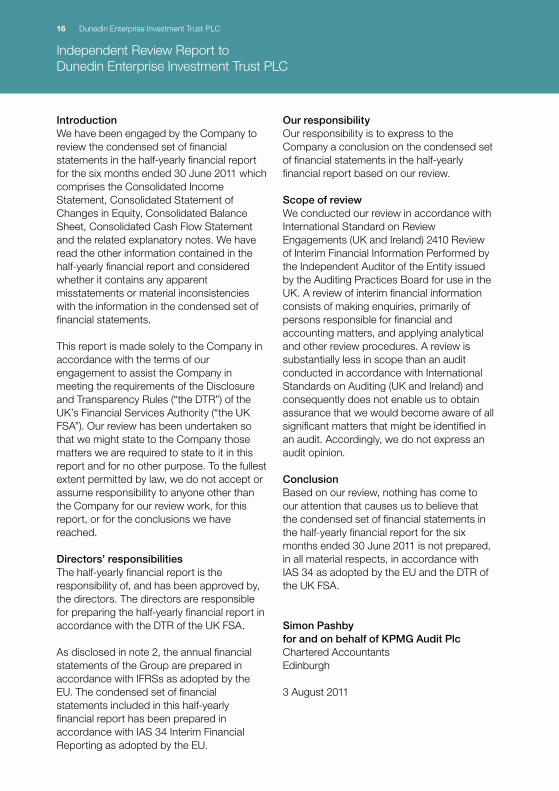
16 Dunedin Enterprise Investment Trust PLC
IntroductionWehavebeenengagedbytheCompanytoreview the condensed set of financial statements in the half-yearly financial report for the six months ended 30 June 2011 which comprises the Consolidated Income Statement, Consolidated Statement of Changes in Equity, Consolidated Balance Sheet, Consolidated Cash Flow Statement andtherelatedexplanatorynotes.Wehaveread the other information contained in the half-yearly financial report and considered whether it contains any apparent misstatements or material inconsistencies with the information in the condensed set of financial statements.
This report is made solely to the Company in accordance with the terms of our engagement to assist the Company in meeting the requirements of the Disclosure and Transparency Rules (“the DTR”) of the UK’s Financial Services Authority (“the UK FSA”). Our review has been undertaken so that we might state to the Company those matters we are required to state to it in this report and for no other purpose. To the fullest extent permitted by law, we do not accept or assume responsibility to anyone other than the Company for our review work, for this report, or for the conclusions we have reached.
Directors’ responsibilitiesThe half-yearly financial report is the responsibility of, and has been approved by, the directors. The directors are responsible for preparing the half-yearly financial report in accordance with the DTR of the UK FSA.
As disclosed in note 2, the annual financial statements of the Group are prepared in accordance with IFRSs as adopted by the EU. The condensed set of financial statements included in this half-yearly financial report has been prepared in accordance with IAS 34 Interim Financial Reporting as adopted by the EU.
Our responsibilityOur responsibility is to express to the Company a conclusion on the condensed set of financial statements in the half-yearly financial report based on our review.
Scope of reviewWeconductedourreviewinaccordancewithInternational Standard on Review Engagements (UK and Ireland) 2410 Review of Interim Financial Information Performed by the Independent Auditor of the Entity issued by the Auditing Practices Board for use in the UK. A review of interim financial information consists of making enquiries, primarily of persons responsible for financial and accounting matters, and applying analytical and other review procedures. A review is substantially less in scope than an audit conducted in accordance with International Standards on Auditing (UK and Ireland) and consequently does not enable us to obtain assurance that we would become aware of all significant matters that might be identified in an audit. Accordingly, we do not express an audit opinion.
ConclusionBased on our review, nothing has come to our attention that causes us to believe that the condensed set of financial statements in the half-yearly financial report for the six months ended 30 June 2011 is not prepared, in all material respects, in accordance with IAS 34 as adopted by the EU and the DTR of the UK FSA.
Simon Pashby for and on behalf of KPMG Audit Plc Chartered AccountantsEdinburgh 3 August 2011
Independent Review Report to Dunedin Enterprise Investment Trust PLC

17 Dunedin Enterprise Investment Trust PLC
Announcements, dividend payments and the issue of the annual and half year reports may normally be expected in the months shown below:
FebruaryPreliminary figures and recommended dividend for the year announced.
AprilAnnual Report and Accounts published.
MayAnnual General Meeting and dividend paid.
AugustHalf year report published.
Financial Calendar
18 Dunedin Enterprise Investment Trust PLC
DirectorsEdward Dawnay, ChairmanLiz AireyBrian FinlaysonDavid GambleFederico Marescotti
Manager and SecretaryDunedin Capital Partners Limited(Authorised and Regulated by the Financial Services Authority)
Registered Office10 George StreetEdinburghEH22DWTelephone 0131 225 6699Registered No. 52844 ScotlandEmail [email protected]
RegistrarEquiniti LimitedAspect HouseSpencer RoadLancingWestSussexBN996DATelephone 0870 601 5366
Corporate Information

19 Dunedin Enterprise Investment Trust PLC

20 Dunedin Enterprise Investment Trust PLC

Dunedin Enterprise Investment Trust PLC specialises in the provision of private equity finance. Private equity is medium to long term finance provided in return for an equity stake in established, potentially high growth private companies.
The Company’s investment objective is to achieve substantial long term growth in its assets through capital gains from its investments.

Dunedin Enterprise Investment Trust PLC10 George Street, Edinburgh EH2 2DW
www.dunedinenterprise.com