investing or safet f y - atmos energy€¦ · service lines to customers’ premises. we plan to...
TRANSCRIPT
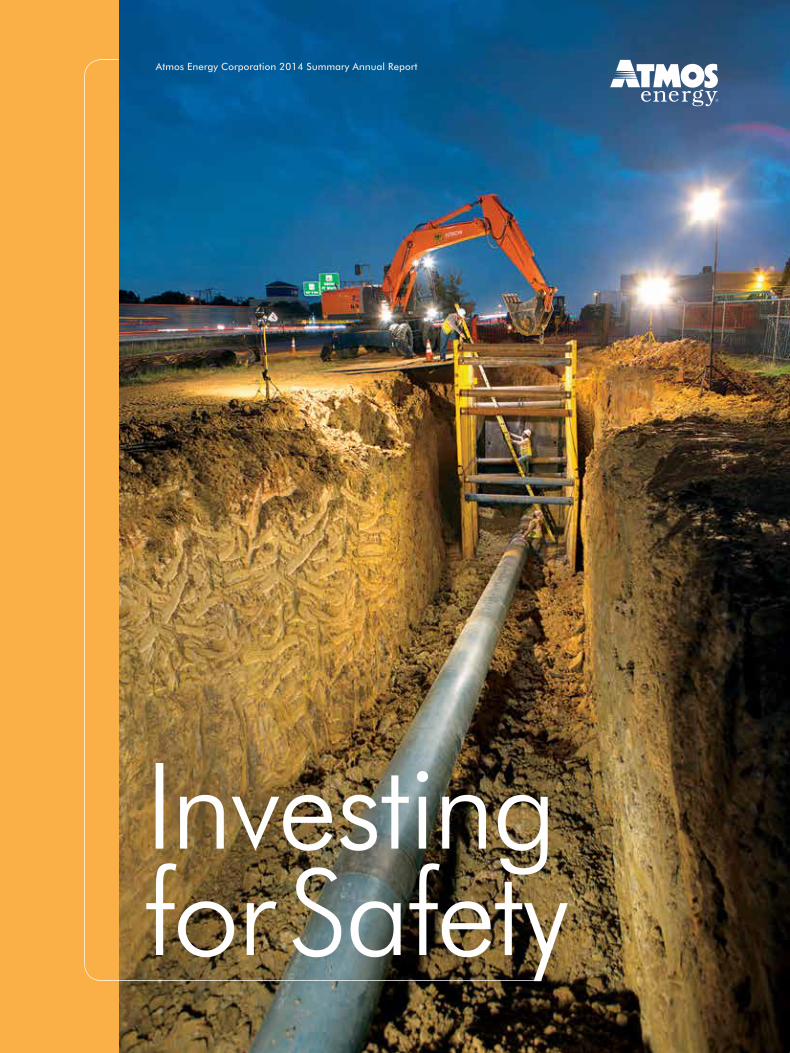
Investing for Safety
Atmos Energy Corporation 2014 Summary Annual Report


Never before has so much capital gone into modernizing the natural gas infrastructure in the United States.
1
During fiscal 2014, Atmos Energy replaced nearly 475 miles of natural gas pipelines. Near Hopkinsville, Kentucky, the Kentucky/Mid-States Division installed 5.5 miles of coated steel pipe as the final phase of a multi-year project to replace some 25 miles of aging bare steel pipeline. The line brings gas to customers in area communities while supporting growth by industrial customers in nearby industrial parks. It effectively doubles the throughput of the former pipeline and allows more storage gas to be used from the company’s nearby St. Charles storage field.
A LEADER IN MODERNIZATION
$800
$600
$400
$200
$0
2010 2011 2012 2013 2014
TOTAL CAPITAL EXPENDITURES
SAFETY AND RELIABILITY EXPENDITURES
DOLLARS IN MILLIONS
Atmos Energy is a leader in pipeline mod-ernization. Since 2007, it has invested about $5 billion dollars to renew and expand its distribution and transmission systems and to improve customer service. About 70 percent of that capital spending has been dedicated to increasing safety and reliability.

In the Flow Lab at Atmos Energy’s Charles K. Vaughan Center in Plano, Texas, construction operators Jason Gilson and Stephen
Ancira learn about remote control shut-off valves from Fred Bev-ersdorf, manager of technical training. Shut-off valves increase the safety on our transmission pipelines and larger mains by enabling
our control centers to respond quickly if a pressure anomaly occurs.

3
Investing for Safety
America’s natural gas industry is pursuing an unprecedented program to enhance the safety, reliability and capacity of its 2.4 million miles of pipelines.
According to the U.S. Department of Transportation (DOT), pipelines rank as the country’s safest mode of transportation. The industry’s outstanding safety record is the result of nearly 45 years of major pipeline improvements. To enhance this excellent record, natural gas companies are planning to replace an estimated 8.4 percent of their 1.3 million miles of gas distribution pipelines and 6.8 percent of 895,000 miles of service lines. Atmos Energy is a leader in pipeline modernization. Since 2007, it has invested about $5 billion dollars to renew and expand its distribution and transmission systems and to improve customer service. About 70 percent of that capital spending has been dedicated to increasing safety and reliability.
AMERICA’S SAFEST GAS COMPANY
“Our goal is to be the safest natural gas distributor in the nation,” says Kim Cocklin, president and CEO of Atmos Energy Corporation. “Our goal is more than an aspirational ideal. It is a commitment we make to our customers, communities, regulators and investors,” he says. “Every employee has taken a pledge to strive to be incident-free every day.”To make a safe system even safer, Atmos Energy has fostered a “culture of safety” in the following ways:
> In 2010, Atmos Energy opened the Charles K. Vaughan Center, the
finest technical training facility in the natural gas distribution industry.
> The company’s training instructors are all seasoned experts with
many years of operating experience.
> Its service technicians and construction operators continually train
and recertify to meet federal Operator Qualification requirements.
> Its Coaching in the Moment safety program engages employees
to be accountable not only for their own safety, but also to protect
their fellow employees and others at a worksite.
> Its AtmoSpirit enculturation program for all employees stresses
safety as the highest priority.
ATMOS ENERGY: INVESTING FOR SAFETY

Pipelines transport
natural gas to more than
M I L L I O NAmericans throughout
the U.S.
Atmos Energy has already removed all cast iron pipelines from its system in seven states. As part of our comprehensive pipeline infrastructure
program, we will replace all remaining cast iron pipe.
4
“Realizing our goal to be the nation’s safest gas utility requires us to invest significant amounts for rehabilitating, fortifying and replacing our regulated infrastructure,” Cocklin says. The company’s fiscal 2015 capital expenditures are projected to be between $900 million and $1.0 billion, with more than 75 percent of these expenditures earmarked to improve safety and reliability. Capital spending in each of the fiscal years 2016 through 2018 should be between $900 million and $1.1 billion.
CALL TO ACTION
There are many reasons for modernizing aging pipelines at this time: industry initiatives, federal laws, safety concerns, regulatory directives, rate-making mechanisms, environmental goals, energy efficiency, economic development, favorable debt and equity pricing, and low natural gas prices with abundant supplies. Federal oversight of natural gas pipeline safety began with the Natural Gas Pipeline Safety Act of 1968. The law required the U.S. Department of Transportation to establish minimum safety stan-dards for new pipeline facilities and for the trans-portation of natural gas. In 2011, then-DOT Secretary Ray LaHood announced a national “Call to Action,” directing the CEOs of pipeline companies to conduct a compre-hensive review of their pipeline systems. The secretary acknowledged that safety and regulatory needs vary in each state. But he called on state legislators and regulators to enact innovative rate structures that fit their unique circumstances. LaHood emphasized the need for regulators to allow timely recovery of these replacement investments. He said that traditional ratemaking approaches can impede the imperative to make improvements.
The 50 states, which often set more stringent reg-ulations than federal laws, have stepped up their own pipeline safety programs. The states have primary responsibility for regulating natural gas distribution systems and intrastate pipelines. Federal funding provides about half the cost of the states’ pipeline in-spection and enforcement programs, and this support has helped states focus on pipeline renewal.
SETTING PRIORITIES
The Pipeline and Hazardous Materials Safety Administration (PHMSA) within the DOT has identified cast iron and unprotected bare steel pipe-lines as the pipeline segments to begin replacing first. These materials were once state-of-the-art tech-nology, enhancing safety and reliability by displacing earlier piping materials like creosoted wood or clay pipe. However, pipelines have continually improved because of better pipe manufacturing, construction practices, and operation and maintenance. Cast iron pipe was first used in the 1830s and continued being installed until the early 1950s. Bare steel pipelines were used extensively for gas mains from the 1900s to the 1960s. Until pipeline coatings were required by federal mandate in 1970, some transmission and distribution operators con-tinued to install bare steel pipelines, particularly in areas of the country with drier climates. Atmos Energy has already removed all cast iron pipelines from its system in seven states. As part of our comprehensive pipeline infrastructure program, we will replace all remaining cast iron pipe and will rehabilitate or replace the remaining bare steel pipelines in our system.
Cast iron distribution mains top the list of pipelines scheduled for replacement across the country. Although some cast iron lines have operated safely for more than 100 years, aging iron pipe can turn
brittle and crack if the ground shifts or the pipe is damaged by excavation. Behind houses in Highland Park, Texas, Juan Gomez
(top right), a senior field construction coordinator, oversees replacing a cast iron main with high-density polyethylene pipe.
ATMOS ENERGY: INVESTING FOR SAFETY
177


7
Today, natural gas
utilities spend more than
$19B I L L I O Nannually to
help enhance the safety of natural
gas delivery systems.
We plan to replace between 450 and 500 miles of distribution pipelines, 70 to 90 miles of transmission pipelines and some 25,000 customer service lines during fiscal 2015.
ATMOS ENERGY: INVESTING FOR SAFETY
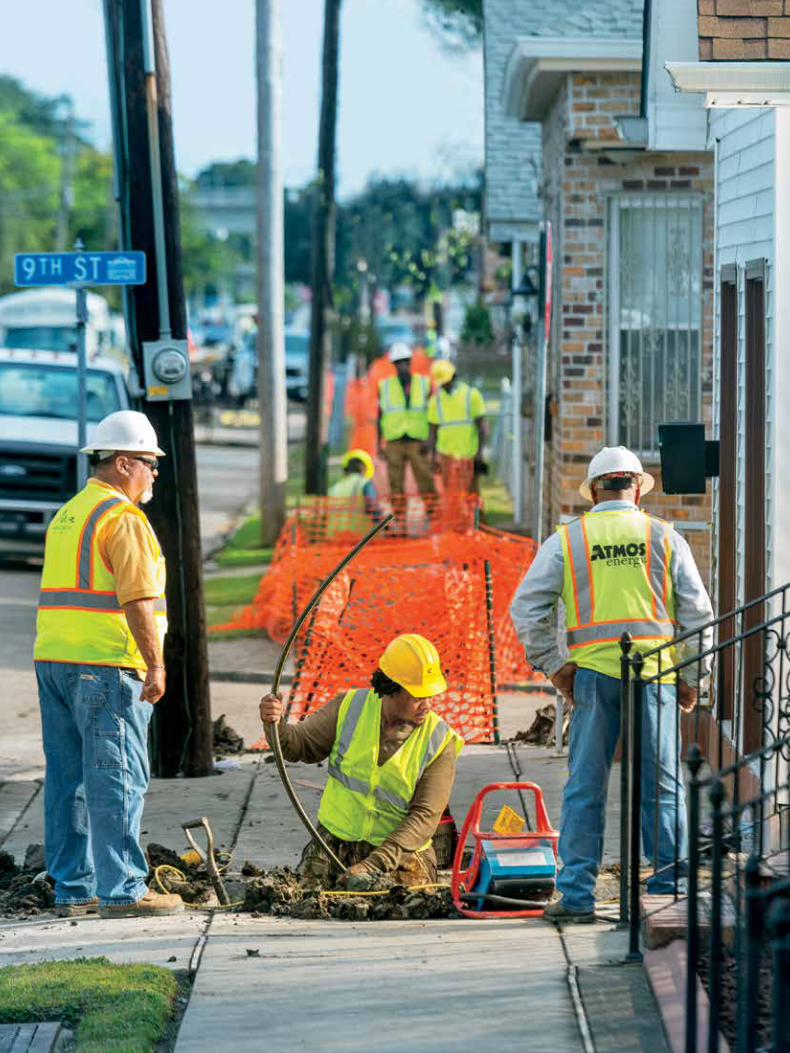
Replacing aging pipelines in communities involves a constant watch for safety and close coordination with local authorities, emergency officials and affected customers. In Gretna, Louisiana, a suburb of New Orleans, Atmos Energy is modernizing its distribution pipelines in older sections of the city by replacing bare steel pipe with high-density polyethylene pipe.
FISCAL 2015 PROJECTED PIPELINE REPLACEMENTS
ENSURING PIPELINE INTEGRITY
Although much of the nation’s current natural gas infrastructure was installed before 1970, the effect of age is not the only factor—or the most significant one—for assessing a pipeline’s fitness for service. Along with the material that a pipe is made of, operators must consider construction practices and other factors that could affect pipeline integrity. Soil conditions, erosion, drought, rainfall, wind, tree roots, maintenance records, whether a line has a protective coating, the proximity to populated loca-tions and data collected from a variety of inspection methods—all have a bearing on a pipeline’s integrity. In 2004, federal regulations began requiring operators of natural gas transmission pipelines to conduct integrity management programs for their pipeline systems. A similar regulation took effect for natural gas distribution pipelines in 2011. Integrity management programs require a comprehensive examination of pipeline infra-structure. Federal and state rules require pipeline operators to assess threats to their system, apply risk analysis to grade the significance of those threats and take both preventative and mitigative actions to protect the public from incidents. Our integrity management plans are shared with the safety regula-tors in each of the states we serve. Integrity management programs can involve running precise instruments through the pipeline, called pigging, to search for corrosion or cracks, excavating around the line to directly inspect the pipe’s condition or performing a hydrostatic pres-sure test of a line segment to ensure it can withstand much higher-than-normal pressure.
A LONG-TERM UNDERTAKING
Based on risk analysis and integrity management data, Atmos Energy currently expects to replace its existing cast iron and most of its bare steel and vintage plastic pipelines during the next two decades. We also plan to continue replacing between 75 miles and 100 miles a year of older coated steel pipelines. During fiscal 2014, Atmos Energy replaced about 375 miles of distribution pipelines, some 95 miles of transmission pipelines and approximately 23,000 service lines to customers’ premises. We plan to replace between 450 and 500 miles of distribution pipelines, 70 to 90 miles of transmission pipelines and some 25,000 customer service lines during fiscal 2015. Replacements of cast iron pipe in the Mid-Tex Division should increase by one-third, from about 60 miles in fiscal 2014 to about 80 miles in fiscal 2015.
DISTRIBUTION PIPELINES: 450–500 MILES
CAST IRON
COATED STEEL
VINTAGE PLASTIC
BARE STEEL
SERVICE LINES
TRANSMISSION PIPELINES: 70–90 MILES
25,000 SERVICES
0 50 100 150 200 MILES

39S TAT E S
have adoptedaccelerated
infrastructurereplacement programs.
No matter the material or age of the pipe, replacement crews take extra precautions to maintain service to surrounding customers, provide
for traffic control and communicate with emergency and city services.
ATMOS ENERGY CONTINUES TO FOCUS ON MODERNIZING ITS SYSTEM
8
The company has worked since the 1980s to remove its most vulnerable cast iron pipe, and elimi-nating the remaining sections is a key component of our comprehensive infrastructure program. An American Gas Foundation study found in 2012 that replacing cast iron pipe costs from $1.5 million to $5 million a mile, on average. Replacing it requires close coordination with all city depart-ments—streets, water, sewer, police and fire—and with other utilities that have lines running in the same corridors. The majority of the pipeline mileage that Atmos Energy expects to replace is bare steel. Some 4,000 miles of this bare steel pipe do not have a low- current flow of electricity around them to stop corrosion of the metal. Cathodic protection on all new steel pipelines has been required by federal regulations since 1970, and it must be installed on bare steel pipe if any corrosion is ever found. No matter the material or age of the pipe, replace-ment crews take extra precautions to maintain service to surrounding customers, provide for traffic control and communicate with emergency and city services.
PAYING FOR PROGRESS
Under traditional cost-of-service ratemaking, utility infrastructure investments are recovered after the investment is in the ground and the regulator approves the costs in a rate case. This process, which originated in the early years of the 20th century, can cause a long lag between when the company spends its dollars for infrastructure replacements and when it begins recovering the investment. Under traditional ratemaking, when investments are subject to a long lag time from the investment to the recovery, the utility must bear the carrying costs without an opportunity to recover these prudent expenditures. That ultimately translates into higher interest charges and requires a rate case to be filed each year, a time-consuming and costly activity for the utility and its customers. Therefore, timely cost recovery of all prudently incurred safety and reliability investments is of ut-most importance to the financial stability of natural gas utilities.
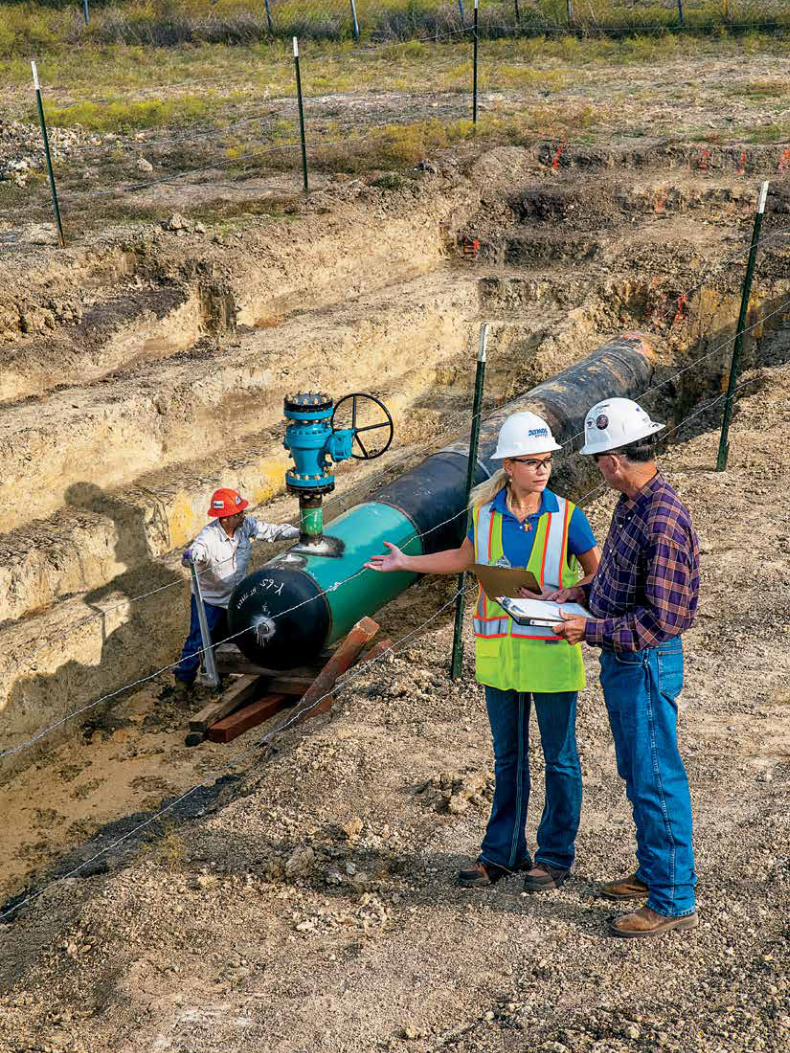
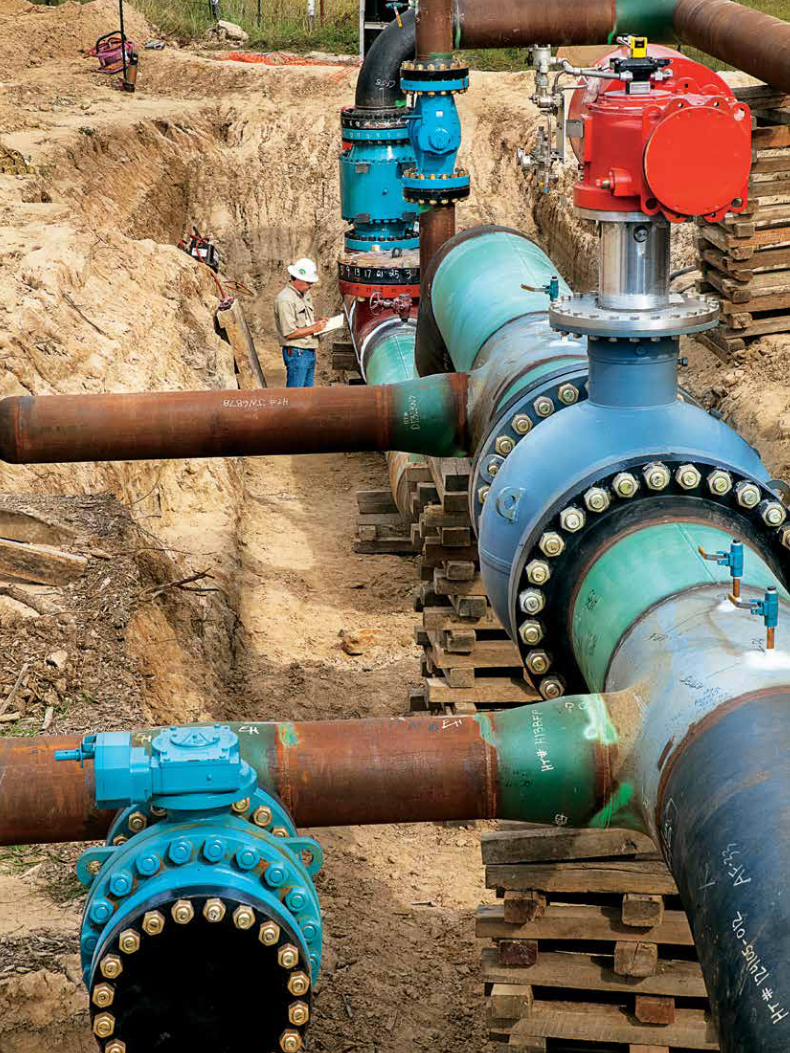
Atmos Energy inspected about 800 miles of pipelines in fiscal 2014 to ensure their fitness for service as part of our ongoing integrity management programs. Near Manor, Texas, Project Engineer Tatiana Perry discusses with a
contractor preparations for a hydrostatic pressure test of a 30-inch transmission pipeline. After sealing off a section of the line, water is pumped in and pressurized to well above the line’s maximum allowable operating pressure and
then is held at that pressure for a minimum of eight hours. Stress testing the pipeline helps assure that it can meet federal and state regulations and can operate safely even under extreme conditions.
ATMOS PIPELINE–TEXAS UTILITY DIVISIONS
TRANSMISSION PIPELINES: 6,600 TOTAL MILES
DISTRIBUTION PIPELINES: 67,000 TOTAL MILES
5,600 MILES 1,000 MILES
POLYETHYLENE PLASTIC
˜10%
COATED STEEL
PROTECTEDBARE STEEL
CAST IRON
PLASTIC
UNPROTECTEDBARE STEEL
9

11
New or improved infrastructure reduces natural gas leaks, leading to greater safety and reliability, and it lowers ongoing expenses charged to customers for operation and maintenance.
ATMOS ENERGY: INVESTING FOR SAFETY
INNOVATIVE RATEMAKING
Many utility regulators recognize the need to promptly, but efficiently, replace aging pipelines for greater safety as well as the enormous capital demands that natural gas pipeline operators face. Today most of the states where Atmos Energy op-erates allow some form of accelerated rate treatment for expenses that are outsized, volatile and generally outside the utility’s control. Rate mechanisms, as they are called, recover a wide variety of expenses. Currently, 39 states allow rate mechanisms to recover replacement costs for natural gas pipelines and related infrastructure. That’s an increase from only 11 states that permitted infrastructure improve-ment mechanisms in 2007. Infrastructure improvement programs, cost track-ers, rate surcharges and deferral accounts specifically allow the recovery of infrastructure investment costs as they occur. Annual formula ratemaking is more general with recovery of infrastructure investments, as well as other costs, between rate cases. These infrastructure mechanisms promote the efficient recovery of the largest component in a natural gas utility’s cost of service without pursuing contentious rate cases. And, virtually any rate mech-anism can be reviewed and adjusted in the utility’s next filed rate case. As many public officials have concluded, keeping natural gas distributors financially healthy is vital. By allowing innovative rate treatment, regulators balance their duty to treat utility investors fairly and to ensure that customers receive safe, reliable and economical service. In 2013, the National Association of Regulatory Utility Commissioners (NARUC) essentially ratified this approach. NARUC passed a resolution “that state commissions should explore, examine, and consider adopting alternative rate recovery mecha-nisms as necessary to accelerate the modernization, replacement and expansion of the nation’s natural gas pipeline systems.”
SUPPORTING SUSTAINABILITY
Regulators are approving alternative recovery mechanisms for natural gas infrastructure to foster other public policies, too, such as environmental improvement, energy efficiency and economic development. New or improved infrastructure reduces natural gas leaks, leading to greater safety and reliability, and it lowers ongoing expenses charged to cus-tomers for operation and maintenance. Leaks reported by natural gas utilities to PHMSA have declined dramatical-ly since 1991. Leaks on mains declined by 43 percent through 2010, and leaks on service lines went down 50 percent by 2010. From 2010 to 2013, Atmos Energy’s leak count fell by 43 percent, which was three times better than the national average. When assessing the effects on the environment, natural gas is far superior to other fossil fuels. Electricity generated with natural gas is about 92 percent efficient per British thermal unit (Btu), compared with 32 percent efficiency for coal-fired generation. When comparing the total fuel cycle from wellhead to burner tip, natural gas comes out far ahead on saving energy and doing more work per unit of energy consumed.
Atmos Pipeline–Texas transports natural gas across the state of Texas primarily to serve our Mid-Tex Division and other local distribution companies. With continuing economic growth in the state, APT is enhancing its capabilities in the Waco-to-Austin corridor and other areas to assure high reliability to its customers and to connect new sources of natural gas at competitive prices.
ATMOS PIPELINE–TEXAS
NATURAL GAS SUPPLY BASINS
REGULATED PIPELINE SPANS TEXAS
> 5,600 MILES OF INTRASTATE TRANSMISSION
> FIVE STORAGE FACILITIES WITH 46 BILLION
CUBIC FEET OF WORKING GAS CAPACITY
> TRANSPORTED 714 BCF IN FISCAL 2014
Haynesville/Bossier Shale
CarthageHub
Katy Hub
Waha Hub
Eagle FordShale
Barnett Shale
Granite WashFormation
PermianBasin
Natural gas is the foundation
fuel of our economy
and meets
P E R C E N Tof the nation’s energy needs
today.
27
Atmos Energy’s pipeline infrastructure investments are occurring at an opportune time. Financing costs for both debt and equity have been
favorable. And, the cost of natural gas has remained relatively low.
12
FUELING THE FUTURE
Natural gas is the essential fuel to achieve key environmental goals of fewer pollutants and cleaner air. For this reason, major environmental groups support using more natural gas, especially to replace coal for generating electricity. Approximately 28 percent of the electricity in the United States today is generated at 1,700 natural gas-fired power plants. Virtually all new power plants built during the past decade use natural gas for fuel because of its abundant domestic supply, low cost and low emissions. With the rapid retirements of many coal-fired power plants, natural gas is becoming the country’s foundation fuel source as well as the backup fuel to complement renewables development. To supply more gas-fired power plants, new natural gas pipe-lines and greater capacity on existing transmission lines are needed. The U.S. Energy Information Administration projects that total natural gas consumption in the United States will grow from 25 trillion cubic feet (Tcf) a year today to 30 Tcf by 2040. This growth will be caused by the increased use of gas both to generate electricity and to fuel manufacturing and process industries. In 2013, for example, Mississippi regulators adopted a policy to en-courage more expansion of the state’s natural gas infrastructure to attract industrial investment and to promote economic development. The state’s Public Service Commission approved a Supplemental Growth Rider that
allows Atmos Energy to spend up to $5 million a year on infrastructure expansions to support new industrial projects and added jobs. Historically, it has been difficult to justify extend-ing natural gas pipelines to certain industrial projects because the initial expected gas volumes and reve-nues were insufficient to pay for the investment. This new Mississippi program funds gas infrastructure investments for their first 10 years in service. Any new gas revenues generated by the investments will help recoup the cost of the program, which is being paid for by customers in Mississippi.
ADVANTAGEOUS TIMING
Atmos Energy’s pipeline infrastructure in-vestments are occurring at an opportune time. Financing costs for both debt and equity have been favorable. And, the cost of natural gas has remained relatively low. Because of extremely low interest rates, issu-ing debt has been very attractive for companies, like Atmos Energy, that must raise hundreds of millions of dollars of new capital each year. The company has taken advantage of this opportunity not only to refinance its debt issues at lower prices, but also to lock in a portion of the interest rate on future debt refinancings. At the same time, investors have expressed strong confidence in Atmos Energy’s stock. Accordingly, the market price of Atmos Energy shares has risen during the period from October 1, 2010, to October 1, 2014, at a compounded average growth rate of approximately 13 percent a year. Atmos Energy has issued more than 10.2 million shares of common stock during the past four fiscal years to raise additional capital and to keep its debt-to-capitalization ratio in balance.
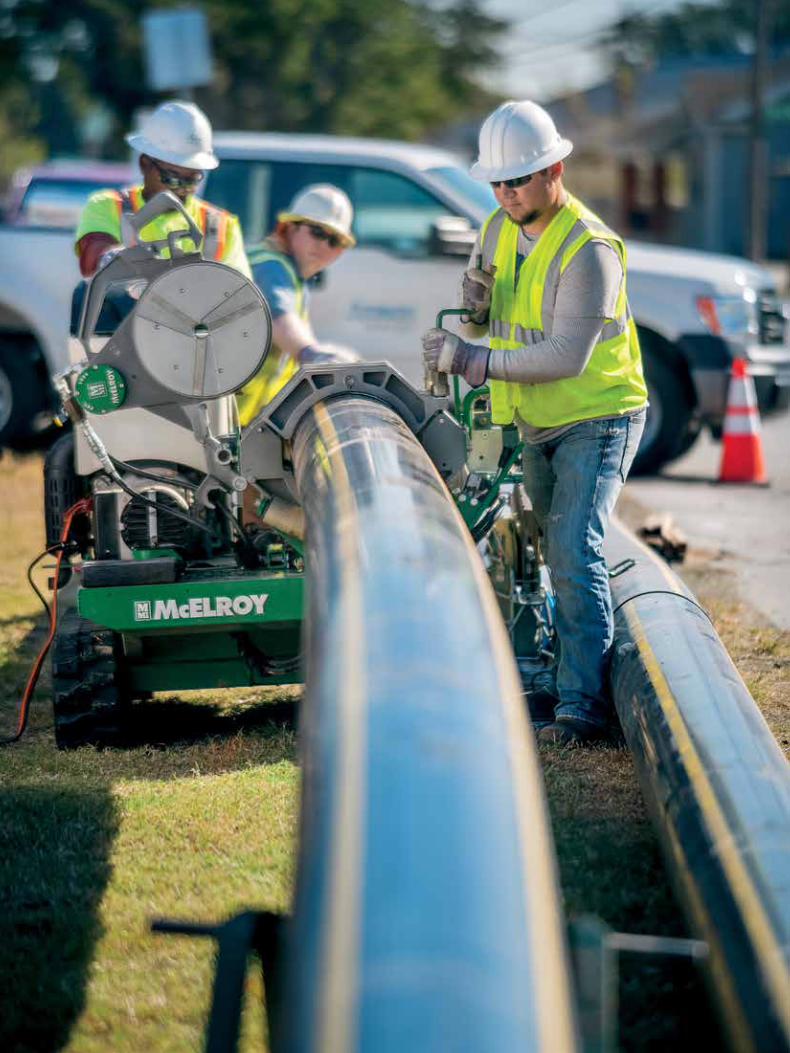
Brad McDaniel, senior service technician, reviews drawings of Atmos Energy’s pipeline supplying gas to the new Yokohama Tire
Company plant at West Point, Mississippi. Now in the first phase of a four-phase expansion program, the complex eventually will employ
2,000 workers and will exceed 100 acres under roof by 2018. Working with the Mississippi Public Service Commission, Atmos
Energy secured a special economic development rider to help recover infrastructure costs that support new industry and jobs for the state.
ATMOS ENERGY: INVESTING FOR SAFETY
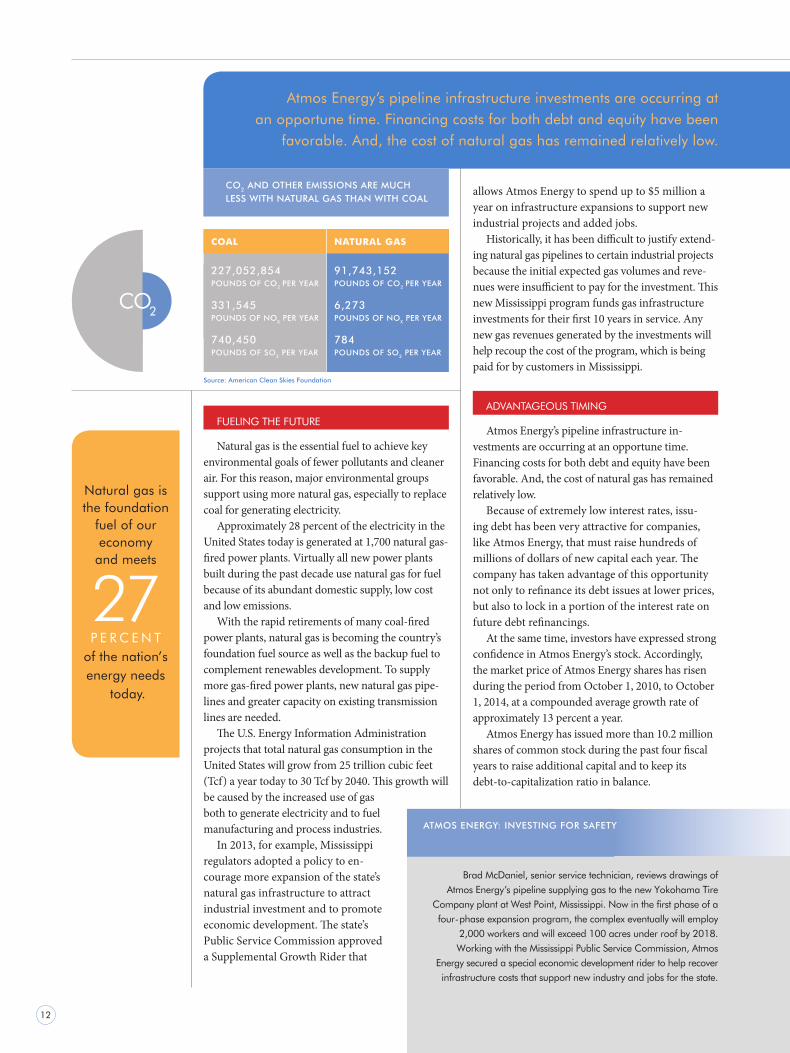
CO2
CO2 AND OTHER EMISSIONS ARE MUCH LESS WITH NATURAL GAS THAN WITH COAL
Source: American Clean Skies Foundation
COAL
227,052,854POUNDS OF CO2 PER YEAR
331,545 POUNDS OF NOX PER YEAR
740,450 POUNDS OF SO2 PER YEAR
NATURAL GAS
91,743,152POUNDS OF CO2 PER YEAR
6,273 POUNDS OF NOX PER YEAR
784 POUNDS OF SO2 PER YEAR

ATMOS ENERGY: INVESTING FOR SAFETY
By 2015, lownatural gas
prices and anabundanceof domesticgas supply
should raiseannual U.S. disposablehousehold income by
$2,000.
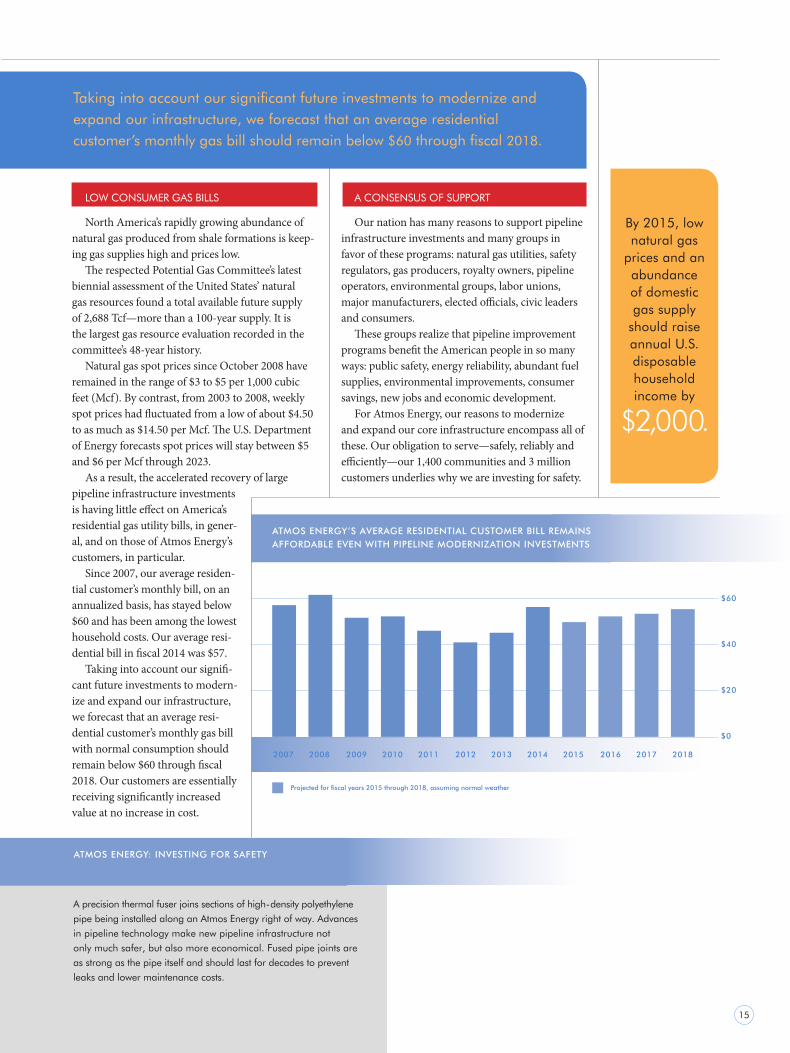
Taking into account our significant future investments to modernize and expand our infrastructure, we forecast that an average residential customer’s monthly gas bill should remain below $60 through fiscal 2018.
LOW CONSUMER GAS BILLS
North America’s rapidly growing abundance of natural gas produced from shale formations is keep-ing gas supplies high and prices low. The respected Potential Gas Committee’s latest biennial assessment of the United States’ natural gas resources found a total available future supply of 2,688 Tcf—more than a 100-year supply. It is the largest gas resource evaluation recorded in the committee’s 48-year history. Natural gas spot prices since October 2008 have remained in the range of $3 to $5 per 1,000 cubic feet (Mcf). By contrast, from 2003 to 2008, weekly spot prices had fluctuated from a low of about $4.50 to as much as $14.50 per Mcf. The U.S. Department of Energy forecasts spot prices will stay between $5 and $6 per Mcf through 2023. As a result, the accelerated recovery of large pipeline infrastructure investments is having little effect on America’s residential gas utility bills, in gener-al, and on those of Atmos Energy’s customers, in particular. Since 2007, our average residen-tial customer’s monthly bill, on an annualized basis, has stayed below $60 and has been among the lowest household costs. Our average resi-dential bill in fiscal 2014 was $57. Taking into account our signifi-cant future investments to modern-ize and expand our infrastructure, we forecast that an average resi-dential customer’s monthly gas bill with normal consumption should remain below $60 through fiscal 2018. Our customers are essentially receiving significantly increased value at no increase in cost.
A CONSENSUS OF SUPPORT
Our nation has many reasons to support pipeline infrastructure investments and many groups in favor of these programs: natural gas utilities, safety regulators, gas producers, royalty owners, pipeline operators, environmental groups, labor unions, major manufacturers, elected officials, civic leaders and consumers. These groups realize that pipeline improvement programs benefit the American people in so many ways: public safety, energy reliability, abundant fuel supplies, environmental improvements, consumer savings, new jobs and economic development. For Atmos Energy, our reasons to modernize and expand our core infrastructure encompass all of these. Our obligation to serve—safely, reliably and efficiently—our 1,400 communities and 3 million customers underlies why we are investing for safety.
A precision thermal fuser joins sections of high-density polyethylene pipe being installed along an Atmos Energy right of way. Advances in pipeline technology make new pipeline infrastructure not only much safer, but also more economical. Fused pipe joints are as strong as the pipe itself and should last for decades to prevent leaks and lower maintenance costs.
15
ATMOS ENERGY’S AVERAGE RESIDENTIAL CUSTOMER BILL REMAINS AFFORDABLE EVEN WITH PIPELINE MODERNIZATION INVESTMENTS
ATMOS ENERGY: INVESTING FOR SAFETY
$60
$40
$20
$0
2007 2008 2009 2010 2011 2012 2013 2014 2015 2016 2017 2018
Projected for fiscal years 2015 through 2018, assuming normal weather

17
To Our Shareholders Three years ago, we made a sea change in Atmos Energy’s core growth strategy, and today it is benefiting our investors, customers and communities.
Our strategy had been to grow through acquisitions of strategically situated natural gas distribution assets. As our founding chairman, Charles K. Vaughan, noted last year on Atmos Energy’s 30th anniversary, had he and the board of directors not staked out that strategy—one com-pletely counterintuitive to the rest of the utility industry at the time—Atmos Energy would not have survived. The company was a regional gas utility in West Texas with little or no customer growth to sustain it. By diversifying and growing through 10 major acquisitions over two decades, Charlie and his successor, Bob Best, built one of the largest and best-managed natural gas utility sys-
tems in the United States. Atmos Energy not only has remained independent, but also has prospered beyond all expectations. It has expanded into many states, and its regulated distribution and pipeline operations have produced steady growth in earnings and dividends. Today Atmos Energy has amassed such a sound portfolio of integrated assets that investing in our own operations yields much better returns than acquir-ing more distribution assets. Our six regulated distribution divisions and our Texas regulated intrastate pipeline produce stable and predictable results for our investors, our customers and the communities we serve. Our nonregulated business also adds value to our portfolio of assets. Although we do not rule out acquisitions, we are dedicated to growth for the foreseeable future from investing principally in our regulated assets.
A CLEAR FOCUS
Even more importantly, our growth strategy is designed to advance our goal of becoming the nation’s safest natural gas utility. Fortunately, the states we serve began recognizing the need to modernize infrastructure before the rest of the nation. Legislatures and regulatory author-ities in our states have promulgated or approved rate design that encourages investments to replace or fortify infrastructure and significantly reduces the lag time in recovering those investments. Today we are recovering and earning on approximately 91 percent of our infrastructure investments within six months after a test year ends and on 96 percent of our investments within 12 months. This balanced regulatory treatment resulted in our capital spending in fiscal 2014 of $835.3 million. Our projected capital investments in fiscal 2015 should be between $900 million and $1.0 billion. This significant level of capital spending will further our journey toward be-coming the country’s safest utility and will increase our future shareholder value.
Kim R. CocklinPresident and Chief Executive Officer
FISCAL 2014 HIGHLIGHTS
$2.96 earnings per diluted share, a 12% increase over fiscal 2013
$1.48 per share annual dividend
15.5% total shareholder return
$835.3 million in capital expenditures
$134.0 million annual approved operating income increase from rate activities
6.2%reduced weighted average cost
of long-term debt
CREDIT UPGRADESStandard & Poor’s: A-
Moody’s Investor Service: A2
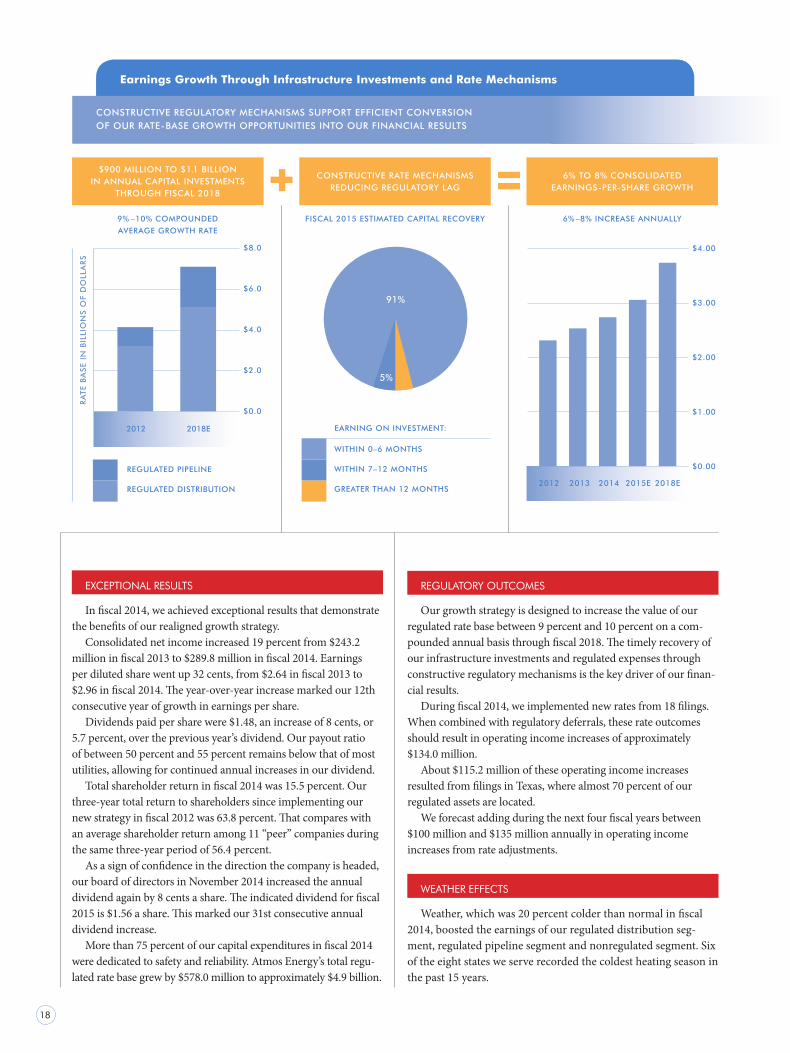
Earnings Growth Through Infrastructure Investments and Rate Mechanisms
18
REGULATORY OUTCOMES
Our growth strategy is designed to increase the value of our regulated rate base between 9 percent and 10 percent on a com-pounded annual basis through fiscal 2018. The timely recovery of our infrastructure investments and regulated expenses through constructive regulatory mechanisms is the key driver of our finan-cial results. During fiscal 2014, we implemented new rates from 18 filings. When combined with regulatory deferrals, these rate outcomes should result in operating income increases of approximately $134.0 million. About $115.2 million of these operating income increases resulted from filings in Texas, where almost 70 percent of our regulated assets are located. We forecast adding during the next four fiscal years between $100 million and $135 million annually in operating income increases from rate adjustments.
WEATHER EFFECTS
Weather, which was 20 percent colder than normal in fiscal 2014, boosted the earnings of our regulated distribution seg-ment, regulated pipeline segment and nonregulated segment. Six of the eight states we serve recorded the coldest heating season in the past 15 years.
EXCEPTIONAL RESULTS In fiscal 2014, we achieved exceptional results that demonstrate the benefits of our realigned growth strategy. Consolidated net income increased 19 percent from $243.2 million in fiscal 2013 to $289.8 million in fiscal 2014. Earnings per diluted share went up 32 cents, from $2.64 in fiscal 2013 to $2.96 in fiscal 2014. The year-over-year increase marked our 12th consecutive year of growth in earnings per share. Dividends paid per share were $1.48, an increase of 8 cents, or 5.7 percent, over the previous year’s dividend. Our payout ratio of between 50 percent and 55 percent remains below that of most utilities, allowing for continued annual increases in our dividend. Total shareholder return in fiscal 2014 was 15.5 percent. Our three-year total return to shareholders since implementing our new strategy in fiscal 2012 was 63.8 percent. That compares with an average shareholder return among 11 “peer” companies during the same three-year period of 56.4 percent. As a sign of confidence in the direction the company is headed, our board of directors in November 2014 increased the annual dividend again by 8 cents a share. The indicated dividend for fiscal 2015 is $1.56 a share. This marked our 31st consecutive annual dividend increase. More than 75 percent of our capital expenditures in fiscal 2014 were dedicated to safety and reliability. Atmos Energy’s total regu-lated rate base grew by $578.0 million to approximately $4.9 billion.
CONSTRUCTIVE REGULATORY MECHANISMS SUPPORT EFFICIENT CONVERSION OF OUR RATE-BASE GROWTH OPPORTUNITIES INTO OUR FINANCIAL RESULTS
$900 MILLION TO $1.1 BILLION IN ANNUAL CAPITAL INVESTMENTS
THROUGH FISCAL 2018
CONSTRUCTIVE RATE MECHANISMS REDUCING REGULATORY LAG
6% TO 8% CONSOLIDATED EARNINGS-PER-SHARE GROWTH
$8.0
$6.0
$4.0
$2.0
$0.0
2012 2018E
REGULATED PIPELINE
REGULATED DISTRIBUTION
WITHIN 0–6 MONTHS
WITHIN 7–12 MONTHS
GREATER THAN 12 MONTHS
EARNING ON INVESTMENT:
9% –10% COMPOUNDED
AVERAGE GROWTH RATE
FISCAL 2015 ESTIMATED CAPITAL RECOVERY 6% –8% INCREASE ANNUALLY
91%
5%
2012 2013 2014 2015E 2018E
$4.00
$3.00
$2.00
$1.00
$0.00
RA
TE B
ASE
IN
BIL
LIO
NS
OF
DO
LLA
RS

19
The effects of colder weather increased the throughput for all three operating segments and added about $17.1 million, or 17 cents per diluted share, to fiscal 2014 consol-idated net income. Atmos Pipeline–Texas (APT), our intrastate natural gas transmission and storage system, transported 714 billion cubic feet of gas during fiscal 2014. APT’s system overlays the prolific Barnett Shale natural gas basin and reaches other producing and shale-gas areas. Its pipelines span across Texas with connections to the state’s three major natural gas hubs at Waha, Katy and Carthage. APT has been adding capabilities to transport reliable and affordable gas supplies to serve primarily our Mid-Tex Division and other local gas distribution customers in Texas. These investments also help APT transport natural gas reliably to new and existing electric power plants and industrial facilities. Higher natural gas consumption during fiscal 2014 also created more volatility in wholesale gas prices. Our nonregulated segment was able to take great advan-tage of the market opportunities caused by the wider spreads in gas prices. Atmos Energy Marketing—which buys, sells and arranges transportation for large volumes of natural gas at competitive prices to major customers in some 20 states and to our own system—nearly tripled its year-over-year contributions to fiscal 2014 consolidated earnings. Because we assume a return to normal weather in fiscal 2015, we do not anticipate our nonregulated segment repeating these results.
FINANCING
To raise additional capital, we sold 9.2 million shares of our common stock in February 2014 at $44.00 a share. We used the $390.2 million of net proceeds from the offering to fund infrastructure improvements, to repay short-term debt under our commercial paper program and to support other corporate needs. In October 2014, we replaced $500 million of maturing 4.95 percent senior notes with $500 million of 4.125 percent senior notes due October 2044. The issuance will reduce our weighted average cost of long-term debt and will save about $8 million annually in interest expense. We also have taken advantage of historically low interest rates to lock in Treasury yield components of interest rates for two planned future refinancings for retiring debt. For our $250 million of 6.35 percent 10-year senior notes maturing in June 2017, the Treasury component of the future issue will effectively be fixed at 3.367 percent. The Treasury component for refinancing our $450 million of 8.50 percent 10-year senior notes that mature in March 2019 will effectively be fixed at 3.857 percent. The refinancings will lower our weighted average cost of debt and will extend weighted average maturities. At the end of the fiscal year on September 30, 2014, our balance sheet was strong with a debt-to-total-capitalization
ratio of 46.2 percent. We had nearly $1.2 billion in available liquidity to meet our expected financial requirements. Rating agencies have recognized the strengths of our bal-ance sheet, constructive regulatory outcomes and peer-lead-ing growth in earnings per share. Our corporate credit ratings were upgraded during the fiscal year by Moody’s Investors Service from Baa1 to A2 and by Standard & Poor’s from BBB+ to A-.
OUTLOOK We have issued Atmos Energy’s fiscal 2015 earnings guidance to be between $2.90 and $3.05 per diluted share, excluding net unrealized margins. Our capital expenditures for fiscal 2015 through fiscal 2018 are projected to be between $900 million and $1.1 billion annually. We expect to finance this growth through $800 million to $1.0 billion of incremental financing. In turn, we forecast that the value of our rate base will increase at a compounded annual growth rate from fiscal 2012 to fiscal 2018 of between 9 percent and 10 percent, with a total value by the end of fiscal 2018 of between $7.2 billion and $7.4 billion. Earnings growth of 6 percent to 8 percent, combined with a dividend yield in the range of 3 percent, should provide our shareholders an attractive total annual return between 9 percent and 11 percent. Significantly, the approximately $4 billion we plan to invest in infrastructure improvements during the next four fiscal years should have little effect on our customers’ total bills. With delivered natural gas prices forecast to remain stable in the range of $5 to $6 per 1,000 cubic feet and assuming normal weather, our average residential customer’s monthly bill should remain well below $60.
AMERICA’S SAFEST GAS COMPANY
In this annual report, we discuss the significant level of capital expenditures we are making in all the states we serve to modernize and expand our natural gas transmission and delivery system. We are a leader in our industry in pursuing these improvements and are proud of the exceptional efforts by our employees to achieve these results. Our goal is to be the safest natural gas company in America. It is a continuing journey toward that goal, but we are fully committed and well on our way to achieving that distinction. It is a goal that will protect and benefit our customers, communities, employees and investors for decades to come.
Kim R. CocklinPresident and Chief Executive OfficerNovember 24, 2014

Natural gas pipeline operators are benefiting from significant improvements in both plastic and steel pipe. High-density polyeth-ylene pipe is now being used for many duties that had required the tensile strength and pressure capacity of metal. Equally important, advances in alloys, coatings and manufacturing methods are producing coated-steel pipe that is even stronger and more resistant to corrosion. As a result, replacement and expansion pipelines now being installed by Atmos Energy and other pipeline operators should be safer, last longer and require less maintenance.
21
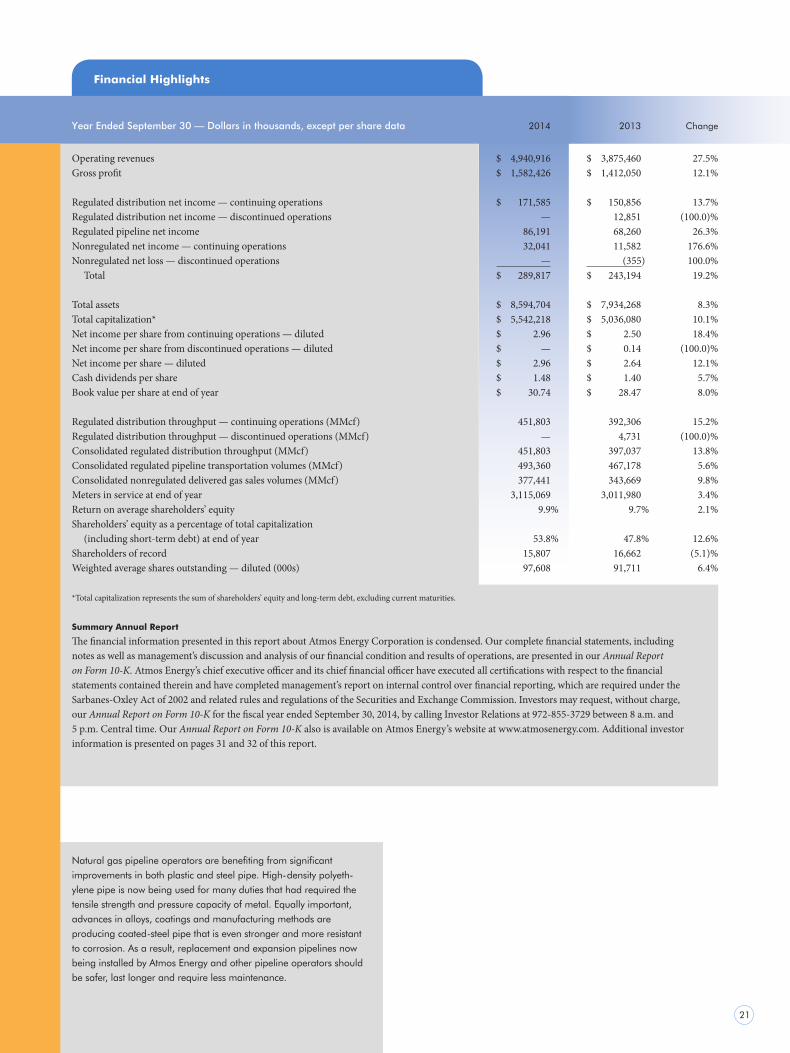
Financial Highlights
Year Ended September 30 — Dollars in thousands, except per share data 2014 2013 Change
Operating revenues $ 4,940,916 $ 3,875,460 27.5%Gross profit $ 1,582,426 $ 1,412,050 12.1%
Regulated distribution net income — continuing operations $ 171,585 $ 150,856 13.7%Regulated distribution net income — discontinued operations — 12,851 (100.0)%Regulated pipeline net income 86,191 68,260 26.3%Nonregulated net income — continuing operations 32,041 11,582 176.6%Nonregulated net loss — discontinued operations — (355) 100.0% Total $ 289,817 $ 243,194 19.2%
Total assets $ 8,594,704 $ 7,934,268 8.3%Total capitalization* $ 5,542,218 $ 5,036,080 10.1%Net income per share from continuing operations — diluted $ 2.96 $ 2.50 18.4%Net income per share from discontinued operations — diluted $ — $ 0.14 (100.0)%Net income per share — diluted $ 2.96 $ 2.64 12.1%Cash dividends per share $ 1.48 $ 1.40 5.7%Book value per share at end of year $ 30.74 $ 28.47 8.0%
Regulated distribution throughput — continuing operations (MMcf) 451,803 392,306 15.2%Regulated distribution throughput — discontinued operations (MMcf) — 4,731 (100.0)%Consolidated regulated distribution throughput (MMcf) 451,803 397,037 13.8%Consolidated regulated pipeline transportation volumes (MMcf) 493,360 467,178 5.6%Consolidated nonregulated delivered gas sales volumes (MMcf) 377,441 343,669 9.8%Meters in service at end of year 3,115,069 3,011,980 3.4%Return on average shareholders’ equity 9.9% 9.7% 2.1%Shareholders’ equity as a percentage of total capitalization (including short-term debt) at end of year 53.8% 47.8% 12.6%Shareholders of record 15,807 16,662 (5.1)%Weighted average shares outstanding — diluted (000s) 97,608 91,711 6.4% *Total capitalization represents the sum of shareholders’ equity and long-term debt, excluding current maturities.
Summary Annual Report
The financial information presented in this report about Atmos Energy Corporation is condensed. Our complete financial statements, including notes as well as management’s discussion and analysis of our financial condition and results of operations, are presented in our Annual Report on Form 10-K. Atmos Energy’s chief executive officer and its chief financial officer have executed all certifications with respect to the financial statements contained therein and have completed management’s report on internal control over financial reporting, which are required under the Sarbanes-Oxley Act of 2002 and related rules and regulations of the Securities and Exchange Commission. Investors may request, without charge, our Annual Report on Form 10-K for the fiscal year ended September 30, 2014, by calling Investor Relations at 972-855-3729 between 8 a.m. and 5 p.m. Central time. Our Annual Report on Form 10-K also is available on Atmos Energy’s website at www.atmosenergy.com. Additional investor information is presented on pages 31 and 32 of this report.

22
Atmos Energy at a Glance
Year Ended September 30 2014 2013
Meters in service
Residential 2,846,664 2,755,831 Commercial 258,404 244,652 Industrial 1,530 1,500 Public authority and other 8,471 9,997 Total meters 3,115,069 3,011,980
Heating degree days*
Actual (weighted average) 2,685 2,729 Percent of normal 102% 103%
Regulated distribution sales volumes — continuing operations (MMcf)
Residential 187,431 154,823 Commercial 105,074 88,850 Industrial 15,746 15,678 Public authority and other 9,069 9,811 Total 317,320 269,162
Regulated distribution transportation volumes — continuing operations (MMcf) 147,776 136,357Total regulated distribution throughput — continuing operations (MMcf) 465,096 405,519Regulated distribution sales volumes — discontinued operations (MMcf) — 3,611 Regulated distribution transportation volumes — discontinued operations (MMcf) — 1,120 Intersegment activity (MMcf) (13,293) (13,213)Consolidated regulated distribution throughput (MMcf) 451,803 397,037Consolidated regulated pipeline transportation volumes (MMcf) 493,360 467,178Consolidated nonregulated delivered gas sales volumes (MMcf) 377,441 343,669
Operating revenues (000s)
Regulated distribution sales revenues Residential $ 1,933,099 $ 1,512,495 Commercial 876,042 661,930 Industrial 90,536 81,155 Public authority and other 64,779 60,557 Total regulated distribution sales revenues 2,964,456 2,316,137 Transportation revenues 64,049 55,938 Other gas revenues 27,707 22,343 Total regulated distribution revenues 3,056,212 2,394,418 Regulated pipeline revenues 92,166 89,011 Nonregulated revenues 1,792,538 1,392,031Total operating revenues (000s) $ 4,940,916 $ 3,875,460
Other statistics
Gross plant (000s) $ 8,447,700 $ 7,722,019 Net plant (000s) $ 6,725,906 $ 6,030,655 Miles of pipe 73,248 72,884 Employees 4,761 4,720
* Heating degree days are adjusted for service areas with weather-normalized operations.

23
Condensed Consolidated Balance Sheets
Year Ended September 30 — Dollars in thousands, except share data 2014 2013
Assets
Property, plant and equipment $ 8,200,121 $ 7,446,272 Construction in progress 247,579 275,747 8,447,700 7,722,019 Less accumulated depreciation and amortization 1,721,794 1,691,364 Net property, plant and equipment 6,725,906 6,030,655 Current assets
Cash and cash equivalents 42,258 66,199 Accounts receivable, less allowance for doubtful accounts of $23,992 in 2014 and $20,624 in 2013 343,400 301,992 Gas stored underground 278,917 244,741 Other current assets 111,265 64,201 Total current assets 775,840 677,133 Goodwill 742,029 741,363 Deferred charges and other assets 350,929 485,117 $ 8,594,704 $ 7,934,268 Capitalization and Liabilities
Shareholders’ equity
Common stock, no par value (stated at $.005 per share); 200,000,000 shares authorized; issued and outstanding: 2014 – 100,388,092 shares, 2013 – 90,640,211 shares $ 502 $ 453 Additional paid-in capital 2,180,151 1,765,811 Accumulated other comprehensive income (loss) (12,393) 38,878 Retained earnings 917,972 775,267 Shareholders’ equity 3,086,232 2,580,409 Long-term debt 2,455,986 2,455,671 Total capitalization 5,542,218 5,036,080 Current liabilities
Accounts payable and accrued liabilities 311,604 241,611 Other current liabilities 402,351 368,891 Short-term debt 196,695 367,984 Total current liabilities 910,650 978,486 Deferred income taxes 1,286,616 1,164,053 Regulatory cost of removal obligation 445,387 359,299 Pension and postretirement liabilities 340,963 358,787 Deferred credits and other liabilities 68,870 37,563 $ 8,594,704 $ 7,934,268
24
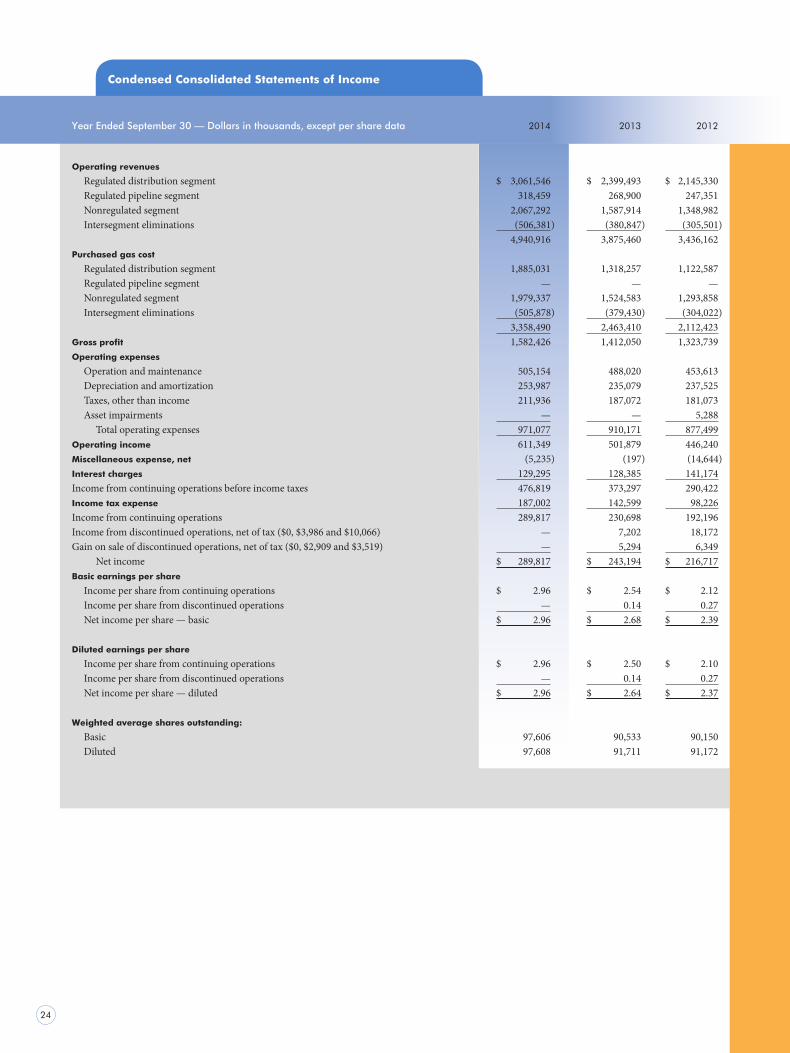
Condensed Consolidated Statements of Income
Year Ended September 30 — Dollars in thousands, except per share data 2014 2013 2012
Operating revenues
Regulated distribution segment $ 3,061,546 $ 2,399,493 $ 2,145,330 Regulated pipeline segment 318,459 268,900 247,351 Nonregulated segment 2,067,292 1,587,914 1,348,982 Intersegment eliminations (506,381) (380,847) (305,501) 4,940,916 3,875,460 3,436,162Purchased gas cost
Regulated distribution segment 1,885,031 1,318,257 1,122,587 Regulated pipeline segment — — — Nonregulated segment 1,979,337 1,524,583 1,293,858 Intersegment eliminations (505,878) (379,430) (304,022) 3,358,490 2,463,410 2,112,423Gross profit 1,582,426 1,412,050 1,323,739Operating expenses
Operation and maintenance 505,154 488,020 453,613 Depreciation and amortization 253,987 235,079 237,525 Taxes, other than income 211,936 187,072 181,073 Asset impairments — — 5,288 Total operating expenses 971,077 910,171 877,499Operating income 611,349 501,879 446,240Miscellaneous expense, net (5,235) (197) (14,644) Interest charges 129,295 128,385 141,174 Income from continuing operations before income taxes 476,819 373,297 290,422 Income tax expense 187,002 142,599 98,226 Income from continuing operations 289,817 230,698 192,196Income from discontinued operations, net of tax ($0, $3,986 and $10,066) — 7,202 18,172Gain on sale of discontinued operations, net of tax ($0, $2,909 and $3,519) — 5,294 6,349 Net income $ 289,817 $ 243,194 $ 216,717Basic earnings per share Income per share from continuing operations $ 2.96 $ 2.54 $ 2.12 Income per share from discontinued operations — 0.14 0.27 Net income per share — basic $ 2.96 $ 2.68 $ 2.39
Diluted earnings per share Income per share from continuing operations $ 2.96 $ 2.50 $ 2.10 Income per share from discontinued operations — 0.14 0.27 Net income per share — diluted $ 2.96 $ 2.64 $ 2.37
Weighted average shares outstanding:
Basic 97,606 90,533 90,150 Diluted 97,608 91,711 91,172

25
Condensed Consolidated Statements of Cash Flows
Year Ended September 30 — Dollars in thousands 2014 2013 2012
Cash Flows from Operating Activities
Net income $ 289,817 $ 243,194 $ 216,717 Adjustments to reconcile net income to net cash
provided by operating activities:
Asset impairments — — 5,288 Gain on sale of discontinued operations — (8,203) (9,868) Depreciation and amortization: Charged to depreciation and amortization 253,987 236,928 246,093 Charged to other accounts 969 679 484 Deferred income taxes 189,952 141,336 104,319 Stock-based compensation 25,531 17,814 19,222 Debt financing costs 9,409 8,480 8,147 Other (428) (2,887) (493) Changes in assets and liabilities (29,251) (24,214) (2,992) Net cash provided by operating activities 739,986 613,127 586,917
Cash Flows Used in Investing Activities
Capital expenditures (835,251) (845,033) (732,858) Proceeds from the sale of discontinued operations — 153,023 128,223 Other, net (2,325) (4,904) (4,625) Net cash used in investing activities (837,576) (696,914) (609,260)
Cash Flows from Financing Activities
Net increase (decrease) in short-term debt (165,865) (208,070) 354,141 Net proceeds from issuance of long-term debt — 493,793 — Net proceeds from equity offering 390,205 — — Settlement of Treasury lock agreements — (66,626) — Repayment of long-term debt — (131) (257,034) Cash dividends paid (146,248) (128,115) (125,796) Repurchase of common stock — — (12,535) Repurchase of equity awards (8,717) (5,150) (5,219) Issuance of common stock 4,274 46 1,606 Net cash provided by (used in) financing activities 73,649 85,747 (44,837)Net increase (decrease) in cash and cash equivalents (23,941) 1,960 (67,180)Cash and cash equivalents at beginning of year 66,199 64,239 131,419Cash and cash equivalents at end of year $ 42,258 $ 66,199 $ 64,239
26
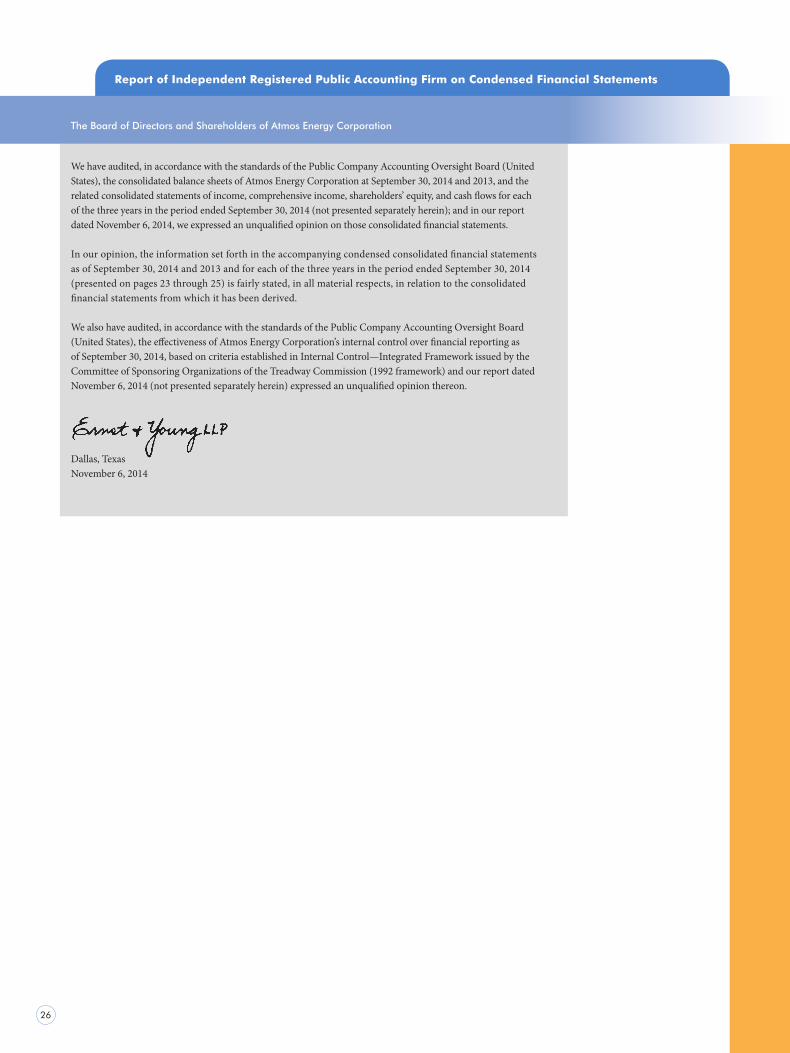
Report of Independent Registered Public Accounting Firm on Condensed Financial Statements
The Board of Directors and Shareholders of Atmos Energy Corporation
We have audited, in accordance with the standards of the Public Company Accounting Oversight Board (United States), the consolidated balance sheets of Atmos Energy Corporation at September 30, 2014 and 2013, and the related consolidated statements of income, comprehensive income, shareholders’ equity, and cash flows for each of the three years in the period ended September 30, 2014 (not presented separately herein); and in our report dated November 6, 2014, we expressed an unqualified opinion on those consolidated financial statements.
In our opinion, the information set forth in the accompanying condensed consolidated financial statements as of September 30, 2014 and 2013 and for each of the three years in the period ended September 30, 2014 (presented on pages 23 through 25) is fairly stated, in all material respects, in relation to the consolidated financial statements from which it has been derived.
We also have audited, in accordance with the standards of the Public Company Accounting Oversight Board (United States), the effectiveness of Atmos Energy Corporation’s internal control over financial reporting as of September 30, 2014, based on criteria established in Internal Control—Integrated Framework issued by the Committee of Sponsoring Organizations of the Treadway Commission (1992 framework) and our report dated November 6, 2014 (not presented separately herein) expressed an unqualified opinion thereon.
Dallas, TexasNovember 6, 2014

27
Condensed Financial and Statistical Summary 2010–2014
Year Ended September 30 2014 2013 2012 2011 2010
Balance Sheet Data at September 30 (000s)
Capital expenditures $ 835,251 $ 845,033 $ 732,858 $ 622,965 $ 542,636 Net property, plant and equipment 6,725,906 6,030,655 5,475,604 5,147,918 4,793,075Working capital (134,810) (301,353) (447,992) 143,355 (290,887)Total assets 8,594,704 7,934,268 7,495,675 7,282,871 6,763,791Shareholders’ equity 3,086,232 2,580,409 2,359,243 2,255,421 2,178,348 Long-term debt, excluding current maturities 2,455,986 2,455,671 1,956,305 2,206,117 1,809,551 Total capitalization 5,542,218 5,036,080 4,315,548 4,461,538 3,987,899
Income Statement Data
Operating revenues (000s) $ 4,940,916 $ 3,875,460 $ 3,436,162 $ 4,286,435 $ 4,661,060 Gross profit (000s) 1,582,426 1,412,050 1,323,739 1,300,820 1,314,136 Income from continuing operations (000s) 289,817 230,698 192,196 189,588 189,851 Income from discontinued operations, net of tax (000s) — 12,496 24,521 18,013 15,988 Net income (000s) 289,817 243,194 216,717 207,601 205,839 Income per share from continuing operations—diluted 2.96 2.50 2.10 2.07 2.03 Income per share from discontinued operations—diluted — 0.14 0.27 0.20 0.17 Net income per diluted share 2.96 2.64 2.37 2.27 2.20
Common Stock Data
Shares outstanding (000s) End of year 100,388 90,640 90,240 90,296 90,164 Weighted average—diluted 97,608 91,711 91,172 90,652 92,422 Cash dividends per share $ 1.48 $ 1.40 $ 1.38 $ 1.36 $ 1.34Shareholders of record 15,807 16,662 17,775 18,680 19,738 Market price— High $ 53.40 $ 45.19 $ 36.94 $ 34.98 $ 30.06 Low $ 41.08 $ 33.20 $ 30.60 $ 28.87 $ 26.41 End of year $ 47.70 $ 42.59 $ 35.79 $ 32.45 $ 29.25 Book value per share at end of year $ 30.74 $ 28.47 $ 26.14 $ 24.98 $ 24.16 Price/Earnings ratio at end of year 16.11 16.13 15.10 14.30 13.30 Market/Book ratio at end of year 1.55 1.50 1.37 1.30 1.21Annualized dividend yield at end of year 3.1% 3.3% 3.9% 4.2% 4.6%
Customers and Volumes (as metered)
Consolidated regulated distribution sales volumes (MMcf) 317,320 272,773 255,725 289,927 322,628 Consolidated regulated distribution transportation volumes (MMcf) 134,483 124,264 135,258 134,093 131,547 Consolidated regulated distribution throughput (MMcf) 451,803 397,037 390,983 424,020 454,175 Consolidated regulated pipeline transportation volumes (MMcf) 493,360 467,178 466,527 435,012 428,599Consolidated nonregulated delivered gas sales volumes (MMcf) 377,441 343,669 351,628 384,799 353,853 Meters in service at end of year 3,115,069 3,011,980 3,116,589 3,213,191 3,186,040 Regulated distribution average cost of gas per Mcf sold $ 5.94 $ 4.91 $ 4.64 $ 5.30 $ 5.77 Regulated distribution average transportation fee per Mcf $ 0.47 $ 0.45 $ 0.43 $ 0.46 $ 0.46
Statistics
Return on average shareholders’ equity 9.9% 9.7% 9.3% 9.1% 9.1%Number of employees 4,761 4,720 4,759 4,949 4,913 Net regulated distribution plant per meter $ 1,670 $ 1,567 $ 1,468 $ 1,362 $ 1,243 Regulated distribution operation and maintenance expense per meter $ 124 $ 126 $ 118 $ 111 $ 114 Meters per employee—regulated distribution 679 662 680 676 676 Times interest earned before income taxes 4.63 4.01 3.27 3.13 3.09

Atmos Energy Officers
Kim R. Cocklin
President and Chief Executive Officer
Bret J. Eckert
Senior Vice President andChief Financial Officer
Louis P. Gregory
Senior Vice President,General Counsel andCorporate Secretary
Michael E. Haefner
Senior Vice President,Human Resources
Marvin L. Sweetin
Senior Vice President,Utility Operations
J. Kevin Akers
President,Kentucky/Mid-States Division
Richard A. Erskine
President,Atmos Pipeline–Texas Division
David E. Gates
President,Mississippi Division
Gary W. Gregory
President,Colorado-Kansas Division
Tom S. Hawkins, Jr.
President,Louisiana Division
John A. Paris
President,Mid-Tex Division
David J. Park
President,West Texas Division
Senior Management Team
28
Regulated Divisions

29
Atmos Energy Officers
J. Kevin Akers
President,Kentucky/Mid-States Division
Richard A. Erskine
President,Atmos Pipeline–Texas Division
David E. Gates
President,Mississippi Division
Gary W. Gregory
President,Colorado-Kansas Division
Tom S. Hawkins, Jr.
President,Louisiana Division
John A. Paris
President,Mid-Tex Division
David J. Park
President,West Texas Division
Mark S. Bergeron
President,Atmos Energy Holdings, Inc.
Verlon R. Aston, Jr.
Vice President,Governmental andPublic Affairs
Clay C. Cash
Vice President,Customer Service
Christopher T. Forsythe
Vice President and Controller
Susan K. Giles
Vice President,Investor Relations
Richard J. Gius
Vice President andChief Information Officer
Conrad E. Gruber
Vice President,Strategic Planning
Kenneth M. Malter
Vice President,Gas Supply and Services
John S. McDill
Vice President,Pipeline Safety
Edward Pace McDonald IV
Vice President, Tax
Daniel M. Meziere
Vice President and Treasurer
Shared Services
Nonregulated Operations Shared Services (continued)

R
30
Board of Directors
Robert W. Best
Chairman of the Board,Atmos Energy CorporationDallas, TexasBoard member since 1997Committee: Executive (Chair)
Kim R. Cocklin
President and Chief Executive Officer,Atmos Energy CorporationDallas, TexasBoard member since 2009
Richard W. Douglas
Executive Vice President, Jones Lang LaSalle LLCDallas, TexasBoard member since 2007Committees: Human Resources, Nominating and Corporate Governance, Work Session/Annual Meeting
Ruben E. Esquivel
Vice President for Community and Corporate Relations, UT Southwestern Medical CenterDallas, TexasBoard member since 2008Committees: Audit, Human Resources
Richard K. Gordon
General Partner, Juniper Capital LP and Juniper Energy LPHouston, TexasBoard member since 2001 Committees: Human Resources (Chair), Executive, Nominating and Corporate Governance
Robert C. Grable
Partner, Kelly Hart & Hallman LLPFort Worth, TexasBoard member since 2009Committees: Audit, Human Resources,Work Session/Annual Meeting
Dr. Thomas C. Meredith
President, Effective Leadership LLC Oxford, MississippiBoard member since 1995Committees: Work Session/ Annual Meeting (Chair), Executive, Human Resources, Nominating and Corporate Governance
Nancy K. Quinn
Independent Energy Consultant Key Biscayne, FloridaBoard member since 2004Lead Director since 2013 Committees: Audit (Chair), Executive, Nominating and Corporate Governance
Richard A. Sampson
General Partner and Founder, RS Core Capital, LLCDenver, ColoradoBoard member since 2012Committees: Audit, Human Resources
Stephen R. Springer
Retired Senior Vice President and General Manager, Midstream Division, The Williams Companies, Inc. Fort Myers Beach, FloridaBoard member since 2005Committee: Work Session/ Annual Meeting
Richard Ware II
Chairman and President, Amarillo National BankAmarillo, TexasBoard member since 1994Committees: Nominating and Corporate Governance (Chair), Audit, Executive, Work Session/Annual Meeting
Charles K. Vaughan
Honorary Director, Retired Chairman of the Board and Retired Lead Director, Atmos Energy CorporationDallas, TexasBoard member from 1983 to 2012

31
Corporate Information
Common Stock Listing New York Stock Exchange. Trading symbol: ATO
Stock Transfer Agent and Registrar
American Stock Transfer & Trust Company, LLCOperations Center6201 15th AvenueBrooklyn, New York 11219800-543-3038
To inquire about your Atmos Energy common stock, please call AST at the telephone number above. You may use the agent’s interactive voice response system 24 hours a day to learn about transferring stock or to check your recent account activity, all without the assistance of a customer service representative. Please have available your Atmos Energy shareholder account number and your Social Security or federal taxpayer ID number.
To speak to an AST customer service representative, please call the same number between 8 a.m. and 8 p.m. Eastern time, Monday through Thursday, or 8 a.m. to 5 p.m. Eastern time on Friday.
You also may send an email message on our transfer agent’s website at www.amstock.com. Please refer to Atmos Energy in your email message and include your Atmos Energy shareholder account number.
Independent Registered Public Accounting Firm
Ernst & Young LLPOne Victory ParkSuite 20002323 Victory Avenue Dallas, Texas 75219214-969-8000
Form 10-K
Atmos Energy Corporation’s Annual Report on Form 10-K is available at no charge from Investor Relations, Atmos Energy Corporation, P.O. Box 650205, Dallas, Texas 75265-0205 or by calling 972-855-3729 between 8 a.m. and 5 p.m. Central time. Atmos Energy’s Form 10-K also may be viewed on Atmos Energy’s website at www.atmosenergy.com.
Annual Meeting of Shareholders
The 2015 Annual Meeting of Shareholders will be held at the Charles K. Vaughan Center, 3697 Mapleshade Lane, Plano, Texas 75075 on Wednes-day, February 4, 2015, at 9:00 a.m. Central time.
Direct Stock Purchase Plan
Atmos Energy has a Direct Stock Purchase Plan that is available to all investors. For an Enrollment Application Form and a Plan Prospectus, please call AST at 800-543-3038. The Prospectus is also available at www.atmosenergy.com. You may also obtain information by writing to Investor Relations, Atmos Energy Corporation, P.O. Box 650205, Dallas, Texas 75265-0205.
This is not an offer to sell, or a solicitation to buy, any securities of Atmos Energy Corporation. Shares of Atmos Energy common stock purchased through the Direct Stock Purchase Plan will be offered only by Prospectus.
Atmos Energy on the Internet
Information about Atmos Energy is available on the Internet at www.atmosenergy.com. Our website includes news releases, current and historical financial reports, other investor data, corporate governance documents, management biographies, customer information and facts about Atmos Energy’s operations.
Atmos Energy Corporation Contacts
To contact Atmos Energy’s Investor Relations, call 972-855-3729 between 8 a.m. and 5 p.m. Central time or send an email message to [email protected].
Securities analysts and investment managers, please contact:Susan K. GilesVice President, Investor Relations972-855-3729 (voice) 972-855-3040 (fax)[email protected]

32
Forward-looking Statements
The matters discussed or incorporated by reference in this Summary Annual Report may contain “forward-looking statements” within the meaning of Section 27A of the Securities Act of 1933 and Section 21E of the Securities Exchange Act of 1934. All statements other than statements of historical fact included in this report are for-ward-looking statements made in good faith by the Company and are intended to qualify for the safe harbor from liability established by the Private Securities Litigation Reform Act of 1995. When used in this report or any other of the Company’s documents or oral presentations, the words “anticipate,” “believe,” “estimate,” “expect,” “forecast,” “goal,” “intend,” “objective,” “plan,” “projection,” “seek,” “strategy” or similar words are intended to identify for-ward-looking statements. Such forward-looking statements are subject to risks and uncertainties that could cause actual results to differ materially from those discussed in this report. These risks and uncertainties are discussed in the Company’s Annual Report on Form 10-K for the fiscal year ended September 30, 2014. Although the Company believes these forward-looking statements to be reasonable, there can be no assurance that they will approximate actual experience or that the expectations derived from them will be realized. Further, the Company undertakes no obligation to update or revise any of its forward-looking statements, whether as a result of new information, future events or otherwise.
Other Information
You can view this Summary Annual Report, our Annual Report on Form 10-K and other financial documents for fiscal 2014 and previous years at www.atmosenergy.com.
If you are a shareholder who would like to receive our Summary Annual Report and other company documents electronically in the future, please sign up for electronic distribution. It’s convenient and easy, and it saves the costs to produce and distribute these materials.
To receive these documents by electronic delivery next year, please visit www.atmosenergy.com or www.proxyvote.com to give your consent. Please remember that accessing our Summary Annual Report and other company docu-ments over the Internet may result in charges to you from your Internet service provider or telephone company.
© 2014 Atmos Energy Corporation. All rights reserved.
Atmos Energy® is a registered trademark of Atmos Energy Corporation.
Cover: Texas State Highway Loop 12, the inner beltway surrounding Dallas, is among the busiest transportation corridors in the Dallas-Fort Worth Metroplex. Beneath the highway lies another major transportation artery, Atmos
Energy’s Line DT-3. This 24-inch pipeline transports natural gas for thousands of homes and businesses in the Dal-las central business district, the I-35 corridor, Irving, Las Colinas, Arlington, Grand Prairie and the Mid-Cities. It also
provides essential pressure control for the region and lets us dispatch gas supplies either north or south, depending on our customers’ demands. All DT-3 pipe and related facilities in Irving and Las Colinas are being replaced by
fiscal 2016 to ensure long-term safety and reliability. It is one of Atmos Energy’s major multi-year pipeline projects.
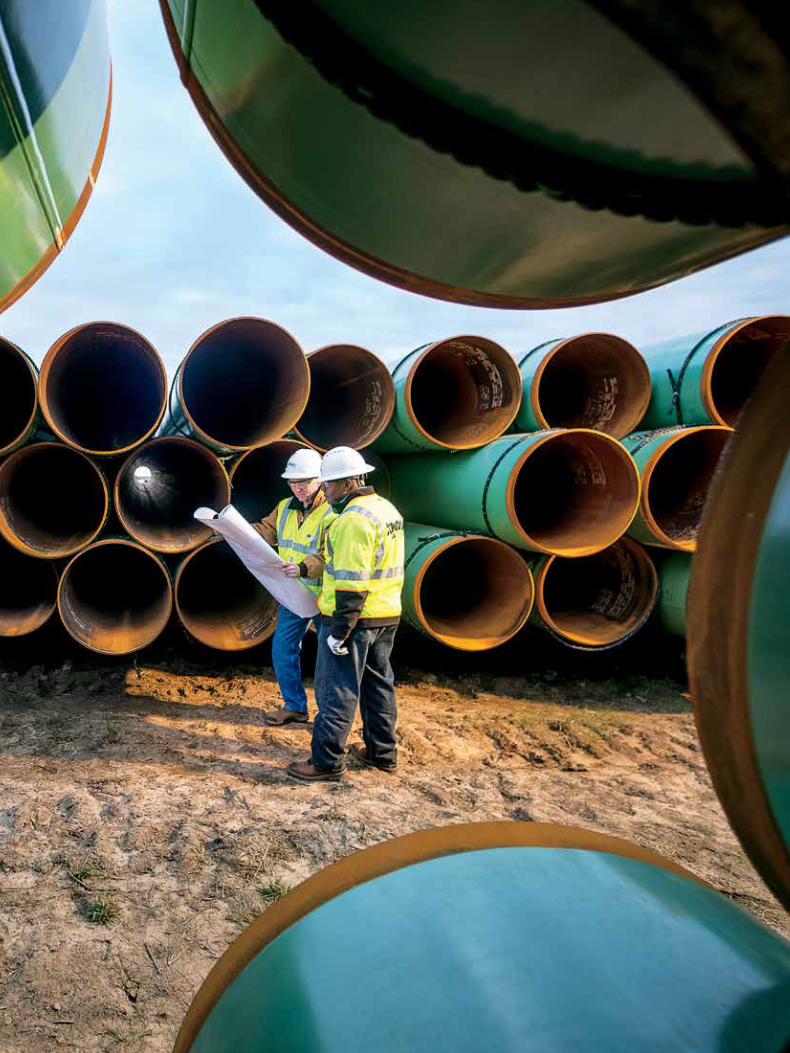
Page 16: Phil Watkins (left), project manager and senior engineer, and Roy Moss, a district operations manager, survey an inventory of 30-inch coated steel pipe that will be installed during fiscal 2015. Along with related 24-inch
and 12-inch transmission projects, the new pipelines will fortify Atmos Pipeline–Texas’ capabilities to transport natural gas from two of its natural gas storage fields to meet the growing needs of the Mid-Tex Division and other
Atmos Pipeline–Texas customers. The total project will cost an estimated $200 million to $230 million.
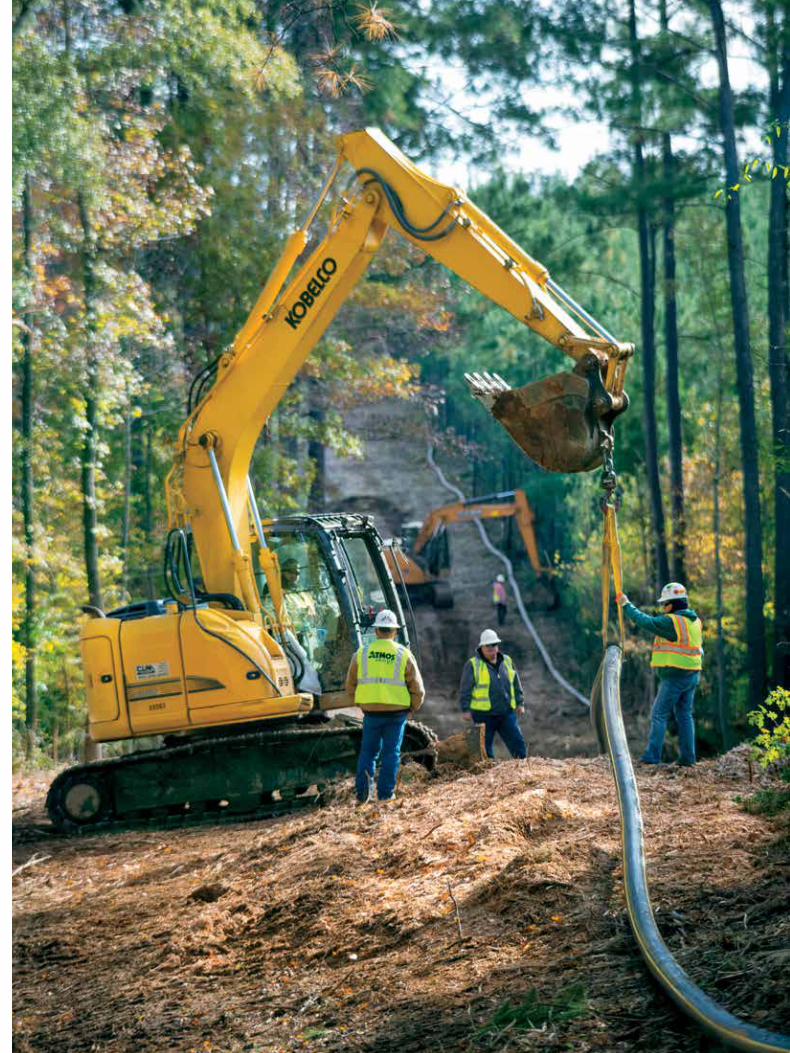
Opposite: Near the beautiful Sabine National Forest in western Louisiana, 2.5 miles of 6-inch advanced polyeth-ylene pipeline is being installed to replace a bare steel main that serves the city of Many. The project is one of many
under way today in our Louisiana Division to replace aging pipelines. It is the result of the Louisiana Public Service Commission authorizing in June 2014 an infrastructure deferral mechanism for safety and reliability projects.

Atmos Energy CorporationP.O. Box 650205
Dallas, Texas 75265-0205
atmosenergy.com