investment analysis and portfolio managementjnujprdistance.com/assets/lms/lms jnu/mba/mba - banking...
TRANSCRIPT
Investment Analysis and Portfolio Management
This book is a part of the course by Jaipur National University, Jaipur.This book contains the course content for Investment Analysis and Portfolio Management.
JNU, JaipurFirst Edition 2014
The content in the book is copyright of JNU. All rights reserved.No part of the content may in any form or by any electronic, mechanical, photocopying, recording, or any other means be reproduced, stored in a retrieval system or be broadcast or transmitted without the prior permission of the publisher.
JNU makes reasonable endeavours to ensure content is current and accurate. JNU reserves the right to alter the content whenever the need arises, and to vary it at any time without prior notice.

I/JNU OLE
Index
ContentI. ...................................................................... II
List of FiguresII. ....................................................... VII
List of TablesIII. .......................................................VIII
AbbreviationsIV. .........................................................IX
Case StudyV. .............................................................. 127
BibliographyVI. ........................................................ 135
Self Assessment AnswersVII. ................................... 138
Book at a Glance
II/JNU OLE
Contents
Chapter I ....................................................................................................................................................... 1Introduction to Investment Analysis .......................................................................................................... 1Aim ................................................................................................................................................................ 1Objectives ...................................................................................................................................................... 1Learning outcome .......................................................................................................................................... 11.1 Introduction .............................................................................................................................................. 2 1.1.1 Definition of Investment .......................................................................................................... 21.2 Characteristics of Investment ................................................................................................................... 21.3 Need and Importance of Investments ...................................................................................................... 41.4 Classification of Investment ................................................................................................................... 51.5 Saving and Investment ............................................................................................................................. 51.6 Investment Activity .................................................................................................................................. 61.7 Measures of Return and Risk ................................................................................................................... 6 1.7.1 Measures of Historical Rates of Return ................................................................................... 7 1.7.2 Computing Mean Historical Returns ....................................................................................... 7 1.7.3 Measuring the Risk of Expected Rates of Return .................................................................... 91.8 Determinants of Required Rate of Return ............................................................................................. 101.9 Investing Versus Financing .................................................................................................................... 101.10 Direct Versus Indirect Investment .........................................................................................................111.11 Investment Environment ...................................................................................................................... 12 1.11.1 Investment Vehicles ............................................................................................................. 12 1.11.2 Financial Markets ................................................................................................................. 171.12 Investment Management Process ......................................................................................................... 20 1.12.1 Setting of Investment Policy ................................................................................................ 20 1.12.2 Analysis and Evaluation of Investment Vehicles ................................................................. 20 1.12.3 Formation of Diversified Investment Portfolio ................................................................... 21 1.12.4 Portfolio Revision ................................................................................................................ 21 1.12.5 Measurement and Evaluation of Portfolio Performance ...................................................... 21Summary ..................................................................................................................................................... 22References ................................................................................................................................................... 22Recommended Reading ............................................................................................................................. 22Self Assessment ........................................................................................................................................... 23
Chapter II ................................................................................................................................................... 25Risk and Return in Investment Analysis ................................................................................................. 25Aim .............................................................................................................................................................. 25Objectives .................................................................................................................................................... 25Learning outcome ........................................................................................................................................ 252.1 Introduction ............................................................................................................................................ 26 2.1.1 Elements of Risk .................................................................................................................... 26 2.1.2 Sources of Risk ...................................................................................................................... 26 2.1.3 Investment Income and Risk .................................................................................................. 27 2.1.4 Return on Investment and Expected Rate of Return .............................................................. 27 2.1.5 Variance and Co-variance ...................................................................................................... 282.2 Risk and Return ...................................................................................................................................... 29 2.2.1 Covariance ............................................................................................................................. 29 2.2.2 Correlation and Coefficient of Determination ....................................................................... 32 2.2.3 Effect of Diversification ........................................................................................................ 34 2.2.4 Two Assets ............................................................................................................................. 352.3 Return ..................................................................................................................................................... 36 2.3.1 Stock Returns ......................................................................................................................... 36 2.3.2 Characteristic Line and Beta Factor ....................................................................................... 36 2.3.3 Residual Variance................................................................................................................... 38
III/JNU OLE
2.3.4 Portfolio Return ..................................................................................................................... 38 2.3.5 Mean Return ......................................................................................................................... 38Summary ..................................................................................................................................................... 39References ................................................................................................................................................... 39Recommended Reading ............................................................................................................................. 39Self Assessment ........................................................................................................................................... 40
Chapter III .................................................................................................................................................. 42Fundamental and Technical Analysis for Investing in Stock ................................................................. 42Aim .............................................................................................................................................................. 42Objectives .................................................................................................................................................... 42Learning outcome ........................................................................................................................................ 423.1 Introduction ............................................................................................................................................ 43 3.1.1 Influence of the Economy ..................................................................................................... 433.2 Economic Analysis ................................................................................................................................. 443.3 Industry Analysis ................................................................................................................................... 45 3.3.1 Industry Life Cycle ................................................................................................................ 45 3.3.2 Industry Characteristics ......................................................................................................... 463.4 Company Analysis ................................................................................................................................ 473.5 Technical Analysis ................................................................................................................................. 47 3.5.1 Basics of Technical Analysis ................................................................................................. 48 3.5.2 Basic Principles of Technical Analysis .................................................................................. 483.6 Tools of Technical Analysis ................................................................................................................... 48 3.6.1 Dow Theory ........................................................................................................................... 48 3.6.2 Bullish Trend .......................................................................................................................... 48 3.6.3 Bearish Trend ......................................................................................................................... 48 3.6.4 Chartist Method ..................................................................................................................... 49 3.6.5 Charts and Trade Lines .......................................................................................................... 49 3.6.6 Criticism of Dow ................................................................................................................... 50Summary ..................................................................................................................................................... 51References ................................................................................................................................................... 51Recommended Reading ............................................................................................................................. 51Self Assessment ........................................................................................................................................... 52
Chapter IV .................................................................................................................................................. 54Portfolio Management ............................................................................................................................... 54Aim .............................................................................................................................................................. 54Objectives .................................................................................................................................................... 54Learning outcome ........................................................................................................................................ 544.1 Introduction ............................................................................................................................................ 55 4.1.1 Portfolio Meaning and Definition .......................................................................................... 55 4.1.2 Objectives of Portfolio management ..................................................................................... 564.2 Portfolio Theory ..................................................................................................................................... 56 4.2.1 Markowitz Portfolio Theory .................................................................................................. 56 4.2.2 The Expected Rate of Return and Risk of Portfolio .............................................................. 594.3 Arbitrage Price Theory ........................................................................................................................... 604.4 Market Efficiency Theory ...................................................................................................................... 61Summary ..................................................................................................................................................... 63References ................................................................................................................................................... 63Recommended Reading ............................................................................................................................. 63Self Assessment ........................................................................................................................................... 64
IV/JNU OLE
Chapter V .................................................................................................................................................... 66Capital Asset Pricing Model ...................................................................................................................... 66Aim .............................................................................................................................................................. 66Objectives .................................................................................................................................................... 66Learning outcome ........................................................................................................................................ 665.1 Introduction ............................................................................................................................................ 67 5.1.1 Assumptions ........................................................................................................................... 67 5.1.2 CAPM Equilibrium ................................................................................................................ 68 5.1.3 Uses and Limitations ............................................................................................................. 695.2 Capital Market Line (CML) ................................................................................................................... 705.3 Security Market Line ............................................................................................................................. 715.4 CAPM and Single Index ........................................................................................................................ 725.5 Pricing and Discounting ......................................................................................................................... 725.6 Market Portfolio ..................................................................................................................................... 735.7 APT and CAPM ..................................................................................................................................... 74Summary ..................................................................................................................................................... 75References ................................................................................................................................................... 75Recommended Reading ............................................................................................................................. 75Self Assessment ........................................................................................................................................... 76
Chapter VI .................................................................................................................................................. 78Bond Market Analysis ............................................................................................................................... 78Aim .............................................................................................................................................................. 78Objectives .................................................................................................................................................... 78Learning outcome ........................................................................................................................................ 786.1 Introduction ............................................................................................................................................ 796.2 Bond Analysis at Micro Level ............................................................................................................... 79 6.2.1 Identification and Classification of Bonds ............................................................................. 79 6.2.2 Bond-classification by their Key Features ............................................................................. 79 6.2.3 Benefits of Bonds ................................................................................................................... 816.3 Debt Market in India .............................................................................................................................. 82 6.3.1 Public Sector Bonds and Fixed Deposit Bonds ..................................................................... 826.4 Listing of Debentures ............................................................................................................................. 83 6.4.1 OTC Debentures ................................................................................................................... 83 6.4.2 NSE Debentures .................................................................................................................... 836.5 Asset Based Securities (Securitisation) .................................................................................................. 836.6 Inflation and Price Risk ......................................................................................................................... 84 6.6.1 Bond Risk .............................................................................................................................. 846.7 Bond Analysis at Macro Level ............................................................................................................... 84 6.7.1 Credit Rating System ............................................................................................................. 84 6.7.2 Risk Factors ........................................................................................................................... 85 6.7.3 Trust Deeds ............................................................................................................................ 85 6.7.4 SEBI Guidelines .................................................................................................................... 86 6.7.5 Non-risk Factors .................................................................................................................... 87Summary ..................................................................................................................................................... 88References ................................................................................................................................................... 88Recommended Reading ............................................................................................................................. 88Self Assessment ........................................................................................................................................... 89
Chapter VII ................................................................................................................................................ 91Forward and Futures ................................................................................................................................. 91Aim .............................................................................................................................................................. 91Objectives .................................................................................................................................................... 91Learning outcome ........................................................................................................................................ 917.1 Introduction ............................................................................................................................................ 92
V/JNU OLE
7.1.1 Forwards and Futures ............................................................................................................. 927.2 Difference Between Options and Futures .............................................................................................. 937.3 Index Futures and Valuation of Index Futures ....................................................................................... 93 7.3.1 Index Futures ......................................................................................................................... 93 7.3.2 Valuation of Index Futures ..................................................................................................... 937.4 Commodity Futures and Financial Futures ............................................................................................ 94 7.4.1 Commodity Futures ............................................................................................................... 94 7.4.2 Financial Futures .................................................................................................................... 957.5 Motives of Trading ................................................................................................................................ 96 7.5.1 Hedging, Speculation and Arbitrage ...................................................................................... 967.6 Forward Prices ...................................................................................................................................... 98 7.6.1 Investment Asset with No Income ........................................................................................ 98 7.6.2 Investment Asset with Known Income ................................................................................. 99 7.6.3 Continuous Dividend Yield ................................................................................................... 99 7.6.4 Storage Costs ........................................................................................................................ 997.7 Value of Contract ................................................................................................................................... 997.8 Commodities ........................................................................................................................................ 1007.9 Future Compared to Forward ............................................................................................................... 1007.10 Backwardation and Contango ............................................................................................................ 100 7.10.1 Unbiased Predictor. ............................................................................................................ 100 7.10.2 Normal Backwardation. ..................................................................................................... 100 7.10.3 Normal Contango. .............................................................................................................. 1017.11 Derivative Trading in Securities ....................................................................................................... 1017.12 NSE Proposals ................................................................................................................................... 102Summary ................................................................................................................................................... 103References ................................................................................................................................................. 103Recommended Reading ........................................................................................................................... 104Self Assessment ......................................................................................................................................... 105
Chapter VIII ............................................................................................................................................. 107Options and Swaps .................................................................................................................................. 107Aim ............................................................................................................................................................ 107Objectives .................................................................................................................................................. 107Learning outcome ...................................................................................................................................... 1078.1 Introduction .......................................................................................................................................... 1088.2 Options ................................................................................................................................................. 108 8.2.1 Call, Put and Trading Options .............................................................................................. 108 8.2.2 Put Call Parity ...................................................................................................................... 1098.3 Types of Derivatives .............................................................................................................................1108.4 Valuation of European Options .............................................................................................................110 8.4.1 The Basic Binomial Model ...................................................................................................111 8.4.2 The Two-period Binomial .....................................................................................................113 8.4.3 The General Binomial ...........................................................................................................114 8.4.4 Matching to Data ..................................................................................................................1148.5 Options in Futures Contracts ...............................................................................................................1158.6 Introduction to Swaps ...........................................................................................................................115 8.6.1 Interest Rate Swap ................................................................................................................116 8.6.2 Currency Swaps ....................................................................................................................1168.7 Uses of Swaps .......................................................................................................................................117 8.7.1 Market Inefficiency ...............................................................................................................117 8.7.2 Management of Financial Risk .............................................................................................118 8.7.3 Speculation ............................................................................................................................1188.8 Swap market ..........................................................................................................................................118 8.8.1 Features .................................................................................................................................118 8.8.2 Dealers and Brokers ..............................................................................................................118

VI/JNU OLE
8.9 Valuation of Swaps................................................................................................................................119 8.9.1 Replication and Implications ................................................................................................1198.10 Interest Rate Swap Pricing ................................................................................................................. 1208.11 Currency Swap ................................................................................................................................... 121 8.11.1 Interest Rate Parity ............................................................................................................. 121 8.11.2 Fixed-For-Fixed ................................................................................................................. 122 8.11.3 Pricing Summary ............................................................................................................... 123Summary ................................................................................................................................................... 124References ................................................................................................................................................. 124Recommended Reading ........................................................................................................................... 124Self Assessment ......................................................................................................................................... 125
VII/JNU OLE
List of Figures
Fig. 1.1 Characteristics of investment ............................................................................................................ 2Fig. 2.1 Relationship between two assets: positive covariance ................................................................... 30Fig. 2.2 Relationship between two assets: negative covariance .................................................................. 31Fig. 2.3 Relationship between two assets: zero covariance ......................................................................... 31Fig. 2.4 Perfect positive correlation between returns of two assets ............................................................. 32Fig. 2.5 Perfect negative correlation between returns of two assets ............................................................ 32Fig. 2.6 Imperfect positive correlation between returns on two assets ........................................................ 33Fig. 2.7 Zero correlation between returns on two assets .............................................................................. 33Fig. 2.8 Stock’s J characteristic line ............................................................................................................. 37Fig. 3.1 Trade lines....................................................................................................................................... 50Fig. 4.1 Map of indifferent curves for a risk-averse investor ...................................................................... 57Fig. 4.2 Portfolio choice using the assumptions of non-satiation and risk aversion .................................... 58Fig. 4.3 Feasible set and efficient set of portfolios (efficient frontier) ........................................................ 59Fig. 5.1 Portfolio frontier ............................................................................................................................. 68Fig. 5.2 Efficient frontier and market portfolio ........................................................................................... 69Fig. 5.3 Capital market line .......................................................................................................................... 71Fig. 5.4 Security market line ........................................................................................................................ 71Fig. 7.1 Backwardation and contango ........................................................................................................ 101Fig. 8.1 Binomial tree for option pricing ....................................................................................................111Fig. 8.2 Binomial with two sub-intervals ....................................................................................................113Fig. 8.3 Currency swaps ..............................................................................................................................117Fig. 8.4 Exploiting comparative advantage ................................................................................................118Fig. 8.5 Interest rate parity ......................................................................................................................... 121Fig. 8.6 Interest rates and exchange rates .................................................................................................. 122

VIII/JNU OLE
List of Tables
Table 1.1 Types of investing and alternatives for financing ........................................................................ 12Table 1.2 Money market and capital market ................................................................................................ 19Table 7.1 Difference between futures and options ....................................................................................... 93Table 8.1 Interest rates of UK and US firms ...............................................................................................117Table 8.2 Floating and fixed interest rates ................................................................................................. 120
IX/JNU OLE
Abbreviations
ABS - Asset-Backed SecuritiesAM - Arithmetic MeanAPT - Arbitrage Price TheoryATS - Alternative Trading SystemCAPM - Capital Asset Pricing ModelCML - Capital Market LineDGM - Dividend Growth ModelEIC - Economy–Industry–CompanyERP - Equity Risk PremiumGDP - Gross Domestic ProductGM - Geometric MeanGNP - Gross National ProductHPR - Holding Period ReturnHPY - Holding Period YieldICD - Inter Corporate DepositIPO - Initial Public OfferingLCE - London Commodity ExchangeLIBOR - London Inter Bank Offered RateLIFFE - London International Financial Futures ExchangeLTOM - London Traded Options MarketNAV - Net Assets ValueNNP - Net National ProductNSCCL - National Securities Clearing CorporationNSE - National Stock ExchangeOTC - Over-the-CounterPTC - PassthroughCertificatesSEBI - Securities and Exchange Board of IndiaSFR - Swap Fixed RateSPV - Special Purpose VehicleUTI - Union Trust of IndiaWACC - Weighted Average Cost of Capital

1/JNU OLE
Chapter I
Introduction to Investment Analysis
Aim
The aim of this chapter is to:
introduce investment analysis•
explain the characteristics of investment•
explicate the need and importance of investments•
Objectives
The objectives of this chapter are to:
enlisttheclassificationofinvestmentonthebasisofphysicalinvestments•
elucidate saving and investment•
explain investment activity•
Learning outcome
At the end of this chapter, you will be able to:
identify the direct and indirect investments•
understand the measures of return and risk•
recognise the determinants of required rate of return•
Investment Analysis and Portfolio Management
2/JNU OLE
1.1 IntroductionThe term ‘investing’ could be associated with different activities, but the common target in these activities is to ‘employ’ the money (funds) during the time period seeking to enhance the investor’s wealth. Funds to be invested come from assets already owned, borrowed money and savings. By foregoing consumption today and investing their savings, investors expect to enhance their future consumption possibilities by increasing their wealth. However, it is alwaysusefultomakeadistinctionbetweenrealandfinancialinvestments.Realinvestmentsusuallyinvolvesomekind of tangible assets, such as land, machinery, factories, etc. Financial investments involve contracts in paper or electronic form, such as stocks, bonds, etc.
1.1.1 Definition of Investment“Investmentanalysisisthestudyoffinancialsecuritiesforthepurposeofsuccessfulinvesting.”Thisdefinitioncontains the following important points:
Thereareinstitutionalfactsaboutthefinancialsecurities,howtotradeandwhatassetsaretobetraded.•There are analytical issues involved in studying these securities, the calculation of risks and returns, and the •relationship between the two.There is the question of what success means for an investor, and the investment strategies that ensure that the •choices made are successful. Therearefinancialtheoriesthatarenecessarytotrytounderstandhowthemarketsworkandhowtheprices•of assets are determined.
It is clear that the more an investor understands, the less likely they are to make an expensive mistake. Note carefully that this is not saying that the more you know, the more you will earn. An explanation for this observation will be foundinsomeofthetheoriesthatfollow.Thesecommentspartlyaddressthequestion“Canyoubeatthemarket?”Whether you can, depends on the viewyoumayhold about the functioningoffinancialmarkets.Oneof theinterpretations of investment analysis is that this is just not possible on a repeated basis. An alternative interpretation is that knowing the theory reveals where we should look for ways of beating the market.
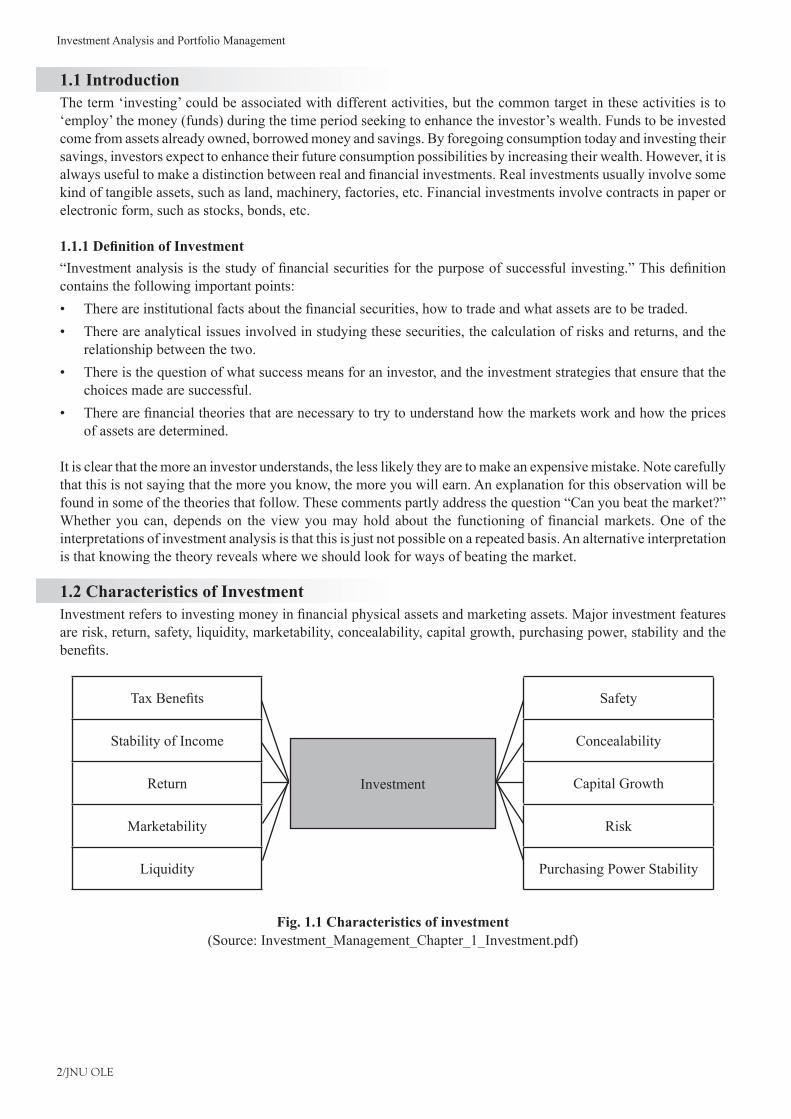
1.2 Characteristics of InvestmentInvestmentreferstoinvestingmoneyinfinancialphysicalassetsandmarketingassets.Majorinvestmentfeaturesare risk, return, safety, liquidity, marketability, concealability, capital growth, purchasing power, stability and the benefits.
TaxBenefits
Stability of Income
Return
Marketability
Liquidity
Safety
Concealability
Capital Growth
Risk
Purchasing Power Stability
Investment
Fig. 1.1 Characteristics of investment(Source: Investment_Management_Chapter_1_Investment.pdf)
3/JNU OLE
RiskRisk refers to the loss of principal amount of an investment. It is one of the major characteristics of an investment. The risk depends on the following factors:
When investment maturity period is longer; investor will take larger risks.•Government or Semi-Government bodies issue securities, which have lesser risks.•Inthecaseofthedebtinstrumentorfixeddeposit,theriskofaboveinvestmentislessduetotheirsecuredand•fixedinterestpayable.Forinstance,debentures.In the case of ownership instrument like equity or preference shares, the risk is more due to their unsecured •nature and variability of their return and ownership character.The risk of degree of variability of returns is more in the case of ownership capital as compared to debt capital. •Thetaxprovisionswouldinfluencethereturnofrisk.
ReturnReturn refers to expected rate of return from an investment. Return is an important characteristic of investment. Returnisthemajorfactorwhichinfluencesthepatternofinvestmentthatismadebytheinvestor.Investoralwaysprefers high rate of return for his investment.
SafetySafety refers to the protection of investor principal amount and expected rate of return. Safety is also one of the essential and crucial elements of investment. Investor prefers his capital’s safety. Capital is the certainty of return without loss of money or it will take time to retain it. If investor prefers less-risk securities, he chooses Government bonds. In cases, where investor prefers high rate of returns, investor will choose private securities, whose safety is low.
LiquidityLiquidity refers to investments ready to be converted into cash. In other words, it is available immediately in the cash form. Liquidity means that investment is easily realisable, saleable or marketable. When the liquidity is high, then the return may be low. For example, UTI units. An investor generally prefers liquidity for his investments and safety of funds through a minimum-risk and maximum-return investment.
MarketabilityMarketability refers to buying and selling of securities in market. Marketability means transferability or saleability of an asset. Securities listed in a stock market are more easily marketable than which are not listed. Public Limited Companies’ shares are more easily transferable than those of private limited companies.
ConcealabilityConcealability is another essential characteristic of the investment. Concealability means investment to be safe from socialdisorders,governmentconfiscationsorunacceptablelevelsoftaxation.Propertymustbeconcealableandshould leave no record of income received from its use or sale. Gold and precious stones have long been esteemed for these purposes, because they combine high-value with small bulk and are readily transferable.
Capital growthCapital growth refers to appreciation of investment. Capital growth has today become an important character of investment. Capital appreciation, also known as capital growth, refers to the increase in the value of an investment overtime.Ittellsyouhowmuchprofityouwouldpaytaxeson,ifyousoldtheinvestmentthatday.Investorsandtheir advisers are constantly seeking ‘growth stock’ in the right industry; bought at the right time.
Purchasing power stabilityIt refers to the buying capacity of investment in market. Purchasing power stability has become one of the import traits of investment. Investment always involves the commitment of current funds with the objective of receiving greater amounts of future funds.
Investment Analysis and Portfolio Management
4/JNU OLE
Stability of incomeIt refers to constant return from an investment. Another major characteristic feature of the investment is the stability of income. Stability of income must look for different paths just as the security of the principal. Every investor must always consider stability of monetary income and stability of the purchasing power of income.
Tax benefitsTaxbenefitisthelastcharacteristicfeatureoftheinvestment.Planninganinvestmentprogrammewithoutconsideringthe tax burden may be costly to the investor. There are actually two problems:
One concerned with the amount of income paid by the investment.•Another is the burden of income tax upon that income.•
1.3 Need and Importance of InvestmentsAn investment is an important and useful factor in the context of present day conditions. Some factors are very important, while considering these investments. They are outlined below:
Longer life expectancy or planning for retirement•Increasing rates of taxation•High interest rates•Highratesofinflation•Larger incomes•Availability of a complex number of investment outlets•
Longer life expectancyInvestmentdecisionshavebecomemoresignificantasmostpeopleinIndiaretirebetweentheagesof56to60.Investment decisions have to be planned to make wise saving decisions. Saving on their own does not increase wealth; the saving must be invested in such a way that the principal and income will be adequate for a greater number of retirement years. Longer life expectancy is one reason for effective savings and further investment activities that help the investment decisions.
Increasing rates of taxationWhen tax rate is increased, it will focus on generating savings by the tax payer. When the tax payer invests their income in provident fund, pension fund, Unit Trust of India, Life Insurance, Unit Linked Insurance Plan, National SavingCertificates,DevelopmentBonds,PostOfficeCumulativeDepositSchemes,etc., itaffectstheirtaxableincome.
Interest ratesInterest rate is one of the most important aspects of a sound investment plan. The interest rate differs from one investment to another. There may be changes between degree of risk and safe investments. They may also differ due todifferentbenefitschemesofferedbytheinstitutions.Ahighrateofinterestmaynotbetheonlyfactorfavouringthe outlet for investment. Stability of interest is an important aspect of receiving a high rate of interest.
InflationInflationhasbecomeacontinuousproblem.Itaffectsintermsofrisingprices.Severalproblemsareassociatedandcoupledwithfallingstandardsofliving.Therefore,investor’scarefulscrutinyoftheinflationwillmakefurtherinvestment process delayed. Investor ensures to check the safety of the principal amount and security of the investment. Both are crucial from the point of view of the interest gained from the investments.
IncomeIncome is another important element of the investment. When government provides jobs to the unemployed persons in the country, the ultimate result is ensuring income than saving the extra income. More incomes and more avenues of investment have led to the ability and willingness of working people to save and invest their funds.
5/JNU OLE
Investment channelsThe growth and development of the country leading to greater economic prosperity has led to the introduction of a vast area of investment outlets. Investment channels mean an investor is willing to invest in several instruments like corporatestock,providentfund,andlifeinsurance,fixeddepositsinthecorporatesectorandunittrustschemes.
1.4 Classification of Investment Theclassificationofinvestmentsintovariousgroupsisexplainedintheparagraphsgivenbelow:On the basis of physical investmentsPhysical investments are as follows:
House•Land•Building•Gold and silver•Precious stones•
On the basis of financial investmentFinancialinvestmentsarefurtherclassifiedonthebasisof:
Marketable and transferable investments•Non-marketable investments•
Marketable investments are as follows:Shares•Debentures of Public Limited Companies, particularly the listed company in Stock Exchange•Bonds of Public Sector Units•Government Securities, etc.•
Non-marketable investments are as follows:Bank deposits•Provident and pension funds•Insurancecertificates•Postofficedeposits•Nationalsavingcertificates•Company deposits•Private company shares, etc.•
1.5 Saving and InvestmentInvestors are savers, but all savers cannot be good investors, as investment is a science and an art. Savings are sometimes autonomous and sometimes inducedby the incentives likefiscal concessions or incomeor capitalappreciation. The number of investors was estimated at about 50 million out of population of more than one billion in India. In the nineties, savers came from all classes except in the case of the population, who were below the poverty line. The growth of urbanisation and literacy has activated the cult of investment. More recently, since the nineties, the investment activity has become more popular with the change in the Government policies towards liberalisation andfinancialderegulation.TheprocessofliberalisationandprivatisationwasacceleratedbytheGovernmentpolicychangestowardsamarket-orientedeconomy,througheconomicandfinancialreformsstartedinJuly1991.
Investment Analysis and Portfolio Management
6/JNU OLE
1.6 Investment ActivityInvestmentactivity includesbuyingandsellingof thefinancialassets,physicalassetsandmarketableassets inprimary and secondary markets. Investment activity involves the use of funds or saving for further creation of assets or acquisition of existing assets.
Accordingly, investment activity refers to acquisition of assets like:Financial assets•Physical assets•Marketable assets from the primary and secondary market•
Financial assets are as follows:Cash•Bank deposits•P.F.•LIC schemes•Pension scheme•Postofficecertificatesanddeposits•
Physical assets are as follows:House,land,buildingandflats•Gold, silver and other metals•Consumer durables•
Marketable assets are as follows:Shares•Bonds•Government securities•M.F schemes•UTI units, etc.•
Investment activity involves the use of funds or saving for further creation of assets or acquisition of existing assets.
1.7 Measures of Return and RiskThese chapters will enable you to choose among alternative investment assets. This selection process requires that you estimate and evaluate the expected risk return trade-offs for the alternative investments available. Therefore, you must understand how to measure the rate of return and the risk involved in an investment accurately. To meet this need, the ways to quantify return and risk are examined. The presentation will consider how to measure both historical and expected rates of return and risk. The historical measures of return and risk are considered with numerous examples of historical average rates of return and risk measures for various assets. Understanding these presentations is very important. In addition, these historical results are often used by investors, when attempting to estimate the expected rates of return and risk for an asset class.
Thefirstmeasureisthehistoricalrateofreturnonanindividualinvestmentoverthetimeperiodtheinvestmentisheld(that is, its holding period). Next, how to measure the average historical rate of return for an individual investment over a number of time periods is considered. The average rate of return for a portfolio of investments is also dealt with. Given the measures of historical rates of return, the traditional measures of risk for a historical time series of returns (that is, the variance and standard deviation) are presented. By following the presentation of measures of historical rates of return and risk, the expected rate of return for an investment is estimated.
7/JNU OLE
1.7.1 Measures of Historical Rates of ReturnWhen you are evaluating alternative investments for inclusion in your portfolio, you will often be comparing investments with widely different prices or lives. As an example, you might want to compare a $10 stock that pays no dividends to a stock selling for $150 that pays dividends of $5 a year. To properly evaluate these two investments, you must accurately compare their historical rates of returns.
When we invest, we defer current consumption in order to add to our wealth, so that we can consume more in the future. Therefore, when we talk about a return on an investment, we are concerned with the change in wealth resultingfromthisinvestment.Thischangeinwealthcanbeeitherduetocashinflows,suchasinterestordividends,or caused by a change in the price of the asset (positive or negative).
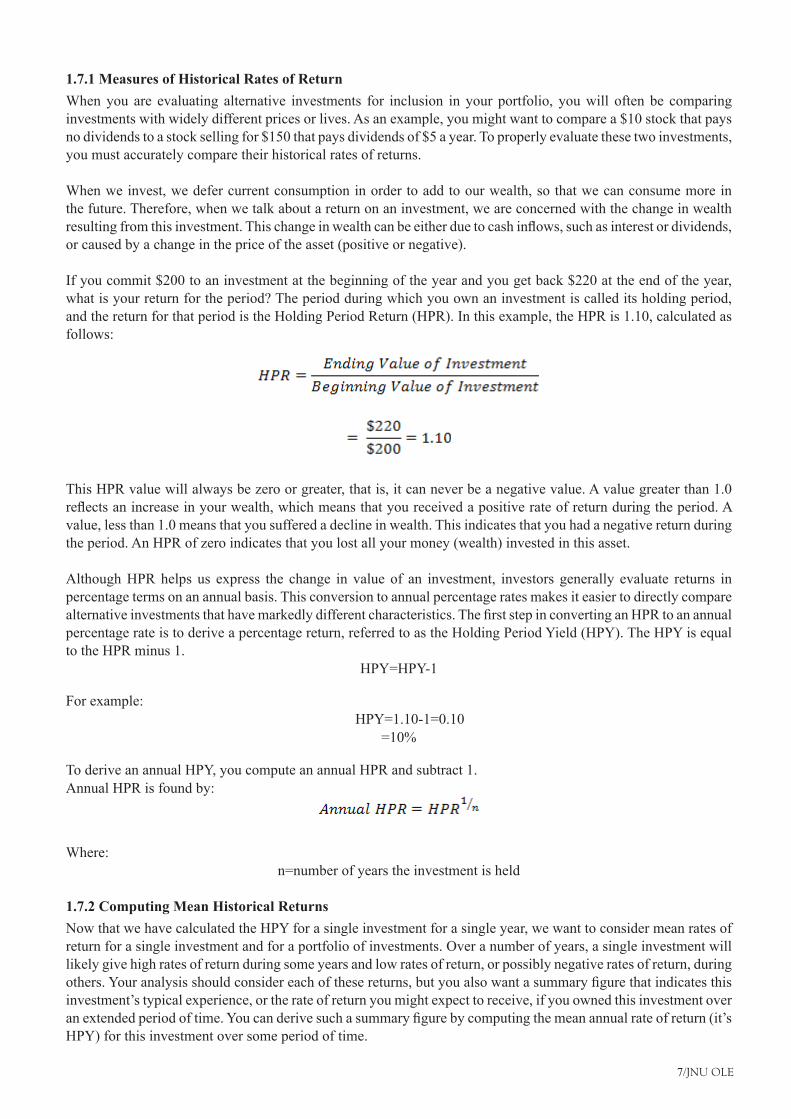
If you commit $200 to an investment at the beginning of the year and you get back $220 at the end of the year, what is your return for the period? The period during which you own an investment is called its holding period, and the return for that period is the Holding Period Return (HPR). In this example, the HPR is 1.10, calculated as follows:
This HPR value will always be zero or greater, that is, it can never be a negative value. A value greater than 1.0 reflectsanincreaseinyourwealth,whichmeansthatyoureceivedapositiverateofreturnduringtheperiod.Avalue, less than 1.0 means that you suffered a decline in wealth. This indicates that you had a negative return during the period. An HPR of zero indicates that you lost all your money (wealth) invested in this asset.
Although HPR helps us express the change in value of an investment, investors generally evaluate returns in percentage terms on an annual basis. This conversion to annual percentage rates makes it easier to directly compare alternativeinvestmentsthathavemarkedlydifferentcharacteristics.ThefirststepinconvertinganHPRtoanannualpercentage rate is to derive a percentage return, referred to as the Holding Period Yield (HPY). The HPY is equal to the HPR minus 1.
HPY=HPY-1
For example: HPY=1.10-1=0.10
=10%
To derive an annual HPY, you compute an annual HPR and subtract 1. Annual HPR is found by:
Where:n=number of years the investment is held
1.7.2 Computing Mean Historical ReturnsNow that we have calculated the HPY for a single investment for a single year, we want to consider mean rates of return for a single investment and for a portfolio of investments. Over a number of years, a single investment will likely give high rates of return during some years and low rates of return, or possibly negative rates of return, during others.Youranalysisshouldconsidereachofthesereturns,butyoualsowantasummaryfigurethatindicatesthisinvestment’s typical experience, or the rate of return you might expect to receive, if you owned this investment over anextendedperiodoftime.Youcanderivesuchasummaryfigurebycomputingthemeanannualrateofreturn(it’sHPY) for this investment over some period of time.
Investment Analysis and Portfolio Management
8/JNU OLE
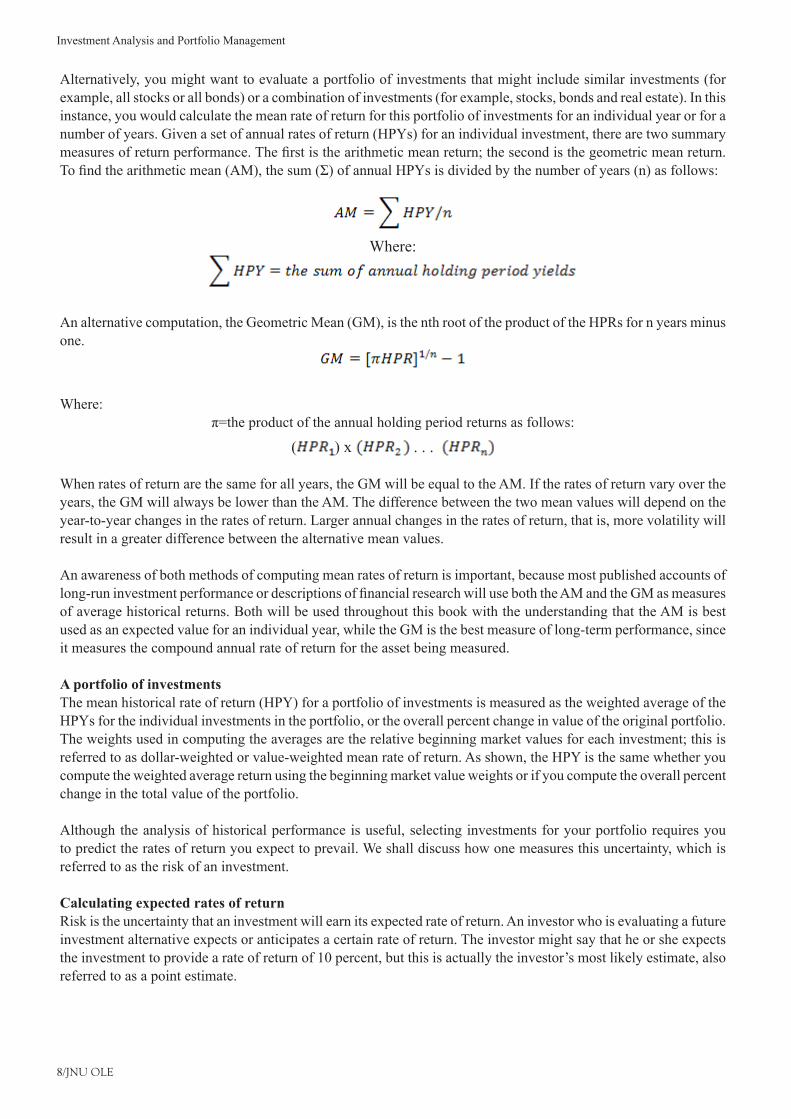
Alternatively, you might want to evaluate a portfolio of investments that might include similar investments (for example, all stocks or all bonds) or a combination of investments (for example, stocks, bonds and real estate). In this instance, you would calculate the mean rate of return for this portfolio of investments for an individual year or for a number of years. Given a set of annual rates of return (HPYs) for an individual investment, there are two summary measuresofreturnperformance.Thefirstisthearithmeticmeanreturn;thesecondisthegeometricmeanreturn.Tofindthearithmeticmean(AM),thesum(Σ)ofannualHPYsisdividedbythenumberofyears(n)asfollows:
Where:
An alternative computation, the Geometric Mean (GM), is the nth root of the product of the HPRs for n years minus one.
Where:π=theproductoftheannualholdingperiodreturnsasfollows:
( ) x . . .
When rates of return are the same for all years, the GM will be equal to the AM. If the rates of return vary over the years, the GM will always be lower than the AM. The difference between the two mean values will depend on the year-to-year changes in the rates of return. Larger annual changes in the rates of return, that is, more volatility will result in a greater difference between the alternative mean values.
An awareness of both methods of computing mean rates of return is important, because most published accounts of long-runinvestmentperformanceordescriptionsoffinancialresearchwilluseboththeAMandtheGMasmeasuresof average historical returns. Both will be used throughout this book with the understanding that the AM is best used as an expected value for an individual year, while the GM is the best measure of long-term performance, since it measures the compound annual rate of return for the asset being measured.
A portfolio of investments The mean historical rate of return (HPY) for a portfolio of investments is measured as the weighted average of the HPYs for the individual investments in the portfolio, or the overall percent change in value of the original portfolio. The weights used in computing the averages are the relative beginning market values for each investment; this is referred to as dollar-weighted or value-weighted mean rate of return. As shown, the HPY is the same whether you compute the weighted average return using the beginning market value weights or if you compute the overall percent change in the total value of the portfolio.
Although the analysis of historical performance is useful, selecting investments for your portfolio requires you to predict the rates of return you expect to prevail. We shall discuss how one measures this uncertainty, which is referred to as the risk of an investment.
Calculating expected rates of returnRisk is the uncertainty that an investment will earn its expected rate of return. An investor who is evaluating a future investment alternative expects or anticipates a certain rate of return. The investor might say that he or she expects the investment to provide a rate of return of 10 percent, but this is actually the investor’s most likely estimate, also referred to as a point estimate.
9/JNU OLE
Pressed further, the investor would probably acknowledge the uncertainty of this point estimate return and admit the possibility that, under certain conditions, the annual rate of return on this investment might go as low as 10 percent orashighas25percent.Thepointisthespecificationofalargerrangeofpossiblereturnsfromaninvestmentreflectstheinvestor’suncertaintyregardingwhattheactualreturnwillbe.Therefore,alargerrangeofpossiblereturns implies that the investment is riskier.
An investor determines how certain the expected rate of return on an investment is by analysing estimates of possible returns. To do this, the investor assigns probability values to all possible returns. These probability values range from zero, which means no chance of the return, to one, which indicates complete certainty that the investment will providethespecifiedrateofreturn.Theseprobabilitiesaretypicallysubjectiveestimatesbasedonthehistoricalperformanceoftheinvestmentorsimilarinvestmentsmodifiedbytheinvestor’sexpectationsforthefuture.
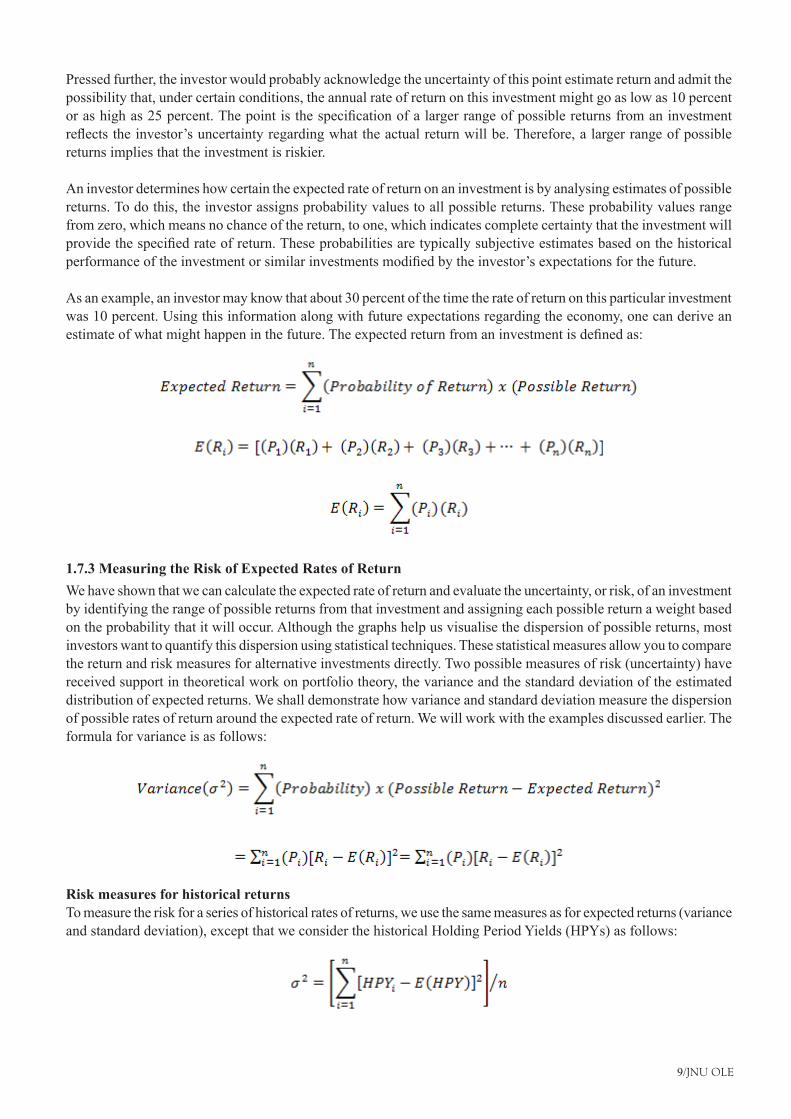
As an example, an investor may know that about 30 percent of the time the rate of return on this particular investment was 10 percent. Using this information along with future expectations regarding the economy, one can derive an estimateofwhatmighthappeninthefuture.Theexpectedreturnfromaninvestmentisdefinedas:
1.7.3 Measuring the Risk of Expected Rates of ReturnWe have shown that we can calculate the expected rate of return and evaluate the uncertainty, or risk, of an investment by identifying the range of possible returns from that investment and assigning each possible return a weight based on the probability that it will occur. Although the graphs help us visualise the dispersion of possible returns, most investors want to quantify this dispersion using statistical techniques. These statistical measures allow you to compare the return and risk measures for alternative investments directly. Two possible measures of risk (uncertainty) have received support in theoretical work on portfolio theory, the variance and the standard deviation of the estimated distribution of expected returns. We shall demonstrate how variance and standard deviation measure the dispersion of possible rates of return around the expected rate of return. We will work with the examples discussed earlier. The formula for variance is as follows:
Risk measures for historical returnsTo measure the risk for a series of historical rates of returns, we use the same measures as for expected returns (variance and standard deviation), except that we consider the historical Holding Period Yields (HPYs) as follows:
Investment Analysis and Portfolio Management
10/JNU OLE
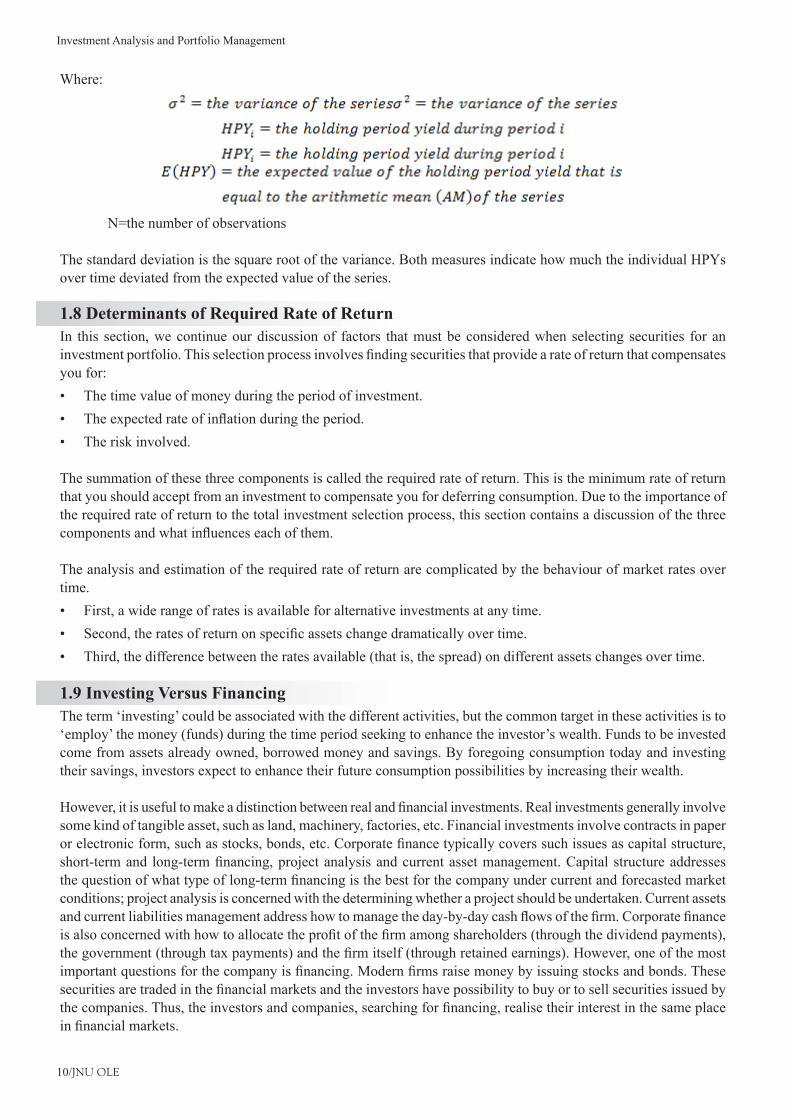
Where:
N=the number of observations
The standard deviation is the square root of the variance. Both measures indicate how much the individual HPYs over time deviated from the expected value of the series.
1.8 Determinants of Required Rate of ReturnIn this section, we continue our discussion of factors that must be considered when selecting securities for an investmentportfolio.Thisselectionprocessinvolvesfindingsecuritiesthatprovidearateofreturnthatcompensatesyou for:
The time value of money during the period of investment.•Theexpectedrateofinflationduringtheperiod.•The risk involved.•
The summation of these three components is called the required rate of return. This is the minimum rate of return that you should accept from an investment to compensate you for deferring consumption. Due to the importance of the required rate of return to the total investment selection process, this section contains a discussion of the three componentsandwhatinfluenceseachofthem.
The analysis and estimation of the required rate of return are complicated by the behaviour of market rates over time.
First, a wide range of rates is available for alternative investments at any time.•Second,theratesofreturnonspecificassetschangedramaticallyovertime.•Third, the difference between the rates available (that is, the spread) on different assets changes over time.•
1.9 Investing Versus FinancingThe term ‘investing’ could be associated with the different activities, but the common target in these activities is to ‘employ’ the money (funds) during the time period seeking to enhance the investor’s wealth. Funds to be invested come from assets already owned, borrowed money and savings. By foregoing consumption today and investing their savings, investors expect to enhance their future consumption possibilities by increasing their wealth.
However,itisusefultomakeadistinctionbetweenrealandfinancialinvestments.Realinvestmentsgenerallyinvolvesome kind of tangible asset, such as land, machinery, factories, etc. Financial investments involve contracts in paper orelectronicform,suchasstocks,bonds,etc.Corporatefinancetypicallycoverssuchissuesascapitalstructure,short-termand long-termfinancing,projectanalysisandcurrentassetmanagement.Capitalstructureaddressesthequestionofwhattypeoflong-termfinancingisthebestforthecompanyundercurrentandforecastedmarketconditions; project analysis is concerned with the determining whether a project should be undertaken. Current assets andcurrentliabilitiesmanagementaddresshowtomanagetheday-by-daycashflowsofthefirm.Corporatefinanceisalsoconcernedwithhowtoallocatetheprofitofthefirmamongshareholders(throughthedividendpayments),thegovernment(throughtaxpayments)andthefirmitself(throughretainedearnings).However,oneofthemostimportantquestionsforthecompanyisfinancing.Modernfirmsraisemoneybyissuingstocksandbonds.Thesesecuritiesaretradedinthefinancialmarketsandtheinvestorshavepossibilitytobuyortosellsecuritiesissuedbythecompanies.Thus,theinvestorsandcompanies,searchingforfinancing,realisetheirinterestinthesameplaceinfinancialmarkets.
11/JNU OLE
Corporatefinanceareaofstudiesandpracticeinvolvestheinteractionbetweenfirmsandfinancialmarketsandinvestmentsareaofstudiesandpracticeinvolvestheinteractionbetweeninvestorsandfinancialmarkets.Investmentsfield also differs from the corporatefinance in using the relevantmethods for research anddecision-making.Investment problems in many cases allow for a quantitative analysis and modelling approach and the qualitative methodstogetherwithquantitativemethodsaremoreoftenusedanalysingcorporatefinanceproblems.Theotherveryimportant difference is, that investment analysis for decision-making can be based on the large data sets available fromthefinancialmarkets,suchasstockreturns,thus,themathematicalstatisticsmethodscanbeused.
However,atthesametimebothcorporatefinanceandinvestmentsarebuiltuponacommonsetoffinancialprinciples,suchasthepresentvalue,thefuturevalue,thecostofcapital.Veryoften,investmentandfinancinganalysisfordecision-making use the same tools, but the interpretation of the results from this analysis for the investor and forthefinancierwouldbedifferent.Forexample,whenissuingthesecuritiesandsellingtheminthemarketthecompany perform valuation looking for the higher price and for the lower cost of capital, but the investor using valuation search for attractive securities with the lower price and the higher possible required rate of return on his/her investments.
Together with the investment, the term speculation is frequently used. Speculation can be described as investment too, but it is related with the short-term investment horizons and usually involves purchasing the saleable securities withthehopethatitspricewillincreaserapidly,providingaquickprofit.Speculatorstrytobuylowandtosellhigh,theirprimaryconcerniswithanticipatingandprofitingfrommarketfluctuations.However,asthefluctuationsinthefinancialmarketsareandbecomemoreandmoreunpredictable,speculationsaretreatedastheinvestmentsofhighest risk. In contrast, an investment is based upon the analysis and its main goal is to promise safety of principle sum invested and to earn the satisfactory risk.
There are two types of investors:Individual investors•Institutional investors•
Individual investors are individuals who are investing on their own. Sometimes, individual investors are called retail investors. Institutional investors are entities, such as investment companies, commercial banks, insurance companies, pensionfundsandotherfinancialinstitutions.Inrecentyears,theprocessofinstitutionalisationofinvestorscanbeobserved. As the main reasons for this can be mentioned, the fact, that institutional investors can achieve economies of scale, demographic pressure on social security and the changing role of banks. One of important preconditions for successful investing both for individual and institutional investors is the favourable investment environment. The basic principles of investment management are applicable, both for individual and institutional investors.
1.10 Direct Versus Indirect InvestmentInvestors can use direct or indirect type of investing.Direct investing is realised usingfinancialmarkets andindirectinvestinginvolvesfinancialintermediaries.Theprimarydifferencebetweenthesetwotypesofinvestingisthatapplyingdirectinvesting,investorsbuyandsellfinancialassetsandmanageindividualinvestmentportfoliothemselves.Consequently,investingdirectlythroughfinancialmarkets,investorstakealltherisksandtheirsuccessfulinvestingdependsontheirunderstandingoffinancialmarkets,itsfluctuationsandontheirabilitiestoanalyseandto evaluate the investments and to manage their investment portfolio.
Contrarily, using indirect type of investing, investors are buying or sellingfinancial instruments of financialintermediaries(financialinstitutions)whichinvestlargepoolsoffundsinthefinancialmarketsandholdportfolios.Indirect investing relieves investors from making decisions about their portfolio. As shareholders with the ownership interestintheportfoliosmanagedbyfinancialinstitutions(investmentcompanies,pensionfunds,insurancecompanies,commercial banks, etc.), the investors are entitled to their share of dividends, interest and capital gains generated and pay their share of the institution’s expenses and portfolio management fee. The risk for investor using indirect investing is related more with the credibility of chosen institution and the professionalism of portfolio managers. Ingeneral,indirectinvestingismorerelatedwiththefinancialinstitutionswhichareprimarilyinthebusinessof
Investment Analysis and Portfolio Management
12/JNU OLE
investing in and managing a portfolio of securities (various types of investment funds or investment companies, private pension funds). By pooling the funds of thousands of investors, those companies can offer them a variety of services,inadditiontodiversification,includingprofessionalmanagementoftheirfinancialassetsandliquidity.
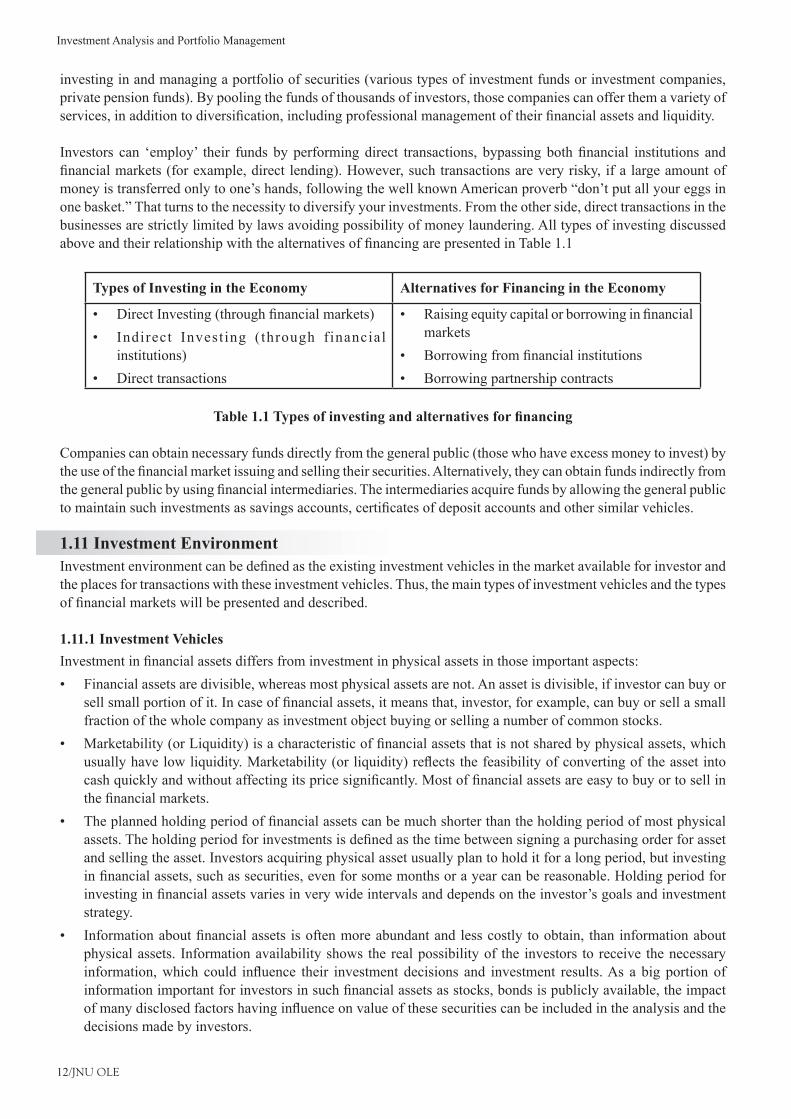
Investors can ‘employ’ their fundsbyperformingdirect transactions, bypassing bothfinancial institutions andfinancialmarkets(forexample,directlending).However,suchtransactionsareveryrisky,ifalargeamountofmoney is transferred only to one’s hands, following the well known American proverb “don’t put all your eggs in onebasket.”Thatturnstothenecessitytodiversifyyourinvestments.Fromtheotherside,directtransactionsinthebusinesses are strictly limited by laws avoiding possibility of money laundering. All types of investing discussed aboveandtheirrelationshipwiththealternativesoffinancingarepresentedinTable1.1
Types of Investing in the Economy Alternatives for Financing in the Economy
DirectInvesting(throughfinancialmarkets)•Indirect Investing (through financial •institutions)Direct transactions•
Raisingequitycapitalorborrowinginfinancial•marketsBorrowingfromfinancialinstitutions•Borrowing partnership contracts•
Table 1.1 Types of investing and alternatives for financing
Companies can obtain necessary funds directly from the general public (those who have excess money to invest) by theuseofthefinancialmarketissuingandsellingtheirsecurities.Alternatively,theycanobtainfundsindirectlyfromthegeneralpublicbyusingfinancialintermediaries.Theintermediariesacquirefundsbyallowingthegeneralpublictomaintainsuchinvestmentsassavingsaccounts,certificatesofdepositaccountsandothersimilarvehicles.
1.11 Investment EnvironmentInvestmentenvironmentcanbedefinedastheexistinginvestmentvehiclesinthemarketavailableforinvestorandthe places for transactions with these investment vehicles. Thus, the main types of investment vehicles and the types offinancialmarketswillbepresentedanddescribed.
1.11.1 Investment VehiclesInvestmentinfinancialassetsdiffersfrominvestmentinphysicalassetsinthoseimportantaspects:
Financial assets are divisible, whereas most physical assets are not. An asset is divisible, if investor can buy or •sellsmallportionofit.Incaseoffinancialassets,itmeansthat,investor,forexample,canbuyorsellasmallfraction of the whole company as investment object buying or selling a number of common stocks.Marketability(orLiquidity)isacharacteristicoffinancialassetsthatisnotsharedbyphysicalassets,which•usuallyhavelowliquidity.Marketability(orliquidity)reflectsthefeasibilityofconvertingoftheassetintocashquicklyandwithoutaffectingitspricesignificantly.Mostoffinancialassetsareeasytobuyortosellinthefinancialmarkets.Theplannedholdingperiodoffinancialassetscanbemuchshorterthantheholdingperiodofmostphysical•assets.Theholdingperiodforinvestmentsisdefinedasthetimebetweensigningapurchasingorderforassetand selling the asset. Investors acquiring physical asset usually plan to hold it for a long period, but investing infinancialassets,suchassecurities,evenforsomemonthsorayearcanbereasonable.Holdingperiodforinvestinginfinancialassetsvariesinverywideintervalsanddependsontheinvestor’sgoalsandinvestmentstrategy.Informationaboutfinancialassets isoftenmoreabundantandlesscostly toobtain, thaninformationabout•physical assets. Information availability shows the real possibility of the investors to receive the necessary information,which could influence their investment decisions and investment results.As a big portionofinformationimportantforinvestorsinsuchfinancialassetsasstocks,bondsispubliclyavailable,theimpactofmanydisclosedfactorshavinginfluenceonvalueofthesesecuritiescanbeincludedintheanalysisandthedecisions made by investors.
13/JNU OLE
Even ifwe analyseonlyfinancial investment, there is avarietyoffinancial investmentvehicles.Theongoingprocesses of globalisation and integration open wider possibilities for the investors to invest into new investment vehicleswhichwereunavailablefor themsometimeago,becauseof theweakdomesticfinancialsystemsandlimited technologies for investment in global investment environment.
Financial innovations suggest for the investors the new choices of investment, but at the same time make the investment process and investment decisions more complicated, because even if the investors have a wide range of alternatives to invest, they can’t forget the key rule in investments, invest only in what you really understand. Thus, the investor must understand how investment vehicles differ from each other and only then to pick those which best match his/her expectations.
The most important characteristic of investment vehicles on the basis of which, the overall variety of investment vehiclescanbeassortedarethereturnoninvestmentandtheriskwhichisdefinedastheuncertaintyabouttheactualreturn that will be earned on an investment. Each type of investment vehicles could be characterised by certain levelofprofitabilityandrisk,becauseofthespecificsofthesefinancialinstruments.Thoughalldifferenttypesofinvestment vehicles can be compared using characteristics of risk and return and the most risky as well as less risky investmentvehiclescanbedefined.However,theriskandreturnoninvestmentarecloselyrelatedandonlyusingboth important characteristics, we can really understand the differences in investment vehicles.
Themaintypesoffinancialinvestmentvehiclesare:Short-term investment vehicles•Fixed-income securities and common stock•Speculative investment vehicles•Other investment tools•
Short-term investment vehiclesShort-term investment vehicles are all those which have a maturity of one year or less. Short-term investment vehicles oftenaredefinedasmoney-marketinstruments,becausetheyaretradedinthemoneymarketwhichpresentsthefinancialmarketforshort-term(uptooneyearofmaturity)marketablefinancialassets.Theriskaswellasthereturnon investments of short-term investment vehicles usually is lower than for other types of investments.
The main short-term investment vehicles are as follows:Certificatesofdeposit•Treasury bills•Commercial paper•Bankers’ acceptances•Repurchase agreements•
Certificate of depositCertificateofdeposit isadebtinstrumentissuedbythebankthatindicatesaspecifiedsumofmoneyhasbeendepositedattheissuingdepositoryinstitution.Certificateofdepositbearsamaturitydateandspecifiedinterestrateandcanbeissuedinanydenomination.Mostcertificatesofdepositcannotbetradedandtheyincurpenaltiesforearlywithdrawal.Forlargemoney-marketinvestors,financialinstitutionsallowtheirlarge-denominationcertificatesofdepositstobetradedasnegotiablecertificatesofdeposits.
Treasury billsTreasurybills(alsocalledT-bills)aresecuritiesrepresentingfinancialobligationsofthegovernment.Treasurybillshave maturities of less than one year. They have the unique feature of being issued at a discount from their nominal value and the difference between nominal value and discount price is the only sum which is paid at the maturity for these short-term securities, because the interest is not paid in cash, only accrued. The other important feature of T-billsisthattheyaretreatedasrisk-freesecuritiesignoringinflationanddefaultofagovernment,whichwasrarein
Investment Analysis and Portfolio Management
14/JNU OLE
developedcountries,theT-billwillpaythefixedstatedyieldwithcertainty.Howeverofcourse,theyieldonT-billschangesovertimeinfluencedbychangesinoverallmacro-economicsituation.T-billsareissuedonanauctionbasis.The issuer accepts competitive bids and allocates bills to those offering the highest prices. Non-competitive bid is an offer to purchase the bills at a price that equals the average of the competitive bids. Bills can be traded before the maturity, while their market price is subject to change with changes in the rate of interest. However, because of the early maturity dates of T-bills, large interest changes are needed to move T-bills prices very far. Bills are thus regarded as high liquid assets.
Commercial paperCommercial paper is a name for short-term unsecured promissory notes issued by corporation. Commercial paper is a means of short-term borrowing by large corporations. Large, well-established corporations have found that borrowing directly from investors through commercial paper is cheaper than relying solely on bank loans. Commercial paper isissuedeitherdirectlyfromthefirmtotheinvestororthroughanintermediary.Commercialpaper,likeT-billsisissued at a discount. The most common maturity range of commercial paper is 30 to 60 days or less. Commercial paper is riskier than T-bills, because there is a larger risk that a corporation will default. Also, commercial paper is not easily bought and sold after it is issued, because the issues are relatively small compared with T-bills and hence their market is not liquid.
Bankers’ acceptancesBankers’ acceptances are the vehicles created to facilitate commercial trade transactions. These vehicles are called bankers acceptances, because a bank accepts the responsibility to repay a loan to the holder of the vehicle in case the debtorfailstoperform.Bankers’acceptancesareshort-termfixed-incomesecuritiesthatarecreatedbynon-financialfirmwhosepaymentisguaranteedbyabank.Thisshort-termloancontracttypicallyhasahigherinterestratethansimilar short-term securities to compensate for the default risk. As bankers’ acceptances are not standardised, there is no active trading of these securities.
Repurchase agreementRepurchase agreement (often referred to as a repo) is the sale of security with a commitment by the seller to buy the securitybackfromthepurchaserataspecifiedpriceatadesignatedfuturedate.Basically,arepoisacollectivisedshort-term loan, where collateral is a security. The collateral in a repo may be a Treasury security, other money-market security. The difference between the purchase price and the sale price is the interest cost of the loan, from which repo rate can be calculated. Due to the concern about default risk, the length of maturity of repo is usually very short. If the agreement is for a loan of funds for one day, it is called overnight repo; if the term of the agreement is for more than one day, it is called a term repo. A reverse repo is the opposite of a repo. In this transaction, a corporationbuysthesecuritieswithanagreementtosellthemataspecifiedpriceandtime.Usingreposhelpstoincrease the liquidity in the money market.
Our focus in this course further will be not investment in short-term vehicles, but it is useful for investor to know that short-term investment vehicles provide the possibility for temporary investing of money/funds and investors use these instruments managing their investment portfolio.
Fixed-income securitiesFixed-incomesecuritiesarethosewhichreturnisfixed,uptosomeredemptiondateorindefinitely.Thefixedamountsmaybestatedinmoneytermsorindexedtosomemeasureofthepricelevel.Thistypeoffinancialinvestmentsispresented by two different groups of securities:
Long-term debt securities•Preferred stocks•
Long-term debt securitiesIt can be described as long-term debt instruments representing the issuer’s contractual obligation. Long-term securities have maturity longer than 1 year. The buyer (investor) of these securities is landing money to the issuer, who undertake obligation periodically to pay interest on this loan and repay the principal at a stated maturity date. Long-term debt securities are traded in the capital markets. From the investor’s point of view these securities can
15/JNU OLE
betreatedasa‘safe’asset.However,inrealitythesafetyofinvestmentinfixed-incomesecuritiesisstronglyrelatedwith the default risk of an issuer. The major representatives of long-term debt securities are bonds, but today there are a big variety of different kinds of bonds, which differ not only by the different issuers (governments, municipals, companies,agencies,etc.),butbydifferentschemesofinterestpayments,whichisaresultofbringingfinancialinnovations to the long-term debt securities market. As demand for borrowing the funds from the capital markets is growing, the long-term debt securities today are prevailing in the global markets. It is a challenge for the investor to pick long-term debt securities relevant to his/her investment expectations, including the safety of investment.
Preferred stocksPreferredstocksareequitysecurity,whichhasinfinitivelifeandpaydividends.However,preferredstockisattributedtothetypeoffixed-incomesecurities,becausethedividendforpreferredstockisfixedinamountandknowninadvance.Though,thissecurityprovidesfortheinvestortheflowofincomeverysimilartothatofthebond.Themaindifferencebetweenpreferredstocksandbondsisthatforpreferredstocktheflowsareforever,ifthestockis not callable. The preferred stockholders are paid after the debt securities holders, but before the common stock holders in terms of priorities in payments of income and in case of liquidation of the company. If the issuer fails to pay the dividend in any year, the unpaid dividends will have to be paid, if the issue is cumulative.
If preferred stock is issued as noncumulative, dividends for the years with losses do not have to be paid. Usually, same rights to vote in general meetings for preferred stockholders are suspended. As the features are attributed for equityandfixed-incomesecurities,preferredstocksisknownashybridsecurity.Amostpreferredstockisissuedas noncumulative and callable. In recent years, the preferred stocks with option of convertibility to common stock are proliferating.
The common stock is the other type of investment vehicles, which is one of most popular among investors with long-term horizon of their investments. Common stock represents the ownership interest of corporations or the equity of the stock holders. Holders of common stock are entitled to attend and vote at a general meeting of shareholders, to receive declared dividends and to receive their share of the residual assets, if any, if the corporation is bankrupt. The issuers of the common stock are the companies which seek to receive funds in the market, though ‘going public’. Issuing common stocks and selling them in the market enables the company to raise additional equity capital more easily, when using other alternative sources. Thus many companies are issuing their common stocks, which are traded infinancialmarketsandinvestorshavewidepossibilitiesforchoosingthistypeofsecuritiesfortheinvestment.
Speculative investment vehiclesSpeculativeinvestmentvehiclesfollowingtheterm‘speculation’couldbedefinedasinvestmentswithahigh-riskand high-investment return. Using these investment vehicles, speculators try to buy low and to sell high, their primaryconcerniswithanticipatingandprofitingfromtheexpectedmarket-fluctuations.Theonlygainfromsuchinvestments is the positive difference between selling and purchasing prices. Of course, using short-term investment strategies, investors can use for speculations other investment vehicles, such as common stock, but here we try to accentuatethespecifictypesofinvestments,whichareriskierthanotherinvestmentvehicles,becauseoftheirnaturerelatedwithmoreuncertaintyaboutthechangesinfluencingthetheirpriceinthefuture.
Speculative investment vehicles could be presented the following different vehicles:Options•Futures•Commodities traded on the exchange (coffee, grain metals and other commodities)•
OptionsOptionsarethederivativefinancialinstruments.Anoptionscontractgivestheownerofthecontracttheright,butnottheobligation,tobuyorsellafinancialassetataspecifiedpricefromortoanotherparty.Thebuyerofthecontract must pay a fee (option price) for the seller. There is a big uncertainty, if the buyer of the option will take the advantage of it and what option price would be relevant, as it depends not only on demand and supply in the optionsmarket,butonthechangesintheothermarket,wherethefinancialassetincludedintheoptioncontractaretraded. Though, option is a risky, investors use it for speculations instead of hedging.
Investment Analysis and Portfolio Management
16/JNU OLE
FuturesThey are other types of derivatives. A future contract is an agreement between two parties, when they agree to transactwithrespecttosomefinancialassetatapredeterminedpriceataspecifiedfuturedate.Onepartyagreestobuythefinancialasset;theotheragreestosellthefinancialasset.Itisveryimportantthatinfuturescontractcase,both parties are obligated to perform and neither party charges the fee.
There are two types of people who deal with options (and futures) contracts:Speculators•Hedgers•
Speculatorsbuyandsellfuturesforthesolepurposeofmakingaprofitbyclosingouttheirpositionsatapricethatis better than the initial price. Such people neither produce nor use the asset in the ordinary course of business. In contrary, hedgers buy and sell futures to offset an otherwise risky position in the market. Transactions using derivativesinstrumentsarenotlimitedtofinancialassets.Therearederivatives,involvingdifferentcommodities(coffee, grain, precious metals, and other commodities). However, in this course, the target is on derivatives, where underlyingassetisafinancialasset.
Other investment toolsOther investment tools are as follows:
Various types of investment funds•Investment life insurance•Pension funds•Hedge funds•
Investment companies/investment fundsThey receive money from investors with the common objective of pooling the funds and then investing them in securities according to a stated set of investment objectives. Two types of funds are as follows:
Open-end funds (mutual funds)•Closed-end funds (trusts)•
Open-end funds have no pre-determined amount of stocks outstanding and they can buy back or issue new shares at any point. Price of the share is not determined by demand, but by an estimate of the current market value of the fund’s net assets per share (NAV) and a commission. Closed-end funds are publicly traded investment companies thathaveissuedaspecifiednumberofsharesandcanonlyissueadditionalsharesthroughanewpublicissue.Pricingof closed-end funds is different from the pricing of open-end funds; the market price can differ from the NAV.
Insurance companiesInsurancecompaniesareinthebusinessofassumingtherisksofadverseevents(suchas,fires,accidents,etc.)inexchangeforaflowofinsurancepremiums.Insurancecompaniesareinvestingtheaccumulatedfundsinsecurities(treasury bonds, corporate stocks and bonds) and real estate. Three types of Insurance Companies are life insurance, non-life insurance (also known as property-casualty insurance) and reinsurance.
During recent years, investment life insurance became very popular investment alternative for individual investors, because this hybrid investment product allows to buy the life insurance policy together with possibility to invest accumulated life insurance payments or lump sum for a long time selecting investment programme relevant to investor’s future expectations.
Pension fundsPensionfundsareassetpoolsthataccumulateoveranemployee’sworkingyearsandpaysretirementbenefitsduringthe employee’s nonworking years. Pension funds are investing the funds according to a stated set of investment objectives in securities (treasury bonds, corporate stocks and bonds) and real estate.
17/JNU OLE
Hedge fundsHedge funds are unregulated private investment partnerships, limited to institutions and high-net-worth individuals, which seek to exploit various market opportunities and thereby to earn larger returns than are ordinarily available. They require a substantial initial investment from investors and usually have some restrictions on how quickly investor can withdraw their funds. Hedge funds take concentrated speculative positions and can be very risky. It could be noted that originally, the term ‘hedge’ made some sense, when applied to these funds. They would by combining different types of investments, including derivatives, try to hedge risk while seeking higher returns. However today, the word ‘hedge’ is misapplied to these funds, because they generally take aggressive strategies investing in stocks, bondsandotherfinancialmarketsaroundtheworld,andtheirlevelofriskishigh.
1.11.2 Financial MarketsFinancial markets form the other important component of investment environment. Financial markets are designed to allow corporations and governments to raise new funds and to allow investors to execute their buying and selling orders.Infinancialmarkets,fundsarechannelledfromthosewiththesurplus,whobuysecurities,tothose,withshortage,whoissuenewsecuritiesorsellexistingsecurities.Afinancialmarketcanbeseenasasetofarrangementsthat allows trading among its participants.
Financial market provides the following three important economic functions (Frank J. Fabozzi, 1999):Financial market determines the prices of assets traded through the interactions between buyers and sellers.•Financialmarketprovidesaliquidityofthefinancialassets.•Financial market reduces the cost of transactions by reducing explicit costs, such as money spent to advertise •thedesiretobuyortosellafinancialasset.
Financialmarketscouldbeclassifiedonthebasisofthefollowingcharacteristics:Sequence of transactions for selling and buying securities.•Termofcirculationoffinancialassetstradedinthemarket.•Economic nature of securities traded in the market.•
By sequence of transactions for selling and buying securitiesBysequenceoftransactionsforsellingandbuyingsecurities,themarketsareclassifiedas:
Primary market•Secondary market•
Allsecuritiesarefirsttradedintheprimarymarket,andthesecondarymarketprovidesliquidityforthesesecurities.Primarymarketiswherecorporateandgovernmententitiescanraisecapitalandwherethefirsttransactionswiththenewissuedsecuritiesareperformed.Ifacompany’sshareistradedintheprimarymarketforthefirsttime,thisis referred to as an Initial Public Offering (IPO).
Investment banks play an important role in the primary market:Usually handle issues in the primary market.•Among other things, act as underwriter of a new issue, guaranteeing the proceeds to the issuer.•
Secondary market is where previously issued securities are traded among investors. Generally, individual investors do not have access to secondary markets. They use security brokers to act as intermediaries for them. The broker delivers orders received from investors in securities to a market place, where these orders are executed. Finally, clearing and settlement processes ensure that both sides to these transactions honour their commitment.
Investment Analysis and Portfolio Management
18/JNU OLE
Types of brokersThe types of brokers are as follows:
Discount broker who executes only trades in the secondary market.•Full service broker, who provides a wide range of additional services to clients (e.g., advice to buy or sell).•Onlinebrokerisabrokeragefirmthatallowsinvestorstoexecutetradeselectronicallyusinginternet.•
Types of secondary market places are as follows:Organised security exchanges.•Over-the-counter markets.•Alternative trading system.•
An organised security exchange provides the facility for the members to trade securities, and only exchange membersmaytradethere.Themembersincludebrokeragefirms,whichoffertheirservicestoindividualinvestors,charging commissions for executing trades on their behalf. Other exchange members buy or sell for their own account, functioning as dealers or market makers who set prices at which they are willing to buy and sell for their own account.
Exchanges play very important role in the modern economies by performing the following tasks:Supervisionoftradingtoensurefairnessandefficiency.•The authorisation and regulation of market participants, such as brokers and market makers.•Creationofanenvironmentinwhichsecurities’pricesareformedefficientlyandwithoutdistortion.Thisrequires•not only regulation of orders and transaction costs, but also a liquid market in which there are many buyers and sellers, allowing investors to buy or to sell their securities quickly;Organisation of the clearing and settlement of transactions.•The regulation of the admission of companies to be listed on the exchange and the regulation of companies •who are listed on the exchange.The dissemination of information (trading data, prices and announcements of companies listed on the exchange). •Investors are more willing to trade, if prompt and complete information about trades and prices in the market is available.
The Over-The-Counter (OTC) market is not a formal exchange. It is organised network of brokers and dealers who negotiate sales of securities. There are no membership requirements and many brokers register as dealers on the OTC. At the same time, there are no listing requirements and thousands of securities are traded in the OTC market. OTC stocks are usually considered as very risky, because they are the stocks that are not considered large or stable enough to trade on the major exchange. An Alternative Trading System (ATS) is an electronic trading mechanism developed independently from the established market places, security exchanges and designed to match buyers and sellers of securities on an agency basis.
The brokers who use ATS are acting on behalf of their clients and do not trade on their own account. The distinct advantages of ATS in comparison with traditional markets are cost savings of transactions, the short time of execution of transactions for liquid securities, extended hours for trading and anonymity, often important for investors, trading large amounts.
By term of circulation of financial assets traded in the market Bythetermofcirculationoffinancialassetstradedinthemarket,themarketsareclassifiedas:
Moneymarket,inwhichonlyshort-termfinancialinstrumentsaretraded.•Capitalmarket,inwhichonlylong-termfinancialinstrumentsaretraded.•
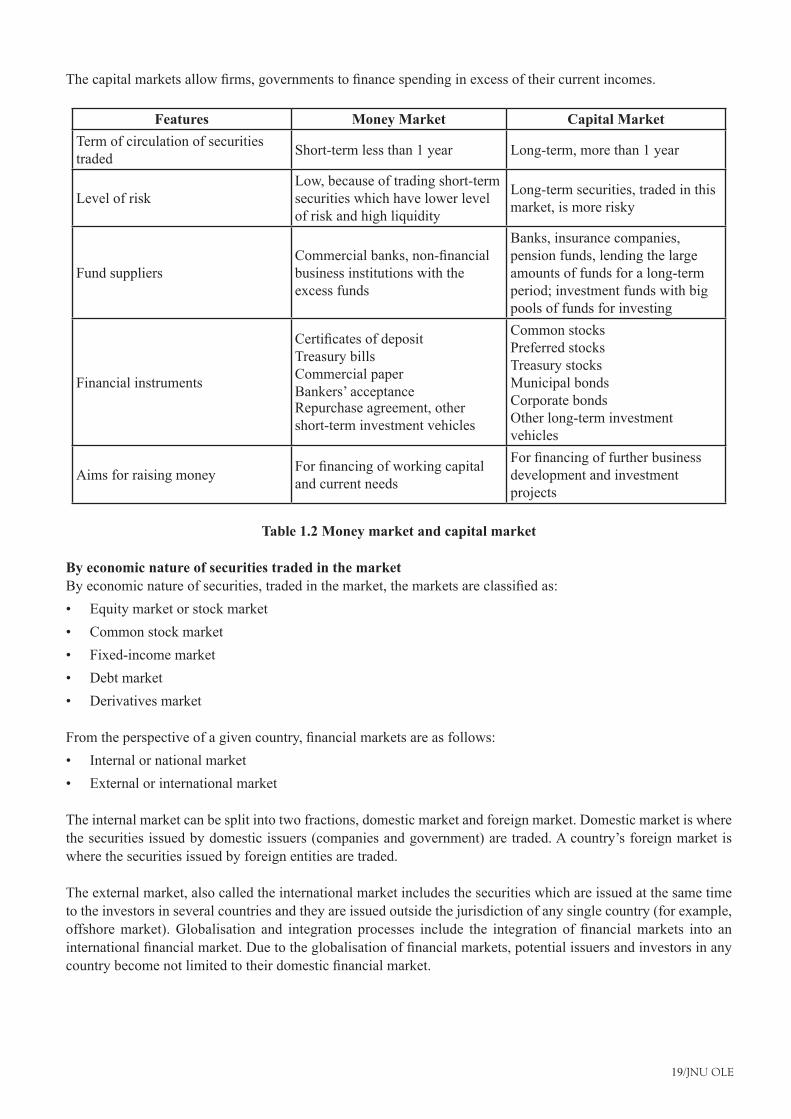
19/JNU OLE
Thecapitalmarketsallowfirms,governmentstofinancespendinginexcessoftheircurrentincomes.
Features Money Market Capital MarketTerm of circulation of securities traded Short-term less than 1 year Long-term, more than 1 year
Level of riskLow, because of trading short-term securities which have lower level of risk and high liquidity
Long-term securities, traded in this market, is more risky
Fund suppliersCommercialbanks,non-financialbusiness institutions with the excess funds
Banks, insurance companies, pension funds, lending the large amounts of funds for a long-term period; investment funds with big pools of funds for investing
Financial instruments
CertificatesofdepositTreasury billsCommercial paperBankers’ acceptanceRepurchase agreement, other short-term investment vehicles
Common stocksPreferred stocksTreasury stocksMunicipal bondsCorporate bondsOther long-term investment vehicles
Aims for raising money Forfinancingofworkingcapitaland current needs
Forfinancingoffurtherbusinessdevelopment and investment projects
Table 1.2 Money market and capital market
By economic nature of securities traded in the marketByeconomicnatureofsecurities,tradedinthemarket,themarketsareclassifiedas:
Equity market or stock market•Common stock market•Fixed-income market•Debt market•Derivatives market•
Fromtheperspectiveofagivencountry,financialmarketsareasfollows:Internal or national market•External or international market•
The internal market can be split into two fractions, domestic market and foreign market. Domestic market is where the securities issued by domestic issuers (companies and government) are traded. A country’s foreign market is where the securities issued by foreign entities are traded.
The external market, also called the international market includes the securities which are issued at the same time to the investors in several countries and they are issued outside the jurisdiction of any single country (for example, offshoremarket).Globalisation and integration processes include the integration offinancialmarkets into aninternationalfinancialmarket.Duetotheglobalisationoffinancialmarkets,potentialissuersandinvestorsinanycountrybecomenotlimitedtotheirdomesticfinancialmarket.
Investment Analysis and Portfolio Management
20/JNU OLE
1.12 Investment Management ProcessInvestment management process is the process of managing money or funds. The investment management process describes how an investor should go about making decisions. Investment management process can be disclosed by thefive-stepprocedure,whichincludesfollowingstages:
Setting of investment policy•Analysis and evaluation of investment vehicles•Formationofdiversifiedinvestmentportfolio•Portfolio revision•Measurement and evaluation of portfolio performance•
1.12.1 Setting of Investment PolicySettingofinvestmentpolicyisthefirstandveryimportantstepininvestmentmanagementprocess.Investmentpolicyincludessettingofinvestmentobjectives.Theinvestmentpolicyshouldhavethespecificobjectivesregardingtheinvestmentreturnrequirementandrisktoleranceoftheinvestor.Forexample,theinvestmentpolicymaydefinethat the target of the investment average return should be 15% and should avoid more than 10% losses. Identifying investor’s tolerance for risk is the most important objective, because it is obvious that every investor would like to earn the highest return possible. However, because there is a positive relationship between risk and return, it is not appropriate for an investor to set his/her investment objectives as just ‘to make a lot of money’. Investment objectives should be stated in terms of both risk and return.
Theinvestmentpolicyshouldalsostateotherimportantconstrainswhichcouldinfluencetheinvestmentmanagement.Constrains can include any liquidity needs for the investor, projected investment horizon, as well as other unique needs and preferences of investor. The investment horizon is the period of time for investments. Projected time horizonmaybeshort,longorevenindefinite.
Setting of investment objectives for individual investors is based on the assessment of their current and future financialobjectives.Therequiredrateofreturnforinvestmentdependsonwhatsumtodaycanbeinvestedandhow much investor needs to have at the end of the investment horizon. Wishing to earn higher income on his/her investments investor must assess the level of risk he/she should take and to decide if it is relevant for him or not. The investment policy can include the tax status of the investor. This stage of investment management concludes withtheidentificationofthepotentialcategoriesoffinancialassetsforinclusionintheinvestmentportfolio.Theidentificationofthepotentialcategoriesisbasedontheinvestmentobjectives,amountofinvestablefunds,andinvestmenthorizonandtaxstatusoftheinvestor.Variousfinancialassetsbynaturemaybemoreorlessriskyandin general their ability to earn returns differs from one type to the other. As an example, for the investor with low tolerance of risk, common stock will not be the appropriate type of investment.
1.12.2 Analysis and Evaluation of Investment VehiclesWhentheinvestmentpolicyissetup,investor’sobjectivesdefinedandthepotentialcategoriesoffinancialassetsforinclusionintheinvestmentportfolioidentified,theavailableinvestmenttypescanbeanalysed.Thisstepinvolvesexamining several relevant types of investment vehicles and the individual vehicles inside these groups. For example, ifthecommonstockwasidentifiedasinvestmentvehiclerelevantforinvestor,theanalysiswillbeconcentratedtothe common stock as an investment. The one purpose of such analysis and evaluation is to identify those investment vehicles that currently appear to be mispriced. There are many different approaches how to make such analysis. Most frequently, two forms of analyses are used, technical analysis and fundamental analysis.
Technical analysis involves the analysis of market prices in an attempt to predict future price movements for the particularfinancialassettradedonthemarket.Thisanalysisexaminesthetrendsofhistoricalpricesandisbasedon the assumption that these trends or patterns repeat themselves in the future. Fundamental analysis in its simplest formisfocusedontheevaluationofintrinsicvalueofthefinancialasset.Thisvaluationisbasedontheassumptionthatintrinsicvalueisthepresentvalueoffutureflowsfromparticularinvestment.Bycomparisonoftheintrinsicvalueandmarketvalueofthefinancialassets,thosewhichareunder-pricedoroverpricedcanbeidentified.Thisstepinvolvesidentifyingthosespecificfinancialassetsinwhichtoinvestanddeterminingtheproportionsofthesefinancialassetsintheinvestmentportfolio.
21/JNU OLE
1.12.3 Formation of Diversified Investment PortfolioFormationofdiversifiedinvestmentportfolioisthenextstepininvestmentmanagementprocess.Investmentportfolioisthesetofinvestmentvehicles,formedbytheinvestorseekingtorealiseits’definedinvestmentobjectives.Inthestageofportfolioformation,theissuesofselectivity,timinganddiversificationneedtobeaddressedbytheinvestor. Selectivity refers to micro-forecasting and focuses on forecasting price movements of individual assets. Timinginvolvesmacro-forecastingofpricemovementsofparticulartypeoffinancialassetrelativetofixed-incomesecurities in general.
Diversificationinvolvesformingtheinvestor’sportfoliofordecreasingorlimitingriskofinvestment.Twotechniquesofdiversificationareasfollows:
Randomdiversification,whenseveralavailablefinancialassetsareputtotheportfolioatrandom.•Objectivediversificationwhenfinancialassetsareselectedtotheportfoliofollowinginvestmentobjectivesand•usingappropriatetechniquesforanalysisandevaluationofeachfinancialasset.
Investmentmanagementtheoryisfocusedonissuesofobjectiveportfoliodiversification.Professionalinvestorsfollow settled investment objectives constructing and managing their portfolios.
1.12.4 Portfolio RevisionThis step of the investment management process concerns the periodic revision of the three previous stages. This is necessary, because over time investor with long-term investment horizon may change his/her investment objectives and this, in turn means that currently held investor’s portfolio may no longer be optimal and even contradict with the new settled investment objectives. Investor should form the new portfolio by selling some assets in his portfolio and buying the others that are not currently held. It could be the other reasons for revising a given portfolio: over time the prices of the assets change, meaning that some assets that were attractive at one time may no longer be so.
Thus, investor should sell one asset and buy the other more attractive in this time according to his/her evaluation. The decisions to perform changes in revising portfolio depend, upon other things, in the transaction costs incurred in making these changes. For institutional investors, portfolio revision is the continuing and very important part of their activity. However, individual investor managing portfolio must perform portfolio revision periodically as well. Periodicre-evaluationoftheinvestmentobjectivesandportfoliosbasedonthemisnecessary,becausefinancialmarkets change, tax laws and security regulations change, and other events alter the stated investment goals.
1.12.5 Measurement and Evaluation of Portfolio PerformanceThis, the last step in investment management process involves determining periodically how the portfolio performed, in terms of not only the return earned, but also the risk of the portfolio. For evaluation of portfolio performance, appropriate measures of return and risk and benchmarks are needed. A benchmark is the performance of predetermined set of assets, obtained for comparison purposes. The benchmark may be a popular index of appropriate assets, stock index and bond index. The benchmarks are widely used by institutional investors evaluating the performance of theirportfolios.Itisimportanttopointoutthatinvestmentmanagementprocessisacontinuingprocessinfluencedby changes in investment environment and changes in investor’s attitudes as well. Market globalisation offers investors new possibilities, but at the same time investment management becomes more and more complicated with growing uncertainty.
Investment Analysis and Portfolio Management
22/JNU OLE
SummaryThe term ‘investing’ could be associated with the different activities, but the common target in these activities •is to ‘employ’ the money (funds) during the time period seeking to enhance the investor’s wealth.Real investments usually involve some kind of tangible asset, such as land, machinery, factories, etc.•Investmentanalysisisthestudyoffinancialsecuritiesforthepurposeofsuccessfulinvesting.•Investmentreferstoinvestmoneyinfinancialphysicalassetsandmarketingassets.•Risk refers to the loss of principal amount of an investment.•Interest rate is one of the most important aspects of a sound investment plan.•Investors are savers, but all savers cannot be good investors, as investment is a science and an art.•Investmentactivityincludesbuyingandsellingofthefinancialassets,physicalassetsandmarketableassetsin•primary and secondary markets.Investors can use direct or indirect type of investing.•Investmentenvironmentcanbedefinedastheexistinginvestmentvehiclesinthemarketavailableforinvestor•and the places for transactions with these investment vehicles.Commercial paper is a name for short-term unsecured promissory notes issued by corporation.•Bankers’ acceptances are the vehicles created to facilitate commercial trade transactions.•Preferredstocksareequitysecurity,whichhasinfinitivelifeandpaydividends.•Financial markets are the other important component of investment environment.•The Over-The-Counter (OTC) market is not a formal exchange.•Investment management process is the process of managing money or funds.•Settingofinvestmentpolicyisthefirstandveryimportantstepininvestmentmanagementprocess.•Formationofdiversifiedinvestmentportfolioisthenextstepininvestmentmanagementprocess.•
ReferencesInvestment Analysis. • [Pdf] Available at: <http://people.exeter.ac.uk/gdmyles/Books/IA.pdf> [Accessed 07 July 2014].Investment Analysis and Portfolio Management.• [Pdf] Available at: <http://www.bcci.bg/projects/latvia/pdf/8_IAPM_final.pdf>[Accessed07July2014].Mayo, H., 2010. • Investments: An Introduction. Cengage Learning.Guerard, J., 2013. • Introduction to Financial Forecasting in Investment Analysis. Springer Science & Business Media, New York.Investment Analysis, Lecture 01 – Introduction. • [Video online] Available at: <https://www.youtube.com/watch?v=OsxFib1YY6g> [Accessed 07 July 2014].Introduction to Investment Analysis. • [Video online] Available at: <https://www.youtube.com/watch?v=MoG8odEs4C4> [Accessed 07 July 2014].
Recommended ReadingAnson, M. J. P., Chambers, D. R., Black, K. H. and Kazemi, H., 2012. • An Introduction to Core Topics in Alternative Investments. John Wiley & Sons.Hirschey, M., 2010. • Investments: Analysis And Behaviour. Tata McGraw-Hill Education. Brussee, W., 2008. • Getting Started in Investment Analysis. John Wiley & Sons.
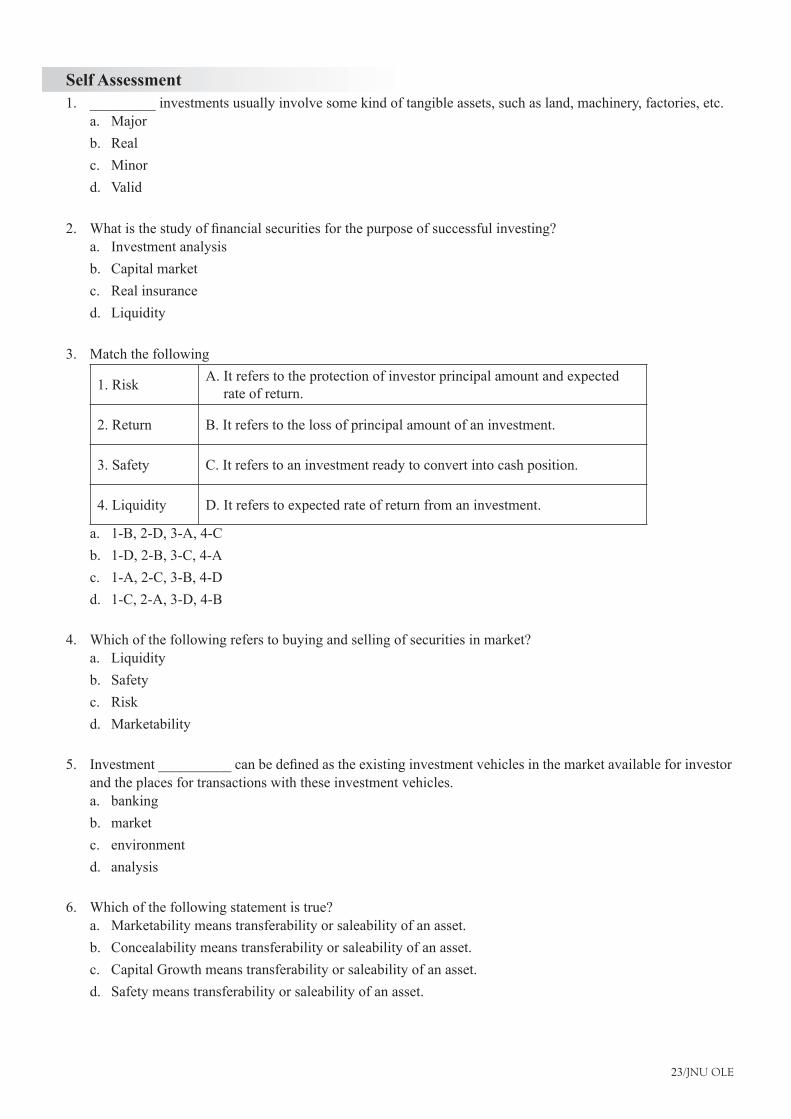
23/JNU OLE
Self Assessment_________ investments usually involve some kind of tangible assets, such as land, machinery, factories, etc.1.
Majora. Realb. Minorc. Validd.
Whatisthestudyoffinancialsecuritiesforthepurposeofsuccessfulinvesting?2. Investment analysisa. Capital marketb. Real insurancec. Liquidityd.
Match the following3.
1. Risk A. It refers to the protection of investor principal amount and expected rate of return.
2. Return B. It refers to the loss of principal amount of an investment.
3. Safety C. It refers to an investment ready to convert into cash position.
4. Liquidity D. It refers to expected rate of return from an investment.
1-B, 2-D, 3-A, 4-Ca. 1-D, 2-B, 3-C, 4-Ab. 1-A, 2-C, 3-B, 4-Dc. 1-C, 2-A, 3-D, 4-Bd.
Which of the following refers to buying and selling of securities in market?4. Liquiditya. Safetyb. Riskc. Marketabilityd.
Investment__________canbedefinedastheexistinginvestmentvehiclesinthemarketavailableforinvestor5. and the places for transactions with these investment vehicles.
bankinga. marketb. environmentc. analysisd.
Which of the following statement is true?6. Marketability means transferability or saleability of an asset.a. Concealability means transferability or saleability of an asset.b. Capital Growth means transferability or saleability of an asset.c. Safety means transferability or saleability of an asset.d.
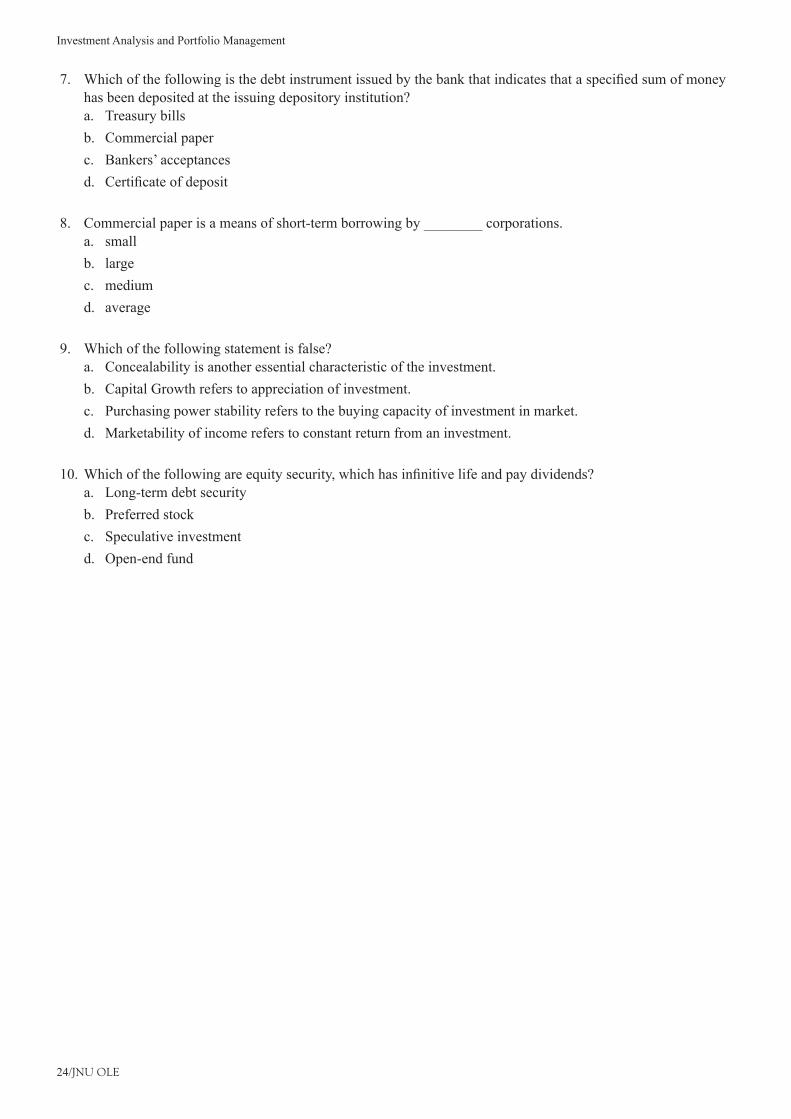
Investment Analysis and Portfolio Management
24/JNU OLE
Whichofthefollowingisthedebtinstrumentissuedbythebankthatindicatesthataspecifiedsumofmoney7. has been deposited at the issuing depository institution?
Treasury billsa. Commercial paperb. Bankers’ acceptancesc. Certificateofdepositd.
Commercial paper is a means of short-term borrowing by ________ corporations.8. smalla. largeb. mediumc. averaged.
Which of the following statement is false?9. Concealability is another essential characteristic of the investment.a. Capital Growth refers to appreciation of investment.b. Purchasing power stability refers to the buying capacity of investment in market.c. Marketability of income refers to constant return from an investment.d.
Whichofthefollowingareequitysecurity,whichhasinfinitivelifeandpaydividends?10. Long-term debt securitya. Preferred stockb. Speculative investmentc. Open-end fundd.
25/JNU OLE
Chapter II
Risk and Return in Investment Analysis
Aim
The aim of this chapter is to:
introduce the concept of risk•
explain the elements of risk•
explicate the sources of risk•
Objectives
The objectives of this chapter are to:
explain return on investment and expected rate of return•
elucidate risk and return•
explicate covariance•
Learning outcome
At the end of this chapter, you will be able to:
identifycorrelationandcoefficientofdetermination•
understand the returns•
recognisetheeffectofdiversification•
Investment Analysis and Portfolio Management
26/JNU OLE
2.1 IntroductionThe dictionary meaning of risk is the possibility of loss or injury; risk is the possibility of not getting the expected return. The difference between expected return and actual return is called the risk in investment. Investment situation may be high-risk, medium and low-risk investment.
2.1.1 Elements of RiskThe components of risk are broadly two groups:
Systematic risks •Unsystematic risks •
Systematic risksThe systematic risks is caused by factors external to the particular company and uncontrollable by the company. The systematic risk affects the market as a whole. It refers to that portion of the total variability of the return caused by common factors affecting the prices of all securities alike through economic, political and social factors.
Unsystematic risksIncaseofunsystematicrisks,thefactorsarespecific,uniqueandrelatedtotheparticularindustryorcompany.Itreferstothatportionofthetotalvariabilityofthereturncausedduetouniquefactors,relatingtothatfirmorindustry,through such factors as management failure, labour strikes, raw material scarcity, etc.
2.1.2 Sources of RiskSources of risk are discussed in the paragraphs given below:Interest rate riskInterestrateriskisthevariationinthesingleperiodratesofreturncausedbythefluctuationsinthemarketinterestrate. Most commonly, the interest rate risk affects the debt securities like bonds and debentures.
Market riskJackClarkFrancishasdefinedmarketriskasthatportionoftotalvariabilityofreturncausedbythealternatingforces of bull and bear market. This is a type of systematic risk that affects share market price. Shares move up and down consistently for some period of time.
Purchasing power riskAnother type of systematic risk is the purchasing power risk. It refers to the variation in investor return caused by inflation.
Business riskEvery company operates within a particular operating environment; operating environment comprises both internal environmentwithinthefirmandexternalenvironmentoutsidethefirm.Businessriskisthusafunctionoftheoperatingconditions faced by a company and is the variability in operating income caused by the operating conditions of the company.
Financial riskIt refers to the variability of the income to the equity capital due to the debt capital. Financial risk in a company isassociatedwiththecapitalstructureofthecompany.Thedebtinthecapitalstructurecreatesfixedpaymentsinthe form of interest. This creates more variability in the earning per share available to equity share holders. This variabilityofreturniscalledfinancialriskanditisatypeofunsystematicrisk.
Liquidity riskWhile there is almost always a ready market for government bonds, corporate bonds are sometimes entirely different animals. There is a risk that an investor might not be able to sell his or her corporate bonds quickly due to a thin market with few buyers and sellers for the bond. Low interest in a particular bond issue can lead to substantial price volatility and possibly have an adverse impact on a bondholder’s total return (upon sale). Much like stocks that trade in a thin market, you may be forced to take a much lower price than expected to sell your position in the bond.
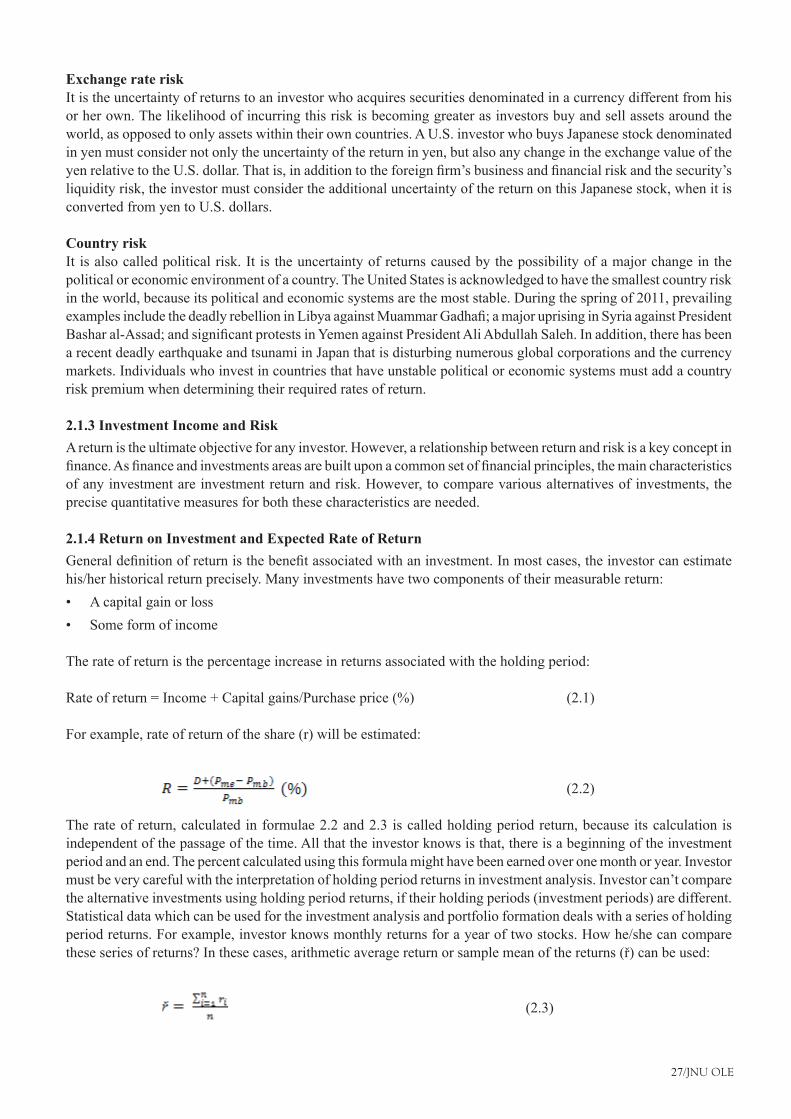
27/JNU OLE
Exchange rate riskIt is the uncertainty of returns to an investor who acquires securities denominated in a currency different from his or her own. The likelihood of incurring this risk is becoming greater as investors buy and sell assets around the world, as opposed to only assets within their own countries. A U.S. investor who buys Japanese stock denominated in yen must consider not only the uncertainty of the return in yen, but also any change in the exchange value of the yenrelativetotheU.S.dollar.Thatis,inadditiontotheforeignfirm’sbusinessandfinancialriskandthesecurity’sliquidity risk, the investor must consider the additional uncertainty of the return on this Japanese stock, when it is converted from yen to U.S. dollars.
Country riskIt is also called political risk. It is the uncertainty of returns caused by the possibility of a major change in the political or economic environment of a country. The United States is acknowledged to have the smallest country risk in the world, because its political and economic systems are the most stable. During the spring of 2011, prevailing examplesincludethedeadlyrebellioninLibyaagainstMuammarGadhafi;amajoruprisinginSyriaagainstPresidentBasharal-Assad;andsignificantprotestsinYemenagainstPresidentAliAbdullahSaleh.Inaddition,therehasbeena recent deadly earthquake and tsunami in Japan that is disturbing numerous global corporations and the currency markets. Individuals who invest in countries that have unstable political or economic systems must add a country risk premium when determining their required rates of return.
2.1.3 Investment Income and RiskA return is the ultimate objective for any investor. However, a relationship between return and risk is a key concept in finance.Asfinanceandinvestmentsareasarebuiltuponacommonsetoffinancialprinciples,themaincharacteristicsof any investment are investment return and risk. However, to compare various alternatives of investments, the precise quantitative measures for both these characteristics are needed.
2.1.4 Return on Investment and Expected Rate of ReturnGeneraldefinitionofreturnisthebenefitassociatedwithaninvestment.Inmostcases,theinvestorcanestimatehis/her historical return precisely. Many investments have two components of their measurable return:
A capital gain or loss•Some form of income•
The rate of return is the percentage increase in returns associated with the holding period:
Rate of return = Income + Capital gains/Purchase price (%) (2.1)
For example, rate of return of the share (r) will be estimated:
(2.2)
The rate of return, calculated in formulae 2.2 and 2.3 is called holding period return, because its calculation is independent of the passage of the time. All that the investor knows is that, there is a beginning of the investment period and an end. The percent calculated using this formula might have been earned over one month or year. Investor must be very careful with the interpretation of holding period returns in investment analysis. Investor can’t compare the alternative investments using holding period returns, if their holding periods (investment periods) are different. Statistical data which can be used for the investment analysis and portfolio formation deals with a series of holding period returns. For example, investor knows monthly returns for a year of two stocks. How he/she can compare theseseriesofreturns?Inthesecases,arithmeticaveragereturnorsamplemeanofthereturns(ř)canbeused:
(2.3)
Investment Analysis and Portfolio Management
28/JNU OLE
However, both holding period returns and sample mean of returns are calculated using historical data. However, what happened in the past for the investor is not as important as what happens in the future, because all the investors’ decisions are focused to the future, or to expected results from the investments. Of course, no one investor knows the future, but he/she can use past information and the historical data as well as use his knowledge and practical experience to make some estimates about it. Analysing each particular investment vehicle possibilities to earn income in the future investor must think about several ‘scenarios’ of probable changes in macro economy, industry andcompanywhichcouldinfluenceassetpricesantrateofreturn.
Theoretically, it could be a series of discrete possible rates of return in the future for the same asset with the different probabilities of earning the particular rate of return. However, for the same asset the sum of all probabilities of these rates of returns must be equal to 1 or 100 %. In mathematical statistics, it is called simple probability distribution. The expected rate of return E(r) of investment is the statistical measure of return, which is the sum of all possible rates of returns for the same investment weighted by probabilities:
Here, (2.4)
In all cases, when investor has enough information for modelling future scenarios of changes in rate of return for investment, the decisions should be based on estimated expected rate of return. However, sometimes sample mean of return (arithmetic average return) is a useful proxy for the concept of expected rate of return. Sample mean can give an unbiased estimate of the expected value, but obviously it’s not perfectly accurate, because based on the assumption that the returns in the future will be the same as in the past. However, this is the only one scenario in estimating the expected rate of return. It could be expected, that the accuracy of sample mean will increase, as the size of the sample becomes longer (if n will be increased). However, the assumption, that the underlying probability distribution does not change its shape for the longer period becomes more and more unrealistic. In general, the sample meanofreturnsshouldbetakenforaslongtime,asinvestorisconfidenttherehasnotbeensignificantchangeinthe shape of historical rate of return probability distribution.
2.1.5 Variance and Co-varianceTheessentialfeatureofinvestingisthatthereturnsonthevastmajorityoffinancialassetsarenotguaranteed.Theprice of stocks can fall just as easily as they can rise, so a positive return in one holding period may become a negative in the next. For example, an investment in the shares of Yahoo! Inc. would have earned a return of 137% between October 2002 and September 2003. Three years later, the return from October 2005 through to September 2006 was 31%. The following year, the stock had a return of 2%. Changes of this magnitude in the returns in different holding periods are not exceptional.
It has already been stressed that as well as caring about the return on an asset or a portfolio, investor has to be equally concerned with the risk. What risk means in this context is the variability of the return across different holding periods. Two portfolios may have an identical mean return, but can have very different amounts of risk. There are few (if any) investors who would knowingly choose to hold the riskier of the two portfolios.
A measure of risk must capture the variability. The standard measure of risk used in investment analysis is the variance of return (or, equivalently, its square root which is called the standard deviation). An asset with a return that never changes has no risk. For this asset, the variance of return is 0. Any asset with a return that does vary will have a variance of return that is positive. More risk is on an asset with larger variance of return.
When constructing a portfolio it is not just the risk on individual assets that matters, but also the way in which this risk combines across assets to determine the portfolio variance. Two assets may be individually risky, but if these risks cancel when the assets are combined then a portfolio composed of the two assets may have very little risk. The risks on the two assets will cancel, if a higher than average return on one of the assets always accompanies a lower than average return on the other. The measure of the way returns are related across assets is called the covariance of return. The covariance will be seen to be central to the understanding portfolio construction. The portfolio variance andcovariancearenowdevelopedbyfirst introducingthevarianceofreturnasameasureoftheriskandthendeveloping the concept of covariance between assets.
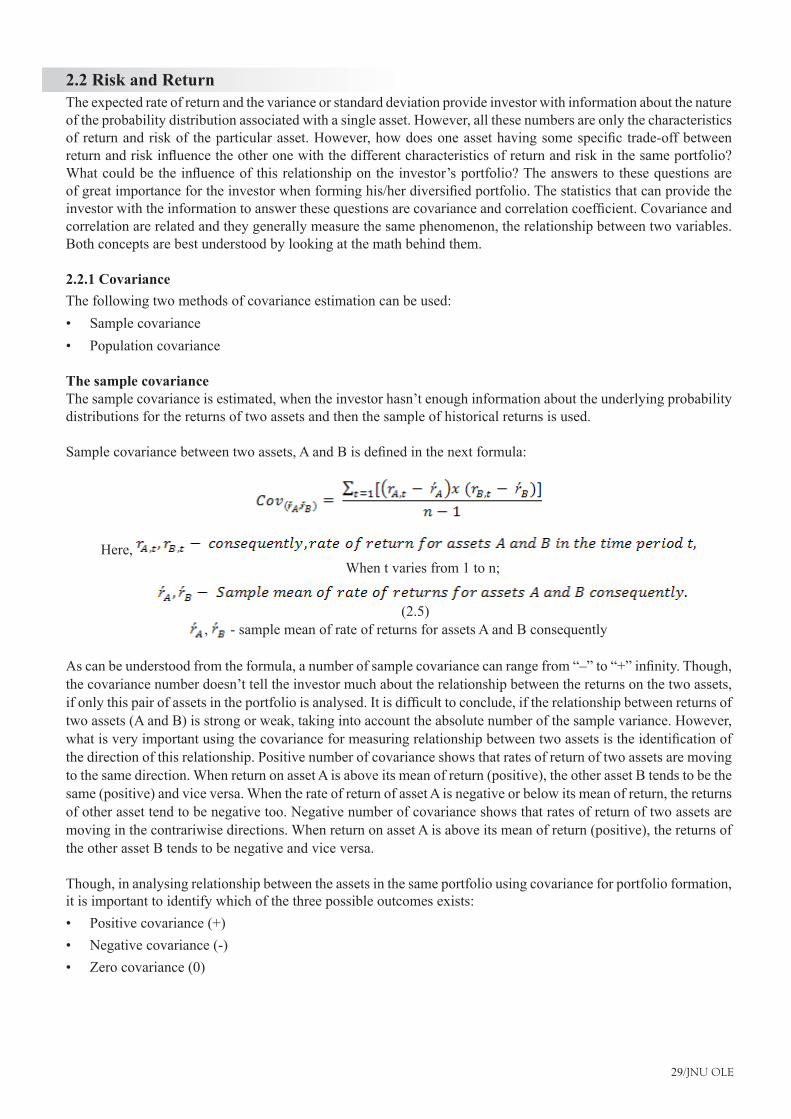
29/JNU OLE
2.2 Risk and ReturnThe expected rate of return and the variance or standard deviation provide investor with information about the nature of the probability distribution associated with a single asset. However, all these numbers are only the characteristics ofreturnandriskof theparticularasset.However,howdoesoneassethavingsomespecifictrade-offbetweenreturnandriskinfluencetheotheronewiththedifferentcharacteristicsofreturnandriskinthesameportfolio?Whatcouldbetheinfluenceofthisrelationshipontheinvestor’sportfolio?Theanswerstothesequestionsareofgreatimportancefortheinvestorwhenforminghis/herdiversifiedportfolio.Thestatisticsthatcanprovidetheinvestorwiththeinformationtoanswerthesequestionsarecovarianceandcorrelationcoefficient.Covarianceandcorrelation are related and they generally measure the same phenomenon, the relationship between two variables. Both concepts are best understood by looking at the math behind them.
2.2.1 CovarianceThe following two methods of covariance estimation can be used:
Sample covariance•Population covariance•
The sample covarianceThe sample covariance is estimated, when the investor hasn’t enough information about the underlying probability distributions for the returns of two assets and then the sample of historical returns is used.
Samplecovariancebetweentwoassets,AandBisdefinedinthenextformula:
Here, When t varies from 1 to n;
(2.5)
, - sample mean of rate of returns for assets A and B consequently
Ascanbeunderstoodfromtheformula,anumberofsamplecovariancecanrangefrom“–”to“+”infinity.Though,the covariance number doesn’t tell the investor much about the relationship between the returns on the two assets, ifonlythispairofassetsintheportfolioisanalysed.Itisdifficulttoconclude,iftherelationshipbetweenreturnsoftwo assets (A and B) is strong or weak, taking into account the absolute number of the sample variance. However, whatisveryimportantusingthecovarianceformeasuringrelationshipbetweentwoassetsistheidentificationofthe direction of this relationship. Positive number of covariance shows that rates of return of two assets are moving to the same direction. When return on asset A is above its mean of return (positive), the other asset B tends to be the same (positive) and vice versa. When the rate of return of asset A is negative or below its mean of return, the returns of other asset tend to be negative too. Negative number of covariance shows that rates of return of two assets are moving in the contrariwise directions. When return on asset A is above its mean of return (positive), the returns of the other asset B tends to be negative and vice versa.
Though, in analysing relationship between the assets in the same portfolio using covariance for portfolio formation, it is important to identify which of the three possible outcomes exists:
Positive covariance (+)•Negative covariance (-)•Zero covariance (0)•
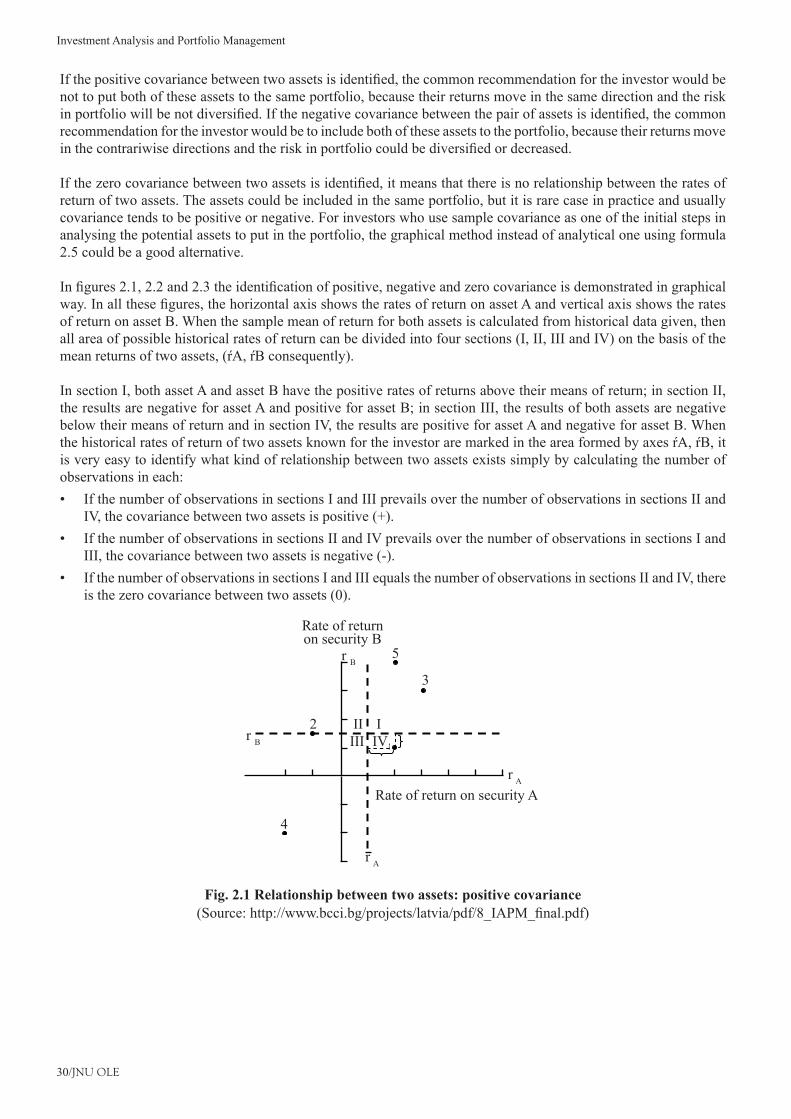
Investment Analysis and Portfolio Management
30/JNU OLE
Ifthepositivecovariancebetweentwoassetsisidentified,thecommonrecommendationfortheinvestorwouldbenot to put both of these assets to the same portfolio, because their returns move in the same direction and the risk inportfoliowillbenotdiversified.Ifthenegativecovariancebetweenthepairofassetsisidentified,thecommonrecommendation for the investor would be to include both of these assets to the portfolio, because their returns move inthecontrariwisedirectionsandtheriskinportfoliocouldbediversifiedordecreased.
Ifthezerocovariancebetweentwoassetsisidentified,itmeansthatthereisnorelationshipbetweentheratesofreturn of two assets. The assets could be included in the same portfolio, but it is rare case in practice and usually covariance tends to be positive or negative. For investors who use sample covariance as one of the initial steps in analysing the potential assets to put in the portfolio, the graphical method instead of analytical one using formula 2.5 could be a good alternative.
Infigures2.1,2.2and2.3theidentificationofpositive,negativeandzerocovarianceisdemonstratedingraphicalway.Inallthesefigures,thehorizontalaxisshowstheratesofreturnonassetAandverticalaxisshowstheratesof return on asset B. When the sample mean of return for both assets is calculated from historical data given, then all area of possible historical rates of return can be divided into four sections (I, II, III and IV) on the basis of the meanreturnsoftwoassets,(ŕA,ŕBconsequently).
In section I, both asset A and asset B have the positive rates of returns above their means of return; in section II, the results are negative for asset A and positive for asset B; in section III, the results of both assets are negative below their means of return and in section IV, the results are positive for asset A and negative for asset B. When thehistoricalratesofreturnoftwoassetsknownfortheinvestoraremarkedintheareaformedbyaxesŕA,ŕB,itis very easy to identify what kind of relationship between two assets exists simply by calculating the number of observations in each:
If the number of observations in sections I and III prevails over the number of observations in sections II and •IV, the covariance between two assets is positive (+).If the number of observations in sections II and IV prevails over the number of observations in sections I and •III, the covariance between two assets is negative (-).If the number of observations in sections I and III equals the number of observations in sections II and IV, there •is the zero covariance between two assets (0).
Rate of returnon security B
Rate of return on security A
5
2 IIV
IIIII
4
r B
r B
r A
r A
3
Fig. 2.1 Relationship between two assets: positive covariance(Source:http://www.bcci.bg/projects/latvia/pdf/8_IAPM_final.pdf)
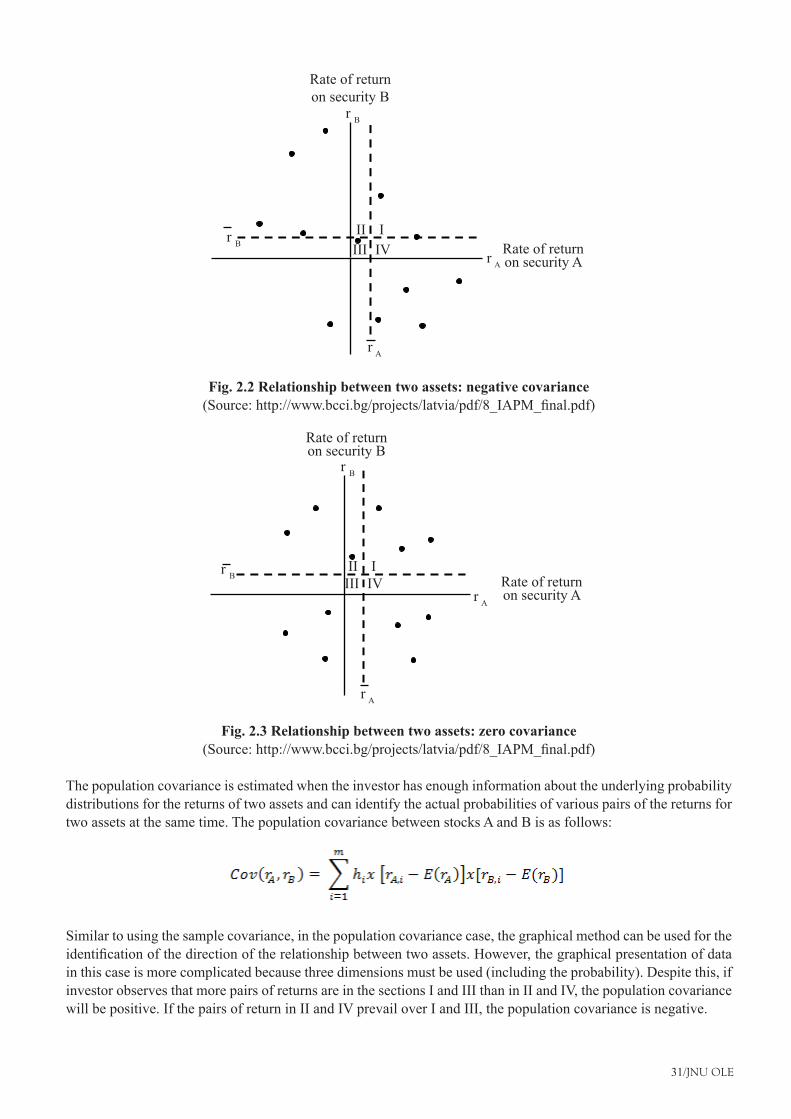
31/JNU OLE
Rate of return on security B
Rate of return on security A
IIV
IIIII
r B
r B
r A
r A
Fig. 2.2 Relationship between two assets: negative covariance(Source:http://www.bcci.bg/projects/latvia/pdf/8_IAPM_final.pdf)
Rate of returnon security B
Rate of returnon security A
r B
r B
r A
r A
IIV
IIIII
Fig. 2.3 Relationship between two assets: zero covariance(Source:http://www.bcci.bg/projects/latvia/pdf/8_IAPM_final.pdf)
The population covariance is estimated when the investor has enough information about the underlying probability distributions for the returns of two assets and can identify the actual probabilities of various pairs of the returns for two assets at the same time. The population covariance between stocks A and B is as follows:
Similar to using the sample covariance, in the population covariance case, the graphical method can be used for the identificationofthedirectionoftherelationshipbetweentwoassets.However,thegraphicalpresentationofdatain this case is more complicated because three dimensions must be used (including the probability). Despite this, if investor observes that more pairs of returns are in the sections I and III than in II and IV, the population covariance will be positive. If the pairs of return in II and IV prevail over I and III, the population covariance is negative.

Investment Analysis and Portfolio Management
32/JNU OLE
2.2.2 Correlation and Coefficient of DeterminationCorrelationisthedegreeofrelationshipbetweentwovariables.Thecorrelationcoefficientbetweentwoassetsiscloselyrelatedtotheircovariance.ThecorrelationcoefficientbetweentwoassetsAandB( ) can be calculated using the next formula:
Here,
Insteadofcovariance,whenthecalculatednumberisunbounded,thecorrelationcoefficientcanrangeonlyfrom-1,0to+1,0.Themoreclosetheabsolutemeaningofthecorrelationcoefficientto1,0,thestrongertherelationshipbetweenthereturnsoftwoassets.Twovariablesareperfectlypositivelycorrelated,ifcorrelationcoefficientis+1,0,that means that the returns of two assets have a perfect positive linear relationship to each other (see Fig. 2.4), and perfectlynegativelycorrelated,ifcorrelationcoefficientis-1,0,thatmeanstheassetreturnshaveaperfectinverselinear relationship to each other (see Fig. 2.5). However, most often correlation between asset returns is imperfect (seeFig.2.6).Whencorrelationcoefficientequals0,thereisnolinearrelationshipbetweenthereturnsonthetwoassets (see Fig. 2.7). Combining two assets with zero correlation with each other reduces the risk of the portfolio. While a zero correlation between two assets returns is better than positive correlation, it does not provide the risk reductionresultsofanegativecorrelationcoefficient.
r A
rB
Fig. 2.4 Perfect positive correlation between returns of two assets(Source:http://www.bcci.bg/projects/latvia/pdf/8_IAPM_final.pdf)
r B
r A
Fig. 2.5 Perfect negative correlation between returns of two assets(Source:http://www.bcci.bg/projects/latvia/pdf/8_IAPM_final.pdf)
33/JNU OLE
r B
r A
Fig. 2.6 Imperfect positive correlation between returns on two assets(Source:http://www.bcci.bg/projects/latvia/pdf/8_IAPM_final.pdf)
r B
r A
Fig. 2.7 Zero correlation between returns on two assets(Source:http://www.bcci.bg/projects/latvia/pdf/8_IAPM_final.pdf)
Itisusefultonote,thatwheninvestorknowscorrelationcoefficient,thecovariancebetweenstocksAandBcanbeestimated, because standard deviations of the assets’ rates of return will already are available:
Therefore, as it was pointed out earlier, the covariance primarily provides information to the investor about whether the relationship between asset returns is positive, negative or zero, because simply observing the number itself without any context with which to compare the number, is not very useful. When the covariance is positive, the correlationcoefficientwillbealsopositive,whenthecovarianceisnegative,thecorrelationcoefficientwillbealsonegative.However,usingcorrelationcoefficientsinsteadofcovarianceinvestorcanimmediatelyassessthedegreeof relationship between asset returns.
Thecoefficientofdetermination( )iscalculatedasthesquareofcorrelationcoefficient:
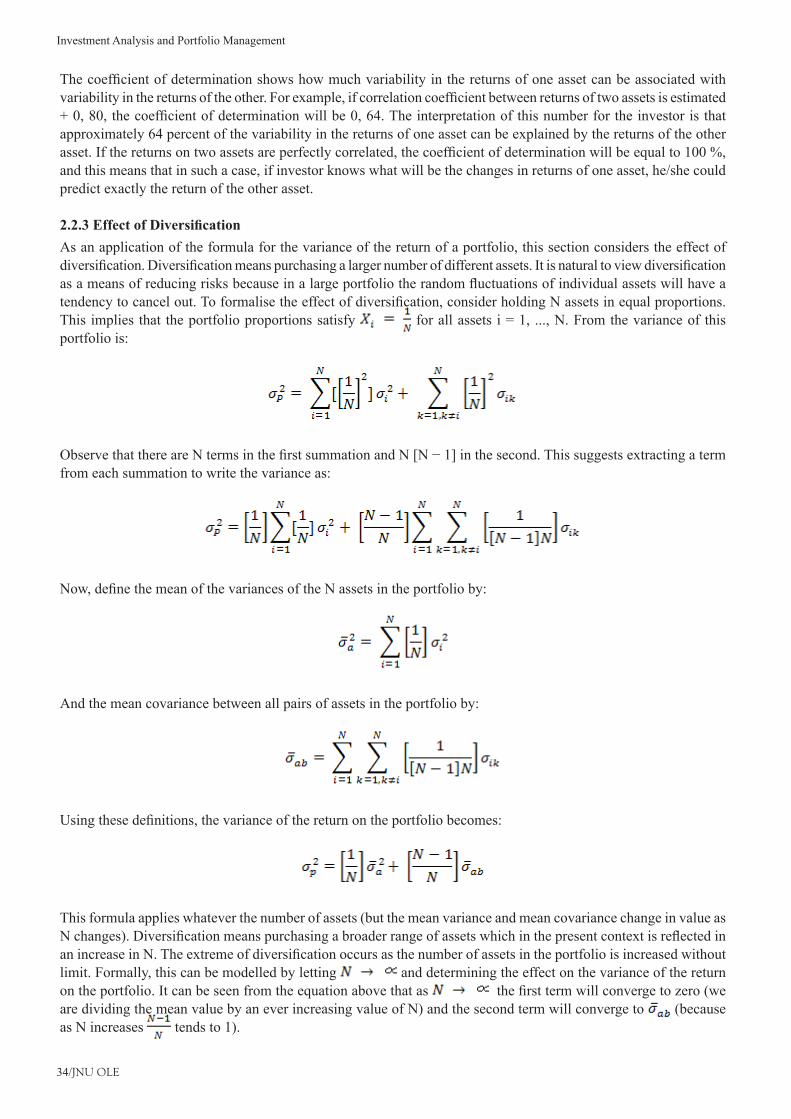
Investment Analysis and Portfolio Management
34/JNU OLE
Thecoefficientofdeterminationshowshowmuchvariabilityinthereturnsofoneassetcanbeassociatedwithvariabilityinthereturnsoftheother.Forexample,ifcorrelationcoefficientbetweenreturnsoftwoassetsisestimated+0,80,thecoefficientofdeterminationwillbe0,64.Theinterpretationofthisnumberfortheinvestoristhatapproximately 64 percent of the variability in the returns of one asset can be explained by the returns of the other asset.Ifthereturnsontwoassetsareperfectlycorrelated,thecoefficientofdeterminationwillbeequalto100%,and this means that in such a case, if investor knows what will be the changes in returns of one asset, he/she could predict exactly the return of the other asset.
2.2.3 Effect of DiversificationAs an application of the formula for the variance of the return of a portfolio, this section considers the effect of diversification.Diversificationmeanspurchasingalargernumberofdifferentassets.Itisnaturaltoviewdiversificationasameansofreducingrisksbecauseinalargeportfoliotherandomfluctuationsofindividualassetswillhaveatendencytocancelout.Toformalisetheeffectofdiversification,considerholdingNassetsinequalproportions.This implies that the portfolio proportions satisfy for all assets i = 1, ..., N. From the variance of this portfolio is:
ObservethatthereareNtermsinthefirstsummationandN[N−1]inthesecond.Thissuggestsextractingatermfrom each summation to write the variance as:
Now,definethemeanofthevariancesoftheNassetsintheportfolioby:
And the mean covariance between all pairs of assets in the portfolio by:
Usingthesedefinitions,thevarianceofthereturnontheportfoliobecomes:
This formula applies whatever the number of assets (but the mean variance and mean covariance change in value as Nchanges).DiversificationmeanspurchasingabroaderrangeofassetswhichinthepresentcontextisreflectedinanincreaseinN.Theextremeofdiversificationoccursasthenumberofassetsintheportfolioisincreasedwithoutlimit. Formally, this can be modelled by letting and determining the effect on the variance of the return on the portfolio. It can be seen from the equation above that as thefirsttermwillconvergetozero(weare dividing the mean value by an ever increasing value of N) and the second term will converge to (because as N increases tends to 1).
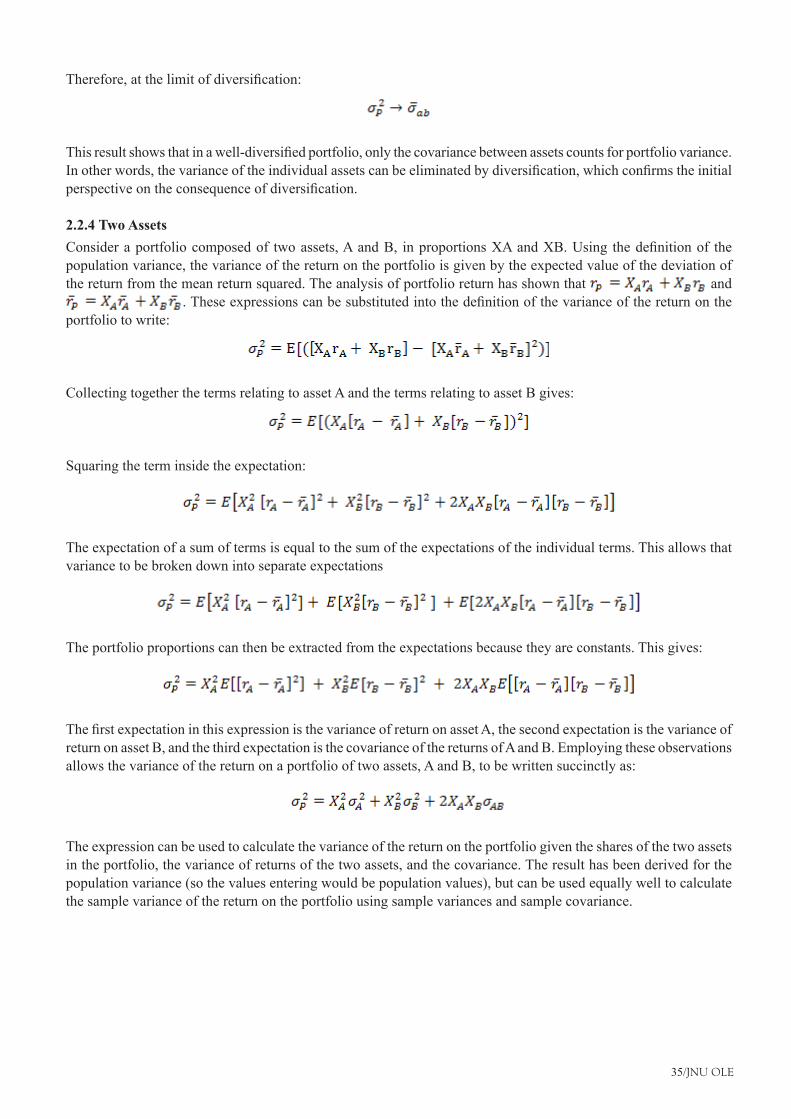
35/JNU OLE
Therefore,atthelimitofdiversification:
Thisresultshowsthatinawell-diversifiedportfolio,onlythecovariancebetweenassetscountsforportfoliovariance.Inotherwords,thevarianceoftheindividualassetscanbeeliminatedbydiversification,whichconfirmstheinitialperspectiveontheconsequenceofdiversification.
2.2.4 Two AssetsConsideraportfoliocomposedof twoassets,AandB, inproportionsXAandXB.Using thedefinitionof thepopulation variance, the variance of the return on the portfolio is given by the expected value of the deviation of the return from the mean return squared. The analysis of portfolio return has shown that and
.Theseexpressionscanbesubstitutedintothedefinitionofthevarianceofthereturnontheportfolio to write:
Collecting together the terms relating to asset A and the terms relating to asset B gives:
Squaring the term inside the expectation:
The expectation of a sum of terms is equal to the sum of the expectations of the individual terms. This allows that variance to be broken down into separate expectations
The portfolio proportions can then be extracted from the expectations because they are constants. This gives:
ThefirstexpectationinthisexpressionisthevarianceofreturnonassetA,thesecondexpectationisthevarianceofreturn on asset B, and the third expectation is the covariance of the returns of A and B. Employing these observations allows the variance of the return on a portfolio of two assets, A and B, to be written succinctly as:
The expression can be used to calculate the variance of the return on the portfolio given the shares of the two assets in the portfolio, the variance of returns of the two assets, and the covariance. The result has been derived for the population variance (so the values entering would be population values), but can be used equally well to calculate the sample variance of the return on the portfolio using sample variances and sample covariance.
Investment Analysis and Portfolio Management
36/JNU OLE
2.3 ReturnVarious types of returns are explained in the paragraphs given below.
2.3.1 Stock ReturnsThe process for the calculation of a return can also be applied to stocks. When doing this, it is necessary to take careofthepaymentofdividends,sincethesemustbeincludedaspartofthereturn.Wefirstshowhowtocalculatethe return for a stock that does not pay a dividend and then extend the calculation to include dividends. Consider a stock that pays no dividends for the holding period over which the return is to be calculated. Assume that this period is one year. In the formula for the return, we take the initial value, V0, to be the purchase price of the stock and the finalvalue,V1,tobeitstradingpriceoneyearlater.Iftheinitialpriceofthestockisp(0)andthefinalpricep(1),then the return on the stock is:
ExampleThe price of Lastminute.com stock trading in London on May 29 2002 was £0.77. The price at close of trading on May 28 2003 was £1.39. No dividends were paid. The return for the year of this stock is given by:
The method for calculating the return can now be extended to include the payment of dividends. To understand the calculation, it needs to be recalled that the return is capturing the rate of increase of an investor’s wealth. As dividend payments are an addition to wealth, they need to be included in the calculation of the return. In fact, the total increase in wealth from holding the stock is the sum of its price increase plus the dividend received. So, in the formulaforthereturn,thedividendisaddedtothefinalstockprice.Letting'd'denotethedividendpaidbyastockover the holding period, this gives the formula for the return:
Stocks in the US pay dividends four times per year and stocks in the UK pay dividends twice per year. When there are multiple dividend payments during the holding period, the value is the sum of these dividend payments.
2.3.2 Characteristic Line and Beta FactorBeforeexaminingtherelationshipbetweenaspecificassetandthemarketportfolio,theconceptof‘marketportfolio’needstobedefined.Theoreticalinterpretationofthemarketportfolioisthatitinvolveseverysingleriskyassetinthe global economic system, and contains each asset in proportion to the total market value of that asset relative to the total value of all other assets (value weighted portfolio). Going from conceptual to practical approach, market index can be used while measuring the return of the market portfolio in such a broad understanding. The investors can think of the market portfolio as the ultimate market index. If the investor following his/her investment policy makes the decision to invest, for example, only in stocks, the market portfolio practically can be presented by one of the available representative indexes in particular stock exchange. Most often, the relationship between the asset return and market portfolio return is demonstrated and examined using the common stocks as assets, but the same concept can be used analysing bonds, or any other assets. With the given historical data about the returns on the particular common stock ( ) and market index return ( ) in the same periods of time investor can draw the stock’s characteristic line (see Fig. 2.8).
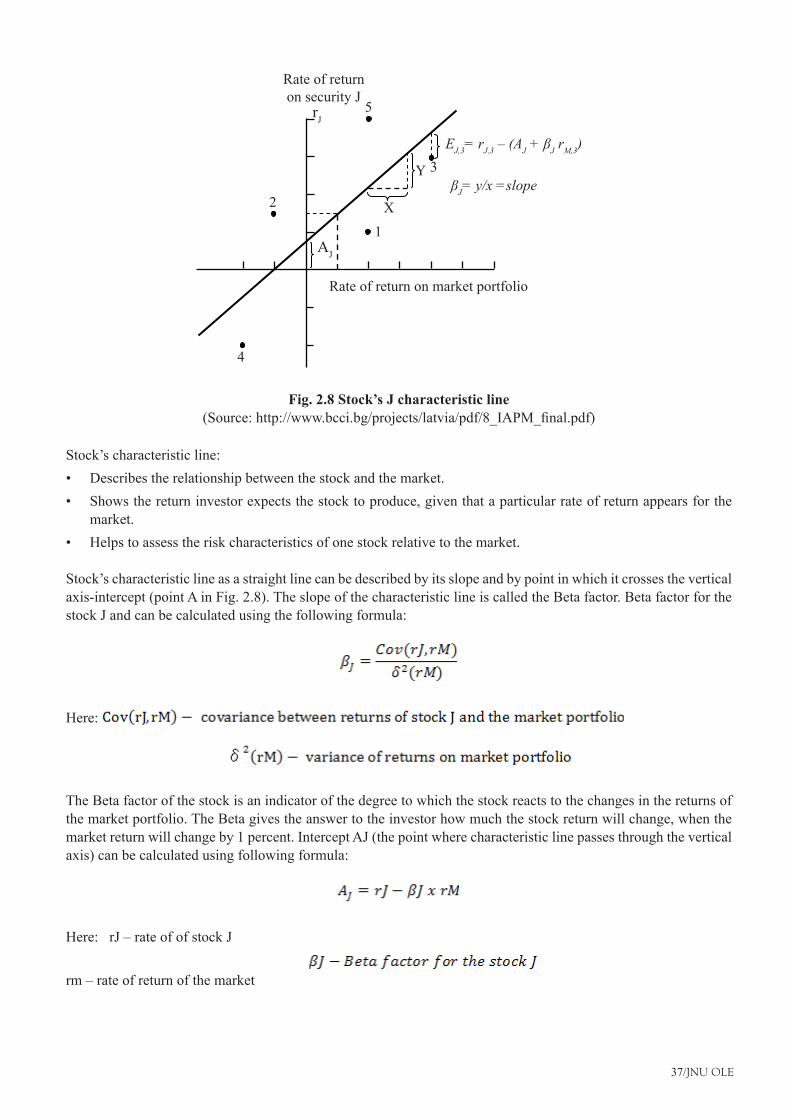
37/JNU OLE
Rate of returnon security J
βJ= y/x =slope
Rate of return on market portfolio
rJ
AJ
5
2
1X
Y
4
3ΕJ,3= rJ,3 – (AJ+βJ rM,3)
Fig. 2.8 Stock’s J characteristic line(Source:http://www.bcci.bg/projects/latvia/pdf/8_IAPM_final.pdf)
Stock’s characteristic line:Describes the relationship between the stock and the market.•Shows the return investor expects the stock to produce, given that a particular rate of return appears for the •market.Helps to assess the risk characteristics of one stock relative to the market.•
Stock’s characteristic line as a straight line can be described by its slope and by point in which it crosses the vertical axis-intercept (point A in Fig. 2.8). The slope of the characteristic line is called the Beta factor. Beta factor for the stock J and can be calculated using the following formula:
Here:
The Beta factor of the stock is an indicator of the degree to which the stock reacts to the changes in the returns of the market portfolio. The Beta gives the answer to the investor how much the stock return will change, when the market return will change by 1 percent. Intercept AJ (the point where characteristic line passes through the vertical axis) can be calculated using following formula:
Here: rJ – rate of of stock J
rm – rate of return of the market
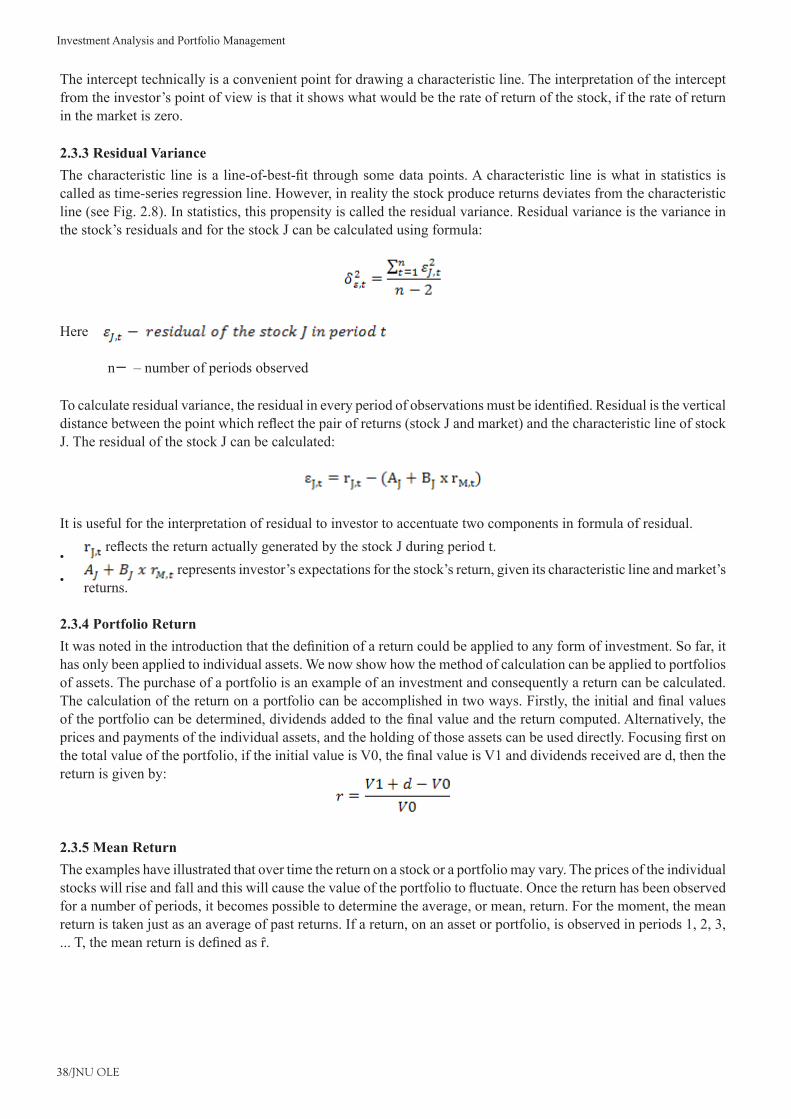
Investment Analysis and Portfolio Management
38/JNU OLE
The intercept technically is a convenient point for drawing a characteristic line. The interpretation of the intercept from the investor’s point of view is that it shows what would be the rate of return of the stock, if the rate of return in the market is zero.
2.3.3 Residual VarianceThecharacteristiclineisaline-of-best-fitthroughsomedatapoints.Acharacteristiclineiswhatinstatisticsiscalled as time-series regression line. However, in reality the stock produce returns deviates from the characteristic line (see Fig. 2.8). In statistics, this propensity is called the residual variance. Residual variance is the variance in the stock’s residuals and for the stock J can be calculated using formula:
Here
n – number of periods observed
Tocalculateresidualvariance,theresidualineveryperiodofobservationsmustbeidentified.Residualistheverticaldistancebetweenthepointwhichreflectthepairofreturns(stockJandmarket)andthecharacteristiclineofstockJ. The residual of the stock J can be calculated:
It is useful for the interpretation of residual to investor to accentuate two components in formula of residual.
•reflectsthereturnactuallygeneratedbythestockJduringperiodt.
• represents investor’s expectations for the stock’s return, given its characteristic line and market’s
returns.
2.3.4 Portfolio ReturnItwasnotedintheintroductionthatthedefinitionofareturncouldbeappliedtoanyformofinvestment.Sofar,ithas only been applied to individual assets. We now show how the method of calculation can be applied to portfolios of assets. The purchase of a portfolio is an example of an investment and consequently a return can be calculated. Thecalculationofthereturnonaportfoliocanbeaccomplishedintwoways.Firstly,theinitialandfinalvaluesoftheportfoliocanbedetermined,dividendsaddedtothefinalvalueandthereturncomputed.Alternatively,thepricesandpaymentsoftheindividualassets,andtheholdingofthoseassetscanbeuseddirectly.Focusingfirstonthetotalvalueoftheportfolio,iftheinitialvalueisV0,thefinalvalueisV1anddividendsreceivedared,thenthereturn is given by:
2.3.5 Mean Return The examples have illustrated that over time the return on a stock or a portfolio may vary. The prices of the individual stockswillriseandfallandthiswillcausethevalueoftheportfoliotofluctuate.Oncethereturnhasbeenobservedfor a number of periods, it becomes possible to determine the average, or mean, return. For the moment, the mean return is taken just as an average of past returns. If a return, on an asset or portfolio, is observed in periods 1, 2, 3, ...T,themeanreturnisdefinedasȓ.
39/JNU OLE
SummaryThe dictionary meaning of risk is the possibility of loss or injury; risk the possibility of not getting the expected •return.The systematic risk is caused by factors external to the particular company and uncontrollable by the •company.Interestrateriskisthevariationinthesingleperiodratesofreturncausedbythefluctuationsinthemarket•interest rate.JackClarkFrancishasdefinedmarketriskasthatportionoftotalvariabilityofreturncausedbythealternating•forces of bull and bear market.Theessentialfeatureofinvestingisthatthereturnsonthevastmajorityoffinancialassetsarenotguaranteed.•The expected rate of return and the variance or standard deviation provide investor with information about the •nature of the probability distribution associated with a single asset.Correlation is the degree of relationship between two variables.•Diversificationmeanspurchasingalargernumberofdifferentassets.•The process for the calculation of a return can also be applied to stocks.•Thecharacteristiclineisaline-of-best-fitthroughsomedatapoints.•The calculation of the return on a portfolio can be accomplished in two ways.•Thepricesoftheindividualstockswillriseandfallandthiswillcausethevalueoftheportfoliotofluctuate.•
ReferencesThe Investment Principle: Risk and Return Models. • [Pdf] Available at: <http://people.stern.nyu.edu/adamodar/pdfiles/acf3E/presentations/risk&ret.pdf>[Accessed07July2014].Return on Investment Analysis. • [Pdf] Available at: <http://www.agileinsights.com/content/pdfs/mjeffery%20Handbook%20ROI%20Chapter%20v3.pdf> [Accessed 07 July 2014].Haslem, J., 2009. • Mutual Funds: Risk and Performance Analysis for Decision Making. John Wiley & Sons.Chandra, P., 2008. • Investment Analysis. 3rd ed., Tata McGraw-Hill Education, New Delhi.Ses 13: Risk and Return II & Portfolio Theory I. • [Video online] Available at: <https://www.youtube.com/watch?v=tL7Lcl90Sc0> [Accessed 07 July 2014].CFA Level I Portfolio Risk and Return Part 2 A Video Lecture by Mr. Arif Irfanullah. • [Video online] Available at: <https://www.youtube.com/watch?v=J11dJ5zjULM> [Accessed 07 July 2014].
Recommended ReadingGreer, G. E. and Kolbe, P. T., 2003. • Investment Analysis for Real Estate Decisions. Dearborn Real Estate.Reilly, F. and Brown, K., 2011. • Investment Analysis and Portfolio Management. Cengage Learning. Ranganatham, M., 2006. • Investment Analysis and Portfolio Management. Pearson Education India.
Investment Analysis and Portfolio Management
40/JNU OLE
Self AssessmentThe dictionary meaning of risk is the possibility of loss or injury; risk the possibility of not getting the 1. expected_________.
returna. saleb. investmentc. componentsd.
What is caused by factors external to the particular company and uncontrollable by the company?2. The unsystematic riska. The systematic riskb. Interest rate riskc. Business riskd.
Match the following3.
1. Interest rate risk A. It is that portion of total variability of return caused by the alternating forces of bull and bear market.
2. Market risk B.Itreferstothevariationininvestorreturncausedbyinflation.
3. Purchasing power risk C. It refers to the variability of the income to the equity capital due to the debt capital.
4. Financial risk D. Most commonly, it affects the debt securities like bond, de-bentures.
1-C, 2-B, 3-A, 4-Da. 1-D, 2-A, 3-B, 4-Cb. 1-A, 2-C, 3-D, 4-Bc. 1-B, 2-D, 3-C, 4-Ad.
Which of the following is the uncertainty of returns to an investor who acquires securities denominated in a 4. currency different from his or her own?
Country riska. Liquidity riskb. Financial riskc. Exchange rate riskd.
What is also called political risk?5. Country riska. Liquidity riskb. Financial riskc. Exchange rate riskd.
A _________ is the ultimate objective for any investor.6. riska. investmentb. returnc. purchased.
41/JNU OLE
Which of the following statement is true?7. Correlation is the degree of relationship between three variables.a. Correlation is the degree of relationship between six variables.b. Correlation is the degree of relationship between four variables.c. Correlation is the degree of relationship between two variables.d.
___________ risk in a company is associated with the capital structure of the company.8. Countrya. Liquidityb. Financialc. Exchange d.
Which of the following statement is false?9. Diversificationmeanspurchasingalargernumberofdifferentassets.a. A characteristic line is what in statistics is called as time-series regression line.b. Investment situation may be high risk, medium and low risk investment.c. The unsystematic risk affects the market as a whole.d.
Whichofthefollowingisthevariationinthesingleperiodratesofreturncausedbythefluctuationsinthe10. market interest rate?
Market riska. Interest rate riskb. Purchasing power riskc. Business riskd.
Investment Analysis and Portfolio Management
42/JNU OLE
Chapter III
Fundamental and Technical Analysis for Investing in Stock
Aim
The aim of this chapter is to:
introduce fundamental analysis•
explain economical analysis•
explicate industry analysis•
Objectives
The objectives of this chapter are to:
enlisttheinfluenceoftheeconomyoncompanies•
elucidate company analysis•
explain technical analysis•
Learning outcome
At the end of this chapter, you will be able to:
identify the tools of technical analysis•
understand industry life cycle•
recognise the characteristics of industry analysis•
43/JNU OLE
3.1 IntroductionFundamental analysis is really a logical and systematic approach to estimating the future dividends and share price. It is based on the basic premise that share price is determined by a number of fundamental factors relating to the economy, industry and company. In other words, fundamental analysis means a detailed analysis of the fundamental factors affecting the performance of companies.
Each share is assumed to have an economic worth based on its present and future earning capacity. This is called its intrinsic value or fundamental value. The purpose of fundamental analysis is to evaluate the present and future earning capacity of a share based on the economy, industry and company fundamentals and thereby assess the intrinsic value of the share. The investor can compare the intrinsic value of the share with the prevailing market price to arrive at an investment decision. If the market price of the share is lower than its intrinsic value, the investor would decide to buy the share as it is underpriced. The price of such share is expected to move up in the future to match with its intrinsic value.
On the contrary, when the market price of a share is higher than its intrinsic value, it is perceived to be overpriced. The market price of such a share is expected to come down in future and hence, the investor should decide to sell such a share. Fundamental analysis thus provides an analytical framework for rational investment decision-making. This analytical framework is known as EIC framework, or economy-industry-company analysis.
3.1.1 Influence of the Economy Companies are a part of the industrial and business sector, which in turn is a part of the overall economy. Thus, the performanceofacompanydependsontheperformanceoftheeconomyinthefirstplace.Iftheeconomyisinrecessionor stagnation, ceteris paribus, the performance of companies will be bad in general, with some exceptions, however. On the other hand, if the economy is booming, incomes are rising and the demand is good, then the industries and the companies in general may be prosperous, with some exceptions however. The following are some effects of the influenceofeconomyoncompanies:
IntheIndianeconomy,thematterstobeconsideredinthefirstplacearethebehaviourofthemonsoonandthe•performance of agriculture. As agriculture is the mainstay of about 60% of the population and contributes nearly 25% of the output of the economy, it is important for the assessment and forecast of industrial performance. If the monsoon is good and agricultural incomes rise, the demand for industrial products and services will be good and industry prospers.India has a mixed economy, where the public sector plays a vital role. The Government being the biggest •investor and spender, the trends in public investment and expenditure would indicate the likely performance of the Indian economy. Concomitant with this, the government budget policy, tax levies and government borrowing programmealongwiththeextentofdeficitfinancingwillhaveamajorinfluenceontheperformanceoftheIndianeconomy,astheseinfluencethedemandandincomesofthepeople.Thechangesinexciseandcustomsduties, corporate taxes, etc., are all relevant to assess the trends in the economy as they have an impact on the industry and the companies.The monetary policy and trends in money supply which mainly depend on the government’s budget policy, its •borrowing from the public and credit from the banks and the RBI, have a major impact on the industrial growth throughthecostandavailabilityofcredit,theprofitmarginsofthecompanies,etc.Themonetarysituationalongwiththebudgetarypolicyinfluencesthemovementinpricelevel(inflation)andinterestrates.Thetightmoneyposition,increasingbudgetdeficitsandRBI-creationofcurrencyleadtoaninflationaryspiral.Althoughtheinterestratesintheorganisedfinancialsystemarecontrolled,thisisbeingchangedtoafreemarketeconomyand thebazaar rates in theunorganisedmarketdo reflect theavailabilityof funds in the freemarkets.So,interestratesinthefreemarketsandthedegreeofinflationdohaveamajorinfluenceontheeconomyandtheperformanceoftheindustries.Althoughamildinflationisgoodforbusinesspsychology,higherdegreesofinflation,particularlyintwodigits,willdefeatallbusinessplanning,leadtocostescalationsandsqueezeonprofitmargins.Thesewilladverselyaffecttheperformanceofindustryandcompanies.Thegeneralbusinessconditionsintheformofbusinesscyclesorthelevelofbusinessactivitiesdoinfluence•the demand for industrial products and the performance of the industry. In India, there are no business cycles, butoutputsdofluctuatedependinguponthestateoftheeconomy,performanceofagriculture,availabilityof
Investment Analysis and Portfolio Management
44/JNU OLE
powerandotherinfrastructuraloutputs,importedinputsandahostofotherfactors.Thesefactorsdoinfluencethecostsandprofitmarginsofcompaniesfrombothdemandandsupplysides.Thebusinessearningsandprofitsare affected by such changes in business conditions.The economic and political stability in the form of stable and long-term economic policies and a stable political •system with no uncertainty would also be necessary for a good performance of the economy in general and of companies in particular. The Government regulations being all pervasive in India, the government policy has to be known in advance in all its aspects and there should be no uncertainty about the political system as economic and political factors are interlinked. Political uncertainties and adverse changes in government policy do adversely affect industrial growth. Government policy relating to projects, clearance for foreign collaboration and foreign investment price and distribution controls, and listing requirements on stock exchanges and a host of other matters like import restrictions do affect the performance of companies. The foreign exchange position and the balance of payments situation at any time would also indicate the rigours of government policy with regard to imports, exports, foreign investment and related matters.
All the above factorsof the economy influence the corporateperformanceand the industry ingeneral. In anyinvestment analysis, a broad picture of these factors and a forecast of the growth of the economy and of industry would be necessary to decide, when to invest and what to invest in.
Fundamental analysis thus involves three steps:Economic analysis•Industry analysis•Company analysis•
3.2 Economic AnalysisThe performance of a company depends on the performance of the economy. Let us look at some of the key economic variables that an investor must monitor as part of his fundamental analysis.
Growth rate of national incomeThe rate of growth of the national economy is an important variable to be considered by an investor. GNP (Gross National Product), NNP (Net National Product) and GDP (Gross Domestic Product) are the different measures of the total income or total economic output as a whole. The estimated growth rate of the economy would be a pointer towards the prosperity of the economy. An economy typically passes through different stages of prosperity known as economic or business cycle.
The four stages of an economic cycle are as follows:Depression:Thisistheworstofthefourstages.Duringadepression,demandislowanddeclining.Inflationis•often high and so are interest rates.Recovery stage: The economy begins to receive after a depression. Demand picks up leading to more investments •intheeconomy.Production,employmentandprofitsareontheincrease.Boom: The phase of the economic cycle is characterised by high demand. Investments and production are •maintainedatahigh-leveltosatisfythehighdemand.Companiesgenerallyposthigherprofits.Recession: The boom phase gradually slows down. The economy slowly begins to experience a downturn in •demand,productionemployment,etc.;theprofitsofcompaniesalsostarttodecline.Thisistherecessionstageof the economy.
InflationInflationleadstoerosionofpurchasingpowerinthehandsofconsumers,thiswillresultinlowerthedemandofproducts.Inflationprevailingintheeconomyhasconsiderableimpactontheperformanceofcompanies.Higherrateofinflationupsetsbusinessplans.
45/JNU OLE
Interest ratesInterest rates determine the cost and availability of credit for companies operating in an economy. A low interest rate stimulates investment by making credit available easily and cheaply. On the contrary, higher interest rates result in highercostofproductionwhichmayleadtolowerprofitabilityandlowerdemand.
Government revenue, expenditure and deficitsGovernment is the largest investor and spender of money, the trend in government revenue and expenditure and deficithaveasignificantimpactontheperformanceofindustriesandcompanies’expenditurebythegovernmentstimulates the economy by creating jobs and generating demand. The nature of government spending is of greater importance in determining the fortunes of many companies.
Exchange ratesTheperformanceandprofitabilityofindustriesandcompaniesthataremajorimportersorexportersareconsiderablyaffected by the exchange rates of the rupee against major currencies of the world. A depreciation of the rupee improves the competitive position of Indian products in the foreign markets, thereby stimulating exports. However, it would alsomakeimportmoreexpensive.Acompanydependingmoreonimportsmayfindthatdevaluationoftherupeeaffectsitsprofitabilityadversely.
InfrastructureThe development of an economy depends very much on the infrastructure available. The availability of infrastructure facilities, such as power, transportation, and communication systems affects the performance of companies bad infrastructureleadtoinefficiencies,lowerproductivity,wastageanddelays.
MonsoonThe Indian economy is essentially an agrarian economy and agriculture forms a very important sector of the Indian economy. The performance of agriculture to a very extent depends on the monsoon; the adequacy of the monsoon determines the success or failure of the agricultural activities in India.
Economic and political stabilityA stable political environment is necessary for steady and balanced growth. Stable long-term economic policies are what are needed for industrial growth. Such stable policies emanate only from stable political systems as economic and political factors are interlinked.
3.3 Industry AnalysisAnindustryultimatelyinvestsmoneyinthesecuritiesofoneormorespecificcompanies,eachcompanycanbecharacterisedasbelongingtoanindustry.Theperformanceofcompanieswouldtherefore,beinfluencedbythefortunesoftheindustrytowhichitbelongs.anindustry“asagroupoffirmsproducingreasonablysimilarproductswhichservethesameneedsofcommonsetofbuyers.”
3.3.1 Industry Life CycleThe industry life cycle theory is generally attributed to Julius Grodinsky. According to the industry life cycle theory, the life of an industry can be segregated into to the pioneering stage the expansion stage, the stagnation stage, and thedecaystage.Thiskindofsegregationisextremelyusefultoaninvestor,becausetheprofitabilityofanindustrydepends upon its stage of growth.
Pioneering stageThisisthefirststageintheindustriallifecycleofanewindustry,wherethetechnologyaswellastheproductsare relatively new and have not reached a state of perfection. Pioneering stage is characterised by rapid growth in demandfortheoutputofindustry.Asaresult,thereisagreateropportunityforprofit.Manyfirmscompetewitheachothervigorously.Weakfirmsareeliminatedandalessernumberoffirmssurvivethepioneeringstage.Example:Leasing industry.
Investment Analysis and Portfolio Management
46/JNU OLE
Expansion stageOnce an industry has established itself, it enters the second stage of expansion or growth. These companies continue tobecomestronger.Eachcompanyfindsamarketforitselfanddevelopsitsownstrategiestosellandmaintainitsposition in the market. The competition among the surviving companies brings about improved products at lower prices. Companies in the expansion stage of an industry are quite attractive for investment purposes.
Stagnation stageIn this stage, the growth of the industry stabilises. The ability of the industry to grow appears to have been lost. Sales may be increasing, but at a slower rate than that experienced by competitive industries or by the overall economy. The transition of an industry from the expansion stages to stagnation stages is very slow. Important reason for this transition is change in social habits and development of improved technology. Example: The black and white television industry in India provides s a good example of an industry which passed from the expansion stages to stagnation stage.
Decay stageDecay stage occurs when the products of the industry are no longer in demand. New products and new technologies have come to the market. Customers have changed their habits, style and liking. As a result, the industry become obsolete and gradually ceases to decay of an industry
3.3.2 Industry CharacteristicsIn an industry analysis, there are a number of key characteristics that should be considered by the analyst.
Demand supply gapThe demand for the product usually tends to change at a steady rate, where as the capacity to produce the product tends to change at irregular intervals, depending upon the installation of additional production capacity. As a result, an industry is likely to experience under-supply and over-supply of capacity at different times. Excess supply reduces theprofitabilityoftheindustrythroughadeclineintheunitpricerealisation.Onthecontrary,insufficientsupplytendstoimprovetheprofitabilitythroughhigherunitpricerealisation.
Competitive conditions in the industryThe level of competition among various companies in an industry is determined by certain competitive forces. These competitive forces are:
Barriers to entry•The threat of substitution•Bargaining power of the suppliers•The rivalry among competitors•
PermanencePermanence is the phenomenon related to the products and the technology used by the industry. If an analyst feels that the need for a particular industry will vanish in a short period, or that the rapid technological changes would render the products obsolete within short period of time, it would be foolish to invest in such industry.
Labour conditionsIn our country, the labour unions are very powerful. If the labour in a particular industry is rebellious and is inclined to resort to strikes frequently, the prospects of that industry cannot become bright.
Attitude of governmentThe government may encourage certain industries and can assist such industries through favourable legislation. On the contrary, the government may look with disfavour on certain other industries. In India this has been the experience of alcoholic drinks and cigarette industries. A prospective investor should consider the role that the government is likely to play in the industry.
47/JNU OLE
Supply of raw materialsThisisalsooneoftheimportantfactorsthatdeterminestheprofitabilityofanindustry.Someindustrymayhavenodifficultyinobtainingthemajorrawmaterialsastheymaybeindigenouslyavailableinplenty.Otherindustriesmay have to depend on a few manufactures within the country or on imports from outside the country for their raw material supply.
Cost structureThecoststructure,thatisthefixedandvariablecost,affectthecostofproductionandprofitabilityofthefirm.Thehigherthefixedcostcomponent,higheristhesalesvolumenecessarytoachievebreakevenpoint.Conversely,thelowertheproportionoffixedcostrelativetovariablecost,lowerwouldbethebreakevenpoint.Itprovideshighermargin of safety. So, an analyst would consider favourably an industry that has a lower breakeven point.
3.4 Company Analysis Companyanalysisisthefinalstageoffundamentalanalysis.Theeconomyanalysisprovidestheinvestorabroadoutline of the prospects of growth in the economy, the industry analysis helps the investor to select the industry in which investment would be rewarding. Now, he has to decide the company in which he should invest his money. Company analysis provides answer to this question. In company analysis, the analyst tries to forecast the future earnings of the company, because there is a strong evidence that the earnings have a direct and powerful effect upon share prices. The level, trend and stability of earnings of a company, however depend upon a number of factors concerning the operations of the company.
Financial statementsThefinancialstatementsofacompanyhelptoassesstheprofitabilityandfinancialhealthofthecompany.Thetwobasicfinancialstatementsprovidedbyacompanyarethebalancesheetandtheprofitandlossaccount.Thebalancesheetindicatesthefinancialpositionofthecompanyonaparticulardate,namelythelastdayoftheaccountingyear.Theprofitandlossaccount,alsocalledincomestatement,revealstherevenueearned,thecostincurredandtheresultingprofitandlossofthecompanyforoneaccountingyear.
Analysis of financial statementsFinancialratiosaremostextensivelyusedtoevaluatethefinancialperformanceofthecompany,italsohelptoassessthewhetherthefinancialperformanceandfinancialstrengthsareimprovingordeteriorating,ratioscanbeusedforcomparativeanalysiseitherwithotherfirmsintheindustrythroughacrosssectionalanalysisoratimeseries analysis.
3.5 Technical AnalysisTechnical analysis is explained in the paragraphs given below.Importance of timing in investmentWhilefundamentalanalysisandsecurityevaluationexplainwhysharepricesfluctuate,howtheyaredeterminedand what to buy or sell, the technical analysis will help the decision, when to buy and traditional theory of capital marketefficiencypostulates,thatentryintothemarketatanytimeleadstothesameaveragereturnasthatofthemarket.However,intherealworldofimperfections,areinvestorswhohaveburnttheirfingersbyenteringthemarket at the wrong time. Investment timing is, therefore, crucial as the market is continuously jolted by waves of buying and selling and prices are moving in trends and cycles and are never stable. The stock market is different from other markets, as there is a continuous buying and selling and bid and offer rates as under a system of auctions. Theresultantprices,ledbythesheerforceofthemarket,mayfluctuateeitherwayandmayexhibitwavesortrends.Entry and exit in the market will, therefore, make all the difference to the spread between buying and selling prices andtheprofitsorlosses.Timingofinvestmentis,therefore,ofvitalimportancefortradinginthestockmarket.
Basic tenets of technical analysisTechnical analysis of the market is based on some basic tenets, namely, that all fundamental factors are discounted bythemarketandarereflectedinprices.Secondly,thesepricesmoveintrendsorwaveswhichcanbeboth,upwardor downward depending on the sentiment, psychology and emotions of operators or traders. Thirdly, the present
Investment Analysis and Portfolio Management
48/JNU OLE
trendsareinfluencedbythepasttrends,andtheprojectionoffuturetrendsispossiblebyananalysisofpastpricetrends.AnalysisofhistoricaltrendsconfirmedtheaboveprinciplesandtheRandomWalkTheoryexplainingtherandomness of price changes have been found to be not applicable by the technical analysts in practice.
3.5.1 Basics of Technical AnalysisA technical analysis believes that the share price is determined by the demand and supply forces operating in the market. A technical analysis concentrates on the movement of share prices. By examining past share price movements, future share price can be accurately predicted. The basic premise of technical analysis is that prices move in trends or waves which may be upward or downward. A rational behind the technical analysis is that share price behaviour repeats itself over time and analysts attempt to drive methods to predict this repetition.
3.5.2 Basic Principles of Technical AnalysisThe market value of a security is related to the demand and supply factors operating in the market. There are both rational and irrational factors which surround the supply and demand factors of a security. Security prices behave in a manner that their movement is continuous in a particular direction for some length of time. Trends in stock prices have been seen to change, when there is a shift in the demand and supply factors. The shift in demand and supply can be detected through charts prepared specially to show the market action. Patterns which are projected by charts record price movements and these recorded patterns are used price movements and these recorded patterns are used by analysts to make forecasts about the movement of prices in future.
3.6 Tools of Technical AnalysisTools of technical analysis are discussed in the paragraphs given below.
3.6.1 Dow TheoryThis theory is formulated by Charles H. Dow. Dow who is the editor of the Wall Street Journal in the U.S.A formulatedahypothesisthatthestockmarketdoesnotmoveonrandombasis,butisinfluencedbythreedistinctcyclical trends that guide its direction. According to Dow Theory, the market has three movements and these movements are simultaneous in nature. These movements are the primary movements, secondary reactions and minor movements.
The primary movement is the long-range cycle that carries the entire market up or down. This is the long-term trend in the market. The secondary reactions act as a restraining force on the primary movement. These are in the opposite direction to the primary movement and last only for a short while and are known as corrections. These are secondary reactions.Thethirdmovementinthemarketistheminormovementswhicharetheday-to-dayfluctuationsinthemarket.Theminormovementsarenotsignificantandhavenoanalyticalvalueastheyareofveryshortduration.The three movements of the market have been compared to the tides, the waves and the ripples in the ocean.
3.6.2 Bullish TrendDuring the bullmarket (upwardmovingmarket), in thefirst phase, the pricewould advancewith the revivalofconfidenceinthefutureofbusiness.Duringthesecondphase,pricewouldadvanceduetoimprovementsincorporateearnings,inthethirdphase,pricesadvanceduetoinflationandspeculation.AccordingtoDowTheory,the formulation of higher bottoms and higher tops indicates a bullish trend.
3.6.3 Bearish TrendThebearmarketisalsocharacterisedbythreephases,inthefirstphase,pricebegintofallduetoabandonmentofhopes.Inthesecondphase,companiesstarttoreportinglowerprofitsandlowerdividends,inthefinalphase,pricefalls still further due to distress selling. A bearish market would be indicated by the formulation of lower tops and lower bottoms. The theory also makes certain assumptions, which have been referred to as the hypothesis of the theory.
Thefirsthypothesisstatesthattheprimarytrendcannotbemanipulated.Itmeansthatnosingleindividualor•institutionorgroupofindividualsandinstitutionsorgroupofindividualsandinstitutionscanexertinfluenceon the major trends of the market.
49/JNU OLE
Thesecondhypothesisstatesthattheaveragesdiscounteverything.Whichmeansisthatthedailypricesreflect•the aggregate judgement and emotions of all stock market participants. In arriving at the price of a stock, the market discounts everything known and predictable about the stock that is likely to affect the demand and supply position of the stock.The third hypothesis states that the theory is not infallible. The theory is concerned with the trend of the market •and has no forecasting value as regards the duration.
3.6.4 Chartist MethodAs referred to earlier, technical analysis is a study of the market data in terms of factors affecting supply and demand schedules, namely, prices, volume of trading, etc. A study of the historical trends of market behaviour shows the cyclesandtrendsinprices,whichmayrepeatasthepresentisareflectionofthepastandthefutureofthepresent.This is the basis for forecasting the future trends, which are used for deciding on the basis of the buy or sell signals. For forecasting, analysts use charts and diagrams to depict the past trends and project the future. However, these methods are rough and ready methods and there are no foolproof methods of forecasting the stock prices. The technical analysis only helps to improve the knowledge of the probabilities of price behaviour (upswing or downswing) and help the investment process.
The technical analysis does not claim 100% chance of success in predictions that are made for investment. In view of the limitations inherent in the technical analysis, this analysis is generally juxtaposed with fundamental analysis of the market and the scripts. It was the past experience that the receipt of information and the actual price absorption of the information would not coincide and there is a time lag between them. As a result, the current price changes would give a clue to the subsequent price changes, if properly analysed and interpreted. In the market analysis, the variables to be taken into account are the breadth of the market, volume of trading, etc. Market breadth is the dispersion of the general price rise or decline, which means daily cumulation of a net number of advancing or declining issues. Breadth analysis focuses on change, rather than level in prices. Breadth of price changes in terms of the number of gainers or losers among the scripts is analysed to know the width of rise or fall in prices.
3.6.5 Charts and Trade LinesThe technical analysis uses charts for analysis of prices. Fitting a trend line for price changes on a daily-basis is the firststepintheanalysisofcharts.Thesechangesmaybepointingupwardsordownwardsorstableoverahorizontalone. The movements are such that there are both peaks and troughs in these price changes, peaks showing an upward trend troughs or reactions to the uptrend, viz., line joining the lowest points or troughs pointing up. If this line is pointing downwards, then it is a bearish phase. If the movements are downwards generally, then there will be rallies moving up the prices. These upper peaks, if they are joined, give the trend line as much as the lowest troughs.
The bull phase depicts the rising peaks successively, while the bear phase shows the falling peaks successively. When the share prices are rising or falling, there will be a resistance level above which the prices may not pierce in the upward direction or a support level, below which the price may not fall. These support lines and resistance lines are clearly noticed, when the prices are moving in a narrow band for some time. When the price pierces the resistanceline,thisisthefirstindicationofthereversalofthetrendintheupwarddirection.So,alsoinabullphasewhenthepricelinefallsbelowthesupportline,areversalofthetrendisindicated.Variousconfigurationsofpricemovements like stable pattern, M and W patterns, head and shoulders, etc., are formed. It is possible that various triangles,flags,pendants,etc.,canbedescribedbythepricetrends.Thebasicanalysisinvolvesthedecipheringofthetrend,identifyingthereversalandfixingupofbuyandsellsignalsinthesepricemovements.Thestablepricepattern is ideal for genuine investors to enter the market.

Investment Analysis and Portfolio Management
50/JNU OLE
PRIC
E
PRIC
E
Y Y
O OX XTIME TIME
Resistance Line
Support Line
Resistance Line
Support Line
Bullish Bearish
Fig. 3.1 Trade lines(Source: http://site.ebrary.com/lib/utspune/docDetail.action?docID=10415576&p00=Security+analysis+%26+por
tfolio+management)
3.6.6 Criticism of DowThe Dow Theory is subject to various limitations in actual practice. Dow has developed this theory to depict the general trend of the market, but not with the intention of projecting the future trends or to diagnose the buy and sell signalsinthemarket.TheseapplicationsoftheDowTheoryhavecomeinthelightofanalyticalstudiesoffinancialanalysts. This theory is criticised on the ground that it is too subjective and based on historical interpretation; it is not infallible as it depends on the interpretative ability of the analyst. The results of this theory do not also give meaningful and conclusive evidence of any action to be taken in terms of buy and sell operations.
51/JNU OLE
SummaryFundamental analysis is really a logical and systematic approach to estimating the future dividends and share •price. It is based on the basic premise that share price is determined by a number of fundamental factors relating to the economy, industry and company.The investor can compare the intrinsic value of the share with the prevailing market price to arrive at an •investment decision.If the economy is in recession or stagnation, ceteris paribus, the performance of companies will be bad in general, •with some exceptions however.Themonetarysituationalongwiththebudgetarypolicyinfluencesthemovementinpricelevel(inflation)and•interest rates.The performance of a company depends on the performance of the economy.•The rate of growth of the national economy is an important variable to be considered by an investor.•The estimated growth rate of the economy would be a pointer towards the prosperity of the economy.•Inflationleadstoerosionofpurchasingpowerinthehandsofconsumers,thiswillresultinlowerthedemand•of products.The development of an economy depends very much on the infrastructure available.•The industry life cycle theory is generally attributed to Julius Grodinsky.•Thecost-structurethatisthefixedandvariablecost,affectthecostofproductionandprofitabilityofthefirm.•Companyanalysisisthefinalstageoffundamentalanalysis.•A technical analysis believes that the share price is determined by the demand and supply forces operating in •the market.
ReferencesTechnical Analysis for Long-term Investors. • [Pdf] Available at: <http://www.clayallen.com/TALTI.pdf> [Accessed 07 July 2014].Stock Market Analysis in Practice: Is It Technical or Fundamental? • [Pdf] Available at: <http://www.scienpress.com/Upload/JAFB/Vol%201_3_9.pdf> [Accessed 07 July 2014].Khan, A. and Zuberi, V., 1999. • Stock Investing for Everyone: Tools for Investing Like the Pros. John Wiley & Sons.Krantz, M., 2009. • Fundamental Analysis for Dummies. John Wiley & Sons.Technical Analysis (Basics)|Investment Knowledge. • [Video online] Available at: <https://www.youtube.com/watch?v=1j3Pdj32RU4 > [Accessed 07 July 2014].What Is the Difference Between Fundamental Theory and Technical Analysis? • [Video online] Available at: <https://www.youtube.com/watch?v=2A9J8kRiPLQ > [Accessed 07 July 2014].
Recommended ReadingSchlichting, T., 2013. • Fundamental Analysis, Behavioral Finance and Technical Analysis on the Stock Market. GRIN Verlag.Joehnk, G., 2012. • Fundamentals of Investing. Pearson Education India. Mladjenovic, P., 2013. • Stock Investing For Dummies. John Wiley & Sons.
Investment Analysis and Portfolio Management
52/JNU OLE
Self AssessmentFundamental analysis is really a logical and ___________ approach to estimating the future dividends and share 1. price, it is based on the basic premise that share price is determined by a number of fundamental factors relating to the economy, industry and company.
practicala. realisticb. systematicc. rationald.
When each share is assumed to have an economic worth based on its present and future earning capacity, what 2. is it called?
Intrinsic value or fundamental valuea. Fundamental analysis b. Economic analysisc. Industry analysisd.
Match the following3.
1. Depression A. Investments and production are maintained at a high level to satisfy the high demand.
2. Recovery stage B. During this stage, demand is low and declining.
3. Boom C. In this stage the economy slowly begin to experience a downturn in demand, productionemploymentetc.theprofitsofcompaniesarealsostarttodecline.
4. Recession D. Demand picks up leading to more investments in the economy.
1-B, 2-D, 3-A, 4-Ca. 1-D, 2-C, 3-B, 4-Ab. 1-A, 2-B, 3-C, 4-Dc. 1-C, 2-A, 3-D, 4-Bd.
What leads to erosion of purchasing power in the hands of consumers, this will result in lower the demand of 4. products?
Interest ratea. Boomb. Recessionc. Inflationd.
Which of the following statement is true?5. The development of an economy does not depend on the infrastructure available.a. The development of an economy depends very much on the infrastructure available.b. The process of an economy depends on the infrastructure available.c. The development of exchange rate depends very much on the infrastructure available.d.
53/JNU OLE
A ___________ of the rupee improves the competitive position of Indian products in the foreign markets, 6. thereby stimulating exports.
depreciationa. developmentb. productivityc. wastaged.
Whichofthefollowingisthefirststageintheindustriallifecycleofanewindustry,wherethetechnologyas7. well as the product are relatively new and have not reached a state of perfection?
Expansion stagea. Stagnation stageb. Decay stagec. Pioneering staged.
Which of the following statement is false?8. Pioneering stage is characterised by rapid growth in demand for the output of industry.a. Expansion stage occurs when the products of the industry are no longer in demand.b. Excesssupplyreducestheprofitabilityoftheindustrythroughadeclineintheunitpricerealisation.c. Insufficientsupplytendstoimprovetheprofitabilitythroughhigherunitpricerealisation.d.
__________analysisisthefinalstageoffundamentalanalysis.9. Economica. Industryb. Companyc. Futured.
Whoformulatedahypothesisthatthestockmarketdoesnotmoveonrandombasis,butisinfluencedbythree10. distinct cyclical trends that guide its direction?
Charles H. Dowa. Julius Grodinskyb. Mike Tysonc. Charles Darwind.
Investment Analysis and Portfolio Management
54/JNU OLE
Chapter IV
Portfolio Management
Aim
The aim of this chapter is to:
introduce portfolio management•
explaintheportfoliomeaninganddefinition•
explicate objectives of portfolio management•
Objectives
The objectives of this chapter are to:
explain portfolio theories•
elucidate the expected rate of return and risk of portfolio•
explicate arbitrage price theory•
Learning outcome
At the end of this chapter, you will be able to:
identifymarketefficiencytheory•
understand security analysis and portfolio management•
recognise risk of the portfolio•
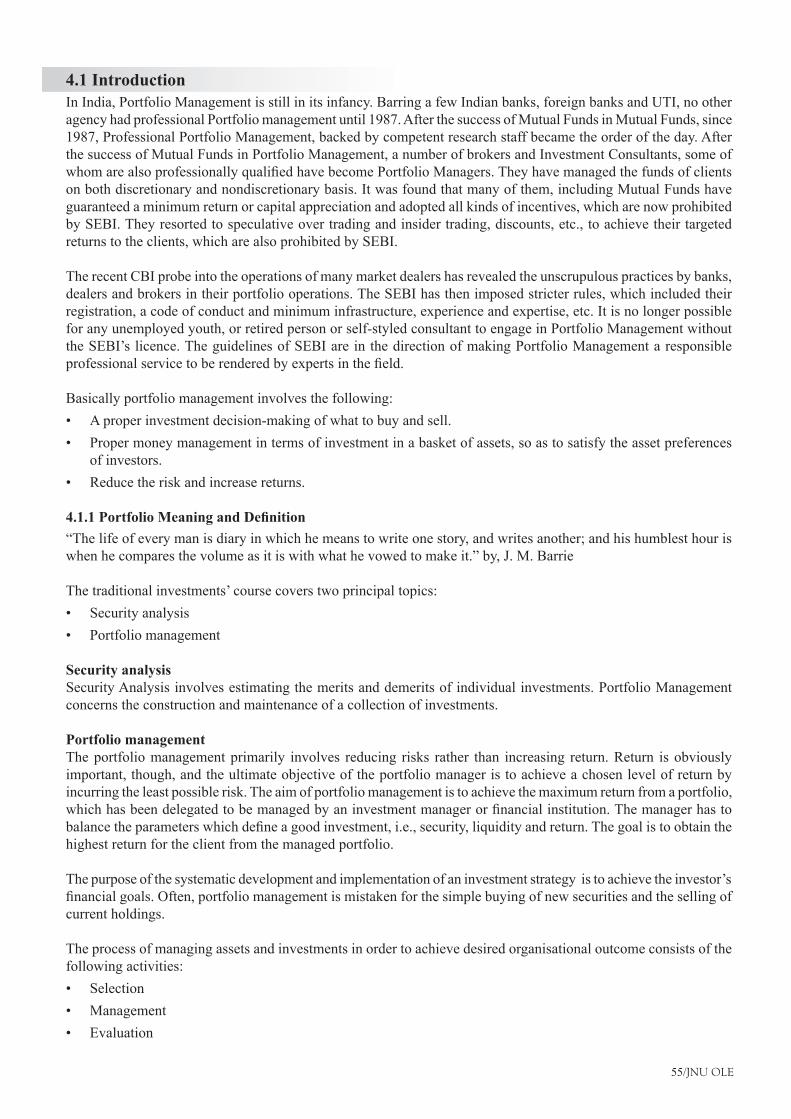
55/JNU OLE
4.1 IntroductionIn India, Portfolio Management is still in its infancy. Barring a few Indian banks, foreign banks and UTI, no other agency had professional Portfolio management until 1987. After the success of Mutual Funds in Mutual Funds, since 1987, Professional Portfolio Management, backed by competent research staff became the order of the day. After the success of Mutual Funds in Portfolio Management, a number of brokers and Investment Consultants, some of whomarealsoprofessionallyqualifiedhavebecomePortfolioManagers.Theyhavemanagedthefundsofclientson both discretionary and nondiscretionary basis. It was found that many of them, including Mutual Funds have guaranteed a minimum return or capital appreciation and adopted all kinds of incentives, which are now prohibited by SEBI. They resorted to speculative over trading and insider trading, discounts, etc., to achieve their targeted returns to the clients, which are also prohibited by SEBI.
The recent CBI probe into the operations of many market dealers has revealed the unscrupulous practices by banks, dealers and brokers in their portfolio operations. The SEBI has then imposed stricter rules, which included their registration, a code of conduct and minimum infrastructure, experience and expertise, etc. It is no longer possible for any unemployed youth, or retired person or self-styled consultant to engage in Portfolio Management without the SEBI’s licence. The guidelines of SEBI are in the direction of making Portfolio Management a responsible professionalservicetoberenderedbyexpertsinthefield.
Basically portfolio management involves the following:A proper investment decision-making of what to buy and sell.•Proper money management in terms of investment in a basket of assets, so as to satisfy the asset preferences •of investors.Reduce the risk and increase returns.•
4.1.1 Portfolio Meaning and Definition“The life of every man is diary in which he means to write one story, and writes another; and his humblest hour is whenhecomparesthevolumeasitiswithwhathevowedtomakeit.”by,J.M.Barrie
The traditional investments’ course covers two principal topics:Security analysis•Portfolio management•
Security analysisSecurity Analysis involves estimating the merits and demerits of individual investments. Portfolio Management concerns the construction and maintenance of a collection of investments.
Portfolio managementThe portfolio management primarily involves reducing risks rather than increasing return. Return is obviously important, though, and the ultimate objective of the portfolio manager is to achieve a chosen level of return by incurring the least possible risk. The aim of portfolio management is to achieve the maximum return from a portfolio, whichhasbeendelegatedtobemanagedbyaninvestmentmanagerorfinancialinstitution.Themanagerhastobalancetheparameterswhichdefineagoodinvestment,i.e.,security,liquidityandreturn.Thegoalistoobtainthehighest return for the client from the managed portfolio.
The purpose of the systematic development and implementation of an investment strategy is to achieve the investor’s financialgoals.Often,portfoliomanagementismistakenforthesimplebuyingofnewsecuritiesandthesellingofcurrent holdings.
The process of managing assets and investments in order to achieve desired organisational outcome consists of the following activities:
Selection•Management•Evaluation•
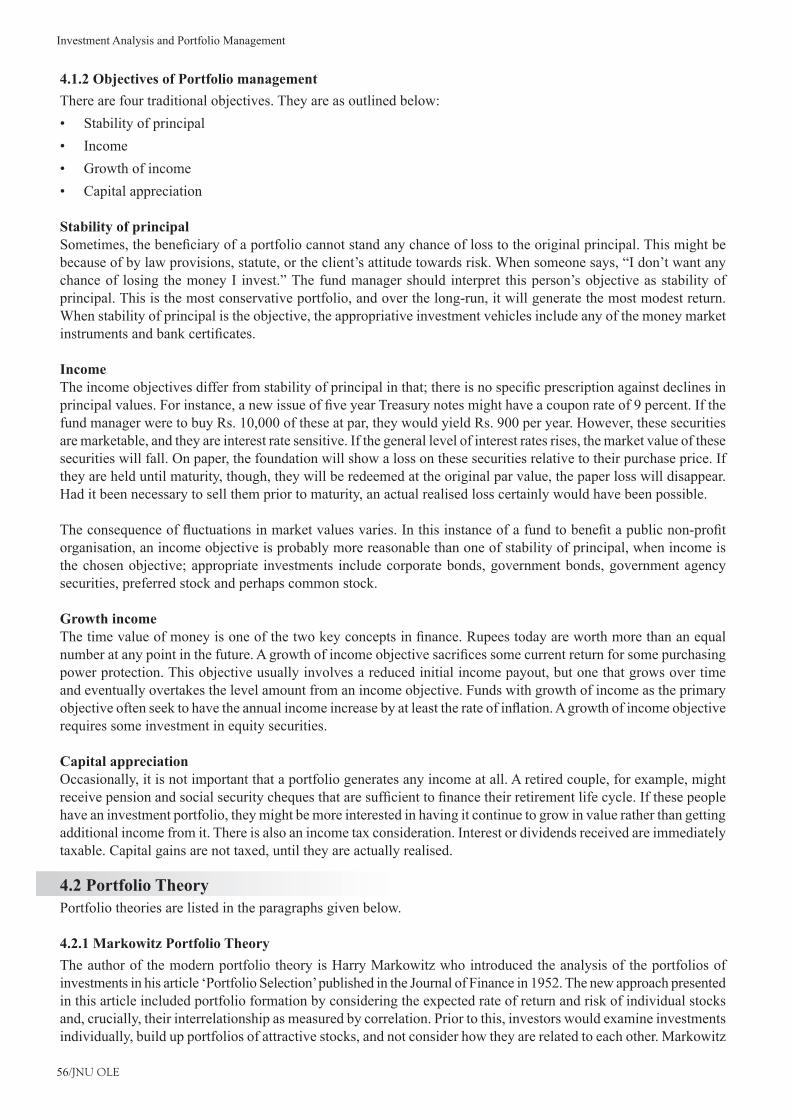
Investment Analysis and Portfolio Management
56/JNU OLE
4.1.2 Objectives of Portfolio managementThere are four traditional objectives. They are as outlined below:
Stability of principal•Income•Growth of income•Capital appreciation•
Stability of principalSometimes,thebeneficiaryofaportfoliocannotstandanychanceoflosstotheoriginalprincipal.Thismightbebecause of by law provisions, statute, or the client’s attitude towards risk. When someone says, “I don’t want any chanceof losing themoneyI invest.”Thefundmanagershould interpret thisperson’sobjectiveasstabilityofprincipal. This is the most conservative portfolio, and over the long-run, it will generate the most modest return. When stability of principal is the objective, the appropriative investment vehicles include any of the money market instrumentsandbankcertificates.
IncomeTheincomeobjectivesdifferfromstabilityofprincipalinthat;thereisnospecificprescriptionagainstdeclinesinprincipalvalues.Forinstance,anewissueoffiveyearTreasurynotesmighthaveacouponrateof9percent.Ifthefund manager were to buy Rs. 10,000 of these at par, they would yield Rs. 900 per year. However, these securities are marketable, and they are interest rate sensitive. If the general level of interest rates rises, the market value of these securities will fall. On paper, the foundation will show a loss on these securities relative to their purchase price. If they are held until maturity, though, they will be redeemed at the original par value, the paper loss will disappear. Had it been necessary to sell them prior to maturity, an actual realised loss certainly would have been possible.
Theconsequenceoffluctuationsinmarketvaluesvaries.Inthisinstanceofafundtobenefitapublicnon-profitorganisation, an income objective is probably more reasonable than one of stability of principal, when income is the chosen objective; appropriate investments include corporate bonds, government bonds, government agency securities, preferred stock and perhaps common stock.
Growth incomeThetimevalueofmoneyisoneofthetwokeyconceptsinfinance.Rupeestodayareworthmorethananequalnumberatanypointinthefuture.Agrowthofincomeobjectivesacrificessomecurrentreturnforsomepurchasingpower protection. This objective usually involves a reduced initial income payout, but one that grows over time and eventually overtakes the level amount from an income objective. Funds with growth of income as the primary objectiveoftenseektohavetheannualincomeincreasebyatleasttherateofinflation.Agrowthofincomeobjectiverequires some investment in equity securities.
Capital appreciationOccasionally, it is not important that a portfolio generates any income at all. A retired couple, for example, might receivepensionandsocialsecuritychequesthataresufficienttofinancetheirretirementlifecycle.Ifthesepeoplehave an investment portfolio, they might be more interested in having it continue to grow in value rather than getting additional income from it. There is also an income tax consideration. Interest or dividends received are immediately taxable. Capital gains are not taxed, until they are actually realised.
4.2 Portfolio TheoryPortfolio theories are listed in the paragraphs given below.
4.2.1 Markowitz Portfolio TheoryThe author of the modern portfolio theory is Harry Markowitz who introduced the analysis of the portfolios of investments in his article ‘Portfolio Selection’ published in the Journal of Finance in 1952. The new approach presented in this article included portfolio formation by considering the expected rate of return and risk of individual stocks and, crucially, their interrelationship as measured by correlation. Prior to this, investors would examine investments individually, build up portfolios of attractive stocks, and not consider how they are related to each other. Markowitz
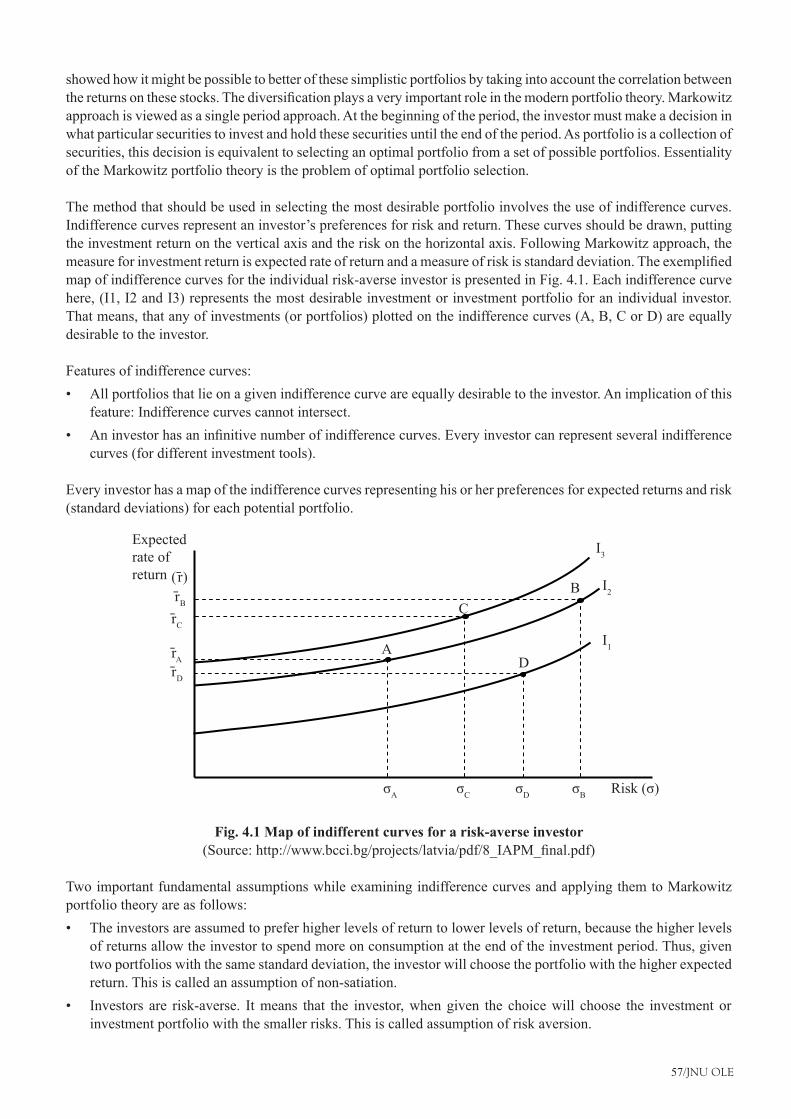
57/JNU OLE
showed how it might be possible to better of these simplistic portfolios by taking into account the correlation between the returns on these stocks. Thediversificationplaysaveryimportantroleinthemodernportfoliotheory.Markowitzapproach is viewed as a single period approach. At the beginning of the period, the investor must make a decision in what particular securities to invest and hold these securities until the end of the period. As portfolio is a collection of securities, this decision is equivalent to selecting an optimal portfolio from a set of possible portfolios. Essentiality of the Markowitz portfolio theory is the problem of optimal portfolio selection.
The method that should be used in selecting the most desirable portfolio involves the use of indifference curves. Indifference curves represent an investor’s preferences for risk and return. These curves should be drawn, putting the investment return on the vertical axis and the risk on the horizontal axis. Following Markowitz approach, the measureforinvestmentreturnisexpectedrateofreturnandameasureofriskisstandarddeviation.Theexemplifiedmap of indifference curves for the individual risk-averse investor is presented in Fig. 4.1. Each indifference curve here, (I1, I2 and I3) represents the most desirable investment or investment portfolio for an individual investor. That means, that any of investments (or portfolios) plotted on the indifference curves (A, B, C or D) are equally desirable to the investor.
Features of indifference curves:All portfolios that lie on a given indifference curve are equally desirable to the investor. An implication of this •feature: Indifference curves cannot intersect.Aninvestorhasaninfinitivenumberofindifferencecurves.Everyinvestorcanrepresentseveralindifference•curves (for different investment tools).
Every investor has a map of the indifference curves representing his or her preferences for expected returns and risk (standard deviations) for each potential portfolio.
Expectedrate ofreturn ( r̄)
r̄Br̄C
r̄Ar̄D
A
C
D
B
I3
I2
I1
σA σC σD σB Risk(σ)
Fig. 4.1 Map of indifferent curves for a risk-averse investor(Source:http://www.bcci.bg/projects/latvia/pdf/8_IAPM_final.pdf)
Two important fundamental assumptions while examining indifference curves and applying them to Markowitz portfolio theory are as follows:
The investors are assumed to prefer higher levels of return to lower levels of return, because the higher levels •of returns allow the investor to spend more on consumption at the end of the investment period. Thus, given two portfolios with the same standard deviation, the investor will choose the portfolio with the higher expected return. This is called an assumption of non-satiation.Investors are risk-averse. It means that the investor, when given the choice will choose the investment or •investment portfolio with the smaller risks. This is called assumption of risk aversion.
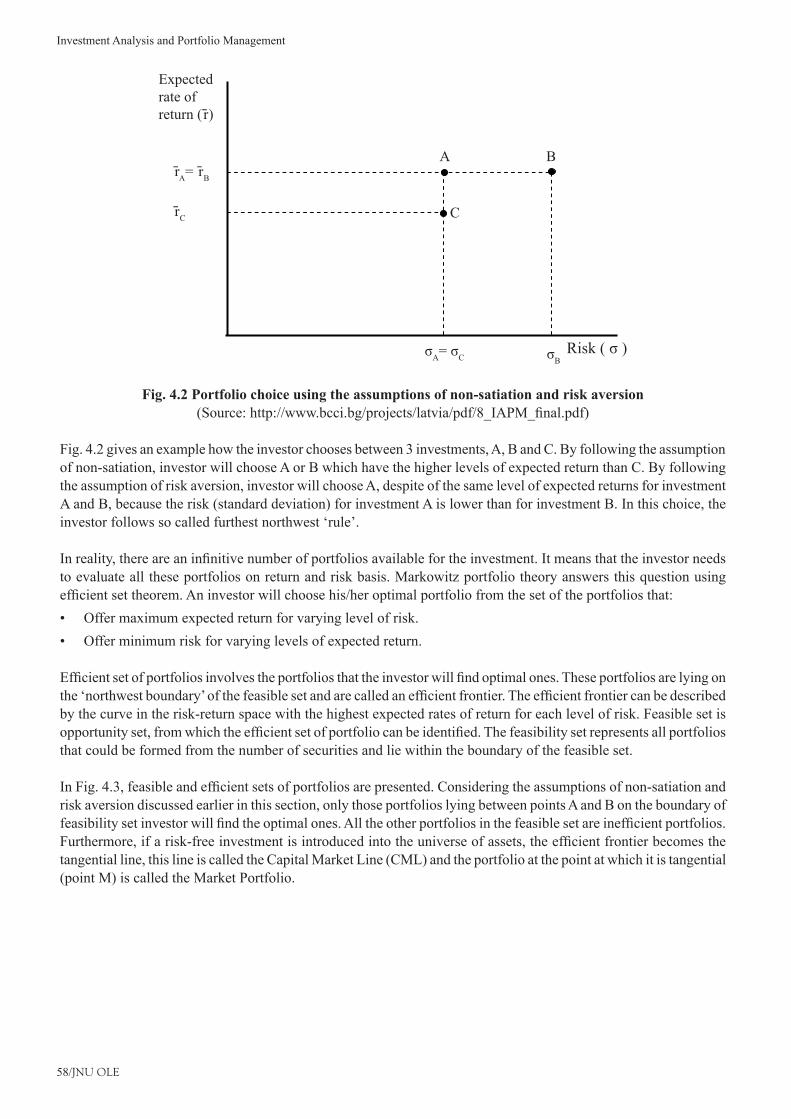
Investment Analysis and Portfolio Management
58/JNU OLE
Expectedrate ofreturn( r̄)
r̄A= r̄B
σA=σC σB
r̄C
A
C
B
Risk(σ)
Fig. 4.2 Portfolio choice using the assumptions of non-satiation and risk aversion(Source:http://www.bcci.bg/projects/latvia/pdf/8_IAPM_final.pdf)
Fig. 4.2 gives an example how the investor chooses between 3 investments, A, B and C. By following the assumption of non-satiation, investor will choose A or B which have the higher levels of expected return than C. By following the assumption of risk aversion, investor will choose A, despite of the same level of expected returns for investment A and B, because the risk (standard deviation) for investment A is lower than for investment B. In this choice, the investor follows so called furthest northwest ‘rule’.
Inreality,thereareaninfinitivenumberofportfoliosavailablefortheinvestment.Itmeansthattheinvestorneedsto evaluate all these portfolios on return and risk basis. Markowitz portfolio theory answers this question using efficientsettheorem.Aninvestorwillchoosehis/heroptimalportfoliofromthesetoftheportfoliosthat:
Offer maximum expected return for varying level of risk.•Offer minimum risk for varying levels of expected return.•
Efficientsetofportfoliosinvolvestheportfoliosthattheinvestorwillfindoptimalones.Theseportfoliosarelyingonthe‘northwestboundary’ofthefeasiblesetandarecalledanefficientfrontier.Theefficientfrontiercanbedescribedby the curve in the risk-return space with the highest expected rates of return for each level of risk. Feasible set is opportunityset,fromwhichtheefficientsetofportfoliocanbeidentified.Thefeasibilitysetrepresentsallportfoliosthat could be formed from the number of securities and lie within the boundary of the feasible set.
InFig.4.3,feasibleandefficientsetsofportfoliosarepresented.Consideringtheassumptionsofnon-satiationandrisk aversion discussed earlier in this section, only those portfolios lying between points A and B on the boundary of feasibilitysetinvestorwillfindtheoptimalones.Alltheotherportfoliosinthefeasiblesetareinefficientportfolios.Furthermore,ifarisk-freeinvestmentisintroducedintotheuniverseofassets,theefficientfrontierbecomesthetangential line, this line is called the Capital Market Line (CML) and the portfolio at the point at which it is tangential (point M) is called the Market Portfolio.
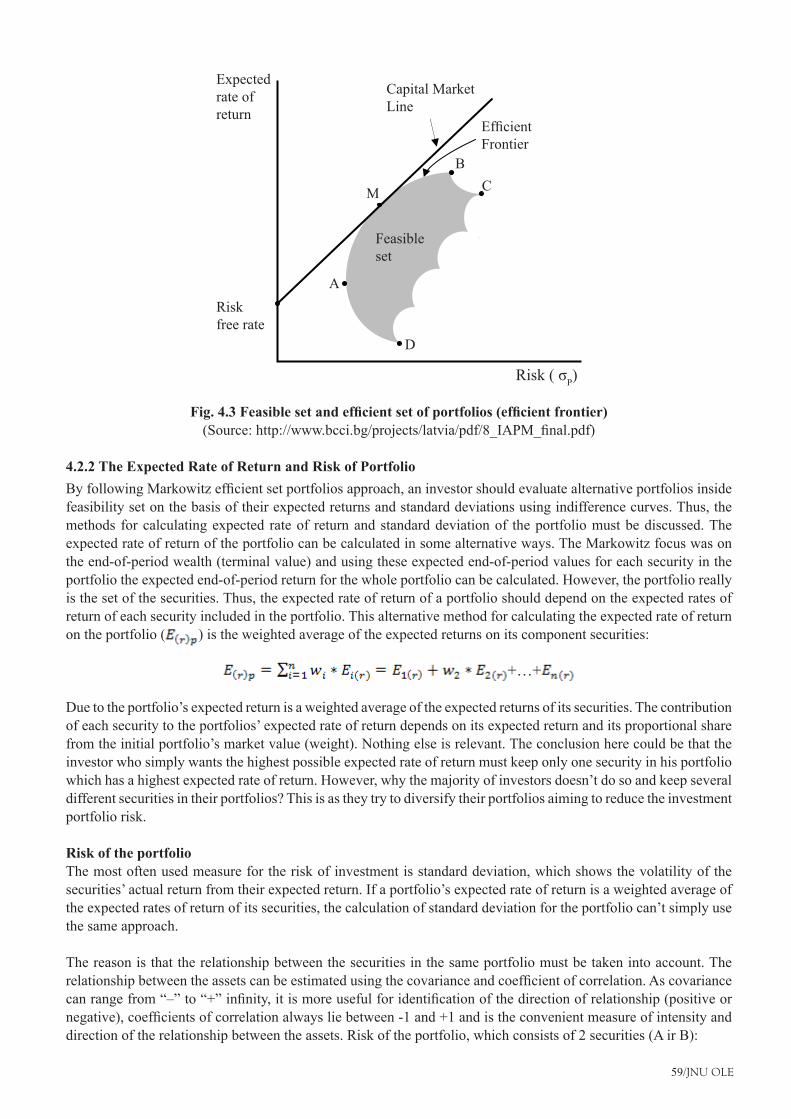
59/JNU OLE
Expectedrate ofreturn
Riskfree rate
Capital MarketLine
EfficientFrontier
Feasibleset
Risk(σP)
BC M
A
D
Fig. 4.3 Feasible set and efficient set of portfolios (efficient frontier)(Source:http://www.bcci.bg/projects/latvia/pdf/8_IAPM_final.pdf)
4.2.2 The Expected Rate of Return and Risk of PortfolioByfollowingMarkowitzefficientsetportfoliosapproach,aninvestorshouldevaluatealternativeportfoliosinsidefeasibility set on the basis of their expected returns and standard deviations using indifference curves. Thus, the methods for calculating expected rate of return and standard deviation of the portfolio must be discussed. The expected rate of return of the portfolio can be calculated in some alternative ways. The Markowitz focus was on the end-of-period wealth (terminal value) and using these expected end-of-period values for each security in the portfolio the expected end-of-period return for the whole portfolio can be calculated. However, the portfolio really is the set of the securities. Thus, the expected rate of return of a portfolio should depend on the expected rates of return of each security included in the portfolio. This alternative method for calculating the expected rate of return on the portfolio ( ) is the weighted average of the expected returns on its component securities:
+…+
Due to the portfolio’s expected return is a weighted average of the expected returns of its securities. The contribution of each security to the portfolios’ expected rate of return depends on its expected return and its proportional share from the initial portfolio’s market value (weight). Nothing else is relevant. The conclusion here could be that the investor who simply wants the highest possible expected rate of return must keep only one security in his portfolio which has a highest expected rate of return. However, why the majority of investors doesn’t do so and keep several different securities in their portfolios? This is as they try to diversify their portfolios aiming to reduce the investment portfolio risk.
Risk of the portfolioThe most often used measure for the risk of investment is standard deviation, which shows the volatility of the securities’ actual return from their expected return. If a portfolio’s expected rate of return is a weighted average of the expected rates of return of its securities, the calculation of standard deviation for the portfolio can’t simply use the same approach.
The reason is that the relationship between the securities in the same portfolio must be taken into account. The relationshipbetweentheassetscanbeestimatedusingthecovarianceandcoefficientofcorrelation.Ascovariancecanrangefrom“–”to“+”infinity,itismoreusefulforidentificationofthedirectionofrelationship(positiveornegative),coefficientsofcorrelationalwaysliebetween-1and+1andistheconvenientmeasureofintensityanddirection of the relationship between the assets. Risk of the portfolio, which consists of 2 securities (A ir B):
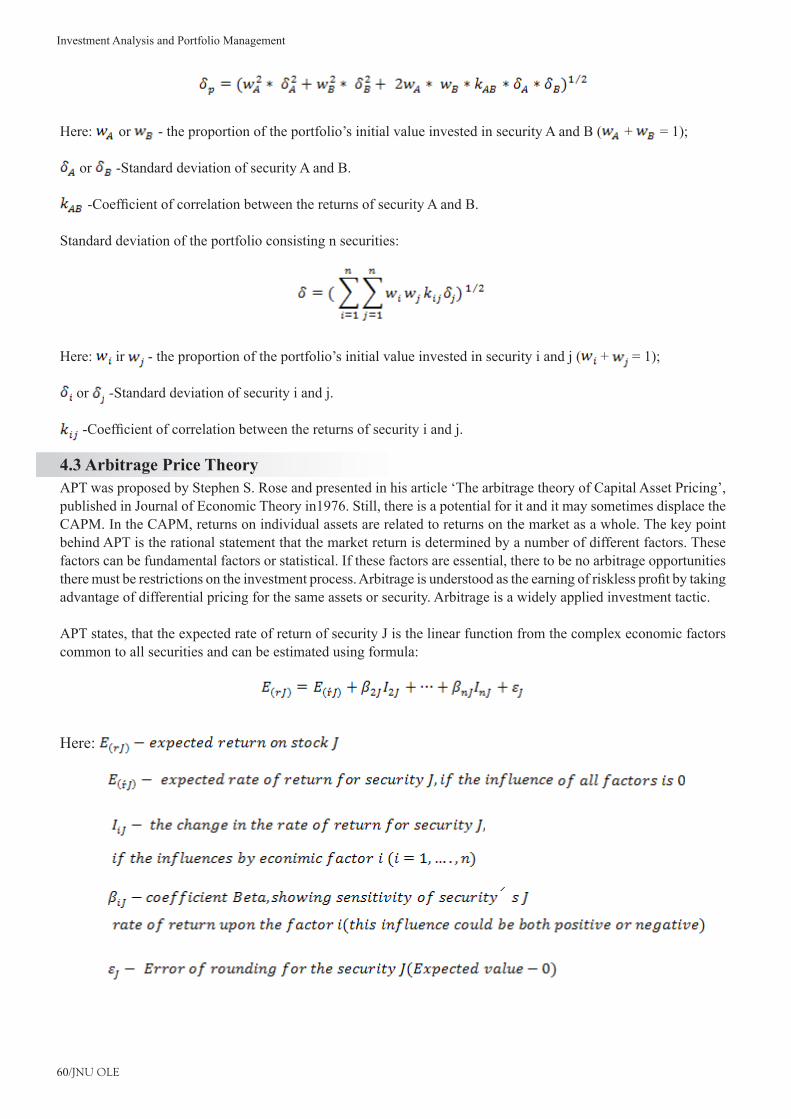
Investment Analysis and Portfolio Management
60/JNU OLE
Here: or - the proportion of the portfolio’s initial value invested in security A and B ( + = 1);
or -Standard deviation of security A and B.
-CoefficientofcorrelationbetweenthereturnsofsecurityAandB.
Standard deviation of the portfolio consisting n securities:
Here: ir - the proportion of the portfolio’s initial value invested in security i and j ( + = 1);
or -Standard deviation of security i and j.
-Coefficientofcorrelationbetweenthereturnsofsecurityiandj.
4.3 Arbitrage Price TheoryAPT was proposed by Stephen S. Rose and presented in his article ‘The arbitrage theory of Capital Asset Pricing’, published in Journal of Economic Theory in1976. Still, there is a potential for it and it may sometimes displace the CAPM. In the CAPM, returns on individual assets are related to returns on the market as a whole. The key point behind APT is the rational statement that the market return is determined by a number of different factors. These factors can be fundamental factors or statistical. If these factors are essential, there to be no arbitrage opportunities theremustberestrictionsontheinvestmentprocess.Arbitrageisunderstoodastheearningofrisklessprofitbytakingadvantage of differential pricing for the same assets or security. Arbitrage is a widely applied investment tactic.
APT states, that the expected rate of return of security J is the linear function from the complex economic factors common to all securities and can be estimated using formula:
Here:
61/JNU OLE
ItisimportanttonotethatthearbitrageintheAPTisonlyapproximate,relatingdiversifiedportfolios,onassumptionthattheassetunsystematic(specific)risksarenegligiblecomparedwiththefactorrisks.Therecouldpresumablybeaninfinitivenumberoffactors,althoughtheempiricalresearchdonebyS.RosstogetherwithR.Roll(1984)identifiedthefollowingfourfactors,economicvariables,towhichassetshavingeventhesameCAPMBeta,aredifferently sensitive:
Inflation•Industrial production•Risk premiums•Slope of the term structure in interest rates•
In practice, an investor can choose the macroeconomic factors which seem important and related with the expected returns of the particular asset. The examples of possible macroeconomic factors which could be included in using APT model:
GDP growth•An interest rate•An exchange rate•A default spread on corporate bonds, etc.•
Including more factors in APT model seems logical. The institutional investors and analysts closely watch macroeconomic statistics, such as themoney supply, inflation, interest rates, unemployment, changes inGDP,political events and many others. Reason for this might be their belief that new information about the changes in thesemacroeconomicindicatorswillinfluencefutureassetpricemovements.However,itisimportanttopointoutthat not all investors or analysts are concerned with the same set of economic information and they differently assess the importance of various macroeconomic factors to the assets they have invested already or are going to invest.
At the same time, the large number of the factors in the APT model would be impractical, because the models seldom are 100 percent accurate and the asset prices are function of both macroeconomic factors and noise. The noise is comingfromminorfactors,withalittleinfluencetotheresult,expectedrateofreturn.
TheAPTdoesnotrequireidentificationofthemarketportfolio,butitdoesrequirethespecificationoftherelevantmacroeconomicfactors.MuchofthecurrentempiricalAPTresearchisfocusedonidentificationofthesefactorsand the determination of the factors’ Betas. This problem is still unsolved. Although more than two decades have passed, since S. Ross introduced APT model, it has yet to reach the practical application stage. The CAPM and APT are not really essentially different, because they are developed for determining an expected rate of return based on one factor (market portfolio-CAPM) or a number of macroeconomic factors (APT). However, both models predict how the return on asset will result from factor sensitivities and this is of great importance to the investor.
4.4 Market Efficiency TheoryTheconceptofmarketefficiencywasproposedbyEugeneFamain1965,whenhisarticle‘RandomWalksinStockPrices’waspublishedinFinancialAnalystJournal.Marketefficiencymeansthatthepricewhichinvestorispayingforfinancialasset(stock,bond,othersecurity)fullyreflectsfairortrueinformationabouttheintrinsicvalueofthisspecificassetorfairlydescribesthevalueofthecompany,theissuerofthissecurity.Thekeytermintheconceptofthemarketefficiencyistheinformationavailableforinvestorstradinginthemarket.Itisstatedthatthemarketpriceofstockreflects:
All known information, including:•Past information, e.g., last year’s or last quarter’s, month’s earnings �Current information as well as events, that have been announced, but are still forthcoming, e.g., shareholders’ �meeting.
Information that can reasonably be inferred, for example, if many investors believe that ECB will increase •interestrateinthenearestfutureorthegovernmentdeficitincreases,priceswillreflectthisbeliefbeforetheactual event occurs.
Investment Analysis and Portfolio Management
62/JNU OLE
Capitalmarketisefficient,ifthepricesofsecuritieswhicharetradedinthemarketreacttothechangesofsituationimmediately,fullyandcrediblyreflectalltheimportantinformationaboutthesecurity’sfutureincomeandrisk-related with generating this income.
What is the important information for the investor? From economic point of view, the important information is definedassuchinformationwhichhasdirectinfluencetotheinvestor’sdecisionsseekingforhisdefinedfinancialgoals.Example,theessentialeventsinthejointstockcompany,publishedinthenewspaper,etc.Marketefficiencyrequires that the adjustment to new information occurs very quickly as the information becomes known. Internet hasmadethemarketsmoreefficientinthesenseofhowwidelyandquicklyinformationisdisseminated.
Thereare3formsofmarketefficiencyunderefficientmarkethypothesis:Weakformofefficiency•Semi-strongformofefficiency•Strongformoftheefficiency•
Weak form of efficiencyUndertheweakformofefficiencystockpricesareassumedtoreflectanyinformationthatmaybecontainedinthepasthistoryofthestockprices.So,ifthemarketischaracterisedbyweakformofefficiency,nooneinvestororanygroupofinvestorsshouldbeabletoearnoverthedefinedperiodoftime,abnormalratesofreturnbyusinginformation about historical prices available for them and by using technical analysis. Prices will respond to news, but if this news is random then price changes will also be random.
Semi-strong form of efficiencyUnderthesemi-strongformofefficiency,allpubliclyavailableinformationispresumedtobereflectedinstocks’prices.Thisinformationincludesinformationinthestockpriceseriesaswellasinformationinthefirm’sfinancialreports,thereportsofcompetingfirms,announcedinformationrelatingtothestateoftheeconomyandanyotherpubliclyavailableinformation,relevanttothevaluationofthefirm.Notethatthemarketwithasemi-strongformofefficiencyencompassestheweakformofthehypothesis,becausethehistoricalmarketdataisapartofthelargersetofallpubliclyavailableinformation.Ifthemarketischaracterisedbysemi-strongformofefficiency,nooneinvestororanygroupofinvestorsshouldbeabletoearnoverthedefinedperiodoftime,abnormalratesofreturnbyusing informationabouthistoricalpricesandpubliclyavailable fundamental information(suchas,financialstatements) and fundamental analysis.
Strong form of the efficiencyThestrongformofefficiencywhichassertsthatstockpricesfullyreflectallinformation,includingprivateorinsideinformation,aswellas thatwhich ispubliclyavailable.This formtakes thenotionofmarketefficiency to theultimateextreme.Underthisformofmarket,efficiencysecurities’pricesquicklyadjusttoreflectboththeinsideandpublicinformation.Ifthemarketischaracterisedbystrongformofefficiency,nooneinvestororanygroupofinvestorsshouldbeabletoearnoverthedefinedperiodoftimeabnormalratesofreturnbyusingallinformationavailable for them.
Thevalidityofthemarketefficiencyhypothesis,whicheverformisofgreatimportancetotheinvestorsbecauseit determines whether anyone can outperform the market, or whether the successful investing is all about luck. Efficientmarkethypothesisdoesnotrequirebehavingrationally,onlythatinresponsetoinformation,therewillbeasufficientlylargerandomreactionthatanexcessprofitcannotbemade.
Theconceptofthemarketefficiencynowiscriticisedbysomemarketanalystsandparticipantsbystatingthatnoonemarketcanbefullyefficientassomeirrationalbehaviourofinvestorsinthemarketoccurswhichismorebasedon their emotions and other psychological factors than on the information available. However, at the same time, it canbeshownthattheefficientmarketcanexist,ifintherealmarketsfollowingeventsoccur:
Alargenumberof rational,profit-maximising investorsexist,whoareactivelyandcontinuouslyanalysing•valuing and trading securities.Information is widely available to market participants at the same time and without or at very small cost.•Information is generated in a random walk manner and can be treated as independent.•Investors react to the new information quickly and fully, though causing market prices to adjust accordingly.•
63/JNU OLE
SummaryIn India, Portfolio Management is still in its infancy.•After the success of Mutual Funds in Portfolio Management, a number of brokers and Investment Consultants •someofwhomarealsoprofessionallyqualifiedhavebecomePortfolioManagers.“The life of every man is diary in which he means to write one story, and writes another; and his humblest hour •iswhenhecomparesthevolumeasitiswithwhathevowedtomakeit.”ThisisthedefinitionofPortfolioManagement by, J. M. Barrie.Security Analysis involves estimating the merits and demerits of individual investments.•The portfolio management primarily involves reducing risk rather than increasing return.•When stability of principal is the objective, the appropriative investment vehicles include any of the money •marketinstrumentsandbankcertificates.Theincomeobjectivesdifferfromstabilityofprincipalinthatthereisnospecificprescriptionagainstdeclines•in principal values.Thetimevalueofmoneyisoneofthetwokeyconceptsinfinance.•The author of the modern portfolio theory is Harry Markowitz who introduced the analysis of the portfolios of •investments in his article ‘Portfolio Selection’ published in the Journal of Finance in 1952.The most often used measure for the risk of investment is standard deviation, which shows the volatility of the •securities actual return from their expected return.APT was proposed by Stephen S. Rose and presented in his article ‘The arbitrage theory of Capital Asset Pricing’, •published in Journal of Economic Theory in 1976.TheconceptofmarketefficiencywasproposedbyEugeneFamain1965,whenhisarticle‘RandomWalksin•Stock Prices’ was published in Financial Analyst Journal.Undertheweakformofefficiency,stockpricesareassumedtoreflectanyinformationthatmaybecontained•in the past history of the stock prices.Under the semi-strong formofefficiency, allpubliclyavailable information ispresumed tobe reflected in•stocks’ prices.Thestrongformofefficiencywhichassertsthatstockpricesfullyreflectallinformation,includingprivateor•inside information, as well as that which is publicly available.
ReferencesPortfolio Management and the Capital Asset Pricing Model. • [Pdf]Available at: <file:///C:/Users/poojar/Downloads/9780387213750-c1.pdf> [Accessed 07 July 2014].Portfolio Management. • [Pdf] Available at: <http://www.psnacet.edu.in/courses/MBA/sapm/lecture-27.pdf> [Accessed 07 July 2014].Reilly, F. and Brown, K., 2011. • Investment Analysis and Portfolio Management. 1 0 t h e d . , Cengage Learning.Swensen, D. F., 2009. • Pioneering Portfolio Management. Simon and Schuster.CFA Level I Portfolio Management An Overview Video Lecture by Mr. Arif Irfanullah Part 1. • [Video online] Available at: <https://www.youtube.com/watch?v=Bj11a3jHtCY> [Accessed 07 July 2014].CFA Level I Portfolio Management An Overview Video Lecture by Mr. Arif Irfanullah Part 2. • [Video online] Available at: <https://www.youtube.com/watch?v=Zxvxuct4w60> [Accessed 07 July 2014].
Recommended ReadingRad, P. F. and Levin, G., 2006. • Project Portfolio Management Tools and Techniquest. www.iil.com/publishing.Cooper, R. G., Edgett, S. J. and Kleinschmidt, E. J., 2001. • Portfolio Management for New Products. Basic Books. Levine, H . A ., 2010. • Project Portfolio Management. John Wiley & Sons.
Investment Analysis and Portfolio Management
64/JNU OLE
Self AssessmentThe traditional investments course covers ________ principal topics.1.
threea. twob. fivec. sixd.
Which of the following concerns the construction and maintenance of a collection of investments?2. Security analysisa. Selection managementb. Portfolio managementc. Stability of principald.
Match the following3.
1. Security analysis A. It primarily involves reducing risk rather than increasing return.
2. Portfolio management B.Underthisformofefficiency,allpubliclyavailableinformationispresumedtobereflectedinstocks’prices.
3.Weakformofefficiency C. It involves estimating the merits and demerits of individual investments.
4.Semi-strongformofefficiency D.Underthis,stockpricesareassumedtoreflectanyinformationthat may be contained in the past history of the stock prices.
1-D, 2-C, 3-B, 4-Aa. 1-B, 2-D, 3-A, 4-Cb. 1-C, 2-A, 3-D, 4-Bc. 1-A, 2-B, 3-C, 4-Dd.
The aim of portfolio management is to achieve the _________ return from a portfolio which has been delegated 4. tobemanagedbyaninvestmentmanagerorfinancialinstitution.
maximuma. minimumb. lowestc. onlyd.
What are not taxed until they are actually realised?5. Growth incomea. Incomeb. Assetsc. Capital gainsd.
Which of the following statement is true?6. None of the portfolios that lie on a given indifference curve are equally desirable to the investor.a. All portfolios that lie on a given indifference curve are equally desirable to the investor.b. Four portfolios that lie on a given indifference curve are equally desirable to the investor.c. All portfolios that lie on a given indifference curve are unequally desirable to the investor.d.
65/JNU OLE
___________ curves represent an investor’s preferences for risk and return.7. Financiala. Indifferenceb. Marketc. Portfoliod.
Who is the author of the modern portfolio theory?8. Harry Markowitza. Stephen S. Roseb. R. Rollc. Eugene Famad.
Whoproposedtheconceptofmarketefficiency?9. Harry Markowitza. Stephen S. Roseb. R. Rollc. Eugene Famad.
Which of the following statement is false?10. Aninvestorhasaninfinitivenumberofindifferencecurves.a. Investors are risk averse.b. Thereare6formsofmarketefficiencyunderefficientmarkethypothesis.c. Arbitrage is widely applied investment tactic.d.
Investment Analysis and Portfolio Management
66/JNU OLE
Chapter V
Capital Asset Pricing Model
Aim
The aim of this chapter is to:
introduce capital asset pricing model•
explain CAPM equilibrium•
explicate uses and limitations of CAPM•
Objectives
The objectives of this chapter are to:
enlist the CAPM assumptions•
elucidate capital market line •
explain security market line•
Learning outcome
At the end of this chapter, you will be able to:
identify pricing and discounting•
understand the CAPM and the single-index•
recognise APT and CAPM•
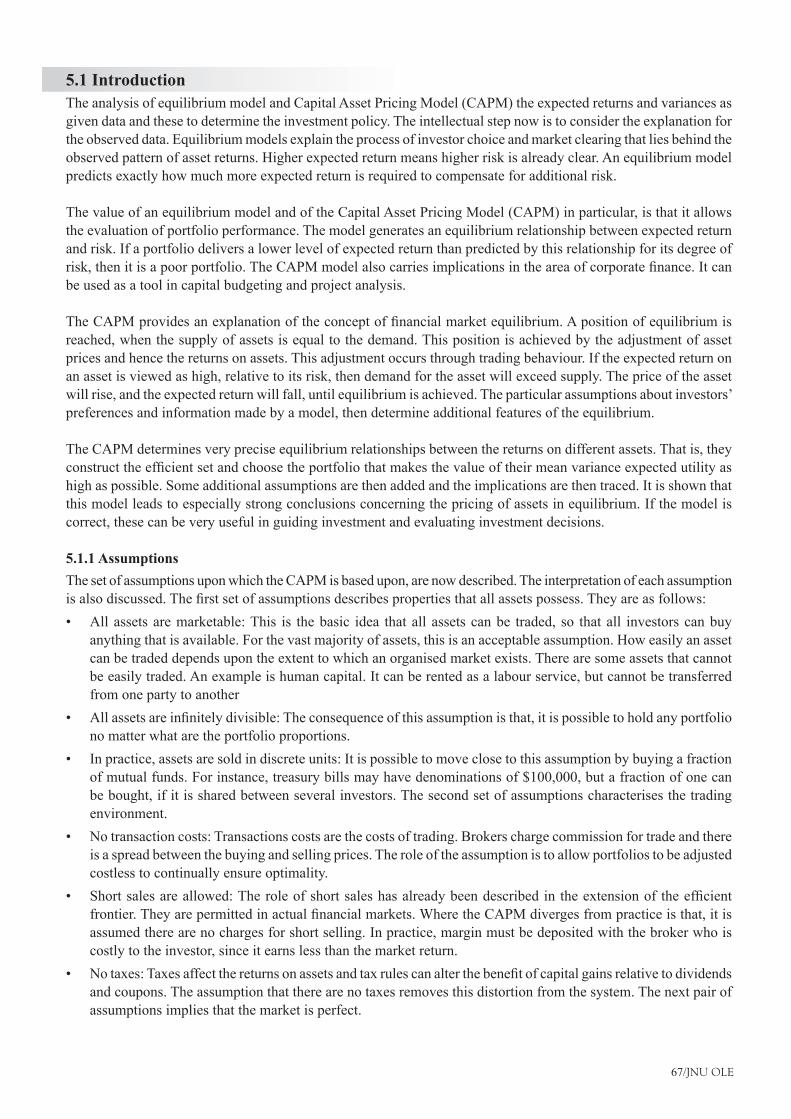
67/JNU OLE
5.1 IntroductionThe analysis of equilibrium model and Capital Asset Pricing Model (CAPM) the expected returns and variances as given data and these to determine the investment policy. The intellectual step now is to consider the explanation for the observed data. Equilibrium models explain the process of investor choice and market clearing that lies behind the observed pattern of asset returns. Higher expected return means higher risk is already clear. An equilibrium model predicts exactly how much more expected return is required to compensate for additional risk.
The value of an equilibrium model and of the Capital Asset Pricing Model (CAPM) in particular, is that it allows the evaluation of portfolio performance. The model generates an equilibrium relationship between expected return and risk. If a portfolio delivers a lower level of expected return than predicted by this relationship for its degree of risk,thenitisapoorportfolio.TheCAPMmodelalsocarriesimplicationsintheareaofcorporatefinance.Itcanbe used as a tool in capital budgeting and project analysis.
TheCAPMprovidesanexplanationoftheconceptoffinancialmarketequilibrium.Apositionofequilibriumisreached, when the supply of assets is equal to the demand. This position is achieved by the adjustment of asset prices and hence the returns on assets. This adjustment occurs through trading behaviour. If the expected return on an asset is viewed as high, relative to its risk, then demand for the asset will exceed supply. The price of the asset will rise, and the expected return will fall, until equilibrium is achieved. The particular assumptions about investors’ preferences and information made by a model, then determine additional features of the equilibrium.
The CAPM determines very precise equilibrium relationships between the returns on different assets. That is, they constructtheefficientsetandchoosetheportfoliothatmakesthevalueoftheirmeanvarianceexpectedutilityashigh as possible. Some additional assumptions are then added and the implications are then traced. It is shown that this model leads to especially strong conclusions concerning the pricing of assets in equilibrium. If the model is correct, these can be very useful in guiding investment and evaluating investment decisions.
5.1.1 AssumptionsThe set of assumptions upon which the CAPM is based upon, are now described. The interpretation of each assumption isalsodiscussed.Thefirstsetofassumptionsdescribespropertiesthatallassetspossess.Theyareasfollows:
All assets are marketable: This is the basic idea that all assets can be traded, so that all investors can buy •anything that is available. For the vast majority of assets, this is an acceptable assumption. How easily an asset can be traded depends upon the extent to which an organised market exists. There are some assets that cannot be easily traded. An example is human capital. It can be rented as a labour service, but cannot be transferred from one party to another Allassetsareinfinitelydivisible:Theconsequenceofthisassumptionisthat,itispossibletoholdanyportfolio•no matter what are the portfolio proportions.In practice, assets are sold in discrete units: It is possible to move close to this assumption by buying a fraction •of mutual funds. For instance, treasury bills may have denominations of $100,000, but a fraction of one can be bought, if it is shared between several investors. The second set of assumptions characterises the trading environment.No transaction costs: Transactions costs are the costs of trading. Brokers charge commission for trade and there •is a spread between the buying and selling prices. The role of the assumption is to allow portfolios to be adjusted costless to continually ensure optimality.Shortsalesareallowed:Theroleofshortsaleshasalreadybeendescribedintheextensionoftheefficient•frontier.Theyarepermittedinactualfinancialmarkets.WheretheCAPMdivergesfrompracticeisthat,itisassumed there are no charges for short selling. In practice, margin must be deposited with the broker who is costly to the investor, since it earns less than the market return. Notaxes:Taxesaffectthereturnsonassetsandtaxrulescanalterthebenefitofcapitalgainsrelativetodividends•and coupons. The assumption that there are no taxes removes this distortion from the system. The next pair of assumptions implies that the market is perfect.
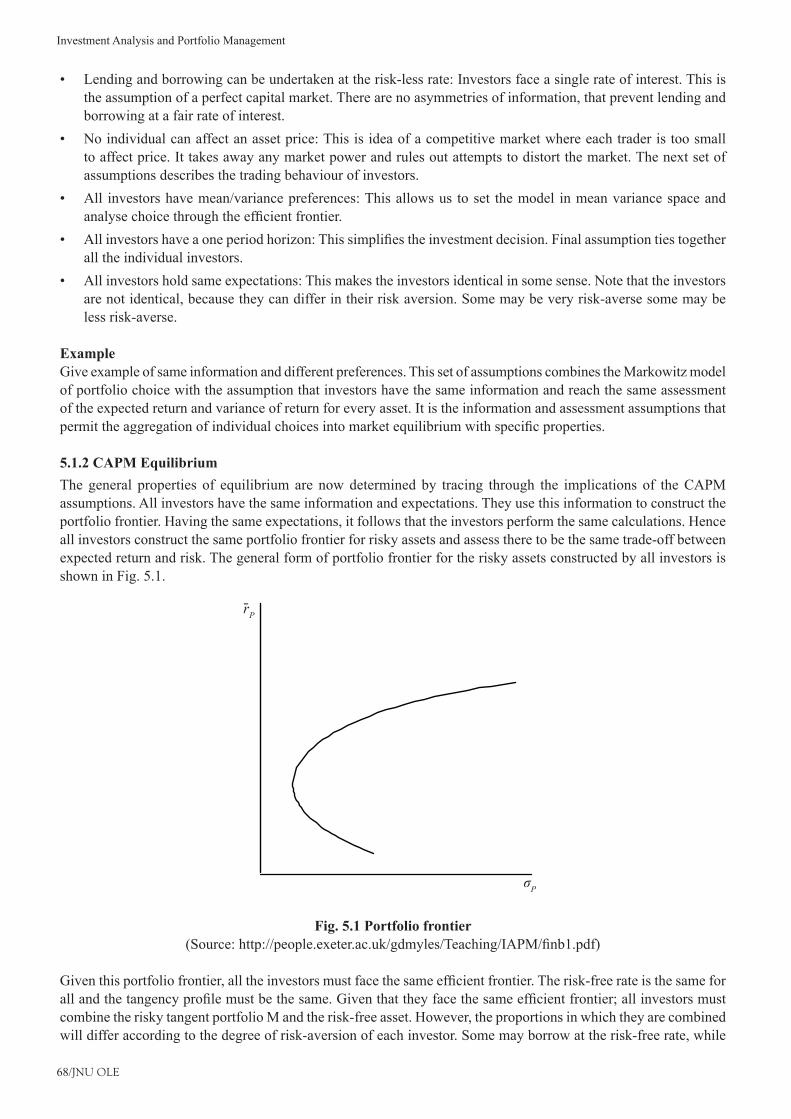
Investment Analysis and Portfolio Management
68/JNU OLE
Lending and borrowing can be undertaken at the risk-less rate: Investors face a single rate of interest. This is •the assumption of a perfect capital market. There are no asymmetries of information, that prevent lending and borrowing at a fair rate of interest.No individual can affect an asset price: This is idea of a competitive market where each trader is too small •to affect price. It takes away any market power and rules out attempts to distort the market. The next set of assumptions describes the trading behaviour of investors.All investors have mean/variance preferences: This allows us to set the model in mean variance space and •analysechoicethroughtheefficientfrontier.Allinvestorshaveaoneperiodhorizon:Thissimplifiestheinvestmentdecision.Finalassumptiontiestogether•all the individual investors.All investors hold same expectations: This makes the investors identical in some sense. Note that the investors •are not identical, because they can differ in their risk aversion. Some may be very risk-averse some may be less risk-averse.
ExampleGive example of same information and different preferences. This set of assumptions combines the Markowitz model of portfolio choice with the assumption that investors have the same information and reach the same assessment of the expected return and variance of return for every asset. It is the information and assessment assumptions that permittheaggregationofindividualchoicesintomarketequilibriumwithspecificproperties.
5.1.2 CAPM EquilibriumThe general properties of equilibrium are now determined by tracing through the implications of the CAPM assumptions. All investors have the same information and expectations. They use this information to construct the portfolio frontier. Having the same expectations, it follows that the investors perform the same calculations. Hence all investors construct the same portfolio frontier for risky assets and assess there to be the same trade-off between expected return and risk. The general form of portfolio frontier for the risky assets constructed by all investors is shown in Fig. 5.1.
r̄P
σP
Fig. 5.1 Portfolio frontier(Source:http://people.exeter.ac.uk/gdmyles/Teaching/IAPM/finb1.pdf)
Giventhisportfoliofrontier,alltheinvestorsmustfacethesameefficientfrontier.Therisk-freerateisthesameforallandthetangencyprofilemustbethesame.Giventhattheyfacethesameefficientfrontier;allinvestorsmustcombine the risky tangent portfolio M and the risk-free asset. However, the proportions in which they are combined will differ according to the degree of risk-aversion of each investor. Some may borrow at the risk-free rate, while
69/JNU OLE
others may lend. As all consumers are purchasing portfolio M, this must be the market portfolio of risky assets. By market portfolio, it is meant a portfolio with the risky assets in the same proportions as they are found in the market as a whole. This is the separation principle that states that, an investor only needs to purchase two assets. All investors combine the risk free assets and the market portfolio.
What differs between investors is the proportion of these in the portfolio. The more risk-averse is an investor; the higher will be the proportion of the risk-free asset in the portfolio. Less risk-adverse investors will hold a larger proportion of the market portfolio. Those with a low enough level of risk aversion will go short in the risk-free asset toinvestinthemarketportfolio.Themarketportfolioisassumedtobewell-diversified.Theconsequenceofthisisthatnon-systematicriskisdiversifiedawaybyallinvestors,sincetheyholdthemarketportfolio.Finally,ifallinvestors are purchasing the same risky portfolio, there can be no short selling in equilibrium. If any investor were short-selling a risky asset, all would be short-selling. This cannot be equilibrium, since the aggregate demand for the asset would be negative.
r̄P
r̄MVP
rf
σPσMVP
M
Fig. 5.2 Efficient frontier and market portfolio(Source:http://people.exeter.ac.uk/gdmyles/Teaching/IAPM/finb1.pdf)
5.1.3 Uses and LimitationsThe uses and limitations of CAPM are discussed in the paragraphs given below.
Advantages of the CAPMThe CAPM has several advantages over other methods of calculating required return, explaining why it has remained popular for more than 40 years:
Itconsidersonlysystematicrisk,reflectingarealityinwhichmostinvestorshavediversifiedportfoliosfrom•which unsystematic risk has been essentially eliminated.It generates a theoretically-derived relationship between required return and systematic risk which has been •subject to frequent empirical research and testing.It is generally seen as a much better method of calculating the cost of equity than the Dividend Growth Model •(DGM) in that, it explicitly takes into account a company’s level of systematic risk relative to the stock market as a whole.It is clearly superior to the WACC in providing discount rates for use in investment appraisal.•
Disadvantages of the CAPMThe CAPM suffers from a number of disadvantages and limitations that should be noted in a balanced discussion of this important theoretical model. In order to use the CAPM, values need to be assigned to the risk-free rate of return, the return on the market, or the Equity Risk Premium (ERP) and the equity beta. The yield on short-term Government debt,whichisusedasasubstitutefortherisk-freerateofreturn,isnotfixed,butchangesonadaily-basisaccordingto economic circumstances. A short-term average value can be used in order to smooth out this volatility.
Investment Analysis and Portfolio Management
70/JNU OLE
FindingavaluefortheERPismoredifficult.Thereturnonastockmarketisthesumoftheaveragecapitalgainandthe average dividend yield. In the short-term, a stock market can provide a negative rather than a positive return, if the effect of falling share prices outweighs the dividend yield. It is therefore usual to use a long-term average value for the ERP, taken from empirical research, but it has been found that the ERP is not stable over time. In the UK, an ERP value of between 2% and 5% is currently seen as reasonable. However, uncertainty about the exact ERP value introduces uncertainty into the calculated value for the required return.
Beta values are now calculated and published regularly for all stock exchange-listed companies. The problem here is that uncertainty arises in the value of the expected return, because the value of beta is not constant, but changes over-time, using the CAPM in investment appraisal. Problems can arise when using the CAPM to calculate a project-specificdiscount rate.Forexample,onecommondifficulty isfindingsuitableproxybetas, sinceproxycompanies very rarely undertake only one business activity. The proxy beta for a proposed investment project must be disentangled from the company’s equity beta. One way to do this is to treat the equity beta as an average of the betas of several different areas of proxy company activity, weighted by the relative share of the proxy company market value arising from each activity. However, information about relative shares of proxy company market value maybequitedifficulttoobtain.
Asimilardifficultyisthattheun-gearingofproxycompanybetasusescapitalstructureinformationthatmaynotbe readilyavailable.Somecompanieshavecomplexcapital structureswithmanydifferent sourcesoffinance.Othercompaniesmayhavedebtsthatarenottradedorusecomplexsourcesoffinance,suchasconvertiblebonds.The simplifying assumption that the beta of debt is zero will also lead to inaccuracy in the calculated value of the project-specificdiscountrate.OnedisadvantageinusingtheCAPMininvestmentappraisalisthattheassumptionofa single-period time horizon is at odds with the multi-period nature of investment appraisal. While CAPM variables can be assumed constant in successive future periods, experience indicates that this is not true in reality.
5.2 Capital Market Line (CML)ThecapitalmarketlineisthenameassignedtotheefficientfrontierintheCAPM.Allefficientportfoliosmustlie on this line which implies that there is a linear relationship between risk and return for all portfolios chosen in equilibrium. Any portfolio above the line will be demanded by all investors. Its price will rise, and so return falls, until in equilibrium it lies on the line. The opposite applies to any portfolio below the line. Its price will fall and return will rise, until it lies on the line.
As the points ( ) and ( ) are both on the capital market line, its gradient can be calculated to be . From this, it follows that any portfolio, p, located on the Capital Market Line must satisfy the equation:
5.1
The interpretation of (5.1) is that is the reward for ‘time’. This is the return earned, when no risk is involved (= 0), but consumption is postponed. Holding the risk-free asset delays consumption for one period and an investor requires compensating for this. The compensation received is the risk-free rate of return. The gradient of the line
is the reward for ‘risk’ or the market price of risk. To hold risk, an investor requires compensation beyond that given by the risk-free rate. Each unit of standard deviation is rewarded by extra units of return. The term
is the Sharpe ratio, which is used later in portfolio evaluation.
Example: Assume , and . Then construct capital market line. Then, take an asset iandfindtheimplied.
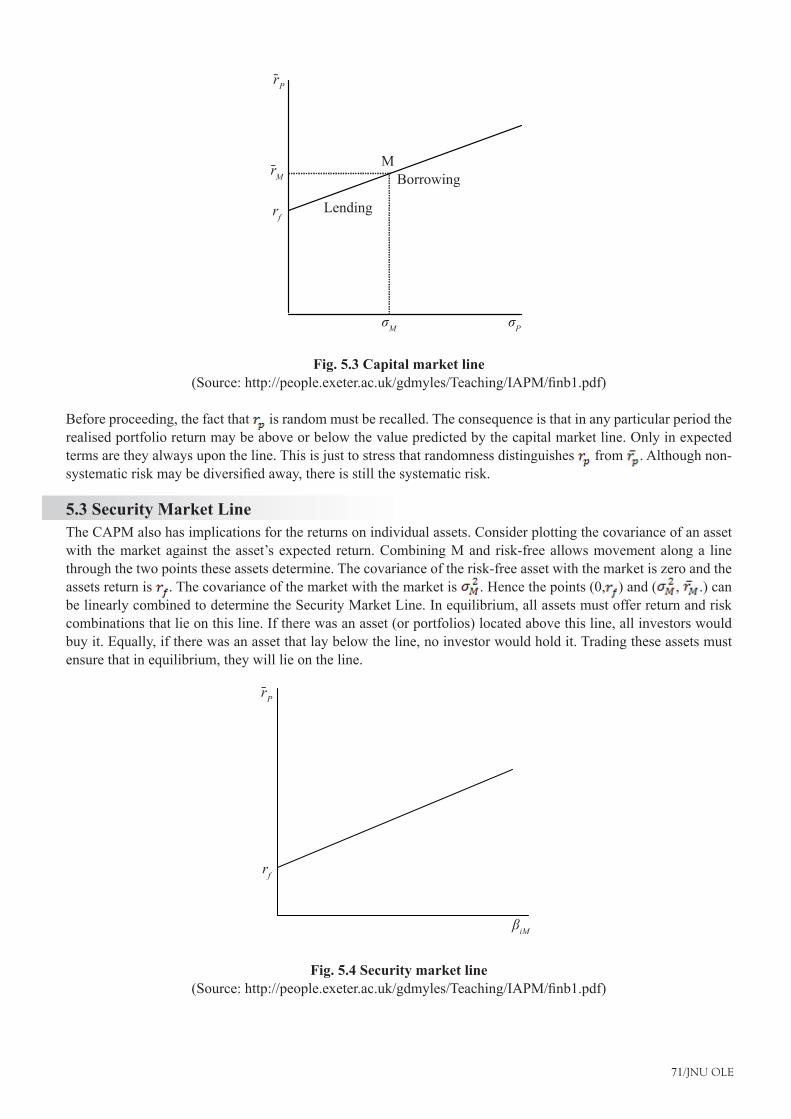
71/JNU OLE
r̄P
r̄M
rf
M
Lending
Borrowing
σPσM
Fig. 5.3 Capital market line(Source:http://people.exeter.ac.uk/gdmyles/Teaching/IAPM/finb1.pdf)
Before proceeding, the fact that is random must be recalled. The consequence is that in any particular period the realised portfolio return may be above or below the value predicted by the capital market line. Only in expected terms are they always upon the line. This is just to stress that randomness distinguishes from . Although non-systematicriskmaybediversifiedaway,thereisstillthesystematicrisk.
5.3 Security Market LineThe CAPM also has implications for the returns on individual assets. Consider plotting the covariance of an asset with the market against the asset’s expected return. Combining M and risk-free allows movement along a line through the two points these assets determine. The covariance of the risk-free asset with the market is zero and the assets return is . The covariance of the market with the market is . Hence the points (0, ) and ( , .) can be linearly combined to determine the Security Market Line. In equilibrium, all assets must offer return and risk combinations that lie on this line. If there was an asset (or portfolios) located above this line, all investors would buy it. Equally, if there was an asset that lay below the line, no investor would hold it. Trading these assets must ensure that in equilibrium, they will lie on the line.
r̄P
βiM
rf
Fig. 5.4 Security market line(Source:http://people.exeter.ac.uk/gdmyles/Teaching/IAPM/finb1.pdf)
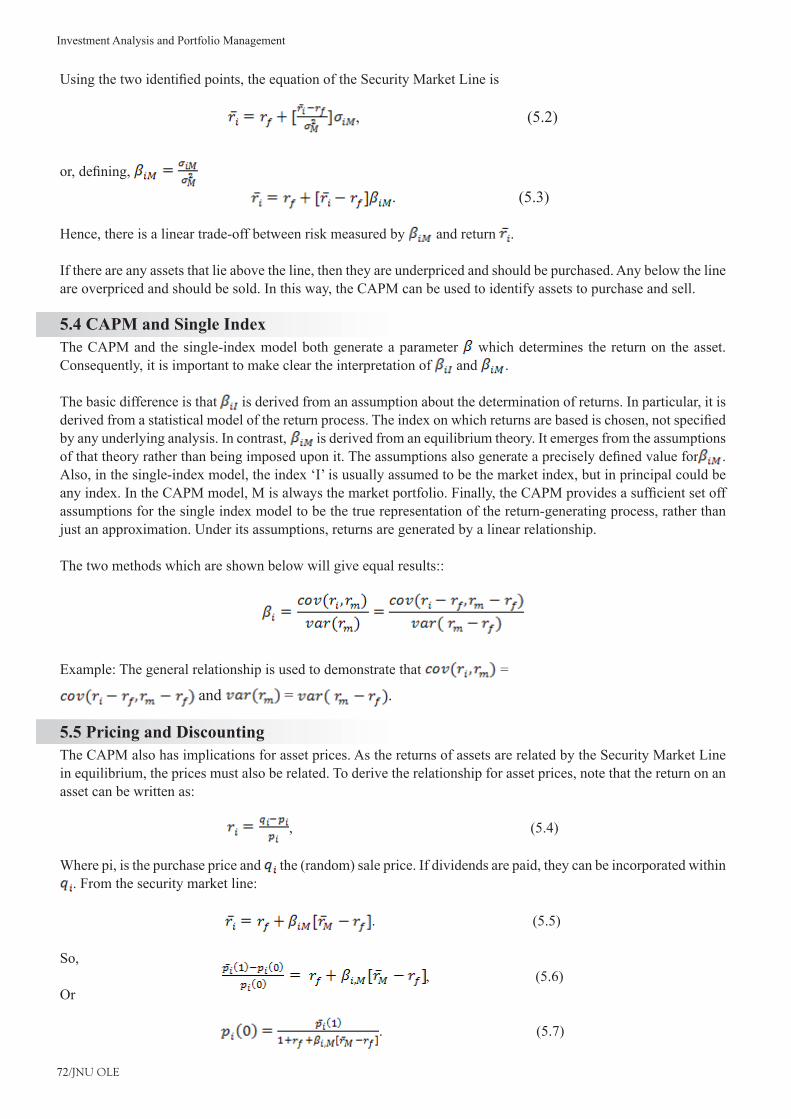
Investment Analysis and Portfolio Management
72/JNU OLE
Usingthetwoidentifiedpoints,theequationoftheSecurityMarketLineis
, (5.2)
or,defining,
. (5.3)
Hence, there is a linear trade-off between risk measured by and return .
If there are any assets that lie above the line, then they are underpriced and should be purchased. Any below the line are overpriced and should be sold. In this way, the CAPM can be used to identify assets to purchase and sell.
5.4 CAPM and Single IndexThe CAPM and the single-index model both generate a parameter which determines the return on the asset. Consequently, it is important to make clear the interpretation of and .
The basic difference is that is derived from an assumption about the determination of returns. In particular, it is derivedfromastatisticalmodelofthereturnprocess.Theindexonwhichreturnsarebasedischosen,notspecifiedby any underlying analysis. In contrast, is derived from an equilibrium theory. It emerges from the assumptions ofthattheoryratherthanbeingimposeduponit.Theassumptionsalsogenerateapreciselydefinedvaluefor . Also, in the single-index model, the index ‘I’ is usually assumed to be the market index, but in principal could be anyindex.IntheCAPMmodel,Misalwaysthemarketportfolio.Finally,theCAPMprovidesasufficientsetoffassumptions for the single index model to be the true representation of the return-generating process, rather than just an approximation. Under its assumptions, returns are generated by a linear relationship.
The two methods which are shown below will give equal results::
Example: The general relationship is used to demonstrate that =
and = .
5.5 Pricing and DiscountingThe CAPM also has implications for asset prices. As the returns of assets are related by the Security Market Line in equilibrium, the prices must also be related. To derive the relationship for asset prices, note that the return on an asset can be written as:
, (5.4)
Where pi, is the purchase price and the (random) sale price. If dividends are paid, they can be incorporated within . From the security market line:
. (5.5)
So,, (5.6)
Or
. (5.7)
73/JNU OLE
This should be the equilibrium market price of the asset.
Note: Work out expected price and dividend in period 1 and discount back to period 0. The role of is to adjust the risk-free rate of return to give the correct rate of discounting for the degree of risk of the asset. This illustrates a generalprinciplefordiscountingtofindthepresentvalueofaproject.Notethat can be seen as the expected value of a future random-payoff from any kind of investment project. Then , the value today, is just the discounted value of the set of payments. The discounting includes the return on risk-free to represent the time element andthebetatermtoreflectcorrectionsforrisk.Noticethatthehigherthebeta,thegreateristhediscounting.So,more risky projects (more risky in terms of beta with market) are discounted more heavily.
To see this as a general process observe that the problem at the heart of valuation is to take a sequence of random cash flows , t = 0, ..., T, and to construct a present value at time 0. If preferences are risk-neutral, the present value isfoundeasilybydiscountingtheexpectedcashflowattanddiscountingattherisk-freerate.Thiswouldgive:
(5.8)
Where istakenasknownattime0.Thedifficultiesbegin,whenthereisriskaversion.Severalmethodsarenowconsideredforachievingthevaluationwithriskaversion.Discountisataratecapturingtheriskinthecashflow.The present value then becomes:
, (5.9)
with = + .Here,rpcanbeinterpretedastheriskpremiumthattheriskycashflowmustpayinexcessoftherisk-freerate.Thedifficultyinusingthisapproachisthedeterminationof .Itshouldreflectthepremiumappliedtootherassetswithsimilarrisk.Usethecertaintyequivalent.Foreachrandomcashflow,thereisacertaintyequivalentthatsatisfies
(5.10)
So,thattheutilityofthecertaintyequivalentisequaltotheexpectedutilityoftherandomcashflow.Thepresentvalue then becomes:
(5.11)
This method is limited by the need to employ the utility function to determine the certainty equivalent. Each of these methods will work, but has its own drawbacks. A further method is now proposed and then explored in detail. Apply CAPM. The risk premium rp can be determined very easily, if the CAPM model is appropriate. If CAPM applies, then the security market line gives the relationship.
. (5.12)
The drawback with using CAPM is that it relies on restrictive assumptions.
5.6 Market PortfolioThe CAPM model relies on the use of a market portfolio in order to be operative. This market portfolio is meant to includetheentiresetofriskyassetsthatareavailable.Itisnotclear,howthisisobtained.Themajordifficultyisthebreadthofthemarketportfolio.Itismeanttoincludeallriskyassetsnotjustfinancialsecurities.Forexample,it includes real assets, such as art and property and other assets such as human capital. This is obviously not easy todefine.
Therearethreesituationsinwhichthisproblemofdefiningthemarketportfolioarises.Thefirstisinthecalculationof the beta values for assets. Recall that these are obtained by covariance of the return on an asset with the market dividedbythevarianceofthereturnonthemarket.Ifthemarketportfolioisincorrectlydefined,bothofthesevalueswill also be wrong and the estimated beta will not be correct. The next problem is the construction of the capital market line and the security market line. If an incorrect market portfolio is chosen and the beta values estimated on the basis of this are wrong, then the two lines will not provide the correct predictions on returns.
Investment Analysis and Portfolio Management
74/JNU OLE
ThefinalproblemisthattheproblemofthemarketportfoliomakesitdifficulttotestwhethertheCAPMmodeliscorrect or not. If the prediction of the security market line is used as a test of the model, then a rejection can show that either the model does not apply or the wrong market portfolio is used.
5.7 APT and CAPMArbitrage Pricing Theory (APT) and the multi-factor model are not necessarily inconsistent with CAPM. In the simplest case with one factor, the two are clearly identical. With more factors, further conditions must be met. To obtain an insight into these, assume that returns are generated from two factors so:
. (5.13)
The equilibrium from the APT model is then determined by the equilibrium equation:
, (5.14)
Where the condition has been used, the interpretation of is that this is the return above the risk-free rate earned by an asset with = 1 and all other values of bji = 0. From the CAPM, the value of this excess return should be:
. (5.15)
Substituting this into (5.14) gives:
(5.16)
. (5.17)
This is exactly the CAPM model where, . The two remains consistent provided this identity holds.
75/JNU OLE
SummaryThe analysis to this point has considered the expected returns and variances as given data and used these to •determine investment policy.The value of an equilibrium model and of the Capital Asset Pricing Model (CAPM) in particular is that it allows •the evaluation of portfolio performance.TheCAPMprovidesanexplanationoftheconceptoffinancialmarketequilibrium.•A position of equilibrium is reached, when the supply of assets is equal to the demand.•The CAPM determines very precise equilibrium relationships between the returns on different assets.•The set of assumptions upon which the CAPM is based upon, are now described.•The general properties of equilibrium are now determined by tracing through the implications of the CAPM •assumptions.The investors have the same information and expectations.•Beta values are now calculated and published regularly for all stock exchange-listed companies.•The proxy beta for a proposed investment project must be disentangled from the company’s equity beta.•ThecapitalmarketlineisthenameassignedtotheefficientfrontierintheCAPM.•The CAPM also has implications for the returns on individual assets.•The covariance of the risk-free asset with the market is zero and the assets return is •The CAPM and the single-index model both generate a parameter • which determines the return on the asset.The CAPM also has implications for asset prices.•The CAPM model relies on the use of a market portfolio in order to be operative.•APT, and the multi-factor model, is not necessarily inconsistent with CAPM.•
ReferencesThe Capital Asset Pricing Model (CAPM). • [Pdf] Available at: <http://people.stern.nyu.edu/ashapiro/courses/B01.231103/FFL09.pdf> [Accessed 07 July 2014].The Capital Asset Pricing Model. • [Pdf] Available at: <http://www.isye.umn.edu/courses/ie5441/pdf/Chapter-7.pdf> [Accessed 07 July 2014].Pahl, N., 2009. • Principles of the Capital Asset Pricing Model and the Importance in Firm Valuation. BoD – Books on Demand.Levy, H., 2011. • The Capital Asset Pricing Model in the 21st Century. Cambridge University Press.Part 2 - CAPM What is Capital Asset Pricing Model Explained (complete until end). • [Video online] Available at: <https://www.youtube.com/watch?v=LH2BpIs1EF0> [Accessed 07 July 2014].22. Risk Aversion and the Capital Asset Pricing Theorem. • [Video online] Available at: <https://www.youtube.com/watch?v=K11CnF5vJ8o> [Accessed 07 July 2014].
Recommended ReadingSharifzadeh, M., 2010. • An Empirical and Theoretical Analysis of Capital Asset Pricing Model. Universal-Publishers.Kürschner, M., 2008. • Limitations of the Capital Asset Pricing Model (CAPM). BoD – Books on Demand. Hill, R . A ., 2010. • The Capital Asset Pricing Model. Bookboon.
Investment Analysis and Portfolio Management
76/JNU OLE
Self Assessment____________ models explain the process of investor choice and market clearing that lies behind the observed 1. pattern of asset returns.
Capitala. Equilibriumb. Demandc. Priced.
Which of the following providesanexplanationoftheconceptoffinancialmarketequilibrium?2. The CAPMa. An equilibrium modelb. Assetsc. Portfolio marketd.
The value of an equilibrium model and of the capital asset pricing model (CAPM) in particular, is that it allows 3. the __________ of portfolio performance.
evaluationa. revolutionb. risec. equilibriumd.
Which of the following model predicts exactly how much more expected return is required to compensate for 4. additional risk?
The CAPMa. Capital marketb. Security marketc. An equilibriumd.
Which of the following statement is true?5. The less risk averse is an investor; the lower will be the proportion of the risk free asset in the portfolio.a. The more risk averse is an investor; the lower will be the proportion of the risk free asset in the portfolio.b. The less risk averse is an investor, the higher will be the proportion of the risk free asset in the portfolio.c. The more risk averse is an investor; the higher will be the proportion of the risk free asset in the portfoliod. .
_________ risk adverse investors will hold a larger proportion of the market portfolio.6. Morea. Highb. Lessc. Manyd.
Which of the following statement is false?7. Themarketportfolioisassumedtobewell-diversified.a. If any investor were short-selling a risky asset, none would be short-selling.b. In the UK, an ERP value of between 2% and 5% is currently seen as reasonable.c. The proxy beta for a proposed investment project must be disentangled from the company’s equity beta.d.
77/JNU OLE
What isthenameassignedtotheefficientfrontierintheCAPM?8. The Equity Risk Premium (ERP)a. Dividend Growth Model (DGM)b. Capital Market Linec. WACCd.
The CAPM and the _________ model both generate a parameter 9. which determines the return on the asset.single-indexa. capital marketb. security marketc. equilibriumd.
The CAPM also has implications for ________ prices.10. marketa. highb. assetc. lowd.
Investment Analysis and Portfolio Management
78/JNU OLE
Chapter VI
Bond Market Analysis
Aim
The aim of this chapter is to:
introduce bond market analysis •
explain bond analysis at micro-level•
explicatebondsclassificationbytheirkeyfeatures•
Objectives
The objectives of this chapter are to:
enlistbenefitsofbonds•
elucidate• debt market in India
explain listing of debentures•
Learning outcome
At the end of this chapter, you will be able to:
identifypublicsectorbondsandfixeddepositbonds•
understand bond analysis at macro-level•
recogniseinflationandpricerisk•
79/JNU OLE
6.1 IntroductionBondsarenotasattractiveasequityforreasonsoflackofhighrisk,highreturnprofileandnocapitalappreciationandbonus,rightsandotherprivilegesofownership.Bondshavefixedinterestreturnsandlessvariabilityofreturns.Bonds however have their own advantages discussed below. Bond market returns are good varying between to 15% in the last decade in the developed markets of UK, USA, Germany Japan and France. The Bond Index for different varieties of bonds is published abroad. The bond description of listed and traded securities is given in terms of the name of issuer, coupon rate or interest rate and year of maturity. The Government security in India is quoted for example as 12.32% Loan, 2011.
6.2 Bond Analysis at Micro LevelBondsarenotasattractiveasequityforreasonsoflackofhighrisk-highreturnprofileandnocapitalappreciationandbonus,rightsandotherprivilegesofownership.Bondshavefixedinterestreturnsandlessvariabilityofreturns.Bonds have their own advantages too, as discussed below.
6.2.1 Identification and Classification of BondsBonds are securities with the following basic characteristics:
Theyaretypicallysecuritiesissuedbyacorporationorgovernmentalbodyforspecifiedterm.Bondsbecome•due for payment at maturity, when the par value/face value of bond is returned to the investors.Bonds usually payfixedperiodic interest instalments, called couponpayments. Somebonds pay variable•income.When investor buys bond, he or she becomes a creditor of the issuer. Buyer does not gain any kind of ownership •rights to the issuer, unlike in the case with equity securities.
The main advantages of bonds to the investor:They are good source of current income.•Investment to bonds is relatively safe from large losses.•In case of default, bondholders receive their payments before shareholders can be compensated.•
Amajordisadvantageofbondsisthatpotentialprofitfrominvestmentinbondsislimited.Currentlyinthefinancialmarkets, there are a lot of various types of bonds and investor must understand their differences and features before deciding what bonds would be suitable for his/her investment portfolio.
6.2.2 Bond-classification by their Key FeaturesBond-classificationbytheirkeyfeaturesisdiscussedbelow.By form of paymentClassificationbyformofpaymentisasfollows:
Non-interest bearing bonds are bonds issued at a discount. Throughout the bond’s life, its interest is not earned, •however, the bond is redeemed at maturity for face value.Regular serial bonds are bonds in which all periodic instalments of principal repayment are equal in amount.•Deferred interest bonds are bonds paying interest at a later date.•Incomebondsarebondsonwhich,interestispaidwhenandonlyearnedbytheissuingfirm.•Indexedbondsarebonds,wherethevaluesofprincipalandthepayoutrisewithinflationorthevalueofthe•underlying commodity.Optional payment bonds are bonds that give the holder the choice to receive payment on interest or principal •or both in the currency of one or more foreign countries, as well as in domestic currency.
Investment Analysis and Portfolio Management
80/JNU OLE
Coupon paymentCoupon payment is as follows:
Coupon bonds are bonds with interest coupons attached.•Zero-coupon bonds are bonds sold at a deep discount from its face value and redeemed at maturity for full face •value. The difference between the cost of the bond and its value when redeemed is the investor’s return. These securities provide no-interest payments to holders.Full coupon bonds are bonds with a coupon rate near or above current market interest rate.•Floating-ratebondsaredebt instruments issuedby largecorporationsandfinancialorganisationsonwhich•theinterestrateispeggedtoanotherrate,oftentheTreasury-billrate,andadjustedperiodicallyataspecifiedamount over that rate.
CollateralClassificationbycollateralisasfollows:
Secured bonds: Bonds secured by the pledge of assets (plant or equipment), the title to which is transferred to •bondholders in case of foreclosure.Unsecured bonds: Bonds backed up by the faith and credit of the issuer instead of the pledge of assets.•Debenturebonds:Bondsforwhichthereisnoanyspecificsecuritysetasideorallocatedforrepaymentof•principal.Mortgage bonds (or mortgage-backed securities) are bonds that have as an underlying security a mortgage on •all properties of the issuing corporation.Sinkingfundbondsarebondssecuredbythedepositofspecifiedamounts.Theissuingcorporationmakesthese•deposits to secure the principal of the bonds, and it is sometimes required that the funds be invested in other securities.Asset-Backed Securities (ABS) are similar to mortgage bonds, but they are backed by a pool of bank loans, •leases and other assets. The ABS are related with the new market terminology, securitisation which understood as the process of transforming lending vehicles, such as mortgages into marketable securities. The main features of ABS for investor are relatively high yield, shorter maturities (3-5 years) and monthly, rather than semi-annual principal/ interest payments. From their introduction to the market, they were ranked as high credit quality instruments.However,therecentfinancialcrisesshowedthatthesedebtinstrumentscouldbeextremelyriskyinvestments, when banks loans portfolios as a guarantee of ABS become worthless causing banks’ insolvency problems.General obligation bonds: Bonds, secured by the pledge of the issuer’s full faith and credit, usually including •unlimited tax-power.Guaranteed bonds: Bonds which principal or income or both are guaranteed by another corporation or parent •company in case of default by the issuing corporation.Participatingbonds:Bondswhich,followingthereceiptofafixedrateofperiodicinterest,alsoreceivesome•oftheprofitgeneratedbyissuingbusiness.Revenue bonds: Bonds whose principal and interest are to be paid solely from earnings.•
Type of circulationClassificationbytypeofcirculationisasfollows:
Convertible bonds: Bonds that give to its owner the privilege of exchanging them for other securities of the •issuing corporation on a preferred basis at some future date or under certain conditions;Interchangeable bonds: Bonds in coupon form that can be converted to the other form or its original form at the •request of the holder paying the service charge for this conversion.
81/JNU OLE
Type of issuersTypes of issuers are as follows:
Treasury (government) bonds (an obligation of the government). These bonds are of the highest quality in each •domestic market because of their issuer, Government. This guarantee together with their liquidity makes them popularwithbothindividualandinstitutionalinvestors.Thegovernmentbondsaredominantinthefixed-incomemarket.Municipal bonds: Bonds issued by political subdivisions in the country (county, city, etc.).•Corporate bonds: A long-term obligation of the corporation.•Industrial bonds: Bonds issued by corporations other than utilities, banks and railroads. This debt is used for •expansion, working capital and retiring other debts.Publicutilitybonds:High-qualitydebtinstrumentsissuedbypublicutilityfirms.•
Recall possibilityClassificationbyrecallpossibilityisasfollows:
Callable (redeemable) bonds: Bonds issued, all or part of which may be redeemed by the issuing corporation •underdefiniteconditions,beforetheissuereachesmaturity.Non-callable (irredeemable) bonds: Bonds issued which contains no provision for being ‘called’ or redeemed •prior to maturity date.
Place of circulationPlace of circulation is as follows:
Internal bonds: Bonds issued by a country payable in its own currency.•Externalbonds:Bondsissuedbygovernmentorfirmforpurchaseoutsidethenation,usuallydenominatedinthe•currency of the purchaser. The term Eurobond is often applied to these bonds that are offered outside the country of the borrower and outside the country in whose currency the securities are denominated. As the Eurobond market is neither regulated nor taxed, it offers substantial advantages for many issuers and investors in bonds.
QualityClassificationbyqualityisasfollows:
Gilt-edged bonds: High-grade bonds issued by a company that has demonstrated its ability to earn a comfortable •profitoveraperiodofyearsandtopayitsbondholderstheirinterestwithoutinterruption.Junk bonds: Bonds with low rating, also regarded as high-yield bonds.•
These bonds are primarily issued by corporations and also by municipalities. They have a high risk of default, because they are issued as unsecured and have a low claim on assets.
Other types of bondsOther types of bonds are as follows:
Voting bonds: Unlike regular bonds, these bonds give the holder some voice in corporation management.•Senior bonds: Bonds having prior claims to the assets of the debtor upon liquidation.•Junior bonds: Bonds which are subordinated or secondary to senior bonds.•
6.2.3 Benefits of BondsAdvantages of bonds are given below:
Bondsareattractivetothosewhoarerisk-averseandarehappywithassuredmodestfixedincomeorinterest•income, and certainty of income.Bonds are necessary in a portfolio to diversify assets into various alternative categories, in order to reduce risk •of the total portfolio.
Investment Analysis and Portfolio Management
82/JNU OLE
Bonds have only lower risk, but in combination with stocks or other assets, lower the total risk of portfolio due •to low correlation or low tendency to vary in the same direction and to the same extent as the prices of other assets.Investors, if properly trained can learn to capitalise on the bondpricemovement andbenefit fromcapital•gain.
6.3 Debt Market in IndiaDebt Market is not developed in India for many reasons, despite the fact that debt in terms of market capitalisation is 42% of GDP, while equity market capitalisation is 56% which has gone up to more than 100% of GDP in the peak of frenzy on the stock market in February, 2000 and in July-August 2007.
Government and semi-Government bodies being largest issuers of debt, the interest rates on debt are controlled •historicallybytheGovernmentForlong,theinterestratesonfixedDepositsofCompaniesandP.S.U.swerealsofixedbytheRBIatceilinglevels.These interest rates were kept low to facilitate Government funding at cheaper cost. The individual investors •couldnotfindtheseratesattractivetoinvestin.Therequirementsoflawinrespectofbanks,insurancecompaniesandfinancialinstitutionsforcedthemtoinvesta•proportion of their funds, in Government and semi-Government debt, which led to a captive market in them.
They thus used to invest accordingly in these securities and hold them, until maturity or trade in them among banks andfinancialinstitutions,onlyforpurposesofadjustmentstodurationofmaturityandyield.Secondarymarketandretail trading did emerge only after 1994-95. In the case of corporate debt also, individual investors are not attracted exceptthroughtherouteoffixeddepositswiththecompanieswhicharenotmarketable.Debentureswhicharelong-termdebt,usedtobesoldmostlytofinancialinstitutions,insurancecompaniesandmorerecentlytomutualfunds, UTI, etc. They also used to hold them until maturity, particularly when it is privately placed or are unsecured. The secondary market in these instruments did not develop as a result. Similar is the case with P.S.U. bonds which were allowed to be issued since 1985. Retail market and trading in these debt instruments did not develop due to theselegalandstructuralfactors.Bulkholdersofthecorporatedebtarestillthebanksandfinancialinstitutions.Debt instruments used to carry lower rates than the free market rates and have no chance of capital appreciation and hence are not welcome to individual investors.
6.3.1 Public Sector Bonds and Fixed Deposit BondsPublicsectorbondsandfixeddepositbondsarediscussedintheparagraphsgivenbelow:Public sector bonds During1995and1996,thelargestamountoffundswasraisedbythePSUsandpublicfinancialinstitutions,throughthe bond route. lDBI, IFCI, SBI, MTPL, SAIL and NTPC are a few examples, which raised large amount of debt during the last few years. The interest rates offered were in the range of 16-18%. Although the bonds are generally issuedfor5to7years,theyareissuedbypublicfinancialinstitutionslikelDBI,ICICIandIFCIforlongerperiodsof 20 to 30 years with the permission of the Government. At the other extreme, since companies raised debt for lessthan18months,toenjoythebenefitsofdebtrouteforequity,butyetnotcreditratedbyanyagency,astheSEBI guidelines exempt these issues of less than 18 months from this requirement of compulsory credit rating; the distinction between those with less than 18 months and more than 18 months was dropped in March 1998.
ICD and fixed deposits Companies borrowing through the ICD (Inter Corporate Deposit route) have to pay as high a rate as 30 to 60% in timesoftightliquidity.Assuch,theyfinditconvenientandcheapertoraisefundsfromthepublic,individualsandinstitutions at 15% to 20% through short-term debt instruments of one year in the form of deposits or some form of debentures. As per the RBI rules, Company deposits carry a maximum rate of 15 to 16% and the rest of the money out of 20% is passed on to investors the form of cash incentive and to the sub-brokers and brokers, is the form of brokerage and commissions. The above ceiling on interest rates was removed in July 1996. An example of company issuing NCDs with a maturity of 18 months is SRF Ltd. and CEAT Financial Services. The funds so mobilised by themareat18-20%andareusedinICDinvestmentsat30-40%,aclean20%gaininfinancialdeal.SRFissuedthese debentures at 18% compounded on a quarterly basis and the yield to maturity works out to 20.61%. The CEAT Financial Services offered those NCDs at 19%, with interest payable on a quarterly basis and yield to maturity of 20.41%.
83/JNU OLE
6.4 Listing of DebenturesDebentures, which are not convertible into equity or redeemable within 18 months, should be compulsorily rated by a credit rating agency for the issue to the public. Some of those issued to the public are also listed on BSE, OTCEI and NSE. However, there are some issues like those of Sundaram Finance SRF, GE Cap, Core Health, Care Dee Pharma, etc., which made private placement at coupon rates of 18-19%, yielding 21-22% to the investors. As these are not listed and traded, buying and selling will be a problem and liquidity is less. However, issues quoted on OTC and NSE are now available for regular trading in retail in marketable lots and in OTCEI the facility of market makers is also available which will ensure their tradability and a quotation.
6.4.1 OTC Debentures Example of OTC listed debentures show that Birla Global Finance is rated A + only, but is at a premium with Rs. 100 debentures quoting at Rs. 132.50, while Raymond with AA is quoting at a discount at Rs. 83.10. The yields to maturities varied from 15.10% in the case of BGFL to 18.36% the case of Dabur India and these yields depend on a host of factors like credit rating, coupon rate, maturity period, performance of the company, etc.
6.4.2 NSE Debentures The Triple ‘A’ rated Tisco Secured promissory notes were yielding 21.39% in 1996 while Torrent Gujarat was yielding 27.09% (YTM) with only a double ‘A’ (AA).
As a matter of thumb rule, the better the credit-rating, the better is the safety of the debenture, but liquidity is provided by availability of market maker and trading on a regular basis. The higher the rating, the lower is generally the coupon rate, as the company can issue the security with less risk, which means lower return. The higher the risk, the higher is the return. In case of Reliance and Ranbaxy with a credit rating of AA + which means high safety, the issues were made at coupon rates ranging from 12.5% to 15%, while United Phosphorus with a lesser rating of only AA (meaning adequate safety) issued debentures at 17%. Coupon rates in general varied from 12.5% to 18.5%, while the current yield, in which investors are interested varied from 15% to 20%, in 1996, and from 10 to 15% in 2006-07.
6.5 Asset Based Securities (Securitisation)Assetbasedsecuritiesandbondsissuedintheplaceofreceivablesheldbyacompany,withahighlydiversifiedportfolio. HDFC converted its Housing loans into securities and sold them. So did the Citi Bank in December 1995 throughwhatarecalled‘PassthroughCertificates’(PTC).SuchsecuritiesarefirstpurchasedbytheSpecialPurposeVehicle (SPV) which is structured as a trust company for this purpose. SPV is ready to buy before maturity, offering liquidity to these instruments. Investors get 17-18% interest. Sometimes, the paper is sold as zero coupon bonds at aninitialdiscountandtheyareredeemableattheendof5to7yearsatpar.TheCitiBankwasthefirsttogettheirPTC rated by a credit Agency (AAA) and have them listed on the NSE. In the case of Citi Bank securities, the SPV has a right to receive interest at 17.36% and the tenor of the security is 30 months, for these zero coupon bonds. The market maker is the Hoare Govett (India) on the NSE and the PTCs are traded on the NSE open to both, residents and NREs, OCBS or Fils. The issue, price and other details of PTCs listed on NSE are seen in the chart below. HDFC, S R FF, Ashok Leyland, etc., have also used the PTC, but they are not listed on any of the Stock Exchanges. In fact, only the NSE, BSE and DSE provide the facilities for trading in bonds or debentures. Of these, the bulk of trading is on NSE, which is expected to develop the debt market in India.
Investment Analysis and Portfolio Management
84/JNU OLE
6.6 Inflation and Price RiskInflationandpriceriskarediscussedintheparagraphsbelow.
6.6.1 Bond RiskRisks are systematic and unsystematic risks. In the macro sense, there are systematic risks. In micro sense, there are unsystematic risks. These risks are measured by the variability or standard deviation from the mean of the return. The source of all systematic risks is: purchasing power changes and interest rate changes, (involving price changes and reinvestment income changes.) Interest rate risk has these two dimensions, namely price risk and reinvestment risk.
Inflation or purchasing power riskReturn expected on Government securities has two components namely riskless return plus some compensation forpurchasingpowerrisk.Inflationandexpectedinflationdeterminethesecondcomponent.RisklessreturnistheTreasury bill return of the Government, which has no risk in practice. In India, in the year 2000, the Treasury bill returnwasaround9.5%andinflationratewasabout5%.Then,theshort-termbondshouldhaveareturnof9.5+5=14.5%.However,theaverageinflationrateinthepastandexpectedinflationrateinthefuturealsoinfluencetheinterestratesandtheyieldsrangedfrom14%to18%inthecaseofcorporatebondsinIndia,in2000.Inflationrateoverthelastdecadeaveragedataround8%andtherisklessreturnplusaverageinflationratewillgiveatotalreturn of around 20%.
Expectationsalsoplayan importantpart.Thus, infiscal1999-2000, the inflation ratewasaround5%,but theexpectedlong-termtrendis8%,duetothefactthatinsomeyears,theinflationratetouchedaround10%to13%inthepast.InflationarypotentialasjudgedbythecentralGovernmentbudgetdeficit,administeredpricechanges,moneysupplychanges,etc.,andahostofotherfactorsdeterminetheexpectationsofinflationratesinIndia.Actualinflationrateswerearound1.5%to3%during2001and2002,buttherateofgrowthoftheeconomysloweddownduringtheseyears.Latertheinflationrangedaround5%p.a.during2003to2006.
Interest rate risk Volatility of bond prices depends on the changes in interest rates. Firstly, income and capital gain or loss will be affected, by changes in interest rates. Secondly, income from bonds reinvested will have also different income due tointerestratechanges.Thefirstisthepriceriskandsecondisthereinvestmentrisk,whicharediscussedbelow.
Price risk-volatility of bond pricesPrice changes in bonds occur due to changes in maturity of bond. Given the same coupon rate and face value Rs. 100, changes in the required yield or in interest rates will lead to different changes in prices depending upon the years to maturity. The longer term maturities will suffer larger capital depreciation with rise in yields than those with shorter term maturities. The capital appreciation will behave in the same manner, if there is a fall in interest rates. As maturity becomes larger, the greater is the bond price volatility. Again, the lower the coupon rate, the greater is the volatility of bond prices. If interest rate rises, the percentage fall in prices will be larger in low coupon bonds than with high coupon bonds. If interest rate falls, the percentage rise in prices will be larger with low coupon bonds thanwithhighcouponbonds.Thestartinglevelofyieldswillalsoinfluencethebondpricevolatility.Thehighertheyieldlevel,fromwhichyieldfluctuationstarts,thegreateristhepricevolatility.
6.7 Bond Analysis at Macro LevelBond analysis at macro-level is discussed in the paragraphs given below.
6.7.1 Credit Rating SystemDebt instruments are generally rated, but even equity can be rated at the time of Initial Public Offer (IPO) based intheprojectappraisalandprojectedfinancialparameters.Creditratingreferstotheratingofrisk,involvedinaninstrument issued by a company. All debt instruments whether short-term or a long-term are to be compulsorily rated, if they are issued to the public. As rating is at a point of time, it has the validity for a short period of 3 to 6 months and rating has to be updated from time-to-time.

85/JNU OLE
Comparative FD Rating Symbols:SymbolswhichinvestorsmustconsiderbeforeplacingafixeddepositCRISIL
Investment Grades FAAA Highest safetyFAA High safetyFA Adequate safety
Speculative grades FB Inadequate safetyFC High riskFD Default
ICRAMAAA Highest safetyMAA High safetyMA Adequate safetyMB Inadequate safetyMC High riskMD Default
CARECARE AAA Best qualityCARE AA High qualityCARE A Adequate safetyCAREBBBSufficientsafetyCARE BB SpeculativeCARE B Susceptible to defaultCARE C High investment riskCARE D Default
6.7.2 Risk FactorsIninfluencingthefixedprices,therearetwocategoriesoffactorstobeexaminednamelyriskfactorsandnon-riskfactors. They are broadly listed below:
Risk Factors Non-risk Factors
Terms of issue offer or provision I Debenture Trust deed Legalandproceduraldifficulties
Earning power Market and marketability
Liquidity Incentives and call factors
Management Tax factors
6.7.3 Trust DeedsIn terms of the Company Law, debentures which are secured and registered can be issued to the public. However, thisrequirementdoesnotapplytoGovernmentandpublicsectorcompaniesandfinancialinstitutions.Alldebentureissues made by the companies to the public which are not convertible within 18 months should be supported by a DebentureTrustee,sayabankorfinancialinstitutionandaTrustDeedtobeexecutedwithinsixmonthsoftheissueto the public. Such public issue of debentures has to be supported by a rating by an Indian Credit Rating Agency, as per the SEBI Guidelines. Credit rating agencies are also controlled through a code of conduct, rules and regulations
Investment Analysis and Portfolio Management
86/JNU OLE
by SEBI. Debenture Trust Deed lay down the terms, rights and obligations of the trustee and the company, the security of assets against the instruments issued, sinking fund arrangements, payment of interest and principal, and action to be taken by debenture trustee in case of complaints of registered holders of Debentures for failure of the company to meet its obligation and other matters.
The trust deed lays down in particular the restrictions on the mortgage or further mortgage of the assets, or sale of the assets, which constitute the security for the debenture issue, on raising the level of debt, creditor rights in the event of any arrears of interest and principal, etc. These terms also include the method of repayment of principal, premium or discount at which they are to be redeemed and the exact date or date of interest payment and principal repayment. These terms partly determine the price of the bond and yield there on, as they determine the extent of the risk, as laid/down in the original terms of issue and incorporated in trust deed.
Earning powerThe earning power is a single important factor determining the fundamentals of the corporate issuing debentures. The price of a bond is determined by the fundamentals of the issuer, through the following:
Earnings level•Earnings variability•Leverage,reflectedbythedebtequityratio•Interest coverage of earnings•Market for the debt issue, listed or not and the demand for such debt•
Theearningspoweralsodependsonthesalesandtheratioofsalesofgrossblock,operatingprofitmargin,priorcommitments through off balance sheet guarantees and commitments, cost of debts vis-a-vis, the earnings, current ratio, and working capital management involving current solvency, leverage enjoyed by equity through debt, extent ofpreferredstockhavingpriorclaims,reflectingthelong-termsolvencyofthecompany,etc.
6.7.4 SEBI GuidelinesForacorporateunittoissuebondsinIndia,SEBIhasissuedmanyguidelinessince1992.Briefly,theyaresetoutbelow:
Minimum debt-equity ratio should not exceed 2:1 and current ratio to be 1:1.33.•The working capital debenture amount should not exceed 20% of the total gross current assets.•Rate of interest paid as debenture is free to be decided by the Company since August 1991.•Credit rating is compulsory for debt issues, even if they are convertible into equity within 18 months and they •are issued to public, through offer of sale.Debentures have to be redeemed after expiry of 7 years and a premium of 5% is permitted on NCD at the time •of redemption.Buy back arrangements and price support operations are permitted for NCDs.•Debenturesandbondsofanytypeincludingnewfinancialproductsarepermitted,convertible,non-convertible,•with warrants or loyalty coupons, etc.Debenture trustee and making of a trust deed are compulsory and to be completed within six months of the •issueofdebenturecertificates.Debt instruments, issued with a credit rating are not to be vetted by SEBI, but by the merchant bankers only.•Putandcalloptionscanbehad,iftheirtermsarespecifiedclearlyforallbondsconvertibleafter36months.•
Earningspotentialessentiallyrestsonthemanagementefficiency,financialprudenceandfutureplans,Governmentpolicy and a host of fundamental factors, discussed in another chapter. More importantly, one has to look for stability of earnings their composition into sales income, trading income and speculative income or through sale of assets or revaluation of assets, etc. The quality of assets is a very important determinant of the solvency and liquidity of the company and hence their earning power.
87/JNU OLE
6.7.5 Non-risk FactorsIn addition to risk factors referred to above, there are other factors also which affect the bond prices. Some examples ofnon-riskfactorswhichinfluencebondpricesare termsof the issue,say issueatadiscount, redemptionatapremium, attached coupons, options and warrants call features, etc. These affect favourably or unfavourably the bondprices.Marketabilityofabondisanimportantfeatureinfluencingitsprice.Thebondslistedandwell-tradedor those with a repurchase facility have a good demand. Bonds with a market maker have good liquidity. The laws of the land facilitating or obstructing trade in bonds are another factor to be considered. Thus, in India stamp duty on issue of debentures and on transfers is a state subject and the rates are as high as Rs. 3 per 100 face value or marketvalue,whicheverishigher.Thedifficultiesofsecuringbondsinretailandinmarketablelotsareanotherset of problems.
DebentureswhenfirstissuedwillbeatafacevalueofsayRs.100andreflectingmarketyieldsafterlistingtheyfallin prices. Tax factors are another set of problems to the Indian bond market. There will be tax deduction at source for all interest income above Rs. 2,500 per annum. The interest income is taxable at the normal rates of income tax, where the capital gains of long-term nature (after holding for more than 12 mouths) are taxable at a lower rate. However for companies, interest paid on debt enjoys the privilege of tax exemption as it is taken as an expense item. Thus, next to manufacturing expenses, all the interest payments on long-term debt, bank borrowing and other short-termdebtisadjustableexpenseitemtoarriveatthenetprofits.However,thesameprivilegeisnotavailabletothefixeddividendpayableonpreferenceshares.
Thereispriorcommitmenttothecompany,beforetheresidualprofitsareavailabletoequityholders.However,toservethepreferenceshareholdersatthepresentfixedrateofdividendof14%,thecompanywillhavetoearnapre-taxreturn of 20% at the prevailing corporate tax rate of say 30% for domestic companies. In the case of bondholders, the company needs to earn only the rate of interest payable on them, which in 2007 varied from 12.5% to 18%, depending upon the credit rating of the company, terms of offer, conversion or warrants or other incentives and add-ons like premiums and discounts. The interest rates to be offered on debentures are now freed from all controls. The company is free to offer any rates that it thinks that investors will accept depending on their assessment of the credit-worthiness of the company. To some extent, the rating of credit rating agencies will help the investors to assessthecompany.However,toalargeextent,investorshavetostudytheriskandnon-riskfactorsthatinfluencethe market prices referred to above.
Investment Analysis and Portfolio Management
88/JNU OLE
SummaryBondsarenotasattractiveasequityforreasonsoflackofhighrisk-highreturnprofileandnocapitalappreciation•and bonus, rights and other privileges of ownership.Bondshavefixedinterestreturnsandlessvariabilityofreturns.•Bondsarenotasattractiveasequityforreasonsoflackofhighrisk-highreturnprofileandnocapitalappreciation•and bonus, rights and other privileges of ownership.Debt instruments used to carry lower rates than the free market rates and have no chance of capital appreciation •and hence are not welcome to individual investors.During1995and1996,thelargestamountoffundswasraisedbytheP.S.U.sandpublicfinancialinstitutions,•through the bond route.Companies borrowing through the ICD (Inter Corporate Deposit route) have to pay as high a rate as 30 to 60% •in times of tight liquidity.Assetbasedsecuritiesandbondsissuedintheplaceofreceivablesheldbyacompany,withahighlydiversified•portfolio.Risks are systematic and unsystematic risks.•Inflationandexpectedinflationdeterminethesecondcomponent.•Volatility of Bond prices depend on the changes in interest rates.•Price changes in bonds occur due to changes in maturity of bond.•Debt Instruments are generally rated but even equity can be rated at the time of Initial Public Offer (IPO) based •intheprojectappraisalandprojectedfinancialparameters.Credit rating refers to the rating of risk, involved in an instrument issued by a company.•In terms of the Company Law, debentures which are secured and registered can be issued to the public.•Marketabilityofabondisanimportantfeatureinfluencingitsprice.•The interest rates to be offered on debentures are now freed from any controls.•
ReferencesInternational Bond Markets: Pricing And Hedging (CAPM). • [Pdf] Available at: <http://www.bauer.uh.edu/rsusmel/7386/ln13.pdf > [Accessed 07 July 2014].Advanced Bond Concepts. • [Pdf]Available at: <http://eco.ibu.edu.ba/assets/userfiles/mng/Reading_bond_advanced_investopia.pdf > [Accessed 07 July 2014].Fabozzi, F. J., 2007. • Bond Markets: Analysis And Strategies. Pearson Education India.Johnson, R. S., 2013. • Debt Markets and Analysis. John Wiley & Sons.StockandBondMarketCorrelation:HowtoHandleInflationinInvestmentAnalysis(1997).• [Video online] Available at: <https://www.youtube.com/watch?v=Xz1Z0tRFZ_s > [Accessed 07 July 2014].The Melting Bond Market with Max Keiser. • [Video online] Available at: <https://www.youtube.com/watch?v=hohweo1wNiU > [Accessed 07 July 2014].
Recommended ReadingChoudhry, M., 2003. • Bond and Money Markets: Strategy, Trading, Analysis. Butterworth-Heinemann.Wilson, R. C. and Fabozzi, F. J., 1995. • Corporate Bonds: Structure and Analysis. John Wiley & Sons.Siegel, J. G., Shim, J. K., Qureshi, A. A. and Brauchler, J . , 2014. • International Encyclopedia of Technical Analysis. Routledge.

89/JNU OLE
Self AssessmentBonds have ________ interest returns and less variability of returns.1.
variablea. inconsistentb. fixedc. predictedd.
Whatarebondsthatusuallypayfixedperiodicinterestinstalmentscalled?2. Coupon paymentsa. Current incomeb. Collateralsc. Secured bondsd.
Match the following3.
1. Non-interest bearing bonds A. Bonds on which interest is paid when and only when earned by theissuingfirm.
2. Deferred interest bonds B. Bonds issued at a discount.
3. Income bonds C.Bondswherethevaluesofprincipalandthepayoutrisewithinfla-tion or the value of the underlying commodity
4. Indexed bonds D. Bonds paying interest at a later date
1-D, 2-B, 3-C, 4-Aa. 1-A, 2-C, 3-B, 4-Db. 1-C, 2-A, 3-D, 4-Bc. 1-B, 2-D, 3-A, 4-Cd.
Which of the following bonds issue, all or part of which may be redeemed by the issuing corporation under 4. definiteconditions,beforetheissuereachesmaturity?
Non-callable bondsa. Internal bondsb. Callable bondsc. External bondsd.
The term ___________ is often applied to these bonds that are offered outside the country of the borrower and 5. outside the country in whose currency the securities are denominated.
Eurobonda. Gilt-edgedb. Public utilityc. Municipald.
Which of the following statement is true?6. Thecallablebondsaredominantinthefixed-incomemarket.a. Thegovernmentbondsaredominantinthefixed-incomemarket.b. Thenon-callablebondsaredominantinthefixed-incomemarket.c. Theinternalbondsaredominantinthefixed-incomemarket.d.
Investment Analysis and Portfolio Management
90/JNU OLE
Debentures, which are not convertible into equity or redeemable within ______ months, should be compulsorily 7. rated by a credit rating agency for the issue to the public.
12a. 4b. 18c. 6d.
Which of the following statement is false?8. Thelowertheyieldlevel,fromwhichyieldfluctuationstarts,thegreateristhepricevolatility.a. Risks are systematic and unsystematic risks.b. Inflationandexpectedinflationdeterminethesecondcomponent.c. Volatility of Bond prices depend on the changes in interest rates.d.
Which of the following occur due to changes in maturity of bond?9. Debt Instrumentsa. Interest Rate Riskb. Credit ratingc. Price changesd.
__________ rating refers to the rating of risk, involved in an instrument issued by a company.10. Debita. Creditb. Bondc. Minimumd.

91/JNU OLE
Chapter VII
Forward and Futures
Aim
The aim of this chapter is to:
introduce forward and futures•
explain index futures and valuation of index futures•
explicate motives of trading•
Objectives
The objectives of this chapter are to:
explain forward prices•
elucidate• value of contract
explicate commodities•
Learning outcome
At the end of this chapter, you will be able to:
identify difference between options and futures•
understand derivative trading in securities •
recognise NSE proposals•
Investment Analysis and Portfolio Management
92/JNU OLE
7.1 IntroductionForwardsandfuturesarebothcontracts,whichinvolvethedeliveryofaspecificassetatanagreeddateinthefutureatafixedprice.Theydifferfromoptionscontractsinthefactthatthereisnochoiceinvolvedastowhetherthe contract is exercised. With both forwards and futures, the agreed price must be paid and delivery undertaken. Despite this, the underlying approach to valuation remains the same.
Forward contracts, which are no more than commitments to a future trade, have been in use for a very long time. One piece of evidence to this effect is that the agreement to purchase dates whilst the dates were still unripe on the tree (a forward contract) was prohibited in the early Islamic period. Commodity futures also have a fairly long history.TheywerefirstintroducedontoanexchangebytheChicagoBoardofTradeinthe1860stoassistwiththereductionintradingriskfortheagriculturalindustry.Financialfutures(whichdifferinsignificantwaysfromcommodity futures) are a much more recent innovation. The motives for trading and potential trading strategies will be analysed. Finally, the valuation of the contracts will be considered.
7.1.1 Forwards and FuturesForwards and futures are two variants of the same basic transaction, but there are some important operational differencesbetweenthem.Thesedifferencesarereflectedinthevaluationsofthecontracts.Theforwardcontractisthesimplerformandthisisdescribedfirst.
As an example of a forward contract, consider a farmer growing wheat and a baker who requires wheat as an ingredient. Assume that wheat is harvested in September. A forward contract would be written, if the farmer and the baker committed in May to the baker purchasing 2 tons of wheat at $1000 per ton, when the wheat is harvested in September.Theessentialelementsherearethecommitmenttotradeatafuturedateforafixedpriceandquantity.No money is exchanged, when the forward contract is agreed. Money only changes hands, when the commodity is delivered.Thefinancialquestionthatarisesisthedeterminationoftheprice(inthisexample$1000)writtenintothe contract. A futures contract has the almost all the features of forward contract. In a futures contract, there is also acommitmenttotradeandagreedquantityatafixedpriceatafuturedate.
Where differences arise between forwards and futures is in the timing of institutional arrangement and the timing of payment.
A forward is an over-the-counter agreement between two individuals. In contrast, a future is a trade organised •by an exchange.A forward is settled on the delivery date. That is, there is a single payment made when the contract is delivered. •Theprofitorlossonafutureissettledonadailybasis.
To understand the process of daily settlement, assume a futures contract is agreed for delivery of a commodity in three months. Label the day the contract is agreed as day 1 and the day of delivery as day 90. Let the delivery price written into the contract on day 1 be $30. Now assume that on day 2, new contracts for delivery on day 90 have a delivery price of $28 written into them.
Those who are holding contracts with an agreement to pay $30 are in a worse position than those holding $28 contracts. The daily settlement process requires them to pay $2 (the value by which their position has deteriorated) to those who have sold the contract. The delivery price of $28 on day 2, is then taken as the starting point for day 3. If the delivery price in new contracts rises to $29 on day 3, then the holder of the futures contract from day 2 receives $1. This process is repeated every day until day 90. Effectively, daily settlement involves the futures contract being re-written each day with a new contract price.
Fromthisbriefdescription,itcanbeseenthatafuturescontractinvolvesacontinuousflowofpaymentsoverthelife of the contract. In contrast, a forward contract has a single payment at the end of the contract. This difference in thetimingofpaymentsimpliesthatthecontractsneednothavethesamefinancialvaluation.Withafuturescontractthe exchange acts as an intermediary between the two parties on different sides of the contract. The process of daily settlement is designed to avoid the development of excessive negative positions and the possibility of default. To
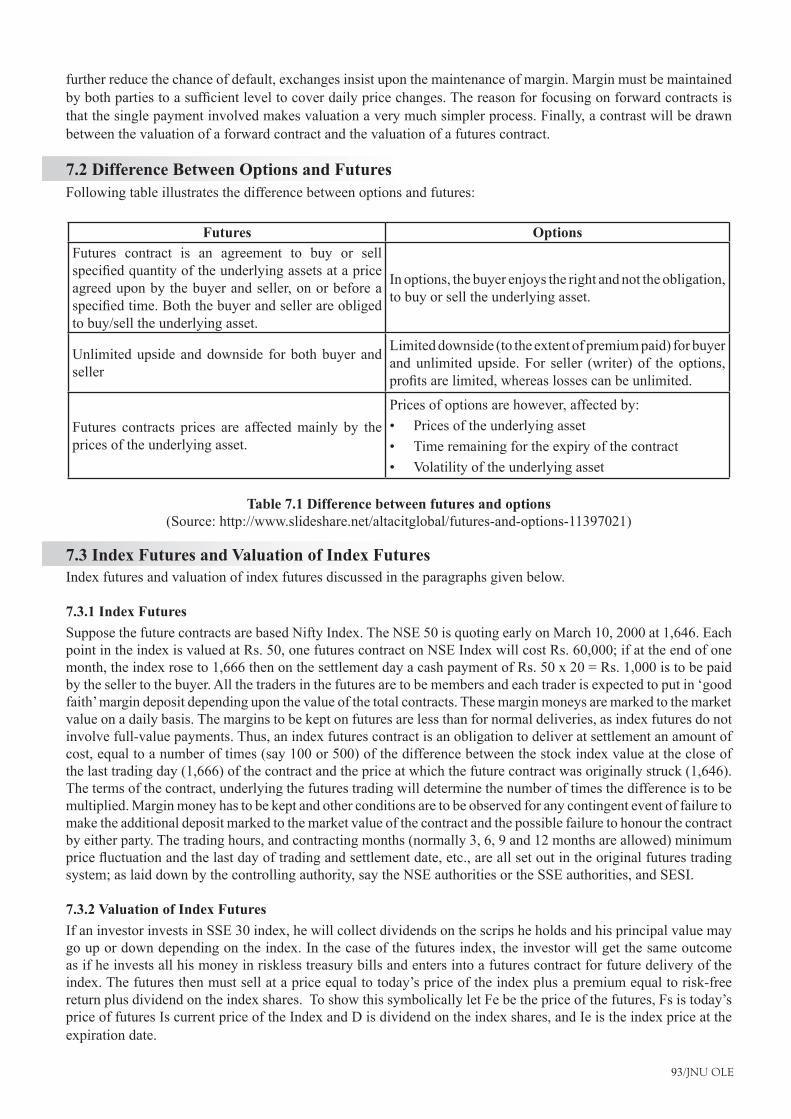
93/JNU OLE
further reduce the chance of default, exchanges insist upon the maintenance of margin. Margin must be maintained bybothpartiestoasufficientleveltocoverdailypricechanges.Thereasonforfocusingonforwardcontractsisthat the single payment involved makes valuation a very much simpler process. Finally, a contrast will be drawn between the valuation of a forward contract and the valuation of a futures contract.
7.2 Difference Between Options and FuturesFollowing table illustrates the difference between options and futures:
Futures OptionsFutures contract is an agreement to buy or sell specifiedquantityoftheunderlyingassetsatapriceagreed upon by the buyer and seller, on or before a specifiedtime.Boththebuyerandsellerareobligedto buy/sell the underlying asset.
In options, the buyer enjoys the right and not the obligation, to buy or sell the underlying asset.
Unlimited upside and downside for both buyer and seller
Limited downside (to the extent of premium paid) for buyer and unlimited upside. For seller (writer) of the options, profitsarelimited,whereaslossescanbeunlimited.
Futures contracts prices are affected mainly by the prices of the underlying asset.
Prices of options are however, affected by:Prices of the underlying asset •Time remaining for the expiry of the contract•Volatility of the underlying asset•
Table 7.1 Difference between futures and options(Source: http://www.slideshare.net/altacitglobal/futures-and-options-11397021)
7.3 Index Futures and Valuation of Index FuturesIndex futures and valuation of index futures discussed in the paragraphs given below.
7.3.1 Index FuturesSuppose the future contracts are based Nifty Index. The NSE 50 is quoting early on March 10, 2000 at 1,646. Each point in the index is valued at Rs. 50, one futures contract on NSE Index will cost Rs. 60,000; if at the end of one month, the index rose to 1,666 then on the settlement day a cash payment of Rs. 50 x 20 = Rs. 1,000 is to be paid by the seller to the buyer. All the traders in the futures are to be members and each trader is expected to put in ‘good faith’ margin deposit depending upon the value of the total contracts. These margin moneys are marked to the market value on a daily basis. The margins to be kept on futures are less than for normal deliveries, as index futures do not involve full-value payments. Thus, an index futures contract is an obligation to deliver at settlement an amount of cost, equal to a number of times (say 100 or 500) of the difference between the stock index value at the close of the last trading day (1,666) of the contract and the price at which the future contract was originally struck (1,646). The terms of the contract, underlying the futures trading will determine the number of times the difference is to be multiplied. Margin money has to be kept and other conditions are to be observed for any contingent event of failure to make the additional deposit marked to the market value of the contract and the possible failure to honour the contract by either party. The trading hours, and contracting months (normally 3, 6, 9 and 12 months are allowed) minimum pricefluctuationandthelastdayoftradingandsettlementdate,etc.,areallsetoutintheoriginalfuturestradingsystem; as laid down by the controlling authority, say the NSE authorities or the SSE authorities, and SESI.
7.3.2 Valuation of Index FuturesIf an investor invests in SSE 30 index, he will collect dividends on the scrips he holds and his principal value may go up or down depending on the index. In the case of the futures index, the investor will get the same outcome as if he invests all his money in riskless treasury bills and enters into a futures contract for future delivery of the index. The futures then must sell at a price equal to today’s price of the index plus a premium equal to risk-free return plus dividend on the index shares. To show this symbolically let Fe be the price of the futures, Fs is today’s price of futures Is current price of the Index and D is dividend on the index shares, and Ie is the index price at the expiration date.

Investment Analysis and Portfolio Management
94/JNU OLE
Return to Index = Index price at Expiration – Current Index Price + Dividend = Ie – IB + D (1)
Return to futures = Future price at Expiration – Current future price + Interest on Risk free asset. = Fe - FB + RF (2)
As IE will equal Fe at expiration, using the above equations, we can derive, FB as = IB + (RF – D)
The above equation means that the present price of futures, will equal present price of Index plus the ‘cost of carry’ which equals (Rf - D), namely the interest obtainable on risk-free asset (Rf) minus dividend on Index Shares (D). The cost of purchasing the Index Shares is substantially higher than the cost of buying the futures contract for the same index. The money used to buy the futures will involve interest cost and by not buying the shares, dividends are lost. Assume that the money used to purchase the index shares is invested in treasury bills to give risk free return (Rf). If Rf is less than the dividends lost, the futures price will be below the Index price (that is FB < IB) and (RF < D).
7.4 Commodity Futures and Financial FuturesCommodityfuturesandfinancialfuturesareexplainedintheparagraphsgivenbelow.
7.4.1 Commodity FuturesCommodityfuturesaretradesinactualcommodities.Manysignificantagriculturalproductsarecoveredbyfuturescontracts including wheat, pork and orange juice plus other commodities, such as timber. Futures contracts originated in an organised way with the Chicago Board of Trade and have since been offered by numerous other exchanges.
Example: The Chicago Board of Trade was established in 1848. It has more than 3,600 members who trade 50 different futures and options products through open auction and/or electronically. Volume at the exchange in 2003 was 454 million contracts. Initially, only agricultural commodities, such as corn, wheat, oats and soybeans were traded. Futures contracts have developed to include non-storable agricultural commodities and non-agricultural products suchasgoldandsilver.ThefirstfinancialfuturescontractwaslaunchedinOctober1975basedonGovernmentNationalMortgageAssociationmortgage-backedcertificates.Furtherfutures,includingU.S.Treasurybondsandnotes, stock indexes have been introduced since then. Options on futures were introduced in 1982.
AcontractwiththeBoardofTrade,whichissimilar instructuretocontractsonotherexchanges,specifiesthefollows:
Thequalityoftheproduct:Thequalityhastobeverycarefullydefined,sothatthepartiestothecontractknow•exactly what will be traded. This is important, when there are many different varieties and qualities of the same product.Thequantityofatrade:Thequantitythatistradedisspecifiedinthecontract.Thisisusuallylargeinorderto•make delivery an economically viable exercise. However, it does mean that these contracts are ‘lumpy’, so that the assumption of divisibility is not easily applied. The high transport costs that can be involved in shipping the commodities around.The date of delivery (or interval in which delivery is to be made): This is essential for the contract to •function.Theprice:Thisisthebasicfeatureofthecontractuponwhichprofitandlossisdetermined.Thepriceiswhat•will be paid at the delivery time.
Thesespecificationshavetobeverypreciseandcompleteinordertoensurethattherecanbenodisputeaboutwhether the correct product is ultimately delivered.
95/JNU OLE
Example: Soybeans FuturesContract Size 5,000 bu.•Deliverable Grades No. 2 Yellow at par, No. 1 yellow at 6 cents per bushel over contract price and No. 3 yellow •at 6 cents per bushel under contract price *No. 3 YellowSoybeans are only deliverable when all factors equal U.S. No. 2 or better except foreign material. See Soybean •Futures in the Rules & Regulations section. Tick Size 1/4 cent/bu ($12.50/contract) •Price Quote Cents and quarter-cents/bu •Contract Months Sep, Nov, Jan, Mar, May, Jul and Aug•Last Trading Day: The business day prior to the 15th calendar day of the contract month. •Last Delivery Day: Second business day following the last trading day of the delivery month.•Trading Hours Open Auction: 9:30 a.m.-1:15 p.m. Central Time, Mon-Fri. Electronic: 7:31 p.m.-6:00 a.m. •Central Time, Sun-Fri. Trading in expiring contracts closes at noon on the last trading day.Ticker Symbols Open Auction: S, Electronic: ZS •Daily Price Limit: 50 cents/bu ($2,500/contract) above or below the previous day’s settlement price.•
No limit in the spot month (limits are lifted two business days before the spot month begins). Although the contracts specify delivery of a commodity, most contracts are closed, before the delivery date. Less than 1% are delivered or settled in cash.
7.4.2 Financial FuturesFinancial futures are contracts drawn up on the basis of some future price or index, such as the interest rate or a stockindex.Generally,no‘good’isdeliveredatthecompletionofthecontractandonlyafinancialexchangetakesplace. Generally is used, because there are exceptions involving bond contracts. Financial futures become possible, whenitisobservedthattheactualcommodityneednotbedeliveredattheendofthecontractonlythe‘profit’overthe current spot price is paid. For example, assume the futures contract price is $3 and the spot price is $2. Then, the buyer of futures contract pays $1 to the seller and no transfer of asset needs to take place.
Afinancialfuturecanalsobeformedbyconvertinganindexintoamonetaryequivalent.Forinstance,astockindex future can be constructed by valuing each 10 points at $1. Thus, an index of 6100 would trade at a price of $610. If the index fell to 6000, the futures price would become $60. Using such a mechanism, it becomes possible toconstructsuchcontractsonanyfutureprice.ExampleofexchangesintheUS,wherefinancialfuturesaretradedare the Chicago Board of Trade, Mid-America Commodity Exchange and New York Board of Trade.
Example: NYSE Composite Index® FuturesContract REVISED NYSE Composite Index®_ Futures Small Contract Size$5 × NYSE Composite Index (e.g., $5 × 5000.00 = $25,000) Symbol Value ofMinimum Move MU $2.50Contract REVISED NYSE Composite Index® Futures Reg. Contract Size$50 × NYSE Composite Index R_ (e.g., $50 × 5000.00 = $250,000) SymbolValue of Minimum Move YU $25.00Price Quotation: Index Points where 0.01 equals $0.50Daily Price Limits: Please contact the Exchange for information on daily price limits for these contracts.Position Limits: NYSE Regular (on a 10:1 basis) are converted into NYSE Small positions for limit calculation purposes. Any One Month Limit 20,000All Months Combined Limit 20,000Cash Settlement: Final settlement is based upon a special calculation of the third Friday’s opening prices of all the stocks listed in the NYSE Composite Index® In the UK, futures contracts are traded on LIFFE, the London InternationalFinancial Futures Exchange which was opened in 1982.
Investment Analysis and Portfolio Management
96/JNU OLE
Example: LIFFE offers a range of futures and options; ad provides an arena for them to be traded. The Exchange brings together different parties, such asfinancial institutions, corporate treasurydepartments and commercialinvestors, as well as private individuals, some of whom want to offset risk, hedgers and others who are prepared to takeonriskinthesearchforprofit.
The following mergers with the London Traded Options Market (LTOM) in 1992 and with the London Commodity Exchange (LCE) in 1996, LIFFE added equity options and a range of soft and agricultural commodity products to its existingfinancialportfolio.TradingonLIFFEwasoriginallyconductedbywhat’sknownas‘openoutcry’.Traderswould physically meet in the Exchange building to transact their business. Each product was traded in a designated area called a pit, where traders would stand and shout the price at which they were willing to buy or sell. In 1998, LIFFE embarked on a programme to transfer all its contracts from this traditional method of trading, to an electronic platform. This transition is now complete. The distribution of LIFFE CONNECTTM stands at around 450 sites, more than any other trading system in the world, and covers all major time zones. This distribution continues to grow.
There are three major types of futures traded on LIFFE.Contracts on short-term interest rates: These are based on the three-month money market rate and are priced as •100 - interest rate. Consequently, when the interest rate goes up, it implies that the price of the futures contract goes down.Bond futures: Bond future represents long-term interest rate futures. They are settled by delivery of bonds, with •adjustmentfactorstotakeaccountoftherangeofdifferentbondsthatmaybedelivered.Thisisafinancialfuturewhich is settled by actual delivery of the commodity.Equity index futures: Equity index futures are cash settled and are priced per index point.•
7.5 Motives of Trading Twomotivescanbeidentifiedfortradingforwardsandfutures.Thesearehedgingandspeculation.Thesemotivesare now discussed in turn.
7.5.1 Hedging, Speculation and ArbitrageHedging, speculation and arbitrage are discussed in the paragraphs given below.
HedgingHedging is the use of the contracts to reduce risk. Risk can arise from either taking, demanding or supplying a commodity at some time in the future. The current price is known, but the price at the time of demand or supply will not be known. A strategy of hedging can be used to guard against unfavourable movements in the product price. Two examples of the way in which hedging can be employed are now given.
Example: Consider a bakery which needs wheat in three months. It can:Wait to buy on the spot market. •OrBuy a future now.•
If the baker followed second option, they would be a long hedger, this is the investor who has committed to accept delivery.
Example: Consider a company in the UK, who will be paid in three months time in Euros. It can:Sell a future on the Euros now. •OrWait to receive the Euros and sell them on the spot market.•
Ifthefirmfollowedfirstoptiontheywouldbeashorthedger,theinvestorwhocommitstosupplythecommodity.
97/JNU OLE
Theadvantageofafuturescontractisthatitfixesthepriceandguardsagainstpricechanges.Forsomeonewhohasto buy in the future, it can be used to insure against price increases while for someone who has to sell in the future it can insure against price-falls. A company that is due to sell an asset at a particular time in the future can hedge by taking a short futures position. They then hold a short hedge. A company that is due to buy an asset at a particular time in the future can hedge by taking a long futures position, a long hedge.
Hedgingthroughtheuseoffuturescontractsreducesriskbyfixingadeliveryorpurchaseprice.Thisinsuresagainstadversepricemovements,butalsomeansthatprofitislostfromfavourablepricemovements.Theoptimaldegreeofhedging determines the best trade-off between these. In effect, it is usually best to cover some exposure by hedging, butleavesomeuncoveredinordertoprofitfromfavourablepricemovements.Thehedgeratioisthesizeoftheposition in futures relative to size of exposure.
One way of analysing the optimal degree of hedging is to consider the strategy that minimises the variance in a position. The optimal hedge ratio can be determined by considering the variation in the spot price and the futures price. Let S be change in spot price S over length of hedge and F be change in futures price F over length of hedge. The standard deviation of S is denoted by and the standard deviation of F by . Let becoefficientof correlation between S and F and let the hedge ratio be denoted by .
Consider a position which is long in the asset, but short in future. With h denoting the hedge ratio, the change in the value of the position over the life of the hedge is:
Conversely, when long in the future, but short in the asset the change in value of position is:
For both of these positions, the variance of change in the value of hedged position is:
Computing the expectation gives:
Onedefinitionofanoptimalpolicyistochoosethehedgeratiotominimisethisvariance.Thenecessaryconditionfor the hedge ratio is:
Solving this condition, the hedge ratio that minimises the variance is:
Given data on these standard deviations and the correlation, this optimal hedge ratio is simple to compute.
Example: A company must buy 1m gallons of aircraft oil in 3 months. The standard deviation of the oil price is 0.032. The company hedges by buying futures contracts on heating oil. The standard deviation is 0.04 and the correlation coefficientis0.8.Theoptimalhedgeratiois:
Investment Analysis and Portfolio Management
98/JNU OLE
One heating oil futures contract is for 42000 gallons. The company should buy
contracts, which is 15 when rounded.
The example illustrates that the hedge does not have to be in the same commodity, but only in a similar commodity whose price is highly correlated with the one being hedged. In addition, it also shows that optimal hedging does not necessarily imply that all of the exposure has to be covered. In the example, the company has an exposure of 1m gallons, but buys futures contracts of 630000 gallons.
SpeculationThe second reason for trading in futures is speculation. If the spot price is expected to change, a trader can engage in speculation through futures. A speculator has no interest in taking delivery of the commodity or of supplying it, butissimplyinterestedinobtainingprofitthroughtrade.Consequently,anytradetheymakemustultimatelybematched by a reversing trade to ensure that they do not need to receive or deliver.
For an expected price rise a speculator will:Buy futures now.•Enter a reversing trade to sell later after the price has risen.•
Conversely, for an expected price fall, the speculator will:Sell futures now.•Enter a reversing trade to buy later after the price has fallen.•
Clearly, even though the quantity of commodity to be traded is limited to the amount produced, any number of speculative trades can be supported, if there are speculators on both sides of the market.
7.6 Forward Prices The valuation issue involved with forward contracts is to determine the delivery price, or forward price, that is written into the contract at its outset. At the time the two parties on either side of a contract agree the trade, no payment is made. Instead, the forward price is set so that the contract is ‘fair’ for both parties. To be fair, the contract must have a value of zero at the time it is agreed. It is this fact that allows the delivery price to be determined.
As we will see, the forward price in the contract and the spot price of the underlying asset at the time the contract is agreed are related. This relationship is now developed as the basis for determining the forward price. This section develops the valuation of forward contracts. Forwards are considered since the daily settlement involved in futures contracts makes their analysis more complex. A later section explores the extent of the differences between the values of the two contracts.
The focus of this section is upon investment assets. The important feature of these is that it is possible to go short intheseassetsorreduceapositiveholding,ifitisadvantageoustodoso.Thisallowsustheflexibilitytoapplyanarbitrage argument to obtain the forward price. A number of cases are considered which differ in whether or not the asset pays an income.
7.6.1 Investment Asset with No Income Theprocessofvaluationusingarbitrageinvolvessearchingforprofitableopportunitiesbycombiningtheassetsthat are available. To determine the fair futures price, it is assumed that the assets available consist of a risk-free asset, the asset underlying the forward contract and the forward contract. If the forward price is not correctly set, it becomespossibletoproducearbitrageprofitsbycombiningtheseassets.Theconstructionofanarbitrageportfoliois illustrated by the following example.
99/JNU OLE
7.6.2 Investment Asset with Known Income Manyfinancialassetsprovideanincometotheholder.Theholderofaforwardontheassetdoesnotreceivethisincome,butthepriceoftheunderlyingassetdecreasestoreflectthepaymentoftheincome.Thisobservationallowsthe payment of income to be incorporated into the binomial tree. If the asset pays an income with present value of I just prior to the delivery date in the forward contract, the value of the asset will be reduced to uS0 –IR on the upper branchofthetreeanddS0−IRonthelowerbranch.
The application of risk-neutral valuation gives:
Solvingthisusingthedefinitionsoftherisk-neutralprobabilitiesprovidestheforwardprice:
As before, this can be extended naturally to the continuous case as:
Therefore, if the asset pays an income this reduces the forward price, because the person who is long in the forward contract does not receive this income, but is affected by the fall in the assets price immediately after the income is paid.
7.6.3 Continuous Dividend Yield Ratherthanmakingasinglepaymentofincome,anassetmayhaveacontinuousflowofdividends.Lettherateofflowofdividendsbeq.Thenthepreviousresultcanbemodifiedto:
A continuousflowof dividends has the effect of continually reducing the asset price, so reduces the forwardprice.
7.6.4 Storage Costs Storage costs are the opposite of income. They can be added into the expressions directly.Let U be present value of storage costs, then:
7.7 Value of ContractIt has already been noted that at the outset of the contract, the forward price is chosen to ensure that the value of the contract is zero. As time progresses, the spot price of the underlying asset will change as will the forward price in new contracts. The contract can then either have a positive value, if the price change moves in its favour and negative, if it moves against.
To determine this value, let be forward price at time t, and the forward price in a contract agreed at time 0. With time to the delivery date, the value, f, of the forward contract is then given by:
As already noted, at the time the contract is written its value is zero. Now since it follows that the value of the contract at time t is:
Investment Analysis and Portfolio Management
100/JNU OLE
With an income from the asset, this value becomes:
And with a dividend:
7.8 CommoditiesConsidering forward contracts on commodities does make a difference to these results. The features of commodities are that there may be no chance to sell. This means the pricing relations have to be revised. Returning to the basic strategies, it is possible to borrow money, buy the underlying asset, go short in a forward, hold the asset until the deliverydateandthendeliverandrepaytheloan.Thismustnotbeprofitable.LetUbepresentvalueofstoragecosts,thestrategyisnotprofitableif:
This relation puts an upper bound on the forward price. A lower bound cannot be applied without the possibility of short sales or of sales from stocks. If the good cannot be stored, then U can be thought of as the cost of actually producing the commodity.
7.9 Future Compared to ForwardIn general, futures and forwards will not have the same price, because of the daily settlement. This leads the two assetshavedifferentflowsofpayments.Whentherisk-freeinterestrateisconstant,then:
This identity arises because with the constant interest rate the timing of the payments does not matter, since they have the same present value. Prices need not be the same when interest rates vary because of daily settlement. Consider a situation where the spot price, S, is positively correlated with the interest rate. With a long position, an increase inSearnsadailyprofit.Positivecorrelationensuresthisisinvested,whenrishigh.Conversely,adecreaseinSearnsalosswhichiscovered,wheninterestratesarelow.Thisimpliesthefutureismoreprofitable.Despitetheobservations, the difference in price may be small in practice.
7.10 Backwardation and ContangoThefinalissuetoaddressistherelationshipbetweenthefuturespriceandtheexpectedspotprice.Therearethreepossibilities that may hold.
7.10.1 Unbiased Predictor.In this case, the futures price is equal to the expected spot price at the delivery date of the contract. Hence:
7.10.2 Normal Backwardation.The argument for normal backwardation follows from assuming that:
Hedgers will want to be short in futures•Will have to offer a good deal to speculators•
Together these imply that
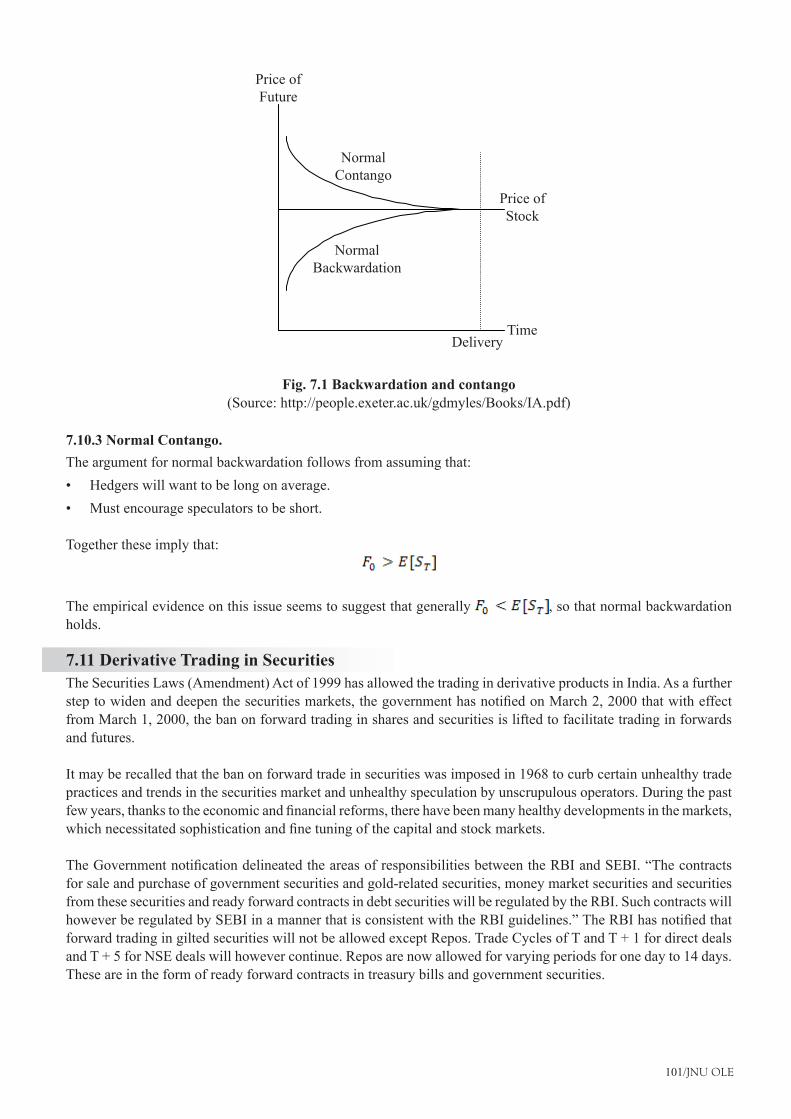
101/JNU OLE
Price ofFuture
NormalContango
NormalBackwardation
DeliveryTime
Price ofStock
Fig. 7.1 Backwardation and contango(Source: http://people.exeter.ac.uk/gdmyles/Books/IA.pdf)
7.10.3 Normal Contango.The argument for normal backwardation follows from assuming that:
Hedgers will want to be long on average.•Must encourage speculators to be short.•
Together these imply that:
The empirical evidence on this issue seems to suggest that generally , so that normal backwardation holds.
7.11 Derivative Trading in Securities The Securities Laws (Amendment) Act of 1999 has allowed the trading in derivative products in India. As a further steptowidenanddeepenthesecuritiesmarkets,thegovernmenthasnotifiedonMarch2,2000thatwitheffectfrom March 1, 2000, the ban on forward trading in shares and securities is lifted to facilitate trading in forwards and futures.
It may be recalled that the ban on forward trade in securities was imposed in 1968 to curb certain unhealthy trade practices and trends in the securities market and unhealthy speculation by unscrupulous operators. During the past fewyears,thankstotheeconomicandfinancialreforms,therehavebeenmanyhealthydevelopmentsinthemarkets,whichnecessitatedsophisticationandfinetuningofthecapitalandstockmarkets.
TheGovernmentnotificationdelineatedtheareasofresponsibilitiesbetweentheRBIandSEBI.“Thecontractsfor sale and purchase of government securities and gold-related securities, money market securities and securities from these securities and ready forward contracts in debt securities will be regulated by the RBI. Such contracts will howeverberegulatedbySEBIinamannerthatisconsistentwiththeRBIguidelines.”TheRBIhasnotifiedthatforward trading in gilted securities will not be allowed except Repos. Trade Cycles of T and T + 1 for direct deals and T + 5 for NSE deals will however continue. Repos are now allowed for varying periods for one day to 14 days. These are in the form of ready forward contracts in treasury bills and government securities.
Investment Analysis and Portfolio Management
102/JNU OLE
The lifting of the ban on forward deals in securities helped to develop index futures and other types of derivatives and futures on stocks. This is a step in the right direction to promote sophisticated market segments as in Western Developed Countries. Sensex futures and Nifty futures for one to three months are now regularly traded and their quotations are published in the Daily Press. The traded quantity, number of contracts and their value are the details of data published. Futures trading in selected scripts both on BSE and NSE are also taking place and their details are also published in the Daily Press, under the head of Derivatives Trading.
7.12 NSE ProposalsThe NSE has proposed to start futures and options by end of the year 1996, (o & F Section) but (started in June 2000 and 2001. This section is for corporate members only. Members trading only and those who will write options are the two classes of members in o & F Section. The former will have a net worth of Rs. 3 crores and the latter Rs. 5 crores. They have to pay additional cash deposits with NSE and National Securities Clearing Corporation (NSCCL) separately.
The membership of o & F Section is also thrown open to non-NSE members, if they satisfy all the requirements of net worth and cash deposits with NSE and NSCCL. The new o & F members have to be members of the Equity market of NSE also, as they can take positions in the cash and futures markets at different times. Existing NSE members opting as trading members in the o & F Section will have to hike their net worth from Rs. 1 crore to Rs. 3 crores and make an additional cash deposit of Rs. 28lakhs. For NSCCL, they will have to pay cash deposit of Rs. 25 lakhs and provide a bank guarantee of Rs. 25 lakhs.
Existing members of NSE opting to be writers of ‘Futures’ or ‘Options’, will hike their net worth to Rs. 5 crores and pay a cash deposit of Rs. 56 lakhs to NSE. For NSCCL, they would make a cash deposit of Rs. 50 lakhs and provideabankguaranteeofRs.50lakhs.TheothertermsanddetailsarefinalisedbytheNSE,andapprovedbySEBI. These terms and conditions are variable.
Even by end March 2000, NSE did not succeed in starting futures due to teething problems in starting futures and duetothedifficultiesofmemberstobringinadditionalfunds.Referencewasalreadymadetotherecommendationsof the Committee on Derivatives, set up by SEBI. In March 2000, when the ban on Forward Trading on Securities was lifted, both the NSE and BSE were considering the launch of the Futures, based on the Index of securities to start with. Index futures and options were started in 2000 and in stocks in 2001.
103/JNU OLE
SummaryForwardsandfuturesarebothcontractswhichinvolvethedeliveryofaspecificassetatanagreeddateinthe•futureatafixedprice.Forward contracts, which are no more than commitments to a future trade, have been in use for a very long •time.Forwards and futures are two variants of the same basic transaction, but there are some important operational •differences between them.The terms of the contract, underlying the futures trading will determine the number of times the difference is •to be multiplied.Commodity futures are trades in actual commodities.•Manysignificantagriculturalproductsarecoveredbyfuturescontractsincludingwheat,porkandorangejuice•plus other commodities, such as timber.Futures contracts originated in an organised way with the Chicago Board of Trade and have since been offered •by numerous other exchanges.Financial futures are contracts drawn up on the basis of some future price or index, such as the interest rate or •a stock index.Afinancialfuturecanalsobeformedbyconvertinganindexintoamonetaryequivalent.•Twomotivescanbeidentifiedfortradingforwardsandfutures.•Hedging is the use of the contracts to reduce risk.•The second reason for trading in futures is speculation.•A speculator has no interest in taking delivery of the commodity or of supplying it, but is simply interested in •obtainingprofitthroughtrade.The valuation issue involved with forward contracts is to determine the delivery price, or forward price, that is •written into the contract at its outset.Theprocessofvaluationusingarbitrageinvolvessearchingforprofitableopportunitiesbycombiningtheassets•that are available.In general, futures and forwards will not have the same price because of the daily settlement.•The Securities Laws (Amendment) Act of 1999 has allowed the trading in derivative products in India.•The NSE has proposed to start Futures and options by end of the year 1996, (0 & F Section) but (started in June •2000 and 2001.
ReferencesForwards and Futures (CAPM). • [Pdf] Available at: <http://www.hss.caltech.edu/~pbs/bem103/JiangWangLN/JWCh10.pdf > [Accessed 07 July 2014].Forward and Futures Prices. • [Pdf] Available at: <http://faculty.weatherhead.case.edu/ritchken/textbook/chapter2ps.pdf > [Accessed 07 July 2014].Poncet, P. and Lioui, A., 2005. • Dynamic Asset Allocation with Forwards and Futures. Springer Science & Business Media.Chisholm, A. M., 2010. • DerivativesDemystified:AStep-by-StepGuidetoForwards,Futures,SwapsandOptions. John Wiley & Sons.Ses9:ForwardandFuturesContractsI.• [Video online] Available at: <https://www.youtube.com/watch?v=i_pLF9J3QPE> [Accessed 07 July 2014].21. Forwards and Futures. • [Video online] Available at: <https://www.youtube.com/watch?v=X_rfROvI9j4 > [Accessed 07 July 2014].

Investment Analysis and Portfolio Management
104/JNU OLE
Recommended ReadingParameswaran, S. K., 2005. • Futures Markets: Theory and Practice. Tata McGraw-Hill Education.Hodrick, R., 2014. • TheEmpiricalEvidenceon theEfficiencyofForwardandFuturesForeignExchangeMarkets. Routledge. Collins, B. M., and Fabozz, F. J., 1999. • Derivatives and Equity Portfolio Management. John Wiley & Sons.

105/JNU OLE
Self AssessmentForwardsandfuturesarebothcontractswhichinvolvethedeliveryofaspecificassetatanagreeddateinthe1. future at a _______ price.
fixeda. highb. lowc. marketd.
Which of the following werefirstintroducedinanexchangebytheChicagoBoardofTradeinthe1860sto2. assist with the reduction in trading risk for the agricultural industry?
Index futuresa. Forward futuresb. Financial futuresc. Commodity futuresd.
Match the following3.
1. Commodity futures A. Trades in actual commodities.
2. Financial futures B. This is second reason for trading in futures.
3. Hedging C. They are contracts drawn up on the basis of some future price or index, such as the interest rate or a stock index.
4. Speculation D. It is the use of the contracts to reduce risk.
1-C, 2-B, 3-A, 4-Da. 1-A, 2-C, 3-D, 4-Bb. 1-B, 2-D, 3-C, 4-Ac. 1-D, 2-A, 3-B, 4-Cd.
The cost of ___________ the index shares is substantially higher than the cost of buying the futures contract 4. for the same index.
sellinga. importingb. purchasingc. exportingd.
Whatisanagreementtobuyorsellspecifiedquantityoftheunderlyingassetsatapriceagreeduponbythe5. buyerandseller,onorbeforeaspecifiedtime?
Financial contracta. Index contractb. Forward contractc. Futures contractd.

Investment Analysis and Portfolio Management
106/JNU OLE
Which of the following statement is true?6. A forward is an over-the-counter agreement between two individuals.a. A future is an over-the-counter agreement between two individuals.b. An index is an over-the-counter agreement between two individuals.c. A commodity is an over-the-counter agreement between two individuals.d.
The process of daily settlement is designed to avoid the development of excessive negative positions and the 7. possibility of ________.
defaulta. failureb. successc. accomplishmentd.
What represents long-term interest rate futures?8. Contractsa. Bond futureb. Equity index futuresc. Hedgingd.
Theprocessofvaluationusing________ involvessearching forprofitableopportunitiesbycombining the9. assets that are available.
hedginga. speculationb. arbitragec. futured.
Which of the following statement is false?10. Prices need not be the same when interest rates vary because of daily settlement.a. A future is a trade organised by an exchange.b. A forward is settled on the delivery date.c. Theprofitorlossonafutureissettledonaweeklybasis.d.

107/JNU OLE
Chapter VIII
Options and Swaps
Aim
The aim of this chapter is to:
introduce options•
explain call, put and trading options•
explicate put call parity•
Objectives
The objectives of this chapter are to:
enlist types of derivatives•
elucidate valuation of European options•
explain• introduction to swaps
Learning outcome
At the end of this chapter, you will be able to:
identify currency swap•
understand swap market•
recognise valuation of swaps•
Investment Analysis and Portfolio Management
108/JNU OLE
8.1 IntroductionAn option is a contract that gives the holder the right to undertake a transaction, if they wish to do so. It also gives themthechoicetonotundertakethetransaction.Possessingthisfreedomofchoiceisbeneficialtotheholderoftheoption, since they can avoid being forced to make an undesirable trade. Options, therefore have value and the rights attached to them and are marketable. The issue that the investment analyst must confront, when faced with options is to determine their value. It is not possible to trade successfully, without knowing the value of what is being traded. Thisappliesequallytothefinancialoptionstradedonestablishedmarketsandtomoregeneralinstruments,suchas employment contracts, which have option-like features built in. This chapter will describe the standard forms of option contract and then gradually build towards a general formula for their valuation. The individual steps of the building process have independent worth, since they provide a methodology for tackling a range of valuation issues.
8.2 OptionsTherearetwobasictypesofoptions.Acalloptiongivestherighttobuyanassetataspecificpricewithinaspecifictimeperiod.Aputoptiongivestherighttosellanassetataspecificpricewithinaspecifictimeperiod.Thepriceat which the trade can take place is called the exercise or strike price. The asset for which there is an option to buy or sell is often called the underlying asset. If the underlying asset is a common stock, then the standard call and put options are called plain vanilla options. This distinguishes them from other more complex options which, for example, can provide the option to buy another option. If the option is used, for example, the holder of a call option chooses to buy the underlying stock, the option is said to have been exercised.
8.2.1 Call, Put and Trading OptionsCall, put and trading options are discussed in the paragraphs given below.
Call optionAplainvanillacalloptionistherighttobuyspecificsharesforagivenpricewithinaspecifiedperiod.Thepremiumon an option is the price paid by the investor to purchase the option contract.
Thecontractforaplainvanillacalloptionspecifies:The company whose shares are to be bought.•The number of shares that can be bought.•The purchase (or exercise) price at which the shares can be bought.•The date when the right to buy expires (expiration date).•
A European call can only be exercised at the time of expiration. This means that the purchaser of the option must hold it, until the expiration date is reached and only then can choose whether or not to exercise the option. In contrast, an American call can be exercised at any time up to the point of expiration. If an investor purchases a call option, they must have some expectation that they will wish to exercise the option. Whether they will wish to do so depends critically upon the relationship between the exercise price in the contract and the price of the underlying asset. Clearly they will never exercise the right to buy, if the price of the underlying asset is below the exercise price. In such a case, they could purchase the underlying assets more cheaply on the standard market.
For a European call, the option will always be exercised, if the price of the underlying asset is above the exercise price at the date of expiration. Doing so allows the investor to purchase an asset for less than its trading price and so mustbebeneficial.WithanAmericancall,theissueofexerciseismorecomplex,sincethereisalsothequestionofwhen to exercise, which does not arise with European options. Putting a detailed analysis of this aside until later, it remains correct that an American option will only be exercised, if the price of the underlying is above the exercise price and will certainly be exercised, if this is true at the expiration date.
109/JNU OLE
Put optionAplainvanillaputoptionistherighttosellspecificsharesforagivenpricewithinaspecifiedperiod.
Thecontractforaplainvanillaputoptionspecifies:The company whose shares are to be sold.•The number of shares that can be sold.•The selling (or exercise) price at which the shares can be sold.•The date when the right to sell expires (expiration date).•
As with calls, a European put can only be exercised at the expiration date, whereas an American put can be exercised at any date up to the expiration date. The difference in value between American puts and European puts will be exploredlater.However,itcanbenotedimmediatelythatsincetheAmericanputismoreflexiblethantheEuropeanput, its value must be at least as high.
Trading optionsOptions are traded on a wide range of exchanges. Most prominent amongst those in the US are the Chicago BoardOptionsExchange,thePhiladelphiaStockExchange,theAmericanStockExchangeandthePacificStockExchange.
Important exchanges outside the US include the Eurex in Germany and Switzerland and the London International FinancialFuturesandOptionsExchange.Optionscontractsareforafixednumberofstocks.Forexample,anoptionscontract in the US is for 100 stocks. The exercise or strike prices are set at discrete intervals (a $2.50 interval for stock with low prices, up to a $10 interval for stock with high prices). At the introduction of an option, two contracts are written, one with an exercise prices above the stock price and one with an exercise price below. If the stock price goes outside this range, new contracts can be introduced. As each contract reaches its date of expiry, new contracts are introduced for trade.
Quotes of trading prices for options contracts can be found in both The Wall Street Journal and the Financial Times. These newspapers provide quotes for the call and put contracts whose exercise prices are just above and just below theclosingstockpriceofthepreviousday.Thepricequotedisforasingleshare,sotofindthepurchasepriceofacontract this must be multiplied by the number of shares in each contract. More detailed price information can also be found on Yahoo which lists the prices for a range of exercise values, the volume of trade and the number of open contracts. Market makers can be found on each exchange to ensure that there is a market for the options. The risk inherent in trading options requires that margin payments must be must in order to trade.
8.2.2 Put Call ParityThere is a relationship between the value of a call option and the value of a put option. In fact, if one value is known, the other can be derived directly. This relationship is determined by analysing a particular portfolio of call, put and the underlying asset. Consider a portfolio that consists of holding one unit of the underlying asset, one put option on that asset, and the sale of one call option, with the put and call having the same exercise price. If is the value of the put option and the value of the call, the value of the portfolio, P, is:
Attheexpirationdate,thefinalvaluesforthetwooptionscanbeusedtowritetheportfoliovalueas:
If S<E at the expiration date, then the put option is exercised but not the call. The value of the portfolio is:
Investment Analysis and Portfolio Management
110/JNU OLE
Conversely, if S>E the call options is exercised, but not the put. This gives the value of the portfolio as:
Hence, whatever the price of the underlying asset at the expiration date, the value of the portfolio is:
So the portfolio has the same value, whatever happens to the stock price. As the value of the portfolio is constant for all S, the portfolio is a safe asset and must pay the rate of return earned on the risk-free asset. If this return is r, with continuous compounding the initial value of the portfolio, if there are t units of time until the date of expiry is equal to the discounted value of the exercise price, so:
Therefore, at any time up to the expiration date, if either V p or V c is known, the other can be derived directly. This relationship is known as put-call parity.
8.3 Types of DerivativesThe security or asset classes on which the derivatives depend are:
Debt or bonds•Equities•Indexes•Commodities•Currencies•
8.4 Valuation of European OptionsThe problem faced in pricing an option before the expiration date is that, we do not know what the price of the underlying asset will be on the date the option expires. In order to value an option before expiry, it is necessary to add some additional information. The additional information that we use takes the form of a model of asset price movements. The model that is chosen will affect the calculated price of the option, so it is necessary to work towards a model that is consistent with the observed behaviour of asset prices. The initial model that is considered makes veryspecificassumptionsuponhowthepriceoftheunderlyingassetmaymove.Theseassumptionsmayseemtobetooartificialtomakethemodeluseful.Ultimatelythough,theyformthefoundationforaverygeneralandwidelyapplied formula for option pricing.
The method of valuation is based on arbitrage arguments. The analysis of Arbitrage Pricing Theory emphasised the force of applying the idea that two assets with the same return must trade at the same price to eliminate arbitrage opportunities. To apply this to the valuation problem, the process is to construct a portfolio, with the option to be valued as one of the assets in the portfolio, in such a way that the portfolio has the same return as an asset with known price. In essence, the returns on the portfolio are matched to the returns on another asset.
The portfolio must then trade at the same price as the asset whose returns it matches. Knowing the prices of all the components of the portfolio, except for the option then implies we can infer the value of the option. This simple methodology provides exceptionally powerful valuing options and will be used repeatedly in what follows. The analysis given in this section is for European options on an underlying stock that does not pay any dividends. Dividends can be incorporated using the same methodology, but space limitations prevent this extension being undertaken here.
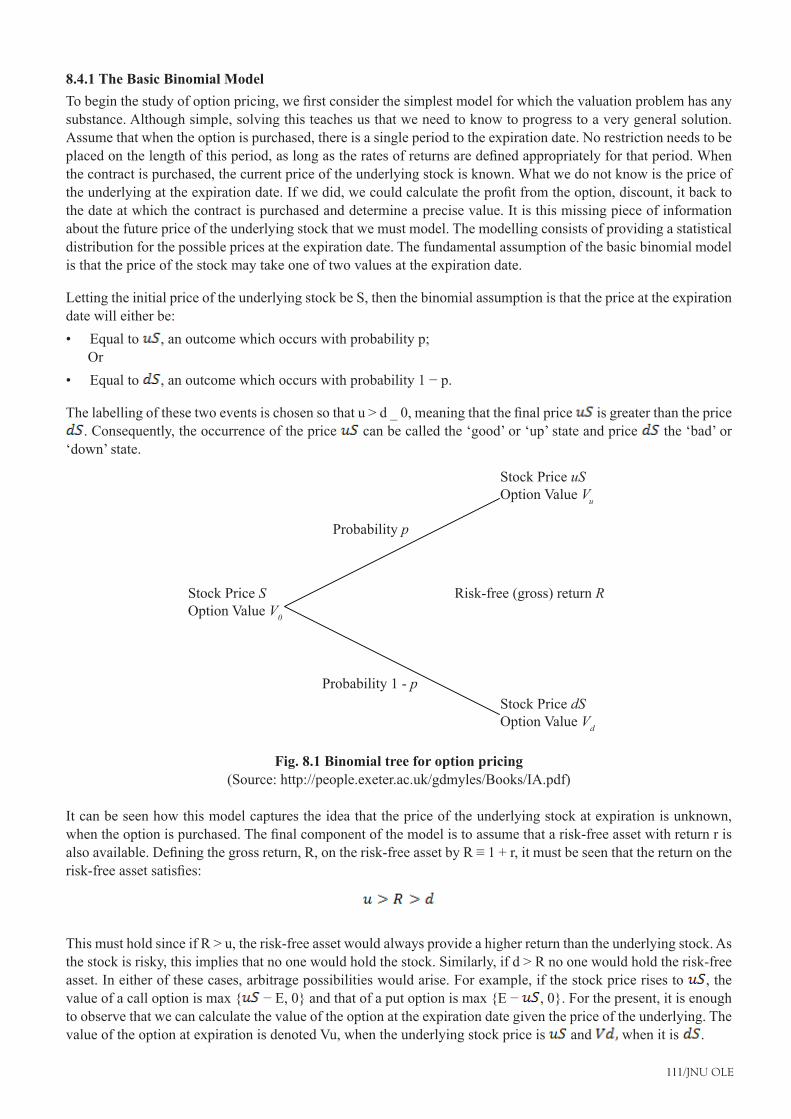
111/JNU OLE
8.4.1 The Basic Binomial ModelTobeginthestudyofoptionpricing,wefirstconsiderthesimplestmodelforwhichthevaluationproblemhasanysubstance. Although simple, solving this teaches us that we need to know to progress to a very general solution. Assume that when the option is purchased, there is a single period to the expiration date. No restriction needs to be placedonthelengthofthisperiod,aslongastheratesofreturnsaredefinedappropriatelyforthatperiod.Whenthe contract is purchased, the current price of the underlying stock is known. What we do not know is the price of theunderlyingattheexpirationdate.Ifwedid,wecouldcalculatetheprofitfromtheoption,discount,itbacktothe date at which the contract is purchased and determine a precise value. It is this missing piece of information about the future price of the underlying stock that we must model. The modelling consists of providing a statistical distribution for the possible prices at the expiration date. The fundamental assumption of the basic binomial model is that the price of the stock may take one of two values at the expiration date.
Letting the initial price of the underlying stock be S, then the binomial assumption is that the price at the expiration date will either be:
Equal to • , an outcome which occurs with probability p; Or
Equal to • ,anoutcomewhichoccurswithprobability1−p.
Thelabellingofthesetwoeventsischosensothatu>d_0,meaningthatthefinalprice is greater than the price . Consequently, the occurrence of the price can be called the ‘good’ or ‘up’ state and price the ‘bad’ or
‘down’ state.
Stock Price uSOption Value Vu
Stock Price dSOption Value Vd
Stock Price SOption Value V0
Risk-free (gross) return R
Probability p
Probability 1 - p
Fig. 8.1 Binomial tree for option pricing(Source: http://people.exeter.ac.uk/gdmyles/Books/IA.pdf)
It can be seen how this model captures the idea that the price of the underlying stock at expiration is unknown, whentheoptionispurchased.Thefinalcomponentofthemodelistoassumethatarisk-freeassetwithreturnrisalsoavailable.Definingthegrossreturn,R,ontherisk-freeassetbyR≡1+r,itmustbeseenthatthereturnontherisk-freeassetsatisfies:
This must hold since if R > u, the risk-free asset would always provide a higher return than the underlying stock. As the stock is risky, this implies that no one would hold the stock. Similarly, if d > R no one would hold the risk-free asset. In either of these cases, arbitrage possibilities would arise. For example, if the stock price rises to , the value of a call option is max { −E,0}andthatofaputoptionismax{E− ,0}.Forthepresent,itisenoughto observe that we can calculate the value of the option at the expiration date given the price of the underlying. The value of the option at expiration is denoted Vu, when the underlying stock price is and when it is .
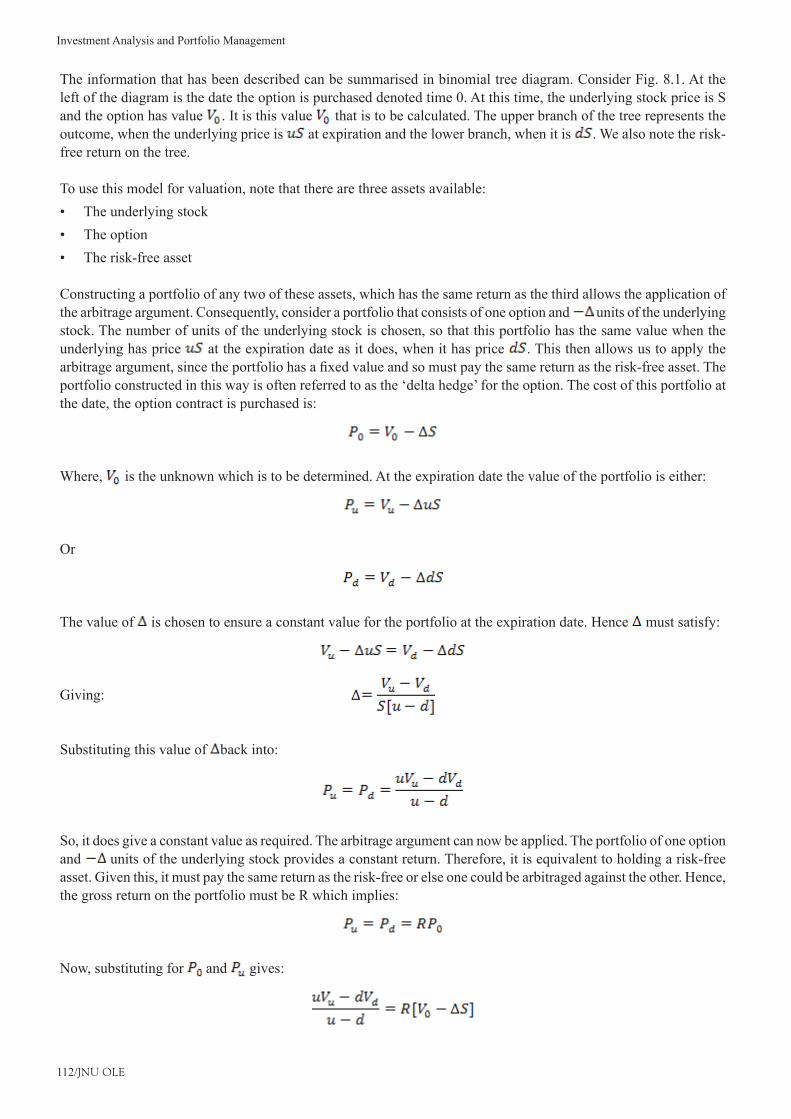
Investment Analysis and Portfolio Management
112/JNU OLE
The information that has been described can be summarised in binomial tree diagram. Consider Fig. 8.1. At the left of the diagram is the date the option is purchased denoted time 0. At this time, the underlying stock price is S and the option has value . It is this value that is to be calculated. The upper branch of the tree represents the outcome, when the underlying price is at expiration and the lower branch, when it is . We also note the risk-free return on the tree.
To use this model for valuation, note that there are three assets available:The underlying stock•The option•The risk-free asset•
Constructing a portfolio of any two of these assets, which has the same return as the third allows the application of the arbitrage argument. Consequently, consider a portfolio that consists of one option and units of the underlying stock. The number of units of the underlying stock is chosen, so that this portfolio has the same value when the underlying has price at the expiration date as it does, when it has price . This then allows us to apply the arbitrageargument,sincetheportfoliohasafixedvalueandsomustpaythesamereturnastherisk-freeasset.Theportfolio constructed in this way is often referred to as the ‘delta hedge’ for the option. The cost of this portfolio at the date, the option contract is purchased is:
Where, is the unknown which is to be determined. At the expiration date the value of the portfolio is either:
Or
The value of is chosen to ensure a constant value for the portfolio at the expiration date. Hence must satisfy:
Giving:
Substituting this value of back into:
So, it does give a constant value as required. The arbitrage argument can now be applied. The portfolio of one option and units of the underlying stock provides a constant return. Therefore, it is equivalent to holding a risk-free asset. Given this, it must pay the same return as the risk-free or else one could be arbitraged against the other. Hence, the gross return on the portfolio must be R which implies:
Now, substituting for and gives:
113/JNU OLE
Using the solution for and then solving for V0:
Thisresultgivesthefairvaluefortheoptionthateliminatesarbitrageopportunities.Inanefficientmarket,thiswouldbethepremiumchargedfortheoption.ThevaluationformulaisdefinedforgeneralvaluesofVuand . What distinguishescallsandputsarethespecificformsthatthesevaluestake.Thesecanbecalledtheboundaryvalues.
8.4.2 The Two-period BinomialThe single-period binomial model introduced a methodology for valuing options, but does not represent a very crediblescenario.Whereitislackingisthattheunderlyingstockwillhavemorethantwopossiblefinalprices.
Stock price uSOption value VuProbability q
Stock price SOption value V0
Stock price dSOption value VdProbability 1 - q
Stock price uuSOption value VuuProbability q2
Stock price udSOption value VudProbability 2q[1 – q]
Stock price ddSOption value VddProbability [1 – q]2
Fig. 8.2 Binomial with two sub-intervals(Source: http://people.exeter.ac.uk/gdmyles/Books/IA.pdf)
Having introduced the method of risk-neutral valuation, the task of relaxing this restriction and moving to a more convincingenvironmentisnotatalldifficult.
Awiderrangeoffinalpricescanbeobtainedbybreakingthetimeperiodbetweenpurchaseoftheoptionandtheexpiration date into smaller sub-intervals and allowing the stock price to undergo a change over each sub-interval. Aslongastherateofreturnfortherisk-freeassetandtheproportionalchangesinthestockpricearedefinedrelativeto the length of each sub-interval, the use of risk-neutral valuation can be directly extended to this setting.
Consider Fig. 8.2 which shows the period between purchase and expiration broken into two sub-intervals. Starting withanunderlyingstockpriceofS,attheendofthefirstsub-intervalthepricewilleitherbe or . In terms of the risk-neutral probabilities, these will occur with probabilities and respectively. Starting from the price
,itispossibletoreachafinalpriceattheendofthesecondintervalofeither or . As the probability ofanotheruisqandofadis1−q,thesefinalpricesmusthaveprobabilitiesq2and respectively. Similarly, starting from ,anotherdoccurswithprobability1−qandauwithprobabilityq.Hence,thefinalpriceddS is reached with probability and with probability . However, , so the central price at the expiration date can be reached in two different ways with total probability of arrival given by
.Therisk-free(gross)return,R,isdefinedasthereturnovereachsub-interval.HencethereturnovertheperiodisR2.Thiscompletestheconstructionofthefigure.
Investment Analysis and Portfolio Management
114/JNU OLE
The value of the option canbeobtainedintwodifferentways.Thefirstwayistouseatwo-stepprocedurewhich employs risk-neutral valuation to find and using the expiration values, and then uses these tofind . Although not strictly necessary for a European option, it is worth working through these two steps since this method is necessary when American options are valued. The second way to value the option is to apply risk-neutral valuation directly to the expiration values using the compound probabilities. Both give the same answer. To applythetwo-stepprocedure,assumeweareattheendofthefirstsubinterval.Thepriceoftheunderlyingstockiseither or . If it is , then applying the value of the option must be:
Similarly,ifthepriceoftheunderlyingstockattheendofthefirstsub-intervalis , the value of the option is:
Nowmovetotheverybeginningofthetree.Attheendofthefirstsub-intervaltheoptioniswortheither or . Applying risk-neutral valuation, the value of the option at the purchase date must be:
Substituting this expression gives:
This is the fair value of the option at the purchase date. It should also be clear that this is the result that would have been obtained by applying risk-neutral valuation directly to the values at the expiration date, using the risk-neutral probabilities given in the binomial tree.
8.4.3 The General BinomialThe process of either working back through the tree or applying risk-neutral valuation directly to the expiration values can be applied to a binomial tree with any number of sub-intervals. A general variant of the binomial formula is now obtained that applies whatever number of sub-intervals the period is divided into. To derive this, note that in the occurrence of a q in the expression matches the occurrence of a u (and a matches a d). Furthermore, thecoefficientsonthevaluesatexpirationare1,1fortheone-intervalcaseand1,2,1forthetwo-intervalcase.These are the terms in the standard binomial expansion. Using these observations, the valuation formula for a period divided into n sub-intervals can be immediately derived as:
It is easy to check that for n = 1 and n = 2 this gives the results already derived directly.
8.4.4 Matching to DataThe next question to be addressed is how to make the formula into a result that can be applied in a practical context. To evaluate the formula, we need to supply values for S, E, R, n and q. The underlying stock price S and the risk-free return R can be obtained directly from market data. The exercise price E is written into the option contract. The number of intervals, n, is chosen to trade-off accuracy against ease of computation. All that is unknown is q, the probability in the binomial tree.

115/JNU OLE
To motivate the approach taken to providing a value for q, recollect that the basic idea of the binomial tree is that the price of the underlying stock is random. Given a value of R, the value of q is determined by u and d. The values of u and d must be chosen to result in behaviour of the underlying stock price that mirrors that observed in the market place.Thisleadstotheideaoffixinguanddtoprovideareturnandvarianceoftheunderlyingstockpriceinthebinomial model that equals the observed variance of the stock in market data.
Let the observed expected return on the stock be r and its variance be .Eachoftheseisdefinedoverthestandardperiod of time. If the time length of each interval in the binomial tree is , the expected return and variance on the stock over an interval are and . If at the start of an interval the stock price is S, the expected price at the end of the interval using the observed return is . Matching this to the expected price in the binomial model gives:
Here it should be noted that, these are the probabilities of the movements in the statistical model and not the risk-neutral probabilities. Solving this shows that to match the data:
Over an interval in the binomial tree, the return on the underlying stock is with probability p and with probability . The expected return is therefore, . The variance in the binomial model, _sb, can then be calculated as . Equating this variance is to the observed market variance gives:
Substituting for p and ignoring terms involving powers of and higher, a solution of the resulting equation is:
These values can then be used to parameterise the binomial model to match observed market data.
8.5 Options in Futures Contracts AnotherfinancialderivativeproducttradedinNewYorkandLondonforexampleisoptionsonfuturecontracts.These contracts are presently traded in Europe and America, in Treasury bonds, Treasury Notes and Euro-dollar deposits. Calls and puts in the above futures are traded. A call position if exercised, will lead to a long position in the cash market. A put option, if exercised will lead to a short position in the cash market. If not exercised, only cash differences are paid and received by the buyer and seller respectively. The cost of such deals includes the premium paid and the limited margins that have to be deposited for dealing in Futures. By using options trading, the futures market provides high risk speculation for those whose speculative instinct is high. Futures market has an element of speculation although lack of delivery by itself is not speculative, but that futures prices may differ widely from its price in cash market at the time of settlement, is itself risky and speculative.
8.6 Introduction to SwapsIn1981,IBMandtheWorldBankundertookanexchangeoffixedratedebtforfloatingratedebt.Thisexchangewas the start of the interest rate swap industry. It is now estimated that the market is worth over $50 trillion per year. However,itisdifficulttoprovideaprecisevaluationofthesizeofthemarketbecausethemarketisnotregulatedandswapsarearrangedbetweenindividualpartiesandnotthroughexchanges.Thefinancialswaps,wewillconsiderareagreementstoexchangeonesequenceofcashflowsoverafixedperiodforanothersequenceofcashflowsoverthesameperiod.ThisispreciselywhatIBMandtheWorldBankdid.Thetwosequencesofcashflowsaretiedtoeither to a debt instrument or to a currency.
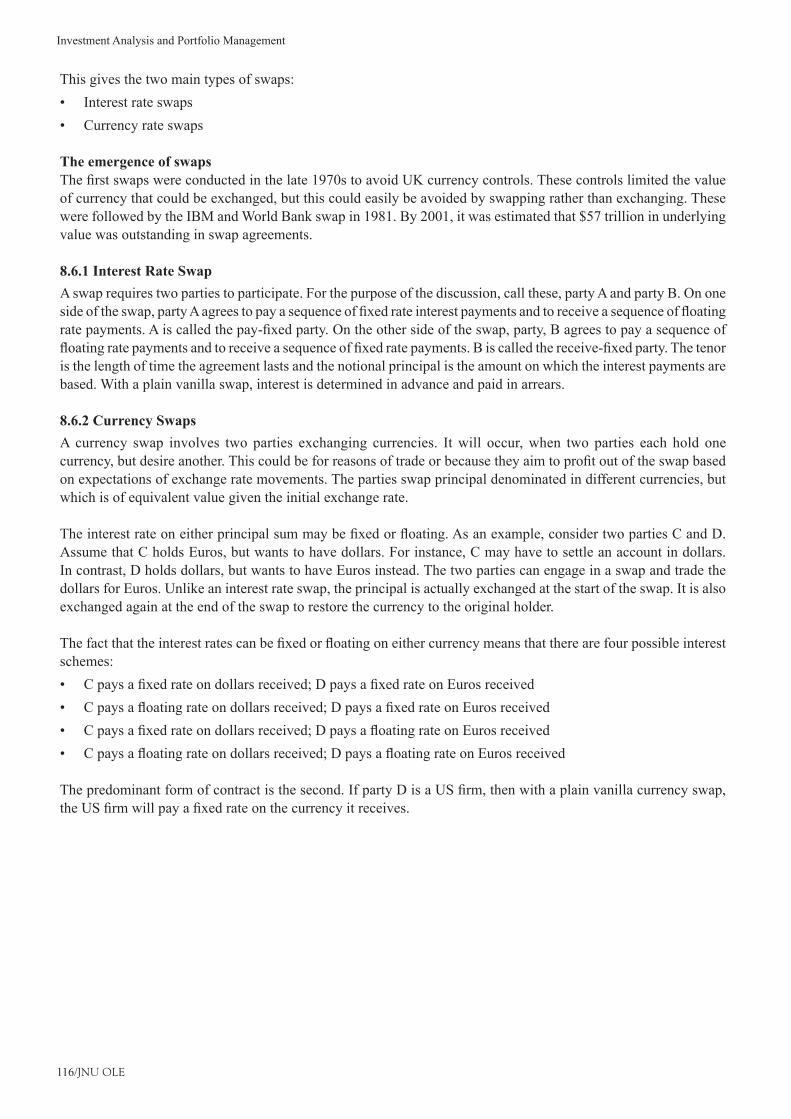
Investment Analysis and Portfolio Management
116/JNU OLE
This gives the two main types of swaps:Interest rate swaps•Currency rate swaps•
The emergence of swapsThefirstswapswereconductedinthelate1970stoavoidUKcurrencycontrols.Thesecontrolslimitedthevalueof currency that could be exchanged, but this could easily be avoided by swapping rather than exchanging. These were followed by the IBM and World Bank swap in 1981. By 2001, it was estimated that $57 trillion in underlying value was outstanding in swap agreements.
8.6.1 Interest Rate SwapA swap requires two parties to participate. For the purpose of the discussion, call these, party A and party B. On one sideoftheswap,partyAagreestopayasequenceoffixedrateinterestpaymentsandtoreceiveasequenceoffloatingratepayments.Aiscalledthepay-fixedparty.Ontheothersideoftheswap,party,Bagreestopayasequenceoffloatingratepaymentsandtoreceiveasequenceoffixedratepayments.Biscalledthereceive-fixedparty.Thetenoris the length of time the agreement lasts and the notional principal is the amount on which the interest payments are based. With a plain vanilla swap, interest is determined in advance and paid in arrears.
8.6.2 Currency SwapsA currency swap involves two parties exchanging currencies. It will occur, when two parties each hold one currency,butdesireanother.Thiscouldbeforreasonsoftradeorbecausetheyaimtoprofitoutoftheswapbasedon expectations of exchange rate movements. The parties swap principal denominated in different currencies, but which is of equivalent value given the initial exchange rate.
Theinterestrateoneitherprincipalsummaybefixedorfloating.Asanexample,considertwopartiesCandD.Assume that C holds Euros, but wants to have dollars. For instance, C may have to settle an account in dollars. In contrast, D holds dollars, but wants to have Euros instead. The two parties can engage in a swap and trade the dollars for Euros. Unlike an interest rate swap, the principal is actually exchanged at the start of the swap. It is also exchanged again at the end of the swap to restore the currency to the original holder.
Thefactthattheinterestratescanbefixedorfloatingoneithercurrencymeansthattherearefourpossibleinterestschemes:
Cpaysafixedrateondollarsreceived;DpaysafixedrateonEurosreceived•Cpaysafloatingrateondollarsreceived;DpaysafixedrateonEurosreceived•Cpaysafixedrateondollarsreceived;DpaysafloatingrateonEurosreceived•Cpaysafloatingrateondollarsreceived;DpaysafloatingrateonEurosreceived•
Thepredominantformofcontractisthesecond.IfpartyDisaUSfirm,thenwithaplainvanillacurrencyswap,theUSfirmwillpayafixedrateonthecurrencyitreceives.
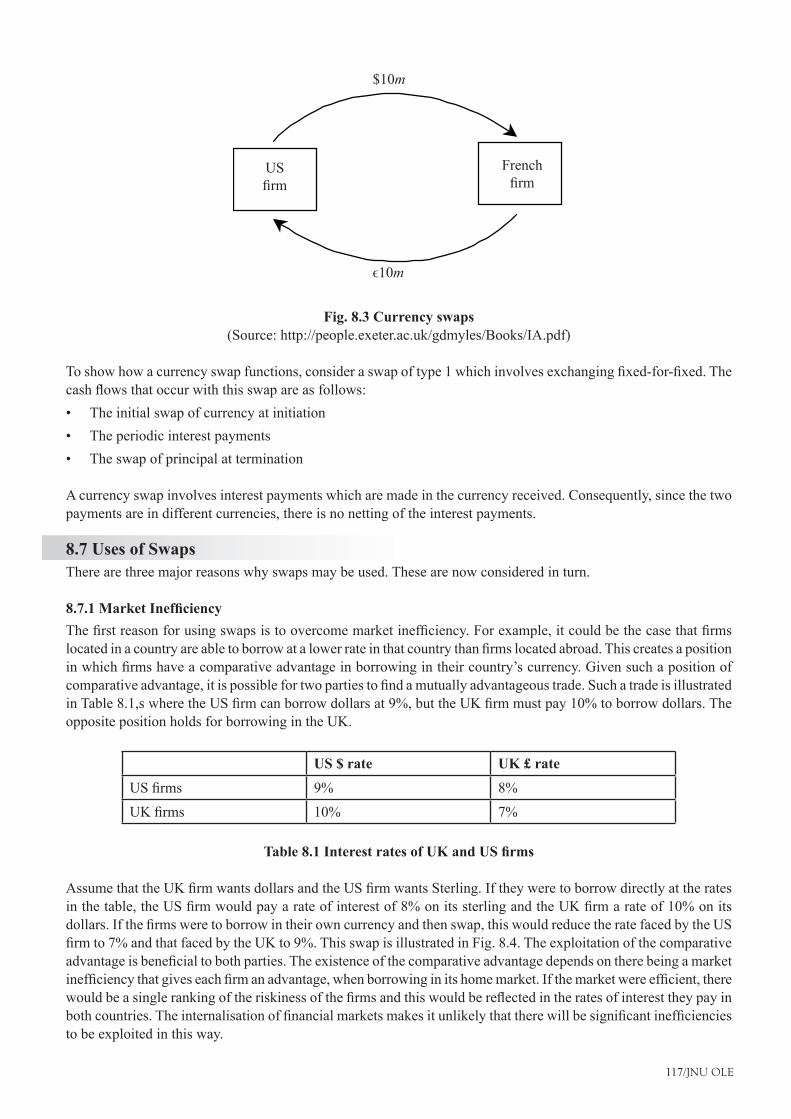
117/JNU OLE
$10m
ϵ10m
USfirm
Frenchfirm
Fig. 8.3 Currency swaps(Source: http://people.exeter.ac.uk/gdmyles/Books/IA.pdf)
Toshowhowacurrencyswapfunctions,consideraswapoftype1whichinvolvesexchangingfixed-for-fixed.Thecashflowsthatoccurwiththisswapareasfollows:
The initial swap of currency at initiation•The periodic interest payments•The swap of principal at termination•
A currency swap involves interest payments which are made in the currency received. Consequently, since the two payments are in different currencies, there is no netting of the interest payments.
8.7 Uses of SwapsThere are three major reasons why swaps may be used. These are now considered in turn.
8.7.1 Market InefficiencyThefirstreasonforusingswapsistoovercomemarketinefficiency.Forexample,itcouldbethecasethatfirmslocatedinacountryareabletoborrowatalowerrateinthatcountrythanfirmslocatedabroad.Thiscreatesapositioninwhichfirmshaveacomparativeadvantageinborrowingintheircountry’scurrency.Givensuchapositionofcomparativeadvantage,itispossiblefortwopartiestofindamutuallyadvantageoustrade.SuchatradeisillustratedinTable8.1,swheretheUSfirmcanborrowdollarsat9%,buttheUKfirmmustpay10%toborrowdollars.Theopposite position holds for borrowing in the UK.
US $ rate UK £ rate
USfirms 9% 8%
UKfirms 10% 7%
Table 8.1 Interest rates of UK and US firms
AssumethattheUKfirmwantsdollarsandtheUSfirmwantsSterling.Iftheyweretoborrowdirectlyattheratesinthetable,theUSfirmwouldpayarateofinterestof8%onitssterlingandtheUKfirmarateof10%onitsdollars.Ifthefirmsweretoborrowintheirowncurrencyandthenswap,thiswouldreducetheratefacedbytheUSfirmto7%andthatfacedbytheUKto9%.ThisswapisillustratedinFig.8.4.Theexploitationofthecomparativeadvantageisbeneficialtobothparties.Theexistenceofthecomparativeadvantagedependsontherebeingamarketinefficiencythatgiveseachfirmanadvantage,whenborrowinginitshomemarket.Ifthemarketwereefficient,therewouldbeasinglerankingoftheriskinessofthefirmsandthiswouldbereflectedintheratesofinteresttheypayinbothcountries.Theinternalisationoffinancialmarketsmakesitunlikelythattherewillbesignificantinefficienciesto be exploited in this way.

Investment Analysis and Portfolio Management
118/JNU OLE
8.7.2 Management of Financial RiskSwapscanbeusedtomanagefinancialrisk.Thisisclearestwhenassetsandliabilitiesaremismatched.TheUSSavings and Loans provide a good example of the possibility of risk management using swaps. These institutions receivedepositsfromsaversandusethefundstoprovideloansforproperty.Thesavingsandloanspayfloatingrateinterestondeposits,buttheyreceivefixedrateinterestontheloanstheygrant.Astheloansareforproperty,they are generally very long-term.
$15m
£10m
£10m$15m
USfirm
LenderUS
UKfirm
LenderUK
Fig. 8.4 Exploiting comparative advantage(Source: http://people.exeter.ac.uk/gdmyles/Books/IA.pdf)
Thisplacesthesavingsandloansinaposition,wheretheyareexposedtoriskifthefloatinginterestraterises.Sucha rise would create an increase in their payments to depositors, but would not be accompanied by any increase from the long-term loans. Precisely this position was responsible, at least in part, for the collapse of a number of these institutions in the 1980s.
8.7.3 SpeculationExpressed in the simplest terms, a swap is a no more than a bet on the direction of interest rate and/or exchange ratemovements.Ifthemovementisintherightdirection,aprofitcanbeearned.Swapscanthereforebeusedforpurely speculative reasons.
8.8 Swap marketThis section discusses the major features of the swap market and the participants in that market.
8.8.1 FeaturesThe major features of the swap market are as follows:
There is no publicly observable marketplace. Swaps are transactions that take place either between individuals •directly, between individuals with the intermediation of a broker, or with a swap dealer. Brokers and dealers are discussed further below.Thereislimitedgovernmentregulation.Asthereisnomarketplace,itisdifficultforanygovernmenttoprovide•regulation. There has been some recent discussion of regulation.
8.8.2 Dealers and BrokersForanyonewishingtoconductaswap,thereistheproblemoffindingthecounterparty.Forotherderivatives,suchas options and futures, this is less of a problem since there are organised exchanges to assist with transactions. In the early days of the swap market, counterparties to a swap were originally found via a broker. The market has developed, sothatswapsarenowgenerallyconductedthroughdealers.Thishasincreasedtheefficiencyoftheswapmarket.
119/JNU OLE
Swap brokerA swap broker acts as an intermediary in the market. Their role is to match swap parties who have complementary needs. A broker maintains a list of clients who are interested in entering into swap deals and tries to match the needs oftheclients.However,becauseitisnecessaryforabrokertofindmatchingclientsbeforeanytradecantakeplace,theorganisationofamarketthroughbrokersdoesnotmakeforaveryefficientmarket.
Swap dealerAswapdealeractsascounter-partytoaswap.Theycanbeoneithersideofthedeal.Theprofitofaswapdealerisobtained by charging a spread between the two sides of the deal. The dealer accumulates a swap book. The book is constructed with the aim of balancing trades to limit risk. The risks faced by a swap dealer are as follows:
Default risk: The party on the other side of a swap may default.•Basis risk: The basis risk arises from movements in interest rates.•Mismatch risk: Mismatch risk arises from the two sides of the dealers swap book not being balanced.•
8.9 Valuation of SwapsThe process of valuation relates to answering two related questions. How a swap is correctly priced? How can the deal be fair for both parties? As an example, consider a plain vanilla interest rate swap. The party on one side of thisswapwillpaythefloatingLIBORrate,whilethepartyontheothersidepaysafixedrateofinterest.Theonlyvariableinthistransactionthatcanbeadjustedtomakethedealfairforbothpartiesisthefixedrate.Bymakingthishigher,theyreceive-fixedpartybenefits.Makeitlowerandtheypay-fixedpartybenefits.
Thefundamentalissueistodeterminewhatfixedrateshouldbeusedtomakethedealfair.Here,fairmeansthatboth parties see the swap as equally advantageous at the time at which it is agreed. Before proceeding to determine thefixedrate,itisworthlookingathowswapsarerelatedtobondportfolios.Thereasoningisthesameasthatapplied to options and forwards. The swap is constructed, so that there are no arbitrage opportunities. Both of the earlier derivatives were priced by constructing a replicating portfolio that gave the same payoffs as the derivative. Applying the arbitrage argument then means the price of the derivative must be the same as the cost of the replicating portfolio. The same basic logic can be applied to swaps, where bonds can be used to replicate the position of a party who has entered a swap deal.
8.9.1 Replication and ImplicationsReplication and implications are discussed in the paragraphs given below.
ReplicationDefinition:Afloatingratenoteisabondthatpaysafloatingrateofinterest(LIBORforthisanalysis)
Interest rate swaps•Plainvanillareceive-fixed.Thisisequivalentto: �-a long position in a bond -ashortpositioninafloatingratenote
Example:A6%corporatebondwithannualcouponmaturity4years,marketvalueof$40mtradingatpar.Afloatingratenote,$40mprincipal,paysLIBORannually,4yearmaturity.Theseflowsmatchthoseforaswapwithnotionalprincipalof$40mandafixedrateof6%.
Plain Vanilla Pay-Fixed. The swap is equivalent to:•Sellbond(goshort)afixed-couponbond �Buybond(golong)afloatingratenote �
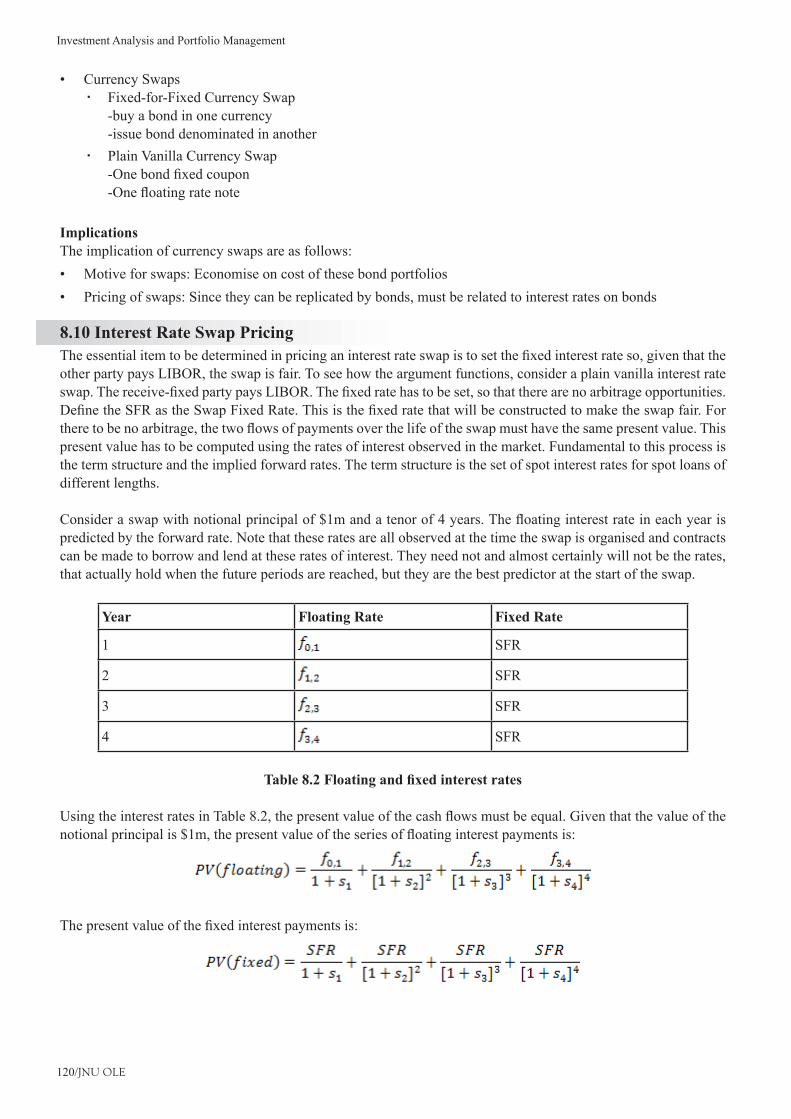
Investment Analysis and Portfolio Management
120/JNU OLE
Currency Swaps•Fixed-for-Fixed Currency Swap �-buy a bond in one currency -issue bond denominated in anotherPlain Vanilla Currency Swap �-Onebondfixedcoupon -Onefloatingratenote
ImplicationsThe implication of currency swaps are as follows:
Motive for swaps: Economise on cost of these bond portfolios•Pricing of swaps: Since they can be replicated by bonds, must be related to interest rates on bonds•
8.10 Interest Rate Swap PricingTheessentialitemtobedeterminedinpricinganinterestrateswapistosetthefixedinterestrateso,giventhattheother party pays LIBOR, the swap is fair. To see how the argument functions, consider a plain vanilla interest rate swap.Thereceive-fixedpartypaysLIBOR.Thefixedratehastobeset,sothattherearenoarbitrageopportunities.DefinetheSFRastheSwapFixedRate.Thisisthefixedratethatwillbeconstructedtomaketheswapfair.Fortheretobenoarbitrage,thetwoflowsofpaymentsoverthelifeoftheswapmusthavethesamepresentvalue.Thispresent value has to be computed using the rates of interest observed in the market. Fundamental to this process is the term structure and the implied forward rates. The term structure is the set of spot interest rates for spot loans of different lengths.
Consideraswapwithnotionalprincipalof$1mandatenorof4years.Thefloatinginterestrateineachyearispredicted by the forward rate. Note that these rates are all observed at the time the swap is organised and contracts can be made to borrow and lend at these rates of interest. They need not and almost certainly will not be the rates, that actually hold when the future periods are reached, but they are the best predictor at the start of the swap.
Year Floating Rate Fixed Rate
1 SFR
2 SFR
3 SFR
4 SFR
Table 8.2 Floating and fixed interest rates
UsingtheinterestratesinTable8.2,thepresentvalueofthecashflowsmustbeequal.Giventhatthevalueofthenotionalprincipalis$1m,thepresentvalueoftheseriesoffloatinginterestpaymentsis:
Thepresentvalueofthefixedinterestpaymentsis:
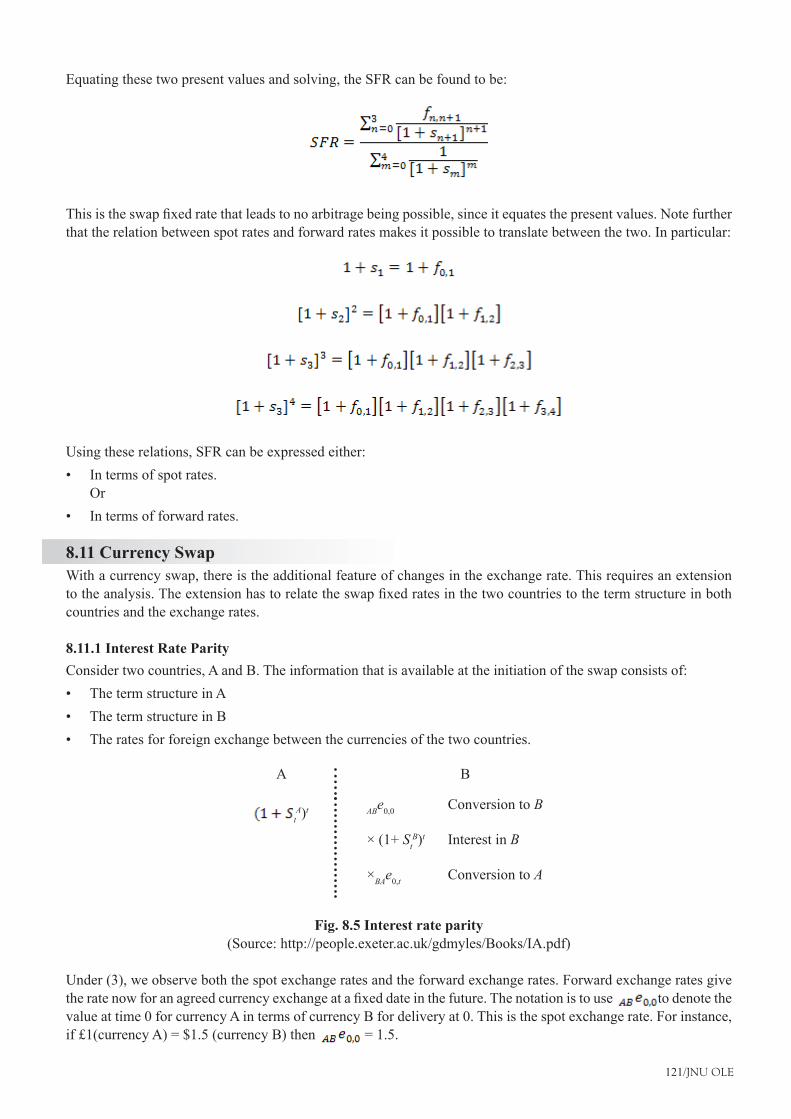
121/JNU OLE
Equating these two present values and solving, the SFR can be found to be:
Thisistheswapfixedratethatleadstonoarbitragebeingpossible,sinceitequatesthepresentvalues.Notefurtherthat the relation between spot rates and forward rates makes it possible to translate between the two. In particular:
Using these relations, SFR can be expressed either:In terms of spot rates. •OrIn terms of forward rates.•
8.11 Currency SwapWith a currency swap, there is the additional feature of changes in the exchange rate. This requires an extension totheanalysis.Theextensionhastorelatetheswapfixedratesinthetwocountriestothetermstructureinbothcountries and the exchange rates.
8.11.1 Interest Rate ParityConsider two countries, A and B. The information that is available at the initiation of the swap consists of:
The term structure in A•The term structure in B•The rates for foreign exchange between the currencies of the two countries.•
A B
tA)t ABe0,0 Conversion to B
× (1+ StB)t Interest in B
×BAe0,t Conversion to A
Fig. 8.5 Interest rate parity(Source: http://people.exeter.ac.uk/gdmyles/Books/IA.pdf)
Under (3), we observe both the spot exchange rates and the forward exchange rates. Forward exchange rates give theratenowforanagreedcurrencyexchangeatafixeddateinthefuture.Thenotationistouse to denote the value at time 0 for currency A in terms of currency B for delivery at 0. This is the spot exchange rate. For instance, if £1(currency A) = $1.5 (currency B) then = 1.5.
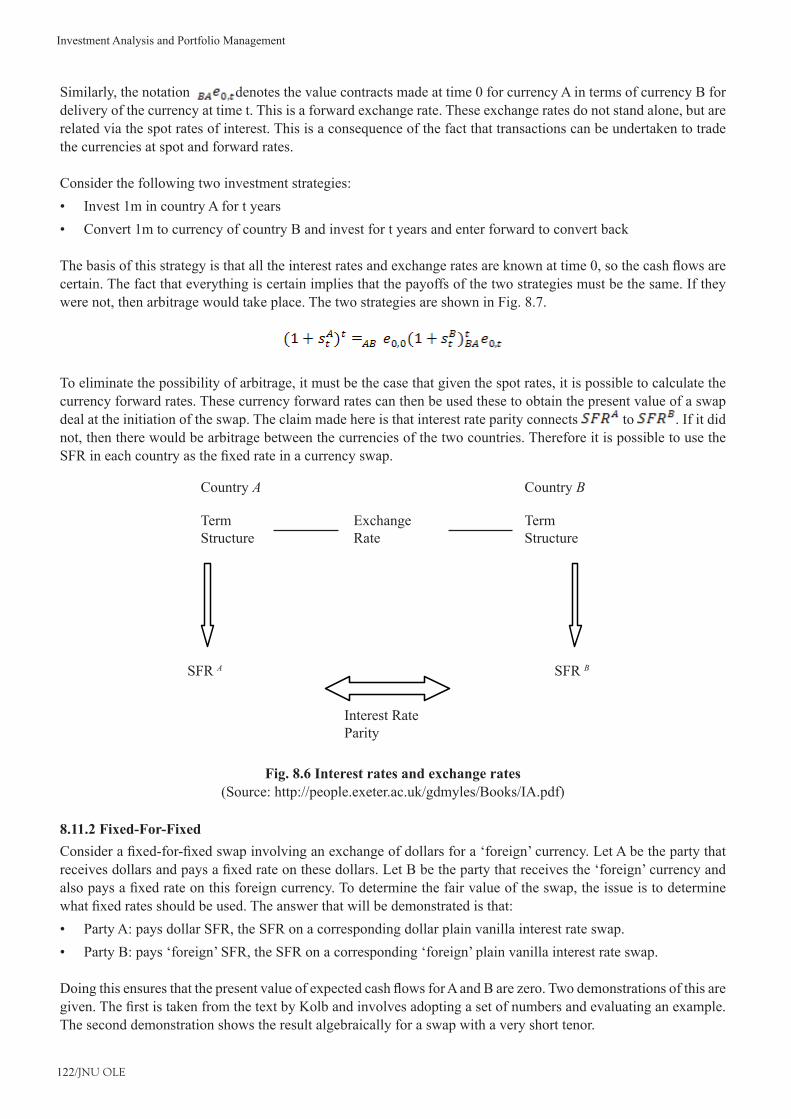
Investment Analysis and Portfolio Management
122/JNU OLE
Similarly, the notation denotes the value contracts made at time 0 for currency A in terms of currency B for delivery of the currency at time t. This is a forward exchange rate. These exchange rates do not stand alone, but are related via the spot rates of interest. This is a consequence of the fact that transactions can be undertaken to trade the currencies at spot and forward rates.
Consider the following two investment strategies:Invest 1m in country A for t years•Convert 1m to currency of country B and invest for t years and enter forward to convert back•
Thebasisofthisstrategyisthatalltheinterestratesandexchangeratesareknownattime0,sothecashflowsarecertain. The fact that everything is certain implies that the payoffs of the two strategies must be the same. If they were not, then arbitrage would take place. The two strategies are shown in Fig. 8.7.
To eliminate the possibility of arbitrage, it must be the case that given the spot rates, it is possible to calculate the currency forward rates. These currency forward rates can then be used these to obtain the present value of a swap deal at the initiation of the swap. The claim made here is that interest rate parity connects to . If it did not, then there would be arbitrage between the currencies of the two countries. Therefore it is possible to use the SFRineachcountryasthefixedrateinacurrencyswap.
Country A
TermStructure
SFR A SFR B
TermStructure
ExchangeRate
Interest RateParity
Country B
Fig. 8.6 Interest rates and exchange rates(Source: http://people.exeter.ac.uk/gdmyles/Books/IA.pdf)
8.11.2 Fixed-For-FixedConsiderafixed-for-fixedswapinvolvinganexchangeofdollarsfora‘foreign’currency.LetAbethepartythatreceivesdollarsandpaysafixedrateonthesedollars.LetBbethepartythatreceivesthe‘foreign’currencyandalsopaysafixedrateonthisforeigncurrency.Todeterminethefairvalueoftheswap,theissueistodeterminewhatfixedratesshouldbeused.Theanswerthatwillbedemonstratedisthat:
Party A: pays dollar SFR, the SFR on a corresponding dollar plain vanilla interest rate swap.•Party B: pays ‘foreign’ SFR, the SFR on a corresponding ‘foreign’ plain vanilla interest rate swap.•
DoingthisensuresthatthepresentvalueofexpectedcashflowsforAandBarezero.Twodemonstrationsofthisaregiven.ThefirstistakenfromthetextbyKolbandinvolvesadoptingasetofnumbersandevaluatinganexample.The second demonstration shows the result algebraically for a swap with a very short tenor.

123/JNU OLE
8.11.3 Pricing SummaryThisuseoftheSFRinafixed-for-fixedswapprovidestheinsightnecessarytounderstandtheinterestratesusedinother swaps. A convenient summary of the results is the following:
Fixed-for-Fixed: Both parties pay the SFR for the currency received.•Floating-for-Fixed:Thepay-floatingpartypaysLIBOR,andthepay-fixedpaysSFR(TheLIBORrateisthat•on the currency received).Fixed-for-Floating:Thepay-fixedpartypaysSFR,andthepay-floatingpaysLIBOR(TheLIBORrateisthat•on the currency received).Floating-for-Floating: Both parties pay the LIBOR on the currency received.•
Investment Analysis and Portfolio Management
124/JNU OLE
SummaryAn option is a contract that gives the holder the right to undertake a transaction, if they wish to do so.•Options have value and the rights to them are marketable.•There are two basic types of options.•The price at which the trade can take place is called the exercise or strike price.•Aplainvanillacalloptionistherighttobuyspecificsharesforagivenpricewithinaspecifiedperiod.•A European call can only be exercised at the time of expiration.•Aplainvanillaputoptionistherighttosellspecificsharesforagivenpricewithinaspecifiedperiod.•Options are traded on a wide range of exchanges.•The method of valuation is based on arbitrage arguments.•The single-period binomial model introduced a methodology for valuing options, but does not represent a very •credible scenario.In1981,IBMandtheWorldBankundertookanexchangeoffixedratedebtforfloatingratedebt.•Thefirstswapswereconductedinthelate1970stoavoidUKcurrencycontrols.•A swap requires two parties to participate.•A currency swap involves two parties exchanging currencies.•Swapscanbeusedtomanagefinancialrisk.•A swap broker acts as an intermediary in the market.•
ReferencesOptions Futures and Other Derivatives. • [Pdf] Available at: <http://raudys.com/kursas/Options,%20Futures%20and%20Other%20Derivatives%207th%20John%20Hull.pdf> [Accessed 07 July 2014].Forwards, Swaps and Futures. • [Pdf] Available at: <http://www.columbia.edu/~mh2078/FE04/for_swap_fut.pdf> [Accessed 07 July 2014].Das, S., 2006. • Derivative Products and Pricing: The Das Swaps and Financial Derivatives Library. John Wiley & Sons.Corb, H., 2013. • Interest Rate Swaps and Other Derivatives. Columbia University Press.What is a swap? - MoneyWeek Investment Tutorials. • [Video online] Available at: <https://www.youtube.com/watch?v=uVq384nqWqg> [Accessed 07 July 2014].CFA Level I Options Video Lecture by Mr. Arif Irfanullah part 1. • [Video online] Available at: <https://www.youtube.com/watch?v=PbRxVBTb-kQ> [Accessed 07 July 2014].
Recommended ReadingArditti, F. D., 1996. • Derivatives: A Comprehensive Resource for Options, Futures, Interest Rate Swaps, and Mortgage Securities. Island Press.Boberski, D., 2010. • CDS Delivery Option: Better Pricing of Credit Default Swaps. John Wiley & Sons. Flavell, R. R. , 2 0 1 2 . • Swaps and Other Derivatives. John Wiley & Sons.

125/JNU OLE
Self AssessmentWhich of the following is a contract that gives the holder the right to undertake a transaction, if they wish to 1. do so?
A swapa. An optionb. Marketc. Debt or Bondsd.
There are _______ basic types of options.2. twoa. fourb. fivec. threed.
Match the following3.
1. A plain vanilla call option A. Acts as counter-party to a swap.
2. A plain vanilla put option B. Acts as an intermediary in the market.
3. A swap broker C.Itistherighttosellspecificsharesforagivenpricewithinaspecifiedperiod.
4. A swap dealer D.Itistherighttobuyspecificsharesforagivenpricewithinaspecifiedperiod.
1-A, 2-D, 3-C, 4-Ba. 1-B, 2-A, 3-D, 4-Cb. 1-C, 2-B, 3-A, 4-Dc. 1-D, 2-C, 3-B, 4-Ad.
What is the price at which the trade can take place called?4. The basic or optional pricea. The exercise or strike priceb. The standard c or put pricec. The complex or underlying priced.
The asset for which there is an option to buy or sell is often called the ________ asset.5. underlyinga. basicb. complexc. maind.
Inwhichyear,theIBMandtheWorldBankundertookanexchangeoffixedratedebtforfloatingratedebt?6. 1956a. 1901b. 1981c. 1974d.

Investment Analysis and Portfolio Management
126/JNU OLE
Which of the following statement is true?7. Thefirstswapswereconductedinthelate1970stoavoidcurrencyUKcurrencycontrols.a. Thefirstswapswereconductedinthelate1940stoavoidcurrencyUKcurrencycontrols.b. Thefirstswapswereconductedinthelate1930stoavoidcurrencyUKcurrencycontrols.c. Thefirstswapswereconductedinthelate1920stoavoidcurrencyUKcurrencycontrols.d.
A currency swap involves __________ parties exchanging currencies.8. threea. twob. fourc. sixd.
Which of the following arises when the two sides of the dealers swap book is not balanced?9. Basis riska. Default riskb. Mismatch riskc. Non-payment riskd.
Which of the following statement is false?10. A swap requires four parties to participate.a. A currency swap involves interest payments which are made in the currency received.b. Swapscanbeusedtomanagefinancialrisk.c. The basis risk arises from movements in interest rates.d.
127/JNU OLE
Case Study I
An Analysis of Small Savings Schemes in India
AbstractThis case study aims at providing insights into the prevailing small savings schemes in India. At the same time, italsotakesalookatthefinancialaspectoftheschemesbasedontheirtaxrebate,post-taxreturns,tenureoftheschemes, etc. The decision, which scheme to invest in depends totally upon the liquidity needs of the investor. The decision to invest is also determined by the return offered by the scheme and its tax implications. Every scheme hasitsbenefitsfortheinvestor.
IssuesIssues are listed below:
UnderstandalltheaspectsofpostofficesavingsschemesinIndia.•Get some insight into which scheme is better for which age group, keeping their investment amount and time •horizon in consideration.Understand the tax implications and the post-tax effective rate of return.•Have an idea about how these schemes are interrelated.•
IntroductionIn India, there are multiple investment avenues available to meet the differing needs of investors. These investment options differ from each other based on their returns, maturity period, and the risk-taking capacity of the investors, amongotherthings.Intermsoftheirreturns,theycanbeclassifiedintohigh-returnandlow-returnclasses.However,risk and returns go hand-in-hand, the higher the risk involved, the higher the returns to be expected. Investors who aspire for higher returns have to bear a high-level of risk as well. An example is an investment made in the highly volatile stockmarket.As faras the timeaspectof the investment isconcerned, therearefinancial instrumentswhichareshort-terminnatureandtheseincludesavingsbankaccounts,moneymarketorliquidfunds,andfixeddepositswithbanks.Ontheotherhand,therearesomefinancialinstrumentswhichofferalong-termhorizonforinvestment.Theseincludepostofficesavings,PublicProvidentFund(PPF),companyfixeddeposits,bondsandmutual funds.
Small savings schemes in India are framed and enacted by the central government under the Government Savings BankAct,1873andGovernmentSavingsCertificateAct,1959.Smallsavingsschemescameintoexistenceafterindependence with the objective of providing safe and simple investment opportunities to the lower and middle incomegroups.Theseschemeswerechannelisedandadministeredbygovernmentinstitutions,suchaspostofficesand nationalised banks. With the same objective, the PPF was established in 1968 for individuals to save for their investments.
TherearevariousschemesofferedbytheGovernmentofIndia(GoI)throughpostofficesacrossthecountry.Theseschemesincludethepost-officeSavingsAccount,thepost-officeRecurringDepositAccount,thepost-officeTimeDepositAccount,thepost-officeMonthlyIncomeAccount,thepost-officePublicProvidentFundAccount,theKisanVikasPatra,theNationalSavingsCertificate,andtheSeniorCitizensSavingsScheme.Thematurityperiodoftheseschemes varies from very short as in the case of a savings deposit to over 15 years as in the case of PPF. However, alltheseinvestmentoptionscomeunderthesameriskclassasallofthemhavefixedreturnsandareguaranteedbythe GoI. The returns vary between schemes based on their features and maturity period.
The responsibility of promoting and mobilising small savings schemes rests with the National Savings Institute (NSI),adivisionoftheministryoffinance.TheNSImarketsthesmallsavingsschemesonanationwidebasisandprovides the government with feedback from customers.

Investment Analysis and Portfolio Management
128/JNU OLE
The small savings scheme program aims at promoting the savings habit and providing safe investment avenues to peoplewithlimitedincomeandsavingspotential.Theseschemesareoperatedthroughabout160,000postofficesacross the country. The PPF scheme is also operated through more than 8000 branches of public sector banks.
Monthly Income Scheme (MIS)ThepostofficeMonthlyIncomeScheme(MIS)providesformonthlypaymentofinterestincometoinvestors.
Recurring Deposit (RD)APostOfficeRecurringDepositAccount(RDA)isabankingserviceofferedbyIndiaPostatallpostofficecountersin the country.
Kisan Vikas PatraTheKisanVikasPatra(KVP)isanothersafeandsecureavenueforinvestmentfloatedbytheGoIunderthepostofficeschemes,accordingtoanalysts.
Public Provident Fund (PPF)PPF is one of the investment plans that suit salaried as well as self-employed people, according to experts.
National Savings Certificate (NSC)TheNationalSavingsCertificateschemeisanotheroptioninthegovernmentsavingsschemes,whichoffersataxadvantage to investors.
ConclusionThe decision regarding which scheme to invest in depends totally upon the liquidity-needs of the investor.
(Source: An Analysis of Small Savings Schemes in India. [Pdf] Available at: <http://www.icmrindia.org/casestudies/catalogue/Finance/FINC067.htm> [Accessed 04 July 2014]).
QuestionsWhat are the issues of small saving schemes?1. AnswerIssues are as follows:
UnderstandalltheaspectsofpostofficesavingsschemesinIndia.•Get some insight into which scheme is better for which age group, keeping their investment amount and •time horizon in consideration.Understand the tax implications and the post-tax effective rate of return.•Have an idea about how these schemes are interrelated.•
Who frames and enacts small savings schemes in India?2. AnswerSmall savings schemes in India are framed and enacted by the central government under the Government Savings BankAct,1873,andGovernmentSavingsCertificateAct,1959.
What are the various schemes offered by theGovernment of India (GoI) through post offices across the3. country?AnswerTherearevariousschemesofferedbytheGovernmentofIndia(GoI)throughpostofficesacrossthecountry.Theseschemesincludethepost-officeSavingsAccount,thepost-officeRecurringDepositAccount,thepost-officeTimeDepositAccount,thepost-officeMonthlyIncomeAccount,thepost-officePublicProvidentFundAccount,theKisanVikasPatra,theNationalSavingsCertificateandtheSeniorCitizensSavingsScheme.
129/JNU OLE
Case Study II
Calculating the Risks in Making Investment Decisions
IntroductionInvestment decisions involve weighing up the risks and the likely rewards of various options. It is often the riskiest alternatives that yield the highest possible gains, while the least risky options may yield smaller rewards. Business decision-makers therefore have to weigh up risk so as to provide the most suitable rewards for stakeholders including shareholdersandcustomers.Thestartingpointisacompany’soverallaim,whichthenfiltersdownintoastrategy,creating a balanced portfolio made up of numerous investments.
This case study examines the processes involved in weighing up risks in order to create a balanced portfolio at BG Group, one of the leading energy businesses in the UK. The case study illustrates typical stages involved in decidingwhethertobidfortherighttoexploreforanddevelopnewgasfieldsand,importantly,howmuchtobid.Before weighing up the risks, ethics is an integral part of BG Group’s considerations, i.e., making morally correct decisions, whether these be concerned with environmental issues, health and safety or any other decision involving the difference between ‘right and wrong’ behaviour. In other words, the ‘best’ investment decision will balance economic, social and environmental considerations.
More than just financeEthical decisions are integral in making investment decisions. BG Group’s Statement of Business Principles sets out the fundamental values and ethical principles within which the Company operates. BG Group will only enter countries, where the Company can operate in accordance with its Business Principles. The following example givesanoutlineoftheimportantstatisticalandfinancialproceduresinvolvedinmakinganinvestmentdecision.However,itisimportanttoemphasisetheweightgiventonon-financialfactorsinvolvedindecision-making.Gasisthe cleanest fossil fuel, but any form of energy production involves some form of environmental cost, e.g., the sight ofwindfarmslocatedinfields,orharmfulreleaseofgreenhousegases,whenburningfossilfuels.BGGroupwillonly bid to explore, if it can operate within its ethical guidelines. The company always seeks to apply its business principles.Thiscansometimesbedifficult,sincenaturalgasresourcesarefoundincountriesatdifferentstagesofeconomic, environmental, political and social development.
BG GroupThe gas industry is today in the private and public sector and there are a number of companies competing in the industry. Some of these companies are government-owned. Others are owned by private shareholders who appoint directors to represent their interest. The directors appoint professional managers to run the business. Like electricity and telecommunications, gas is a ‘network industry’. In the case of gas, consumers are linked to a central network of gas pipelines. Group is an integrated business in that it has activities across the whole range of gas operations, fromthereservoirtothecustomer.BGGroup’sExplorationandProduction(E&P)businessfindsanddevelopsgasreserves. Natural gas is delivered to customers either by BG Group’s Transmission and Distribution (T&D) business usingpipelinesorbytheLiquefiedNaturalGas(LNG)businessviaLNGships.BGGroup’spowerbusinessfocuseson thecreationofelectricitybynaturalgas-firedpowergenerationplants.The illustrationshowsthegaschainindicatingthevariouslinksinanintegratedbusinessinvolvedinbringinggastofinalconsumers.
Demand for gas is projected to grow at an increasing rate over the next decade, outstripping the growth in demand for other major sources of energy. As an energy source, gas is a relatively clean fossil fuel, abundant and is increasingly becoming the fuel of choice for consumers, on both environmental and economic grounds.
Investment Analysis and Portfolio Management
130/JNU OLE
Field developmentThe gas business has a number of characteristics that are particularly important in relation to investment decision-making:
It is very capital-intensive, so that decisions may typically involve spending several hundred million pounds.•There are long lead times between the start of a project and the receipt of earnings from that project, typically •overfiveyearsfromfirstinvestmenttofirstrevenue.Thetaxationandcontractstructureisuniquetotheenergyindustryandiscomplex.Gasisafiniteresourcefor•a nation. Its exploitation is of strategic importance to the host government for some time.
Government owns the rights to minerals found on land (onshore) and under water (offshore) in their countries. Governments divide the ground into exploration ‘blocks’ and invite energy companies to bid for the right to explore for oil and gas in those blocks. To earn the right to explore a block, the energy company commits to a work programme, whichdescribesthestepsitwilltakeinordertofindoil/gas.Theenergycompany’sinvestmentandexpertisehelpsgovernments access the mineral wealth beneath the ground. BG Group makes important decisions as to whether or nottoapplyfortherighttoexplorefornewgasfieldsandhowmuchtobid.
Key risksShown below are some of the key risks in a typical gas project and the experts responsible for addressing those risks:
Geologistsandgeophysicistsevaluatetherisksaroundvolumeandthechanceoffindingthosevolumes.•Engineers examine facility and well design, costs, production rates.•HSSE managers assess health, safety, security and environmental risks.•Economists analyse market demand and price, government and partner commercial terms.•
Investment appraisalDiscountedcashflowisanimportanttechniqueforinvestmentappraisal.Thediscountedcashflowapproachisawayof valuing the future returns on investment by assessing the values of these returns in terms of their value today. It placesemphasisonthecostoffundstiedupinaprojectbyconsideringthetimingofcashflows.Forexample,weall instinctively know that £1 in the hand today is worth more than a promise of £1 in the future. This is because:
Inflationmaylowertherealvalueofmoney.•The money cannot be put to constructive use in the meantime (i.e., earning interest in the bank or applied to •another project).There is always the risk that unforeseen circumstances will prevent you receiving the amount you have been •promised.
AppraisinginvestmentsusingthediscountedcashflowmethodallowstheCompanytoundertakeacapitalallocationprocess, which involves ranking projects and selecting those that add the most value to the Company. It therefore incurs theopportunitycostof thoseprojects that addvalue,but cannotbefinancedas sufficient fundsarenotavailable to undertake them.
Ultimately,thevalueofanyinvestmentisthepresentvalueofthefuturefreecashflows,NetPresentValue(NPV)thattheinvestmentisexpectedtogenerate.Therefore,itisnecessarytoforecasttheeconomiccashflowsanddiscountthem appropriately to allow for the fact that they will not be received, until sometime in the future. BG Group uses adiscountratethatreflectsthereturnitsinvestors(shareholdersandbanks)expectforinvestinginanon-riskfreeactivity (compared to depositing money in a bank account). The NPV calculation always assumes the project is a success.However,thereisachancethatnooilorgasispresent(geologicalrisk),thisriskmustthereforebereflectedin the valuation. This is achieved by assigning probabilities to the values of successful and unsuccessful outcomes. The sum of these risked values is the Expected Monetary Value (EMV).
131/JNU OLE
EMV calculation can be illustrated by a decision tree. Decision trees are a simple way of choosing from alternative courses of action when faced with uncertainty. The basic procedure for constructing a decision tree is to set out a series of alternative branches of the tree and then to calculate the probability of the event occurring and the likely money value of the return. In a decision tree, it is possible to distinguish between points of decision and points where chance and probability (uncertainty) may come into play. For example, this process can be used to illustrate possiblereturnsfromdrillingawellandthenexploitingagasfield.
The inputs from geologists, engineers and others underpin the economic analysis and ultimately the calculation of value. These inputs relate to both internal and external data:
Internal-technical data relating to the costs involved in developing the block, e.g., the costs of building and •developing the gas platforms, likely volume and quality of hydrocarbons.External-commercial data about the future demand for, and price of, gas as well as likely tax changes, and •information about local markets and other data.
Economistscanthendevelopmodelsprojectingthelikelycostsandrevenuesofdevelopingnewfields.Essentialcomponents of these models are as follows:
Revenues (price x volume)•Costs•Government take (e.g., taxes because the blocks that companies bid for are government property). Revenues •lesscosts,lessgovernmenttake=thenetcashflowswhicharediscountedtogivetheNPV.
BG Group then uses all of this information to calculate the EMV of decisions. The EMV is equal to: EMV = (NPV of success x chance of success) plus (NPV of failure x chance of failure)
The following example uses estimated returns expected from BG Group committing itself to drilling one exploration well. The net present cost will be £16m. There is a 16% chance that the three year project will be a success, yielding a return at NPV of £114m.
First of all, we work forward across the diagram from the decision fork, where the choice is: ‘drill exploration •well’ or ‘don’t drill exploration well’.Next, we set out the probabilities of gas being discovered and the NPV of success or failure (these are based on •the geologists’ and economists’ calculations).If the well is not drilled, there will be a return of £0. If the exploration well is drilled and no gas is found there •will be a loss of £16m. There is an 84% chance of this being the case.If the exploration well is drilled and gas is found there will be a gain of £114m. There is a 16% chance of this •happening.
WecannowworkouttheEMV,ifthedecisionismadetogoaheadwithexploitingthefield.Therefore,onariskedbasis drilling the well is attractive on economic grounds in that it generates a positive EMV. The opportunity would be presented to management to compete for funds in the capital allocation process.
Portfolio considerationsAt this phase of the investment decision, a number of factors must be considered. The overriding goal of the company is to create shareholder value. In order to achieve the optimal growth for an acceptable level of risk, the company invests on a portfolio basis. This means that it will invest in a number of different wells and at times share the costs and working interest with partners in order to improve the risk/reward balance and stay within a budget.
As the returns of these individual wells are likely to be uncorrelated or weakly correlated (e.g., failure in one exploration well is unlikely to affect the chance of success of another), the risk of the overall portfolio is lower than that of an individual well. This is especially important at the exploration stage due to the high risk of failure. In additiontothisideaofinvestinginprojectswhichhelptoreducetheoverallriskprofileoftheCompany,decisionmakersmustconsiderthestrategicfittothecurrentbusinessandwherethecompany’sskillsandexpertiselie.Onlyafter considering all of these factors can a decision be made on whether or not to invest in a particular project.

Investment Analysis and Portfolio Management
132/JNU OLE
ConclusionThe gas market is an exciting one to be involved in. The world’s demand for energy is growing rapidly and it is imperative that it is supplied with clean energy reserves by principled companies. BG Group is a major world player in this market and it constantly needs to make the right sorts of investment decisions, which balance the needs of global consumers, its shareholders, the communities in which it operates governments and other stakeholders.
(Source: Calculating the Risks in Making Investment Decisions. [Pdf] Available at: <http://businesscasestudies.co.uk/bg-group/calculating-the-risks-in-making-investment-decisions/introduction.html#axzz379chmYsh> [Accessed 11 July 2014]).
QuestionsWhat do investment decisions involve?1. What does this case study examine?2. What are the key risks in a typical gas project and who are the experts responsible for addressing those risks?3.
133/JNU OLE
Case Study III
Investment Management at Harvard Management Company
AbstractThe case examines the investment management strategies adopted by the Harvard Management Company (HMC). HMC managed Harvard University’s endowment funds, the largest in the industry. The case explains the hybrid fund management strategy followed at HMC and how the strategy led to phenomenal growth of Harvard’s endowment funds over the decades. The case describes the investment performance of the endowment fund, asset allocation, portfolio mix and risk management strategies under various fund managers of HMC, since its inception. The case also explains the recent problems faced by HMC due to the frequent changes in its leadership and the sub-prime crisisthatemergedintheUSinlate2007resultinginsignificantlossesforHarvard’sendowmentfund.
IssuesIssues are given below:
Analyse the investment management strategies followed at HMC.•Appreciatetheimportanceofasset-allocationandportfolio-diversificationininvestmentmanagement.•Study the risk management practices at HMC.•Understand the pros and cons of hybrid investment management strategy.•
IntroductionOn February 17, 2009, 1,600 non-faculty employees of Harvard University (Harvard) received a crimson folder containingdetailsof theearly retirementbenefitsoffered to them.Earlier,onFebruary11,2009,Harvardhadannounced the eligibility4 criteria for those employees who would be offered early retirement.
The objective of the move was to save on operating expenses. The University also announced other cost-cutting measures that included budget cuts varying between 10% and 15% in all Harvard departments. Besides, it announced a 3.5% increase in tuition fees for the academic year 2009-10.
The University attributed these cost-cutting measures to the losses incurred by Harvard Management Company (HMC). HMC managed Harvard’s endowment funds, the largest in the industry. As of June 30, 2008, it managed assets worth US$ 36.9 billion. Harvard reported that the value of the assets had fallen by 22% in the four months of fiscal2008-09thatendedonOctober31,2008.ThelossesreportedinthiscasedidnotincludeHMC’sinvestmentsin real assets and private equity. Harvard depended on its endowment to fund more than one-third of its operational budget every year.
ItwithdrewUS$1.6billionfromitsendowmentfundinthefiscalyear2008thatendedonJune30,2008.Thismarked HMC’s largest ever endowment payout to the university. Harvard estimated a loss of 30% on the assets of HMCforthecurrentfiscalyearthatwouldendonJune30,2009.ThiswouldbetheworstlossreportedbyHMC,since 1974, when it had posted a loss of 12.2%. HMC announced that it would lay off 25% of its 200 employees as a part of its reorganisation and rebalancing strategy.
HMCwasregardedasoneofthemostprofitablemanagersofendowmentfunds(RefertoTableIforreturnsgeneratedbytopfourendowmentsintheUSforthefinancialyears2005to2008).
It consistently outperformed the average returns posted by the industry, which invested in similar asset classes in which HMC invested. For instance, HMC posted a positive return of 8.6% on its funds for the year ended June 2008 as compared to a 13% negative return posted by the S&P 500 index5 during the same period. HMC was renowned for its asset-allocation strategy. It followed a hybrid model in managing its funds.
Investment Analysis and Portfolio Management
134/JNU OLE
Background noteHMC was incorporated in 1974 to manage the endowments, pension assets, working capital, and non-cash gifts of Harvard.ItsobjectivewastoprovidefinancialsupporttotheoperationsofHarvard.Toconformtothatobjective,HMC’s Board and the management laid down the investment philosophy to allocate assets across various markets and asset classes in their efforts to generate the optimum rate of return in line with Harvard’s risk tolerance level. HMC also worked on the premise that in addition to earning income to support the activities of the University, it had to generate capital appreciation on the assets it held over a long-term.
Asset allocationHMC had managed the largest university endowment fund in the world, since its inception. (Refer to Exhibit IV for TopTenUniversityEndowmentsintheUSbytheEndofJune2008).Itfollowedawell-diversifiedasset-allocationstrategy.Forinstance,forthefiscalendedJune2008,HMChadinvestmentsin12non-cashassetclasses.
Fund management at HMCWalterCabot(Cabot)wasnominatedasthefirstPresidentandCEOforHMCin1974.HMC’sassetsgrewfromUS$ 1.3 billion in 1974 to US$ 4.7 billion in 1990 under his leadership. Cabot resigned from HMC after his 16-year tenure in 1990, when Meyer was nominated as his successor. Meyer led HMC between 1990 and 2005 and grew HMC’s asset value from US$ 4.7 billion to US$ 22.6 billion. HMC nominated Mohammed El-Erian (El-Erian) as successor to Meyer.
(Source: Investment Management at Harvard Management Company. [Pdf] Available at: <http://icmrindia.org/casestudies/catalogue/Finance/FINC056.htm> [Accessed 04 July 2014]).
QuestionsWhat does the case examine?1. What are the various issues of HMC?2. WhendidHarvardUniversityreceiveacrimsonfoldercontainingdetailsoftheearlyretirementbenefitsoffered3. to them?

135/JNU OLE
Bibliography
References21. Forwards and Futures. • [Video online] Available at: <https://www.youtube.com/watch?v=X_rfROvI9j4 > [Accessed 07 July 2014].22. Risk Aversion and the Capital Asset Pricing Theorem. • [Video online] Available at: <https://www.youtube.com/watch?v=K11CnF5vJ8o> [Accessed 07 July 2014].Advanced Bond Concepts. • [Pdf]Available at: <http://eco.ibu.edu.ba/assets/userfiles/mng/Reading_bond_advanced_investopia.pdf > [Accessed 07 July 2014].CFA Level I Options Video Lecture by Mr. Arif Irfanullah part 1. • [Video online] Available at: <https://www.youtube.com/watch?v=PbRxVBTb-kQ> [Accessed 07 July 2014].CFA Level I Portfolio Management An Overview Video Lecture by Mr. Arif Irfanullah Part 1. • [Video online] Available at: <https://www.youtube.com/watch?v=Bj11a3jHtCY> [Accessed 07 July 2014].CFA Level I Portfolio Management An Overview Video Lecture by Mr. Arif Irfanullah Part 2. • [Video online] Available at: <https://www.youtube.com/watch?v=Zxvxuct4w60> [Accessed 07 July 2014].CFA Level I Portfolio Risk and Return Part 2 A Video Lecture by Mr. Arif Irfanullah. • [Video online] Available at: <https://www.youtube.com/watch?v=J11dJ5zjULM> [Accessed 07 July 2014].Chandra, P., 2008. • Investment Analysis. 3rd ed., Tata McGraw-Hill Education, New Delhi.Chisholm, A. M., 2010. • DerivativesDemystified:AStep-by-StepGuidetoForwards,Futures,SwapsandOptions. John Wiley & Sons.Corb, H., 2013. • Interest Rate Swaps and Other Derivatives. Columbia University Press.Das, S., 2006. • Derivative Products and Pricing: The Das Swaps and Financial Derivatives Library. John Wiley & Sons.Fabozzi, F. J., 2007. • Bond Markets: Analysis And Strategies. Pearson Education India.Forward and Futures Prices. • [Pdf] Available at: <http://faculty.weatherhead.case.edu/ritchken/textbook/chapter2ps.pdf > [Accessed 07 July 2014].Forwards and Futures (CAPM). • [Pdf] Available at: <http://www.hss.caltech.edu/~pbs/bem103/JiangWangLN/JWCh10.pdf > [Accessed 07 July 2014].Forwards, Swaps and Futures. • [Pdf] Available at: <http://www.columbia.edu/~mh2078/FE04/for_swap_fut.pdf> [Accessed 07 July 2014].Guerard, J., 2013. • Introduction to Financial Forecasting in Investment Analysis. Springer Science & Business Media, New York.Haslem, J., 2009. • Mutual Funds: Risk and Performance Analysis for Decision Making. John Wiley & Sons.International Bond Markets: Pricing And Hedging (CAPM). • [Pdf] Available at: <http://www.bauer.uh.edu/rsusmel/7386/ln13.pdf > [Accessed 07 July 2014].Introduction to Investment Analysis. • [Video online] Available at: <https://www.youtube.com/watch?v=MoG8odEs4C4> [Accessed 07 July 2014].Investment Analysis and Portfolio Management.• [Pdf] Available at: <http://www.bcci.bg/projects/latvia/pdf/8_IAPM_final.pdf>[Accessed07July2014].Investment Analysis, Lecture 01 – Introduction. • [Video online] Available at: <https://www.youtube.com/watch?v=OsxFib1YY6g> [Accessed 07 July 2014].Investment Analysis. • [Pdf] Available at: <http://people.exeter.ac.uk/gdmyles/Books/IA.pdf> [Accessed 07 July 2014].Johnson, R. S., 2013. • Debt Markets and Analysis. John Wiley & Sons.Khan, A. and Zuberi, V., 1999. • Stock Investing for Everyone: Tools for Investing Like the Pros. John Wiley & Sons.
Investment Analysis and Portfolio Management
136/JNU OLE
Krantz, M., 2009. • Fundamental Analysis for Dummies. John Wiley & Sons.Levy, H., 2011. • The Capital Asset Pricing Model in the 21st Century. Cambridge University Press.Mayo, H., 2010. • Investments: An Introduction. Cengage Learning.Options Futures and Other Derivatives. • [Pdf] Available at: <http://raudys.com/kursas/Options,%20Futures%20and%20Other%20Derivatives%207th%20John%20Hull.pdf> [Accessed 07 July 2014].Pahl, N., 2009. • Principles of the Capital Asset Pricing Model and the Importance in Firm Valuation. BoD – Books on Demand.Part 2 - CAPM What is Capital Asset Pricing Model Explained (complete until end). • [Video online] Available at: <https://www.youtube.com/watch?v=LH2BpIs1EF0> [Accessed 07 July 2014].Poncet, P. and Lioui, A., 2005. • Dynamic Asset Allocation with Forwards and Futures. Springer Science & Business Media.Portfolio Management and the Capital Asset Pricing Model. • [Pdf]Available at: <file:///C:/Users/poojar/Downloads/9780387213750-c1.pdf> [Accessed 07 July 2014].Portfolio Management. • [Pdf] Available at: <http://www.psnacet.edu.in/courses/MBA/sapm/lecture-27.pdf> [Accessed 07 July 2014].Reilly, F. and Brown, K., 2011. • Investment Analysis and Portfolio Management. 1 0 t h e d . , Cengage Learning.Return on Investment Analysis. • [Pdf] Available at: <http://www.agileinsights.com/content/pdfs/mjeffery%20Handbook%20ROI%20Chapter%20v3.pdf> [Accessed 07 July 2014].Ses 13: Risk and Return II & Portfolio Theory I. • [Video online] Available at: <https://www.youtube.com/watch?v=tL7Lcl90Sc0> [Accessed 07 July 2014].Ses9:ForwardandFuturesContractsI.• [Video online] Available at: <https://www.youtube.com/watch?v=i_pLF9J3QPE> [Accessed 07 July 2014].StockandBondMarketCorrelation:HowtoHandleInflationinInvestmentAnalysis(1997).• [Video online] Available at: <https://www.youtube.com/watch?v=Xz1Z0tRFZ_s > [Accessed 07 July 2014].Stock Market Analysis in Practice: Is It Technical or Fundamental?. • [Pdf] Available at: <http://www.scienpress.com/Upload/JAFB/Vol%201_3_9.pdf> [Accessed 07 July 2014].Swensen, D. F., 2009. • Pioneering Portfolio Management. Simon and Schuster.Technical Analysis (Basics)|Investment Knowledge. • [Video online] Available at: <https://www.youtube.com/watch?v=1j3Pdj32RU4 > [Accessed 07 July 2014].Technical Analysis for Long-term Investors. • [Pdf] Available at: <http://www.clayallen.com/TALTI.pdf> [Accessed 07 July 2014].The Capital Asset Pricing Model (CAPM). • [Pdf] Available at: <http://people.stern.nyu.edu/ashapiro/courses/B01.231103/FFL09.pdf> [Accessed 07 July 2014].The Capital Asset Pricing Model. • [Pdf] Available at: <http://www.isye.umn.edu/courses/ie5441/pdf/Chapter-7.pdf> [Accessed 07 July 2014].The Investment Principle: Risk and Return Models. • [Pdf] Available at: <http://people.stern.nyu.edu/adamodar/pdfiles/acf3E/presentations/risk&ret.pdf>[Accessed07July2014].The Melting Bond Market with Max Keiser. • [Video online] Available at: <https://www.youtube.com/watch?v=hohweo1wNiU > [Accessed 07 July 2014].What is a swap? - MoneyWeek Investment Tutorials. • [Video online] Available at: <https://www.youtube.com/watch?v=uVq384nqWqg> [Accessed 07 July 2014].What Is the Difference Between Fundamental Theory and Technical Analysis? • [Video online] Available at: <https://www.youtube.com/watch?v=2A9J8kRiPLQ > [Accessed 07 July 2014].
137/JNU OLE
Recommended ReadingAnson, M. J. P, Chambers, D. R., Black, K. H. and Kazemi, H., 2012. • An Introduction to Core Topics in Alternative Investments. John Wiley & Sons.Arditti, F. D., 1996. • Derivatives: A Comprehensive Resource for Options, Futures, Interest Rate Swaps, and Mortgage Securities. Island Press.Boberski, D., 2010. • CDS Delivery Option: Better Pricing of Credit Default Swaps. John Wiley & Sons. Brussee, W., 2008. • Getting Started in Investment Analysis. John Wiley & Sons.Choudhry, M., 2003. • Bond and Money Markets: Strategy, Trading, Analysis. Butterworth-Heinemann.Collins, B. M., and Fabozz, F. J., 1999. Derivatives and Equity Portfolio Management. John Wiley & Sons.•Cooper, R. G., Edgett, S. J. and Kleinschmidt, E. J., 2001. • Portfolio Management for New Products. Basic Books. Flavell, R. R. , 2 0 1 2 . • Swaps and Other Derivatives. John Wiley & Sons.Greer, G. E. and Kolbe, P. T., 2003. • Investment Analysis for Real Estate Decisions. Dearborn Real Estate.Hill, R . A ., 2010. • The Capital Asset Pricing Model. Bookboon.Hirschey, M., 2010. • Investments: Analysis And Behaviour. Tata McGraw-Hill Education. Hodrick, R., 2014. • TheEmpiricalEvidenceon theEfficiencyofForwardandFuturesForeignExchangeMarkets. Routledge. Joehnk, G., 2012. • Fundamentals of Investing. Pearson Education India. Kürschner, M., 2008. • Limitations of the Capital Asset Pricing Model (CAPM). BoD – Books on Demand. Levine, H . A ., 2010. • Project Portfolio Management. John Wiley & Sons.Mladjenovic, P., 2013. • Stock Investing For Dummies. John Wiley & Sons.Parameswaran, S. K., 2005. • Futures Markets: Theory and Practice. Tata McGraw-Hill Education.Rad, P. F. and Levin, G., 2006. • Project Portfolio Management Tools and Techniquest. www.iil.com/publishing.Ranganatham, M., 2006. • Investment Analysis and Portfolio Management. Pearson Education India.Reilly, F. and Brown, K., 2011. • Investment Analysis and Portfolio Management. Cengage Learning. Schlichting, T., 2013. • Fundamental Analysis, Behavioral Finance and Technical Analysis on the Stock Market. GRIN Verlag.Sharifzadeh, M., 2010. • An Empirical and Theoretical Analysis of Capital Asset Pricing Model. Universal-Publishers.Siegel, J. G., Shim, J. K., Qureshi, A. A. and Brauchler, J., 2014. International Encyclopedia of Technical •Analysis. Routledge.Wilson, R. C. and Fabozzi, F. J., 1995. • Corporate Bonds: Structure and Analysis. John Wiley & Sons.

Investment Analysis and Portfolio Management
138/JNU OLE
Self Assessment Answers
Chapter Ib1. a2. a3. d4. c5. a6. d7. b8. d9. b10.
Chapter IIa1. b2. b3. d4. a5. c6. d7. c8. d9. b10.
Chapter IIIc1. a2. a3. d4. b5. a6. d7. b8. c9. a10.
Chapter IVb1. c2. c3. a4. d5. b6. b7. a8. d9. c10.

139/JNU OLE
Chapter Vb1. a2. a3. d4. d5. c6. b7. c8. a9. c10.
Chapter VIc1. a2. d3. c4. a5. b6. c7. a8. d9. b10.
Chapter VIIa1. d2. b3. c4. d5. a6. a7. b8. c9. d10.
Chapter VIIIb1. a2. d3. b4. a5. c6. a7. b8. c9. a10.