investment and the digital economy - unctad · 156 world investment report 2017 investment and the...
TRANSCRIPT

CHAPTER IV
INVESTMENT AND THE DIGITAL ECONOMY

156 World Investment Report 2017 Investment and the Digital Economy
1. The pervasiveness of the digital economy
The digital economy – the application of internet-based digital technologies to the production and trade of goods and services – is becoming an ever more important part of the global economy. The transition to a digital economy can provide a boost to competitiveness across all sectors, new opportunities for business and entrepreneurial activity, and new avenues for accessing overseas markets. It also provides new tools for tackling persistent development and social problems. However, it comes with a host of challenges – from the global digital divide, to potential negative social and development impacts, and complex, internet-specific regulatory issues – which policymakers need to address. The opportunities and challenges associated with the digital economy are particularly important for developing countries.
The digital economy is becoming an ever more important part of the global economy:
• It is affecting the lives of growing numbers of people: according to the International Telecommunication Union (ITU), three quarters of the population in most developed and emerging economies use the internet, and the penetration rate is approaching 50 per cent across developing countries – exceeding 25 per cent in Africa.1
• It is a growing part of people’s economic lives: in developed countries and emerging economies, up to two thirds of people now shop online.2
• It is pervasive in doing business: business-to-business (B2B) transactions are worth a multiple of business-to-consumer (B2C) transactions; even considering only web-based sales (excluding closed digital networks between firms), they are still about a third higher, according to UNCTAD’s Information Economy Report (UNCTAD, 2015a).
• It is encompassing an ever greater part of the global economy: the value of B2C transactions has tripled from 0.5 per cent of global GDP in 2010 to 1.5 per cent today, and the internet industry contributes almost four percentage points to GDP in the largest economies, those that generate 70 per cent of global GDP.3
• It is increasingly used by governments to interact with citizens and to deliver services: according to the UN’s e-Government Development Index, 90 countries now offer one or more one-stop portals for public information or online services, and 148 countries provide at least one form of online transactional services.
The transition to a digital economy is a major policy priority for all countries. For developing countries, it poses both immense challenges and immense opportunities. They can derive significant economic benefits from digital development. It can make overseas markets more accessible for exports, including by linking domestic companies and small and medium-sized enterprises (SMEs) to global value chains (GVCs). It can create new markets, such as digital applications adapted to specific local conditions (e.g. in sectors such as agriculture, education and health) or open up niche sectors, such as in the creative economy. It makes possible new business models for developing-country entrepreneurs and SMEs.
Digitalization can also contribute to addressing specific social or development challenges. Digital technologies can facilitate access to basic services such as health (e.g. e-health services), education (e.g. remote teaching) and financial services. They can foster government transparency and effectiveness (e.g. e-government, including approaches such as UNCTAD’s eRegulations and eRegistrations systems) and support anti-corruption efforts. They can help
A. INTRODUCTION

Chapter IV Investment and the Digital Economy 157
governments better understand and respond to societal trends and developments, such as changes in migration patterns and migrants’ behaviour and needs. Or they can facilitate the delivery of humanitarian and development assistance (e.g. information management and communications can strengthen crisis response to environmental disasters, health pandemics and population displacements). In general, digitalization can expand choices and lower transaction costs in social and economic interactions; improve livelihoods by allowing users to create, access, utilize and share information; and boost individual empowerment and collective engagement through the use of social media.
Besides these significant opportunities, however, digitalization also presents serious challenges:
• First, the digital divide – caused by a lack of investment, skills and capacity – makes digitalization a complex process, particularly for developing and least developed countries (LDCs).
• Second, digitalization can help address some development challenges, but it also has important limitations (e.g. remote teaching or health services cannot fully substitute for physical schools and hospitals).
• Third, governments must address not only concerns over the impact of digitalization and automatization on employment and inequality, but also new regulatory challenges, e.g. the protection of security and privacy.
• Finally, digitalization will affect all countries, irrespective of whether they actively pursue it. Developing countries, and especially LDCs, may risk increasing dependency on a few global digital MNEs, or further marginalization from the global economy.
Policymakers around the world are grappling with the implications of digitalization, trying to capture the opportunities and address the challenges. The number of digital economy studies has mushroomed in recent years, both in the private sector (consultants, think tanks) and in the public sector (public institutions, international organizations). The varying scope of these studies reflects the many dimensions of the digital economy. They range from specific discussions on the impact of the internet in economic interactions (e-commerce) to broader discussions on the use of new technologies in everyday life (e-health, e-education, the internet of things) and the adoption of digital technologies in business (robotics, big data), all driving a new industrial revolution.
The many studies on the digital economy contain multiple policy perspectives, ranging from implications and legislative needs driven by new technologies (e.g. privacy, data standards and protection, intellectual property rights, internet governance, cybersecurity) to advice on tackling broader economic and societal implications, including effects on employment, equality, competition and tax systems. The development perspective is equally well covered, with policy advice ranging from white papers focusing on how to improve connectivity and access to the internet, to broad debates on new entrepreneurial and business development opportunities and greater access to overseas markets for SMEs in developing countries. With such a broad array of policy advice on offer and with digital development widely considered a key avenue for economic growth, many governments, in both developed and developing countries, have formulated or are formulating policies for the development of the digital economy, from broadband plans to digital development strategies and industry 4.0 visions.
In light of the vast amounts of analysis already conducted in recent years on the pros and cons of the transition to a digital economy, this chapter, in its main analytical sections, focuses instead on the implications for international investment and investment policymaking. However, in the concluding section, it aims to bring the development perspective back in, building on existing knowledge, in an overarching policy framework for investment in the digital economy.

158 World Investment Report 2017 Investment and the Digital Economy
2. The relevance of the digital economy for investment and investment policy
The digital economy has important implications for investment, and investment is crucial for digital development. First, the digital economy has the potential to transform the international operations of MNEs and the impact of foreign affiliates on host countries, and therefore affects investment policies. Second, digital development in all countries, and particularly the participation of developing countries in the global digital economy, calls for targeted investment policies to build connectivity infrastructure, promote digital firms and support digitalization of the broader economy.
MNEs grow their international operations to access overseas markets to harness differences in factor costs and to secure resources. By creating new ways to access markets the digital economy can make a physical presence overseas less fundamental or even obsolete, which could result in a retreat of international production. At the same time, it can also have the opposite effect on international production by driving new companies that have created a virtual global presence online to physically expand overseas and invest in foreign operations. The digital economy also has implications for efficiency-seeking and resource-seeking investment by enabling new governance and coordination mechanisms in international production networks. Thus, it affects the companies expanding overseas (with new players on the investment scene), the quantity and direction of cross-border investment flows, the types of operations that MNEs set up overseas, the governance modalities in global supply chains and the impact of foreign affiliates in host countries.
With such transformative effects on international production and on the universe of MNEs and their investment decisions, it is inevitable that existing national and international investment policy frameworks should adapt to the digital economy. Investment determinants and business models are changing, which has implications for policies that seek to promote and facilitate investment, as well as for international investment governance mechanisms. Existing rules and regulations related to foreign investment, often designed with physical assets or traditional services in mind, must therefore be reviewed, and where necessary, updated.
At the same time, the plethora of digital development strategies being launched by national governments and regional organizations need an investment policy component, aimed at building up the necessary infrastructure and digital industries that are the basis of digital development. To date, many digital development strategies do not provide guidance for investment policymakers, and they rarely contain concrete investment policy measures to support their goals.
The objective of this chapter is first to show how the digital economy changes MNE operations and investment behaviour, and to discuss implications for investment policy. The chapter then aims to show how investment policy can support digital development. Taken together, these two perspectives provide the basis for an investment policy framework for the digital age.
Section IV.B documents how the digital economy is affecting the global investment landscape and MNE operations. Section IV.C discusses the investment dimension of digital development. Section IV.D summarizes key policy implications and proposes a policy framework.

Chapter IV Investment and the Digital Economy 159
Information and communication technologies (ICTs) have been a fundamental enabler of the growth of international production. The rise of the digital economy represents both an intensification and a disruption in the symbiotic relationship between ICTs and international production. An intensification in that it provides MNEs with more far-reaching opportunities to redesign processes and routes to market, and to redefine governance modalities in global production networks. A disruption in that it gives rise to entirely new multinational business models, from “born globals” to virtual MNEs, with fundamentally different international footprints.
ICTs have been a fundamental enabler of the growth of international production. The coordination of increasingly complex and dispersed global production networks would not have been possible without commensurate improvements in communication capabilities. Advances in ICTs have facilitated the spread of new governance mechanisms in GVCs. Internet-based digital technologies also shape modern global production networks (Foster and Graham, 2016). The implications for MNE location and governance decisions are still the subject of empirical analysis and academic debate. Some studies (e.g. Rangan and Sengul, 2009) argue that ICT adoption facilitates control in outsourcing and other non-equity relationships, through constant information exchange. Others tend to associate ICTs with higher in-house production and intrafirm trade (Chen and Kamal, 2016).
This section examines how the international footprint of ICT and digital MNEs differs from that of other multinationals, and looks at the consequences for FDI and host economies. The rise of digital companies and the digitalization of MNEs across all sectors have implications for financing choices, asset profiles, employment and tax contributions. They also have implications for firms in host countries, including SMEs, that aim to establish linkages to MNEs and gain access to global markets.
1. The rise of tech MNEs and its implications
Tech MNEs are enablers of the global digital economy: they provide the infrastructure and the tools for digital adoption. With the rapid growth of the digital economy, the weight of tech MNEs in international production has increased dramatically over the last decade. Tech MNEs are not only outgrowing firms in all other industries, but also disrupting traditional patterns of job creation and of asset structure, with intangibles and cash accounting for a significantly higher share of assets.
The fast rise of tech MNEs represents one of the most noteworthy trends in the world of global megacorporations in recent years. This phenomenon has attracted increasing attention, not only at the research and policy levels, but also in the broader public (see, for example, The Economist, 2016). In 2010, the relevance of tech companies in the top 100 MNE ranking compiled by UNCTAD was still limited and not significantly different than 10 years earlier (box IV.1). From 2010 to 2015, in contrast, the number of tech companies in the ranking more than doubled, from 4 to 10, and their share in total assets and operating revenues followed a similar, and even more pronounced, trend (figure IV.1). This growing weight
B. MNEs AND INTERNATIONAL PRODUCTION IN THE DIGITAL ECONOMY

160 World Investment Report 2017 Investment and the Digital Economy
Box IV.1. ICT firms in UNCTAD’s ranking of the top 100 MNEs
UNCTAD has historically collected data on the largest global MNEs and compiled an annual ranking of the top 100 non-financial MNEs worldwide. UNCTAD uses foreign assets, estimated from the geographical segmentation disclosed in financial statements, as the leading metric for establishing the MNE ranking. This focus on the foreign (or FDI) component of the business enables UNCTAD to identify corporations that have a more pronounced international footprint.
For the purpose of this study, UNCTAD’s list of the top 100 is divided into three types of MNEs, the first two of which are considered ICT firms:
• Tech MNEs. This group includes MNEs operating in the broader information technology (IT) industry, either as manufacturers of computers, ICT devices and related components (e.g. Apple, Samsung, Hon Hai) or as providers of software and services (e.g. Microsoft, SAP). These companies not only supply the IT tools supporting the digital revolution, but are themselves providers of digital services as well. This group does not include MNEs operating mainly in adjacent sectors, such as consumer electronics (e.g. Philips).
• Telecom MNEs. This group includes the providers of communication infrastructure and connectivity.
• Other MNEs. This group includes MNEs from all other (non-digital) industries. These MNEs may be exposed to digital technologies and services, but they are all users rather than providers or enablers.
Box figure IV.1.1 identifies the tech and telecom MNEs in UNCTAD’s rankings since 2000 and charts the dynamics leading to the current list. As UNCTAD’s methodology is based on foreign assets, some well-known global digital giants, such as Amazon and Facebook, do not feature in the top 100. Neither do major telecom players, such as Verizon and AT&T, whose domestic assets and revenues are very large, but whose foreign businesses are relatively small.
Source: ©UNCTAD, based on UNCTAD’s FDI/MNE database, company reports and data from Orbis Bureau van Dijk (BvD) and Thomson ONE.Note: The selection of top 100 MNEs is compiled and updated annually by UNCTAD as part of the research for the World Investment Report.
HPIBMNokiaSony
EricssonHPIBMLGMotorolaSony
Alphabet (Google)AppleHon HaiHPIBMMicrosoftOracleSamsungSAPSony
Box �gure IV.1.1. Movement of ICT players in UNCTAD’s top 100 MNEs
Tech MNEs
Telecom MNEs
Nokia
AppleGoogleMicrosoft Samsung SAPHon Hai
GoogleOracle
TeliaSonera
Softbank
AlticeAmerica MovilNTT
Deutsche TelekomLibertyOrangeTeliaSoneraVivendi
VivendiCable & WirelessSBCVerizon
EricssonLGMotorola
America Movil
America Movil
Nokia Google
AlticeAmerica MovilDeutsche TelekomLibertyNTTOrangeSoftbankTelefonicaVodafone
Deutsche TelekomLibertyOrangeTelefonicaTeliaSoneraVivendiVodafone
Cable & WirelessSBCTelefonicaVerizonVodafone
2000 2010 2011 2012 2013 2014 2015
2000 2010 2011 2012 2013 2014 2015

Chapter IV Investment and the Digital Economy 161
results from a group of tech MNEs, mainly from the United States, entering the ranking. Some of these companies, such as Alphabet (Google) and Microsoft, are leading the digital revolution; others, such as Oracle, heavily rely on and benefit from the acceleration of the internet to deliver their value proposition. When including telecom MNEs, other important enablers of the digital economy, 19 MNEs in the top 100 are ICT companies – a sizeable portion of megacorporations.
Tech megacorporations are enjoying exceptional growth momentum. Figure IV.2 describes the recent evolution of assets, operating revenues and employees for the sample of MNEs in the 2015 UNCTAD top 100. In the last five years, the largest tech MNEs have outpaced traditional MNEs and telecom companies, with assets growing by more than 10 per cent annually, compared with an essentially flat trend for the other two groups. Growth in operating revenues and employees is more moderate, but still higher than in other members of the top 100 MNEs. These figures confirm that tech MNEs represent by far the most dynamic players among the largest global multinationals.
The fast growth of tech MNEs is a result of multiple and interrelated factors, including strong technological and market momentum prompted by the digital revolution, financial solidity and spending capacity due to very high margins and liquidity, as well as a managerial culture oriented towards investment and innovation. As a result, not only have tech megacorporations gained market dominance in their core segments, but they have also successfully expanded in neighbouring digital areas. In just a few years, some have become digital hubs operating across the full spectrum of the digital economy.
5%
5%
Figure IV.1. Evolution of ICT MNEs in UNCTAD’s ranking of the top 100 MNEs, 2006 and 2010–2015
Share in assets
Share in operating revenues
Number of �rms
2011 2012 2013 20142010
11
11%
10%
2006
13
11%
10%
2015
20%
19%
19
4%
7%6%
6% 8%
6%
8%4%
7%
5%
6%11%
9%
5
7
7
6
8
6
8
9
4
7
6
7
10
9
8%
4%
10%
4%
10%
6%
5%
5%
6%
4%12%
7%
9%
Tech MNEs Telecom MNEs
Source: ©UNCTAD, based on UNCTAD’s FDI/MNE database, company reports and data from Orbis BvD and Thomson ONE.

162 World Investment Report 2017 Investment and the Digital Economy
A critical issue related to digitalization is employment. It is often argued that rising productivity and the growing role of intangibles in value generation could result in a loss of human labour. The debate is polarized between those who foresee sizeable new opportunities and those who expect significant jobs dislocation (WEF, 2016). The employment trend reported in figure IV.2 conveys a multifaceted picture. In telecom and other MNEs, employment has remained substantially flat, in line with assets and operating revenues, which suggests that digitalization in these groups has, so far, not affected jobs specifically. The number of employees in tech MNEs, in contrast, has increased by about 5 per cent annually over the last five years. This employment creation is roughly aligned with the increase in operating revenues, but significantly lower than the increase in total assets (at 11 per cent annually). This indicates that although tech MNEs are creating more employment as they grow, sources of corporate value are shifting from labour to capital.
Critically, the focus is moving toward capital components such as intangibles and cash, which generate relatively little employment. The average market capitalization of tech megacorporations is almost three times higher than that of other MNEs. At the end of 2015, 10 tech MNEs made up about 26 per cent of the total market capitalization of the top 100 MNEs in the UNCTAD ranking, a share over two times larger than their share in number, assets and operating revenues (for comparison, see figure IV.1). Such market capitalization can be largely attributed to highly valuable unrecorded intangibles, such as brand, know-how and intellectual property (as demonstrated by the wide gap between market value
Source: ©UNCTAD, based on UNCTAD’s FDI/MNE database, company reports and data from Orbis BvD and Thomson ONE.Note: The analysis includes the subset of UNCTAD’s 2015 ranking of the top 100 MNEs that had reported information consistently for the relevant years (97 MNEs for assets
and operating revenues, of which 9 tech, 8 telecom and 80 other MNEs; 81 MNEs for employees, of which 6 tech, 8 telecom and 67 other MNEs).
Figure IV.2. Trends in assets, operating revenues and employees of the 2015 top 100 MNEs(Indexed, 2010 = 100)
Operatingrevenues
Employees
Assets
Tech MNEs Telecom MNEs Other MNEs
100
130
9192
100
165
99103
2010 2011 2012 2013 2014 2015
100
125
108
92
CAGR 2010–2015
11%
1%
0%
5%
-2%
-2%
5%
1%
-2%

Chapter IV Investment and the Digital Economy 163
and asset book value). When including this component (calculated according to the market capitalization method), tech MNEs’ intangibles are estimated to be roughly equal to their asset book value – significantly more than the average 40 per cent recorded for other MNEs (figure IV.3). The second distinctive feature in the asset composition of tech MNEs is the large share of cash and cash equivalents, which stands at 28 per cent of total asset book value, or more than three times higher than the share of cash in other MNEs. Strong liquidity and high spending capacity have fueled the exceptional growth of these companies in recent years.
These major differences in asset profile indicate a structural shift in the sources of corporate value from fixed, tangible assets to intangibles and current assets, and illustrate the profound disruption brought about by digital and tech MNEs. The traditional approach to growth and investment – characterized by high capital expenditure and debt, stretched liquidity, high fixed costs and squeezed margins – is largely absent in the digital world. So the question arises, How is this business revolution affecting MNEs’ decisions about international investment?
Source: ©UNCTAD, based on UNCTAD’s FDI/MNE database, company reports and data from Orbis BvD and Thomson ONE.Note: The analysis includes the subset of UNCTAD’s 2015 ranking of the top 100 MNEs that reported the relevant information on the asset composition (92 MNEs, of which
10 tech, 8 telecom and 74 other MNEs). Estimates of undisclosed intangible assets are equivalent to the difference between market capitalization and equity book value (market capitalization method). For an alternative application employing the enterprise value instead of market capitalization, see the Global Intangible Financial Tracker (Brand Finance, 2016). Replacing the market capitalization with the enterprise value in this analysis leads to similar results (with a smaller, but still sizeable, difference in the weight of intangibles between tech MNEs and other MNEs).
Sources of value of the top 100 MNEs: market capitalization and asset composition, 2015Figure IV.3.
Market capitalization Asset composition
Average, $ billion Share oftotal top 100
Tech MNEs
Telecom MNEs
OtherMNEs
Average,top 100 81
69
57
192
Equity book value
26%
6%
68%
+
+
+
+
Cash
Other current assets
Fixed tangible
Fixed intangible (disclosed)
Intangible, undisclosed(% asset book value)
12%
7%
28%
9%
91%
100 = Asset book value
9%
23%
30%
Ratio between intangibles (including undisclosed) and asset book valueBreakdown
1.0
0.4
0.5
0.4

164 World Investment Report 2017 Investment and the Digital Economy
2. Digital and tech MNEs: a fundamentally different international footprint
Relying on the enabling infrastructure provided by ICT firms, digital MNEs’ operations are based on, or strictly linked to, the internet. They include providers of internet platforms, e-commerce, digital solutions and digital content. The importance of these digital firms in the MNE universe is growing rapidly. Their international footprint, however, is fundamentally different than that of other MNEs: they can reach foreign markets with fewer assets and fewer employees overseas. Their economic impact on host countries is thus less directly visible in terms of physical investment and job creation. Their international operations also differ from those of other MNEs in a number of areas: they tend to hold more liquid assets, and they have more opportunities to exploit tax-efficient corporate structures. In addition, unlike other MNEs, most digital MNEs are headquartered in only a few countries, with a heavy concentration in the United States.
A fundamental question for research and policy analysis is whether, and how, digitalization is changing the internationalization strategies of MNEs. It is generally argued that digitalization may lead to a retreat in FDI, as it enables MNEs to operate globally and engage in foreign markets without a physical presence (Eden, 2016; McKinsey Global Institute, 2016). In theory, digitalization can lighten foreign asset footprints of MNEs in two ways:
• Online marketplaces. Traditional MNEs reach foreign consumers in downstream parts of the value chain through market-seeking FDI (e.g. retail distribution chains or sales and marketing operations) or through building overseas production operations that sell through local distributors. Digital MNEs can dispense with much of that effort. They reach consumers online and often distribute through third-party channels. In smaller markets, they often maintain only local corporate offices, for minimal representation purposes.
• Digital value chains. Digitalization affects not only downstream functions but often the process of production. Digitalization of production and operations is occurring in many forms: fully digital products and services (e.g. internet platforms), digitalized physical products (e.g. digital content) and the digitalization of selected parts of the production process (see also section IV.B.3 on digital transformation). In all these forms, some or all of the GVC is digital, either digitally born or turning from physical to digital. Operations take place mostly on the internet and are thus intangible and transnational (or even stateless) by nature. In this context, some of the traditional motivations for FDI weaken or may be insufficient to compensate for the location costs or coordination and governance issues associated with FDI. These dynamics affect primarily efficiency-seeking FDI, motivated for example by the reduction of labour costs or of trade costs.
As motivations for market-seeking FDI and efficiency-seeking FDI are partially undermined by digitalization, other types of FDI are becoming more important. These include knowledge-seeking FDI and to some extent also financial- and tax-driven FDI. Compared with traditional types of FDI, these types tend to have a limited impact on MNEs’ international production footprint.
This issue is central to the discussion on the future of international production; however, it has so far been debated mostly on the basis of anecdotal evidence. No systematic empirical analysis has been done to underpin it and to quantify its scale. Most likely, this is due to the methodological and empirical challenges related to (i) assessing MNEs’ exposure to digitalization, (ii) measuring their international footprint and (iii) linking these two dimensions. The analysis in the next sections will attempt to fill the gap.
Chapter IV Investment and the Digital Economy 165
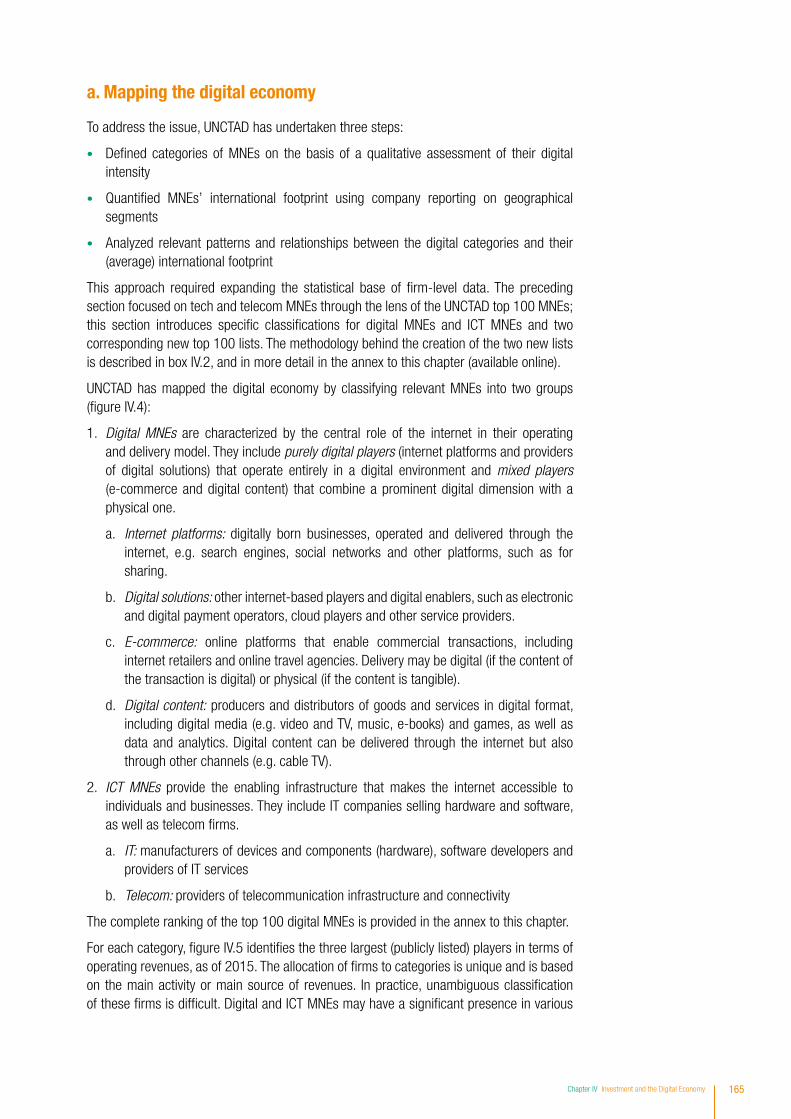
a. Mapping the digital economy
To address the issue, UNCTAD has undertaken three steps:
• Defined categories of MNEs on the basis of a qualitative assessment of their digital intensity
• Quantified MNEs’ international footprint using company reporting on geographical segments
• Analyzed relevant patterns and relationships between the digital categories and their (average) international footprint
This approach required expanding the statistical base of firm-level data. The preceding section focused on tech and telecom MNEs through the lens of the UNCTAD top 100 MNEs; this section introduces specific classifications for digital MNEs and ICT MNEs and two corresponding new top 100 lists. The methodology behind the creation of the two new lists is described in box IV.2, and in more detail in the annex to this chapter (available online).
UNCTAD has mapped the digital economy by classifying relevant MNEs into two groups (figure IV.4):
1. Digital MNEs are characterized by the central role of the internet in their operating and delivery model. They include purely digital players (internet platforms and providers of digital solutions) that operate entirely in a digital environment and mixed players (e-commerce and digital content) that combine a prominent digital dimension with a physical one.
a. Internet platforms: digitally born businesses, operated and delivered through the internet, e.g. search engines, social networks and other platforms, such as for sharing.
b. Digital solutions: other internet-based players and digital enablers, such as electronic and digital payment operators, cloud players and other service providers.
c. E-commerce: online platforms that enable commercial transactions, including internet retailers and online travel agencies. Delivery may be digital (if the content of the transaction is digital) or physical (if the content is tangible).
d. Digital content: producers and distributors of goods and services in digital format, including digital media (e.g. video and TV, music, e-books) and games, as well as data and analytics. Digital content can be delivered through the internet but also through other channels (e.g. cable TV).
2. ICT MNEs provide the enabling infrastructure that makes the internet accessible to individuals and businesses. They include IT companies selling hardware and software, as well as telecom firms.
a. IT: manufacturers of devices and components (hardware), software developers and providers of IT services
b. Telecom: providers of telecommunication infrastructure and connectivity
The complete ranking of the top 100 digital MNEs is provided in the annex to this chapter.
For each category, figure IV.5 identifies the three largest (publicly listed) players in terms of operating revenues, as of 2015. The allocation of firms to categories is unique and is based on the main activity or main source of revenues. In practice, unambiguous classification of these firms is difficult. Digital and ICT MNEs may have a significant presence in various

166 World Investment Report 2017 Investment and the Digital Economy
Box IV.2. UNCTAD’s ranking of top digital and ICT MNEs: selection, classification and international footprint analysis
UNCTAD’s new database is an effort to systematically rank digital and ICT MNEs. Through its scale, breadth and depth, which is part of the value added of the analysis, it seeks to achieve two key objectives:
• Profile the leading digital and ICT MNEs in all the main digital areas. Doing so has value beyond the international footprint analysis developed here; UNCTAD’s sample can be used as a basis for firm-level analysis of other relevant dimensions of digital MNEs.
• Build an extensive sample of digital and ICT firms to support solid empirical analysis, addressing not only the comparison between digital and non-digital MNEs, but also relevant patterns between categories of digital and ICT MNEs.
a. Selection and classification of top digital and ICT MNEsUNCTAD’s research of company data identified the largest 100 digital and 100 ICT MNEs by operating revenues and/or sales. The definitions of digital MNE and ICT MNE follow the classification of figure IV.4. Box table IV.2.1 provides key statistics for the selected MNEs and summarizes the selection criteria as well as the main analytical steps.
b. International footprint analysisThis study mainly relied on consolidated geographic information reported by publicly listed MNEs. The key metrics used to analyze MNEs’ international footprint were the following:
• Share of foreign assets
• Share of foreign sales
• Ratio of the share of foreign sales to the share of foreign assets
A more detailed discussion of the construction of the database and the approach to the international footprint analysis can be found in the annex to this chapter.
Source: ©UNCTAD, based on UNCTAD’s FDI/MNE database, company reports and data from Orbis BvD and Thomson ONE.Note: MNEs for which there is complete information include the subset of the top 100 digital and 100 ICT MNEs that report information on foreign assets and on foreign
sales or operating revenues in their financial accounts.
Source: ©UNCTAD.
Telecom
IT
Software and services
Devices and components
Total
Total
Total
E-commerce
Internet retailers
Other e-commerce
Total
Digital solutions
Electronic payments
Other digital solutions
Total
Internet platforms
Search engines
Social networks
Other platforms
Total
Digitalcontent
Digital media
Games
Info and data
Total
UNCTAD’s database of the top digital and top ICT MNEs: key elements and descriptive statistics
Box table IV.2.1.
DigitalMNEs
ICTMNEs
# MNEs# MNEswith full info
Sales, 2015, $ billion Avg Max Min
Listed companies
Multinational enterprises
Reported information on foreign business (at least one between foreign sales and foreign assets)
Selection criteria
Extraction of the initial sample - all companies with annual operating revenues above $1 billion (about 20,000 �rms from the ORBIS company database)
Selection of the 100 largest multinationals (in terms of operating revenues) for digital MNEs and ICT MNEs based on activity codes, trade description, �nancial reporting and company websites
Cross-validation with other lists, both generalist (Fortune 2000, Forbes 500, S&P 500) and specialized (UNCTAD Information Economy Reports and consultants reports)
Main analytical steps
27
19
50
69
86
96
9
5
14
3
19
22
2
5
3
10
20
5
15
40
27
21
52
73
100
100
13
5
18
5
21
26
3
5
3
11
22
7
16
45
31.3
19.5
31.4
28.0
7.6
28.9
11.9
4.8
9.9
6.2
3.7
4.2
27.6
5.5
4.6
11.3
11.9
4.5
3.7
7.8
146.8
85.3
215.6
215.6
107.0
215.6
107.0
9.2
107.0
11.5
11.7
11.7
75.0
17.9
8.6
75.0
74.5
15.8
12.2
74.5
5.1
4.6
5.0
4.6
1.0
4.6
1.0
1.6
1.0
1.3
1.0
1.0
2.8
1.0
2.1
1.0
1.2
1.4
1.1
1.1

Chapter IV Investment and the Digital Economy 167
neighbouring areas of the digital world. Examples include top digital companies such as Apple, Microsoft, Facebook, Alphabet and Amazon that have become leaders in multiple digital products and services.
The largest firms in each category are not all truly global, however. Some large corporations, such as Baidu and NetEase, are highly concentrated in one market and have a comparatively small foreign presence. These companies fall out of the scope of this study, which focuses specifically on MNEs and their “transnationality”.
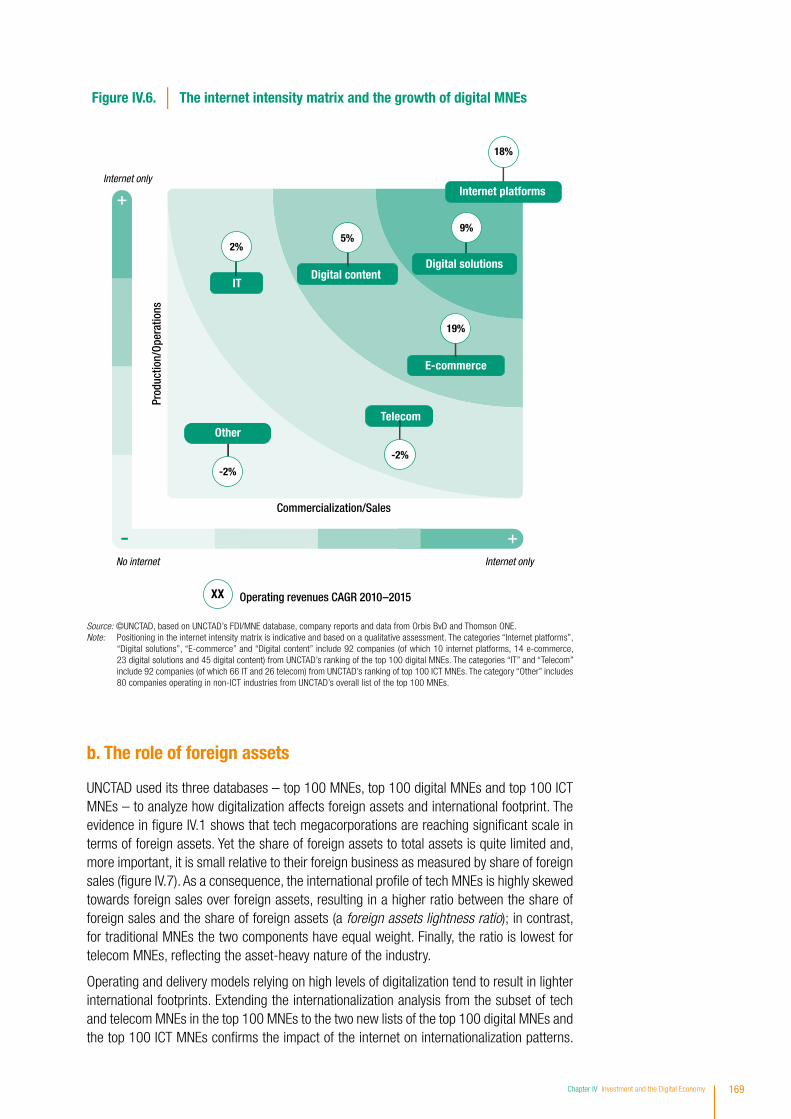
A conceptual matrix positioning MNEs on the basis of their “internet intensity”, both in terms of products and operations and in terms of commercialization and sale of their products, provides another useful way to compare digital MNEs with ICT and other MNEs (figure IV.6). At the top end of the matrix are the purely digital MNEs, the group of internet platforms and providers of digital solutions, for which both operations and sales are digital. At the lower end of the matrix is the heterogeneous group of non-ICT, non-digital firms, some of which are gradually moving towards digital adoption in operations and sales, as confirmed for example by the growing importance of e-commerce in traditional business. For each category, the figure reports the annual growth rate of the aggregate operating revenues in the last five years (the median growth rate produces similar results, confirming that the trend applies across the sample). The growth pattern revealed by the matrix highlights the rapid expansion of digital MNEs and the role of the internet as a growth engine.
Figure IV.4. The architecture of the digital economy
Digitalization of the global economy
Digital contentE-commerce
Internet platforms
IT (hardware and software)
Telecom
Digital solutions
ICT MNEs, providing the enabling infrastructure supporting the internet
Mixed
Purely digital
Digital MNEs, performing activities based on or strictly linked to the internet
• Search engines• Social networks• Other platforms/sharing economy
• Electronic/digital payments• Other digital solutions/cloud
• Internet retailers• Other e-commerce/travel
• Media/entertainment• Info/data providers
Source: ©UNCTAD.

168 World Investment Report 2017 Investment and the Digital Economy
Figu
re IV
.5.
Cate
gorie
s of
dig
ital a
nd IC
T �r
ms,
larg
est p
laye
rs a
nd re
venu
e so
urce
s, 2
015
Oper
atin
g re
venu
es,
CAGR
201
0–20
15,
med
ian
of to
p co
mpa
nies
Sear
ch e
ngin
es
Soci
al n
etw
orks
Othe
r pla
tform
s
Digi
tal m
edia
Gam
es
Info
and
dat
a
Inte
rnet
reta
ilers
Othe
r e-c
omm
erce
Size
, ope
ratin
g re
venu
es 2
015,
$ b
illio
n
Mai
n so
urce
s of
reve
nue
Sale
of a
dver
tisin
g sp
ace
Dire
ct s
ale
or s
ale
of
cont
ent r
ight
s
Com
mis
sion
s fr
om s
elle
rs
Inte
rnet
pla
tfor
ms
Digi
tal c
onte
nt
E-co
mm
erce
Digi
tal s
olut
ions
Dive
rsi�
ed b
usin
ess
mod
els
23
45
1050
100
120
0
Elec
troni
c pa
ymen
ts
Othe
r dig
ital s
olut
ions
Tran
sact
ion-
base
d co
mm
issi
on fe
es
Dive
rsi�
ed b
usin
ess
mod
els
Tele
com
IT
Chin
a M
obile
Baid
u
NetE
ase
IAC/
Inte
ract
ive
Yaho
o Ja
pan
Grou
pon
Red
Hat
Tim
e W
arne
r21
st C
entu
ry F
ox
Elec
troni
c Ar
tsAc
tivis
ion
Blizz
ard
Niel
sen
JD.c
omAl
ibab
a
Amad
eus
ITEx
pedi
a
PayP
alW
orld
pay Sa
lesf
orce
VMW
are
Veriz
on
Orac
leHP
Ent
erpr
ise
Hon
Hai P
reci
sion
Sam
sung
Sale
of c
onne
ctiv
ity a
nd
rela
ted
serv
ices
Sale
of s
oftw
are
and
IT s
ervi
ces
Sale
of d
evic
es a
nd
com
pone
nts
Softw
are
and
serv
ices
Devic
es a
nd c
ompo
nent
s
5%4%
Glob
al le
ader
Follo
wer
, glo
bal
Follo
wer
, mos
tly d
omes
tic (o
ut o
f sco
pe)
Digital players ICT players
4%24%
18%
19%
Allia
nce
Data
Syst
ems
Sour
ce:
©UN
CTAD
, bas
ed o
n UN
CTAD
’s F
DI/M
NE
data
base
, com
pany
repo
rts a
nd d
ata
from
Orb
is B
vD a
nd T
hom
son
ON
E.No
te:
The
map
ping
and
cor
resp
ondi
ng r
anki
ng o
f the
com
pani
es is
bas
ed o
n th
e m
ost r
ecen
t ann
ual o
pera
ting
reve
nues
, as
avai
labl
e at
the
time
of th
e da
ta c
olle
ctio
n (b
etw
een
Dec
embe
r 20
16 a
nd F
ebru
ary
2017
) fro
m s
tand
ard
finan
cial
repo
rting
. For
the
maj
ority
of c
ompa
nies
, the
clo
sing
dat
e of
the
late
st re
porte
d fin
anci
als
is 3
1 D
ecem
ber 2
015.
Chapter IV Investment and the Digital Economy 169
Figure IV.6. The internet intensity matrix and the growth of digital MNEs
E-commerce
Telecom
Digital content
-2%
IT
2%5%
19%
9%
18%
-2%
Other
Internet only
Internet only
Commercialization/Sales
Prod
uctio
n/Op
erat
ions
No internet
Internet platforms
Digital solutions
XX Operating revenues CAGR 2010–2015
b. The role of foreign assets
UNCTAD used its three databases – top 100 MNEs, top 100 digital MNEs and top 100 ICT MNEs – to analyze how digitalization affects foreign assets and international footprint. The evidence in figure IV.1 shows that tech megacorporations are reaching significant scale in terms of foreign assets. Yet the share of foreign assets to total assets is quite limited and, more important, it is small relative to their foreign business as measured by share of foreign sales (figure IV.7). As a consequence, the international profile of tech MNEs is highly skewed towards foreign sales over foreign assets, resulting in a higher ratio between the share of foreign sales and the share of foreign assets (a foreign assets lightness ratio); in contrast, for traditional MNEs the two components have equal weight. Finally, the ratio is lowest for telecom MNEs, reflecting the asset-heavy nature of the industry.
Operating and delivery models relying on high levels of digitalization tend to result in lighter international footprints. Extending the internationalization analysis from the subset of tech and telecom MNEs in the top 100 MNEs to the two new lists of the top 100 digital MNEs and the top 100 ICT MNEs confirms the impact of the internet on internationalization patterns.
Source: ©UNCTAD, based on UNCTAD’s FDI/MNE database, company reports and data from Orbis BvD and Thomson ONE.Note: Positioning in the internet intensity matrix is indicative and based on a qualitative assessment. The categories “Internet platforms”,
“Digital solutions”, “E-commerce” and “Digital content” include 92 companies (of which 10 internet platforms, 14 e-commerce, 23 digital solutions and 45 digital content) from UNCTAD’s ranking of the top 100 digital MNEs. The categories “IT” and “Telecom” include 92 companies (of which 66 IT and 26 telecom) from UNCTAD’s ranking of top 100 ICT MNEs. The category “Other” includes 80 companies operating in non-ICT industries from UNCTAD’s overall list of the top 100 MNEs.

170 World Investment Report 2017 Investment and the Digital Economy
As illustrated in figure IV.8, delivery and operating models characterized by higher internet intensity produce a higher foreign asset lightness ratio. In other words, the more MNEs rely on the internet, the better they can leverage their foreign assets, obtaining a higher share of foreign sales with relatively limited foreign assets. This pattern is not driven by a few large companies but applies across the board: the results are consistent when replacing categories’ weighted averages with median values.
The foreign asset configuration of digital MNEs reflects the different degrees of exposure to, and usage of, internet and digital technologies.
• Purely digital MNEs, including internet platforms and providers of digital solutions, show the highest gap between (low) foreign assets and (high) foreign sales. These are companies that operate almost entirely in a virtual environment, characterized by limited physical ties with their markets. Tangible foreign assets in foreign markets are often limited to corporate offices and data centre hubs.
• Digital MNEs with mixed models, including providers of digital content and e-commerce, also exhibit a lighter foreign asset footprint than traditional MNEs, but the gap is significantly reduced. Both groups combine a digital core business with a physical component instrumental to the delivery of their value proposition.
Internet retailers consist mainly of e-commerce multinationals, such as Amazon or Rakuten, whose marketing and commercial activities are online, but whose delivery activities require logistic assets and operations.
Digital content providers include large media companies, such as 21st Century Fox and Sky. These companies operate in an inherently digital environment with digital products and digital technologies. However, they still reach their mass customer base in traditional ways, for example, through cable or satellite television. With some notable exceptions such as Netflix, their online distribution segment, although growing rapidly, is still smaller than their traditional distribution segments.
MNE business models more suited to online operations and delivery, such as online travel agencies (in the e-commerce category), and information and data providers (in the digital content category), are characterized by a lighter foreign asset footprint.
Source: ©UNCTAD, based on UNCTAD’s FDI/MNE database, company reports and data from Orbis BvD and Thomson ONE.Note: The reference sample for the analysis is UNCTAD’s overall ranking of the top 100 MNEs for 2015, including 10 tech, 9 telecom and 81 other MNEs. More details on the
calculation of foreign assets and sales, their shares of the total and the related foreign asset lightness ratio are discussed in the annex to this chapter.
Figure IV.7.
Share of foreign assets
Share of foreign sales
Other MNEsTelecom MNEsTech MNEs
Ratio, share of foreign sales/share of foreign assets
Average shares of foreign assets and foreign sales in the top 100 MNEs, 2015
0.9 1.0
57%
66%
64%
65%
73%
41%
1.8

Chapter IV Investment and the Digital Economy 171
1.1E-commerce
0.9
Telecom
1.1
Digital content
1.8
IT
1.0
Other
Figure IV.8. The internet intensity matrix and the foreign sales/assets ratio
Internet only
Internet only
Commercialization/Sales
Prod
uctio
n/Op
erat
ions
No internet
2.6Internet platforms
1.9Digital solutions
XX
Software and services: 1.4 Devices and components: 1.9
Digital media: 1.1Games: 1.1Info and data: 1.3
Ratio, share of foreign sales/share of foreign assets
Search engines: 2.6Social networks: 2.4Other platforms: 3.7
Electronic payments: 2.9 Other digital solutions: 1.7
Internet retailers: 0.9Other e-commerce: 2.4
The group of ICT MNEs is highly polarized between IT MNEs (hardware and software) and telecom MNEs.
• IT MNEs exhibit a light foreign asset footprint overall, with a ratio between the share of foreign sales and the share of foreign assets almost equivalent to that of purely digital players. However, this group is quite heterogeneous, and reasons other than digitalization may contribute to a light foreign asset configuration. The leading IT companies, such as Apple and Samsung, and the leading software companies, such as Microsoft and Oracle, have strong digital footprints. Conversely, smaller and specialized IT manufacturers have more limited digital exposure. Several of these MNEs are suppliers of IT components from East and South-East Asia. These companies tend to locate their production facilities at home, where production costs are lower, and then to export. This clearly contributes to a high ratio between the share of foreign sales and the share of foreign assets.
• Telecom MNEs, as already observed in the context of the UNCTAD top 100 MNEs (figure IV.7), exhibit a high share of foreign assets relative to foreign sales. They tend to establish a heavy, tangible presence in the foreign countries where they operate. This is intrinsic to their business and operating model, which requires telecommunication infrastructure to achieve capillary coverage.
Source: ©UNCTAD, based on UNCTAD’s FDI/MNE database, company reports and data from Orbis BvD and Thomson ONE.Note: Positioning on the internet matrix is indicative and based on a qualitative assessment. The categories “Internet platforms”, “Digital
solutions”, “E-commerce” and “Digital content” include 86 companies (of which 10 internet platforms, 22 digital solutions, 14 e-commerce and 40 digital content) from UNCTAD’s ranking of the top 100 digital MNEs. The categories “IT” and “Telecom” include 96 companies (of which 69 IT and 27 telecom) from UNCTAD’s ranking of the top 100 ICT MNEs. The category “Other” includes 81 companies operating in non-ICT industries, from UNCTAD’s overall list of the top 100 MNEs. More details on the calculation of foreign assets and sales, their shares of the total and the related foreign asset lightness ratio are discussed in the annex to this chapter.

172 World Investment Report 2017 Investment and the Digital Economy
The international asset footprint of non-digital MNEs (“Other” in figure IV.8) exhibits significant variability across industries (figure IV.9). The sectoral pattern of foreign assets and foreign sales remains substantially stable over time, with tech MNEs showing the highest foreign asset lightness ratios in both 2010 and 2015. They are followed by MNEs in automotive and aircraft, a highly technological industrial sector, that typically resorts to contract manufacturing for more asset- and labour-intensive operations. At the lower end of the ranking are industries that rely either on local infrastructure (telecommunication and utilities) or on natural resources (mining and petroleum refining).
Digitalization tends to break the operational nexus between foreign sales and foreign assets. As discussed earlier, internet platforms present a low share of foreign assets relative to foreign sales. None of these MNEs exhibit a share of foreign assets above 40 per cent, and most do not exceed 20 per cent; on average, their share of foreign sales is more than 2.5 times the share of foreign assets. Not only do highly digital MNEs tend to realize more foreign sales with fewer foreign assets, but there is little correlation between the two, suggesting that commercial presence in foreign markets has no apparent bearing on international investment choices (figure IV.10). Conversely, for MNEs in telecom and in digital content, which have relatively heavier foreign asset footprints, the share of foreign sales correlates highly with the share of foreign assets. This suggests that physical presence in a foreign market is a critical condition for sales.
Share of foreign assets and sales by industry, top 100 MNEs, 2010 and 2015Figure IV.9.
Total
Others
Petroleum re�ningand related industries
Telecom
Utilities
Primary
Food, beveragesand tobacco
Chemicals andpharmaceuticals
Other manufacturing
Automotiveand aircraft
Tech
62%
64%
73%
66%
55%
76%
90%
64%
62%
53%
41%
64%
38%
60%
57%
47%
68%
87%
68%
71%
71%
73%
2015
# MNEsShare offoreign assets
Share offoreign sales
Ratio, share of foreign sales/share of foreign assets
1.0
1.8
1.3
1.1
1.1
1.0
0.9
0.9
0.9
0.8
0.6
62%
47%
69%
76%
61%
68%
81%
59%
67%
53%
51%
64%
43%
63%
65%
55%
68%
82%
69%
75%
68%
71%
2010Ratio, share of foreign sales/share of foreign assets# MNEs
Share offoreign assets
Share offoreign sales
4
14
13
12
8
9
12
6
9
13
100 1.0
1.4
1.3
1.1
1.2
1.0
1.0
0.9
0.9
0.9
0.9
10
14
9
14
9
11
8
9
8
8
100
Source: ©UNCTAD, based on UNCTAD’s FDI/MNE database, company reports and data from Orbis BvD and Thomson ONE.Note: “Other manufacturing” includes among others machinery and electric equipment; “Others” is a residual category including some large conglomerates that operate in
many industries (e.g. Marubeni and Mitsubishi). Details on the calculation of foreign assets and sales, their shares of the total and the related foreign asset lightness ratio are discussed in the annex to this chapter.

Chapter IV Investment and the Digital Economy 173
Figure IV.10.Correlation between the share of foreign sales and the share of foreign assets, by category (Per cent)
Internet platformsRatio, share of foreign sales/share of foreign assets: 2.6
Correlation coef�cient: -0.01
Share of foreign sales
Share of foreign assets
0
5
10
15
20
25
30
35
40
45
0 10 20 30 40 50 60 70
Alphabet
EbayYahoo IAC
Groupon
Red Hat
Match Group
Digital content
Share of foreign sales
Share of foreign assets
10
20
30
40
50
60
70
80
90
100
0 20 40 60 80 100
Ratio, share of foreign sales/share of foreign assets: 1.1Correlation coef�cient: 0.78
0
20
40
60
80
100
0 20 40 60 80 100
Telecom
Share of foreign sales
Share of foreign assets
Ratio, share of foreign sales/share of foreign assets: 0.9Correlation coef�cient: 0.96
Source: ©UNCTAD, based on UNCTAD’s FDI/MNE database, company reports and data from Orbis BvD and Thomson ONE.
c. Foreign earnings
Despite their limited tangible assets, foreign affiliates of tech and digital MNEs retain a sizeable part of their foreign earnings overseas, typically in the form of cash and cash equivalents. This practice has been in the spotlight recently because of its tax implications.4
Tech and digital MNEs are on average highly profitable and maintain large cash reserves for investment (see also figure IV.3). A significant part of this cash consists of unremitted foreign earnings, retained abroad for tax optimization purposes. Tech megacorporations from the United States in UNCTAD’s 2015 ranking of the top 100 MNEs kept 62 per cent of their total foreign earnings unremitted, a share almost three times higher than that of other United States MNEs (figure IV.11). Furthermore, total foreign earnings retained abroad by tech MNEs from the United States are growing faster, at an average annual rate of 28 per cent between 2010 and 2015, against 8 per cent for other MNEs. As a result, tech megacorporations each retained about $75 billion abroad on average in 2015, against $45 billion for other MNEs.

174 World Investment Report 2017 Investment and the Digital Economy
The fact that unremitted foreign earnings are equivalent to about six times the estimated value of foreign tangible assets suggests that these resources are only in small part used to finance foreign productive capacity. The main objective is rather to minimize the tax burden by (indefinitely) deferring the payment of the tax adjustment upon repatriation of foreign earnings to the United States. Accordingly, tech MNEs incurred an average effective tax rate of 19 per cent in 2015 – significantly lower than the tax rate paid by other United States MNEs. These patterns are likely to apply to digital MNEs as well, given the common characteristics they share with tech MNEs. It should be noted that the phenomenon of high retained foreign earnings is strictly linked to the United States territorial tax system and could be less relevant for MNEs from other countries. Changes in the United States corporate tax system currently under discussion may significantly affect overseas retained earnings of tech and digital MNEs.
d. A concentrated geography
Most digital MNEs are from developed countries, in particular the United States. The share of digital MNEs based in the United States is high, at almost two thirds. Their predominance, coupled with their tendency to retain most tangible assets at home, results in a geographic distribution of subsidiaries that is highly skewed towards domestic companies based in the United States. Only about 50 per cent of the subsidiaries of digital MNEs are foreign affiliates, compared with almost 80 per cent for other MNEs. Also, about 40 per cent of the subsidiaries of digital MNEs are based in the United States, almost twice the share for other MNEs (table IV.1). As a result, the growth of digital economy MNEs could reverse the trend in outward FDI observed in the last decade towards “democratization” (with developing economies increasingly becoming important outward investors) back towards concentration in a few large home countries.
385325
271221
168110
28%
411398369355322
281
8%
Share of total foreign earnings
Ratio to foreign tangible assets
Effectivetax rate
2015
62%
23%
x6
x1
19%
27%
2010 2011 2012 2013 20152014
Figure IV.11. Unremitted foreign earnings of United States MNEs in UNCTAD’s top 100 MNEs
Trend in unremitted foreign earnings, 2010–2015
$ billion
Tech MNEs
Other MNEs
CAGR
Source: ©UNCTAD, based on UNCTAD’s FDI/MNE database and company reports.Note: The analysis includes the United States MNEs in UNCTAD’s 2015 ranking of top 100 that report the relevant information in their financial accounts (for the historical
analysis: 14 MNEs of which 5 tech and 9 other MNEs; for the analysis at 2015: 17 MNEs of which 5 tech and 12 other MNEs).

Chapter IV Investment and the Digital Economy 175
The empirical analysis highlights three key trends in the mode of internationalization of digital and tech MNEs:
• Limited international asset footprint (figure IV.7 to figure IV.10)
• Large cash reserves kept overseas (figure IV.11)
• Concentration of productive investment in a few developed economies, especially the United States (table IV.1)
These trends describe an entirely new multinational business model and have the potential to radically transform the international operations of many MNEs. At the same time, this process of digital disruption is still limited to digital and tech MNEs, or MNEs with strong links to the digital economy, whether as providers or enablers. For other MNEs, traditional business models are resilient.
However, the penetration of leading digital MNEs into large portions of the real economy outside typical digital markets will give some impulse to the digitalization of broader economic activities. The fast growth of online sales channels within traditional industries shows that companies are already moving towards the digitalization of commercial activities. The digitalization of production is proving more challenging, but is advancing as well. The next section examines possible digital-adoption scenarios in more detail.
3. The digitalization of MNEs across industries: gradual transformation
The digital economy is not limited to the ICT sector and to digital firms. Arguably the biggest economic impact comes from the digitalization of processes and supply chains across all sectors of the global economy. Digitalization can affect any process in the supply chain, including procurement, production, coordination across networks of operating units, outbound logistics and customer relations. The international production profiles seen in digital firms could be a harbinger of the future for many industries. They may represent the extreme end of a transformation process that could affect all MNEs, to varying degrees. To date, the impact of digitalization on the international footprint (foreign assets and sales) of non-digital MNEs is limited, but a trend towards more asset-light forms of international production and alternative modes of governance has begun to emerge.
Table IV.1. Ownership structure of MNEs
Parent companies Subsidiaries
United States Other countries Domestic Foreign United States Other countries
Number Number Share Number Share Number Number Share Number Share Number Share Number Share
Digital MNEs 100 63 63% 37 37% 22,742 10,199 45% 12,543 55% 8,968 39% 13,774 61%
ICT MNEs 100 21 21% 79 79% 27,950 6,522 23% 21,428 77% 7,463 27% 20,487 73%
Other MNEs 81 15 19% 66 81% 57,002 12,353 22% 44,649 78% 11,834 21% 45,168 79%
Source: ©UNCTAD, based on UNCTAD’s FDI/MNE database and ownership information from Orbis BvD.Note: “Digital MNEs” and “ICT MNEs” are from UNCTAD’s top 100 digital and ICT MNE databases, compiled for this report; “Other MNEs” are companies operating in non-ICT
industries from UNCTAD’s general 2015 ranking of the top 100 MNEs. To qualify as a subsidiary, minimal ownership by parents is set at 50 per cent.

176 World Investment Report 2017 Investment and the Digital Economy
To date, the adoption of digital technologies in non-ICT MNEs is not yet visible in international production patterns in the way it is for ICT and digital MNEs, as described in the previous sections. Overall, internationalization, or the foreign share in MNEs’ assets and sales, has been increasing (figure IV.12). However, the relative contributions of foreign sales and assets have not substantially changed over the last 10 years, with the share of foreign sales roughly aligned to the share of foreign assets. On average, in 2015 the largest MNEs generate 64 per cent of their sales abroad, with 62 per cent of their assets overseas.
a. Digitalization along the supply chain
Although digital adoption has so far not affected international production statistics, anecdotal evidence confirms it has the potential to transform the way companies across different industries run their internal operations, interact with customers and suppliers, and govern their international supply chains (see box IV.3). Many MNEs are centralizing global functions and back-office operations, while cloud computing is used to share resources within MNE networks and facilitate new forms of pooling arrangements. In human resources, for example, Singapore-based Flextronics migrated its fragmented human resources systems for 200,000 workers in 25 countries into one global platform. The Four Seasons hotel chain (Canada), which has 42,000 employees worldwide, moved to a globally scaled, cloud-based human resources system (McKinsey Global Institute, 2016).
In supply chains, digital tools can coordinate a multitude of vendors around the globe with greater efficiency, opening up new possibilities for procurement. Companies such as Cisco and Procter & Gamble have built “control towers” that offer real-time visibility across complex global supply chains. These hubs bring together information from sensors, actuators, radio frequency identification tags, GPS tracking and other tools into dynamic models that help managers evaluate alternatives instantly when risks or bottlenecks arise (McKinsey Global Institute, 2016).
Rather than a single technology, it is the convergence of multiple technologies that, in combi-nation, enables firms to adopt new ways of doing business. The change agents are often not incumbent firms in each industry but instead new entrants providing new digital technologies, suppliers who embrace digital opportunities to move up the value chain, and even customers who are not just on the receiving end of a product or service but are actively co-creating it.
Source: ©UNCTAD, based on UNCTAD’s FDI/MNE database, company reports and data from Thomson ONE.Note: The transnationality index (TNI) in the figure is the arithmetic mean between the share of foreign sales and the share of foreign assets.
Figure IV.12. Evolution of the share of foreign sales and the share of foreign assets for UNCTAD’stop 100 MNEs, 2006–2015 (Indexed, 2006 = 100)
90
95
100
105
110
115
120
Share of foreign assets
Share of foreign sales
Average (TNI)
100
112111
2006 2007 2008 2009 2010 2011 2012 2013 2014 2015
Share of foreignassets
Share of foreignsales
TNI
2006 2015
62%
64%
63%
56%
57%
57%

Chapter IV Investment and the Digital Economy 177
Companies digitalize aspects of their supply chain in response to industry-specific challenges and drivers. They may, as for example in the pharmaceutical sector, have a pressing need to address inventory management challenges. They may also rely on digitalization to address quality, ensuring that their products are of a consistently high standard and their provenance traceable. Or they may adopt a digital approach in order to maintain or regain competitive advantage through improved customer service or to reduce their environmental impact.
The speed of digitalization in individual MNEs is driven by various factors. Developing an end-to-end digital supply chain involves a major transformation, organization-wide disruption and significant levels of investment. This is particularly the case for large global MNEs with a history of mergers and acquisitions and an array of legacy systems to integrate. The speed of adoption often also depends on digital awareness and skills at senior management levels in firms.
At the sector and industry levels, the urgency and speed of adoption depends on industry characteristics and competition. In some sectors, the digitalization of products and services themselves is changing the nature of supply and consumption. For instance, streaming of media and entertainment products as well as online purchasing of financial services are now widespread.
Technologies enabling the sharing economy are also affecting services industries. These business models, based on facility or product access rather than ownership, can be replicated beyond consumer transport and hotels (such as Uber and Airbnb) in any services sector where underutilized, time-limited capacity can be sold through digital platforms. Although many supply-side actors are small businesses, the owners of these digital platforms have quickly become dominant sector players. Employment rights, service quality and investment demands imposed by digital platform operators on small providers have become a major concern for regulators (and increasingly for consumers).
In traditional manufacturing industries, the impact of digitalization has also been significant. Within fast-moving consumer goods, the connection to individual consumers through e-commerce transactions offers retailers and manufacturers alike opportunities to capture product and delivery preferences.
In engineering industries, the Rolls-Royce “power-by-the-hour” business model (in which revenues from product use, service and repair exceed those of the initial sale of the primary asset) is now the norm. The ability to track engine performance in near real time is enabled by advances in sensors that provide data back to a central control room to manage service requirements. Manufacturers of the latest engines are also now deploying digital 3D printing technologies to deliver enhanced functionality and lightweight structures, demonstrating that 3D printing is utilized not only in decentralized manufacturing of small components, where production takes place close to the end user, but also in centralized, large-scale manufacturing as a competitive mainstream production technology.
In the health care sector, new digitally enabled production technologies such as continuous processing with advanced process analytics are providing alternatives to the centralized production of large batches that is still prevalent in pharmaceuticals. These technologies promise more flexible volume and variant production in the supply of medicines to better target niche patient populations. Smart packaging also provides the ability, through printed electronics and embedded sensors, to authenticate, track and ensure environmental compliance, providing patients with assurances of the provenance and quality of the medicines they receive. Digitally enabled packs, medical devices and wearables enable the monitoring of both adherence to, and the effectiveness of, treatment regimes.

178 World Investment Report 2017 Investment and the Digital Economy
Box IV.3. Adoption of digital technologies in global supply chains
The introduction of digital technologies in manufacturing supply chains is leading to digital transformations in 10 areas, from inbound logistics and supplier management, to internal processes and governance of end-to-end supply chains, to customer relationship management (box figure IV.3.1).
1. Automated e-sourcing: Electronic data interchange and automated call-off are well-established forms of digitized sourcing. Companies are seeking not only to extend their use beyond direct suppliers but also to include proactive warning systems. Increasingly, the sourcing bottlenecks or the materials vulnerable to supply disruption are farther back in the supply chain, and digital systems can provide enhanced visibility.
2. Digital factory design: 3D modelling systems for factory design are becoming more sophisticated. Coupled with the advent of flexible manufacturing systems and data connectivity, they provide the stimulus for a new paradigm in factory layout design, and process and material flows.
3. Real-time factory scheduling: Digital business process re-engineering is leading to greater productivity, improved delivery performance and higher responsiveness to change through sensor- and smart device-enabled management and joined-up enterprise resource planning, manufacturing execution and cloud systems.
4. Flexible factory automation: Ever cheaper technology, collaborative robotics and machine learning are driving a new era of factory automation, enabling flexible reconfiguration and leading to lower cost for variety and greater customization, as well as potential labour savings.
5. Digital production processes: The shift towards replacing “subtractive” manufacturing processes (such as machining) with “additive” processes (such as laser sintering and digital printing) also enables new product designs and enhanced customization. These techniques could bring about the reconfiguration of entire industry supply chains.
6. E-commerce fulfilment: E-commerce is extended to web-based order management, including personalized configuration, omni-channel access and last-mile delivery. New business models are emerging that are based on customer-connected supply chains – constantly monitoring product usage and experience, and tailoring the offering. Sectors as diverse as construction vehicles (B2B) and consumer goods (B2C) are leading the way.
Box �gure IV.3.1. Digital transformations in manufacturing supply chains
2. Digitalfactory design
3. Real-time factoryscheduling
4. Flexible factoryautomation
5. Digital productionprocesses
7. Extended supply chain(near) real-time monitoring
9. Digital supplynetwork design
1. Automatede-sourcing
6. E-commerceful�lment
8. Digitalproduct quality 10. Product lifecycle
management
Inbound
Internal
Outbound
CustomersPrimeSuppliers
End-to-end
Source: ©J.S. Srai, University of Cambridge.
/...

Chapter IV Investment and the Digital Economy 179
b. Impact on international production
The adoption of digital technologies by non-ICT MNEs can have significant implications for their international operations, potentially affecting all stages of the value chain (figure IV.13):
• Upstream in the value chain, in inbound processes and supplier interactions, e-auctions can have multiple effects. They can bring in new suppliers and have a democratizing effect, allowing new entrants to participate in cross-border supply chains. Conversely, if purchasing platforms are complex or require qualifying capabilities that are challenging or are closed by design, they can also drive exclusivity and favour established partners. In non-commodity supply chains, digitalization can promote greater levels of supplier integration in terms of inventory control and new product development.
• In internal production processes, greater automation drives higher capital intensity and favours high-skilled, high-value jobs. Advanced manufacturing technologies that enhance replication and scale flexibility could also drive more distributed manufacturing models with significant local value added in host countries but sophisticated centralized coordination.
• Downstream, digitalization offers opportunities for disintermediation, with component and final-product manufacturers no longer constrained by retailers and wholesalers but accessing new channels to the end customer. MNE partnerships may change, with a shift from traditional distribution partners to new services partnerships and non-equity modes.
• Across the end-to-end supply chain, continuous reconfiguration of optimum site locations and sourcing options is being supported by more dynamic network design tools and improved forecasting driven by market data. This can lead to an increase in “footloose” behaviour of MNEs and higher fluctuations in production levels in affiliates or in the supplier base. Data across the supply chain will become increasingly valuable, with data ownership and free flow of data increasingly important as investment determinants.
Digital transformation in global supply chains pushes international production in conflicting directions, in terms of where and how MNEs invest. More capital-intensive production tends to result in fewer large production sites, often in locations with highly skilled, advanced-economy capabilities; yet distributed manufacturing options support larger numbers of
7. Extended supply-chain monitoring: Whereas transformation 4 focuses on flexible factory scheduling, a broader transformation relates to the complete, end-to-end supply chain, using predictive analytics and real-time risk management, enabled by sensors and track-and-trace processes to create visualization “watch towers”, optimize integration, predict disruptions and support dynamic decision-making.
8. Digital product quality: Total quality management in the digital context involves end-to-end transparency, real-time analytics and proactive resolution driven by customer connectivity. A series of “traceability islands” are connected back from customers, across internal operation networks, through to suppliers, leading to faster problem resolution and prevention, and compliance verification.
9. Digital supply-network design: Transformation 2 focuses on digital factory design, but a higher-level transformation relates to the entire supply network. This involves digital network design, modelling and visualization tools based on drivers of costs, risks and resource access. It can lead to new network design principles and changes in supply collaboration, site location, capacity, inventory and customer response.
10. Product life-cycle management: Next-generation systems for managing product life cycles can provide accurate, up-to-date product information accessible throughout the value chain. This enables enhanced cross-organizational involvement in design, collaborative innovation, design for manufacture or procurement, and quicker time to market.
Source: J.S. Srai, Centre for International Manufacturing, University of Cambridge.
Box IV.3. Adoption of digital technologies in global supply chains (concluded)

180 World Investment Report 2017 Investment and the Digital Economy
Digi
tal t
rans
form
atio
ns a
nd im
pact
on
inte
rnat
iona
l pro
duct
ion
Figu
re IV
.13.
Disc
rete
ass
embl
y in
dust
ries
(e.g
. au
tom
otiv
e, a
eros
pace
, mar
itim
e)
Cons
umer
ele
ctro
nics
whe
re c
ompo
nent
co
mpl
exity
requ
ires
auto
mat
ed s
ourc
ing
Dem
ocra
tizin
g vs
. exc
lusi
ve e
ffect
s on
su
pplie
rs
Clos
enes
s to
(B2B
) clie
nts,
sup
plie
rs
follo
win
g cl
ient
s ab
road
New
ent
ry m
odes
into
GVC
s an
d in
tern
atio
nal p
rodu
ctio
n ne
twor
ks
Prod
uctio
n-as
set-
inte
nse
indu
strie
s be
ne�t
ing
from
aut
omat
ion
to s
uppo
rt vo
lum
e an
d va
riant
�ex
ibili
ty
For 3
D pr
intin
g pr
oduc
ts:
inve
ntor
y-he
avy
indu
strie
s de
pend
ing
on s
mal
l-sca
le it
ems
and
spar
es
For c
ontin
uous
�ow
: bat
ch p
roce
ss
indu
strie
s se
ekin
g vo
lum
e �e
xibi
lity
High
-val
ue jo
bs, n
et e
mpl
oym
ent
redu
ctio
n, im
prov
ed p
rodu
ctiv
ity –
ca
pita
l int
ensi
ty
New
form
s of
con
trolle
d of
fsho
ring
and
outs
ourc
ing;
non
-equ
ity p
artn
ersh
ips
Enha
nced
tech
nolo
gica
l req
uire
men
ts o
f M
NEs,
par
tner
s an
d su
pplie
rs
Med
ia, �
nanc
ial s
ervi
ces
(e.g
. ins
uran
ce)
Shar
ing
econ
omy
(e.g
. Airb
nb, U
ber)
E-co
mm
erce
B2C
�rm
s, re
taile
rs,
fast
-mov
ing
cons
umer
goo
ds w
ith
last
-mile
dis
tribu
tion,
hea
lth c
are
solu
tions
Disi
nter
med
iate
d m
odes
redi
strib
ute
valu
e ad
ded
of lo
cal p
artn
ers
in h
ost
coun
tries
Serv
itiza
tion
and
outc
ome-
base
d co
ntra
ctin
g, "
Inte
l ins
ide"
com
pone
nt
mod
els
for v
alue
cap
ture
Incr
ease
d co
mpe
titio
n –
new
ent
rant
s ch
alle
nge
esta
blis
hed
play
ers
Regu
late
d in
dust
ries
requ
iring
co
nfor
man
ce (e
.g. p
harm
aceu
tical
s,
food
)
Thro
ugh-
life
prod
uct s
ervi
cing
(e.g
. ae
rosp
ace)
, int
ellig
ent w
hite
goo
ds
(e.g
. "sm
art"
refri
gera
tors
)
Ente
rpris
e da
ta s
yste
m p
rovi
ders
(e.g
. "w
atch
tow
ers"
)
Freq
uent
reco
n�gu
ring
of p
rodu
ctio
n lo
catio
ns, d
rivin
g M
NE fo
otlo
ose
beha
viou
rs
Incr
ease
d co
mpl
ianc
e re
quire
men
ts
for s
uppl
iers
and
use
rs
Open
ness
of d
ata
�ow
s an
d ow
ners
hip
beco
mes
an
inve
stm
ent
dete
rmin
ant
Dow
nstr
eam
/cu
stom
er re
latio
ns
End-
to-e
nd p
roce
sses
and
gove
rnan
ceIn
tern
al p
rodu
ctio
npr
oces
ses
Upst
ream
/su
pplie
r rel
atio
ns
Digi
tal
tran
sfor
mat
ions
Indu
stri
es
whe
re p
reva
lent
Inte
rnat
iona
l pr
oduc
tion
impl
icat
ions
Digi
tally
ena
bled
aut
omat
ion
of fa
ctor
y op
erat
ions
Digi
tal t
win
s en
ablin
g re
plic
atio
n, w
ith
prod
uctio
n cl
oser
to p
oint
of
cons
umpt
ion
Adva
nced
dig
itally
ena
bled
m
anuf
actu
ring
tech
nolo
gies
(e.g
. 3D
prin
ting,
con
tinuo
us p
roce
ssin
g)
Tran
spar
ency
and
trac
eabi
lity
and
prov
enan
ce o
f goo
ds w
ith d
igita
l qu
ality
and
com
plia
nce
syst
ems
Big-
data
-driv
en p
redi
ctiv
e su
pply
ch
ains
Use
of n
ew d
ata
man
agem
ent
prov
ider
s an
d sy
stem
inte
grat
ors
E-au
ctio
ns, w
ith o
pen
or c
lose
d sy
stem
s
Supp
lier-
or v
endo
r-m
anag
ed in
vent
ory
Colla
bora
tive
prod
uct o
r pr
oduc
tion-
proc
ess
desi
gn
Leve
l of m
atur
ity
Disi
nter
med
iatio
n in
pro
duct
del
iver
y an
d di
strib
utio
n m
odel
s; m
onito
ring
of
prod
uct u
se b
y en
d us
er
Digi
tally
ena
bled
pro
duct
cus
tom
izat
ion
Mas
s co
nnec
tivity
bet
wee
n cu
stom
ers
and
supp
liers
High
Low
Sour
ce: ©
UNCT
AD; s
ee a
lso
box
IV.3
on
the
adop
tion
of d
igita
l tec
hnol
ogie
s in
glo
bal s
uppl
y ch
ains
.

Chapter IV Investment and the Digital Economy 181
small-scale production locations. As for how and with whom MNEs partner, e-auctions lead to broader supplier relationships, and disintermediation to looser distribution partnerships, but complex co-design encourages closer and more exclusive supplier partnerships, and e-commerce fulfilment can lead to new customer service partnerships.
These opposing effects in the nature and direction of investment and partnerships, which are not mutually exclusive, in turn influence the impact of international production in host economies, following several possible scenarios (table IV.2).
(i) Distributed production: implications for international production
Distributed production is characterized by higher levels of customization, localized close to the point of consumption but with elements of centralized control, and supported by new production technologies such as 3D printing, which enables factory replication (digital twins) to ensure consistent product quality. It can also involve end-user participation in product design and production (see Srai et al., 2016, and Srai, Harrington and Tiwari, 2016).
For example, digitalization in the pharmaceutical sector will lead to more distributed production. The industry is currently characterized by predominantly large-batch, centralized manufacturing. This has led to a slow, inventory-heavy operating model that is increasingly regarded as inflexible and unsustainable. New markets and the rapidly evolving pharmaceutical and biotechnology landscape are driving greater product variety, shorter product life cycles and smaller drug volumes, exacerbating the accelerating unsustainability of the traditional production model. Future pharmaceutical supply chains will involve new production models that manufacture drugs to order and closer to the point of consumption. This scenario requires more widely distributed microfactories rather than the traditional centralized model. Final product or pack finishing may also take place at the local clinic or pharmacy to meet a patient’s individual medical needs.
Table IV.2. Illustrative digital adoption scenarios and implications for international production
ScenarioDescriptive elementsDescriptive elements
Possible international production implicationsPossible international production implications
Distributed production
• Localized manufacturing closer to the point of consumption
• Factory replication (digital twins) under centralized control
Patterns of investment and modes of governance:• More, smaller production locations, rather than
few, large locations
• Sophisticated centralized coordination and quality control
Accelerated servicifi cation
• Product servitization (power-by-the-hour models)
• Increased use of contract manufacturing and outsourcing of ancillary operations across more industries
Types of investment:• More investment in services
• More non-equity modes of production
Extended disintermediation
• Direct delivery of products and services to end users
• Branded manufacturers reaching out to end users; “Intel inside” model
Investment impact:• Increased value capture by MNEs
• Fewer local distribution partnerships, new service partnership opportunities
Flexible production
• Automation to support Customization (increased product variety) Production to order (volume fl exibility)
Investor behaviour:• More fl uctuations in output and use of labour
• More footloose production
Source: ©UNCTAD.

182 World Investment Report 2017 Investment and the Digital Economy
Although digitally enabled distributed production is still in its infancy, it is taking shape in many industries. One manifestation is the emergence of “makerspaces”, or community-based centres of production. Although many of the early examples of makerspaces were largely educational, often closely related to universities and technology centres, some have now evolved into commercially viable centres of early-stage prototyping and manufacturing. Gearbox (Kenya) is an example of a makerspace facility where 3D printing and other advanced manufacturing technologies are being used to develop local skills and to support prototype manufacturing and small-scale production.
(ii) Accelerated servicification: implications for international production
The servicification of manufacturing – the rise of services in the global economy – is a long-standing trend. It takes different forms, each of which is being accelerated by digitalization.
First, the fragmentation of value chains into separate “tasks” has brought to the surface many services activities that were previously “hidden” in manufacturing. Services can be incorporated as separate business entities or outsourced to external service providers. Digitalization is enabling the separation from the value chain and outsourcing of services activities beyond the administrative support and ancillary tasks that were already widely contracted out. Technical services, for example, are outsourced more and more often for specialist diagnostics, monitoring of equipment and quality testing.
Second, the outsourcing of production to contractors has led to manufacturing tasks being carried out as a service on a commission basis. The emergence of global contract manufacturing organizations (CMOs) has been accelerated by digital technologies: lower transaction costs through improved international communication capabilities between independent organizations has been vital. Beyond enhanced day-to-day operations that support inventory-light control mechanisms (such as vendor-managed inventory), digital technologies have also enabled improved product design and specification. As a result, outsourcing has become increasingly competitive, with firms focusing on core competencies and outsourcing ancillary activities. On both the supplier and distribution ends of manufacturing supply chains, crowdsourcing platforms allow new partners to enter the supply chain.
Third, many manufacturers of engineering equipment or capital goods have adopted business models that add services to their sales, as in the “power-by-the-hour” model for aircraft engines, where most revenues come from maintenance rather than direct asset sales. Digitalization is central to this servitization process, with data on usage allowing for “air miles”, as well as the condition of the engine, to be monitored using sensors and wireless communications to assess maintenance and servicing requirements. In terms of geographic dispersion, the service model promotes centralized control of asset management, with local intervention on servicing. The model has become widely prevalent in engineering industries and is being rolled out across other industries, as in Xerox’s “pay-per-page” system for photocopiers. In addition, physical goods are increasingly incorporating digital services content through apps or geolocation devices (e.g. in shipping containers), giving a further boost to servitization.
(iii) Extended disintermediation: implications for international production
The role of digitalization in downstream supply-chain disintermediation is perhaps most obvious with the ability to bypass wholesalers and distributors to move directly to final delivery. Effective demand capture can enable more direct delivery. For physical goods, this generally involves shorter supply chains. In the case of non-physical goods, such as media streaming or financial services, intermediaries are bypassed altogether. As such, the value

Chapter IV Investment and the Digital Economy 183
added of MNEs’ distribution partners in overseas markets is under pressure. At the same time, e-commerce delivery requires sophisticated distribution models, which challenges manufacturers and retailers alike by allowing the emergence of new entrants managing the last-mile delivery. Also, the disintermediation of distribution is resulting in the emergence of new services partnerships.
But disintermediation in the supply chain can extend to branded goods manufacturers. The digitalization of product design and equipment specifications enables component suppliers to engage directly with end users to ensure that they require the inclusion of their product into final goods. Here, the disintermediation is in the specification of products, rather than in the distribution: an original equipment manufacturer no longer selects a component; instead, this choice becomes an end-user requirement fostered by component suppliers. Often, this shift involves component providers from developed countries supplying branded high-end parts into final assemblies, lowering the final assembly value added. Although this phenomenon is not new, as illustrated by the “Intel inside” example in computers and automotive firms specifying componentry to module manufacturers, it is now increasingly prevalent in more sectors, enabled by digital technologies.
For example, in consumer home appliances, Strix heating-control elements are required componentry in most kettles manufactured globally, with production largely undertaken by CMOs on behalf of brand owners. Digitalization facilitates communication with users, specification control, production quality control and final-product quality and safety. Local suppliers to CMOs, often in developing countries and offering inferior quality, are sidelined. Similarly, in shipping, vessel designers engage with fleet operators who require the use of specialized equipment and components, for example, Brunvoll thrusters. Again, disintermediation is enabled by digitalization, which allows specification control and fleet operator engagement.
(iv) Flexible production: implications for international production
Digitalization continues to promote further automation in production, driven by expectations of significant productivity gains. Investment in automation and robotics pushes fixed capital costs for production higher. The business case for investment therefore requires scale, which, unlike the scenarios just described, could result in more centralization and high-volume manufacturing.
At the same time, highly automated and digitally enabled production can also support greater product variety and customization. Furthermore, production lines that are more flexible in terms of product allocations and manufacturing of multiple products allow more volume flexibility to meet seasonal or demand fluctuations. This could result in less stable output levels. Several emerging manufacturing production technologies, enabled by digitalization, affect the optimum scale of production and hence investment requirements and location decisions.
With 3D printing, for example, the dominant scenario is the small-scale production of components or spares close to the point of need. Continuous processing, another digitally enabled technology that is most evident in industries where traditional batch operations are being replaced by continuous flow (e.g. pharmaceuticals), may also transform production scale, and hence investment characteristics.
c. Impact on host-country firms
The digitalization process in global supply chains will have a profound impact on the overseas operations of MNEs, with important implications for host-country firms, especially

184 World Investment Report 2017 Investment and the Digital Economy
in developing countries. On the one hand, higher technological requirements imposed on suppliers can make it more difficult for local firms to participate in MNE-coordinated GVCs. On the other hand, new opportunities may arise for domestic firms to connect to the international production networks of MNEs or to operate through non-equity relationships.
In developing countries, firms in more technology-intensive industries show a higher propensity to adopt digital technologies for communications with customers and suppliers (figure IV.14). It is firms in lower-technology industries that will feel the greatest impact of digital demands placed on them by trends in global digital supply chains, to close the gap between upstream and downstream levels of digital adoption. For example, furniture retailers such as IKEA source from wood and pulp suppliers with low rates of technology adoption, while operating downstream in the highly connected retail sector, with emerging e-commerce applications. Firms in the agrifood sector show similarly low levels of adoption, while downstream in fast-moving consumer goods, food processing and retail is highly digitized. In contrast, technology adoption in the automotive industry is well advanced throughout the supply chain, with ICT infrastructure already established upstream within assembly plants and downstream in dealerships.
Figure IV.14. Business use of internet and level of technology intensity in developing countries, by industry Share of �rms using the internet for customer or supplier communications (Per cent)
Tech
nolo
gy in
tens
ity
Share of �rms using internet to communicate with customers or suppliersAverage
200 40 60 80
Motor vehicles, trailers and semi-trailers 77
Machinery and equipment, nec 76
Chemicals and chemical products 75
Rubber and plastics products 69
Pulp, paper, paper products, printing and publishing 65
Basic metals 64
Coke, re�ned petroleum products and nuclear fuel 66
Fabricated metal products 63
Textiles, textile products, leather and footwear 57
Food products, beverages and tobacco 53
Manufacturing nec; recycling 43
Other non-metallic mineral products 44
Wood and products of wood and cork 36
Computer, electronic and optical equipment 78
High-tech industries
Medium- to high-tech industries
Medium- to low-techindustries
Low-tech industries
Source: ©UNCTAD, based on data from the World Bank Enterprise Surveys.Note: Analysis based on manufacturing firms from developing countries only. Data are from 2016 or the latest available data point. Industry grouping by technology intensity is
adapted from the OECD ISIC rev.3 Technology Intensity Definition (based on R&D expenditure). Use of the internet by firms reflects the World Bank survey results on use of email and company websites. Running the analysis using sampling weights provided by the World Bank to reflect the population composition produces similar results. For data on OECD countries, see also OECD (2016).

Chapter IV Investment and the Digital Economy 185
4. Implications for investment policy: from analogue to digital
New actors on the international production scene and the evolving nature of MNE international operations have implications for strategic investment targeting, for policies and institutions promoting and facilitating investment, and for regulations governing investor behaviour. Investment rules designed for the physical economy may need to be reviewed in light of new digital business models. Many of the industries most affected by digitalization – such as retail, media and (consumer) finance – are also those in which numerous countries maintain investment restrictions. Some have taken steps to update policies, whereas others are facing the risk of letting rules become obsolete or of creating an uneven playing field for digital and non-digital firms.
The growing importance of ICT and digital firms in the MNE universe, and the gradual adoption of digital technologies by MNEs across all sectors, have important implications for investment policy. First, they affect traditional investment drivers and determinants. The investment decisions of ICT and digital MNEs are influenced by their soft and hard infrastructure needs (e.g. internet infrastructure, electricity supply and costs, ICT skills availability) and sector-specific policy preferences. Policies for the promotion and facilitation of investment in the digital economy need to take these factors into account. This is of immediate strategic relevance for policymakers aiming to attract investment in digital development.
Some of these factors increasingly affect the investment decisions of non-ICT and non-digital MNEs as well. In the longer term, as digital supply chains spread across all sectors, policymakers need to assess the challenges and opportunities that may arise for their participation in GVCs and international production networks, and consequently their priorities for strategic investment promotion.
In addition, the economic contribution of MNEs is becoming less tangible in the digital economy. This has further implications for investment authorities and investment promotion agencies (IPAs). Not only must they take into account an evolving new set of investment drivers and determinants in their targeting, policy advocacy and facilitation activities, but they also should consider how they assess their performance in carrying out these activities, which currently tends to be measured in terms of physical investment and jobs created.
E-government policies can foster digital development by setting the standard and driving the demand for digital services. They also provide a facilitation tool for discerning MNEs operating at higher levels of digitalization. Key digital tools for investment facilitation are online information portals and online single windows, which provide investor information, transparency on rules and regulations, and efficient administrative procedures for investors. Many governments could greatly improve their online investment facilitation (box IV.4).
Investment rules and regulations designed for the physical economy may need to be reviewed in light of new digital business models. This is most relevant in sectors such as retail, media and consumer finance, which are highly affected by digitalization and digital competitors. At the same time, they are among the sectors in which investment is often more highly regulated and in which many countries maintain ownership restrictions (figure IV.15).5 Global digital firms are also crossing industry boundaries, disrupting other highly regulated services industries, such as transportation (e.g. Uber).
The need for digital economy investment policies, modernizing or complementing analogue-era rules, is illustrated by India’s investment policy, which has long restricted foreign investment in the retail sector, allowing FDI in wholesale but not consumer retailing. To maintain this policy, the Indian Government has had to adopt certain restrictions on direct internet sales to consumers by companies such as Amazon, as well as investment measures

186 World Investment Report 2017 Investment and the Digital Economy
in 2016 that allow FDI in electronic marketplaces – online platforms for merchants – but not in e-commerce companies that manage their own inventory.
Physical economy rules can also have different effects in digital sectors. Indonesia defines certain investment thresholds below which foreign ownership limitations apply, to protect local SMEs. The value of these thresholds may constitute a higher barrier for asset-light digital investments than for physical investments.
The nature of many digital businesses, transcending industry boundaries, is a particularly difficult problem for regulators. In many countries, e-commerce may be regulated by a ministry of trade (as it is often considered retail), but platforms may be regulated by a ministry of telecommunication. Also, e-payment businesses (or e-payment parts of broader digital businesses) may face multiple regulatory regimes, between central banks and financial services authorities. These can also constitute an important hurdle in the development of a digital financial sector. Coordination between regulators and government institutions is crucial.
Box IV.4. Digital investment facilitation tools: online information portals and single windows
To promote transparency in the formulation of investment policies, regulations and procedures relevant to investors, UNCTAD’s Global Action Menu for Investment Facilitation promotes the establishment of online investor information portals and single windows. UNCTAD has developed a series of e-government tools for business and investment facilitation over the past decade (businessfacilitation.org):
• The eRegulations system – an information portal that sets out clear administrative procedures – seeks to boost transparency.
• The eSimplification tool sets out 10 key principles for governments to use in simplifying and streamlining procedures, reducing steps by up to 50 per cent without changing laws.
• The eRegistrations system enables governments to develop online single windows to facilitate procedures such as obtaining company registrations, construction permits and export licenses.
These tools are now used in 29 countries. They demonstrate that legal reform is not always necessary to improve business and investment facilitation, which greatly benefits from improving the application of existing rules and procedures.
UNCTAD has selected one procedure – business registration – and analysed it on a global scale. The Global Business Registration Portal, GER.co, links to all business and investor registration websites worldwide and rates each site. The ratings are based on 10 objective criteria, related to the quality and completeness of information on rules and procedures, as well as to user friendliness.
In 104 economies not supported by UNCTAD’s own eRegulations system, more than a third of portals contain only the minimum information required to qualify as business registration portals, and only about 10 per cent contain all (or almost all) information needed to register a business or investment (box figure IV.4.1). GER.co also rates online single windows. Only 30 online single windows are currently listed on the global portal.
Source: ©UNCTAD, based on data from GER.co. See also UNCTAD (2017a).Note: Statistics based on 104 economies not supported by UNCTAD’s eRegulations system. Criteria and ratings for individual countries’ portals can be found on GER.co.
Source: ©UNCTAD.
Distribution of information portals by share of quality criteria met(Per cent)
Box �gure IV.4.1.
11
25
32
36
76-100
51-75
26-50
0-25

Chapter IV Investment and the Digital Economy 187
Digitalization can challenge domestic regulators in areas as diverse as consumer protection, financial stability, and health and safety. For example, the Icelandic banking crisis was exacerbated by a run on large deposits in overseas e-savings accounts. And online purchases of pharmaceutical products enable consumers to bypass domestic health and safety regulations, such as the requirement to obtain a doctor’s prescription. Although beyond the direct remit of investment policymakers, sector regulations adopted in response to digital adoption may nonetheless affect investors.
Other policy areas in which the fast pace of digital development sometimes outstrips regulatory capacity include innovative financing structures of digital firms at various stages of growth, from start-up to maturity. Policymakers are playing catch-up: some countries have taken steps to update policies, whereas others are facing the risk of letting rules become obsolete or creating an uneven playing field for digital and non-digital firms.
At the international investment policy level, most IIAs, which typically were concluded before the emergence of digitalization, do not address the specificities of the digital economy. However, the dynamics of digitalization can have important implications for IIAs. For example, sectors where an open investment environment may be important for harnessing the benefits of digitalization might also be those where governments stop short of locking in openness in IIAs (e.g. by means of maintaining reservations or only making limited commitments in pre-establishment IIAs). Similarly, provisions setting out the scope and definition of an IIA may leave open questions about the IIA’s coverage of types of (mostly intangible) assets that are of particular relevance for digital MNEs (this may also apply to IIAs with so-called open ended, asset based definitions). All of this suggests that policymakers, when modernizing their country’s IIAs, are well advised to factor in digital economy-related considerations. Ensuring the best possible interaction between IIAs and other international agreements that deal with the digital economy (e.g. free trade agreement chapters on intellectual property, on e-commerce or on standards and technical barriers) is an important part of doing so.
Figure IV.15. Top 10 industries affected by digitalization and by FDI restrictions (Per cent)
8
9
13
16
16
20
21
30
50
56
Industries ranked by digital impact Industries ranked by FDI restrictions
Education
Accounting
Waste management
Agriculture and forestry
Financial services
Mining, oil and gas
Telecom
Electricity
Media
Transportation
Consumer packaged goods
Automotive and assembly
Financial services
Professional services
Telecom
Travel, transport and logistics
Healthcare systems and services
High tech
Retail
Media and entertainment
Share of executives (survey respondents) Share of countries with restrictions
62
55
54
51
44
44
42
39
32
31
Source: ©UNCTAD, based on McKinsey & Company (2017) and the World Bank’s Investing Across Borders database (http://iab.worldbank.org).

188 World Investment Report 2017 Investment and the Digital Economy
Furthermore, evolving international rules on services trade and e-commerce also have an investment policy dimension. An issue that clearly relates to investment is localization requirements, a type of trade-related investment measure (for a detailed analysis see UNCTAD (2016)). Also, the development of e-commerce raises questions related to investment in some financial services (payment systems) and courier services; digital MNEs depend on many types of business services (e.g., telecommunication, customs clearance, express parcel, finance and insurance), which to date remain partially closed to FDI. Moreover, the international provision of services will be an increasingly important part of a digital economy, and digitalization will accelerate the servicification trend. In other words, ever more investment could be covered under the General Agreement on Trade in Services.
The impact of digitalization on investment policy is especially important as countries are actively pursuing strategies to push digitalization in their economy. The next section examines the investment dimension of digital development strategies and looks in more detail at specific investment policy aspects.

Chapter IV Investment and the Digital Economy 189
1. Digital development strategies: the investment dimension
Many countries have published or are preparing development strategies for the digital economy. Yet most digital development strategies fail to adequately address investment needs, and those that do often focus exclusively on investment in infrastructure (broadband coverage), with very few touching on the potential role of foreign investment or IPAs. A comprehensive digital development strategy should cover investment in infrastructure, in digital firms and in the digitalization of firms across all industries.
There is a significant digital divide today between developed and developing countries, in particular LDCs (World Bank, 2016). Individual internet adoption levels vary significantly across regions, with the share of people using the internet in developing economies at less than half that of developed economies, and the share in Africa at half the average of developing economies (figure IV.16).
The digital divide concerns not only individuals. The adoption of broadband and usage of key tools such as email and websites among firms are also lagging in developing countries. Although the gap is smaller than for individuals, it is potentially more worrying, given the benefits that digital adoption by firms can bring to economic and social development.
Narrowing these gaps has been on the agenda of both national and international policymakers. At the international level, increasing the availability and affordability of internet access is part of the SDGs. Better internet access is also widely acknowledged to be instrumental for
C. INVESTMENT IN DIGITAL DEVELOPMENT
Figure IV.16. Internet adoption (Per cent)
Developed economies
Asia
Latin America and the Caribbean
Transition economies
Developing economies
Africa
Total
81
58
45
60
75
71
61
40
83
39
20
49
55
55
49
14
Share of the population using the internet Share of �rms using the internet
Memorandum Item:LDCs
Source: ©UNCTAD, based on ITU World Telecommunication/ICT Indicators database (internet adoption) and data from the World Bank Enterprise Surveys (internet adoption by firms).
Note: Data on the adoption of the internet by firms reflects the World Bank survey results on use of email and company websites. Data are from 2016 or the latest available data point. Running the analysis using sampling weights provided by the World Bank to reflect the population composition produces similar results. For data on internet adoption by firms in OECD countries, see OECD (2016).

190 World Investment Report 2017 Investment and the Digital Economy
the achievement of many of the other SDG targets. A number of international organizations, including the ITU, the World Bank and UNCTAD, have focused on narrowing the digital divide for many years, recognizing that digital adoption can boost economic growth and sustainable development (see box IV.5 on UNCTAD’s eTrade for All initiative).
Efforts to close the digital divide are also taking place at the national level. Many countries have adopted digital development strategies. Digital strategies are cross-sectoral plans that address policy objectives related to the development of a digital economy and society. Common objectives include developing broadband infrastructure; promoting digital firms, both international and local (the “digital sector”); strengthening e-government; and encouraging businesses and SMEs to adopt digital technologies, as well as promoting general ICT skills and competencies. The priorities in any country’s strategy generally depend on the level of digital adoption in that country, with less digitalized economies focusing more on connectivity and promoting digital skills and adoption, and more digitalized economies seeking to upgrade to high-speed internet and to promote user and data protection.
For this report, UNCTAD examined the extent to which digital strategies address investment needs and whether foreign investment is considered as a source of finance. The research focused on investment needs related to two specific objectives, namely the development of broadband infrastructure and the development of digital business (box IV.6; see also UNCTAD, 2017b).
Although the development of digital infrastructure and of a digital industry will necessarily require significant amounts of investment in most countries – a fact acknowledged in the majority of digital development strategies – many strategies either fail to include the investment dimension entirely or address investment needs only in very general terms (figure IV.17), and little detail is typically provided about the type or quantity of investment required.
Box IV.5. UNCTAD’s eTrade for All initiative
This UNCTAD-led initiative, launched in 2016, aims to improve the ability of developing countries, and particularly LDCs, to use and benefit from e-commerce.
The initiative responds to demand from numerous development partners, foundations and private sector actors who seek to harness the power of the internet to foster economic development. Its objective is to create synergies and bring together current efforts, which are often fragmented and lack sufficient scale.
The initiative’s main tool is an online platform to help developing countries and donors navigate the supply of and demand for e-commerce development support, learn about trends and best practices, and raise the visibility of various partners’ initiatives and resources.
The initiative focuses on seven key policy areas of e-commerce development:
• E-commerce readiness assessment and strategy formulation
• ICT infrastructure and services
• Trade logistics
• Payment solutions
• Legal and regulatory frameworks
• E-commerce skills development
• Access to financing
Source: ©UNCTAD.

Chapter IV Investment and the Digital Economy 191
Box IV.6. Mapping the investment dimension in digital development strategies
Drawing on an ITU database of digital strategies and on additional research, UNCTAD identified 102 digital strategies from countries in all regions. The strategies include 30 plans that exclusively address broadband infrastructure, 6 that only focus on digital business development and 61 that cover both areas (box table IV.6.1). About 60 per cent of these strategies were adopted in 2012 or later.
Assessment of the role of investment in digital strategies was based on three main questions: (i) Does the strategy include a dedicated section addressing financing needs, and, specifically, does it identify assets required or quantify investment needed? (ii) Does it identify potential sources of finance, such as public or private investment, public-private partnerships, foreign investment or others? and (iii) Does it refer to any relevant policy measures to promote or facilitate the financing of the plans? Special attention was given to the potential roles of foreign investment and of IPAs.
Source: ©UNCTAD.
Box table IV.6.1. Digital development strategies by region (Number of strategies)
Objective
All strategiesBroadband
infrastructure Digital business
Developed economies 32 27 21
Developing economies 59 54 40
Africa 25 23 17
Asia and Oceania 16 15 9
Latin America and the Caribbean 18 16 14
Transition economies 11 10 6
Total 102 91 67
Source: ©UNCTAD, digital strategies survey. Note: The strategies also include the digital plan of the Association of Southeast Asian Nations (ASEAN). For some
countries, more than one strategy is included.
19
43
33
52
69
13
29
54
75
81
Figure IV.17. The investment dimension in digital development strategies, by objective(Percentage of strategies)
Acknowledgement of investment needs Proposed sources of �nance
Other
Foreigninvestment
Public-privatepartnership
Privateinvestment
Public �nance
4
43
24
55
Digital businessBroadband infrastructure
Financing needs
Amount speci�ed
Source: ©UNCTAD, digital strategies survey.Note: “Financing needs” includes any strategy that contains a section or paragraph dealing with financing.

192 World Investment Report 2017 Investment and the Digital Economy
Of 91 strategies including digital infrastructure objectives, only 50 have any section or paragraph dealing with infrastructure investment needs; of those, only 20 include an assessment of the amount of investment required, and only 8 specify the type of investments or assets required. Despite the lack of detail on investment requirements, most plans acknowledge different potential sources of finance for digital development, with public funding being the most common, then private, followed by public-private partnerships. In the 76 plans that acknowledge the importance of private investment in digital infrastructure development, proposed policy measures tend to focus on strengthening sector regulatory frameworks, incentives and digital standards (figure IV.18).6
Similarly, of the 67 strategies that include digital business development objectives, only 29 acknowledge investment needs, of which only 3 contain an assessment of the amount of investment required. Again, most refer to potential sources of financing, with public support the most common. Of the 49 plans that acknowledge the importance of private investment in digital business development, most propose to do so through conducive regulatory frameworks; incentives, investment facilitation, incubators and clusters are also commonly proposed measures.
Discussion of the role of IPAs is practically non-existent in digital development strategies. Only four of those strategies that acknowledge the importance of private investment in either broadband infrastructure or digital business foresee a specific role for their domestic IPAs.
Investment promotion can play a role in the development of both broadband infrastructure and a digital industry. In fact, despite the limited role assigned to IPAs in digital development strategies, most agencies consider these two areas as priorities for investment promotion –
well over 80 per cent, according to UNCTAD’s separate IPA survey (UNCTAD, 2017b).
Although investment incentives and other facilitation measures are among the more frequently proposed initiatives to promote private investment in digital development strategies, only about half of IPAs indicated that their country has any incentives or other instruments in place specifically designed to attract investment to the digital economy. Therefore, in addition to a coordination gap, there could also be an implementation gap when it comes to investment promotion.
In line with the findings of the digital strategies survey, only about one in five IPAs indicated that they have been involved in the formulation of a broadband strategy or digital development strategy (figure IV.19). Coordination between institutions involved in investment promotion and digital development is most common in developed countries, in particular regarding digital strategies, and in Africa, in particular for broadband plans.
In short, the results from the two surveys show that
• Not all countries have a digital development strategy, but of those that do, most acknowledge the need for investment.
Figure IV.18.
Policies to promote private investment in digital development strategies, by objective(Percentage of strategies)
Digital business
Broadband infrastructure4
2
39
41
14
61
69
7
4
13
41
51
57
62
Other promotionmeasures
IPA promotionactivities
Clusters or incubators
Facilitation
Standards
Incentives (�scal,�nancial, guarantees)
Regulatoryframework
Source: ©UNCTAD, digital strategies survey.Note: Limited to strategies that acknowledge the need for private investment for
broadband infrastructure (76) and digital business (49).

Chapter IV Investment and the Digital Economy 193
• Hardly any strategy contains a specific investment chapter; most discuss investment needs only in general terms.
• Policy measures to promote private investment that are proposed in digital development strategies tend to focus on improving the (sectoral) regulatory framework. Other measures include incentives and general facilitation, digital standards, and clusters and incubators for digital business development.
• Less than half of digital development strategies consider foreign investment as a source of finance. IPAs mostly do not feature in the plans.
• IPAs are generally not involved in the formulation of digital strategies. Nevertheless, most IPAs count the promotion of investment in digital infrastructure and digital firms, as well as the development of linkages between foreign investors and domestic firms in the digital sector, among their priority objectives.
• Although incentives and facilitation measures are frequently proposed in digital development strategies, only a minority of IPAs have investment promotion instruments for the digital economy.
The discrepancies between the two surveys’ results suggest that policy coordination between investment authorities, on the one hand, and ministries and public institutions charged with digital development, on the other, could be improved. Ideally, IPAs should be engaged in the formulation of digital development strategies, as part of an inclusive consultation process.
The growth and advancement of a digital economy rests on three pillars: digital infrastructure, digital firms (the digital sector) and digital adoption in the broader economy (figure IV.20). Investment policies are relevant at each level. As countries progress in digital development, government priorities shift from supporting infrastructure to promoting the development of content and services by digital firms, as well as digitalizing the rest of the economy. To adapt to evolving needs and technology, digital development strategies must be flexible and reviewed regularly. There is, of course, no single digital development blueprint; each country needs to develop along the three dimensions, setting out its own path.
2. Investment in digital infrastructure
Investment requirements to achieve adequate connectivity for most developing countries are less daunting than often supposed: the SDG connectivity targets could be attainable with an enabling framework for private investment and policies aimed at generating sufficient demand. Government support and public-private partnerships may be needed to achieve universal connectivity, including in thinly populated and low-income areas. Although telecom firms construct the bulk of networks and support the development of internet exchange points, attracting digital MNEs can also help complete internet infrastructure (e.g. content distribution networks and data centres). Regional cooperation for investment in internet infrastructure can increase the attractiveness of infrastructure projects for international investors.
Figure IV.19.Investment promotion agencies involved in digital development strategies (Percentage of responses)
Developed economies
Developing economies
Africa
Latin America and the Caribbean
Asia and Oceania
Transition economies
25
18
33
912
14
33
19
25
18
13 14
Broadband strategy Digital strategy
Source: ©UNCTAD, IPA survey.

194 World Investment Report 2017 Investment and the Digital Economy
Digital development and investmentFigure IV.20.
Typical investment needs
Typical investors
Relevanceof investment policies andinvestment support measures
Digital infrastructure
Digital �rms
Wider digitaladoption
International, national, last-mile connectivity
Internet exchange points (IXPs)
(Mobile) network operators and internet service providers (ISPs)
Global digital �rms
Governments
Sector-speci�c foreign investment rules
Privatizations
Public-private partnerships
Investment-related policies (e.g. competition)
Local platforms (e.g. social networks, e-commerce)
Local enterprise development
Data centres
Training and capacity-building
Global digital �rms
Data centre providers
Venture capital, private equity, other funds
Local �rms (e.g. media �rms)
Innovation hubs, incubators
Enabling environment for innovative forms of �nancing
ICT adoption/devices
Training
Local businesses
Public institutions and governments
E-government investment facilitation
Business linkages programmes supporting participation in GVCsSource: ©UNCTAD.
The first level of digital development involves the deployment of the internet infrastructure required to provide connectivity. Investment in infrastructure takes many forms. In most developing countries, significant gaps remain in basic broadband coverage, which need to be addressed to meet the SDG target of universal availability and adoption of the internet (box IV.7). But significant infrastructure investment is still required in developed countries and emerging market economies as well, even when effectively all citizens may be able to access the internet through mobile and fixed broadband access. Where coverage is available, growing adoption, which requires updates of technology and increases in capacity, drives investment. For instance, in the European Union, the Digital Agenda sets a target for all citizens to have access to broadband speeds of at least 30 Mbps by 2020 and for at least 50 per cent of households to adopt broadband with speeds greater than 100 Mbps.7
As shown in the preceding section, the digital development strategies of many developing countries lack detail on the infrastructure investments required to achieve the objectives of the strategy (box IV.8). A high-level assessment of investment needs, based on existing coverage and simple parameters influencing investment costs – such as population density and urbanization – can provide useful insights for policymaking, helping to set priorities and point the way towards cost-effective measures. This section looks at the potential infrastructure investment costs associated with achieving the SDG target of universal access, indicating how policymakers could estimate high-level investment costs for their own countries. The needs assessment is followed by a discussion of what policies would be conducive to investment in internet infrastructure.
A clear investment policy perspective in digital infrastructure development strategies is also important, given that a large share of investments in developing countries are driven by MNEs. Greenfield projects in ICT infrastructure have been undertaken in a wide range of developing and transition economies. Over the period 2012–2016, some 730 ICT infrastructure projects were announced in developing and transition economies (table IV.3).

Chapter IV Investment and the Digital Economy 195
Box IV.7. Investing in the digital economy and the SDGs
Investing in the digital economy can significantly contribute to the SDGs, adopted by the United Nations on 25 September 2015. It directly supports achieving target 9.c (under Goal 9; industry, innovation and infrastructure), which aims for increased access to ICTs and universal and affordable access to the internet in LDCs by 2020. ICTs are also specifically mentioned in three other targets, namely those concerned with ICT enrolment in higher education (target 4.b), women’s empowerment (target 5.b), and science, technology and innovation capacity-building (target 17.8). Indirectly, ICTs can also be catalysts for many other SDGs for which investments in digital applications lead to innovation and new opportunities, for instance in agriculture, health, education, gender equality, economic growth and climate change.
No hunger (Goal 2). In the case of agriculture, digitalization of production may enhance worldwide food security and improve nutrition. So-called “smart agriculture” enables farmers to make informed management decisions based on quantitative data at a much higher level of precision than was previously possible.
Good health and well-being (Goal 3). Telemedicine, e-health and m-health applications have the potential to make high-quality health care more accessible and affordable. In 2016, investment in digital health reached an estimated $7.9 billion,a and it is expected to grow to $233 billion by 2020.
Quality education (Goal 4). Investment in e-learning offers great potential to ensure inclusive and equitable quality education and promote lifelong learning opportunities for all. Investments reached $3.6 billion in 2015,b mostly targeting projects based on online tutoring.
Gender equality (Goal 5). Providing access to the internet and improving digital fluency can contribute to gender equality. Economic participation by 600,000 women in developing countries resulting from better internet access is estimated to boost annual GDP in those countries by $13–18 billion, while achievement of digital fluency is estimated to reduce the pay gap by 21 per cent worldwide by 2030 (Accenture, 2016 and 2017).
Decent work and economic growth (Goal 8). ICT technologies and digital applications can play an important role in expanding access to finance and economic growth. Mobile banking and fintech already are catalysts for local businesses and social enterprises, which are particularly important in developing markets, where SMEs contribute up to 45 per cent of employment and 33 per cent of GDP.c Global fintech investment grew 75 per cent in 2015, exceeding $22 billion.d
Climate action (Goal 13). Digital technologies can help with climate change mitigation and adaptation. Global CO2 savings resulting from
efficient use of ICTs is estimated to amount to 15 per cent of global emissions. ICT technologies may also be used to monitor climate change impacts. For instance, a joint task force of the ITU, the World Meteorological Organization and the United Nations Educational, Scientific and Cultural Organization is investigating the use of submarine telecommunication cables for ocean and climate monitoring and for disaster warning.
Source: ©UNCTAD, based on United Nations (2015), Accenture (2016 and 2017) and Deloitte (2016). a Baum, S., “Start Up Health: Digital health investment reaches $7.9B across 585 companies in 2016”, MedCity News, 30 December, http://medcitynews.com.b Lafuente López, L., “Investments in The Education Sector”, eLearning Industry, 19 June 2016, https://elearningindustry.com.c “Small and Medium Enterprises (SMEs) Finance”, World Bank, 2015, http://worldbank.org.d Delventhal, S., “Global Fintech Investment Hits Record High in 2016”, Investopedia, 13 June 2016, www.investopedia.com.
Destination region Number of projects
Jobs Capital investment
Total AverageTotal
(Millions of dollars)Average
(Millions of dollars)
Africa 145 11,337 78 24,877 171.6
Asia 357 27,121 76 36,612 102.6
Latin America and Caribbean 186 17,456 93 54,496 293.0
Transition economies 42 3,642 86 2,401 57.2
Total 730 59,556 81 118,386 162.2
Table IV.3. Announced greenfi eld FDI projects in ICT infrastructure, by destination region, 2012−2016
Source: ©UNCTAD, based on information from Financial Times Ltd, fDi Markets (www.fDimarkets.com).

196 World Investment Report 2017 Investment and the Digital Economy
Although the top 10 destinations accounted for over half of the projects, 114 developing and transition economies hosted at least one project. The data also confirm the relatively low direct employment impact of ICT infrastructure investments, as discussed in section IV.B; however, these projects can make important capital contributions to digital development, the real objective in promoting ICT infrastructure investments.
Infrastructure investments are no longer solely the domain of telecommunication operators; several digital firms are beginning to invest in almost every type of infrastructure. For example:
• Submarine cable: Google and Facebook are investing in a cable to connect Los Angeles and Hong Kong.
• Backbone: Google and Facebook have separate projects to provide backhaul in remote regions using aerial platforms (balloons and drones, respectively).
• Metro: Google’s Project Link is to provide metro fibre in cities in Africa, starting in Kampala, Uganda.
• Last mile: Microsoft’s 4Africa Initiative is investing in broadband service providers.
Digital MNEs engage in wholesale investments to provide additional capacity and new networks, and to help ISPs get access to the internet. MNEs in the software and IT services sector, most notably Amazon, were responsible for a sizeable number (11 per cent) of projects. Three of the top five investing MNEs were based in developing countries.
a. Investment needs for universal internet access
Because of the widespread deployment of mobile networks, internet availability has expanded significantly in recent years. In fact it often far outpaces internet adoption. In any country, investment needs related to internet availability can be broken down by three regions: (i) where there is no coverage, (ii) where there is cellular coverage and (iii) where cellular coverage has been upgraded to broadband:
Box IV.8. Digital infrastructure components
The infrastructure investments that are the foundation for digital development are generally carried out by telecommunication operators, whether local firms or telecom MNEs. They include major long-term investments in four kinds of connectivity:
• International connectivity. Fibre-optic cables used to connect a country or region to the global internet. These include submarine cables to connect continents and coastal countries within a region and terrestrial cables to connect landlocked countries.
• National connectivity (“backbone”). Typically fibre-optic cables, used to connect points within a country and by internet service providers (ISPs) to access international capacity; also used to connect among operators.
• Metro connectivity. Used within a city to connect operators to each other and to connect larger customers directly.
• Last-mile connectivity. Used by ISPs to reach end users, more and more often, through wireless connections provided by mobile operators; also through fixed connections using copper, fibre or coaxial cables.
A final important part of internet infrastructure concerns internet exchange points (IXPs). These connection points enable local providers to exchange internet traffic directly with one another in an efficient manner. Without IXPs, traffic must be exchanged outside the country, which is much slower and uses expensive international capacity. IXPs underpin the rest of the infrastructure, as they may be used by any of the providers and help create an efficient internet. The importance of IXPs far outweighs their investment cost, as they can be deployed relatively inexpensively, and often by a non-profit association of the members who will use the IXP (Internet Society, 2015).
The number of countries that have an IXP, as well as the number of IXPs within countries, has been rising steadily. Yet more than 70 countries still lack an IXP (mostly developing countries in Africa, Latin America and Central Asia), and others have IXPs that are not functioning well.a This key piece of infrastructure investment is necessary to promote digital growth in these countries and should be considered a priority.
Source: ©UNCTAD. a See Packet Clearing House, “Packet Clearing House Report on Internet Exchange Point Locations”, www.pch.net/ixp/summary.

Chapter IV Investment and the Digital Economy 197
• No coverage. Regions with a complete lack of cellular coverage tend to be characterized by high deployment costs and low demand. Deployment costs can be high because of difficult topography, such as in mountainous areas, or because of low population density. Demand can be low because of very low income levels in a region. In such regions, commercial investment may not occur, and a variety of models such as community deployment of networks are being used to create access. Where new mobile networks are deployed, it is typically more cost-effective to leapfrog directly to a generation of technology that supports mobile broadband – e.g. 3G or beyond.
• Cellular coverage. In these regions, mobile networks offer voice services (2G) but have not been upgraded to offer internet broadband access. That is typically because there is not enough demand for services. As demand increases, the network will need to be upgraded to 3G or beyond. This is an investment made by the mobile operators.
• Broadband coverage. These regions already enjoy at least 3G coverage, meaning that users have access to the internet. Here investment is typically an incremental response to increased usage and numbers of users.
Even in regions with broadband coverage, internet adoption often lags. The reason is that investment in infrastructure alone is not sufficient to stimulate adoption. Affordability is a key barrier (World Bank, 2016): the cost of devices to access the internet, or the cost of the internet subscription, may be too high for users in low-income countries. Improving affordability should be a policy priority for sector regulators and competition authorities. The interplay between these policy areas and investment policy is clear: infrastructure investment will not be economic if the uptake by users remains low. The same is true for other barriers to adoption relating to availability of locally relevant content and training in digital skills (covered in the next section).
Figure IV.21 shows the adoption gap (the difference between internet adoption and availability), and the broadband gap divided into two parts: the upgrading gap (where only 2G coverage is available), and the coverage gap (where there is no cellular coverage at all).
82 17 2
40 30 24 6
21 35 33 11
50 32 15 3
52 23 21 4
60 24 14 1
13 36 38 14
Figure IV.21. Internet adoption and connectivity gaps, by region Percentage of population using or connected to mobile broadband
2G coverage gapCurrent adoption Adoption gap 3G upgrading gap
Investment required for universal internet access
Developed economies
Developing economies
Africa
Asia
Latin America and the Caribbean
Transition economies
Memorandum Item:LDCs
Source: ©UNCTAD, based on ITU World Telecommunication/ICT Indicators database.
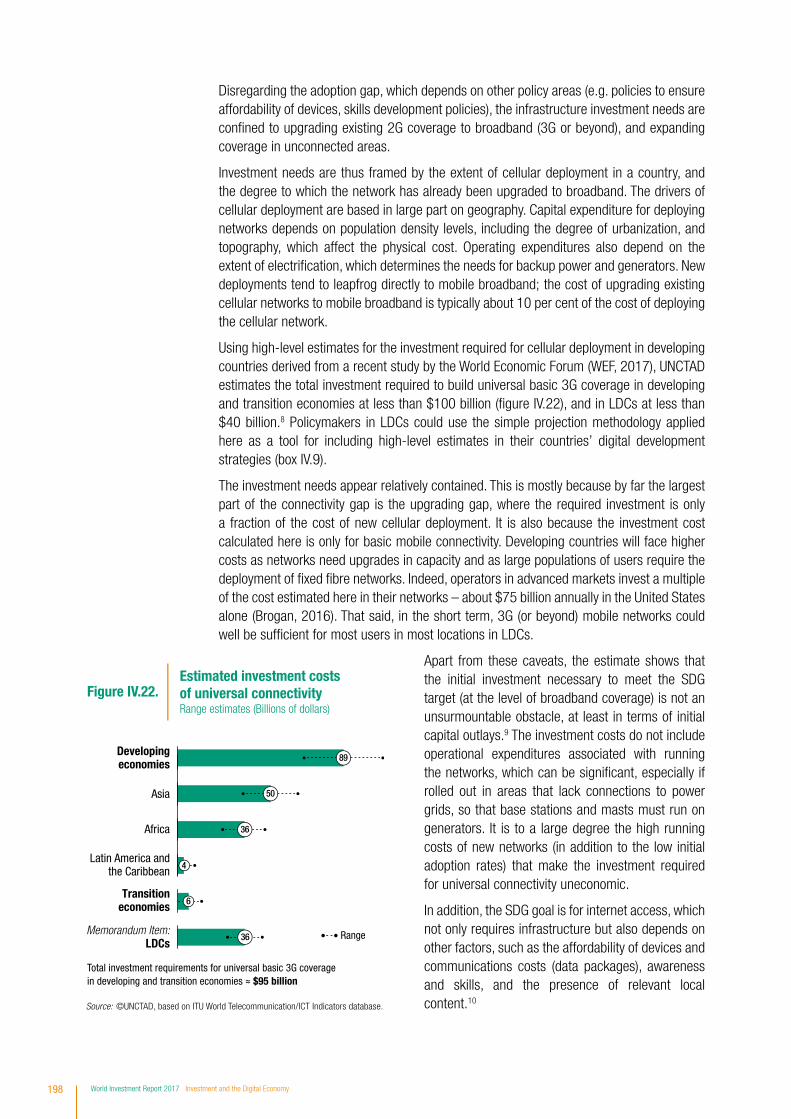
198 World Investment Report 2017 Investment and the Digital Economy
Disregarding the adoption gap, which depends on other policy areas (e.g. policies to ensure affordability of devices, skills development policies), the infrastructure investment needs are confined to upgrading existing 2G coverage to broadband (3G or beyond), and expanding coverage in unconnected areas.
Investment needs are thus framed by the extent of cellular deployment in a country, and the degree to which the network has already been upgraded to broadband. The drivers of cellular deployment are based in large part on geography. Capital expenditure for deploying networks depends on population density levels, including the degree of urbanization, and topography, which affect the physical cost. Operating expenditures also depend on the extent of electrification, which determines the needs for backup power and generators. New deployments tend to leapfrog directly to mobile broadband; the cost of upgrading existing cellular networks to mobile broadband is typically about 10 per cent of the cost of deploying the cellular network.
Using high-level estimates for the investment required for cellular deployment in developing countries derived from a recent study by the World Economic Forum (WEF, 2017), UNCTAD estimates the total investment required to build universal basic 3G coverage in developing and transition economies at less than $100 billion (figure IV.22), and in LDCs at less than $40 billion.8 Policymakers in LDCs could use the simple projection methodology applied here as a tool for including high-level estimates in their countries’ digital development strategies (box IV.9).
The investment needs appear relatively contained. This is mostly because by far the largest part of the connectivity gap is the upgrading gap, where the required investment is only a fraction of the cost of new cellular deployment. It is also because the investment cost calculated here is only for basic mobile connectivity. Developing countries will face higher costs as networks need upgrades in capacity and as large populations of users require the deployment of fixed fibre networks. Indeed, operators in advanced markets invest a multiple of the cost estimated here in their networks – about $75 billion annually in the United States alone (Brogan, 2016). That said, in the short term, 3G (or beyond) mobile networks could well be sufficient for most users in most locations in LDCs.
Apart from these caveats, the estimate shows that the initial investment necessary to meet the SDG target (at the level of broadband coverage) is not an unsurmountable obstacle, at least in terms of initial capital outlays.9 The investment costs do not include operational expenditures associated with running the networks, which can be significant, especially if rolled out in areas that lack connections to power grids, so that base stations and masts must run on generators. It is to a large degree the high running costs of new networks (in addition to the low initial adoption rates) that make the investment required for universal connectivity uneconomic.
In addition, the SDG goal is for internet access, which not only requires infrastructure but also depends on other factors, such as the affordability of devices and communications costs (data packages), awareness and skills, and the presence of relevant local content.10
Total investment requirements for universal basic 3G coveragein developing and transition economies ≈ $95 billion
4
6
36
36
Figure IV.22.Estimated investment costs of universal connectivityRange estimates (Billions of dollars)
Developingeconomies
Africa
Asia
Latin America andthe Caribbean
Transitioneconomies
Memorandum Item:LDCs
Range
50
89
Source: ©UNCTAD, based on ITU World Telecommunication/ICT Indicators database.
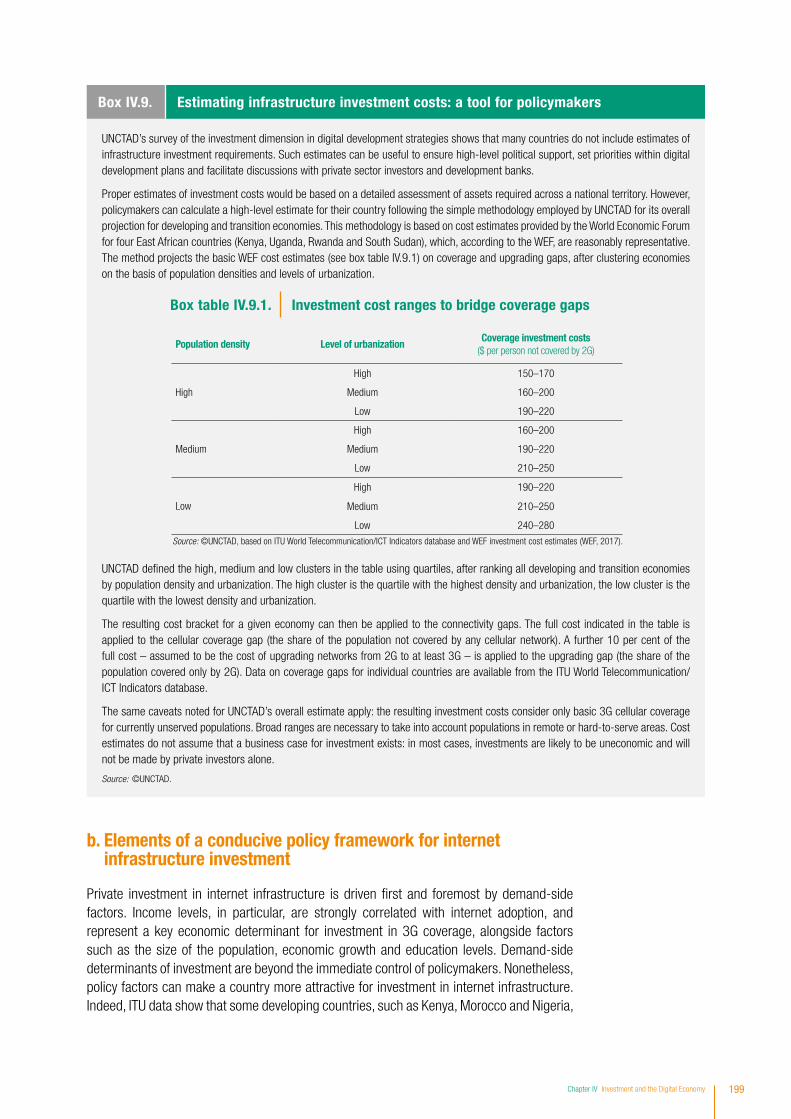
Chapter IV Investment and the Digital Economy 199
b. Elements of a conducive policy framework for internet infrastructure investment
Private investment in internet infrastructure is driven first and foremost by demand-side factors. Income levels, in particular, are strongly correlated with internet adoption, and represent a key economic determinant for investment in 3G coverage, alongside factors such as the size of the population, economic growth and education levels. Demand-side determinants of investment are beyond the immediate control of policymakers. Nonetheless, policy factors can make a country more attractive for investment in internet infrastructure. Indeed, ITU data show that some developing countries, such as Kenya, Morocco and Nigeria,
Box IV.9. Estimating infrastructure investment costs: a tool for policymakers
UNCTAD’s survey of the investment dimension in digital development strategies shows that many countries do not include estimates of infrastructure investment requirements. Such estimates can be useful to ensure high-level political support, set priorities within digital development plans and facilitate discussions with private sector investors and development banks.
Proper estimates of investment costs would be based on a detailed assessment of assets required across a national territory. However, policymakers can calculate a high-level estimate for their country following the simple methodology employed by UNCTAD for its overall projection for developing and transition economies. This methodology is based on cost estimates provided by the World Economic Forum for four East African countries (Kenya, Uganda, Rwanda and South Sudan), which, according to the WEF, are reasonably representative. The method projects the basic WEF cost estimates (see box table IV.9.1) on coverage and upgrading gaps, after clustering economies on the basis of population densities and levels of urbanization.
UNCTAD defined the high, medium and low clusters in the table using quartiles, after ranking all developing and transition economies by population density and urbanization. The high cluster is the quartile with the highest density and urbanization, the low cluster is the quartile with the lowest density and urbanization.
The resulting cost bracket for a given economy can then be applied to the connectivity gaps. The full cost indicated in the table is applied to the cellular coverage gap (the share of the population not covered by any cellular network). A further 10 per cent of the full cost – assumed to be the cost of upgrading networks from 2G to at least 3G – is applied to the upgrading gap (the share of the population covered only by 2G). Data on coverage gaps for individual countries are available from the ITU World Telecommunication/ICT Indicators database.
The same caveats noted for UNCTAD’s overall estimate apply: the resulting investment costs consider only basic 3G cellular coverage for currently unserved populations. Broad ranges are necessary to take into account populations in remote or hard-to-serve areas. Cost estimates do not assume that a business case for investment exists: in most cases, investments are likely to be uneconomic and will not be made by private investors alone.
Source: ©UNCTAD.
Population density Level of urbanizationCoverage investment costs
($ per person not covered by 2G)
High
High 150–170
Medium 160–200
Low 190–220
Medium
High 160–200
Medium 190–220
Low 210–250
Low
High 190–220
Medium 210–250
Low 240–280
Box table IV.9.1. Investment cost ranges to bridge coverage gaps
Source: ©UNCTAD, based on ITU World Telecommunication/ICT Indicators database and WEF investment cost estimates (WEF, 2017).

200 World Investment Report 2017 Investment and the Digital Economy
have achieved levels of connectivity and internet adoption well beyond the average observed in other countries that have similar incomes per capita and demographic characteristics.
Drawing on the ample experience in many countries with the liberalization of the telecommunication sector over the last three decades, three major reforms have emerged as important determinants for private investment in digital development:
• Privatization of the incumbent telecommunication operator
• Opening of the sector to competition
• Establishment of an independent sector regulator
These reforms send important signals to investors. Privatizing the incumbent, of course, directly creates an investment opportunity. It also signals to other investors that there is a lower risk that the government will favour the incumbent in policy or regulatory decisions. Opening to competition signals the extent to which the sector will operate under market forces. Finally, establishing an independent regulatory agency further signals impartiality in decision-making while also ensuring a measure of regulatory certainty in the face of changes in government.11
Despite the positive correlation between these reforms and the level of investment in connectivity (figure IV.23), not all countries have adopted them. Of 118 countries surveyed
by the ITU in 2015, 50 had adopted all three, 44 countries had adopted two, and 24 countries one or none. Broadband coverage, a proxy for the level of investment, is at least 10 per cent higher in those countries that have embraced all three reforms.
Opening the sector to competition often also involves opening it to foreign investment or allowing foreign participation. Many countries have made regulatory changes to successfully attract foreign investment, but restrictions on foreign participation or ownership in the ICT sector are still in place in at least 89 countries, often limiting foreign participation in telecom operators to less than 50 per cent. There may also be restrictions barring foreign firms from greenfield investments, allowing government to have special voting rights in foreign-owned firms and discriminating against foreign firms in areas such as interconnection and spectrum allocation (figure IV.24).
Beyond the fundamental sector reforms that enable private investment, as well as specific rules and regulations applying to foreign investment, numerous other policy areas influence the attractiveness of a market for investors in internet infrastructure.
• Licensing of telecommunication services. Regulatory authorization is typically required to provide services, even if the market or service has been fully liberalized. The conditions for securing licences are critical. Requiring multiple licences increases the cost and uncertainty associated with investing in a
Figure IV.23.
No reforms
One of three reforms
Two of three reforms
76
77
80
90All three reforms
Sector reforms and investment in connectivityNumber of reforms implemented and average 3G coverage (Per cent)
0%5%8%10%13%60%
Source: ©UNCTAD, based on ITU World Telecommunication/ICT Indicators database and World Telecommunication/ICT Regulatory Survey 2015.
8
5
10
60
Figure IV.24.Types and frequency of restrictions on foreign investment in the ICT sector (Percentage of responses)
Discriminatory licensingrequirements
Special voting rightsheld by government
Green�eld investmentrestrictions
Participation orownership restrictions
Source: ©UNCTAD, based on ITU World Telecommunication/ICT Regulatory Survey 2016.

Chapter IV Investment and the Digital Economy 201
market. A broader licence lowers the cost of providing more than one type of service – such as voice, internet or international services – and allows for a more flexible business plan, as new services can be added later without going through another licensing process.
According to an ITU survey, licensing conditions vary significantly among countries. Some countries limit the number of licences available for certain services. Some impose minimum capital requirements to obtain a licence. In addition, the scope of licences is broader in some countries than in others: general authorizations (allowed in 53 countries) cover all services and require a simple notification or registration that a service is being provided, rather than an extensive licensing procedure; unified licences (18 countries) allow all types of services to be provided; multiple-services licences (42 countries) allow several services to be provided; and service-specific licences (78 countries) are the most restrictive.12
Some countries are not fully transparent about the conditions for obtaining a licence, which increases uncertainty for investors. Many countries (43) do not make licence agreements public, which may feed the perception that different operators may be subject to different conditions.13 Transparent and streamlined administrative procedures to obtain relevant licences for the provision of telecommunication and value added services could facilitate investment in the digital economy.
• Spectrum for mobile operators. Investment in mobile operators is subject to its own set of policies and regulations that can act to promote, or hinder, investment. Access to radio-frequency spectrum is the foundation of a mobile service, which in turn depends on the allocation of spectrum to mobile services in general and on the assignment of spectrum among operators. Factors that help promote investment are the availability of sufficient spectrum to efficiently offer service – particularly low-frequency spectrum, which propagates farther (thus minimizing investment in tower sites) – and flexibility in terms of technology used.
Auctions are often used to assign spectrum to operators and ensure that spectrum is assigned to those who can use it most efficiently. The design and implementation of the auction can have a significant impact on the outcome – for instance, in a recent 3G auction in Bangladesh, the reserve price was set so high that it left over one third of the spectrum unsold, thus reducing subsequent investment and market benefits. In such cases, an additional risk is that although operators might pay the high reserve price to enter the market, that high price may negatively influence subsequent investments in improved services (GSMA, 2014). A balanced approach is needed to ensure optimal roll-out and quality of services.
• Taxes on devices and services. In some countries, relatively high taxes on mobile hand-sets and services have led to depressed demand and lower infrastructure investment. For instance, Niger has one of the lowest mobile internet adoption rates in Africa, in part because taxes on mobile broadband represent 23 per cent of average per capita income. Tanzania, with significantly lower internet penetration than its neighbours, also imposes taxes that have reduced uptake (GSMA, 2016).
• Import procedures and use of foreign personnel. Because the build-up of infrastructure requires equipment and skilled engineers, procedures for capital goods import and rules governing the use of foreign personnel influence the cost and time needed to deploy.
• Skills training. The training of engineers is required in order to develop a local labour pool to deploy and maintain equipment. Such training can be provided at universities or through vocational training courses, developed or supported by governments in cooperation with the private sector. Such policies are typically beyond the remit of the ICT ministry or regulator and require cross-government actions.

202 World Investment Report 2017 Investment and the Digital Economy
• Regional coordination. Cross-border infrastructure is critical for landlocked countries to be able to access international internet transit services through coastal countries with submarine cables, and generally promotes economies of scale for investments. Investment in cross-border infrastructure can be encouraged by regional actions to increase coordination across borders. Coordination can go further by creating a single market for services, to lower costs and increase regional investment.
A summary of key policy determinants for investment in digital infrastructure can be found in table IV.4.
The approach that regulators take to stimulating investment in uneconomic areas also influences investment. Where private investment is uneconomic, greater public involvement may be warranted (as demonstrated by the number and scope of national broadband plans designed for that purpose). Such public investment is often deployed through a universal service fund, which levies a fee on telecommunication operators to subsidize service in areas where it would otherwise be uneconomic. Other mechanisms frequently used include government grants or direct financial subsidies, as well as dedicated broadband development funds (box IV.10).
Government policy can actively support investment in uneconomic areas in other ways besides public investment. Government support for sharing infrastructure, such as providing access to its own rights of way (for roads, railroads, electricity, sewers, etc.) helps to lower
Table IV.4. Policy determinants for investment in digital infrastructure
Key policy determinants Practices that affect investment
Basic sector reforms and openness
• Privatization of the incumbent opens the market to investment and creates a level playing fi eld for entrants.
• Liberalization enables investment in competing operators providing the affected telecommunication services.
• An independent regulator acts as a referee for the level playing fi eld and can improve regulatory certainty for investors.
• FDI openness typically accompanies the other reforms, allowing MNEs to invest in the market.
Sector regulations
• Licensing conditions can reduce the cost of investment and allow for fl exibility in the face of future market changes.
• Spectrum rules determine the cost of access to critical radio-frequency spectrum, as well as non the spectrum can be used as technology and business models evolve.
• Sector-speci� c taxes on devices and services can reduce demand, potentially signifi cantly in LDCs, affecting investment returns.
• Universal service funds or the possibility of entering PPPs to serve otherwise uneconomical areas can help support investment.
• Access to rights of way can be streamlined to facilitate investment, and the ability to share infrastructure can lower costs.
• Local standards for equipment, and the extent to which they can be satisfi ed through type approvals, can infl uence investment costs.
Other support policies
• Streamlining import procedures and the rules for employing foreign personnel can reduce the time and cost of investment.
• Support for skills training of local engineers effi ciently supports the deployment and operation of infrastructure investments.
• Regional coordination can foster economies of scale for infrastructure investments in multiple countries.
Source: ©UNCTAD.Note: Policy determinants listed in the table are those specifically relevant for digital infrastructure investments. General policy determinants (e.g. CSR policies) also apply – see
UNCTAD’s Investment Policy Framework for Sustainable Development (UNCTAD, 2015b).

Chapter IV Investment and the Digital Economy 203
Box IV.10. Stimulating internet infrastructure investment in uneconomic areas: FITEL, Peru
When the telecommunication operator in Peru was privatized in the 1990s, a universal service fund was created to fund the expansion of telecommunications to the many unserved rural areas. This fund, known as the Fondo de Inversión en Telecomunicaciones (FITEL), was administered first by the new independent regulator, OSIPTEL, and is now administered by the Ministry of Transport and Communications.
Companies providing telecommunication services contribute 1 per cent of their gross revenue to the fund, which is disbursed through an innovative lowest-subsidy auction. A project for expanding telephone coverage is designed and put up for tender, and the company that requests the lowest subsidy is awarded the project.
FITEL plays a key role in the financing of Peru’s national broadband plan. Initially, projects focused on public telephone services for unserved villages. As the internet emerged, projects focused on expanding access, including new telecentres for public access, backbone infrastructure that can be shared by mobile operators, training and the creation of local content.
Recent projects include the provision of high-speed internet access to 1,019 locations, serving 3,883 rural communities, along with content development and capacity-building. An ongoing project, begun in 2015, is delivering backbone and internet access throughout different regions, serving hundreds of thousands of users along with schools, health centres and other government institutions.
Source: ©UNCTAD, based on Ministry of Transport and Communications, Peru, Fondo de Inversión en Telecomunicaciones, www.fitel.gob.pe, and Government of Peru, “Plan Nacional Para El Desarrollo De La Banda Ancha En El Perú“, 2011.
deployment costs and makes investment more attractive. The same is true of allowing operators to share infrastructure among themselves, such as towers for mobile operators.
Policy determinants and underlying investor concerns need to be balanced against legitimate public policy concerns (table IV.5). When it comes to digital infrastructure, the State has an important public service responsibility, which is to provide affordable internet access to all. In that context, sector-specific regulations, including licensing requirements, may be required in order to promote competition and guarantee operating standards to protect broader digital business and consumer interests. In the case of a State-owned incumbent, governments also need to carefully consider the potential costs and benefits of a privatization or market liberalization in relation to its digital development objectives. Governments also need to secure public revenue and returns on public infrastructure investment, for instance through taxation or licensing. Finally, governments may need to safeguard broader national interests – for instance, related to industrial and sustainable development objectives – or address security concerns related to sensitive infrastructure.
Table IV.5. Development of digital infrastructure: balancing public policy and investor concerns
Selected determinants Public policy concerns Investor concerns
Basic sector reforms and openness
• State-owned incumbents
• Public service responsibilities
• National security
• Market access
• Level playing fi eld
• Regulatory certainty
Licensing conditions
• Competition
• Operating standards (public service responsibilities)
• Public revenue
• Investment costs
• Flexibility for business development
Sector-specifi c taxes
• Public revenue
• Return on (public) infrastructure investment
• Total cost to customer
• Demand maximization
Local standards • Industrial development• Investment costs
• Interoperability
Source: ©UNCTAD.

204 World Investment Report 2017 Investment and the Digital Economy
In conclusion, internet coverage is well ahead of internet adoption throughout the developing world. This not only limits the immediate infrastructure investment needs, but also highlights that infrastructure investments are not the only priority – increased investment is needed above all in local content and services to stimulate adoption. Increased adoption, in turn, will drive further infrastructure development. Investment in local content means investment in local digital firms.
3. Investment in digital firms
With coverage well ahead of adoption in many developing countries, speeding up digital development requires a focus on investment in local digital content and services to increase demand. This should include stimulating investment in local enterprise development by creating and maintaining a conducive regulatory framework for digital firms and by undertaking active support measures, which may include establishing technology or innovation hubs and incubators, building or improving e-government services, supporting innovative financing approaches and instituting skill-building programmes. Linkages with global firms can help, and the involvement of foreign investors in local digital firms can accelerate their growth, but developing the digital sector mostly means supporting developing domestic enterprise rather than promoting investment by digital MNEs.
As shown in the preceding section, it is common for broadband coverage to significantly outpace internet adoption levels. Although there are many reasons that individuals may not go online, surveyed non-users often indicate a lack of locally relevant content, in terms of language and subject matter, or locally relevant services.14
There is, of course, a surfeit of international content available. However, the growth of digital firms that offer local content and services is a crucial step in digital development and should be a policy priority.15 The development of a local digital sector creates jobs and can boost economic growth. Furthermore, while the digital sector itself typically only represents about 4 per cent of even the most digitally advanced economies, it is a critical stepping stone for digital adoption among the rest of the economy (Atkinson and Stewart, 2013).
The development of a local digital content and services industry is far less capital intensive than the build-up of digital infrastructure. Nevertheless, it involves crucial investment components, for example, to support the creation of content, to enable local hosting to store and deliver content, and to build or improve peripheral services, such as financial services that provide the ability to monetize content, and postal services necessary for successful e-commerce development (UNCTAD, 2015a).
a. Investment needs for the development of a local digital sector
The investments needed to provide international content depend on the type of service and the amount of traffic delivered to a country. By the very nature of the global internet, content available in one country is generally available in any country, unless it is subject to blocking or filtering or licence restrictions. Achieving this broad reach does not require any specific investment, which is why global digital firms tend to have a limited asset footprint outside their home countries and tend to create subsidiaries only in markets that present significant local marketing or advertising opportunities, with limited in-country investment (see section IV.B).
Exceptions occur, as global digital firms invest in data centres and content delivery networks to facilitate hosting of content closer to end users. Content hosted locally loads faster, which

Chapter IV Investment and the Digital Economy 205
increases uptake by users who may not wait for slow or unresponsive downloads, while also lowering the cost of accessing content by avoiding expensive international links.16
Investment in a data centre can foster a healthy local content ecosystem. Therefore, promoting or facilitating investments in data centres by global digital firms can be relevant as part of efforts to build a local digital sector. However, a data centre is a large investment, which requires access to complementary inputs, such as reliable and inexpensive power supplies, domestic telecommunications capacity, significant amounts of local content and trained personnel. The decision to invest in local data centres by global digital firms is complex, and inevitably not all locations that aim to develop a local digital economy will attract one. However, data centres can be non-proprietary and carrier-neutral, open to all content providers. Given the size of most data centres, access to a large regional market would create economies of scale for investors.
Whereas international content can be available inside a country without any investment, creating a local digital sector that produces content and offers local services requires investing in local start-ups and in enterprise development, and building up digital arms of existing companies such as newspapers and retailers. To develop digital content and services, both entrepreneurs and existing firms need access to training and ICT technology. In terms of access to finance, new companies will have greater difficulty in finding funding than established ones, which may be able to self-finance digital content development through cost savings or revenue increases.
International investors can be crucial sources of funds to help create and develop local digital firms. A growing number of specialized venture capital funds, private equity funds and global digital firms have been investing in the development of local digital firms in developing countries (for examples, see box IV.11).
In addition, the digital economy has enabled new forms of financing, supporting the development of digital firms. Crowdfunding mechanisms are now supporting numerous ventures. To date, most of these are in developed countries, but the phenomenon is spreading (box IV.12).
A key requirement for investment in the digital sector is the development of adequate payment platforms. To promote investment, developers must be able to monetize their innovations. This can include direct payment for content (e.g. buying mobile apps) or indirect payments from advertisers. Either way, there must be a financial platform through which buyers or advertisers can make payments and developers can receive those payments.
Box IV.11. Attracting international investors in Nigeria’s digital sector
As the largest economy in Africa, with an estimated population of 180 million and GDP of more than $500 billion, Nigeria offers a large and growing potential market for digital firms. Not surprisingly, local e-commerce companies have emerged, notably Jumia and Konga, both founded in the country.
Jumia’s parent company, Africa Internet Group, recently raised €300 million and now counts among its international investors AXA (France), Rocket Internet (Germany), Goldman Sachs (United States), MTN (South Africa) and Millicom (Luxembourg). Konga is backed by Naspers (South Africa) and Kinnevik (Sweden). Both companies have been extending into a wide range of new online businesses within Nigeria, and Jumia is now also present in more than 20 countries in Africa.
A lack of trust in online services, however, has resulted in most orders being paid with cash on delivery. This creates risks and raises operational costs. More to the point, this highlights the importance of creating trust in online services and developing secure online payment systems to increase the size of e-commerce markets and make them more efficient.
Source: Ringier Africa, background note prepared for UNCTAD, 2016.
206 World Investment Report 2017 Investment and the Digital Economy
Box IV.12. Investment models in the digital economy: crowdfunding
The internet not only provides a global market for innovators’ goods and services, but also provides access to many resources for innovators, including online training, avenues of research, open source software and investment funds. Crowdfunding is an innovative source of finance that has emerged in recent years, through which an innovator can raise money directly from a pool of millions of potential investors around the world.
The earliest form of crowdfunding focused on charitable donations for good causes. Over time, three models have emerged that provide funds for innovators and returns for investors: rewards, debt and equity.
• Rewards. In this model, investors are provided early and discounted access to the new products and services they are financing, enabling innovators to presell their outputs and use the money raised to scale up production. One large platform, Kickstarter, has raised almost $3 billion for projects, and one of its most successful fundraisers, $10.3 million for the Pebble startup, effectively created the smartwatch segment. A subsequent campaign by Pebble for a newer watch raised $20.3 million.
• Debt. This is by far the largest segment in funds raised. Typically, this involves peer-to-peer loans. One early platform, Kiva, has raised almost $1 billion in loans to 2.3 million borrowers in 82 countries, with a 97 per cent repayment rate, enabling entrepreneurs to fund their projects with loans as small as $25.
• Equity. In this model, investors can invest directly in a particular startup or create a fund that invests in a portfolio of startups, effectively democratizing venture capital markets. The model, however, depends on regulations regarding equity investments – for instance, it has become feasible in the United States only recently – and so far largely focuses on developed countries. One example, AngelList, has raised $540 million for 1,370 companies in the United States, generating a further $4.8 billion in follow-on investments.
The total size of the crowdfunding market in 2015 was $34 billion, the bulk of which ($25.1 billion) was debt. Of the total amount, only $24 million was funded for Africa and $85 million for South America.
One issue revolves around payments – to be successful, the funds must be delivered to the innovator, and this is sometimes challenging. Kickstarter, for instance, is available only to creators in fewer than 20 member countries of the Organization for Economic Co-operation and Development. IndieGogo, another large crowdfunding platform, is available in most countries, but the innovator must be able to receive payments through a bank or credit card.
That said, there are fewer geographic limits on the sources of funding. One innovation on IndieGogo called FlowHive (for harvesting honey) received $12 million from 37,000 backers in 150 countries. Highlighting the broad nature of the campaigns, Kickstarter notes that the average distance between backers and creators is more than 3,000 km.
Over time, equity crowdfunding would appear to have the greatest potential, because backers may be more interested in financial returns than in product or services rewards. For instance, Oculus VR raised $2.5 million on Kickstarter to fund its pioneering virtual reality headset. Backers bought a development version of the headset worth about $300; two years later, Facebook bought Oculus for $2 billion, a return that would have vastly outweighed the value of the headset.
Addressing regulatory issues to enable global equity crowdfunding, along with digital means of payment, would facilitate foreign investment and fund local entrepreneurs who are developing digital firms.
Source: ©UNCTAD, based on data from CrowdExpert.com and specific platform websites.
Some international content platforms, such as an app store or YouTube, offer a means for publishing local content but still require a payment system to receive fees from users or advertisers.
Mobile app stores, notably the Google Play store for Android devices and the App Store for Apple devices, provide a potential platform for the development of local content. A software development kit helps developers build apps, and once uploaded, the online store takes care of marketing, sales and distribution in every country where the store is accessible. Payments issues, however, limit where the store is accessible: Nigeria, for instance, is the only country in Sub-Saharan Africa where a developer can upload an app for sale to Google Play (Kende, 2015).

Chapter IV Investment and the Digital Economy 207
b. Elements of a conducive policy framework for investment in digital firms
Government policies can actively support investment in local content and services and in the development of the digital sector through the following interventions:
• Establish innovation hubs, where entrepreneurs gather to work and collaborate. In many countries, an innovation hub is available, such as the iHub in Kenya, where developers work, learn from each other and network, including with venture capitalists. Another example is Tech Park in Cabo Verde, built with support from the Government and the African Development Bank, which includes a data centre and a business continuity or disaster recovery site, a common facilities centre, office spaces, an incubation centre, and a training and qualification centre.
• Create government online services to support local developers and local data centres, while also increasing demand for online services. A number of national broadband plans include support for the provision or adoption of online government services or applications.
• Support venture capital funding, as was done in Israel to help launch the country’s startups. More recently, other governments have tried to emulate the success of the Israeli program and kick-start their own venture capital funds. India, for instance, has created the India Aspiration Fund, a so-called “fund of funds” with $306 million to invest in private venture capital funds in order to expand the pool of, and boost, Indian entrepreneurs.17
• Create an enabling framework to foster other innovative sources of funding for digital firms, thereby overcoming domestic capital market constraints to growth. For example, online crowdfunding platforms have the potential to channel more funds to developing countries, particularly if international equity crowdfunding is enabled. According to the World Bank, businesses in developing countries could use crowdfunding to mobilize up to $96 billion by 2025.18
Government policy also indirectly affects investment in online services through content regulations and through rules designed for offline purposes that are applied online.
Key areas of regulation that affect the digital investment environment include the following:19
• Privacy and data protection laws. Many digital firms collect and store data on their users – either data provided directly by users of online services, such as health information that may be gathered by an online health service, or data gathered indirectly through the use of the service, such as search texts input on a website or links clicked. Data protection and privacy laws have been put in place in numerous countries to protect users; their substance can influence investment decisions in online services.
• E-transaction and consumer protection laws. Some content regulations may influence investment and enterprise development in specific areas of online services. For example, in addition to data protection and privacy laws, e-transaction, cybercrime and consumer protection laws all influence the development of the e-commerce sector. UNCTAD’s Global Cyberlaw Tracker monitors these five sets of laws, as they are particularly important for supporting online commerce. Additional elements that support online services include digital identification laws that enable identification for sensitive services such as financial transactions and digital payments, which in turn promote e-commerce.

208 World Investment Report 2017 Investment and the Digital Economy
• Content restrictions and censorship laws. Countries may have policies or laws that restrict or censor content for political, national security, religious or cultural reasons, and often these policies are applied to online content. Although such restrictions alone may inhibit investments in content, the application of the laws – in terms of predictability and consistency – can also have an impact. In extreme cases, governments are increasingly resorting to internet shutdowns, turning off a specific service or the entire internet in a country, often for political or national security reasons. This affects the entire sector, making investment less attractive. A recent study from the Brookings Institute recorded 81 temporary shutdowns in 19 countries over 12 months spanning 2015 and 2016, estimating the cost at $2.4 billion. As noted in the study, this does not include the cost to investor confidence, which could be significant as such disruptions continue to grow in number.20
• Intellectual property protection. Intellectual property rules are an example of offline regulations that extend to the online world. They can have an impact on decisions to invest in services that provide professional content such as audio or video. The application of copyright rules online, for instance, can affect investment levels.21
• Intermediary liability laws. Whereas many sites generate their own content for which they are responsible under content laws, other services act as platforms for user-generated content, such as blogs, messages or videos. The extent to which these platforms, otherwise known as “intermediaries”, are held liable for content can influence their investment decisions. These considerations extend not just to content platforms, but also to companies that host or store content, such as content delivery networks and data centres. The recent introduction of new legislation increasing the liability of platforms for content (in particular the obligation to remove “fake news” in Germany) may be targeted mostly at global digital players but could have cost implications for other, smaller, digital firms and start-ups.
• Application of traditional telecommunication rules to digital business. In many countries, regulatory authorities are applying rules designed for the traditional telecommunication sector to online services or “over the top” services. For example, a specific digital service that has been the subject of regulatory attention is voice over internet protocol (VoIP), because of its convergence with traditional voice services. According to an ITU survey, VoIP service is subject to general ICT regulations in 58 countries.22 Such laws may impose conditions that deter the provision of service or investment.
• Data localization requirements. In recent years, at least 20 governments have proposed data localization requirements.23 Such requirements oblige digital firms to store and process local data within a country. Some laws stipulate specific conditions under which data can be transferred out of a country. For example, the Russian Federation is considering a law that requires internet companies to locate servers in the country and store user data for six months after the data are created. India has also proposed requiring all e-mail service providers to host servers in India.
Often, such requirements are motivated by privacy or national security considerations. They can also be enacted as part of a strategy to create IT jobs or to develop the digital sector. However, the scale of data in a given territory is often not sufficient to justify large investments in data centres. Localization requirements could significantly increase the costs of providing internet-based services such as cloud computing. In some cases, data localization requirements could lead providers of data services to exit the market, leaving domestic businesses with access to potentially less efficient and effective services. Also, forcing companies to build local data centres would create few jobs once construction is finished.

Chapter IV Investment and the Digital Economy 209
A study by the European Centre for International Political Economy showed that a proposed (but subsequently abandoned) data localization strategy in Brazil would have caused a 4.2 per cent drop in investment; the results showed similar numbers for other countries (Bauer et al., 2014).
• Competition policy. Regulatory frameworks for competition are crucial. Although the entrance of digital firms across all sectors encourages innovation, provides consumers with more options and creates demand for a more developed digital ecosystem, it can inherently create competition concerns due to network and winner-take-all effects (box IV.13).
A summary of key policy determinants for investment in the digital sector can be found in table IV.6.
As in the case of determinants of investment in digital infrastructure, policy determinants and underlying investor concerns need to be balanced against legitimate public policy concerns (table IV.7). Digitalization has given rise to new concerns related to national security, cybercrime and politically sensitive (dis-)information. These concerns may lead to the introduction of content restrictions, data localization requirements or mandatory source
Box IV.13. Foreign investment in e-commerce: the experience of Indonesia
Indonesia’s e-commerce market is the biggest and fastest growing in South-East Asia. In 2015, it was estimated at $1.7 billion (a third of the region’s $5.5 billion e-commerce market), according to a report by Google and Temasek (2016). The report forecasted that between 2015 and 2020, the number of internet users would expand by some 19 per cent annually – faster than India’s estimated 14 per cent – and the e-commerce market would grow to $46 billion.
This massive and growing market has attracted international tech companies, and local startups have flourished. Go-jek is the firm with the most visibility and growth. It started in 2011 as a motorcycle ride-hailing app but has since expanded into providing various courier services, an e-wallet and a car-hailing service. The latter has turned Uber (the international ride-hailing app) and Grab Taxi (South-East Asia’s biggest ride-hailing app) into Go-jek’s toughest competitors.
In Indonesia, Grab and Uber have also tapped into Go-jek’s market by expanding their service to motorcycle-hailing (GrabBike and UberMotor). In their fight for customer acquisition, the three have sustained months of charging “promotional prices” that seem far below a reasonable operating cost in traffic-ridden Jakarta. During 2015, Go-jek offered months of “Rp 10,000 anywhere”, less than a dollar at the prevailing exchange rate. GrabBike followed suit to offer half that fare for several months. On the car front, Uber was able to charge substantially below traditional taxis as part of its marketing. This kind of competition bears some benefits in that it encourages innovation, provides consumers with more options and creates demand for a more developed digital ecosystem, but it also raises the question of whether a price war could enable a company to become dominant and raise prices due to winner-take-all effects. Another concern is the appropriateness of the existing regulatory framework for the new business models – in particular regarding consumer protection.
In other parts of e-commerce, these price wars are also a common occurrence. Mataharimall, Tokopedia and Bukalapak (local marketplace platforms) are competing with Lazada (the regional e-commerce service rolled out by Germany’s Rocket Internet and backed by China’s Alibaba), Elevania (Republic of Korea) and Rakuten (Japan’s biggest e-commerce site). Massive discounts and large marketing campaigns seem to be the norm, and to survive it, local players are relying on financing from backers such as Sequoia Capital (an investor in Apple, LinkedIn and Dropbox (all United States)) and SoftBank (Japan).a Go-jek partnered with Sequoia in 2015, and in August 2016, it reportedly obtained a $550 million investment from KKR & Co. and Warburg Pincus (both United States).b Indonesia is seeing funding deals like never before: TechinAsiac reported that, from two to three funding deals announced each month in 2014, the number had doubled in 2015.
The fierce competition between digital companies is not inherently bad. Younger local digital companies with organic growth such as Go-jek, Tokopedia, Mataharimall and Bukalapak can be resilient, with innovation and a better understanding of their local market, but to survive price wars against more mature international digital giants, securing large investments is undeniably crucial.
Source: ©UNCTAD.a Tokopedia reportedly received some $100 million financing from SoftBank Internet and Media Inc in 2014. This deal marks the first record-breaking financing round
by a startup in Indonesia. Cosseboom, L., “Indonesian Online Marketplace Tokopedia Raises $100M from SoftBank and Sequoia”, TechinAsia, 22 October 2014, www.techinasia.com.
b Millward, S., “Go-Jek Ramps Up War on Uber and Grab with $550m Funding”, TechinAsia, 5 August 2016, www.techinasia.com.c Wijaya, K.K., “Indonesia’s Startup Funding Exploded in 2015”, TechinAsia, www.techinasia.com.

210 World Investment Report 2017 Investment and the Digital Economy
code disclosure measures. Governments also take more and more responsibility regarding user protection – for instance, with respect to privacy, cybersecurity and consumer protection concerns. In terms of business protection, intermediary liability rules aim to curb illegal content distribution, while regulation in other sectors may aim to prevent or mitigate potential disruptive impacts from digital platforms and technologies.
4. Investment in digitalization across industries
The greatest development value may well be in the digitalization of firms in non-digital sectors. Internet adoption by businesses in developing countries significantly lags that in developed countries. Promoting investment in ICT across all firms, as well as business linkages and participation in GVCs, should be an important part of digital development policies.
A strong digital sector, including adequate internet infrastructure and digital companies providing online content and services, is the foundation of the digital economy. However, adoption of these services – by both individuals and non-ICT firms – is a fundamental
Table IV.6. Policy determinants for investment in the digital sector
Key policy determinants Practices that affect investment
Content rules and regulations
• Privacy and data protection can bolster users’ trust and make investments in online services more attractive.
• E-transactions and consumer protection laws help develop the e-commerce sector and support online commerce.
• Content restrictions, ranging from fi ltering to internet shutdowns, can undermine opportunities in a country and fuel uncertainty for investors.
• Copyright laws should provide clarity and balance the interests of copyright holders with those of innovators and content distributors to reduce risks for investors.
• Intermediary liability rules impose requirements on platforms to monitor third-party content for banned or pirated content, which can increase costs and legal risks.
• Applying traditional telecommunication or media regulations to online services can impose conditions that increase the cost of providing services.
• Data localization laws, requiring domestic storage and processing of content, reduce economies of scale for data centres or cloud services, reducing investment.
Other regulatory areas
• Mandatory source code disclosure policies, e.g. in procurement contracts, can infl uence the interest of investors in participating.
• Regulations in other sectors of the economy (often professions or non-tradable services such as taxis or real estate), and their relative openness to competition, may discourage or block investment by new digital entrants.
Support policies
• Supporting the development of innovation hubs can assist local entrepreneurs in developing new online services.
• Development of e-government services can create demand for local developers and data centres, promoting the development of the sector.
• Facilitating crowdfunding – particularly for equity investments – can increase international investments in the local industry.
• Government support of venture capital investments can help build the domestic venture capital industry while promoting investment in the local content industry.
• Entrepreneurship programmes, such as UNCTAD’s Empretec programme, can help to put ICTs skills into practice and develop successful business projects.
Source: ©UNCTAD.Note: Policy determinants listed in the table are those specifically relevant for investments in the digital sector. General policy determinants (e.g. CSR policies) also apply – see
UNCTAD’s Investment Policy Framework for Sustainable Development (UNCTAD, 2015b).

Chapter IV Investment and the Digital Economy 211
part of digital development. Policymakers should not focus exclusively on facilitating the development of digital firms, but also aim to stimulate the use of digital services (Atkinson and Miller, 2015).
Digital adoption in firms across an economy is also ultimately what is necessary for realizing the benefits of digital access to global markets for SME exporters – an important goal of the eTrade for All initiative. As a measure of the potential opportunity, the amount of goods traded through Alibaba and Amazon has grown by more than 30 per cent annually since 2012, and sales in 2016 were worth over $700 billion, with large and rapidly growing shares of these activities taking place on a global level. Some 50 million small and medium-size enterprises worldwide now conduct business on Facebook, a number that has doubled from 2014 (McKinsey Global Institute, 2016).
The digitalization process in global supply chains, described in section IV.B, will have a profound impact on the overseas operations of MNEs, with important implications for host-country firms, especially in developing countries (Foster and Graham, 2016). New opportunities may arise for domestic firms connected to the international production networks of MNEs or operating in non-equity relationships. Such businesses connected to GVCs tend to show higher levels of digital adoption (figure IV.25). Likewise, businesses with higher levels of digital adoption have better chances of participating in GVCs and connecting with MNEs. Foreign affiliates and local small and medium-sized suppliers linking to digital supply chains can make an important contribution to digital development in host countries.
Digital adoption by businesses in social sectors can make an especially important contribution to development. In health care, for instance, telemedicine has the potential to make high-quality health care more accessible and affordable, and can enable access to expertise for local hospitals and health centres in developing countries. In Africa, some
Table IV.7. Development of the digital sector: balancing public policy and investor concerns
Selected determinants Public policy concerns Investor concerns
Data protection, localization laws
• Privacy
• National security
• Industrial development
• Scale economies
• Free fl ow of data
Content restrictions
• Politically sensitive (dis-)information
• National security
• Cultural or religious values
• Predictability of the business environment
Intermediary liability rules • Illegal content distribution• Legal certainty
• Operating costs
Telecommunication and media regulations (applied to online services)
• Public service responsibilities• Network access
• Operating costs
Mandatory source code disclosure policies
• National security
• Technology dissemination
• Industrial development
• Intellectual property protection
Sector regulations in other sectors of the economy
• Professional standards
• Social protection• Market access
Source: ©UNCTAD.

212 World Investment Report 2017 Investment and the Digital Economy
countries are implementing their own e-health programs. One of the leading countries in this area is Kenya, which in 2015 announced a collaborative partnership with the Merck Group (Germany), a global pharmaceutical company. Together they are rolling out a new e-health platform that links patients and health care providers in remote areas by using knowledge transfer and video conferencing to interact with specialists at Kenyatta Hospital to extend accessibility, improving the quality and reducing the cost of health care in remote areas.24
ICT technologies and digital applications can also play an important role in expanding access to finance (see also box IV.12). Mobile banking can be a catalyst for local businesses and social enterprises, which are particularly important in developing markets. Apart from innovations in banking, digital technologies can support online peer-to-peer lending platforms. In Indonesia, for example, Amartha has transformed from a traditional microfinance institution into a fintech company. The company uses machine learning for its credit scoring, based on behavioural and transaction data, and can provide access to finance for clients who have no formal credit history. Amartha’s move into fintech has extended its outreach considerably, with the number of disbursed loans growing by nearly 600 per cent.25 In a country where three quarters of the population does not have a bank account,26 the company has disbursed $5.1 million in loans to 30,000 microentrepreneurs and has raised the maximum loan value from $225 to $750.27 It has also reached more than 23,000 women in villages, with loans totaling $4 million (box IV.14).
As digital development progresses and initial infrastructure investments get off the ground, it is important to adjust digital development strategies, shifting the focus gradually to initiatives to promote digital adoption in all firms – not just digital firms – and especially in social sector firms (box IV.15).
Bringing traditional local companies online requires investment in internet access, in devices and computers, and in relevant training. Several policy factors will affect investment decisions in this area:
• The policy environment for digital services is to some degree relevant for firms across all sectors, as all firms are affected by cybersecurity and data protection regulations, among other laws that affect the digital sector.
Figure IV.25. Business use of the internet and levels of GVC participationShare of �rms using the internet to communicate with customers or suppliers (Per cent)
Developing economies
56
83
58
75
43
LDCs
36
68
39
53
19
All
Only export
No GVCs
Import and export
Only import
Source: ©UNCTAD, based on data from the World Bank Enterprise Surveys.Note: Analysis based on domestic firms only. Use of the internet by firms reflects the World Bank survey results on use of email and company websites. Data are from 2016 or
the latest available data point. Running the analysis using sampling weights provided by the World Bank to reflect the population composition produces similar results.

Chapter IV Investment and the Digital Economy 213
• The affordability considerations that apply to consumers are also relevant for firms. High import tariffs and taxes on devices, or high taxes on internet usage, have a negative impact, which can be significant: when Kenya exempted mobile handsets from a 16 per cent value added tax in 2009, the uptake of new handsets tripled. Tanzania imposes significant taxes on mobile services, with a 17 per cent excise tax on top of the value added tax, making the total the second highest in Africa and resulting in 3G adoption rates that lag those in much of the region. A GSMA study has estimated that removing the excise tax would boost 3G adoption by 800,000 subscriptions, resulting in $115 million more in mobile investment.28
• Tax measures to lower the effective cost of ICT adoption can stimulate investment.
• Access to cloud services can significantly lower capital and operating expenses for companies operating online. Cloud services can provide access to a number of online services important to businesses, ranging from e-mail and web hosting to customer relationship management software. Using the cloud enables a firm to avoid buying expensive servers and software packages, and hiring dedicated IT staff to operate systems and upgrade software. These cloud services rely on the general determinants for digital services, including local data centres and digital service providers.
Box IV.14. Strengthening women’s participation in the digital economy
The digital economy can contribute towards generating opportunities for women’s participation in the economy, an important SDG target. Online marketplaces are reporting good numbers on women participating as producers. For example, more than half of the sellers on Taobao, Alibaba’s marketplace, are women.a Etsy, one of the biggest marketplaces in the United States, in its latest diversity report stated that 9 out of 10 of its sellers are women (higher than the female participation in retail trade, which was more than 40 per cent, according to the United States Census Bureau).b
Employment flexibility is another factor. The flexibility that internet platforms offer enables more women to join the workforce. The World Bank Digital Dividend report (2016) pointed out that the ability to work flexible hours from home is considered the greatest advantage of online work for women. On Upwork, a freelancing platform, 44 per cent of freelancers are women, compared with a 25 per cent average in the global non-agricultural economy. In addition, the flexibility of location that internet platforms offer in places where women may find it difficult to travel (whether because of lack of infrastructure or social norms) can also help women enter the job market. On the downside, flexibility often comes with less protection for employees (e.g. absence of insurance or precarious terms), which can dilute some of the merits of greater employment of women.
Some significant gaps between genders in the digital economy remain, however – gaps that can prevent women from capitalizing on the gains that the digital economy offers. For example, in LDCs, women are less likely to own cellphones and use the internet (UNCTAD, 2015a and World Bank, 2016). In terms of employment in the tech sector, even in a high-income country with the most mature digital economy (the United States), a wide gender gap exists. There, in the core business of the digital economy (developers, coders and technical staff), women are notably underrepresented (making up only some 20 per cent of the occupational group – far below their overall representation across all occupational groups, at close to 50 per cent).
Some current initiatives aim to close this gap and increase women’s participation in the digital economy. An example in education is Girls Who Code, a United States domestic nonprofit that teaches girls in grades 6–12 how to code. Since its start in 2012, it has graduated 10,000 students through after-school and summer programs, project-based learning and internships. The initiative introduces young women to the technology world, and by doing so encourages them to study computer science formally, an area that seems to be largely male-dominated. Alternatively, informal academic paths with more vocational features (i.e. shorter, less expensive and more job-ready) can be an option to support women involvement in the digital economy quickly, particularly given the fast rate of obsolescence in the field.
To support women entrepreneurs in the digital economy, initiatives may include gender-specific loan programs, which can help women get access to capital that is otherwise difficult to obtain. An example is one rolled out by the International Finance Corporation and Goldman Sachs called 10,000 Women, which financed a lending program of RMB 500 million, intended for women entrepreneurs who mostly run their businesses on Alibaba Group’s online marketplaces.
Source: ©UNCTAD.a Erickson, J., “Factsheet: Alibaba’s Conference on Women and Entrepreneurship”, Alizila, 19 May 2015, www.alizila.com.b Gorman, J., “Diversity and Equality at Etsy”, Etsy News, 28 April 2016, https://blog.etsy.com.

214 World Investment Report 2017 Investment and the Digital Economy
Box IV.15. Digital development plans: the case of Rwanda
The Rwanda Government’s National Information Communications Infrastructure (NICI) plan, part of its broader Vision 2020 programme, is an example of a digital development strategy that extends beyond a targeted national broadband plan. The Vision represents a comprehensive plan to turn Rwanda into a middle-income country by 2020 and an “information-rich, knowledge-based” economy.
The results have been impressive, with 3G network now covering over 90 per cent of the population, and 4G at almost 50 per cent; a large and growing IXP with several leading content delivery networks in the country; a branch of Carnegie Mellon University and several innovation labs; and internet adoption rising to over 20 per cent in 2016 from under 1 per cent in 2000.
Several elements have been key to this success:
• First, the vision starts at the top, with the full backing of the President and the Ministry of Youth and ICT, but also extends to the public and private sectors, including health, education, agriculture and financial services.
• Second, the vision is adaptive, with the new Smart Rwanda Master Plan, which evolved from the NICI policy and plan, updated every five years to adapt to changes in the industry.
• Third, the vision has been adjusted throughout all the phases of digital development, starting with the liberalization of the sector and the establishment of the regulator (NICI I), through the focus on infrastructure building with projects such as the national fibre backbone, the National Data Centre, the Rwanda Internet Exchange (NICI II), and online services and skills development (NICI III), to the development of the private sector and creative industries (the current NICI IV).
Source: ©UNCTAD, based on Rwanda Utilities Regulatory Authority, www.rura.rw.
Table IV.8. Policy determinants for investment in digital adoption by fi rms
Key policy determinants Practices that affect investment
Competition, tax and trade policies affecting the cost of digital adoption
• Competition policies in the telecommunication sector infl uence the cost of data packages and devices, which affects digital adoption by fi rms, especially micro, small and medium-sized enterprises.
• Taxes and tariffs similarly affect on device costs, infl uencing digital adoption.
Support policies
• Fiscal policies can reduce the effective cost of ICT-related capital investments and training expenditures by fi rms.
• Promoting cloud services can lower the cost of accessing online services for businesses.
• E-government services can create demand for local developers while lowering the cost to interact with government for all businesses.
• Partnerships with global digital MNEs help digital adoption in SMEs and the creation of digital entrepreneurs, such as app developers (including through existing programmes offered by global digital MNEs in this area); and can localize their offering (e.g. accepting local currency in their systems, facilitating payments for local fi rms).
• Partnerships with universities help fi rms adopt digital technologies (e.g. in centres of excellence) and build on skills programmes.
• Skills programmes provide companies with the ability to effi ciently adopt and use internet technology and services.
• The level of digital skills, the availability of skills development and educational programmes affect demand for online services.
• The availability of e-government services helps to create business demand for internet access, while also providing efficiency returns from their use.
As digitalization spreads and deepens in an economy, greater investment will be needed in infrastructure and in digital firms to help meet demand for better and more ubiquitous access. A summary of key policy determinants for investment in digital adoption by firms can be found in table IV.8.
Source: ©UNCTAD.

Chapter IV Investment and the Digital Economy 215
D. TOWARDS AN INVESTMENT POLICY FRAMEWORK FOR THE DIGITAL AGE
Investment, including international investment, plays an important role in the development of the digital economy. Conversely, the digital economy will transform international production, and hence investment patterns. A comprehensive investment policy framework for the digital economy should ensure not only that digital development is embedded in investment policies but also that investment policy is embedded in digital development strategies. Moreover, governments need to find a balanced approach that accommodates public concerns caused by digital transformation as well as the interests of private investors.
This chapter has shown how the transition to a global digital economy has fundamental implications for investment policy. Section IV.B discussed how digital MNEs, and the adoption of digital technologies across all MNEs, are changing patterns of international production:
• Digital MNEs can reach overseas markets with a much lighter international asset footprint.
• They generate less employment in host countries directly – their economic impact is largely indirect, through competitiveness benefits across all other sectors.
• Digital adoption in all MNEs is increasing the weight of intangibles and services in global value creation and placing new demands on host-country supply chain partners and technological infrastructure.
As a result, policymakers are faced with a number of challenges. At the strategic level, they need to formulate policy responses to shifting patterns of international investment and to changing investment determinants. Attracting international investment in a digital economy that relies less on some factors, such as low-cost labour, and more on others, such as infrastructure, skills and low-cost energy, may require different competitive advantages. This poses challenges particularly for developing countries.
At the level of domestic investment rules and regulations, policymakers need to assess how new modes of investment and changing investment impacts affect existing rules, which may be general investment regulations or, more likely, sectoral restrictions – and vice versa. Some analogue-era regulations may become obsolete (such as retail restrictions that are bypassed by e-commerce) or risk slowing down digital adoption (such as sector regulations that effectively block new digital entrants); others may need adaptation to the digital age to achieve their public policy objectives. At the international level, policymakers need to assess the implications of the digital economy on investment treaty-making, and the investment dimension of evolving rules in e-commerce and services trade.
Section IV.C looked at the investment dimension of digital development. Again, policymakers face a host of challenges. Digital development requires the development of adequate digital infrastructure to provide the necessary connectivity. Policymakers also need to put in place accompanying policies to support the actual uptake of available connectivity, such as competition policy frameworks to improve the affordability of devices and services.

216 World Investment Report 2017 Investment and the Digital Economy
And they must undertake other measures to improve inclusive internet access, through education, skill building, R&D and other policies to facilitate digital adoption among local firms, especially micro, small and medium-sized enterprises, where the adoption of digital technologies can significantly boost productivity.
As they encourage investment in the digital economy to harness its benefits, policymakers must also mitigate its potential negative impact and protect legitimate public interests. This requires up-to-date regulations – and the ability to implement them – in such areas as data security, privacy, intellectual property protection, consumer protection and the safeguarding
Invest in digital infrastructure
Invest in digital �rms
Invest in digitalization
National
International
Policy framework for investment in the digital economyTable IV.9.
Policy checklist
Embedding investment policy in digital development strategies
Embedding digital development in investmentpolicies
Strategic investment policy considerations
Policy interactions and institutional synergies
Review competitive advantages for the attraction of investment from digital MNEs, assess potential challenges and risks, and identify strategic opportunities (e.g. niche industries, digital content or services industries, app development).
Review and prepare for changing investment determinants and investor pro�les in other industries as they adopt digital technologies in global supply chains.
Formulate a strategic response to ensure investment policy remains geared towards sustainable development and inclusive growth.
Conduct a detailed assessment of infrastructure investment needs in digital development strategies, including broadband coverage and internet infrastructure (e.g. data centres, IXPs).
Build the right conditions for private investment in digital infrastructure, including to promote public service and universal connectivity objectives.
Engage in regional cooperation, promoting multi-country infrastructure investments for scale.
Manage interactions with related policy areas to address public concerns, through up-to-date regulations (e.g. data security, privacy, competition, consumer protection, national security, safeguarding of cultural values).
Manage interactions with sectoral and social policies to mitigate potential negative social and economic impacts of digital transformation (e.g. job losses in traditional sectors).
Ensure an effective whole-of-government approach, establishing coordination processes and communication channels across institutions, and involving investment authorities and IPAs.
Assess the extent to which existing investment regulations are affected by digital operating models.
Modernize investment regulations where needed, balancing investment promotion and facilitation with measures to mitigate risks associated with digital operating models.
Review the coverage and treatment of new digital industries in IIAs.
Take into account the digital investment dimension of evolving international rules, such as those on e-commerce and services trade.
Ensure that content rules and regulations remain conducive to investment in the digital sector, while safeguarding public policy objectives.
Support local enterprise development in the digital economy, through clusters and hubs, facilitation of innovative �nancing approaches, and conducive regulations in non-digital industries.
Promote investments by �rms across all sectors in ICTs and in related skills, and access to low cost digital services (e.g. cloud services).
Build and improve e-government services to lead the way, to create demand for local developers, and to lower the cost of doing business.
Source: ©UNCTAD.

Chapter IV Investment and the Digital Economy 217
To date, in most countries, investment policymakers have taken a back seat in the formu-lation of digital development strategies. It is time they take a more proactive approach. Not only should they prepare for critical changes in their own policy arena, but they also can make an important contribution to the design and implementation of what are effectively digital industrial policies. Digital development should be embedded in investment policies, and investment policy should be embedded in digital development strategies.
of cultural values. Moreover, where digital transformation causes disruption or generates a negative social or economic impact, especially job losses, they need to put in place policies to mitigate these effects.
Most countries are actively encouraging the digitalization of their economy, as it offers significant development opportunities. Digital development can help local firms access global markets or integrate into global e-value chains. The digital economy can yield new opportunities for local enterprise development, including through international investment or links with global digital firms, across broad digital sectors (e-commerce and digital media), in social sectors (e-health, e-education), in new niche industries (e.g. the creation of a digital creative or app-development industry), creating new jobs (including jobs conducive to women participation).
The policy actions to realize the opportunities and deal with the challenges cut across many areas. Core investment policies related to the establishment, protection, facilitation and promotion of international investment are important, especially where foreign investment is crucial for rapid digital development and where investment costs in physical assets are high, such as for the development of digital infrastructure. Public-private partnerships, including with foreign investors, are also an important tool for infrastructure development. For the development of the digital sector, other investment-related policy areas tend to be more important (e.g. taxation, trade, technology, skill-building).
Table IV.9. summarizes the key investment policy dimensions of the transition to a digital economy, starting from strategic investment policy considerations, covering the two policy perspectives (how investment policies are affected by digital development, and how to strengthen the role of investment policy in digital development strategies), and concluding with policy interactions and institutional synergies to consider.

218 World Investment Report 2017 Investment and the Digital Economy
1 ITU, World Telecommunication/ICT Indicators database, released January 2017.2 See Statista.com and Eurostat, “E-Commerce Statistics for Individuals”, http://ec.europa.eu.3 Information Technology and Innovation Foundation, ITIF fact sheet, www.itif.org.4 See Wong, A., “Americans Are Paying Apple Millions to Shelter Overseas Profits”, Bloomberg Technology,
7 December 2016; and Kocieniewski, D., “The Sharing Economy Doesn’t Share the Wealth”, Bloomberg Business Week, 6 April 2016, www.bloomberg.com.
5 See also the Digital Trade Estimates database from the European Centre for International Political Economy (http://ecipe.org).
6 Calculations in the text include any type of private contribution to investment, including PPPs and foreign investment.
7 “Broadband Strategy & Policy”, European Commission, last updated 9 May 2017, https://ec.europa.eu.8 For other investment estimates see for instance ITU (2016).9 Even though the investment component of SDG target 9.c looks achievable, the target itself – a significant
increase in access to ICTs and universal and affordable access to the internet in LDCs by 2020 – looks much more uncertain (see A4AI, 2015). This will also negatively impact the use of ICTs to promote the empowerment of women (Goal 5, target 5.b).
10 See WEF (2017) for cost estimates for some of these factors. They are not included in the UNCTAD estimate, which focuses only on investment costs (as opposed to, for instance, costs of devices to consumers).
11 For more detail, IBRD, World Bank, InfoDev and ITU (2011).12 ITU World Telecommunication/ICT Regulatory Survey 2015.13 ITU World Telecommunication/ICT Regulatory Survey 2015.14 See, for instance, “Explaining the Digital Divide in Brazil”, Internet Society, 6 September 2015, https://
www.internetsociety.org.15 For a study on balancing the benefits of international technology diffusion and indigenous technological
capabilities development, see Fu, Pietrobelli and Soete (2010).16 See “Local Internet Hosting Opportunities Key to Furthering Internet Development in Emerging Economies”,
Internet Society, 13 January 2015, https://www.internetsociety.org.17 “India Opens $306 Million Fund to Help Finance Start-ups”, Reuters 18, August 2015, www.reuters.com.18 “Crowdfunding’s Potential for the Developing World”, InfoDev/World Bank, 2013, www.infodev.org.19 For a summary of digital-related regulatory issues see also Koske et al. (2014) and Fifth Era (2016) for
a survey of 475 verified internet investors on how internet regulations and policies affect investment decisions in 15 countries (Australia, India, Indonesia, Israel, Japan, the Republic of Korea, Nigeria, Saudi Arabia, South Africa, Thailand, Turkey, the United Arab Emirates and Viet Nam, along with the United States and the United Kingdom as leading countries providing FDI to the other countries).
20 See West, D.M., “Internet Shutdowns Cost Countries $2.4 Billion Last Year”, Center for Technology Innovation at Brookings, October 2016, https://www.brookings.edu.
21 See, for instance, “The Impact of U.S. Internet Copyright Regulations on Early-Stage Investment – A Quantitative Study”, Booz & Company, 2011, www.strategyand.pwc.com.
22 ITU World Telecommunication/ICT Regulatory Survey 2015.23 ITU World Telecommunication/ICT Regulatory Survey 2015.24 “Kenya: Merck Unveils Kshs 10.2 Million E-Health Initiative in Kenya”, CIO East Africa, 6 May 2015, http://
allafrica.com.25 Widyanto, A., “3 Ways Fintech Can Transform the UN’s Sustainable Development Goals”, 22 November
2016, http://sdg.responsiblebusiness.com.26 World Bank, Financial Inclusion Data/Global Findex, http://datatopics.worldbank.org.27 Freischlad, N., “Indonesian Micro-lender Amartha Scores Funding from Major Bank”, 7 March 2017,
TechinAsia, https://www.techinasia.com.28 See “Digital Inclusion and Mobile Sector Taxation in Tanzania”, GSMA, February 2015, www.gsma.com.
NOTES

REFERENCES
A4AI (2016). “Affordability Report 2015–16”. Alliance for Affordable Internet, Washington, D.C.
Accenture (2016). “How Digital Solutions Will Drive Progress Towards the Sustainable Development Goals”. http://systemtransformation-sdg.gesi.org.
Accenture (2017). “Getting to Equal 2017: Closing the Gender Pay Gap”. https://www.accenture.com.
ASEAN Secretariat and UNCTAD (2016). ASEAN Investment Report 2016: Foreign Direct Investment and MSME Linkages. Jakarta: ASEAN Secretariat and Geneva: UNCTAD.
Atkinson, R., and B. Miller (2015). “A Policymaker’s Guide to Spurring ICT Adoption”. ITIF paper, Information Technology Innovation Foundation, Washington, D.C.
Atkinson, R., and L.A. Stewart (2013). “The Economic Benefits of Information and Communication Technology”. ITIF paper, Information Technology Innovation Foundation, Washington, D.C.
Bauer, M., H.L. Makiyama, E. Van der Marel and B. Verschelde (2014). “The Costs of Data Localisation: Friendly Fire on Economic Recovery”. ECIPE Occasional Paper No. 3/2014, European Centre for International Political Economy, Brussels.
Belussi, F., G. Rudello and M. Savarese (2016). “The Internationalization of MNEs from and to BRICS countries: the case of the industrial machinery industry”, Marco Fanno Working Papers 205, Università degli studi di Padova, Padova.
Blundell-Wignall, A., and G. Wehinger (2011). “Open Capital Markets and Sovereign Wealth Funds, Pension Funds, and State-Owned Enterprises”, in R.A. Fry, W.J. McKibbon and J. O’Brien (eds.), Sovereign Wealth: The Role of State Capital in the New Financial Order. London: Imperial College Press.
Brand Finance (2016). Global Intangible Financial Tracker 2016 – An Annual Review of the World’s Intangible Value. London: Brand Finance.
Brogan, P. (2016). “Broadband Investment Ticked Down in 2015: Research Brief”. US Telecom Association, http://www.ustelecom.org.
Broude T., Y. Haftel, and A. Thompson (2016). “Legitimation Through Renegotiation: Do States Seek More Regulatory Space in Their BITs?” Hebrew University of Jerusalem Legal Research Paper, 17-1, Hebrew University of Jerusalem.
Chen, W., and F. Kamal (2016). “The Impact of Information and Communication Technology Adoption on Multinational Firm Boundary Decisions”, Journal of International Business Studies, 47(5): 563–576.
Deloitte (2016). ”2016 Global Life Sciences Outlook: Moving Forward with Cautious Optimism”. Deloitte Touche Tohmatsu. https://www2.deloitte.com.
Economist (2016). “The Rise of the Superstars”. Special Report: Companies, The Economist, 17 September. http://www.economist.com/.
Eden, L. (2016). “Multinationals and Foreign Investment Policies in a Digital World”. E15Initiative, International Centre for Trade and Sustainable Development and World Economic Forum, Geneva. www.e15initiative.org.
Fifth Era (2016). “The Impact of Internet Regulation on Investment”. Fifth Era, San Francisco. www.fifthera.com.
Foster, C.G., and M. Graham (2016). “Reconsidering the Role of the Digital in Global Production Networks”. Global Networks, 17(1): 68–88.
Fu, X., C. Pietrobelli and L. Soete (2010). “The Role of Foreign Technology and Indigenous Innovation in Emerging Economies: Technological Change and Catch-up”, World Development, 39(7): 1203–1212.
Google and Temasek (2016). “E-conomy SEA: Unlocking the $200b Digital Opportunity”. http://apac.thinkwithgoogle.com.
Gordon, K., and J. Pohl (2015). “Investment Treaties over Time – Treaty Practice and Interpretation in a Changing World”. OECD Working Papers on International Investment, 2015/02, Organization for Economic Cooperation and Development, Paris.
GSMA (2014). “The Cost of Spectrum Auction Distortions”. GSMA, London. www.gsma.com.
GSMA (2016). “Digital Inclusion and Mobile Sector Taxation 2016”. GSMA, London. www.gsma.com.
IBRD, World Bank, InfoDev and ITU (2011). Telecommunications Regulation Handbook, Tenth Anniversary Edition. Washington, D.C.: World Bank.
IMF (2017). World Economic Outlook (April 2017). Washington, D.C.: International Monetary Fund.
Internet Society (2015). “Internet Exchange Points: An Internet Society Public Policy Briefing”. The Internet Society, Reston, VA, United States. www.internetsociety.org.
ITU (2016). “Working Together to Connect the World by 2020. Reinforcing Connectivity Initiatives for Universal and Affordable Access”. Discussion paper for the Broadband Commission Special Session at the World Economic Forum, Davos, Switzerland, 21 January. www.broadbandcommission.org.
Kedia, Ben, Nolan Gaffney and Jack Clampit (2012).“EMNEs and Knowledge-Seeking FDI”, Management International Review, 52(2): 155–173.
References 219

Kende, M. (2015). “The Mobile App Divide”. Discussion Paper No. 1, The Internet Society, Reston VA, United States. https://www.internetsociety.org.
Koske, I., R. Bitetti, I. Wanner and E. Sutherland (2014). “The Internet Economy – Regulatory Challenges and Practices”, OECD Economics Department Working Papers, No. 1171, Organization for Economic Cooperation and Development, Paris.
Malik, O. M. and R. Agarwal (2012). “The Rise of Emerging Market Multinational Companies (EMNC): A Capabilities-Based Perspective”. Paper presented at the Third Copenhagen Conference on Emerging Multinationals: Outward Investment from Emerging Economies, Copenhagen, Denmark, 25–26 October.
McKinsey & Company (2017). McKinsey Special Collection: Digital Strategy. New York: McKinsey.
McKinsey Global Institute (2016). Digital Globalization: The New Era of Global Flows. New York: MGI.
OECD (2016). “Stimulating Digital Innovation for Growth and Inclusiveness – The Role of Policies for the Successful Diffusion of ICT”, OECD Digital Economy Papers, No. 256, Organization for Economic Cooperation and Development, Paris.
PwC (2016). “Navigating Growth in Uncertain Times”. PwC’s 2016 APEC CEO Survey: ASEAN Report. New York.
Rangan, S., and M. Sengul (2009). “Information Technology and Transnational Integration: Theory and Evidence on the Evolution of the Modern Multinational Enterprise”, Journal of International Business Studies, 40(9): 1496–1514.
Srai, J.S., M. Kumar, G. Graham, W. Phillips, J. Tooze, M.K. Tiwari, S. Ford, P. Beecher, B. Raj, M.J. Gregor, M.K. Tiwari, B. Ravi, A. Neely, R. Shankar, F. Charnley and A. Tiwari (2016). “Distributed Manufacturing: Scope, Challenges and Opportunities”, International Journal of Production Research, 54(23): 6917–6935.
Srai, J.S., T.S. Harrington and M.K. Tiwari (2016). “Characteristics of Redistributed Manufacturing Systems: A Comparative Study of Emerging Industry Supply Networks”, International Journal of Production Research, 54(23): 6936–6955.
UNCTAD (2011). “Interpretation of IIAs: What States Can Do”. IIA Issues Note No. 3. United Nations, New York and Geneva.
UNCTAD (2012). Information Economy Report 2012: The Software Industry and Developing Countries. New York and Geneva: United Nations.
UNCTAD (2013). Information Economy Report 2013: The Cloud Economy and Developing Countries. New York and Geneva: United Nations.
UNCTAD (2015a). Information Economy Report 2015: Unlocking the Potential of E-commerce for Developing Countries. New York and Geneva: United Nations.
UNCTAD (2015b). Investment Policy Framework for Sustainable Development. New York and Geneva: United Nations.
UNCTAD (2016). Data Protection Regulations and International Data Flows: Implications for Trade and Development. New York and Geneva: United Nations.
UNCTAD (2017a). Investment Facilitation: A Review of Policy Practices. New York and Geneva: United Nations.
UNCTAD (2017b). “Investment Policy Monitor: Promoting Investment in the Digital Economy”. Special Issue. April. New York and Geneva: United Nation.
UNCTAD (forthcoming). “Investment and Trade in Services: The Out-Sized Role of Holdings and Intra-Firm Services”.
UNCTAD, UN Global Compact, UNEP FI and PRI (2016). “Sustainable Stock Exchanges Initiative – 2016 Report on Progress”. Paper prepared for the Sustainable Stock Exchanges 2016 Global Dialogue by UNCTAD, UN Global Compact, UN Environment Financial Initiative and Principles for Responsible Investment, Geneva.
United Nations (2015). Transforming our World: The 2030 Agenda for Sustainable Development. New York: United Nations.
United Nations (2017). World Economic Situation and Prospects 2017. New York: United Nations.
WEF (2016). The Future of Jobs: Employment, Skills and Workforce Strategy for the Fourth Industrial Revolution. Global Challenge Insight Report. Geneva: World Economic Forum.
WEF (2017). Internet for All: An Investment Framework for Digital Adoption. Geneva: World Economic Forum.
WIR11. World Investment Report 2011: Non-Equity Modes of International Production and Development. New York and Geneva: United Nations.
WIR13. World Investment Report 2013: Global Value Chains: Investment and Trade for Development. New York and Geneva: United Nations.
WIR14. World Investment Report 2014: Investing in the SDGs: An Action Plan. New York and Geneva: United Nations.
WIR15. World Investment Report 2015: Reforming International Investment Governance. New York and Geneva: United Nations.
WIR16. World Investment Report 2016. Investor Nationality: Policy Challenges. New York and Geneva: United Nations.
World Bank (2016). World Development Report 2016: Digital Dividends. Washington, D.C.: World Bank.
220 World Investment Report 2017 Investment and the Digital Economy