investment behaviour.pdf
TRANSCRIPT

7/18/2019 INVESTMENT BEHAVIOUR.pdf
http://slidepdf.com/reader/full/investment-behaviourpdf 1/44
CHAPTER V
INVESTOR BEHAVIOUR

7/18/2019 INVESTMENT BEHAVIOUR.pdf
http://slidepdf.com/reader/full/investment-behaviourpdf 2/44
CHAPTER V
INVESTOR BEHAVIOUR
Eventhough the fundamental investment rules and principles
remain the same, investment climate and investor behaviour change
from time to time and place to place. Individual investor behaviour in
the capital market is factored by their income, education, reading
habits, cognition levels, etc. Investor preferences differ with respect to
alternative investment avenues, assets and market segments in the
securities market. The track records of companies and of the promoters
have a telling influence on investment decisions. The investment
motives also vary through capital gains, dividends, bonus, rights, tax
benefits and other relevant factors. These and related aspects specific
to the state of Kerala are focused in this chapter.

7/18/2019 INVESTMENT BEHAVIOUR.pdf
http://slidepdf.com/reader/full/investment-behaviourpdf 3/44
128
5.1 Investor
Behaviour
Economists have developed behavioural models to explain the
decision-making process of individuals. The interdependence of the
inherent risk and uncertainty about any course of action are provided
by the theory of games. Game theorists call the stock market a
`pobitive sum game'. But the money game of the stock market may not
yield uniform returns to all its participants.
There are various investment avenues. When one investment
opportunity is chosen, other opportunities may be given up. So,
opportunity cost of an investment is the possible income from the next
best alternative. Rational decision-making demands technical
knowledge and practical experience.
Investor behaviour approaches investing as a rational decision -
making process in which the investor attempts to select a portfolio of
securities. Rational investors form rational expectations about asset
returns, motivated by the maximising principle. They collect available
and relevant information for making decisions. Some investors make
decisions on inadequate information and such decisions may go wrong.

7/18/2019 INVESTMENT BEHAVIOUR.pdf
http://slidepdf.com/reader/full/investment-behaviourpdf 4/44
129
5... T ehaviour of Individual Investors
Greed and fear have been recognised as the two dominant emotions
that characterise market behaviour. Greed makes individuals grasp and
grab when they buy shares, and fear leads to panic (Jawaharlal 202).
Figure 5.1
Behavioral Phases of Individual Investors
j-
/' Greed
/
Hope
Caution
Fear
Selling
or. Buying Buying on
Panic selling
Se1Fng on
baince aggressively balance ba ance
Tim e
Source: Jawaharlal, P. 202.
When share prices increase, small individual investors become
sellers on balance. When share prices are at peak, they become greedy
and buy securities aggressively. At the point of decline, they do not
give up hope and tend to buy more shares than they sell. But when the
market depresses and reaches the bottom, small investors develop fear
and sell most of their securities.

7/18/2019 INVESTMENT BEHAVIOUR.pdf
http://slidepdf.com/reader/full/investment-behaviourpdf 5/44
130
in totality, small investors occasionally make right decisions,
and they try to earn profit by selling securities when share prices are
rising and by buying securities when their prices are declining. Most
often, small investors make incorrect decisions at turning points and
other crucial junctures in share price movements.
5.3 Factors Influencing Investment Decisions
The investor has various alternative avenues of investment for
his savings to flow, in accordance with his preferences. Savings are
invi,st cd in assets depending mainly on their return, liquidity and risk
characteristics. The prime objective of the investor is to minimise the
risk involved in investment and maximise the return.
A security market exists to provide the facilities of a market
place where potential investors can put their money to work,
purchasing securities and those who already own securities can equally
freely and speedily turn them into cash. An effective security market
requires qualities like choice, efficiency and regulation in order
attract investors.

7/18/2019 INVESTMENT BEHAVIOUR.pdf
http://slidepdf.com/reader/full/investment-behaviourpdf 6/44
3
5.3.1 Return Factor
Genuine investors are those who always try to seek equilibrium
between risk and return. How do investors make an assessment about
the return on securities? What return is expected on an average? It is
the expected value of the return, which is the sum of each possible
return multiplied by the chance of its occurrence. The sum of the
chances must add up to one. (Barua, et al 227)
If the return on a security is expected to be r, with a chance of
p,. with a chance of p2,.., and rr, with a chance of pn, then the over
all assessment of investors is based on the expected value of returns,
which is computed as:
Expected Return, E = P1 r1 + P2 r2 +...+ Pn rn
Where as the over all portfolio return would
be the weighed
average of expected return on securities and is computed as:
EP =W, xEl +W2 xE2+...+WnxEn
Wher
EP is the expected portfolio return
W, is the proportion of money invested in security I

7/18/2019 INVESTMENT BEHAVIOUR.pdf
http://slidepdf.com/reader/full/investment-behaviourpdf 7/44
132
E1 is the expected return on security I
W2 is the proportion of money invested in security 2
E2 is the expected return on security 2
Genuine investors, by and large, hold medium and long- term
investments and the return aspect assumes larger importance. There
are two types of security analysis, namely, Technical Analysis and
Fundamental Analysis.
The technical analysts believe that important information about
future stock price movements can be obtained by studying the
historical price movement of stock prices. Financial data are recorded
on graph paper and the data are scrutinised in search of respective
patterns and then deduced from that pictured history the probable
futur L t, end.
Fundamental analysts believe that the true intrinsic value of a
security can be ascertained by studying such items as the company's
earnings, its products, its management, financial statements and other
fundamental facts.

7/18/2019 INVESTMENT BEHAVIOUR.pdf
http://slidepdf.com/reader/full/investment-behaviourpdf 8/44
3 3
The present value of future dividends, computed at an
ap ; upriate discount rate to reflect the real return from the share, is
called the intrinsic or fundamental value of the share. The analysts
attempt to find under-priced or over-priced shares for the investors'
investment decisions.
5.3.2 Liquidity Factor
A security must possess the attribute of liquidity to be attractive
as an investment for the ordinary investors. Liquidity refers to easy
convertibility without loss. Liquidity of an investment is measured in
terms of the speed and ease with which an investment can be converted
in to cash whenever the investor wants it. Liquid investments give the
investor a feeling of security because they enable one to change one's
mind and correct one's mistakes.
A genuine investor is supposed to invest for a relatively long
period for the sake of income as distinguished from a purely trading
profit arising from short-run price fluctuations induced by shifts in
market sentiments. A prudent long term investor would have provided
for his immediate cash needs by holding cash balances and near cash
assets like fixed deposits and only if he has surplus of cash, would he

7/18/2019 INVESTMENT BEHAVIOUR.pdf
http://slidepdf.com/reader/full/investment-behaviourpdf 9/44
134
consider it wise to hold long term investment such as equities. This
assumption is in argument with the usual threefold classification of the
motives of holding liquid cash viz., the transaction motive, the
precautionary motive and the speculative motive. If so, a
genuine
investor would normally expect moderate liquidity and not 'instant'
liquidity.
A prudent investor should be prepared to tide over prolonged
periods of stock market depression, which no amount of liquidity can
eliminate. It is the speculator, who wants instant liquidity because he
wants to be in and out of a security during the same day.
5.3.3 Risk Factor
The words
risk' and ̀ uncertainty
are used inter
-
changeably.
But technically their meanings are different. Risk suggests that a
decision- maker know possible consequences of a decision and their
likelihood at the time he makes the decision. Uncertainly on the other
hand, involves a situation about which the likelihood of the possible
outcomes is not known. On the basis of the degree of risk perception,
investors could be classified into risk takers, risk averters and risk
neutrals.

7/18/2019 INVESTMENT BEHAVIOUR.pdf
http://slidepdf.com/reader/full/investment-behaviourpdf 10/44
135
The risk takers pay more than the expected value of an asset or
an uncertain future and mostly invest in common stocks and
convertible securities. Risk averters show their preference for
investments of low risk and prefer Government securities, insurance
policies, unit trust certificates, etc. Risk neutrals are willing to pay for
making an investment provided they get a return of an equal value. The
majority of the investors accept medium risk.
Securities that have risk
and return
characteristics of their-own,
in ;oinbination makes up a portfolio. Portfolio
selection entails
choosing
the one best portfolio
to suit the risk-return preferences of
the investor
. And portfolio
management is the dynamic
function of
evaluating and revising
the portfolio
in terms of stated investor
objectives (Fischer &Jordan 2).
In academic parlance, the mathematical measure of investment
risk is called `beta
'. The market
as a whole has a `beta
of one. If a
particular stock has a ̀ beta' of two then it is twice as risky as the
market
It means
that if the
market goes
up by
20 per cent
the stock
price rises
by 40
per cent
and if the market falls
by 20
per cent, the

7/18/2019 INVESTMENT BEHAVIOUR.pdf
http://slidepdf.com/reader/full/investment-behaviourpdf 11/44
136
stock price falls by 40 per cent. High ̀ beta' stocks are considered
more risky than low beta stocks.
People who believe that `beta' measures risk
disdain examining
what a company produces or may even prefer not to know the
company's name
The true investor is risk averse but may welcome
volatility.
The more volatile a market becomes, the more the
opportunities to the value oriented investor
(
Bakshi 36).
Figure 5.2
90
80
60
50
40
30
20
1 0
Motives
Behind Investment in Shares
23
M otives
W
45
1. Capital Gain 2. Dividend 3. Rights
4. Bonus
5. Tax
Benefit

7/18/2019 INVESTMENT BEHAVIOUR.pdf
http://slidepdf.com/reader/full/investment-behaviourpdf 12/44
1 3 7
The primary motive behind investment is returns. Figure 5.2
shows the relative investor preferences for the different modes of
returns. It can be seen that investors give the highest priority to capital
gain, followed by dividend, rights, bonus and tax benefits respectively.
Tax factor has only
a negligible influence.
Table 5.1
Risk
Return
and Liquidity
Perceptions of Investors
100 point scale
Investment
Avenues
Risk
Return
Liquidity
Mean
Std.Dev
Mean
SD
Mean
SD
Gold
13.3
16.2
20.5
17.5
44.8
30.1
Real Estate
19.5
15 8
41.7 25.8 22.5
17.3
Shares
45
.2
26.4
39.0
23.6
35.3
32.5
Debenture
22.3
19.5
24.3
19 9
20.9
19.3
Bank Deposits
6.0
13.0
23.3
20.2
64.2
36.6
Com.Deposits
18.3
17.1
24.5
21.5
23.5
23.3
Mutual Fund
23.8
20.2
26.0
19.5
27.9
22.1
Private
Financiers
46.7 32.8 33.7
25.9
28 1
22.3
Others
2.1
12.8
2.0
12.1
1 .9
10.7
Source: Survey data
The important factors that influence demand preferences for
assets are risk, return and liquidity. Here the comparative assessment

7/18/2019 INVESTMENT BEHAVIOUR.pdf
http://slidepdf.com/reader/full/investment-behaviourpdf 13/44
138
technique has been used for rating these factors. The respondents were
asked to perceive the risk, return and liquidity on different investment
options on a 10- point scale, and later enlarged to a 100- point scale
for easy comparison.
As per data, investment with private financiers has been the most
risky and deposits with banks the least risky. Though equity
investment (shares) shows high level of risk, its level of return is
relatively high. Table 5.1 makes a comparative evaluation of risk-
return-liquidity perception among the various investment avenues.
5.4 Reading Habits of Investors
Though Kerala's educational achievements are outstanding, the
majority of investors is not well read or well informed. Despite the
wide newspaper readership in Kerala, only 59.6 per cent of the
investors read the business page of ordinary newspapers regularly.
As shown in table 5.2, it is strikingly clear that only 19.6 per
cent read any Business Daily regularly. And in the case of business
periodicals, only 6.9 per cent of the investors have been regular
readers.

7/18/2019 INVESTMENT BEHAVIOUR.pdf
http://slidepdf.com/reader/full/investment-behaviourpdf 14/44
139
--
C -C
C
^
N
n
x
C
M 00
O
-r
O
MM
N
V
MM
M
N
C
C
NN
N
N
oe
.Mi
^
V
O
Q
N
00
o0
M
Nr
r4 ̂
`̂ v7
m
00
CC
C b
C
N
t
i
.-.
M
C ̀•D
N
'
M
N
C
O
N
N^
N
i
M
N
̂̂
^
•y
C
oC
;-q
•
t
oc
r
r ;
rq
N
en
v
y
L
cC
•y
O
,
00
r
C•
00
00
N
G^
O
O
C
O
^„ ^
C^
,.
i
0
C p
Qw Q
NW
N
N
N
•'
'
C ID
N JC
M
CC
y
O
6^
W
•
C.
¢
O
h .9
D
y
CC
u
C
Y^ •^
c^
.^
x
V
c s a
U
C 7
m
n
r

7/18/2019 INVESTMENT BEHAVIOUR.pdf
http://slidepdf.com/reader/full/investment-behaviourpdf 15/44
1 40
Table 5.3
Reading
Habits of Investors-Books
No. of Books Read
Class
Respondents
0
1-5
6-10
>10
Total
Non-Matriculate
2
- - 22
95.5)
4.5)
8.5)
Pre-Degree
1 4
2
6
87.5)
12.5)
6.2)
Graduate
87
34
_
122
71.1)
27.9)
8)
46.9)
Post Graduate
32
1 3
2
_
47
68.1)
27.7)
4.3)
18.1)
Professionals
27
1 5
4
_
46
58.7)
32.6)
8.7)
17.7)
Others
5
2
7
71.4)
28.6)
2.7)
Total
186
67
6
260
71.5)
25.8)
2.3)
.4)
100)
Source: Survey data
Note : Figures in parenthesis show percentages.
Table 5.3 shows that about 72 per cent of the respondents have not
read even a single book on the subject. On close analysis, we find
clear association between the level of education and reading habits.
People with higher level of education have better reading habits.

7/18/2019 INVESTMENT BEHAVIOUR.pdf
http://slidepdf.com/reader/full/investment-behaviourpdf 16/44
1 4 1
The survey results (table 5.4) show that only one third (34.2%)
of the investors can read and understand the financial statements of
companies such as Balance Sheet and Profit and Loss Account.
Education wise, graduates are in a better position than the post-
graduates. Category of investors by profession, bank employees can
read and understand the financial statements. More than 40% of the
professionals also can understand the financial statements. But only
around 20 per cent of the teachers and government employees can read
and understand the financial statements of companies.
Table 5.4
Understanding Financial Statements of Companies
(profession - wise distribution)
Category of
Understand
To some
Do Not
Class
Investors
extend Understand
Total
Bank Employees
27
18
2
47
57.4)
38.3) 4.3)
Teachers
8
7 8 33
24.2) 51.5)
24.2)
Company
10
24
7
41
em
p
lo
y
ees 24.4)
58.5) 17.1)
Government
8 24
5
37
employees
21.6) 64.9) 13.5)
Business
1 3
26 7 46
28.3) 56.5) 15.2)
Professional 1 0
13
24
41.7) 54.2) 4.2)
I:etired
4
6 _
10
40.0) 60.0)
Others
9 1 3
_
22
4.9) 59.1)
8 9
1 41
3 0
2 6 0
Total 34.2) 54.2) 11.5)
100)
Source : Survey data
Note : Figures in parenthesis show percentages.

7/18/2019 INVESTMENT BEHAVIOUR.pdf
http://slidepdf.com/reader/full/investment-behaviourpdf 17/44
142
Table 5.5 clearly shows that small investors dominate the stock
market. The majority of the investors are small investors, holding
shares having face value of less than Rs.10,000/-. 68% of the investors
hold less than 10 scrips. Less than 10% hold shares of more than 20
companies.
Table 5.5
Share-holding Pattern of Investors
Shares held
Frequency
Percentage
Cumulative
Nil
1- 5---- ----------
1 2
- ----- 94
4.6
-- -- 36.2
4.6
40.8
6 -10
83
31.9
72.7
11 -15
38
14.6
87.3
16 -20
9
3.5
90.8
Ah,jve 20
24
9.2
100
Total
260
100
100
Source : Survey data

7/18/2019 INVESTMENT BEHAVIOUR.pdf
http://slidepdf.com/reader/full/investment-behaviourpdf 18/44
14 3
Table 5.6
Debenture Holding Pattern of Investors
F
Debentures Held
Frequency
Percentage
Cumulative
Nil
143
55.0
55.C
1 -2
57
21.9
76.9
3 - 5
46
17 7
94.6
6 - 7
2
0 .8
95.4
8 - 10
9
3 5
98.9
Above 10
3
1.1
1 00
Total
260
100
100
Source Survey data.
Table 5.6 shows that 55 per cent of the investors in Kerala do
not hold debentures. Around 40 per cent hold only one or tv; o
debentures. Only one per cent holds more than 10 debentures. Thus it
is obvious that debenture holder density in Kerala is remarkably low.
It indicates that either the investor is not fully aware of the potential
debt market or not interested in it. It seems that the liquidity factor
does influence the investment decisions of investors.
7/18/2019 INVESTMENT BEHAVIOUR.pdf
http://slidepdf.com/reader/full/investment-behaviourpdf 19/44
144
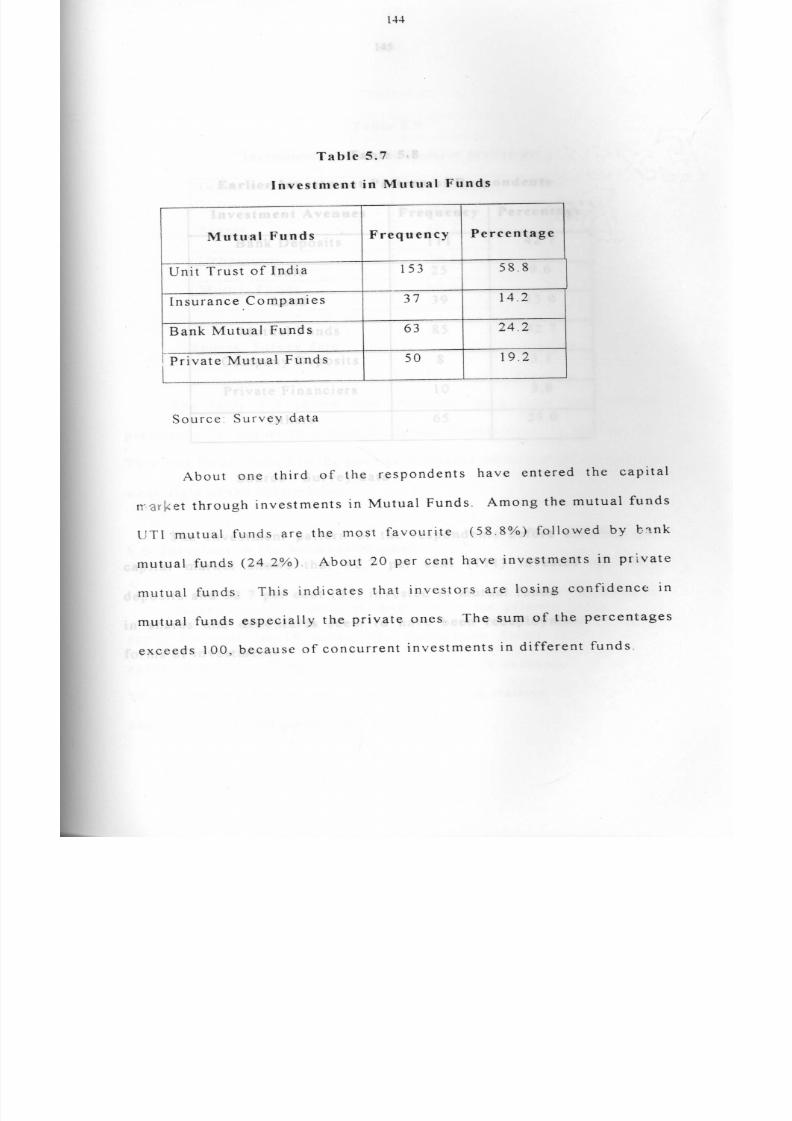
Table 5.7
Investment in Mutual Funds
Mutual Funds
Frequency
Percentage
Unit Trust of India
153
58.8
Insurance Companies
37
14.2
Bank Mutual Funds
63
24.2
Private Mutual Funds
50
19.2
Source. Survey data
About one third of the respondents have entered the capital
nrayi<et through investments in Mutual Funds. Among the mutual funds
UTI mutual funds are the most favourite (58.8%) followed by bank
mutual funds (24.2%). About 20 per cent have investments in private
mutual funds. This indicates that investors are losing confidence in
mutual funds especially the private ones. The sum of the percentages
exceeds 100, because of concurrent investments in different funds.

7/18/2019 INVESTMENT BEHAVIOUR.pdf
http://slidepdf.com/reader/full/investment-behaviourpdf 20/44
145
Table 5.8
Earlier Investment Pattern of Respondents
Investment Avenues
Frequency
Percentage
Bank Deposits
111
-
42.7
----
----- Gold
25
9.6
Land
39
15.0
Mutual Funds
85
32.7
Company Deposits
8
3.1
Private Financiers
3.8
Others
65
25.0
Source : Survey data
The Investment pattern of the respondents before entering the
capital market shows that 42.7 per cent (111) invested on bank
deposits and 32.7 per cent (85) invested in mutual funds. Investment
in shares and debentures seem to have been redeployment of other
forms of investment.

7/18/2019 INVESTMENT BEHAVIOUR.pdf
http://slidepdf.com/reader/full/investment-behaviourpdf 21/44
146
Table 5.9
Investment Options and Order of preference
Investment Option
Average
Rank
Score
Shares
88.72
Debentures
36.13
3
Mutual Funds
60.64
2
Source: Survey data
The table 5.9 shows that investors have clear and marked
preference for shares to mutual funds and mutual funds to debentures.
This may be attributed to the poor performance of mutual funds and the
weak
state
of the debt market.
5.5 Investors
in the
Primary Market
Survey results show that investors in the primary market v. ho
apply for new issues collect the application forms from brokers,
agents, friends, investment forums, and the stock exchange. More than
50 per cent (56.9%) of the investors are in the mailing list of at least
one agency supplying application forms.

7/18/2019 INVESTMENT BEHAVIOUR.pdf
http://slidepdf.com/reader/full/investment-behaviourpdf 22/44
14 7
Table 5.10
Primary Market Operations
Income wise distribution
Frequency
of
applying
onthly
Income
Below 5,000
Never
5
-
Occasionally
52
Very
egularly
Often
3J
8.3)
86.7)
5.0)
5,001 - 10,000
19
1 02
2 1
13.4)
71.8)
14.1) 0.7)
10,001 - 15,000
4
31
5
10.0)
77.5)
12.5)
15,001 - 20,000
3
_
75.0)
25.0)
Not Revealed
7
12.5)
87.5)
Total
29
200
30
11.2)
76.9)
11.5)
0.4)
Source: Survey data
Note : Figures in parenthesis show percentages.
The majority of the respondents are occasional operators in the
pritr.ry market. 88.8 per cent (231) of the investors operate in ...e
primary market. Income wise analysis shows that 77.7 per cent (202)
of the investors belong to the middle income group. New entrants (of
the investing public) prefer to secure shares through public issues
rather than by trading in the secondary market.

7/18/2019 INVESTMENT BEHAVIOUR.pdf
http://slidepdf.com/reader/full/investment-behaviourpdf 23/44
4
'Table 5.11
Return on
investment in New Issues
Ca
egory of
High
Low
Was
Investors
High
F ank employees
1 2
20
1 5
25.1)
42.6)
31.9)
Teachers
1 0
11
1 2
30.3)
3 3 _ 3 )
3.6.4
rCompany employees
9
13
1 9
II
1.9
31.7) 46.3)
Government
9
9
1 9
employees
24.3)
24.3
51.4)
Business
ii
6
1 9
X23.9
34.8
41.3)
Pr
ofessionals 1
2
6
1 6
Retired
83)
2
25.0)
2
63.7)
6
20._0)
20.0) 60.0)
Others
u
8 8
27.3)
36.4) 36.4)
6 1 8 5
1 1 4
Total
23 5) -? 7)
43.3)
Source: Survey data.
Note : Figures in parenthesis show percentages.
If the returns are commensurate with the risk the investor
assumes, the investment decision may be considered as the right one.
The majority of the investors believe that investment in the primary
may'-.-t is more remunerative. 43.8 per cent state that it was higher
dui iiig the early nineties and 23.5 per cent state that it continues to be
high.
7/18/2019 INVESTMENT BEHAVIOUR.pdf
http://slidepdf.com/reader/full/investment-behaviourpdf 24/44
149
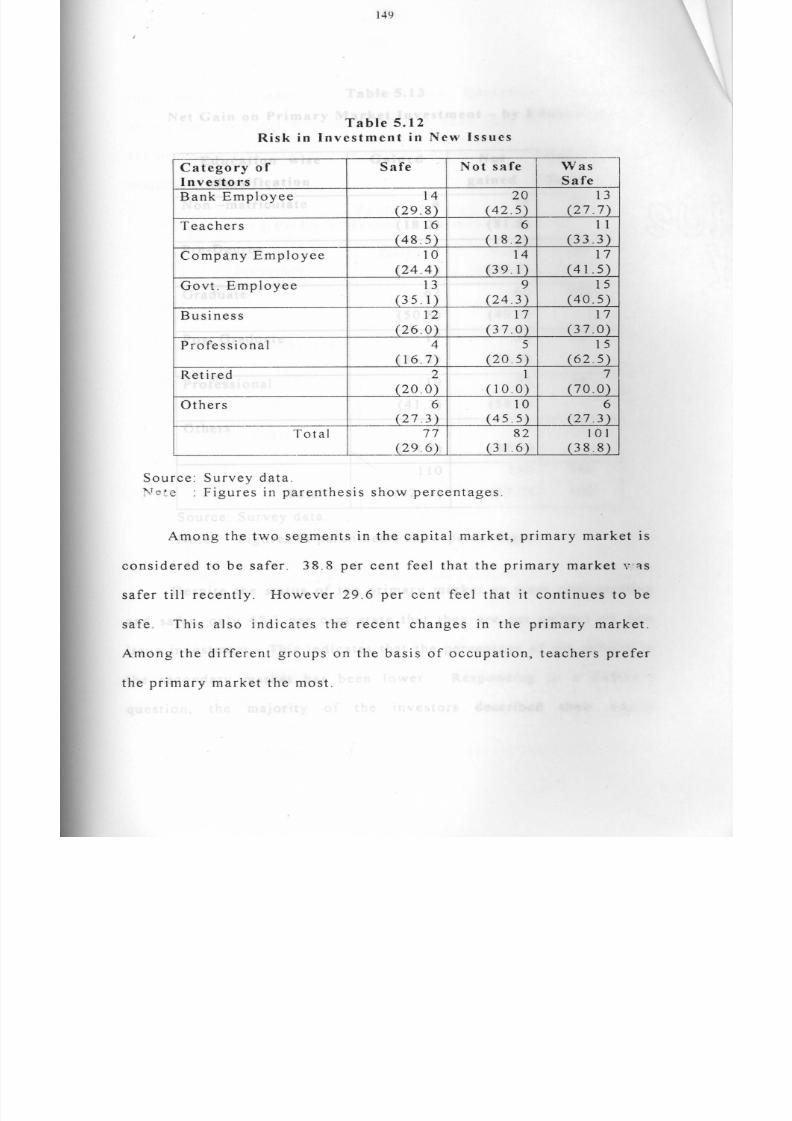
Table 5.12
Risk in Investment in New Issues
Category of
Safe
Not safe Was
Investors
Safe
Bank Employee
14
20
13
29.8)
42.5 27.7)
Teachers
16
6
1 1
48.5)
18.2)
33.3
Company Employee
1 0
1 4
17
24.4
39.1)
41.5)
Govt. Employee
13
9
1 5
35.1)
24.3)
40.5)
Business
12
17
17
26.0)
37.0)
37.0)
Professional
4
5
1 5
16.7)
20.5)
62.5)
Retired
2
7
20.0) 10.0 70.0)
Others
6
1 0 6
27.3)__
_ 45.5)
27.3
Total
77
82 101
29.6)
3 1.6)
38.8)
Source: Survey data.
'iCe : Figures in parenthesis show percentages.
Among the two segments in the capital market, primary market is
considered to be safer. 38.8 per cent feel that the primary market v. is
safer till recently. However 29.6 per cent feel that it continues to be
safe. This also indicates the recent changes in the primary market.
Among the different groups on the basis of occupation, teachers prefer
the primary market the most.
7/18/2019 INVESTMENT BEHAVIOUR.pdf
http://slidepdf.com/reader/full/investment-behaviourpdf 25/44
1 50
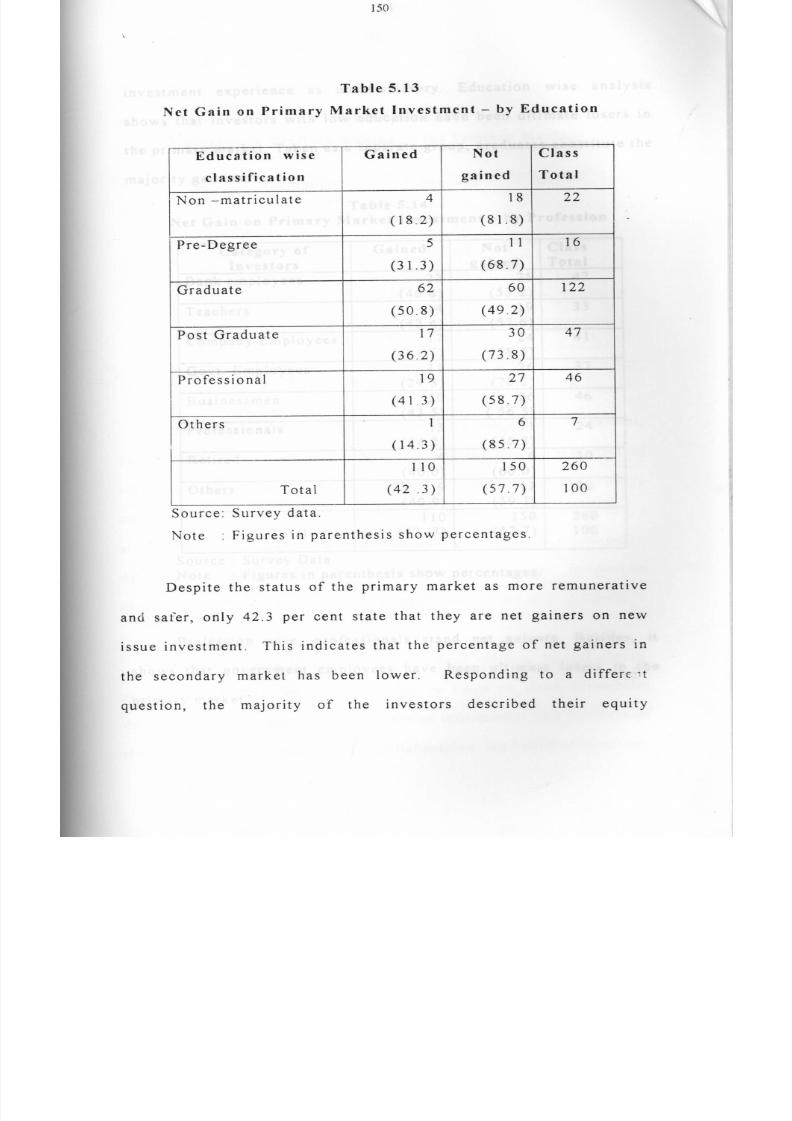
Table 5.13
Net Gain on Primary Market Investment
-
by Education
Education wise
Gained
Not
Class
classification
gained
Total
Non -matriculate
4
18
22
(18.2)
(81.8)
Pre-Degree
5
11
1 6
31.3)
68.7)
Graduate
62
60 122
50.8)
49.2)
Post Graduate
1 7
30
47
36.2)
73.8)
Professional
1 9
27
46
41.3)
58.7)
Others
6 7
14.3)
85.7)
1 1 0
1 5 0
2 6 0
Total
42 .3)
57.7)
1 00
Source: Survey data.
Note : Figures in parenthesis show percentages.
Despite the status of the primary market as more remunerative
and safer, only 42.3 per cent state that they are net gainers on new
issue investment. This indicates that the percentage of net gainers in
the secondary market has been lower. Responding to a differc't
question, the majority of the investors described their equity

7/18/2019 INVESTMENT BEHAVIOUR.pdf
http://slidepdf.com/reader/full/investment-behaviourpdf 26/44
5
investment experience as unsatisfactory. Education wise analysis
shows that investors with low education have been ultimate losers in
the primary market. Taken as a separate group, graduates constitute the
majority gainers.
Table 5.14
Net Gain on Primary Market Investment
-
by Profession
Category of
Gained
Not
Class
Investors
gaine
Total
Bank employees
22
25
47
46.8
53.2)
Teachers
4
1 9
33
-- 42.4)
57.6)
---
Company Employees
17
24
41
41.5
58.5)
Govt. Employees
11
26
37
29.8
7
Businessmen
20
26
46
43.5
56.5
Professionals 13
1 1 24
54.2
45.8)
Retired
4
6
10
40.0)
60.0
Others
9
13
22
40.9
59.1)
1 1 0
1 5 0
2 6 0
Total
42 .3)
57.7)
1 00
Source : Survey Data
Note :
Figures in parenthesis
show
percentages.
Profession wise, professionals stand net gainers. Besides, it
shows that government employees have been ultimate losers in the
primary market.

7/18/2019 INVESTMENT BEHAVIOUR.pdf
http://slidepdf.com/reader/full/investment-behaviourpdf 27/44
152
Table 5.15
Guidance
in Decision making in
the Primary Market
Guidance
Average
Score
Rank
Own----
75.38
Friends
54.92
2
Media
Brokers
Relatives
47.31
15.15
13.15
3
4
5
Source : Survey data
Though
investment decisions depend on one
s own judgement,
due weightage has been given to friends and the media. The role of
stock- brokers in influencing the decisions of investors in the primary
market is negligible
Investment decisions based on tips and rumours
are likely to be wrong
Investment especially equity investment,
demands good knowledge of the market and due diligence
Investment
decisi ins in the primary market lack the professional touch in Kerala
Prospectus is a formal public document offering to sell shares,
setting forth details an investor needs to know to make investment
decisions. A prospectus contains heads of information like business of
the ermpany, promotors, business collaboration, the board of directs.-,

7/18/2019 INVESTMENT BEHAVIOUR.pdf
http://slidepdf.com/reader/full/investment-behaviourpdf 28/44
5 3
cost of the project
means of finance
business prospects, the size of
the issue, listing and the names of managers and underwriters to the
issue
Around 51.5 of the investors either do not refer to any
literature on capital market or merely go through the prospectus in lieu
of information of the companies. This also indicates that investors, by
and large, are not well informed and are not
likely to
be rational
decision-makers
. Only around
5 per cent
study
the prospectus
thoroughly.
Table 5.16
Studying Prospectus while Deciding
to Apply
for New Issues
Education
-
wise
No
Yes
Just go
Refer
Refer
Classification
through
in brief
in
detail
Non-Matriculate
1 1
2
8
2 _
50.0
9. 1
3.4
4.5)
Pre-Degree
6
4
6
-
-
37.5)
25.0)
37.5)
Graduate
7
40
43
9
3
13.9
32.8
35.2)
15.6)
2.5)
Post Graduate
4
1 2
20
5
4
8.5)
25.8
42.6)
10.6)
8.5
Professional
4
19
3
6
4
8.7
41.3
28.3)
13.0
8.7)
Others
_
6
8
5.7)
14.3)
4 2
8 4
91
3 2
Total
16.2)
32.3)
35.0)
12.3)
4.2)
Source: Survey data.
Note : Figures in parenthesis show percentages.

7/18/2019 INVESTMENT BEHAVIOUR.pdf
http://slidepdf.com/reader/full/investment-behaviourpdf 29/44
S t
1 54
Various factors influence investment decisions in the primary
market. Table 5.17 shows various factors arranged in the order of
preference expressed by the respondents. The track record of the
company and the promoters are given top priority, while deciding to
apply for shares. Highlights of the issue and the product of the
company are also important considerations.
Table 5.17
Factors Influencing Primary Market Investment
Rank
Factors
Average
Score
Track record of the company
64.04
2
Track record of promotors
63.81
3
Highlights of the Issue
49.04
4
The product of the company
47.19
5
Risk factors mentioned
45.92
6
Ratings given in Publications
44 5
7
Equity Participation of promotors
41.15
8
Equity participation of foreign firms
33.12
9
Some big name in the Board
15.46
1 0
Who the underwriters are
11.38
Source : Survey data.

7/18/2019 INVESTMENT BEHAVIOUR.pdf
http://slidepdf.com/reader/full/investment-behaviourpdf 30/44
155
Table 5.18
Borrowings
for Equity
Investment
Category of Investors No From Banks Financiers
Monthy Income friends
Blow- 500039192
65.0) 31.7) 3.3)
5001 10000 101 29 12
71.1) 20.4) 8.5)
10001 15000 28 1 11
70.0) 2.5) 27.5)
15001 20000 5 1
83.3) 16.7)
Above 20000 2 1 1
0) 25.0) 25.0)
50
Not Revealed
4
2
50.0)
12.5)
25.0)
12.5)
1 7 9
51
2 9
Total
68.8)
19.6)
11.2)
0
Source
: Survey data
Note
: Figures in parenthesis
show
percentages.
The majority of the Investors (68.8%) do not borrow for equity
investment. Around 20 per cent borrow from friends and 10% borrow
from banks. The cost of borrowings, i.e., the rate of interest is

7/18/2019 INVESTMENT BEHAVIOUR.pdf
http://slidepdf.com/reader/full/investment-behaviourpdf 31/44
156
reasonably
high,
and so it may not be profitable to invest borrowed
funds.
Speculators
usually borrow for
equity investment and therefore
it indicates that majority of the investors are not speculators.
The capital market suffers from functional and institutional
lapses. There have been inordinate delays in allotment of shares,
refund of application money, despatch of share certificates and
effecting transfer of shares. In connection with Allotment, Refund t.nd
Share Transfer 41.5 per cent (108) of the investors had to file
complaints with the companies. Of these, 62.96 per cent (68)
succeeded in solving their problems. Around 15 per cent of the
investors lodged complaints with the S E B I.
5.6 Investors in the Secondary Market
Stock market is a place where the purchase and sale of securities
like shares and debentures take place. Members of the stock market
known as stock- brokers transact business on behalf of the investors.
Institutions also can become members of the stock market.

7/18/2019 INVESTMENT BEHAVIOUR.pdf
http://slidepdf.com/reader/full/investment-behaviourpdf 32/44
157
Table 5.19
Secondary Market Operations
Income
-
wise Distribution
Monthly Income
Do not
Shares
Debentures
Both
Buy
onl
y
onl
y
Below5000
30
30
50.0)
50.0)
5001 10000
5 6
8 4
_
2
39.4)
59.2)
1.4)
10001 15000
1 0
2 7
2
25.0)
67.5)
2.5)
2.5)
15001 -20000
5
_
83.3)
16.7)
Above 20000
2
2
50.0)
50.0)
Not Revealed
2
5
_
25.0)
62.5)
12.5
1 0 0
1 53
6
38.5)
58.8)
0.4)
2.3)
Source: Survey data.
Note : Figures in parenthesis show percentages.
61.5% of the investors buy securities from the Secondary
Market. Only 2.7 per cent of the respondents buy debentures. This
substantiates the statement that debenture market in Kerala is not
popular.

7/18/2019 INVESTMENT BEHAVIOUR.pdf
http://slidepdf.com/reader/full/investment-behaviourpdf 33/44
158
Table 5.20
Share Retaining Habits of Investors
Monthly
Till
Three
One
Three
More
Income
listing
Months
year
years
than
Three
Years
Below 5000
6
6
11
24
1 3
10.0)
10.0)
18.3)
40.0)
21.7)
5001 10000
7
31
5 5
3 8
7.2)
4.9)
21.8)
38.7)
26.8)
1 0 0 0 1 - 1 5 0 0 0
-
1 0
2 0
9
2.5)
25.0)
50.0)
22.5)
15001 - 20000
-
3
16.7)
16.7)
16.7)
50.0)
Above 20000
2
25.0)
50.0)
25.0)
Not Revealed
2
-
3
2
12.5)
25.0)
37.5)
25.0)
Total
20
1 6
53
105
66
7.7)
6.1)
20.4)
40.4)
25.4)
Source: Survey data.
Note : Figures in parenthesis show percentages.
About
65.8 per cent of the respondents hold shares for a period
of more than one year
. They
seem to prefer a steady return from their
investments to windfall gains from speculations
This tendency of the
investors indicates that investors out number speculators in the capital
market.

7/18/2019 INVESTMENT BEHAVIOUR.pdf
http://slidepdf.com/reader/full/investment-behaviourpdf 34/44
159
Table 5.21
Perceptions of Indices as Performance Indicators
Indices
Positive
Negative
Misleading
Only an
Total
indication
BSE
6 5
3 8
3 7
1 2 0
2 6 0
Sensex
25.0)
14.6)
14.2)
46.2)
NSE Index
42
31
42
145
260
16.2)
12.0)
16.2)
55.8)
National
32
32
49
147
260
Index
12.3)
12.3)
18.8)
56.5)
Cochin
26
86
41
107
260
S E Index
(10.0)
(33.0)
(15.8)
(41.2)
Per -
15.8
(18.0)
(16.3
)
49.9)
100
centage
Source: Survey data.
Note : Figures
in parenthesis show percentages.
Stock market Indices are expected to provide an overview
of the behaviour of security prices and the direction of the market. The
B S E Sensex still remains the popular index among investors, though
most of the investors are aware that stock market indices are not real
indicators of the market conditions. Only 15.8 per cent feel that these
are indicators at least in some way.

7/18/2019 INVESTMENT BEHAVIOUR.pdf
http://slidepdf.com/reader/full/investment-behaviourpdf 35/44
160
Table 5.22
Effectiveness of S E
B I as the Regulator
of Capital Market
Category of Investors
Yes
No
Very
Class
Little
Total
Bank employees
1 4
1 0
23
47
29.8)
21.3)
48.9
Teachers
4
27
22
33
12.1)
21.2)
66.7)
Company employees
3
25
1 3
41
7.3)
61.0)
31.7)
Govt: employees
5
6
1 6
37
13 5
43.2)
43.2)
Business
27
1 8
24
2.2)
58.7)
75.0
Professionals
2
4
18
24
8.3)
16.7
75.0
Retired
_
6
4
1 0
60.0)
40.0)
Others
3 5
101
1 29
260
13.5)
38.8)
47.7)
100)
Source: Survey data.
Note : Figures in parenthesis show percentages.
More than 90 per cent of the investors are aware of the existence
of Securities and Exchange Board of India (S E B I). But there is a
strong feeling among the investors that SEBI has not succeeded in
regulating the capital market. Only a small minority (13.5%) believes
that S E B I has been successful.

7/18/2019 INVESTMENT BEHAVIOUR.pdf
http://slidepdf.com/reader/full/investment-behaviourpdf 36/44
6
Table 5.23
Opinion of Investors about Stock Brokers
Opinion
Frequency
Per centage
Well Informed
42
16.2
Not well Informed
218
83.8
Total
260
100
Honest
123
47.3
1_ - ishonest
137
52.7
Total
260
100
Prompt Payment
44
16.9
Dela in Payment
216
83.1
Total
260
100
Reliable
Not Reliable
147
113
56.5
43.5
_Tota
Helpful
260
193
100
74.2
Not Helpful
67
25.8
Total
260
100
Source: Survey data.
A broker is a member of the stock exchange who has been
licenced to buy or sell shares on his own or on his client's behalf.
Brokers offer facilities such as safe keeping client's shares, offering
investment advice, planning client's portfolio of investments and
managing client's portfolio. On professional competence, about 84%
belie': that brokers are not well informed, about 53% feel that brokers
are not honest, and about 83% have experienced that there is
considerable delay in payments. However, the majority of the
investors (74.2%) consider that brokers are helpful.

7/18/2019 INVESTMENT BEHAVIOUR.pdf
http://slidepdf.com/reader/full/investment-behaviourpdf 37/44
162
Table 5.24
Attitude on Attending
Short-
term Courses on Capital Market
T
tal
Category of Interested
Not
Inclined
nvestors nterested
o
Bankempoyees 16922
4 7
340) 191) 46.8)
Tachers7 3 3
3 3
21.2 39.4) 39.4
41
Comany 2623
empoyees 293146561
Gov: emoyees95 3
3 7
243135 622
4 6
Bsness5 724
370 52.2
10.9
2 4
5
Poessona 7 2
20.8 .29.2 X50.0
40991 500
5
26 0
Total
6 5
6 0
13
100)
ercentage
(25.0)
(23.1)
51.9) 1
Source: Survey data.
Note : Figures in parenthesis show percentages.
Around 77 per cent of the respondents are interested and in
favour of attending awareness programmes and even short-term courses
on capital market investments. Among the various groups on the basis
of occupation, Bank Employees are more interested in attending such
pr,)grammes. Teachers followed by business- men are the least
interested.

7/18/2019 INVESTMENT BEHAVIOUR.pdf
http://slidepdf.com/reader/full/investment-behaviourpdf 38/44
6 3
Table 5.25
Investor Preference in Kerala Based Companies by Profession
Category
of
Interested
Not
Total
Investors
interested
Bank employees
5
42
47
10.6)
89.4)
Teachers
1 0
23
33
30.3)
69.7)
Company employees
8
33
41
19.5)
80.5
Govt: employees
5
32
37
13.5)
86.6)
Business
1 0
36
46
21.7)
78.3)
Professional
5
9
24
20.8
79.2)
Retired
2
8
20.0)
80.0)
Others
8
1 4
22
32.4)
67.6)
Total
53
207 260
Percentage
20.4)
79.6)
1 0 0 )
Source
Survey data
Note :
Figures in parenthesis show percentages.
Around 80% of the respondents are not inclined to invest in
Kerala Based Companies. IRR of Regional companies, evaluated and
presented in Chapter 6, substantiates this statement. Most of the
Regional companies recorded negative returns.

7/18/2019 INVESTMENT BEHAVIOUR.pdf
http://slidepdf.com/reader/full/investment-behaviourpdf 39/44
1 6 4
Table 5.26
Intentions
of Investors to Continue in the Capital Market
Category of
Certainly
Probably
Certainly
Total
Investors
Yes
No
Bank employees
8
26
1 3
47
17.0
55.3
27.7)
Teachers
4
20
9
33
12.1)
60.6
27.3
Company employees
8
26
7
4
19.5)
63.4
17.1
Govt: employees
3
31
3
37
8.1
)
83.8
8.1
Business
1 0
27
9
46
21.7)
58.7
19.6
Professional
6
16
2
24
25.0)
66.7
8.3
Retired
2
7
20.0)
70.0
10.0
Others
4
1 5
3
22
18.2
68.2)
13.6)
Total
45
168
47
260
Percentage
(
17.3)
(64.6)
(18.1)
(100)
Source: Survey data
Note : Figures in parenthesis show percentages.
It is alarming to note that only 17.3 per
cent
of the respondents
are sure, certain
and likely to continue
investment in the Capital
Market. 64.6 per cent
are not sure, where as 18.7 per cent have
withdrawn from the market forever. The study indicates that the
capital market is likely to be lukewarm for some more time (Survey
was conducted during mid 1997).

7/18/2019 INVESTMENT BEHAVIOUR.pdf
http://slidepdf.com/reader/full/investment-behaviourpdf 40/44
165
5.7. Problems faced by Investors
Investors have been attracted to the capital market by the
potential
for rapid growth
and high returns
. However, they
have been
highly
discouraged
by the
operating inefficiencies and lack of
reliability of
market institutions and infrastructure.
Investors face numerous problems in the capital market. There
has been acute shortage of reliable information on the capital market
network. Investors feel that the media is not friendly to them.
Frequent change in the norms by the Regulators for new issues cause
worries.
Rigging of prices - as in the case of M S Shoes
issue
- before
floating of new issues is yet another problem. Manipulation of high
premium on new issues is a similar problem
. Besides, certain
promoters manipulate and inflate the costs of the projects
several
times.
There has been undue delay in refunding the application money,
issue of allotment letters and in the issue of share certificates.
Because of the absence of any mechanism to check the performance of

7/18/2019 INVESTMENT BEHAVIOUR.pdf
http://slidepdf.com/reader/full/investment-behaviourpdf 41/44
1 66
companies which come out with public issues
a number of companies
vanish into thin air after the issue.
Investors in up-country regions lack accessil ^̀ .;y to Stock
Exchange
,
Stockbrokers and collection centres of commercial banks.
Hence
the primary market has a serious problem to mobilise the
potential savings of the public
Only less than 10 per cent of the
financial savings are routed through the capital market.
The most important problem faced by investors in the secondary
market has been delay and non-payment of dues or non-delivery of
shares by brokers
Similarly there is undue delay in transfer of shares
by companies, mostly due to bad delivery. The investors also
experience delay in payments of dividends on shares and interest on
debentures
Rights issues and bonus issues
very
often result in the
problem of odd lots. The stock market lacks liquidity as it is flooded
with untradable scrips, thousands of which are quoted below par.
Besides, most of the stock exchanges are in metropolitan cities and so,
many up-country investors miss the market very often.

7/18/2019 INVESTMENT BEHAVIOUR.pdf
http://slidepdf.com/reader/full/investment-behaviourpdf 42/44
1 67
5.8. Conclusion
Despite the existence of favourable environment and potential
for the spectacular growth of the capital market in the State,
shareholder density has been far below the national average. This
indicates the under-utilisation of favourable circumstances.
Several factors influence the investors' demand preferences for
assets
. The important factors have been return, risk, and liquidity of
which, the investors have given top priority to the return.
Despite Kerala's commendable achievements in the field of
education, investors in the capital market are not well read and thus
not well informed. Capital market investment is one area which
demands adequate and reliable information for making right decisions.
Issuers are required to disclose meaningful information to help
investors take sound decisions. But only one-third of the investors can
read and understand the financial statements of companies and so, not
likely to be rational decision-makers. Those who read and analyse
information give top priority to the track record of companies,
followed by highlights of issue and the product of the company. A

7/18/2019 INVESTMENT BEHAVIOUR.pdf
http://slidepdf.com/reader/full/investment-behaviourpdf 43/44
1 68
good number of investors depend on their friends and the media for
investment guidance.
Small investors dominate the capital market, and the debenture-
holder density is remarkably low in Kerala. Debt market is an area
where the investors can fearlessly tread in. An investor who buys a
debenture is lending money to the issuing company or institution at a
given rate of interest. The debenture- holder can sell the instrument in
the market or may hold it till the repayment date. Investment in debt
instruments of good quality can provide a steady guaranteed income
combined with safety of the principal. The interest rate on such bonds
is 4 - 5 per- centage points higher that on bank deposits. A good
number of investors who are habitual depositors in banks have entered
the capital market through the Mutual Funds. The majority does not
borrow for making investment in the capital market.
The Primary market has been the favourite of the vast majority
of investors. About 43.8 per cent of the investors expressed that they
had been receiving higher return from the primary market. Only less
than a quarter of the total number of investors have stated that the
return from the primary market has been higher. It guic:e, us to the
reason for the recent sluggishness in the primary market. Despite the

7/18/2019 INVESTMENT BEHAVIOUR.pdf
http://slidepdf.com/reader/full/investment-behaviourpdf 44/44
169
rapid growth of the market in the eighties and the early nineties, the
prolonged sluggishness of primary market during the latter part of the
nineties has been a matter of serious concern.
The majority of the investors buy securities from the secondary
market, only a very small number buy debentures, and this
substantiates the view that debenture market in the state is not popular.
Investors in general hold shares for a period of more than one year and
it indicates that, investors out number speculators in the capital
market. Of the various forms of returns on investment, top priority has
been given to capital gain.
Investors reveal strong feelings on the ineffectiveness
of stock
price indices and the regulator
, SEBI itself. They
also doubt the
professional competence
of stock-brokers. The study
also reveals
that the majority of the investors are not inclined to invest in Kerala
based regional companies and some of them have already withdrawn
from the market
. The majority
of the investors have revealed their
willingness to learn and readiness to attend awareness programmes and
even short- term courses on capital market
. Timely
and right
interventions
by the regulators could bring
positive changes in the