investment community conference call … · hong kong dollar 7.80 7.77 ... indian rupee 43.53 44.09...
TRANSCRIPT
Baring Asset Management (Asia) Limited19th Floor, Edinburgh Tower
15 Queen’s Road Central, Hong KongTel: (852) 2841 1411Fax: (852) 2868 5296
Internet: www.baring-asset.com
THE ASIA PACIFIC FUND, INC.
Asia : Long-Term and Short-Term Market Review and Outlook
Investment Community Conference Call
www.asiapacificfund.com
September 20, 2005
1
(HK: s:\shared\investmentmanagement\accounts\tango\present\0509-ICCC.ppt
Table of Contents
Page
Section 1: Asian Markets Review 2 - 5
Section 2: Market Outlook
- Re-assessing The Secular Case for Asia 7 - 16
- Asia – The Short-Term View 17 - 33
Section 3: Portfolio Strategy 34 - 36
Section 1:
ASIAN MARKETS REVIEW
3
(HK: s:\shared\investmentmanagement\accounts\tango\present\0509-ICCC.ppt
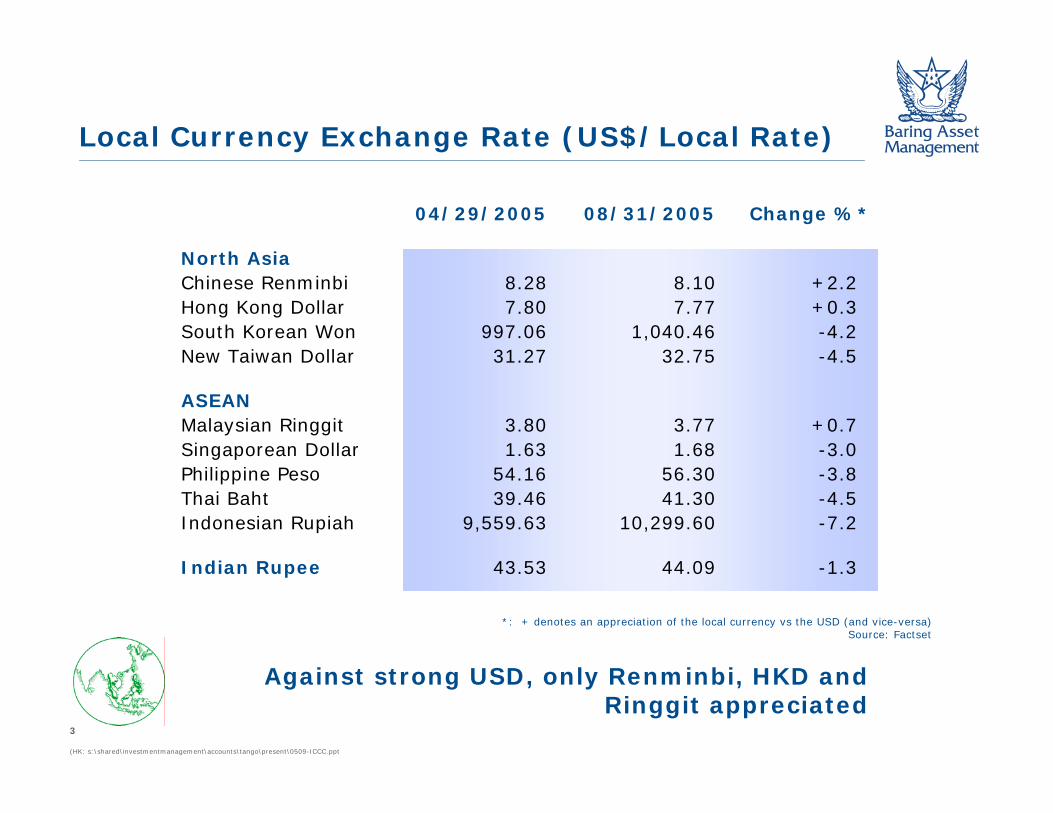
Local Currency Exchange Rate (US$/Local Rate)
04/29/2005 08/31/2005 Change %*
North AsiaChinese Renminbi 8.28 8.10 +2.2Hong Kong Dollar 7.80 7.77 +0.3South Korean Won 997.06 1,040.46 -4.2New Taiwan Dollar 31.27 32.75 -4.5
ASEANMalaysian Ringgit 3.80 3.77 +0.7Singaporean Dollar 1.63 1.68 -3.0Philippine Peso 54.16 56.30 -3.8Thai Baht 39.46 41.30 -4.5Indonesian Rupiah 9,559.63 10,299.60 -7.2
Indian Rupee 43.53 44.09 -1.3
*: + denotes an appreciation of the local currency vs the USD (and vice-versa)Source: Factset
Against strong USD, only Renminbi, HKD and Ringgit appreciated
4
(HK: s:\shared\investmentmanagement\accounts\tango\present\0509-ICCC.ppt
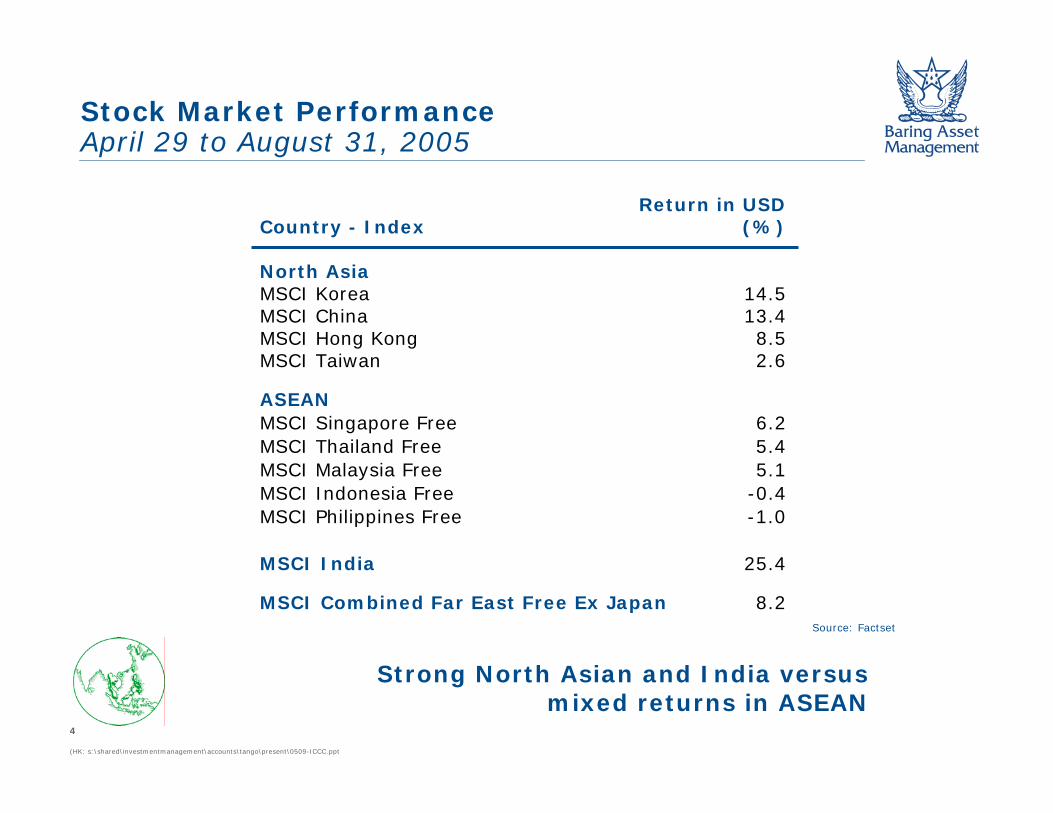
Stock Market PerformanceApril 29 to August 31, 2005
Return in USDCountry - Index (%)
North AsiaMSCI Korea 14.5MSCI China 13.4MSCI Hong Kong 8.5MSCI Taiwan 2.6
ASEANMSCI Singapore Free 6.2MSCI Thailand Free 5.4 MSCI Malaysia Free 5.1MSCI Indonesia Free -0.4MSCI Philippines Free -1.0
MSCI India 25.4
MSCI Combined Far East Free Ex Japan 8.2Source: Factset
Strong North Asian and India versusmixed returns in ASEAN
5
(HK: s:\shared\investmentmanagement\accounts\tango\present\0509-ICCC.ppt
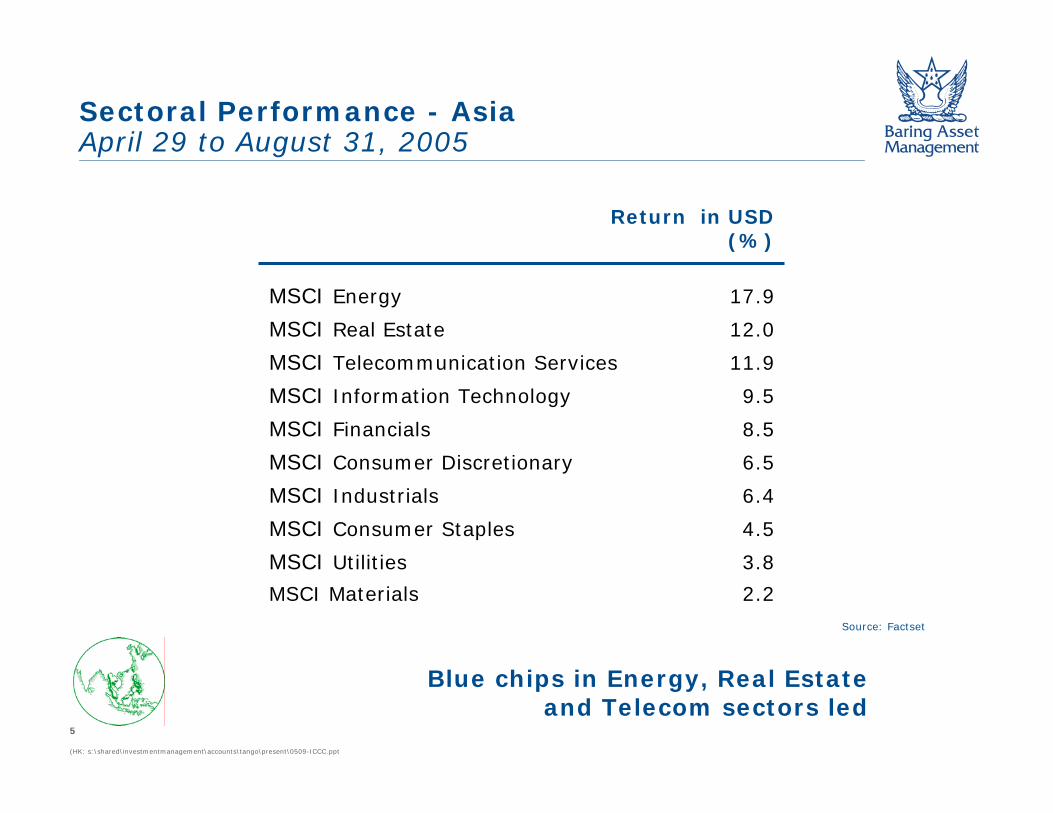
Sectoral Performance - AsiaApril 29 to August 31, 2005
Source: Factset
Return in USD(%)
MSCI Energy 17.9
MSCI Real Estate 12.0
MSCI Telecommunication Services 11.9
MSCI Information Technology 9.5
MSCI Financials 8.5
MSCI Consumer Discretionary 6.5
MSCI Industrials 6.4
MSCI Consumer Staples 4.5
MSCI Utilities 3.8
MSCI Materials 2.2
Blue chips in Energy, Real Estateand Telecom sectors led

Section 2:
MARKET OUTLOOK

Re-assessing The Secular Casefor Asia
8
(HK: s:\shared\investmentmanagement\accounts\tango\present\0509-ICCC.ppt
Asia - The Secular Case remains intact
Re-rating of Asian equities is set to continue on superior economic growth and higher corporate returns
Favorable demographics and rising credit culture lead to stronger domestic consumption
Corporate ROE has improved thanks to better supply side discipline and deleveraging
Asian currencies remain undervalued and Asian equities are under-owned
A more sustainable earnings growth with less cyclicality will bethe major driver for re-rating
Source: Baring Asset Management, Sept 2005
Asia remains an attractive strategic investment
9
(HK: s:\shared\investmentmanagement\accounts\tango\present\0509-ICCC.ppt
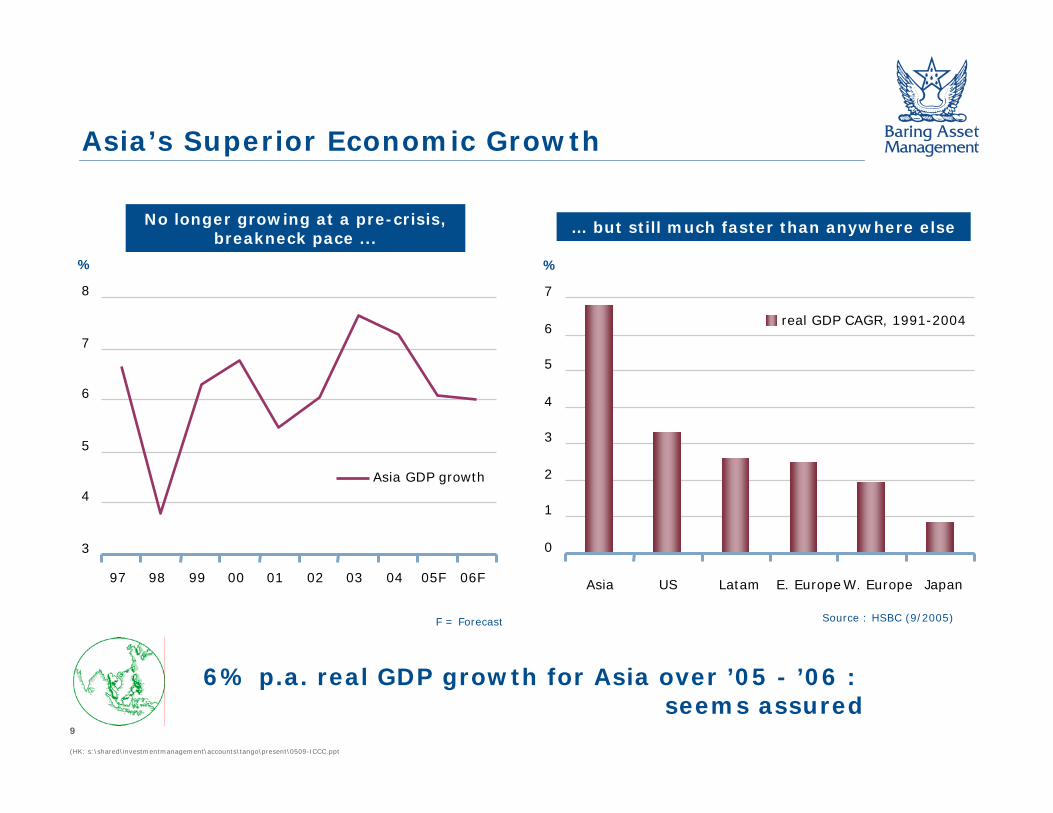
No longer growing at a pre-crisis, breakneck pace ...
Source : HSBC (9/2005)
… but still much faster than anywhere else
6% p.a. real GDP growth for Asia over ’05 - ’06 : seems assured
Asia’s Superior Economic Growth
F = Forecast
3
4
5
6
7
8
97 98 99 00 01 02 03 04 05F 06F
Asia GDP growth
%
0
1
2
3
4
5
6
7
Asia US Latam E. EuropeW. Europe Japan
real GDP CAGR, 1991-2004
%

10
(HK: s:\shared\investmentmanagement\accounts\tango\present\0509-ICCC.ppt
A high proportion of economically active citizens ...
… can fund much higher levels of borrowing
Domestic consumption : solid long-term trend
Consumption - Supported by Demographics and a Rising Credit Culture
% of population aged 15-39 Household loans as % of GDP
Source : HSBC (9/2005)
20
25
30
35
40
45
Chin
a
India
Indones
ia
Kore
a
Mal
aysi
a
Thai
land
US
UK
Japan
2005 2015
0
10
20
30
40
50
60
70
80
90
100
SG US JP KR HK MY TW TH ID PH
11
(HK: s:\shared\investmentmanagement\accounts\tango\present\0509-ICCC.ppt
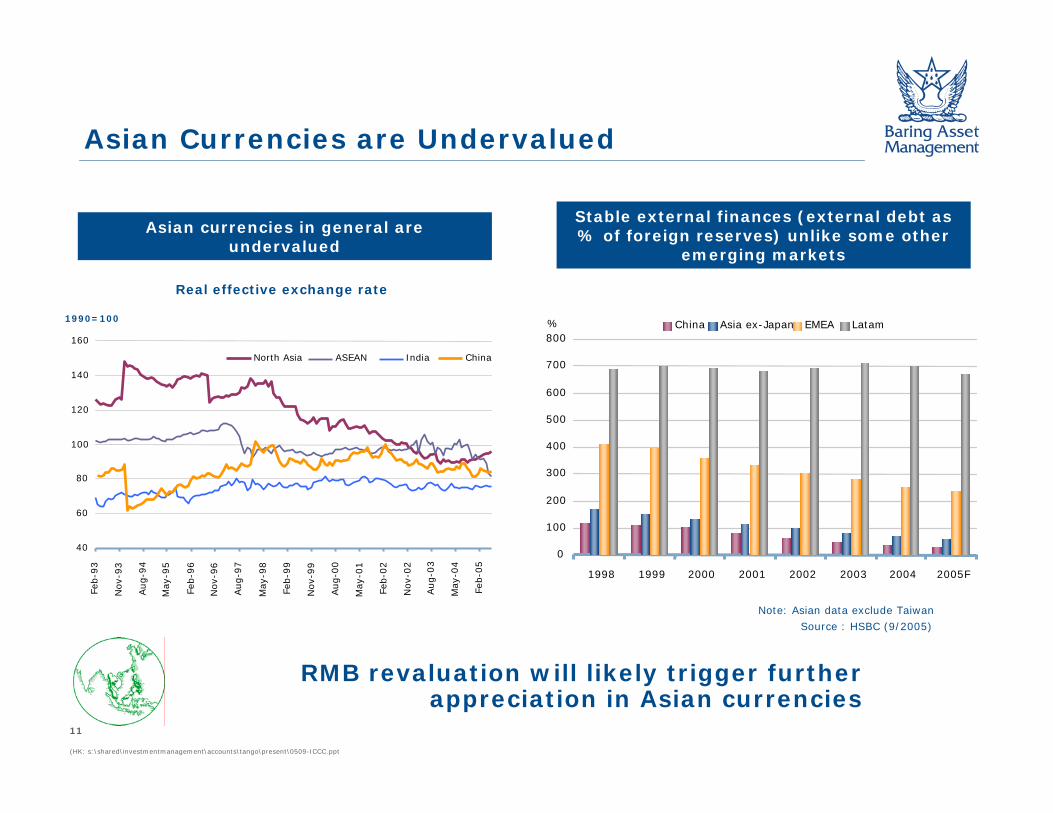
Asian currencies in general are undervalued
Stable external finances (external debt as % of foreign reserves) unlike some other
emerging markets
Note: Asian data exclude Taiwan
Real effective exchange rate
Asian Currencies are Undervalued
Source : HSBC (9/2005)
RMB revaluation will likely trigger further appreciation in Asian currencies
40
60
80
100
120
140
160
Feb-9
3
Nov-
93
Aug-9
4
May
-95
Feb-9
6
Nov-
96
Aug-9
7
May
-98
Feb-9
9
Nov-
99
Aug-0
0
May
-01
Feb-0
2
Nov-
02
Aug-0
3
May
-04
Feb-0
5
North Asia ASEAN India China
1990=100
0
100
200
300
400
500
600
700
800
1998 1999 2000 2001 2002 2003 2004 2005F
China Asia ex-Japan EMEA Latam%

12
(HK: s:\shared\investmentmanagement\accounts\tango\present\0509-ICCC.ppt
Credit upgrades as % of all changes -only Asia is collecting net credit upgrades
Asia’s average ROE vs COE - finally,a value-creating Asia
Clear improvement in recent two years: a sign of secular change?
Note: Data compiled using credit changes made by all the major global agencies. Note: Average Asia-wide ROEs and COEs are calculated using year-end neutral weights.
Post-Crisis TransformationA Value-Creating Asia
Source : HSBC (9/2005)
0
2
4
6
8
10
12
14
16
18
1992 1993 1994 1995 1996 1997 1998 1999 2000 2001 2002 2003 2004 2005
ROE COE
%
0
10
20
30
40
50
60
70
80
90
01/96 01/98 01/00 01/02 01/04
Asia ex-Japan World excluding Asia
13
(HK: s:\shared\investmentmanagement\accounts\tango\present\0509-ICCC.ppt
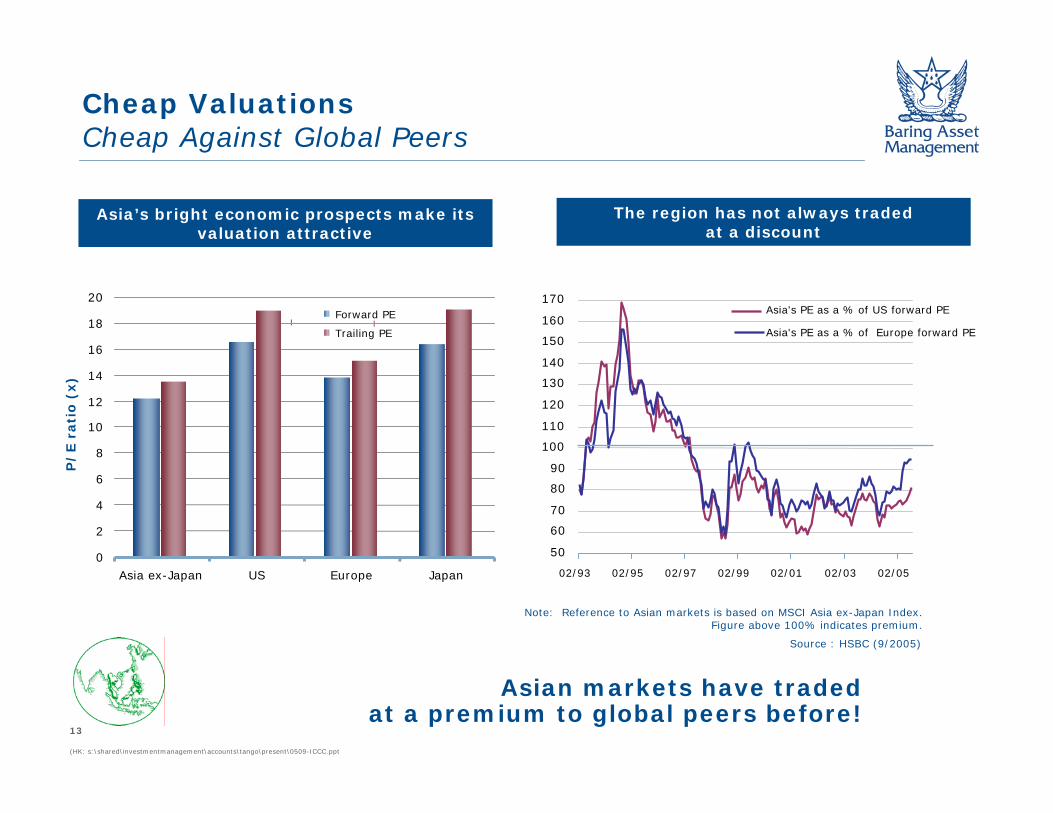
Asia’s bright economic prospects make its valuation attractive
The region has not always traded at a discount
Asian markets have tradedat a premium to global peers before!
Note: Reference to Asian markets is based on MSCI Asia ex-Japan Index.Figure above 100% indicates premium.
Cheap Valuations Cheap Against Global Peers
Source : HSBC (9/2005)
50
60
70
80
90
100
110
120
130
140
150
160
170
02/93 02/95 02/97 02/99 02/01 02/03 02/05
Asia's PE as a % of US forward PE
Asia's PE as a % of Europe forward PE
0
2
4
6
8
10
12
14
16
18
20
Asia ex-Japan US Europe Japan
P/
E r
ati
o (
x)
Forward PE
Trailing PE
14
(HK: s:\shared\investmentmanagement\accounts\tango\present\0509-ICCC.ppt
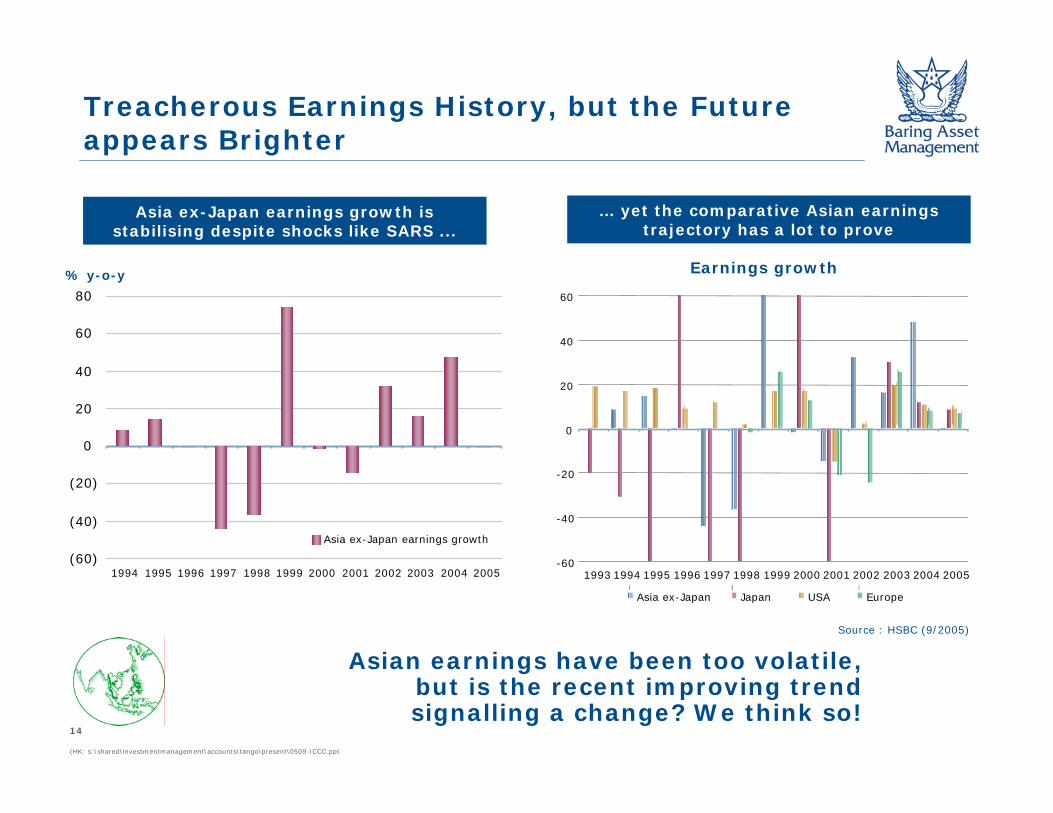
Asia ex-Japan earnings growth is stabilising despite shocks like SARS ...
… yet the comparative Asian earnings trajectory has a lot to prove
Asian earnings have been too volatile,but is the recent improving trendsignalling a change? We think so!
Treacherous Earnings History, but the Future appears Brighter
Source : HSBC (9/2005)
Earnings growth
-60
-40
-20
0
20
40
60
1993 1994 1995 1996 1997 1998 1999 2000 2001 2002 2003 2004 2005
Asia ex-Japan Japan USA Europe
(60)
(40)
(20)
0
20
40
60
80
1994 1995 1996 1997 1998 1999 2000 2001 2002 2003 2004 2005
Asia ex-Japan earnings growth
% y-o-y
15
(HK: s:\shared\investmentmanagement\accounts\tango\present\0509-ICCC.ppt
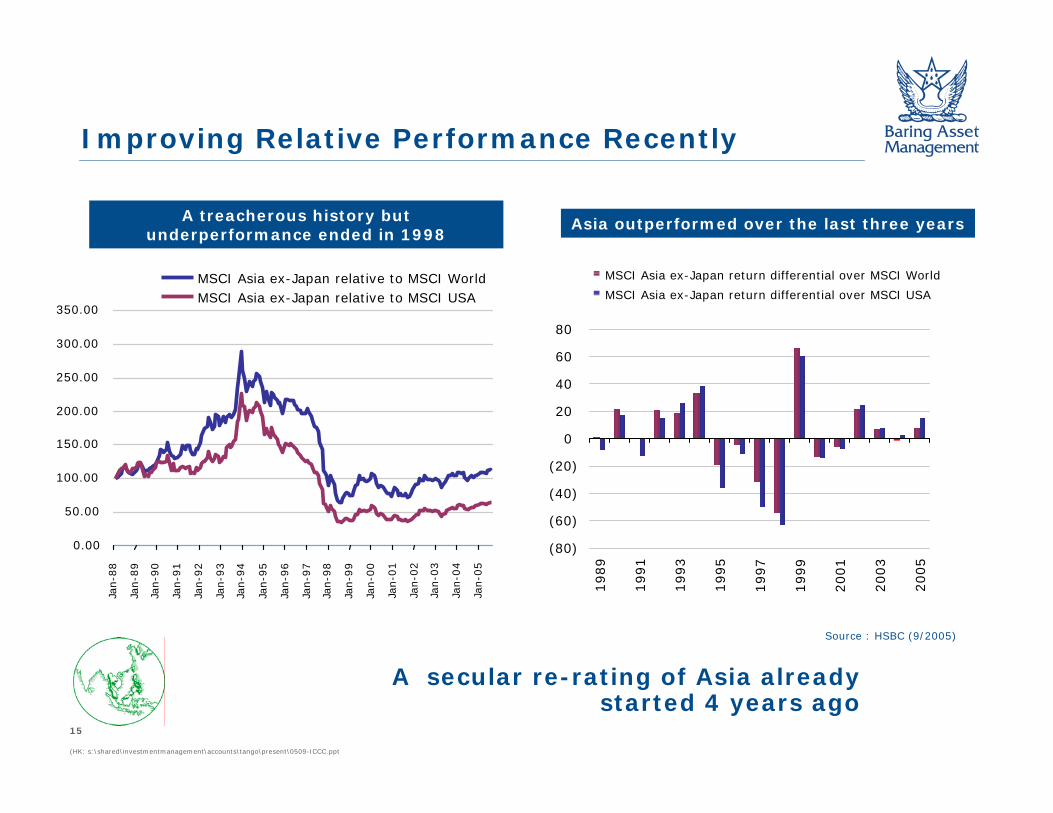
A treacherous history but underperformance ended in 1998
Asia outperformed over the last three years
A secular re-rating of Asia alreadystarted 4 years ago
Improving Relative Performance Recently
Source : HSBC (9/2005)
0.00
50.00
100.00
150.00
200.00
250.00
300.00
350.00
Jan-8
8
Jan-8
9
Jan-9
0
Jan-9
1
Jan-9
2
Jan-9
3
Jan-9
4
Jan-9
5
Jan-9
6
Jan-9
7
Jan-9
8
Jan-9
9
Jan-0
0
Jan-0
1
Jan-0
2
Jan-0
3
Jan-0
4
Jan-0
5
MSCI Asia ex-Japan relative to MSCI WorldMSCI Asia ex-Japan relative to MSCI USA
MSCI Asia ex-Japan return differential over MSCI World
MSCI Asia ex-Japan return differential over MSCI USA
(80)
(60)
(40)
(20)
0
20
40
60
80
1989
1991
1993
1995
1997
1999
2001
2003
2005

16
(HK: s:\shared\investmentmanagement\accounts\tango\present\0509-ICCC.ppt
Global investors remain massively under-invested in the region -
as evidenced by neutral weights
Domestic investors still hold a lot in low-yielding deposits
Ample room for re-rating if local and global investorsthink that earnings growth is sustainable
Under-ownedCompared to Its Economic Size
Source : HSBC (9/2005)
Share of world GDP (in PPP)
Share of world GDP (in USD bn)
Weight in MSCI AC World index
0
50
100
150
200
250
CN TW ID KR IN MY PH HK SG TH
%Market capitalisation to deposits
05
101520253035404550
Asia ex-Japan United States European Union Japan Others
Asia – The Short-Term View
18
(HK: s:\shared\investmentmanagement\accounts\tango\present\0509-ICCC.ppt
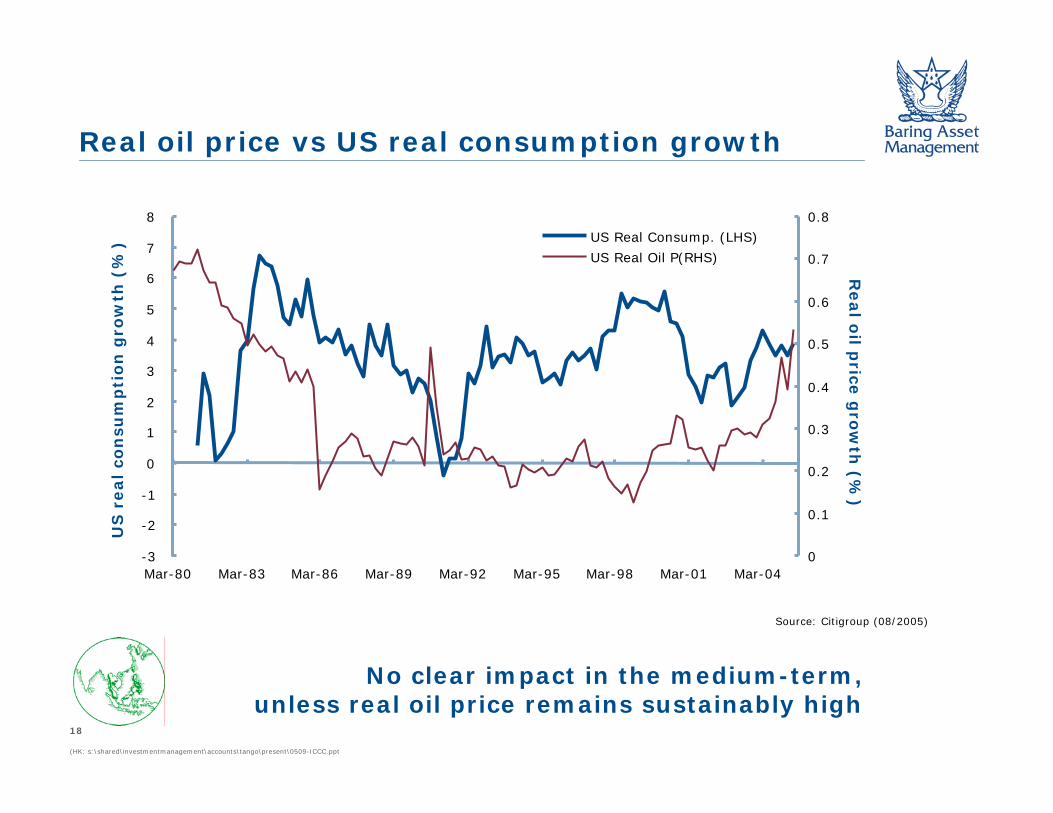
Real oil price vs US real consumption growth
No clear impact in the medium-term,unless real oil price remains sustainably high
Source: Citigroup (08/2005)
-3
-2
-1
0
1
2
3
4
5
6
7
8
Mar-80 Mar-83 Mar-86 Mar-89 Mar-92 Mar-95 Mar-98 Mar-01 Mar-040
0.1
0.2
0.3
0.4
0.5
0.6
0.7
0.8
US Real Consump. (LHS)
US Real Oil P(RHS)
US
real
con
sum
pti
on
gro
wth
(%
)
Real o
il price
gro
wth
(%)
19
(HK: s:\shared\investmentmanagement\accounts\tango\present\0509-ICCC.ppt
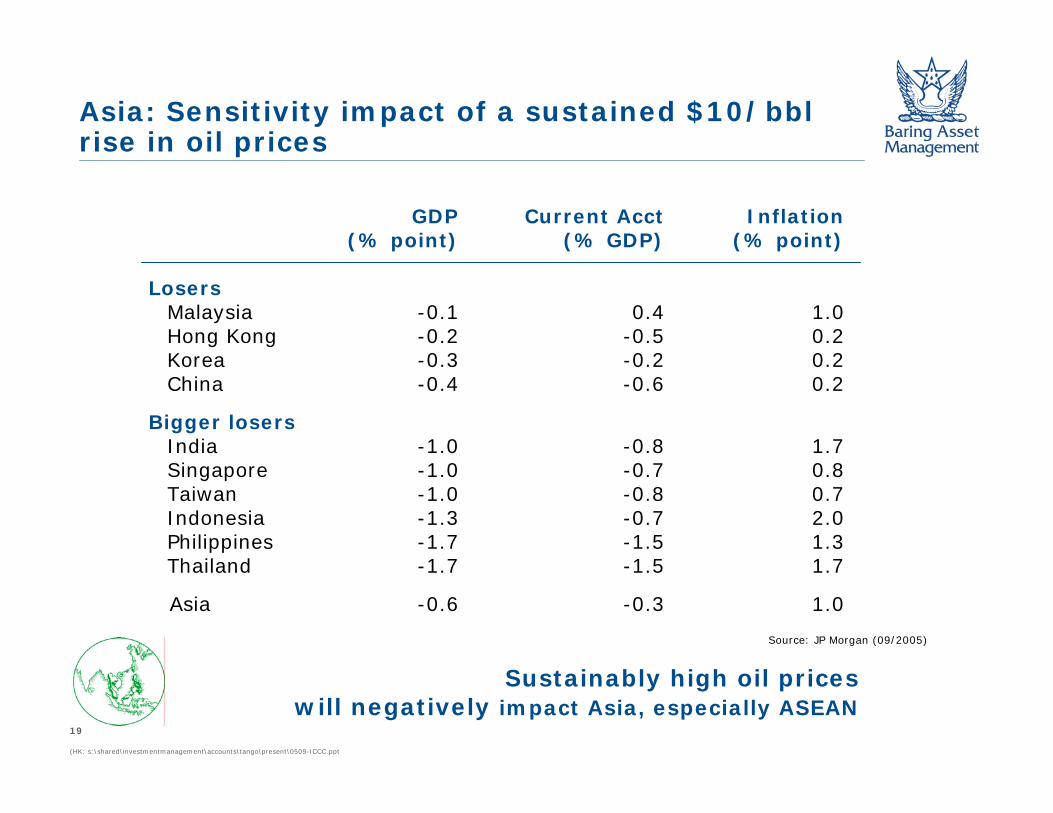
Asia: Sensitivity impact of a sustained $10/bbl rise in oil prices
GDP Current Acct Inflation(% point) (% GDP) (% point)
LosersMalaysia -0.1 0.4 1.0Hong Kong -0.2 -0.5 0.2Korea -0.3 -0.2 0.2China -0.4 -0.6 0.2
Bigger losersIndia -1.0 -0.8 1.7Singapore -1.0 -0.7 0.8Taiwan -1.0 -0.8 0.7Indonesia -1.3 -0.7 2.0Philippines -1.7 -1.5 1.3Thailand -1.7 -1.5 1.7
Asia -0.6 -0.3 1.0
Sustainably high oil priceswill negatively impact Asia, especially ASEAN
Source: JP Morgan (09/2005)
20
(HK: s:\shared\investmentmanagement\accounts\tango\present\0509-ICCC.ppt
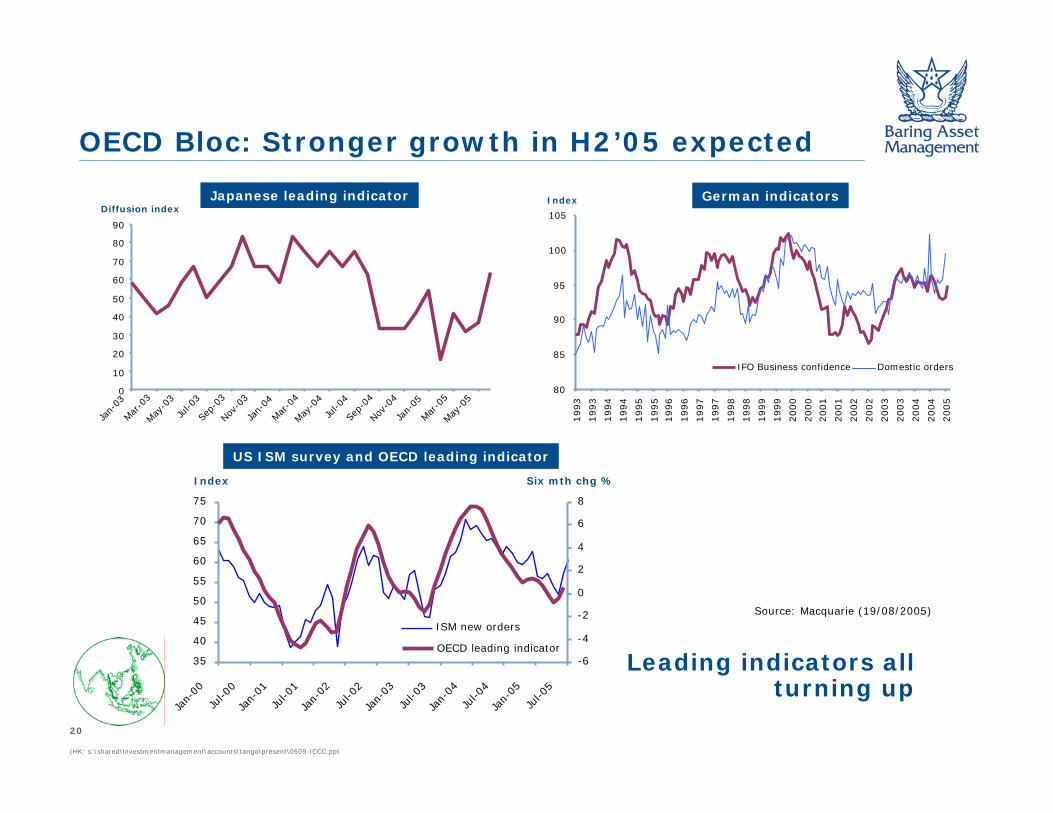
OECD Bloc: Stronger growth in H2’05 expected
German indicators
US ISM survey and OECD leading indicator
Japanese leading indicator
Source: Macquarie (19/08/2005)
Leading indicators all turning up
0
10
20
30
40
50
60
70
80
90
Jan-
03Mar
-03
May-0
3Ju
l-03
Sep-
03Nov
-03
Jan-
04Mar
-04
May-0
4Ju
l-04
Sep-
04Nov
-04
Jan-
05Mar
-05
May-0
5
Diffusion index
80
85
90
95
100
105
1993
1993
1994
1994
1995
1995
1996
1996
1997
1997
1998
1998
1999
1999
2000
2000
2001
2001
2002
2002
2003
2003
2004
2004
2005
IFO Business confidence Domestic orders
Index
35
40
45
50
55
60
65
70
75
Jan-
00Ju
l-00
Jan-
01Ju
l-01
Jan-
02Ju
l-02
Jan-
03Ju
l-03
Jan-
04Ju
l-04
Jan-
05Ju
l-05
-6
-4
-2
0
2
4
6
8
ISM new orders
OECD leading indicator
Index Six mth chg %
21
(HK: s:\shared\investmentmanagement\accounts\tango\present\0509-ICCC.ppt
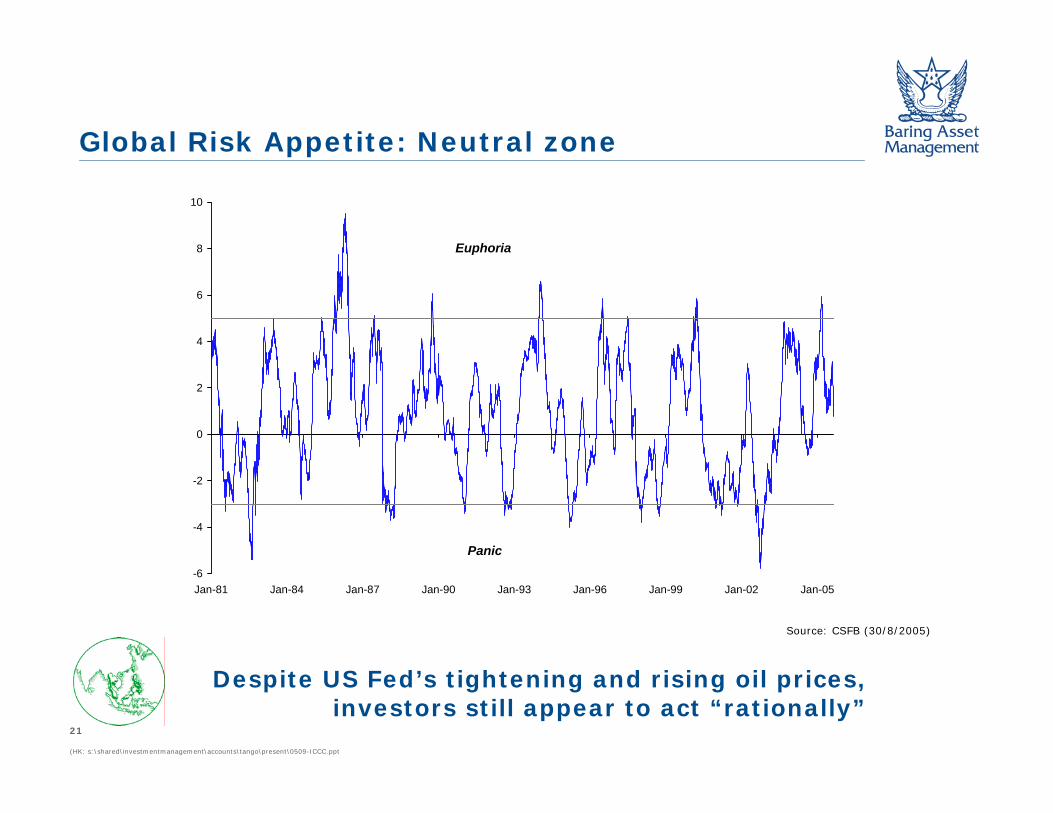
Global Risk Appetite: Neutral zone
Despite US Fed’s tightening and rising oil prices, investors still appear to act “rationally”
Source: CSFB (30/8/2005)
-6
-4
-2
0
2
4
6
8
10
Jan-81 Jan-84 Jan-87 Jan-90 Jan-93 Jan-96 Jan-99 Jan-02 Jan-05
Euphoria
Panic
22
(HK: s:\shared\investmentmanagement\accounts\tango\present\0509-ICCC.ppt
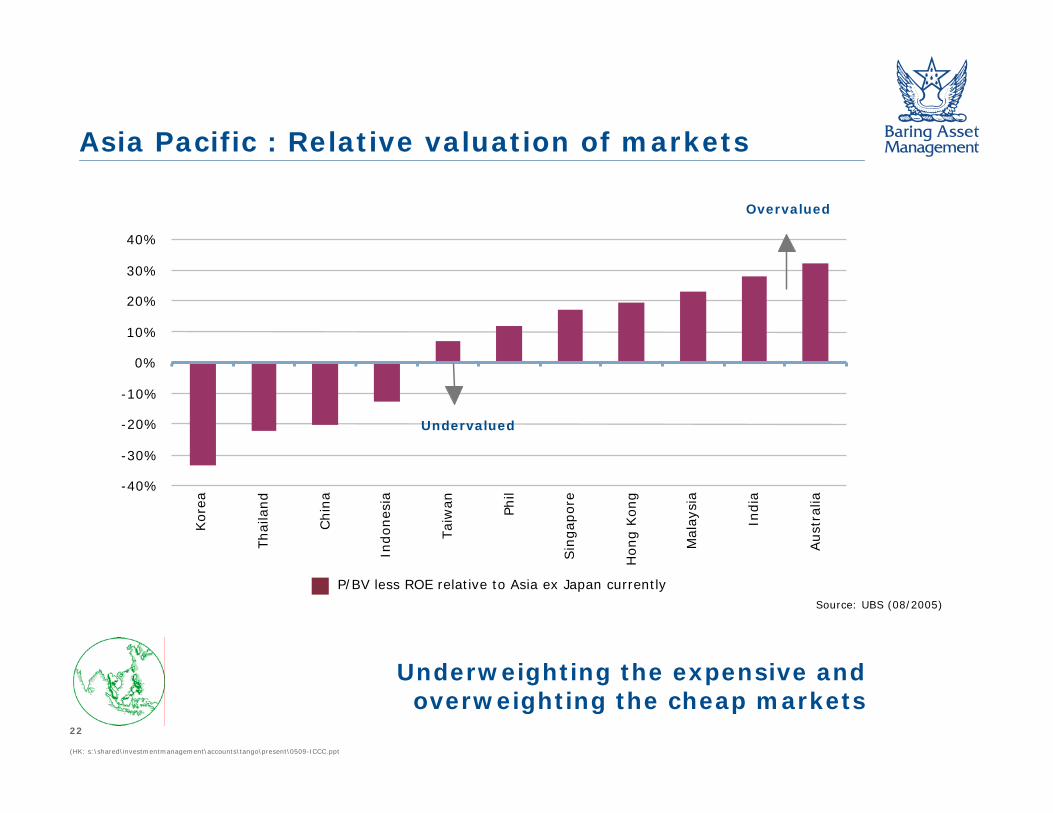
Asia Pacific : Relative valuation of markets
Underweighting the expensive and overweighting the cheap markets
Source: UBS (08/2005)
-40%
-30%
-20%
-10%
0%
10%
20%
30%
40%
Kore
a
Thai
land
Chin
a
Indones
ia
Tai
wan Phil
Sin
gap
ore
Hong K
ong
Mal
aysi
a
India
Aust
ralia
Undervalued
Overvalued
P/BV less ROE relative to Asia ex Japan currently
23
(HK: s:\shared\investmentmanagement\accounts\tango\present\0509-ICCC.ppt
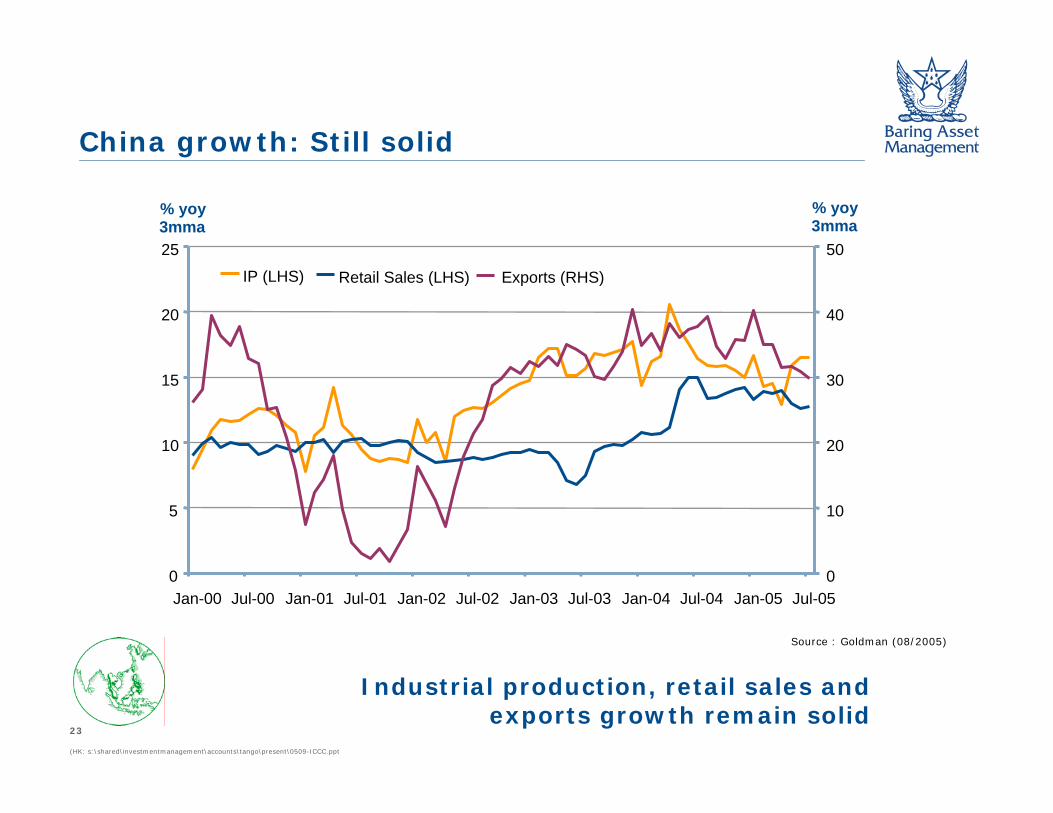
China growth: Still solid
Source : Goldman (08/2005)
Industrial production, retail sales and exports growth remain solid
0
5
10
15
20
25
Jan-00 Jul-00 Jan-01 Jul-01 Jan-02 Jul-02 Jan-03 Jul-03 Jan-04 Jul-04 Jan-05 Jul-050
10
20
30
40
50
IP (LHS) Retail Sales (LHS) Exports (RHS)
% yoy3mma
% yoy3mma
24
(HK: s:\shared\investmentmanagement\accounts\tango\present\0509-ICCC.ppt
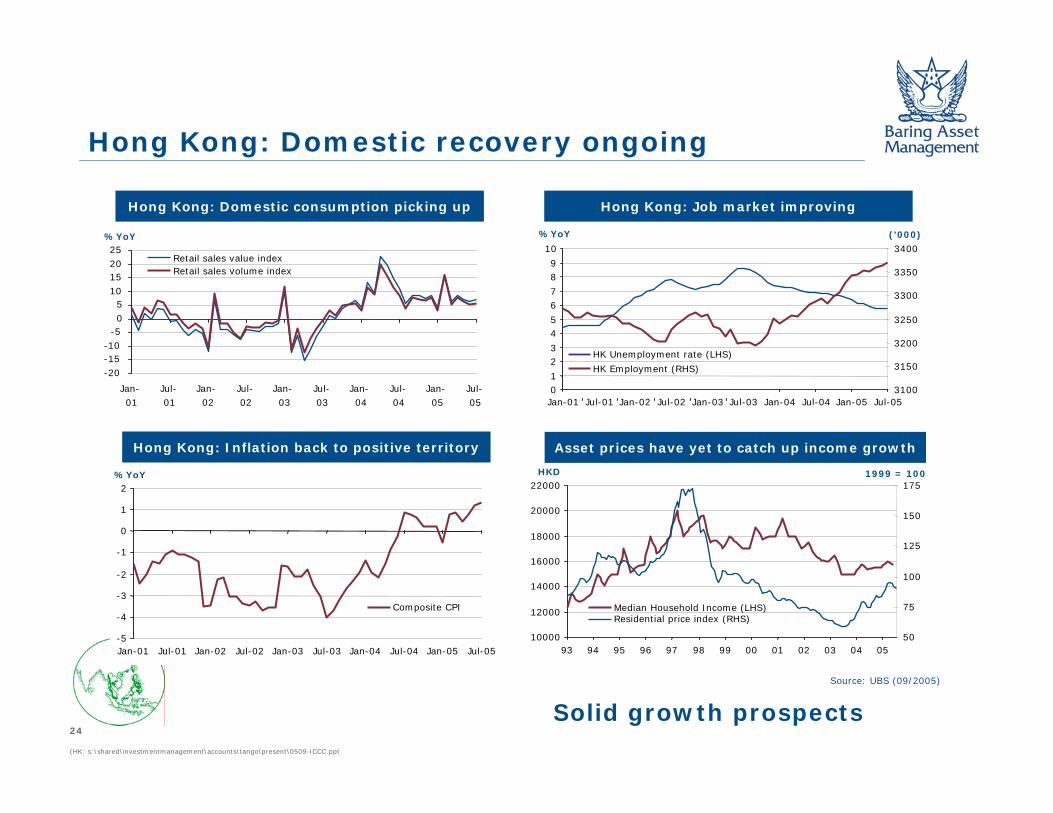
Hong Kong: Domestic recovery ongoing
Hong Kong: Domestic consumption picking up Hong Kong: Job market improving
Hong Kong: Inflation back to positive territory Asset prices have yet to catch up income growth
Source: UBS (09/2005)
-20-15-10
-505
10152025
Jan-01
Jul-01
Jan-02
Jul-02
Jan-03
Jul-03
Jan-04
Jul-04
Jan-05
Jul-05
Retail sales value indexRetail sales volume index
%YoY
01
23
45
67
89
10
Jan-01 Jul-01 Jan-02 Jul-02 Jan-03 Jul-03 Jan-04 Jul-04 Jan-05 Jul-053100
3150
3200
3250
3300
3350
3400
HK Unemployment rate (LHS)
HK Employment (RHS)
%YoY ('000)
10000
12000
14000
16000
18000
20000
22000
93 94 95 96 97 98 99 00 01 02 03 04 0550
75
100
125
150
175
Median Household Income (LHS)Residential price index (RHS)
HKD 1999 = 100
-5
-4
-3
-2
-1
0
1
2
Jan-01 Jul-01 Jan-02 Jul-02 Jan-03 Jul-03 Jan-04 Jul-04 Jan-05 Jul-05
Composite CPI
%YoY
Solid growth prospects

25
(HK: s:\shared\investmentmanagement\accounts\tango\present\0509-ICCC.ppt
Hong Kong: Property stocks to benefit from Reflation
Source: MSDW (9/2005)
-70%
-60%
-50%
-40%
-30%
-20%
-10%
0%
10%
20%
0591 92 93 94 95 96 97 98 99 00 01 02 03 04
Property Investors Property Developers
Discount
Premium
Sep 11Asian
Financial Crisis
Maximum bullish 1993
Peak of bull market
Fed massive interest rate
easing
SARS
Mexican Crisis
China's austerity
NAV expansion
Premium/Discount to Net Asset Value
More upside in property stocks
26
(HK: s:\shared\investmentmanagement\accounts\tango\present\0509-ICCC.ppt
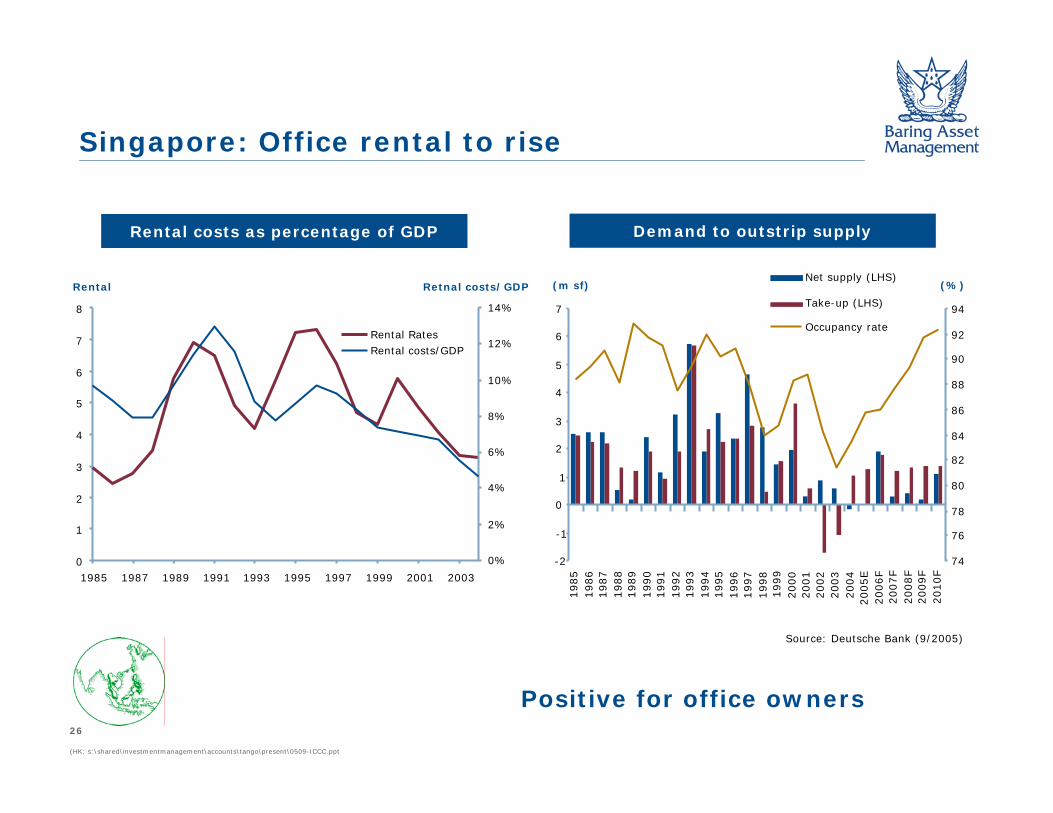
Singapore: Office rental to rise
Positive for office owners
Source: Deutsche Bank (9/2005)
0
1
2
3
4
5
6
7
8
1985 1987 1989 1991 1993 1995 1997 1999 2001 2003
0%
2%
4%
6%
8%
10%
12%
14%
Rental RatesRental costs/GDP
Rental Retnal costs/GDP
-2
-1
1
0
2
3
4
5
6
7
1985
1986
1987
1988
1989
1990
1991
1992
1993
1994
1995
1996
1997
1998
1999
2000
2001
2002
2003
2004
2005E
2006F
2007F
2008F
2009F
2010F
74
76
78
80
82
84
86
88
90
92
94
Net supply (LHS)
Take-up (LHS)
Occupancy rate
(m sf) (%)
Rental costs as percentage of GDP Demand to outstrip supply

27
(HK: s:\shared\investmentmanagement\accounts\tango\present\0509-ICCC.ppt
Taiwan: Undiscounted reflation story
Sinyi Housing Price index Transaction volume index- Taiwan
Cross-strait relation improvements provide trigger for Taiwan re-rating
Source: J P Morgan (9/2005)
60
70
80
90
100
110
120
130
140
3Q91
2Q92
1Q93
4Q93
3Q94
2Q95
1Q96
4Q96
3Q97
2Q98
1Q99
4Q99
3Q00
2Q01
1Q02
4Q02
3Q03
2Q04
1Q05
Taipei City Taichung Kaoshiung Taiwan
0
200
400
600
800
1000
1200
1400
1Q96
3Q96
1Q97
3Q97
1Q98
3Q98
1Q99
3Q99
1Q00
3Q00
1Q01
3Q01
1Q02
3Q02
1Q03
3Q03
1Q04
3Q04
1Q05
80
85
90
95
100
105
110
115
120Cathay 30-day Transaction Volume Index- LHS
Cathay Housing Price Index- RHS

28
(HK: s:\shared\investmentmanagement\accounts\tango\present\0509-ICCC.ppt
Asian Technology: Still offering value
Source: UBS (9/2005)
A forecast upturn in Asian Tech earningsin H2 ’05 will further boost the rally in Tech;
Taiwan is the major beneficiary
1.93X Oct 2.08XSep
1.9 Apr 03 2.2X
0
1
2
3
4
5
6
7
8
Jan-95 Jan-97 Jan-99 Jan-01 Jan-03 Jan-05
PB
V (
x)
0%
5%
10%
15%
20%
25%
30%
35%
40%
45%
RO
E (%
)
PB (RHS) ROE (LHS)
29
(HK: s:\shared\investmentmanagement\accounts\tango\present\0509-ICCC.ppt
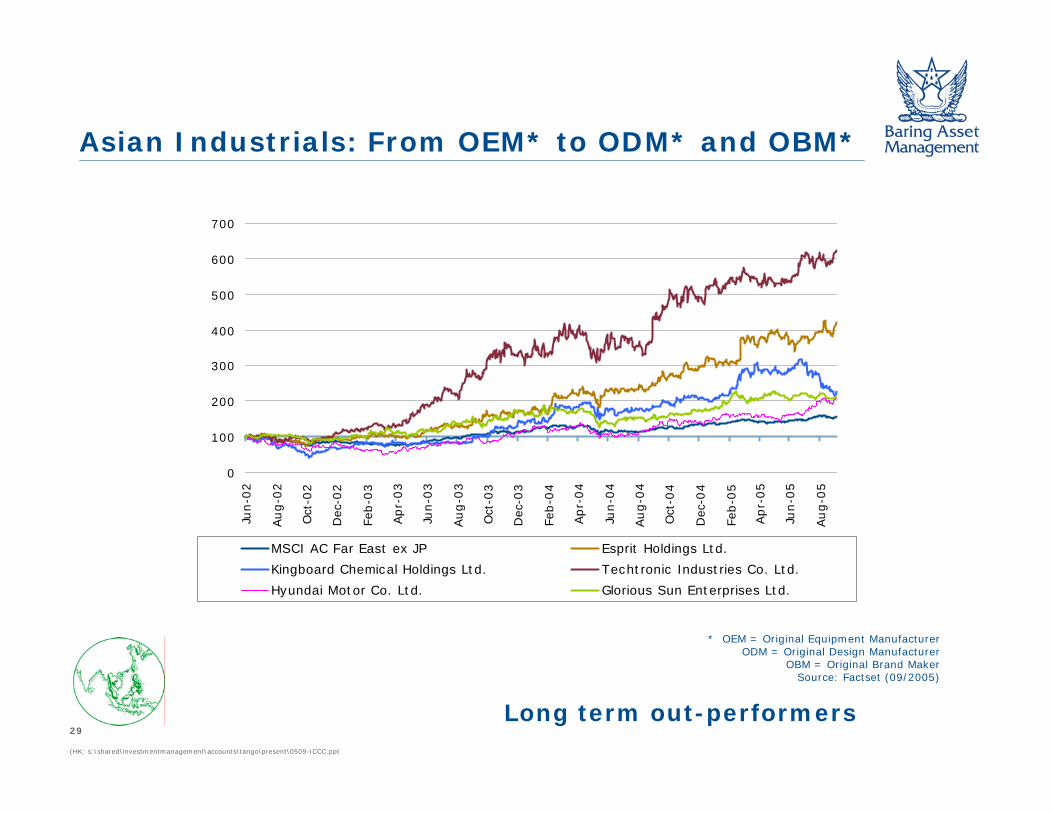
Asian Industrials: From OEM* to ODM* and OBM*
Long term out-performers
* OEM = Original Equipment ManufacturerODM = Original Design Manufacturer
OBM = Original Brand MakerSource: Factset (09/2005)
0
100
200
300
400
500
600
700
Jun-0
2
Aug-0
2
Oct
-02
Dec
-02
Feb-0
3
Apr-
03
Jun-0
3
Aug-0
3
Oct
-03
Dec
-03
Feb-0
4
Apr-
04
Jun-0
4
Aug-0
4
Oct
-04
Dec
-04
Feb-0
5
Apr-
05
Jun-0
5
Aug-0
5
MSCI AC Far East ex JP Esprit Holdings Ltd.
Kingboard Chemical Holdings Ltd. Techtronic Industries Co. Ltd.
Hyundai Motor Co. Ltd. Glorious Sun Enterprises Ltd.
30
(HK: s:\shared\investmentmanagement\accounts\tango\present\0509-ICCC.ppt
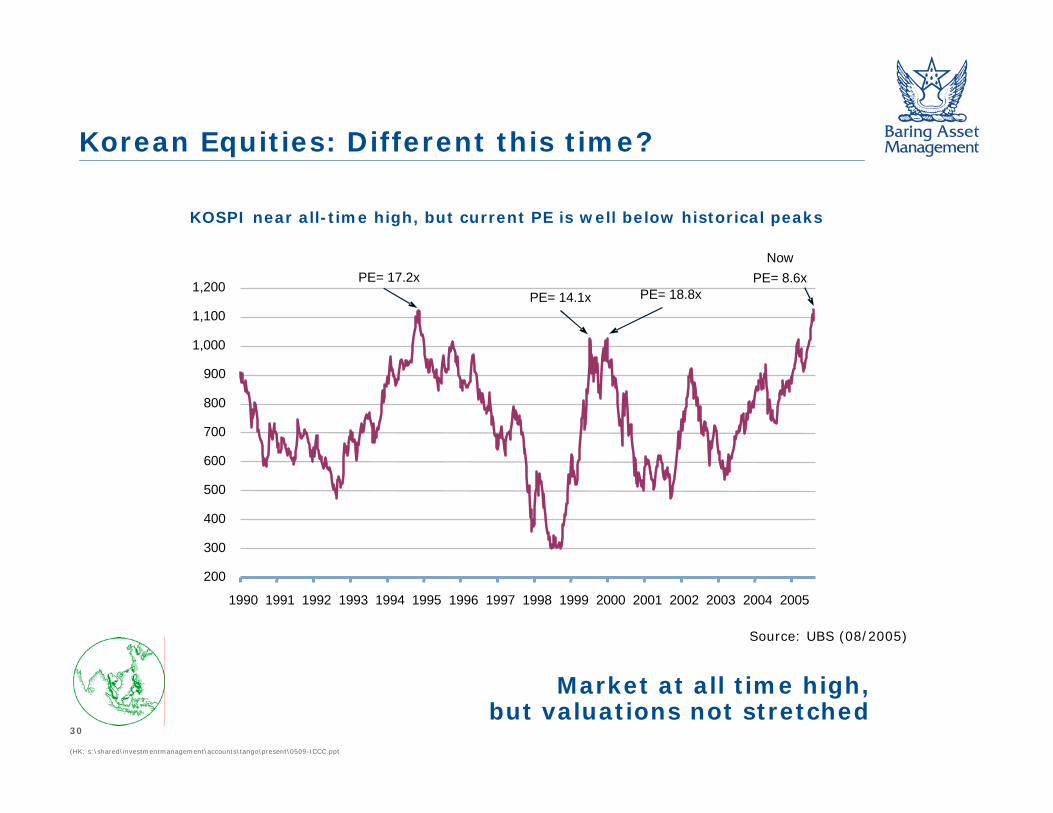
Korean Equities: Different this time?
KOSPI near all-time high, but current PE is well below historical peaks
200
300
400
500
600
700
800
900
1,000
1,100
1,200
1990 1991 1992 1993 1994 1995 1996 1997 1998 1999 2000 2001 2002 2003 2004 2005
PE= 17.2xPE= 14.1x PE= 18.8x
NowPE= 8.6x
Source: UBS (08/2005)
Market at all time high,but valuations not stretched
31
(HK: s:\shared\investmentmanagement\accounts\tango\present\0509-ICCC.ppt
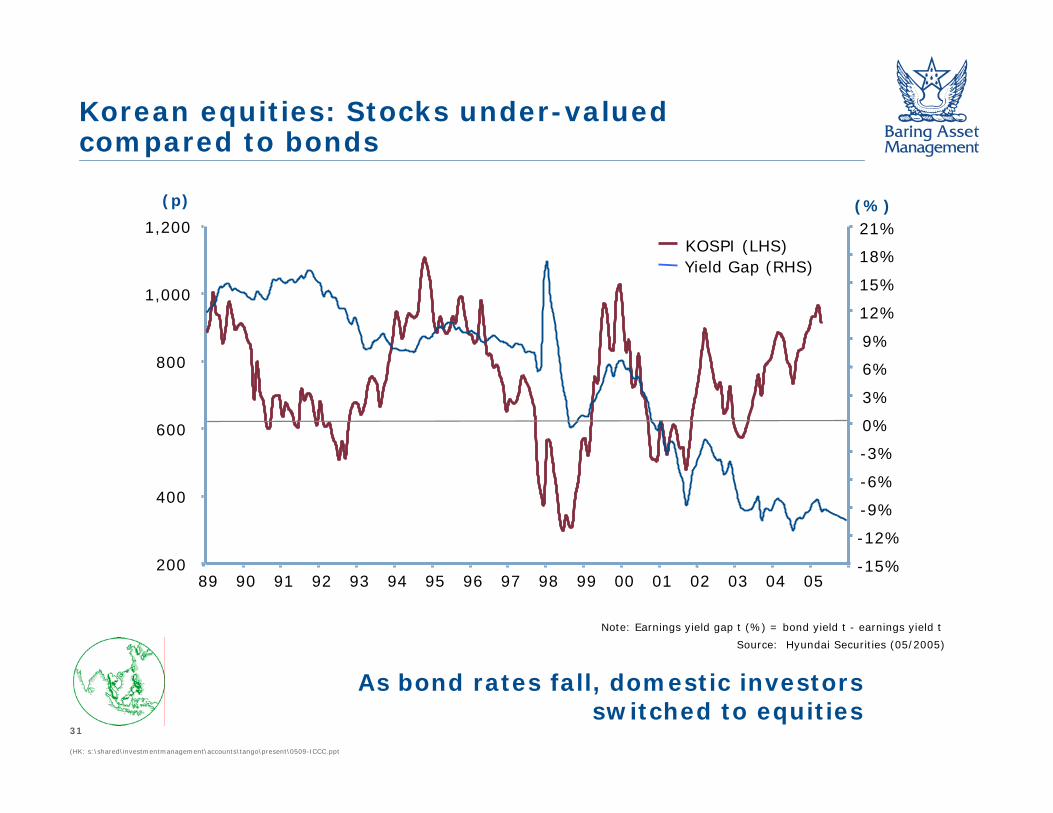
89 90 91 92 93 94 95 96 97 98 99 00 01 02 03 04 05
KOSPI (LHS)Yield Gap (RHS)
200
400
600
800
1,000
1,200
(p)
-15%
-12%
-9%
-6%
-3%
0%
3%
6%
9%
12%
15%
18%
21%(%)
Source: Hyundai Securities (05/2005)
Note: Earnings yield gap t (%) = bond yield t - earnings yield t
Korean equities: Stocks under-valued compared to bonds
As bond rates fall, domestic investorsswitched to equities

32
(HK: s:\shared\investmentmanagement\accounts\tango\present\0509-ICCC.ppt
Korean Liquidity surprise: Strong domestic fund flows
Monthly net inflow into equity fund Monthly net inflow into equity fund
7,000
8,000
9,000
10,000
11,000
12,000
13,000
14,000
Jan-0
4
Feb-0
4
Apr-
04
May
-04
Jun-0
4
Aug-0
4
Sep
t-04
Nov-
04
Dec
-04
Jan-0
5
Mar
-05
May
-05
(Won Bn)
Balance of Equity Funds
Source : UBS (08/2005)
Domestic participation isa necessary condition for market re-rating
-1,000-800-600
-400-200
0200
400600
8001,000
Jan-
04
Feb -
04
Mar
-04
Apr-04
May
-04
Jun -
04
Jul -0
4
Aug -
04
Sep
-04
Oct
-04
Nov-
04
Dec
- 04
Jan-
05
Feb-
05
Mar
- 05
Apr-05
May
- 05
Jun-
05
Jul -0
5
Aug -
05
Monthly Net inflow of Equity fund
(Won bn)
10 days Aug MTD
33
(HK: s:\shared\investmentmanagement\accounts\tango\present\0509-ICCC.ppt
Conclusions
Macro
Strong economic growth
Favourable demographics
Recovering domestic consumption
Undervalued currencies
Micro
Cheap stock market valuations
Re-rating
Asia is attractive from both a short-term andlong-term perspectives

Section 3:
Portfolio Strategy

35
(HK: s:\shared\investmentmanagement\accounts\tango\present\0509-ICCC.ppt
Risks
Markets’ volatility likely to remain
Oil prices: will they rise to and stay sustainably above US$70/bbl?
Will the US Federal Reserve continue to tighten past the 4% rate?
How severe is the lagged impact of high oil prices and Fed tightening on US and global growth in 2006?
36
(HK: s:\shared\investmentmanagement\accounts\tango\present\0509-ICCC.ppt
Concluding Remarks
Expect trend growth in the key economies of the US and China
Asian equities remain attractive
Strategy to focus on domestic reflation and selective industrials and technology names
Planning for a more defensive market environment in 2006

37
(HK: s:\shared\investmentmanagement\accounts\tango\present\0509-ICCC.ppt
Regulatory Disclosure
This document is provided as a service to professional investors/advisers. It is issued in the United Kingdom by Baring Asset Management Limited and/or by its investment adviser affiliates in other jurisdictions. The affiliate serving as the Asia Pacific Fund’s investment adviser is Baring Asset Management (Asia) Limited. In the United Kingdom this document is issued only to persons falling within a permitted category under (i) the FSA’s rules made under section 238(5) of the Financial Services and Markets Act 2000 and (ii) the Financial Services and Markets Act 2000 (Promotion of Collective Investment Schemes) (Exemptions) Order 2001.
This is not an offer nor a solicitation to buy or sell any investment referred to in this document. Baring Asset Management group companies, their affiliates and/or their directors, officers and employees may own or have positions in any investment mentioned herein or any investment related thereto and from time to time add to or dispose of any such investment. The contents of this document are based upon sources of information believed to be reliable but no guarantee, warranty or representation, express or implied, is given as to their accuracy or completeness. This document may include forward-looking statements, which are based upon our current opinions, expectations and projections as of the date on the cover hereof. We undertake no obligation to update or revise any forward-looking statements. Actual results could differ materially from those anticipated in the forward-looking statements. The value of any investments and any income generated may go down as well as up and is not guaranteed. Past performance will not necessarily be repeated. Changes in rates of exchange may have an adverse effect on the value, price or income of an investment. There are additional risks associated with investments (made directly or through investment vehicles which invest) in emerging or developing markets. Compensation arrangements under the Financial Services and Markets Act 2000 of the United Kingdom will not be available.
Private investors in the Company referred to herein should obtain their own independent financial advice before making investments. This document must not be relied on for purposes of any investment decisions. Before investing in the Company, we recommend that all relevant documents, such as reports and accounts and prospectus should be read, which specify the particular risks associated with investment in the Company, together with any specific restrictions applying and the basis of dealing. The Company may not be available for investment in all jurisdictions. There may also be prohibitions or restrictions on distribution of this document and other material relating to the Company and accordingly recipients of any such documents are advised to inform themselves about and to observe any such restrictions.
Complied (Boston): September 15, 2005