investment management committee - texas documents/board... · the september 1213, 2013 meetings of...
TRANSCRIPT

INVESTMENT MANAGEMENT COMMITTEE
September 2013

Page Intentionally Left Blank

NOTE: The Board of Trustees (Board) of the Teacher Retirement System of Texas will not consider or act upon any item before the Investment Management Committee (Committee) at this meeting of the Committee. This meeting is not a regular meeting of the Board. However, because the full Investment Management Committee constitutes a quorum of the Board, the meeting of the Committee is also being posted as a meeting of the Board out of an abundance of caution.
TEACHER RETIREMENT SYSTEM OF TEXAS MEETING BOARD OF TRUSTEES
AND INVESTMENT MANAGEMENT COMMITTEE
(Committee Chair and Members are Subject to Change at the September Board
Meeting―Mr. Barth, Committee Chair; Mr. Colonnetta; Mr. Kelly; Mr. McDonald; & Ms. Sissney, Committee Members)
AGENDA
September 12, 2013 – 8:30 a.m. TRS East Building, 5th Floor, Boardroom
The September 12-13, 2013 meetings of the TRS Board of Trustees and Investment Management Committee will be held by telephone conference call as authorized under Texas Government Code Section 551.130. The Board and Investment Management Committee intend to have quorums physically present at 1000 Red River Austin, Texas 78701 in the TRS East Building, 5th Floor, Boardroom.
1. Consider the approval of the proposed minutes of the June 13, 2013 committee meeting – Committee Chair.
2. Review of the External Public Markets Portfolio – Dale West.
3. Receive a presentation on the five year anniversary of the Public Markets Strategic Partnership Network (SPN) – David Veal.
4. Discuss the process for developing new internal portfolios – Mohan Balachandran.
5. Discuss risk parity – James Nield.

Page Intentionally Left Blank

Tab 1Tab 1

ThiThis page intentionally leftintentionally left
blank.

Minutes of the Investment Management Committee
June 13, 2013
The Investment Management Committee of the Board of Trustees of the Teacher Retirement System of Texas met on June 13, 2013 in the boardroom located on the Fifth Floor of the TRS East Building offices at 1000 Red River Street, Austin, Texas. The following committee members were present: Todd Barth, Chair David Kelly Eric McDonald Nanette Sissney
A quorum of the committee was present. Others present: Karen Charleston, TRS Trustee Hugh Ohn, TRS Charlotte Clifton, TRS Trustee John Ritter, TRS Chris Moss, TRS Trustee Molly Rose, TRS Anita Palmer, TRS Trustee Noel Sherman, TRS Brian Guthrie, TRS Sharon Toalson, TRS Britt Harris, TRS David Veal, TRS Ken Welch, TRS Angela Vogeli, TRS Mark Albert, TRS Susan Wade, TRS Jerry Albright, TRS Dr. Keith Brown, Investment Advisor Thomas Albright, TRS Steven Huff, Fiduciary Counsel Jase Auby, TRS Steve Voss, Hewitt EnnisKnupp Mohan Balachandran, TRS Brady O’Connell, Hewitt EnnisKnupp Amy Barrett, TRS Ronnie Jung, Texas Retired Teachers Association Sylvia Bell, TRS Tim Lee, Texas Retired Teachers Association Vaughn Brock, TRS Ann Fickel, Texas Classroom Teachers Association Chi Chai, TRS Meredyth Fouler, Office of Speaker Straus David DeStefano, TRS Juan V. Garcia, Office of the Governor Dennis Gold, TRS Dan Pickering, Tudor, Pickering, Holt & Co. Brian Gomolski, TRS Sam Oh, Apollo Rich Hall, TRS Josh Harris, Apollo Caroline Hansard, TRS Jeremy Bergman, Apollo Malorie Harding, TRS Nick Ballard, Pension Review Board Dan Herron, TRS Alan Bunsen, Bridgewater Dan Junell, TRS Jim Bauer, UniteHere Eric Lang, TRS Mark Schafer, State Street Lynn Lau, TRS Jeff Lambert, State Street Scot Leith, TRS Craig teDuits, State Street Jaime Llano, TRS Paul Yett, Hamilton Lane Denise Lopez, TRS Bryan Ryland, Hamilton Lane Shayne McGuire TRS Mr. Barth called the meeting to order at 8:45 a.m.
1. Consider the approval of the proposed minutes of the April 18, 2013 committee meeting – Todd Barth.
On a motion by Mr. McDonald, seconded by Mr. Kelly, the committee approved the minutes of the April 18, 2013 meeting as presented.

June 13, 2013 Investment Management Committee Minutes, Page 2 of 4
2. Receive an update and review of Private Equity – Rich Hall. Mr. Hall provided an update on the Private Equity Portfolio. As of December 31, 2012, he said, the portfolio outperformed the State Street Private Equity Index over the one-year, three-year, and 10-year periods, and ranked number one in the peer group over the 10-year period. He stated that private equities diversified the trust and generated stronger-than-expected returns with lower-than-expected risk. Based on the study completed by Hamilton Lane, he stated, the portfolio had generated $3.9 billion more than if the fund were invested in the public markets of the MSCI All Country World Index. Mr. Hall described the private equity team structure and introduced the team members. He also explained the investment process and long-term funding plan of the portfolio. Per Mr. Barth’s request, he explained the process of incorporating the strategic partnership network into the long-term capital plan and funding model of the portfolio. Mr. Hall presented information for the five-year period ending December 31, 2012 about the asset growth, allocation and returns of the Private Equity Portfolio. Responding to a question from Mr. McDonald, he stated that private equity exposure could be reduced, if needed, by selling in a secondary market. Per Mr. Barth’s request, Mr. Hall explained the private equity benchmark, the State Street Private Equity Index. He noted that the drawback of the benchmark as a performance measurement tool was that the portfolio was not as mature as the index, which caused a mismatch between the portfolio and the benchmark. Dr. Brown, Mr. Hall, Mr. Harris and Mr. Kelly discussed the potential for a liquidity premium to be paid in connection with TRS' private equity investments. Mr. Hall concluded his presentation with an overview of the accomplishments and priorities of the Private Equity Portfolio and the market conditions affecting it.
3. Receive an update and review of Real Assets – Eric Lang. Mr. Lang provided an update on the Real Assets Portfolio. As of December 31, 2012, he said, the portfolio outperformed the benchmark over the one-year and three-year periods and ranked in the top quartile for the one-year period and second quartile for the three-year period. He noted that the portfolio had grown from $2 billion to $14 billion in five years. He stated that real assets provided a partial hedge during reflationary times and typically would not perform well during disinflationary periods. Mr. Lang described the team structure and introduced the team members. He also explained in detail the portfolio structure and investment process. He elaborated on the growth of the portfolio and charted historical returns since the inception of the portfolio in 2006. He summarized the accomplishments of the portfolio in 2012 and its priorities for 2013. He reviewed market conditions, general partner activity, and collaboration with the strategic partnership network. He also discussed principal and other investments in energy and natural resources.

June 13, 2013 Investment Management Committee Minutes, Page 3 of 4
4. Introduction of Energy and Natural Resources Investment Initiative, including the following:
A. Discussion of opportunities and risks associated with investing in energy and
natural resources – Sam Oh, Apollo Investment Corporation and Dan Pickering, Tudor, Pickering, Holt & Co.
Mr. Harris reviewed the pros and cons of investing in energy and natural resources (ENR). Mr. Pickering and Mr. Oh detailed their projections on the future of ENR investments. Mr. Pickering and Mr. Oh discussed the prospects of ENR investments with trustees and answered their questions. After a brief recess at 11:14 a.m., the committee reconvened at 11:27 a.m.
B. Risk review of proposed Energy and Natural Resources strategy – Jase Auby.
Mr. Auby described the proposed ENR strategy and asset allocation. He explained that the proposed new 3% policy allocation to ENR could be made by transferring 1% from the current allocation to private equity and 2% from real assets. He stated that the proposed ENR allocation was intended to improve the trust performance in an inflationary environment. He said that the proposal anticipated increasing the policy allocation to ENR to 5% over time, possibly in 2014. He described a proposed new benchmark for the ENR portfolio. Dr. Brown, Mr. Auby, Mr. Barth, and Mr. Kelly discussed the nature of and rationale for the proposed separate allocation and benchmark for ENR. Mr. Auby stated that the proposed policy changes concerning ENR would be considered by the board in October.
Mr. Barth asked Dr. Brown and Mr. Voss and Mr. O’Connell of Hewitt EnnisKnupp to consider alternatives for implementing an ENR strategy and to report to the board.
C. Energy and Natural Resources Strategic Plan – Vaughn Brock.
Mr. Brock reviewed the ENR strategic plan. He stated that the purpose of establishing the ENR Portfolio was to consolidate investments devoted to energy and natural resources and to assign a team to manage them. He defined energy and natural resources and laid out the timeline of implementation. Presenting current ENR investments across the trust, he stated that TRS had invested about $9.8 billion in public equity, $1.7 billion in private equity, $2.1 in real assets, and $700 million in gold and precious metals, which totaled about $14.2 billion or 12% of the trust. He presented the historical growths and current allocation in different types of ENR investments as of March 31, 2013. He introduced the ENR team members and described the ENR portfolio’s external relationships. He also presented the investment plan, outlook and opportunities for energy markets. Describing the optimal capital structure, he noted that the advantages of having overriding royalty interests. He stated that the ENR asset allocation was based on inflation sensitivity and projected returns. He noted that the target return would increase to about 16% from the current 14.2% after a reallocation from the gold fund to the higher return zones.

June 13, 2013 Investment Management Committee Minutes, Page 4 of 4
In conclusion, Mr. Brock described the investment plan and updated the committee on its implementation.
The meeting adjourned at 12:50 p.m.

Tab 2Tab 2

ThiThis page intentionally leftintentionally left
blank.

External Public Markets
Dale West Managing Director September 2013

2
Agenda
1. Performance and Investment Summary
2. Update on 2012 Priorities
3. External Public Markets Team and Processes
4. Long-Oriented Global Equity Update and Manager Case Study
5. Hedge Fund Update
6. 2013 Priorities

3
30, 2012
131.1% includes fund-based investments, including hedge funds. Agency agreements remain below 30% legislative mandate. Source: State Street Bank Note: Performance is annualized and net of fees
E X T E R N A L P U B L I C M A R K E T S Total Assets ($ millions) Percent of Trust 1-Year Return 3-Year Return 1-Year Alpha 3-Year Alpha
$36,006 31.1%1 15.6% 10.0% 2.7% 1.0%
P E R F O R M A N C E
Program 1-Year Return 3-Year Return 1-Year Alpha 3-Year Alpha 1-Year TUCS Peer Quartile
3-Year TUCS Peer Quartile
US Large Cap 21.1% 18.0% 0.4% -0.5% 2nd 2nd
US Small Cap 24.0% 18.4% -1.9% -1.5% 3rd 2nd Non-US Developed 19.5% 8.8% 2.5% -0.6% 2nd 3rd Emerging Markets 5.8% 4.1% 2.9% 0.7% 2nd 3rd World Equity 20.8% 13.4% 4.2% 1.0% 2nd 2nd Total Hedge Funds 8.9% 4.5% 1.8% 1.0% Stable Value Hedge Funds 5.5% n/a -1.4% n/a Directional Hedge Funds 12.1% n/a 4.9% n/a Other Absolute Return 78.6% 27.1% 76.3% 24.7%
A S S E T S ( $ M I L L I O N S )
Program June 2012 Assets
Net Cash Flows
June 2013 Assets
June 2013 % of Trust
Long-Term Target % of Trust
External Managers $22,585 -$58 $26,443 22.8% 22.5% US Large Cap (10 managers) 7,135 -591 7,965 6.9% 6.2% US Small Cap (7 managers) 1,675 42 2,127 1.8% 1.6% Non-US Developed (7 managers) 4,063 773 5,761 5.0% 4.6% Emerging Markets (7 managers) 6,139 -307 6,250 5.4% 6.1% World Equity (4 managers) 3,573 24 4,340 3.7% 4.0% Hedge Funds $7,165 $1,563 $9,434 8.1% 9.0% Stable Value (15 funds) 3,862 220 4,293 3.7% 4.0% Directional (23 funds) 3,303 1,343 5,141 4.4% 5.0% Other Absolute Return (1) $1,270 -$1,387 $129 0.1% 0.0%
1. Executive Summary As of June 30, 2013

4
1. Investment Highlights
• Alpha goals achieved on a 1- and 3-year basis
• Six of eight portfolios generated positive 1-year alpha
• More than $750 million in added value over 12 months
• Strong hedge fund performance since October 2011 split
• Strong absolute and relative performance of Directional Hedge Funds
• Stable Value Hedge Funds portfolio fulfilling its diversification role
• Portfolio build-out substantially completed
• Long-oriented global equity and hedge fund portfolios are now in place

5
2. Update on 2012 Top Priorities
Source: State Street Bank Note: Performance is annualized and net of fees
2012 Goals Actual Explanation Generating alpha across all portfolios
• 1-year and 3-year alpha generated by Total External Public Markets program
• 1-year alpha achieved in 6 of 8 portfolios • 3-year alpha achieved in Emerging Markets, World
Equity, Hedge Funds and Dislocated Credit • 3-year alpha not achieved in US Large Cap, US
Small Cap and Non-US Developed
Providing diversification for the Trust with our Hedge Fund investments
• Directional and Stable Value hedge fund portfolios are providing diversifying return streams to the Trust
Continuing the integration and cooperation with other IMD teams
• Joint effort with Risk team on Risk Parity and Reinsurance strategies
• Two-way information sharing with IPM on managers in the Global Equity Portfolio
• $514 million invested in external Risk Parity Strategies • IIC approval of Reinsurance manager • Cooperating with Stable Value Team on emerging market bond
trade
Completing public markets Emerging Manager program
• Completed programs for long-oriented and hedge fund emerging managers
• Transferred to dedicated unit
Developing ability and structures to act opportunistically
• Several innovative structures with existing managers to optimize value-added to TRS
• Examples: • Opportunistic pre-commitment with fee discount • Conversion from main fund to customized account
As of June 30, 2013 1-Year Alpha 3-Year Alpha US Large Cap 0.4% -0.5% US Small Cap -1.9% -1.5% Non-US Developed 2.5% -0.6% Emerging Markets 2.9% 0.7% World Equity 4.2% 1.0% Total Hedge Funds 1.8% 1.0% Directional Hedge Funds 4.9% n/a Stable Value Hedge Funds -1.4% n/a Other Absolute Return 76.3% 24.7% Total External Public Markets 2.7% 1.0%
October 2011 - June 2013 Return Volatility
Directional HF Portfolio 8.6% 4.5% MSCI AC World Index 17.2% 13.7% Stable Value HF Portfolio 2.9% 2.6% Long-term US Treasuries -1.6% 11.6%
Public Markets Emerging Managers Firms Invested ($ millions) Long-Oriented Equity 7 $138 Hedge Funds 9 $99

6
INVESTMENTS TEAM
Dale West, CFA Managing Director MBA, Stanford
Susanne Gealy, CAIA Director, Global Equity MBA, University of Chicago
Brad Gilbert, CFA, CAIA Director, Hedge Funds BBA, UT Austin
Katy Hoffman Director MBA, Vanderbilt
Joel Hinkhouse, CFA Sr. Investment Manager MBA, University of Chicago
Lulu Llano, CFA Sr. Associate BBA, UT Austin
Steven Wilson Associate MBA, Rice
Rachel Clark Sr. Analyst BA, UT Austin
Mikhael Rawls Sr. Analyst AB, Harvard
Scott Gonsoulin Sr. Analyst MS, Texas A&M
Nick Croix Contract Analyst MS, UT Austin
ANALYTICS TEAM
Joe Tannehill, CFA Sr. Investment Manager MBA, UNC Chapel Hill
Kyle Schmidt Associate MBA, SMU
Patty Steinwedell Analyst BA, North Carolina State
Courtney Dunn Analyst BBA, UT San Antonio
RELATIONSHIP MANAGEMENT
Jon Klekman Analyst BA, SUNY Binghamton
3. External Public Markets Team
CONSULTANTS AND ADVISORS Albourne, Hewitt EnnisKnupp, Investcorp, Rock Creek Group
7
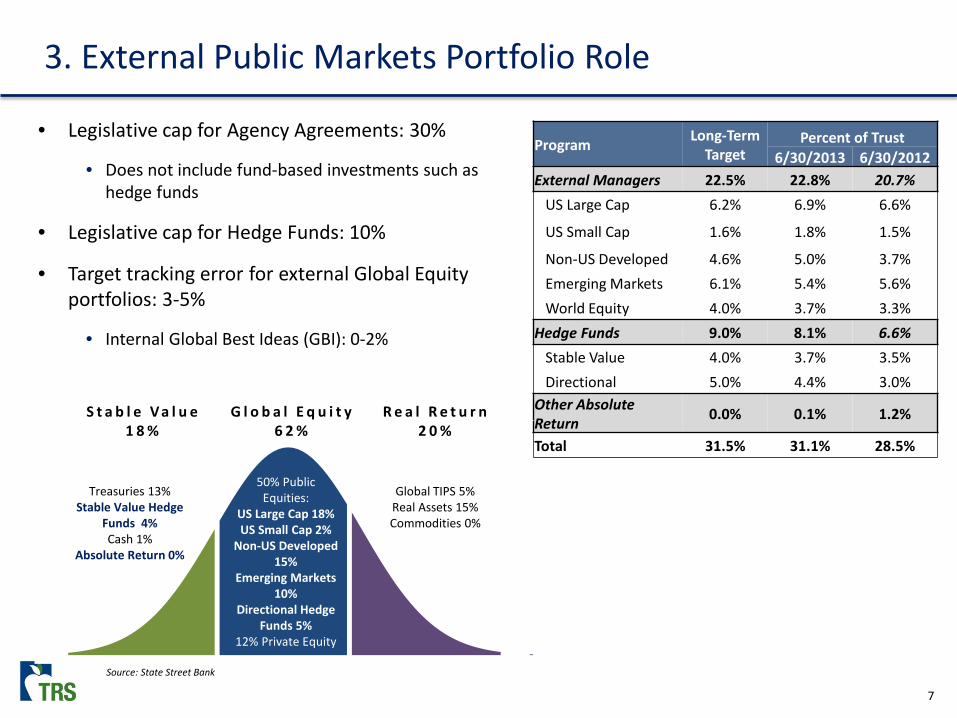
3. External Public Markets Portfolio Role
Source: State Street Bank
Program Long-Term Target
Percent of Trust 6/30/2013 6/30/2012
External Managers 22.5% 22.8% 20.7% US Large Cap 6.2% 6.9% 6.6%
US Small Cap 1.6% 1.8% 1.5%
Non-US Developed 4.6% 5.0% 3.7% Emerging Markets 6.1% 5.4% 5.6% World Equity 4.0% 3.7% 3.3% Hedge Funds 9.0% 8.1% 6.6% Stable Value 4.0% 3.7% 3.5% Directional 5.0% 4.4% 3.0% Other Absolute Return 0.0% 0.1% 1.2%
Total 31.5% 31.1% 28.5%
• Legislative cap for Agency Agreements: 30%
• Does not include fund-based investments such as hedge funds
• Legislative cap for Hedge Funds: 10%
• Target tracking error for external Global Equity portfolios: 3-5%
• Internal Global Best Ideas (GBI): 0-2%
S t a b l e V a l u e 1 8 %
G l o b a l E q u i t y 6 2 %
R e a l R e t u r n 2 0 %
Treasuries 13% Stable Value Hedge
Funds 4% Cash 1%
Absolute Return 0%
50% Public Equities:
US Large Cap 18% US Small Cap 2%
Non-US Developed 15%
Emerging Markets 10%
Directional Hedge Funds 5%
12% Private Equity
Global TIPS 5% Real Assets 15% Commodities 0%

8
3. Delegation Authority Detail As of June 30, 2013
• 23.6% of the 30% Agency Agreement authority is currently utilized
# of Portfolios Assets ($ billion) Percentage of Trust External Managers Agency LP Total Agency LP Total Agency LP Total US Large Cap 8 2 10 $6.7 $1.2 $7.9 5.8% 1.0% 6.8%
US Small Cap 4 3 7 $1.2 $0.9 $2.1 1.0% 0.8% 1.8%
Non-US Developed 4 3 7 $3.3 $2.2 $5.5 2.8% 1.9% 4.7%
Emerging Markets 6 1 7 $5.3 $0.9 $6.2 4.6% 0.8% 5.4%
World Equity 4 0 4 $4.3 $0.0 $4.3 3.7% 0.0% 3.7% Total Equity 26 9 35 $20.9 $5.2 $26.1 18.0% 4.5% 22.5% Other Absolute Return 0 1 1 $0.0 $0.1 $0.1 0.0% 0.1% 0.1% Public Market SPN 5 5 $6.0 $6.0 5.2% 5.2% Other 2 2 $0.4 $0.4 0.4% 0.4% Totals 33 10 43 $27.3 $5.3 $32.7 23.6% 4.6% 28.2%

9
Pre-IIC Negotiations
Manager fee negotiated
Near-final terms negotiated
IIC Review and Approval
Investments presented to
IIC for approval
External consultant provides prudence
letter
Additional requirements
met as needed
Final Legal Review
Finalize terms
Contracts signed
Funding Execution
Coordinate with Investment
Operations, Asset Allocation & Legal
Portfolio Monitoring
Monitor manager in key areas
Investigate alarms with Asset Allocation
Portfolio Management
Adjust portfolio to maintain optimal risk
Implement portfolio decisions
Reporting
Generate Board, IIC and policy reporting
Generate ad hoc reporting as needed
Strategic Planning
Review asset allocation
Evaluate Premier List needs
Premier List Development
Initial manager proposal
Perform minimum criteria analysis
Collaborative review by TRS, Hewitt EnnisKnupp
& Albourne
Add/reject proposed portfolio
Alignment Analysis (Legal & Compensation)
Preliminary review of legal terms
Preliminary review of financial terms
Certification Process
Onsite visit conducted
Receive/review consultant report
Evaluate 9 critical areas
Prepare certification report
Risk Analysis
Quantitative analysis
Review of current portfolio (characteristics
& valuations)
Develop optimized asset class structure
Final Fit Analysis
“Alpha Stacking” demonstrated
Determine initial and optimal investment size
3. External Public Critical Process Texas Way
10
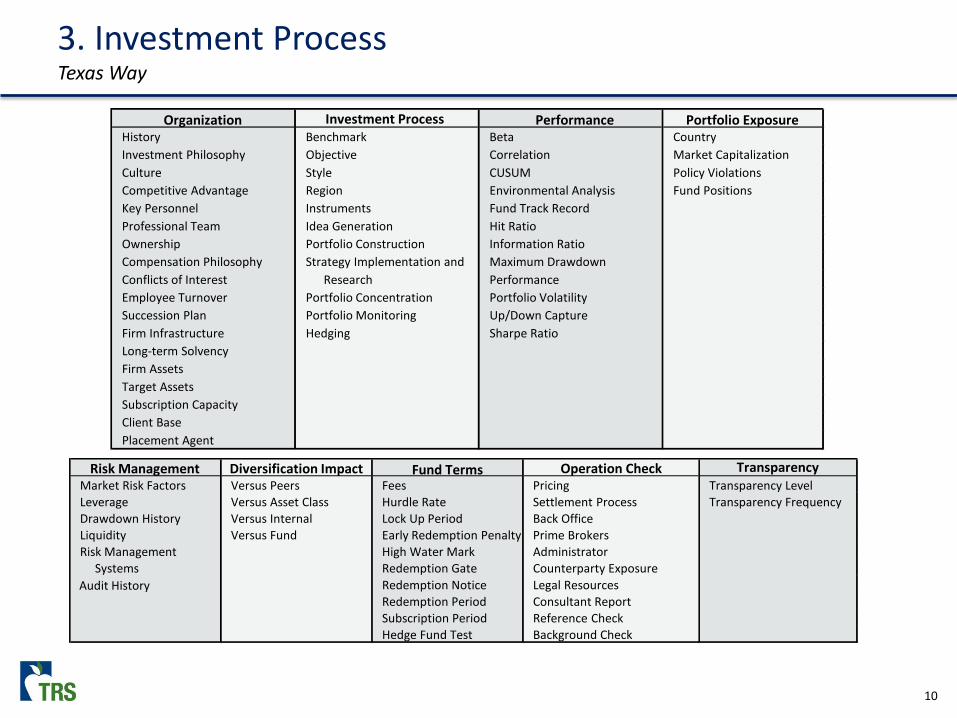
Investment Process Certification Parameters
Organization Investment Process Performance Portfolio Exposure History Benchmark Beta Country Investment Philosophy Objective Correlation Market Capitalization Culture Style CUSUM Policy Violations Competitive Advantage Region Environmental Analysis Fund Positions Key Personnel Instruments Fund Track Record Professional Team Idea Generation Hit Ratio Ownership Portfolio Construction Information Ratio Compensation Philosophy Strategy Implementation and Maximum Drawdown Conflicts of Interest Research Performance Employee Turnover Portfolio Concentration Portfolio Volatility Succession Plan Portfolio Monitoring Up/Down Capture Firm Infrastructure Hedging Sharpe Ratio Long-term Solvency Firm Assets Target Assets Subscription Capacity Client Base Placement Agent
Risk Management Diversification Impact Fund Terms Operation Check Transparency Market Risk Factors Versus Peers Fees Pricing Transparency Level Leverage Versus Asset Class Hurdle Rate Settlement Process Transparency Frequency Drawdown History Versus Internal Lock Up Period Back Office Liquidity Versus Fund Early Redemption Penalty Prime Brokers Risk Management High Water Mark Administrator Systems Redemption Gate Counterparty Exposure
Redemption Notice Legal Resources Redemption Period Consultant Report Subscription Period Reference Check Hedge Fund Test Background Check
3. Investment Process Texas Way
Audit History

11
4. Update on Long-Oriented Global Equity Portfolio
• Active management generated strong results in the year ending June 30, 2013
• $451 million in value added over passive alternatives
• Three new manager relationships
• Includes a China specialist manager in the Emerging Markets portfolio
• Two terminations
Long-Oriented Global Equity Portfolios As of 6/30/2013
Assets ($ millions)
Return (1 yr)
Alpha (1 yr)
US Large Cap $7,965 21.1% 0.4% MSCI USA 20.7% US Small Cap $2,127 24.0% -1.9% MSCI USA Small Cap 25.9% Non-US Developed $5,761 19.5% 2.5% MSCI EAFE + Canada 17.1% Emerging Markets $6,250 5.8% 2.9% MSCI Emerging Markets 2.9% World Equity $4,340 20.8% 4.2% MSCI AC World 16.6%
Source: State Street Bank Note: Performance is net of fees

12
4. Case Study: Sourcing a Value Manager
• World Equity Portfolio Fit
• Sourcing
• Wellington Capital Management
• Implementation

13
4. Case Study: World Equity Portfolio Fit
• The External Public Markets World Equity portfolio has a 3-year annualized alpha of 104 bps. However, it has underperformed its benchmark by 37 bps per month in strong environments for Value
• The World Equity portfolio is underexposed to Value as a factor when measured by our risk systems
• Value has historically produced positive payoffs over the long term
• This presents a sourcing opportunity
Performance in Value Environments EPU World Equity Portfolio
Current EPU World Equity
Portfolio
Value Environments - Hit Rate 20.0%
Value Environments - Average Excess Return -37 bps
Value Factor Exposure (Barra) -0.19

14
4. Case Study: Sourcing
• We sourced value manager ideas from the Premier List
• We considered several managers, including strategies from existing invested relationships
• We brought two strategies to the Internal Investment Committee for investment approval:
• Wellington Capital Management
• D.E. Shaw Investment Management
Performance in Value Environments EPU World Equity Portfolio
Current EPU World
Equity Portfolio Pro Forma with
Recommended Changes Value Environments - Hit Rate 20.0% 70.0% Value Environments - Average Excess Return -37 bps 14 bps Value Factor Exposure (Barra) -0.19 -0.06

15
4. Case Study: Wellington Capital Management
• TRS has been invested in Wellington’s Global Select Capital Appreciation (“GSCA”) strategy since December 2009
• The GSCA strategy uses a multi-manager approach allocating equally to three Wellington portfolio managers and is largely tilted to growth environments
• Wellington employs 547 investment professionals and offers 148 equity strategies, 61 of which were in the top quartile of their respective peer groups
• We are adding two value portfolio managers to our multi-manager investment with Wellington
• As part of this change, Wellington’s allocation will increase to approximately $1.6 billion, well within the external manager limit of 3% of trust assets
Portfolio BenchmarkDifference
vs. Benchmark1-Year 25.3% 16.6% 8.7%2-Year 7.7% 4.4% 3.3%3-Year 14.4% 12.4% 2.0%Since Investment 9.4% 7.9% 1.5%
* Returns for periods greater than one year are annualized
Net Performance Through June 30, 2013*Wellington Global Select Capital Appreciation

16
4. Case Study: Implementation
• In addition to adding the two value portfolio managers, TRS will work directly with Wellington in the future to add or remove portfolio managers within the mandate
• In this adjusted framework, TRS will have access to Wellington's full array of institutional quality portfolio managers
• With the additional capital, TRS has negotiated a fee discount
• Additionally, in this multi-manager framework, performance fees are paid on an aggregated net basis rather than on the performance of each individual manager

17
4. Case Study: Fee Netting - Example
• The charts below detail how fee netting could benefit TRS, using fictional returns for two equally sized managers:
4.0%
-4.0%
0.0%0.8%
0.0%0.4%
-5.0%
-4.0%
-3.0%
-2.0%
-1.0%
0.0%
1.0%
2.0%
3.0%
4.0%
5.0%
Portfolio Manager 1 Portfolio Manager 2 Total Portfolio
Performance Fees Paid Without Netting
Alpha (Gross) Performance Fee Paid(example: 20%)
4.0%
-4.0%
0.0% 0.0%
-5.0%
-4.0%
-3.0%
-2.0%
-1.0%
0.0%
1.0%
2.0%
3.0%
4.0%
5.0%
Portfolio Manager 1 Portfolio Manager 2 Total Portfolio
Performance Fees Paid With Netting
Alpha (Gross) Performance Fee Paid(example: 20%)
Alpha (Gross)Performance
Fees PaidPortfolio Manager 1 4.0% 0.8%Portfolio Manager 2 -4.0% 0.0%Total Portfolio Without Netting 0.0% 0.4%
Performance Fees Paid Without Netting
Alpha (Gross)Performance
Fees PaidPortfolio Manager 1 4.0% N/A Portfolio Manager 2 -4.0% N/A Total Portfolio With Netting 0.0% 0.0%
Performance Fees Paid With Netting

18
Hedge Fund Update
• In 2011, the Texas Legislature approved an increase in the limit to hedge funds from 5% to 10% of Trust assets
• As of June 30, 2013, TRS has 8.1% invested in external hedge funds
• The Board approved an increased target allocation from 4% to 9% in September 2011
• The Directional Hedge Fund portfolio was launched in October 2011
5. Hedge Fund Update
Hedge Fund Portfolios As of 6/30/2013
Assets ($ millions)
Return (1 yr)
Alpha (1 yr)
Directional Hedge Funds $5,141 12.1% 4.9% HFRI Fund of Funds Composite 7.2% Stable Value Hedge Funds $4,293 5.5% -1.4% HFRI Fund of Funds Conservative 6.9%
Source: State Street Bank Note: Performance is net of fees

19
5. Directional Hedge Fund Portfolio
Directional Hedge Fund Objectives Status Details
Focus on equity and market sensitive hedge funds
• Correlation to MSCI AC World: 0.8
Core strategies have moderate market sensitivity, lower volatility than equities
• Beta to MSCI AC World: 0.3 • Directional HF Volatility: 4.5% • MSCI AC World Volatility: 13.7%
Expected to outperform equities when markets are down, but will underperform strong markets
• 88% hit rate vs. equity in equity down months
• Average monthly excess return over equities in down months: 1.7%
• Inception to date return of 8.6% versus MSCI AC World 17.2%
Expected to outperform US Treasuries over the long term
• 8.6% vs. Treasuries -1.6%
HFRI Fund of Funds Composite benchmark with target tracking error of 6%
• 4.2% ahead of HFRI benchmark
since inception • Tracking Error: 1.6%
Dates: October 2011 to June 2013
Source: State Street Bank
Note: Performance is annualized except where noted and is net of fees

20
5. Stable Value Hedge Fund Portfolio
Source: State Street Bank
Note: Performance is annualized except where noted and is net of fees
Stable Value Hedge Fund Objectives Status Details
Focus on absolute return hedge funds • Return: 2.9% • Average Sharpe Ratio: 1.1
Core strategies have low to negative market sensitivity
• Beta to MSCI AC World: 0
Expected to have positive returns when markets are down
• Positive returns in 63% of down
equity months since the split (5 of 8 months)
Expected to outperform US Treasuries over the long term
• 2.9% vs. Treasuries -1.6%
HFRI Fund of Funds Conservative benchmark with target tracking error of 4%
• Return of 2.9% vs. the HFRI
benchmark of 4.3% • Tracking Error: 2.6%
Dates: October 2011 to June 2013
21
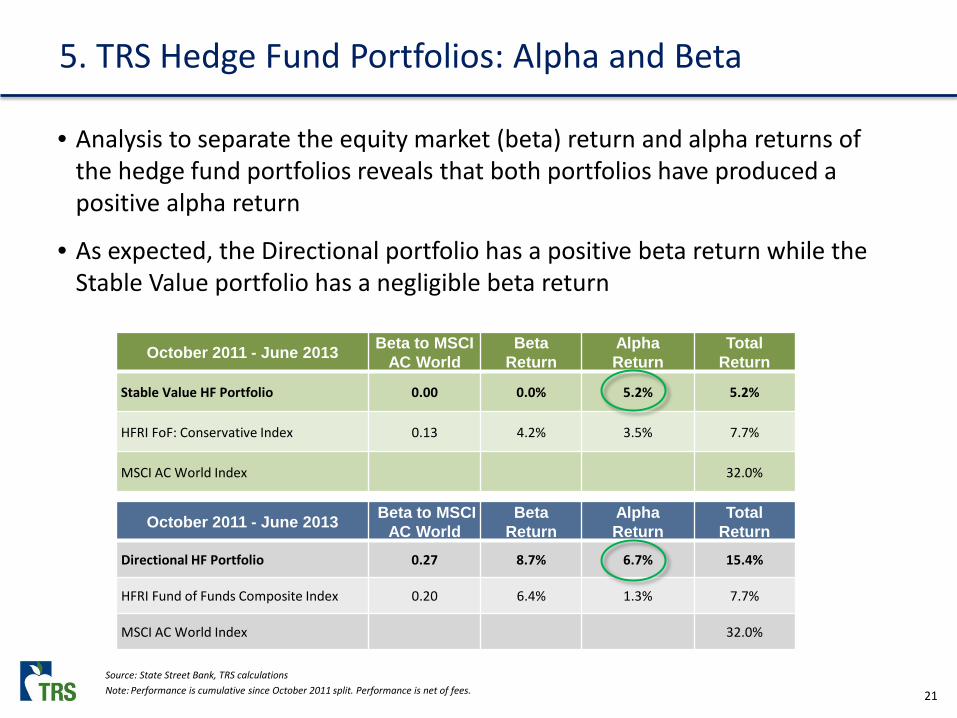
5. TRS Hedge Fund Portfolios: Alpha and Beta
• Analysis to separate the equity market (beta) return and alpha returns of the hedge fund portfolios reveals that both portfolios have produced a positive alpha return
• As expected, the Directional portfolio has a positive beta return while the Stable Value portfolio has a negligible beta return
October 2011 - June 2013 Beta to MSCI AC World
Beta Return
Alpha Return
Total Return
Stable Value HF Portfolio 0.00 0.0% 5.2% 5.2%
HFRI FoF: Conservative Index 0.13 4.2% 3.5% 7.7%
MSCI AC World Index 32.0%
Source: State Street Bank, TRS calculations Note: Performance is cumulative since October 2011 split. Performance is net of fees.
October 2011 - June 2013 Beta to MSCI AC World
Beta Return
Alpha Return
Total Return
Directional HF Portfolio 0.27 8.7% 6.7% 15.4%
HFRI Fund of Funds Composite Index 0.20 6.4% 1.3% 7.7%
MSCI AC World Index 32.0%

22
6. 2013 Priorities
• Generating alpha across all portfolios
• Continuing to develop the External Public team
• Cross-training within investment team
• EPU Wiki
• Moving from manager selection to strategic collaboration
• Continuing integration and cooperation with other IMD teams

APPENDIX

31
US Small Cap Manager
0
10
20
30
40
50
60
70
80
90
100
110
120
130
140
-200 -100 0 100 200 300 400 500 600 700 800 900 1000 1100 1200
Tota
l Fee
s, b
ps
Net Alpha to TRS, bps
Rack Rate Fee Schedule
TRS Negotiated Fees
Manager's Average Alpha Since Inception
Fee Paid at 250 bps of Alpha
Preferred Fee Arrangement Example

Periods 84R-Squared 96.88%Tracking Error 4.84%
Risk Free1.35%0.55%0.43%0.00%5.07%0.04%
42.2%71.8%56.0%
Trend Deviation: No Active Signal
Cumulative Performance:
Annualized Performance:
13.97%10-Year 3.37% 0.72
6/30/13
2008
St. Dev.Best MonthWorst MonthBest 12 MthsWorst 12 Mths
Portfolio
Jensen's alpha
Start Date: 26.88%
Inception
Period3-month
Year
3.15%3.66%
4.65%13.66%9.77%
(0.43%)
(7.02%)
(9.57%) 2.14%
B'mark
2.89%(1.94%)3.98%(3.39%)
2.13%4.84%3.98%(3.39%)9.42%(4.99%)
0.310.080.47
Hit Rt UpHit Rt Dn
79.29%48.49%30.80%
PortfolioBenchmarkExcess Return
I.R.
1.82%
0.75
0.61
1.020.91
26.00%17.09%(27.37%)91.63%
5.81%
(55.32%)
4.49
(48.77%)
3.29%
ReturnEx. Ret.Diff
Info. RatioM2 PremiumBeta
SharpeTreynorSortino
B'mark
Up CaptureDown Capture
8.70%24.06%17.33%(27.68%)96.40%
90.62%(43.15%)
(56.56%)
0.609.29%0.91
Risk-Adjusted Performance Summary:
98.38%
3.56%
Portfolio(5.65%) (8.08%)
VFB T.E.
2.86%
2.43%4.70%
Performance by Period (Inception: 7/31/98)
5-Year
7.60%(3.36%)6.26%
1.662.87%
18.22%
201020112012
39.42%
B'mark23.32%
2.47%
5.57%17.03%
4.20%
18.88%
41.23%(49.97%)
4.03%
3.36%
ExcessPerformance by Year:
1-YearYTD
3.38%
(4.87%)
2.05%2.87%
3.58%
(4.87%)
(53.33%)71.27%24.43%
78.51%
2013
7/31/06
End Date:
20062007
3-Year2-Year
(18.42%)
2009 (7.24%)5.56%
Statistical Tracking And Reporting (STAR) System
(9.57%)
(17.93%)20.20%
External Public Emerging Markets Manager vs. >STAR EM 00 - MSCI EM Net (NDUEEGF)Monthly Data from 7/06 to 6/13
Portfolio
Hit Rt Tot
4.74%
0.49%1.98%4.70%
-4%-3%-2%-1%0%1%2%3%4%5%
J-06
J-07
J-08
J-09
J-10
J-11
J-12
Monthly Excess Returns
Avg. Monthly Excess Returns: 0.19%
0%
2%
4%
6%
8%
10%
12%
14%
16%
18%
J-06
J-07
J-08
J-09
J-10
J-11
J-12
Drawdowns
Largest Drawdown: 6.95%, Peak to Trough
3.56%
1.82%
3.36%
5.56%
0.49%
1.98%
4.70%
-7.24% -8%
-6%
-4%
-2%
0%
2%
4%
6%
8%
06 07 08 09 10 11 12 13
Annual Excess Returns
-30%
-25%
-20%
-15%
-10%
-5%
0%
5%
10%
15%
20%
-30% -25% -20% -15% -10% -5% 0% 5% 10% 15% 20%
Monthly Returns vs. Benchmark
2013 2012 2011 Best Fit
-10%
-5%
0%
5%
10%
15%
20%
25%
30%
35%
J-06
J-07
J-08
J-09
J-10
J-11
J-12
Cumulative Excess Returns vs Expectations
Ann. Expected Ex. Ret: 1.5%, Ann. Expected T.E.: 3.0%

PeriodsHit RateAvg Ex Ret (bp)
2231.8%(42.6)
External Public Emerging Markets Manager vs. >STAR EM 00 - MSCI EM Net (NDUEEGF)
Benchmark UpBenchmark Down
PeriodsHit Rate
All Periods
42.2%71.8%
Hit Rate Analysis:
4067.5%43.7
Intl Bond Outperf.Neutral
46.7% 61.1%
US Bond/Intl Bond
Periods
Value Outperf.
15 54
24.2Small Growth
Outperf.
Avg Ex Ret (bp)
Hit Rate During Various Environments: STAR EM Environment
Neutral
1546.7%(27.2)29.7
Monthly Data from 7/06 to 6/13
59.1%Hit Rate34.2Avg Ex Ret (bp)
Periods
PeriodsHit Rate
3672.2%
2437.5%
Hit Rate 58.8%
Large/Small Large Outperf. Neutral Small Outperf.
2.479.4
5754.4% 60.0%
Periods
Statistical Tracking And Reporting (STAR) System
Small Value/Small Growth
Neutral Bonds Outperf.Stocks/Bonds7.1
Avg Ex Ret (bp)
Growth Outperf.
Neutral
Hit Rate453984
Avg. Ex. Ret.(36.7)82.318.6
Value/Growth
56.0%
Periods
US Bond Outperf.
2210
Small Value Outperf.
17
Stocks Outperf.
Avg Ex Ret (bp) 53.1(36.3)Core/High Yield
36 17 3147.2%(11.5)
52.9%8.7
67.7%59.0
Hit RateAvg Ex Ret (bp)US Stocks/Intl Stocks Neutral Intl Stocks Outperf.US Stocks
Outperf.Core Outperf. Neutral High Yield
Outperf.
2450.0%
2941.4%(53.0)16.9
57.7%26
50.2 43.4
3441.2%(21.6)
2969.0%91.6
PeriodsHit RateAvg Ex Ret (bp)
1861.1%
3268.8%
21.7
-8.0
-7.0
-6.0
-5.0
-4.0
-3.0
-2.0
-1.0
0.0
J-06
J-07
J-08
J-09
J-10
J-11
J-12
CUSUM Information Ratio Alarm
Current CUSUM Value: 0.00
-0.5
0.0
0.5
1.0
1.5
2.0
J-06
J-07
J-08
J-09
J-10
J-11
J-12
Trend Deviation: 60 Month Rolling
No Active Signal
0%
1%
2%
3%
4%
5%
6%
7%
8%
9%
J-06
J-07
J-08
J-09
J-10
J-11
J-12
Annualized Tracking Error (12-Month Rolling)
Avg. Tracking Error: 4.55%
-8%
-6%
-4%
-2%
0%
2%
4%
J-06
J-07
J-08
J-09
J-10
J-11
J-12
Annualized Excess Manager Volatility (12-Month Rolling)
Avg. Excess Volatility: -1.99%
0 0 0 0 0 0 0
2
4
7
24
26
14
5
2
0 0 0 0 0 0 0 0
5
10
15
20
25
30
<-10
-10
to -9
-9 to
-8
-8 to
-7
-7 to
-6
-6 to
-5
-5 to
-4
-4 to
-3
-3 to
-2
-2 to
-1
-1 to
0
0 to
1
1 to
2
2 to
3
3 to
4
4 to
5
5 to
6
6 to
7
7 to
8
8 to
9
9 to
10
>10
Distribution of Excess Returns
-2.0
-1.0
0.0
1.0
2.0
3.0
4.0
J-06
J-07
J-08
J-09
J-10
J-11
J-12
Trend Deviation: 12 Month Momentum
No Active Signal

Tab 3Tab 3

ThiThis page intentionally leftintentionally left
blank.

Five Year Anniversary of the Public Markets Strategic Partnership Network (SPN)
David T. Veal Director, Strategic Partnerships & Research
September 2013
2
Agenda
1. Overview
2. History
3. Performance
4. Positions
5. Research
6. Priorities

3
Assets Net Annualized
Return % Net Annualized
Alpha %Tracking Error Information Ratio
ProgramNAV ($m)
% of Trust 1 Year 3 Year
Since Incept. 1 Year 3 Year
Since Incept. 1 Year 3 Year
Since Incept. 1 Year 3 Year
Since Incept.
Barclays* 565.7 0.5% 10.2 n/a 6.2 1.5 n/a -0.1 1.6 n/a 1.5 1.0 n/a 0.0BlackRock 1,314.6 1.1% 9.7 11.8 5.3 1.0 0.3 0.7 1.7 1.8 2.0 0.6 0.2 0.4JP Morgan 1,406.5 1.2% 13.8 12.9 6.5 5.1 1.3 2.0 1.6 2.8 2.5 3.2 0.5 0.8Morgan Stanley 1,348.8 1.2% 12.9 13.5 5.9 4.3 2.0 1.3 2.1 1.7 1.6 2.1 1.2 0.8Neuberger Berman 1,362.3 1.2% 10.0 11.4 5.8 1.3 -0.2 1.2 1.3 2.0 2.3 1.0 -0.1 0.6
Total Public SPN 5,998.0 5.2% 11.5 12.4 5.9 2.8 0.8 1.3 1.0 1.4 1.4 2.8 0.6 0.9
*Barclays inception date is July 1, 2011; all others were July 1, 2008 Source: State Street Bank
Public Markets SPN Performance As of June 30, 2013
-2.0%
0.0%
2.0%
4.0%
6.0%
8.0%
10.0%
Jun-
08
Sep-
08
Dec-
08
Mar
-09
Jun-
09
Sep-
09
Dec-
09
Mar
-10
Jun-
10
Sep-
10
Dec-
10
Mar
-11
Jun-
11
Sep-
11
Dec-
11
Mar
-12
Jun-
12
Sep-
12
Dec-
12
Mar
-13
Jun-
13
Cumulative Alpha of Public SPN
2.53.03.54.04.55.05.56.06.5
Jun-
08
Oct
-08
Feb-
09
Jun-
09
Oct
-09
Feb-
10
Jun-
10
Oct
-10
Feb-
11
Jun-
11
Oct
-11
Feb-
12
Jun-
12
Oct
-12
Feb-
13
Jun-
13
$ B
illio
ns
Public Markets SPN Assets Under Management

5
•Manage, oversee and monitor five unique long-term investment relationships in the public markets around the world
Public Investments
•Work closely with two industry-leading private markets specialist partners to identify and allocate capital to attractive private opportunities
Private Investments
•Use and disseminate views and positioning data from partners to provide
insight and support to other groups in the IMD and to the Trust overall
Headlight System
•Work with heavily resourced partners to provide customized, timely investment research and training that the meets the needs of the IMD
Research Center
• Leverage the TRS investment network to develop product and process expertise to help ensure that the IMD is world class in every respect
Center of Excellence
Mandates

6
Strategic Partnerships & Research Group
David T. Veal, CAIA, CFA, FRM Director, Strategic Partnerships & Research BS, Industrial Engineering, Auburn University MBA, Finance & Accounting, University of Michigan Background: • Portfolio Manager, ERS of Texas • Research Analyst, Morgan Stanley • Supply Officer, US Navy
Grant Birdwell Investment Manager BS, Finance, Texas A&M Public Markets Background: • TRS Tactical Asset Allocation • Fixed Income Trading, Morgan Stanley • Institutional Advisory, Morgan Stanley
Courtney Villalta Senior Investment Manager BS, Finance, St. Edwards Private Equity and Real Assets Background: • TRS External Private Markets • Private Equity • Investment Banking, Tejas Securities Co.
Matt Wey Analyst BBA, Accounting, Texas A&M MS, Finance & Mathematics, Texas A&M Background: • Associate, Berkeley Research Group
Roxy Becker Team Support - Contractor BA, Communications, Austin College Background: • Executive Assistant, Goldman Sachs

7
History of the Public Markets SPN
• First major initiative using external managers in public markets
• Firms manage customized and risk-controlled global mandates
• Benchmark weights and tactical ranges based on TRS public markets asset allocation policy
• Four selected (BlackRock, JP Morgan, Morgan Stanley, Neuberger Berman) after a thorough review of multiple candidates
• Funded at $1 billion each in July 2008
• Barclays added in July 2011 at half weight ($500 million)

8
Seven Requirements for Public Markets Strategic Partners
1. Delivers full range of valuable investment products and services
2. Customizes products and services to specific TRS requirements
3. Operates globally with a sustainable business model
4. Produces proprietary, value-added investment research
5. Shares significant resources when appropriate
6. Shares long-term compensation philosophy compatible with TRS
7. Fully committed team, beginning with senior management

9
*Barclays inception date is July 1, 2011; all others were July 1, 2008 Source: State Street Bank
Public Markets SPN Performance Periods Ending June 30
1.8% 2.0% 2.0%
-2.0%
2.8%
-3.0%
-2.0%
-1.0%
0.0%
1.0%
2.0%
3.0%
2009 2010 2011 2012 2013Fiscal Year
Net Alpha By Public Markets SPN
-18.6%
15.8% 25.6%
2.5%
11.7%
-30.0%
-20.0%
-10.0%
0.0%
10.0%
20.0%
30.0%
2009 2010 2011 2012 2013Fiscal Year
Net Return By Public Markets SPN

10
Public Markets SPN Positioning “Headlight System” Example
Global Equity Stable Value Real Return
US Non-US US Long Non $ InflationTotal LC SC EAFE EM Total Treasury Sov Debt Credit Total Linked Com REITs
Barclays 4.1% 1.9% 0.0% 0.4% 1.8% 13.3% -0.5% 11.3% 2.5% -0.3% -0.2% -0.1% 0.0%BlackRock 3.2% 3.2% -0.4% -3.9% 4.3% 0.5% -2.1% 0.0% 2.6% -3.6% -0.2% -1.4% -2.0%JP Morgan 8.8% 2.5% -1.5% 7.5% 0.3% -1.1% -11.5% 0.3% 10.1% -2.5% -2.1% -0.3% -0.1%Morgan Stanley 1.3% -8.9% -0.7% 8.1% 2.8% 7.7% -0.8% 8.5% 0.0% -2.0% -1.5% -0.4% -0.1%Neuberger Berman 2.8% 1.4% 0.1% 0.1% 1.2% 11.6% 2.9% 2.4% 6.3% -0.2% 0.0% -0.2% 0.0%
Total (Average) 4.0% 0.0% -0.5% 2.4% 2.1% 6.4% -2.4% 4.5% 4.3% -1.7% -0.8% -0.5% -0.4%
As of 12/28/2012
As of 06/30/2013
Global Equity Stable Value Real Return
US Non-US US Long Non $ InflationBenchmark Total LC SC EAFE EM Total Treasury Sov Debt Credit Total Linked Com REITsNeutral 68% 28% 6% 20% 14% 20% 20% 0% 0% 12% 7% 3% 2%
Barclays 6.0% 6.2% 0.0% -4.5% 4.2% 13.6% -0.6% 14.2% 0.0% -3.1% -2.2% -0.9% 0.0%BlackRock 6.8% 9.6% 0.4% -0.6% -2.6% 2.6% -6.5% 0.0% 9.1% -5.2% -0.8% -2.3% -2.0%JP Morgan 8.2% 1.4% 2.0% 4.5% 0.2% 3.9% -7.4% 1.2% 10.2% -3.3% -2.7% -0.6% -0.1%Morgan Stanley 2.2% 5.5% -0.2% -1.5% -1.7% -2.3% -2.0% -0.3% 0.0% -6.8% -2.2% -4.5% -0.1%Neuberger Berman 0.4% 0.9% 1.0% -1.0% -0.5% 8.3% 4.2% -0.9% 5.0% -0.6% -0.1% -0.5% 0.0%
Total (Average) 4.7% 4.7% 0.6% -0.6% -0.1% 5.2% -2.5% 2.8% 4.9% -3.8% -1.6% -1.8% -0.4%

11
Joint Public/Private SPN Summit Center of Excellence
• Held on July 24, 2013 in New York City • First such event of its kind • Brought together 54 senior investors representing 7 firms • ~1000 years of collective leadership & investment experience
KEY TOPICS OF DISCUSSION
SPN positioning & performance Geopolitical outlook
Fed tapering and leadership Portfolio trends
Global monetary policy Academic review on private equity
US political landscape Leadership in uncertain times

12
Joint Public/Private SPN Summit Key Findings Center of Excellence
• Fed’s unemployment target looks achievable within the next 24 months, such that tapering should begin in 2013
• Inflation not a near-term concern for the next 12 months, though its eventual return may be marked by wage pressures which could be problematic for margins
• US is well-positioned relative to the rest of the world, and absent an external shock the current expansion is likely to last another 2-3 years.
• Mexico stands to be a key beneficiary of US growth and is showing early signs of getting its security situation under control
• China is the biggest wild card in the global economy and could swing the entire equation.
• Strong disagreement among partners on the path of global monetary policy, with some seeing tightening on EM inflation and others seeing loosening on slowing growth
• Biggest geopolitical risks are an Asian maritime crisis and an Israel/Iran conflict

13
Public Strategic Partnership Research Center
INVESTMENT MODELS VALUATION FRAMEWORKS RISK MANAGEMENT INVESTMENT STRATEGIES
• NCRIEF Modeling • NOI/Private Equity • Optimal Property Sector • Factor Rotation • European Country
Switching • Tactical FX Overlay • Tactical Credit
Allocation
• Inflation/Deflation Regimes • Regimes and Asset Classes • Regime Change • Sentiment • Earnings Forecasts • Implications of Low Rates • Opportunistic Global
Screens • Persistence of Hedge Fund
Alpha
• Risk Budgeting • FX Hedging • Portfolio Risk Analysis • RE as an Inflation Hedge • Forecasting Volatility • Tail Risk • Liquidity Risk • Volatility Reduction • Spanning Tree Analysis
• Alternative Risk Premia • Risk-Based Asset Allocation • Hedge Fund Risk Premia • Risk Premia Implementation • Thematic Investing • Switching Between Risk
Parity and Mean Variance • Structured Alpha
PUBLIC STRATEGIC PARTNERSHIP RESEARCH PROJECTS
Program 2008 2009 1H 2009 2H 2010 1H 2010 2H 2011 1H 2011 2H 2012 1H 2012 2H 2013 1H
Barclays Risk Budgeting Alternative Risk Premia
Risk-Based Asset
Allocation
Hedge Fund Alpha
Persistence
Hedge Fund Risk Premia
Risk Premia Implementation
BlackRock Currency Hedging
Inflation and Deflation
Portfolio Risk Analysis
NCREIF Modeling
NOI/Private Equity Model
Optimal Property Sector
Real Estate as Inflation
Hedge
Thematic Trading
Forecasting Volatility
Opportunistic Global Screens
JP Morgan Currency Hedging
Downside Risk
Inflation and GDP Regimes Regimes and Asset Classes Regime Change Tail Risk Factor
Rotation
Europe Country
Switching
Switching Between Risk Parity and Mean Variance
Morgan Stanley Currency Hedging
Inflation Regimes Liquidity Sentiment Volatility
Reduction Earnings Forecasting Gold vs.
Cash Switching
Europe Country
Switching Tactical FX Overlay
Neuberger Berman Currency Hedging
Regime Analysis
Tactical Credit Allocation
Risk-Based Asset
Allocation
Risk Parity
Spanning Tree
Analysis
Implications of Low Rates
Structured Alpha Part I

14
2013 Priorities
SPN Summits remaining during 2013
• Public Markets SPN Summit – Wednesday, September 18 in Austin
• Private Markets SPN Summit – Wednesday, November 13 in Austin
• Enhancement of Trust “headlight system” using portfolio signals
• Develop common language to enable greater information exchange
• Greater IMD access to Strategic Partner resources and research
• Develop academic research partnership with State Street Associates

APPENDIX

16
STAR Report for Total Public Markets SPN

Page Intentionally Left Blank

Tab 4Tab 4

ThiThis page intentionally leftintentionally left
blank.
Process for Developing New Internal Strategies
Mohan Balachandran Managing Director September 2013

2
1. Introduction
2. Guidelines for new internal portfolios
3. Current portfolios
4. Performance
5. Appendix

3
Introduction
• The IMD’s current new internal portfolio development effort began in 2009 with the addition of GBI Quant to the GBI portfolio
• As the Trust’s strategic asset allocation transition has neared completion, the IMD’s ability to identify new internal portfolio strategies has increased
• Currently, there are ten new internal portfolios in various stages of research
• Accordingly, the IIC has developed a formal four step process for new internal portfolios:
1. Strategy Development. Develop the strategy, obtain a Management Committee sponsor and present to the Management Committee.
2. Paper Portfolio. Launch a fully documented and independently reported Paper Portfolio.
3. Research Portfolio. Obtain IIC approval for a small allocation following normal Board notification procedures used for external managers (transparency report).
4. Full Allocation. Obtain IIC approval for a permanent allocation or terminate the portfolio.
• There are two exceptions to these guidelines: portfolios that are minor extensions of current Trust portfolios and strategies taking advantage of time-sensitive market dislocations

4
IMD Evaluation Process Research and Development of New Investment Concepts and Strategies
Investment Concept
Long-Term Allocation
“Paper” Portfolio
IIC Approval/Disapproval
• Role in Trust
• Type of Strategy
• Investment Process
• Policy Compliance
• Sponsor from Management Committee
• Success Metrics
Management Committee
Approval/Disapproval
Research and Development
• Six Months
• Operations oversight No assets Trade entry Position reporting
• Performance reporting
through State Street Systems
• Monthly Report to Management Committee
• Transparency Report
• Beyond one year
• Metrics satisfied
• Role in Trust established
• Direct assignments made
• All previous oversight and reporting continued
Established Internal Strategy
“Research” Portfolio
IIC Approval/Disapproval
• Six Months
• Operations oversight Assets <= $100 m Trade entry Position reporting
• Performance reporting
through State Street Systems
• Monthly Report to Management Committee
• Transparency Report
5
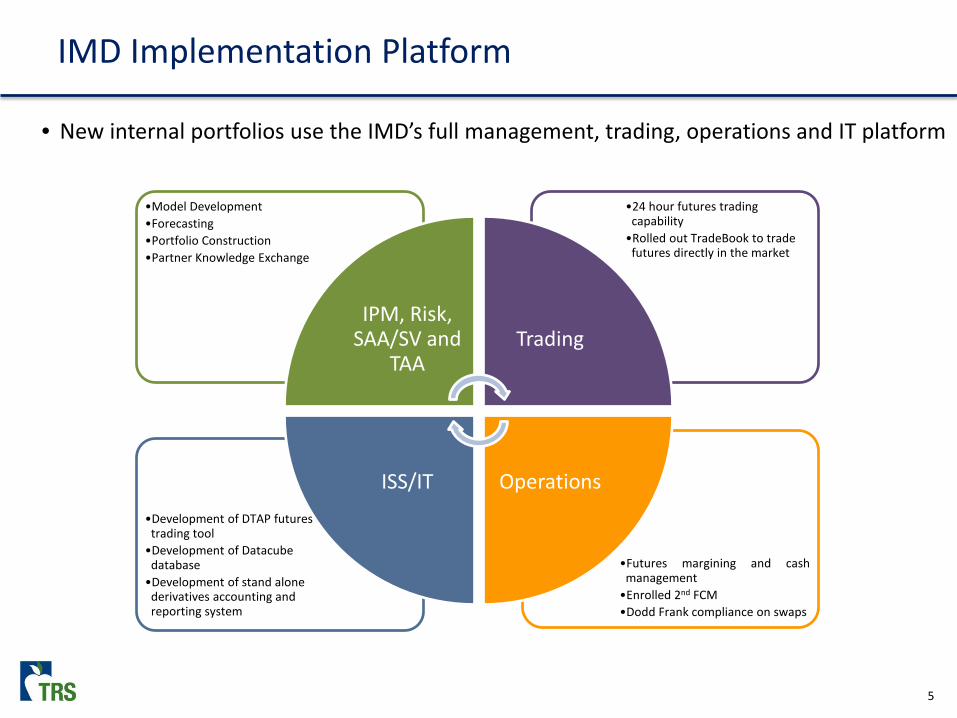
• New internal portfolios use the IMD’s full management, trading, operations and IT platform
•Futures margining and cash management •Enrolled 2nd FCM •Dodd Frank compliance on swaps
•Development of DTAP futures
trading tool •Development of Datacube
database •Development of stand alone
derivatives accounting and reporting system
•24 hour futures trading capability •Rolled out TradeBook to trade
futures directly in the market
•Model Development •Forecasting •Portfolio Construction •Partner Knowledge Exchange
IPM, Risk, SAA/SV and
TAA Trading
Operations ISS/IT
IMD Implementation Platform

6
Strategy Types
• New Strategies fall into one of three categories:
Type Alternative Beta Valuation/Dislocation Alpha Source of Return Risk premium Reversion to mean –
move back to long term intrinsic value
All other sources. Typically differentiated information or outlook
Concentration Well-diversified Typically high Varies
Implementation Systematic Security or asset class selection with margin of safety
Systematic or selection
Time Horizon Long term Until dislocation mean reverts to mean
Typically short to intermediate term
Duration Perpetual Finite Continuous
Examples Small cap, momentum, low volatility, value, quality, risk parity
Dislocated credit, residential housing post 2008 crisis
QVF, Enhanced Commodities, Currency overlay

9
• IMD has developed an ability to • Identify potentially effective strategies
• Rigorously assess these strategies
• Incrementally discontinue or fund strategies based on metrics and independent reporting
• Evaluation Process • Exceeds one year
• Evaluation and funding requires Management Committee review and IIC approval
• Reporting is systematic and transparent • Monthly reports to the Management Committee
• Monthly disclosure in the Transparency Report
• Searches for New Strategies in three areas • Alternative Beta: Five strategies under review and development
• Valuation/Dislocation: One strategy under development
• Alpha: Four strategies under review
Summary of IMD Research and Development Plan
APPENDIX

TRS Investment Management Division Internal Investment Committee
Recommended Guidelines for Developing New Internal Portfolios
Portfolio Strategies
Type Alternative Beta Valuation Alpha Source of Return
Risk premium Reversion to mean – move back to long term intrinsic value
All other sources. Typically differentiated information or outlook.
Concentration Well diversified Typically high Varies Implementation Systematic Security or asset class
selection with margin of safety
Systematic or selection
Time Horizon Long term Until dislocation mean reverts
Typically short term to intermediate term
Duration Perpetual Finite Continuous Examples Small cap, momentum, low
volatility, value, quality, risk parity
Dislocated credit, residential housing post GFC
QVF, enhanced commodities
Four Steps to IIC Approval of a New Internal Portfolio or Strategy
1. Develop Strategy (prior to paper portfolio launch) a. Create a strategy document, which addresses the following:
i. Strategy description (objective, type, source of return, concentration, implementation, time horizon, duration, instruments used, etc.)
ii. Role in Trust and potential impact (size considerations, source of funds, impact on risk and return, impact on leverage and liquidity, etc.)
iii. Investment process iv. Policy benchmark and risk controls v. STAR Reports
vi. Future success metrics (absolute return, alpha, return/risk ratios, liquidity, environmental expectations, peer group of external portfolios, portfolio characteristics, etc.)
vii. Required resources (people, databases, external resources, operations resources, trading, etc.)
viii. Compliance with the Investment Policy Statement b. Obtain support of the relevant profit center (management team and full group) and
demonstrate alignment with the annual priorities of the profit center. c. Present strategy document to a Management Committee sponsor and obtain that member’s
sponsorship. d. Present strategy document to the Management Committee.

-2-
2. Launch Paper Portfolio (month 0 to month ~4) a. Send notification to the Management Committee of paper portfolio launch with one page
executive summary and list of initial portfolio holdings. b. Engage Investment Operations to oversee portfolio trading and performance measurement. c. Engage State Street to report performance through PureView. a. Develop a useful and concise monthly reporting package for distribution to the Management
Committee, the relevant profit center and others who may be interested. i. Performance
ii. Risk metrics iii. Sources of beta and alpha (absolute and versus expectations) iv. Current portfolio v. Portfolio commentary
d. The typical duration of a paper portfolio is four months.
3. Launch Research and Development Portfolio (month ~5 to month 12+) b. Present strategy document to the IIC for formal vote to fund research and development
allocation. c. Confirm compliance treatment with State Street. d. Confirm portfolio fit with the Risk Group.
4. Launch Full Allocation (month 12+) a. Deliver final presentation to the relevant profit center and IIC sponsor for approval. b. Present to IIC with recommendation to increase funding to full long-term target over a specified
time horizon or terminate portfolio. c. Formal IIC vote required. d. Fund follow-on.
Shorter Timeline These four steps suggest a general timeline for launching a new portfolio or strategy. At the discretion of the IIC, the process and timeline may be shortened, for instance in the following circumstances:
• The portfolio represents only a minor extension of currently implemented portfolios, presents few novel operational challenges and will not significantly affect risk parameters at the Trust level.
• The investment opportunity is timely, and a long-term rollout would risk missing the opportunity. This might be the case in a Valuation Strategy where a market dislocation or anomaly is not expected to last for an extended period.

Tab 5Tab 5

ThiThis page intentionally leftintentionally left
blank.

Risk Parity
James Nield Senior Investment Manager
September 2013

2
1. Executive Summary
2. Portfolio Construction
3. Benefits and Considerations
4. State of the Market

3
Risk Parity and TRS
1. Invested $500 million in Risk Parity strategies on February 1, 2012
• Allocated to two external managers
• 10% allocation within Directional Hedge Fund Portfolio
2. Developed an internal Risk Parity strategy
• Began research portfolio in September 2012
• Performance in line with peers
• Funded research and development portfolio on July 1, 2013 ($100 million)
3. Strategic Asset Allocation (SAA)
• Provide opportunity to enhance existing portfolio construction process
• Next SAA study in 2014
Executive Summary

4
Executive Summary Peer Comparison
Source: Hewitt EnnisKnupp, Wilshire TUCS
• Top performing fund in TUCS universe over the past three years is the Fairfax County (VA) Employees’ Retirement System
• Fairfax County incorporates a risk
parity like framework at the Trust level
• Target market exposure was 153% of
assets (as of June 2012) • Asset mix includes a large allocation
to core Fixed Income

5
0
0.2
0.4
0.6
0.8
1
1.2
0 0.2 0.4 0.6 0.8 1 1.2
Expe
cted
Ret
urn
Risk
Modern Portfolio Theory
100% Bonds
Diversified Portfolio
Efficient Frontier2
3
1
100% Stocks
Leverage
Portfolio Construction Modern Portfolio Theory
Risk Parity seeks to capitalize on Modern Portfolio Theory
1. Most investors create a portfolio with their desired risk and return characteristics along the efficient frontier. For example, a 60/401 portfolio might be a portfolio selected by an investor
2. Alternatively, Risk Parity seeks to build a well-diversified portfolio that has the highest probability of outperforming cash
3. However, the Risk Parity portfolio has a low expected return and risk profile. An investor can then apply leverage to the Risk Parity portfolio to target the desired risk profile
1 60/40 portfolio is comprised of 60% S&P 500 and 40% Barclays Aggregate

6
• Risk Parity seeks to build a well-diversified portfolio balancing risk exposures
• Sample risk contributions:
• The balance in a Risk Parity portfolio leads to a more equal contribution of risk relative to a 60/40 portfolio
• Since stocks are more volatile they dominate the risk profile of a 60/40 portfolio
• No one asset or factor exposure should dominate returns in a Risk Parity portfolio
Risk contribution for 60 /40 portfolio calculated using Bloomberg data from January 2000 through June 2013. Risk contribution for Risk Parity is illustrative only
S&P 500 Barclays Agg
Portfolio Construction Balance Risk Exposures
Risk Parity 60% stocks/40% bonds
S&P 500 TIPS Commodities Treasuries

7
2012 EM Equities
18.2%
S&P 500 16.0%
TIPS 7.0%
Treasuries 4.2%
Commodities 0.1%
2011 Treasuries
15.6%
TIPS 13.6%
S&P 500 2.1%
Commodities (1.2%)
EM Equities (18.4%)
2010 EM Equities
18.9%
S&P 500 15.1%
Treasuries 9.4%
Commodities 9.0%
TIPS 6.3%
2009 EM Equities
78.5%
S&P 500 26.5%
Commodities 13.5%
TIPS 11.4%
Treasuries (6.0%)
2008 Treasuries
18.0%
TIPS (2.4%)
S&P 500 (37.0%)
Commodities (46.5%)
EM Equities (53.3%)
Portfolio Construction Return Forecasts
• Building a balanced portfolio, rather than relying on return forecasts, is beneficial as asset class returns can vary greatly from expectations
• Risk Parity does not use return forecasts to construct a portfolio
Source: Bloomberg
8
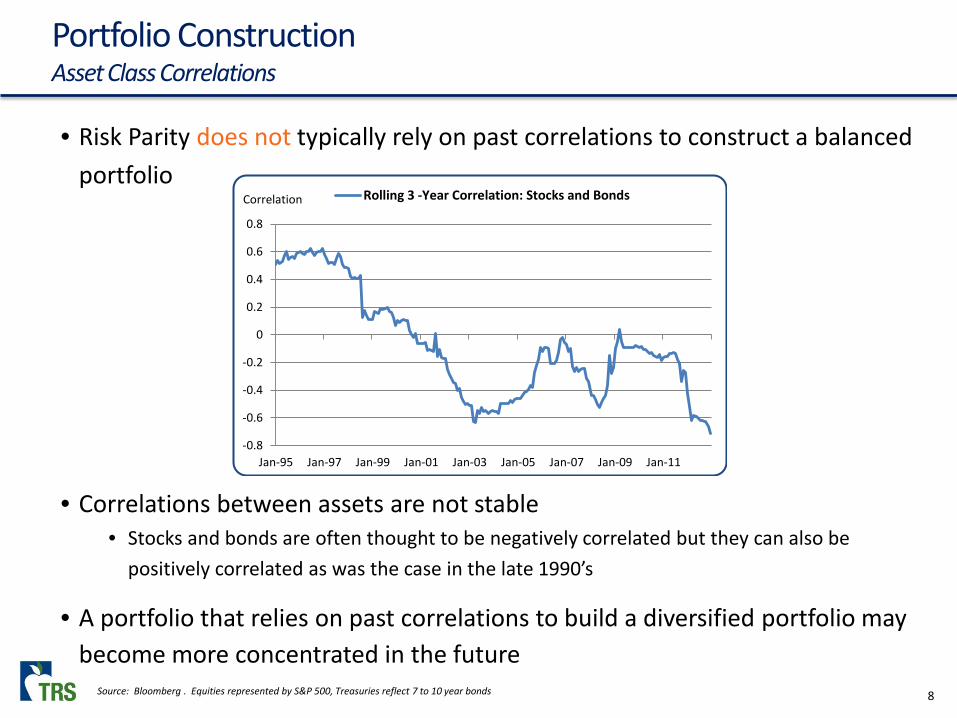
Portfolio Construction Asset Class Correlations
• Correlations between assets are not stable • Stocks and bonds are often thought to be negatively correlated but they can also be
positively correlated as was the case in the late 1990’s
• A portfolio that relies on past correlations to build a diversified portfolio may become more concentrated in the future
• Risk Parity does not typically rely on past correlations to construct a balanced portfolio
-0.8
-0.6
-0.4
-0.2
0
0.2
0.4
0.6
0.8
Jan-95 Jan-97 Jan-99 Jan-01 Jan-03 Jan-05 Jan-07 Jan-09 Jan-11
Correlation Rolling 3 -Year Correlation: Stocks and Bonds
Source: Bloomberg . Equities represented by S&P 500, Treasuries reflect 7 to 10 year bonds
9
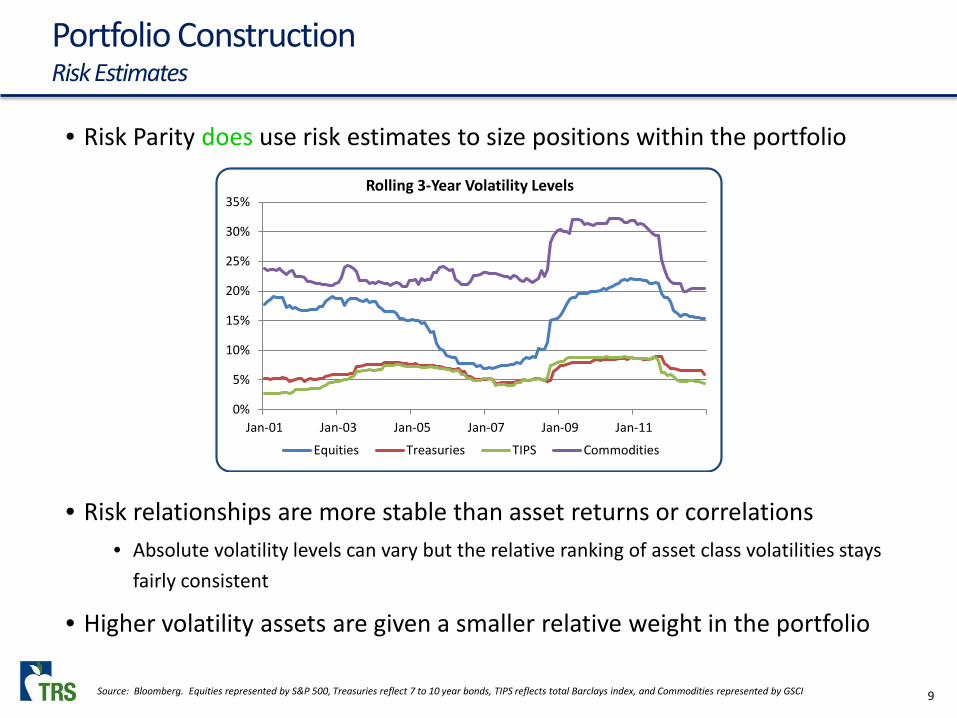
• Risk relationships are more stable than asset returns or correlations • Absolute volatility levels can vary but the relative ranking of asset class volatilities stays
fairly consistent
• Higher volatility assets are given a smaller relative weight in the portfolio
0%
5%
10%
15%
20%
25%
30%
35%
Jan-01 Jan-03 Jan-05 Jan-07 Jan-09 Jan-11
Rolling 3-Year Volatility Levels
Equities Treasuries TIPS Commodities
Portfolio Construction Risk Estimates
• Risk Parity does use risk estimates to size positions within the portfolio
Source: Bloomberg. Equities represented by S&P 500, Treasuries reflect 7 to 10 year bonds, TIPS reflects total Barclays index, and Commodities represented by GSCI

10
• An alternative to using correlations to build a diversified portfolio is to use asset environmental sensitivities (rising and falling growth and inflation) which are more stable Rising
Growth Falling
Growth Rising
Inflation Falling
Inflation Equities
Treasuries
TIPS
Commodities
Portfolio Construction Balanced Portfolio
• The objective in this scenario is to target an equal risk allocation to each macroeconomic environment
Rising Growth 25%
Rising Inflation 25%
Falling Growth 25%
Falling Inflation 25%
11
Portfolio Construction Summary
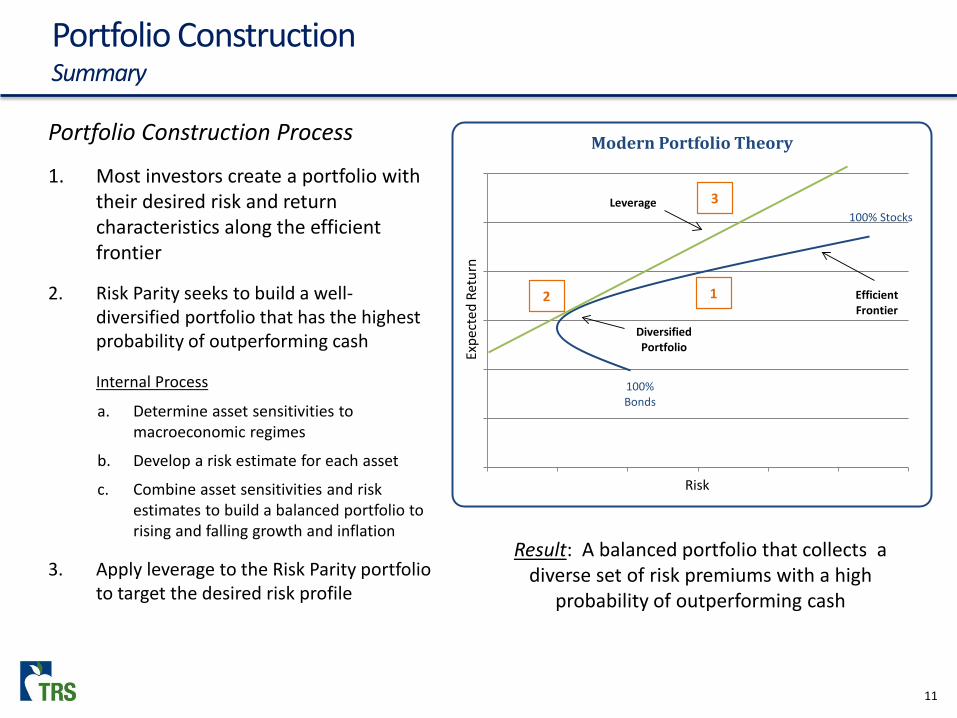
Portfolio Construction Process
1. Most investors create a portfolio with their desired risk and return characteristics along the efficient frontier
2. Risk Parity seeks to build a well-diversified portfolio that has the highest probability of outperforming cash
Internal Process
a. Determine asset sensitivities to macroeconomic regimes
b. Develop a risk estimate for each asset
c. Combine asset sensitivities and risk estimates to build a balanced portfolio to rising and falling growth and inflation
3. Apply leverage to the Risk Parity portfolio to target the desired risk profile
Result: A balanced portfolio that collects a diverse set of risk premiums with a high
probability of outperforming cash
0
0.2
0.4
0.6
0.8
1
1.2
0 0.2 0.4 0.6 0.8 1 1.2Ex
pect
ed R
etur
nRisk
Modern Portfolio Theory
100% Bonds
Diversified Portfolio
Efficient Frontier
2
3
1
100% StocksLeverage

12
• The balanced exposure in Risk Parity portfolios results in a drawdown profile that is generally improved relative to a 60/40 despite the use of leverage
• In 2008, Risk Parity had a drawdown of 22%, whereas a 60/40 portfolio had a drawdown of 33%
• Risk Parity will underperform a 60/40 portfolio when equities do well as was the case recently
• A Risk Parity portfolio provides a diversified return stream relative to a 60/40 portfolio
• Risk Parity has also been able to outperform a 60/40 portfolio with lower volatility providing additional diversification benefits
60/40 portfolio represents 60% S&P 500 and 40% Barclays Aggregate; Risk Parity portfolio represents the combination of external managers performance
Benefits
Diversification
-35%
-30%
-25%
-20%
-15%
-10%
-5%
0%
2000 2002 2004 2006 2008 2010 2012
Risk Parity 60 / 40Drawdown
Risk Profile
-0.1
0.0
0.1
0.2
0.3
0.4
0.5
0.6
0.7
0.8
1999 2001 2003 2005 2007 2009 2011
Correlation Risk Parity Rolling 3 Year Correlation with 60/40

13
• Risk Parity portfolios are short cash leading to negative performance when cash is a preferred asset
• Cash is typically a preferred asset in two scenarios:
• Flight to quality (2008 financial crisis) • A reduction in liquidity (unexpected
central bank tightening 1994; 2013)
• Mitigating factors include: • Portfolio leverage will be reduced
when assets move together helping to preserve capital
• Investments are liquid so positions can be adjusted daily as needed
Considerations
Rising Rates
• Risk Parity has a large capital allocation to nominal bonds which will be negatively impacted if rates rise faster than expected
• Mitigating factors include: • The balance in the portfolio should help
mitigate losses from bonds
• Risk Parity has exposure to global rates, not just U.S. rates
• Example: Sample Risk Parity portfolio returned 15% from October 1998 - January 2000 when rates rose 260 basis points
Asset Weight Return
Treasuries 75% -7%
TIPS 70% 2%
S&P 500 35% 39%
Commodities 20% 24%
Total 200% 15%
Short Cash Position

14
State of the Market
• Risk Parity is a widely invested strategy • More than $100 billion invested in top five managers • Risk Parity is considered to be one of the fastest growing strategies
• Risk Parity is now offered in mutual fund form • AQR (AQRIX); First Quadrant (MMAFX); Invesco (ABRZX); Salient (SRPFX)
• Some investors make Risk Parity a line item in their asset allocation • One Texas Fund has a 7% allocation target to Risk Parity
• Some plans have adopted risk parity principles at an enterprise level • ATP (Danish pension fund)
• Fairfax County (VA) Employees’ Retirement System
• Ontario Teachers Pension Plan
• San Diego County Employees Retirement Association
• State of Wisconsin Investment Board (SWIB)

APPENDIX

16
• Internal Portfolio Investment Checklist
• Create Strategy Document
• Identify IIC Sponsor
• Present strategy to Management Committee
• Review process with operations
• Launch paper portfolio
• Provide monthly performance report
• Formal IIC funding request
• Fund research and development portfolio
• Fund full allocation portfolio
Investment Process TRS Internal Strategy

17
Paper Portfolio Performance TRS Internal Strategy
0.76
0.92 0.87 0.89 0.85
0.90
- 0.1 0.2 0.3 0.4 0.5 0.6 0.7 0.8 0.9 1.0
TRS Trust AQR Salient B'Water Invesco First Q
Correlation to TRS Parity
200%
220%
240%
260%
280%
300%
320%
Actual Leverage Leverage Cap
0.52 0.54
0.40 0.40
0.15
0.39 0.42
-0.5
-0.3
-0.1
0.1
0.3
0.5
0.7
0.9
IRP TRSTrust
AQR Salient B'Water Invesco First Q
Equity Beta Since Inception
-15.0%
-10.0%
-5.0%
0.0%
5.0%
10.0%
15.0%Inception-to Date Performance
I RP RP Peer Average TRS Trust

Page Intentionally Left Blank