investment research general market conditions euro...
TRANSCRIPT

Important disclosures and certifications are contained from page 9 of this report. www.danskeresearch.com
Investment Research — General Market Conditions
The rise in inflation to the ECB’s 2.0% target for the first time since 2013 implies that
market expectations have turned in favour of expecting a more hawkish stance from the
ECB (a 50% probability of a 10bp deposit rate hike from the ECB is priced in for the end of this
year). However, the rise in inflation has so far been driven by volatile energy and unprocessed
food price inflation, while the underlying price pressure reflected in core inflation remains
subdued. Consistent with weak underlying price pressure, the market is pricing in lower inflation
in coming months (down at 0.8% in January 2018), which in our view is in sharp contrast with
the expectations of a policy rate hike this year.
In this research piece, we take a close look at what to expect from inflation, with special
focus on core inflation as it reveals the underlying price pressure. Based on the
communication from ECB members, the latter is highly important for the future monetary policy
stance. We expect the ECB to decide on whether to start tapering its QE purchases at the meeting
on 7 September. Hence, we consider the inflation figures released ahead of this meeting.
Our conclusion is that the rise in inflation is not a sustained adjustment towards the 2%
target, as core inflation is set to print below 1.0% for the next six months, except for one month
where it will be lifted by the timing of Easter. The most important reason why core inflation
should stay modest is our expectation of subdued wage pressure due to slack in the labour market
particularly in the periphery countries but also continued modest wage growth in Germany.
Based on this, we still expect the ECB to announce a third QE extension in September and
most likely continue buying assets of EUR60bn per month, as its focus will remain on the
underlying price pressure. However, the ECB might continue to remove some of its dovish
communications from the introductory statement prior to this but, in our view, this does not
mean it will start hiking policy rates or tapering QE towards zero.
Headline inflation is expected to trend down – core inflation to stay subdued
Source: Eurostat, Danske Bank Markets
29 March 2017
Euro area research
Euro area reflation story ending
Other euro inflation research papers
ECB core inflation forecast is still
too optimistic
14 March 2017
Euro area inflation surprises on
the upside – will core inflation
follow the upward trend?
31 January 2017 Highest euro area inflation in
three years – but the underlying
price pressure remains weak
4 January 2017
Five reasons the ECB will not
announce QE tapering in 2017 4 January 2017
Senior Analyst Pernille Bomholdt Henneberg +44 20 7410 8157 [email protected]

2 | 29 March 2017 www.danskeresearch.com
Eu
ro a
rea resea
rch
Euro area research
Euro area inflation for the next six months
Inflation in March (released 31 March): we estimate headline inflation took a dip from 2.0%
in February to 1.6% in March, driven partly by a drop in core inflation from 0.9% down to
0.7%. If this core inflation figure is correct, it will be the lowest since April 2016. However,
our estimate of a decline is due mainly to the early timing of Easter in 2016, causing low
inflation in the volatile package holiday prices in March this year. Added to the lower core
inflation, the latest decline in the oil price together with less support from base effects in
energy prices will also have driven headline inflation lower, although energy price inflation
should still have a considerable positive contribution to inflation. Finally, food price
inflation has surprised on the upside recently, due mainly to cold weather in the winter
months. However, this is unlikely to have continued and we look for a lower contribution.
Inflation in April (released 28 April): headline inflation should go up to 1.8% but only for
this month. Core inflation will also rise and for the first time in a year print at 1.0%, but the
rise in core inflation is again related to the early timing of Easter last year. This implies the
higher figure should not be too encouraging for the ECB as it does not reflect higher
underlying price pressure but a temporary rise in prices on package holidays. (In April,
package holidays should add 0.1pp more to core inflation than the historical average). We
expect the contribution from energy price inflation to be the same as in March based on a
fairly stable oil price development. On the other hand, food price inflation should continue
lower still, correcting from the strong figures in the cold winter months.
Inflation in May (released 31 May): both headline and core inflation should go lower to
1.4% and 0.8%, respectively. The lower core inflation is reflecting a normalisation following
the Easter effect and following this temporary volatility, service price inflation (around 60%
of core inflation) should be back around its level in the beginning of this year. Non-energy
industrial goods price inflation (the remaining roughly 40% of core inflation) should still be
around 0.2-0.3% as there is less tailwind from the EUR weakening and as the indirect
support from the higher oil price usually kicks-in with a lag of around 12 months. The lower
headline inflation should also follow as the contribution from energy price inflation should
go down by 0.2pp compared with April due to less support from base effects. Food price
inflation is also set to continue lower in May and print at the lowest level since December.
Inflation in June (released 30 June): we expect headline inflation to decline a bit further to
1.3%, reflecting energy price base effect continues to fade, bringing the contribution to
inflation down by another 0.2pp. On the other hand, core inflation should increase slightly
to 0.9% as we expect non-energy industrial goods price inflation to go a bit higher as an
indirect impact of the higher oil price starting to lift it slowly. Service price inflation is also
supported by an indirect impact of the higher oil price, but as the sector is highly dependent
on the labour input, the overall figure should remain modest as long as wage growth is
subdued. We expect food price inflation to go slightly higher.
Inflation in July (released 31 July): headline inflation is set to go 0.1pp higher to 1.4% but
core inflation should remain unchanged at 0.9%, still reflecting the lack of expected upward
pressure from wages. The higher headline inflation is instead supported by an increase in
energy price inflation as there is a temporary support from base effects during the summer
months. Food price inflation should be a bit lower again in July although modestly so.
Inflation in August (released 31 Aug): headline inflation should again go a bit higher to 1.5%
but again we expect core inflation to remain unchanged at 0.9%, implying the only month
that we expect core inflation to print at 1.0% is in April, where it is lifted by the early timing
of Easter last year. In line with the higher headline inflation in July, it is again lifted by a
higher support from energy price inflation while food price inflation is modestly lower.
Euro area inflation forecast
Source: Eurostat, Danske Bank Markets
Market pricing of inflation vs forecast
Source: Bloomberg, Eurostat, Danske Bank
Markets
HICP Energy Food Core
Jan-17 1.8 8.1 1.8 0.9
Feb-17 2.0 9.3 2.5 0.9
Mar-17 1.6 7.5 2.2 0.7
Apr-17 1.8 7.5 1.8 1.0
May-17 1.4 5.8 1.5 0.8
Jun-17 1.3 4.1 1.7 0.9
Jul-17 1.4 5.2 1.5 0.9
Aug-17 1.5 6.4 1.4 0.9
Sep-17 1.6 5.3 1.7 1.0
Oct-17 1.5 3.7 1.9 1.0
Nov-17 1.5 4.0 1.8 1.2
Dec-17 1.3 2.2 1.7 1.1
Jan-18 1.0 -0.3 1.3 1.2
Feb-18 1.1 -0.1 0.8 1.3
Mar-18 1.2 0.6 1.0 1.3
Apr-18 1.2 0.6 1.2 1.3
May-18 1.3 0.6 1.4 1.3
Jun-18 1.2 0.6 1.2 1.3
Jul-18 1.2 0.6 1.2 1.3
Aug-18 1.2 0.6 1.2 1.3
Sep-18 1.2 0.6 1.3 1.3
Oct-18 1.2 0.6 1.3 1.3
Nov-18 1.2 0.6 1.3 1.2
Dec-18 1.2 0.6 1.3 1.2
-1.00%
-0.50%
0.00%
0.50%
1.00%
1.50%
2.00%
Dec-13 Dec-14 Dec-15 Dec-16 Dec-17 Dec-18
HICP inflation Market pricing Dankse HICP inflation forecast

3 | 29 March 2017 www.danskeresearch.com
Eu
ro a
rea resea
rch
Euro area research
Variation in inflation driven mainly by commodity prices
The recent rise in headline inflation is driven by a lift in energy price inflation. Historically,
energy price inflation has explained around 50% of variation in inflation despite its low weight.
Headline inflation lifted by base effects in energy prices Variation in inflation driven by energy price inflation
Source: Eurostat, Danske Bank Markets Source: Eurostat, Danske Bank Markets
The strong positive contribution from energy price inflation is set to fade as the positive base
effects of the very low oil price in early 2016 will not continue to be supportive.
Slowly rising oil and energy prices Fuels for personal transport is main driver of energy inflation
Source: Bloomberg, Eurostat, Danske Bank Markets Source: Eurostat, Danske Bank Markets
Food price inflation has been lifted recently by unprocessed food prices, due mainly to cold
weather. This should correct itself in the spring as indicated by 5% lower commodity food prices.
Strong food price inflation in recent months Cold weather has affected unprocessed food prices
Source: Eurostat, Danske Bank Markets Source: Eurostat, Hamburg Institute of International Economics, Danske Bank
4 | 29 March 2017 www.danskeresearch.com
Eu
ro a
rea resea
rch
Euro area research
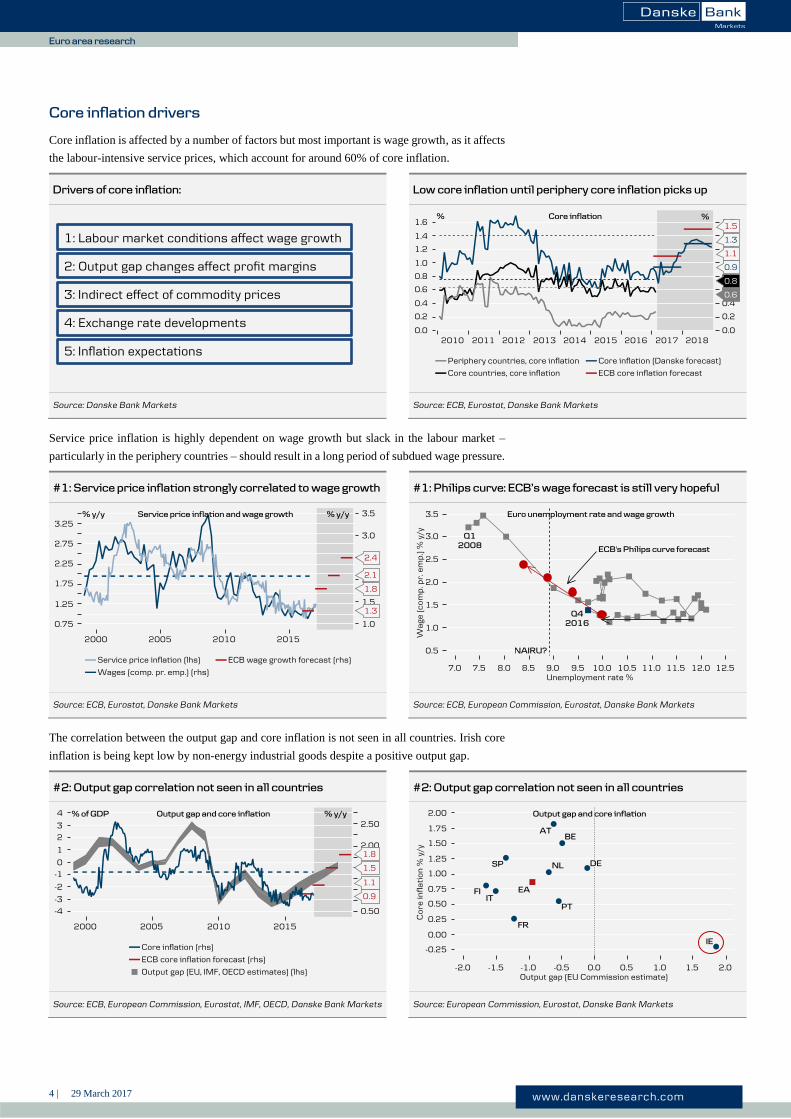
Core inflation drivers
Core inflation is affected by a number of factors but most important is wage growth, as it affects
the labour-intensive service prices, which account for around 60% of core inflation.
Drivers of core inflation: Low core inflation until periphery core inflation picks up
1: Labour market conditions affect wage growth 2: Output gap changes affect profit margins
3: Indirect effect of commodity prices 4: Exchange rate developments 5: Inflation expectations
Source: Danske Bank Markets Source: ECB, Eurostat, Danske Bank Markets
Service price inflation is highly dependent on wage growth but slack in the labour market –
particularly in the periphery countries – should result in a long period of subdued wage pressure.
#1: Service price inflation strongly correlated to wage growth #1: Philips curve: ECB’s wage forecast is still very hopeful
Source: ECB, Eurostat, Danske Bank Markets Source: ECB, European Commission, Eurostat, Danske Bank Markets
The correlation between the output gap and core inflation is not seen in all countries. Irish core
inflation is being kept low by non-energy industrial goods despite a positive output gap.
#2: Output gap correlation not seen in all countries #2: Output gap correlation not seen in all countries
Source: ECB, European Commission, Eurostat, IMF, OECD, Danske Bank Markets Source: European Commission, Eurostat, Danske Bank Markets

5 | 29 March 2017 www.danskeresearch.com
Eu
ro a
rea resea
rch
Euro area research
Core inflation drivers (continued)
Core inflation is affected indirectly by commodity prices and the higher oil price has started to
lift service inflation, but non-energy industrial goods inflation is affected with a 12-month lag.
#3: Indirect effect from commodity prices lift NEIG inflation #3: Commodity prices also indirectly lifting service inflation
Source: Bloomberg, Eurostat, Danske Bank Markets Source: Bloomberg, Eurostat, Danske Bank Markets
The EUR weakening in 2014-15 supported core inflation and was the main reason why core
inflation printed above 1.0% in 2015. The tailwind has since faded and should remain modest.
#4: Exchange rate development no longer supportive #4: The weaker euro lifted core inflation above 1.0% in 2015
Source: Bloomberg, Eurostat, Danske Bank Markets Source: Eurostat, Danske Bank Markets
Service price inflation expectations have diverged strongly from the actual inflation figures.
Therefore, we do not use these measures as important indicators of core inflation.
#5: Inflation expectations a very poor core inflation indicator #5: Inflation expectations from the PMIs are also very poor
Source: European Commission, Eurostat, Danske Bank Markets Source: Eurostat, Markit PMI, Danske Bank Markets

6 | 29 March 2017 www.danskeresearch.com
Eu
ro a
rea resea
rch
Euro area research
Service price inflation components
Overall service price inflation is determined mainly by the wage pressure but it can be
disaggregated into six sub-components where one of them is indirectly related to the oil price.
Service price inflation set to go slightly higher at end-2017… …due mainly to transport prices, which are lifted by oil prices
Source: Eurostat, Danske Bank Markets Source: Bloomberg, Eurostat, Danske Bank Markets
The ongoing recovery is also set to support service price inflation at the end of this year.
Likewise, higher house prices and the cost of borrowing are supportive for service inflation.
The ongoing recovery should also support service inflation Services related to housing are affected by costs of borrowing
Source: Eurostat, Danske Bank Markets Source: ECB, Eurostat, Danske Bank Markets
Service price inflation in communication has again turned negative and should remain negative.
Prices related to package holidays should add volatility particularly around the Easter months.
Inflation in communication is again negative Inflation in package tours adds volatility to service inflation
Source: Eurostat, Danske Bank Markets Source: Eurostat, Danske Bank Markets

7 | 29 March 2017 www.danskeresearch.com
Eu
ro a
rea resea
rch
Euro area research
Non-energy industrial goods price inflation components
Non-energy industrial goods price inflation is affected by commodity prices, exchange rate
developments and the economic situation, as it affects inflation of clothing and garment prices.
Non-energy industrial goods price inflation to trend up a bit Higher NEIG should follow mainly as non-durable goods rising
Source: Eurostat, Danske Bank Markets Source: Eurostat, Danske Bank Markets
Non-energy industrial goods price inflation is affected indirectly by changes in the oil price but
there is a lag. Changes in the effective EUR also affect the core inflation component.
The higher oil price and producer prices affect NEIG inflation Changes in the effective EUR also affect NEIG inflation
Source: Bloomberg, Danske Bank Markets Source: European Commission, Eurostat, Danske Bank Markets
The third component of non-energy industrial goods price inflation (semi-durable) depends
mainly on clothing and garments prices and is very volatile. The trend follows durable goods.
Durable goods price inflation predicts semi-durable goods Volatility in clothing and garments affects core inflation
Source: Eurostat, Danske Bank Markets Source: Eurostat, Danske Bank Markets
8 | 29 March 2017 www.danskeresearch.com
Eu
ro a
rea resea
rch
Euro area research
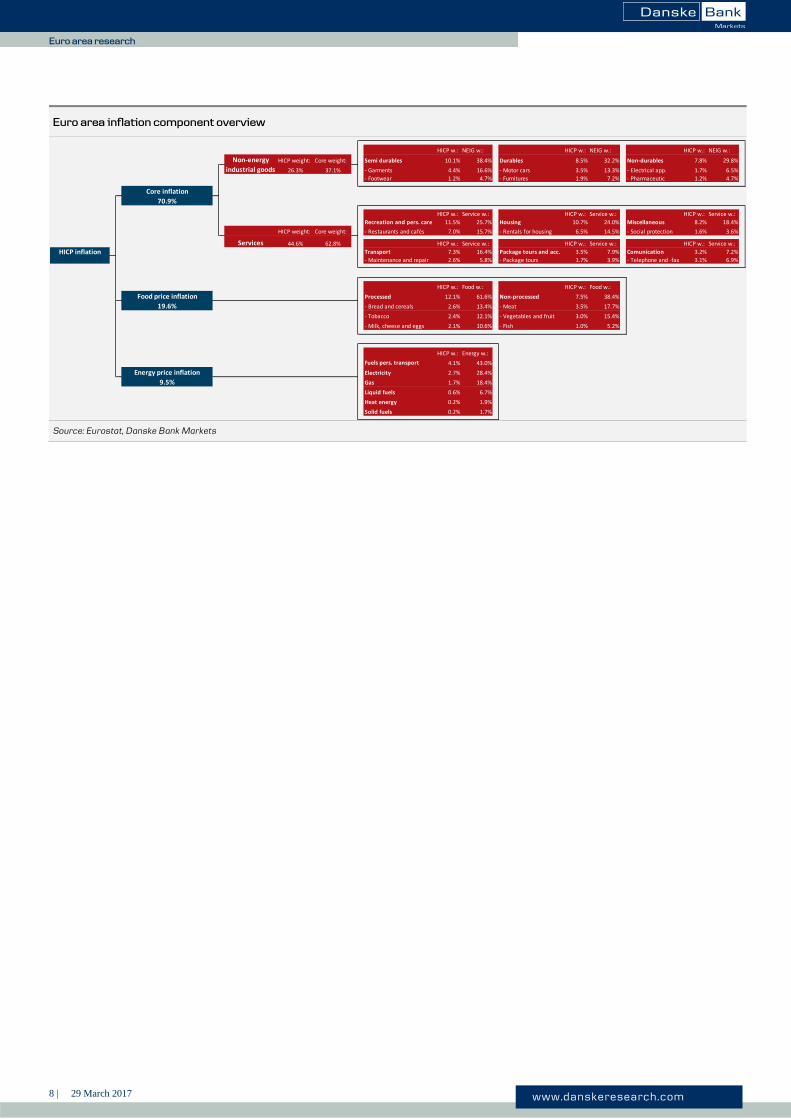
Euro area inflation component overview
Source: Eurostat, Danske Bank Markets
HICP w.: NEIG w.: HICP w.: NEIG w.: HICP w.: NEIG w.:
HICP weight: Core weight: Semi durables 10.1% 38.4% Durables 8.5% 32.2% Non-durables 7.8% 29.8%
26.3% 37.1% - Garments 4.4% 16.6% - Motor cars 3.5% 13.3% - Electrical app. 1.7% 6.5%
- Footwear 1.2% 4.7% - Furnitures 1.9% 7.2% - Pharmaceutic 1.2% 4.7%
Core inflation
70.9%
HICP w.: Service w.: HICP w.: Service w.: HICP w.: Service w.:
Recreation and pers. care 11.5% 25.7% Housing 10.7% 24.0% Miscellaneous 8.2% 18.4%
HICP weight: Core weight: - Restaurants and cafés 7.0% 15.7% - Rentals for housing 6.5% 14.5% - Social protection 1.6% 3.6%
HICP w.: Service w.: HICP w.: Service w.: HICP w.: Service w.:
HICP inflation Transport 7.3% 16.4% Package tours and acc. 3.5% 7.9% Comunication 3.2% 7.2%
- Maintenance and repair 2.6% 5.8% - Package tours 1.7% 3.9% - Telephone and -fax 3.1% 6.9%
HICP w.: Food w.: HICP w.: Food w.:
Food price inflation Processed 12.1% 61.6% Non-processed 7.5% 38.4%
19.6% - Bread and cereals 2.6% 13.4% - Meat 3.5% 17.7%
- Tobacco 2.4% 12.1% - Vegetables and fruit 3.0% 15.4%
- Milk, cheese and eggs 2.1% 10.6% - Fish 1.0% 5.2%
HICP w.: Energy w.:
Fuels pers. transport 4.1% 43.0%
Energy price inflation Electricity 2.7% 28.4%
9.5% Gas 1.7% 18.4%
Liquid fuels 0.6% 6.7%
Heat energy 0.2% 1.9%
Solid fuels 0.2% 1.7%
Non-energy
industrial goods
Services 44.6% 62.8%
9 | 29 March 2017 www.danskeresearch.com
Eu
ro a
rea resea
rch
Euro area research
Disclosure This research report has been prepared by Danske Bank Markets, a division of Danske Bank A/S (‘Danske Bank’). The
author of the research report is Pernille Bomholdt Henneberg, Senior Analyst.
Analyst certification
Each research analyst responsible for the content of this research report certifies that the views expressed in the research
report accurately reflect the research analyst’s personal view about the financial instruments and issuers covered by the
research report. Each responsible research analyst further certifies that no part of the compensation of the research analyst
was, is or will be, directly or indirectly, related to the specific recommendations expressed in the research report.
Regulation
Danske Bank is authorised and subject to regulation by the Danish Financial Supervisory Authority and is subject to the
rules and regulation of the relevant regulators in all other jurisdictions where it conducts business. Danske Bank is subject
to limited regulation by the Financial Conduct Authority and the Prudential Regulation Authority (UK). Details on the
extent of the regulation by the Financial Conduct Authority and the Prudential Regulation Authority are available from
Danske Bank on request.
The research reports of Danske Bank are prepared in accordance with the recommendations of the Danish Securities Dealers
Association.
Conflicts of interest
Danske Bank has established procedures to prevent conflicts of interest and to ensure the provision of high-quality research
based on research objectivity and independence. These procedures are documented in Danske Bank’s research policies.
Employees within Danske Bank’s Research Departments have been instructed that any request that might impair the
objectivity and independence of research shall be referred to Research Management and the Compliance Department.
Danske Bank’s Research Departments are organised independently from and do not report to other business areas within
Danske Bank.
Research analysts are remunerated in part based on the overall profitability of Danske Bank, which includes investment
banking revenues, but do not receive bonuses or other remuneration linked to specific corporate finance or debt capital
transactions.
Financial models and/or methodology used in this research report
Calculations and presentations in this research report are based on standard econometric tools and methodology as well as
publicly available statistics for each individual security, issuer and/or country. Documentation can be obtained from the
authors on request.
Risk warning
Major risks connected with recommendations or opinions in this research report, including a sensitivity analysis of relevant
assumptions, are stated throughout the text.
Expected updates
None.
Date of first publication
See the front page of this research report for the date of first publication.
General disclaimer This research has been prepared by Danske Bank Markets (a division of Danske Bank A/S). It is provided for informational
purposes only. It does not constitute or form part of, and shall under no circumstances be considered as, an offer to sell or
a solicitation of an offer to purchase or sell any relevant financial instruments (i.e. financial instruments mentioned herein
or other financial instruments of any issuer mentioned herein and/or options, warrants, rights or other interests with respect
to any such financial instruments) (‘Relevant Financial Instruments’).
The research report has been prepared independently and solely on the basis of publicly available information that Danske
Bank considers to be reliable. While reasonable care has been taken to ensure that its contents are not untrue or misleading,
no representation is made as to its accuracy or completeness and Danske Bank, its affiliates and subsidiaries accept no
liability whatsoever for any direct or consequential loss, including without limitation any loss of profits, arising from
reliance on this research report.
The opinions expressed herein are the opinions of the research analysts responsible for the research report and reflect their
judgement as of the date hereof. These opinions are subject to change, and Danske Bank does not undertake to notify any
recipient of this research report of any such change nor of any other changes related to the information provided in this
research report.
This research report is not intended for, and may not be redistributed to, retail customers in the United Kingdom or the United
States.
This research report is protected by copyright and is intended solely for the designated addressee. It may not be reproduced
or distributed, in whole or in part, by any recipient for any purpose without Danske Bank’s prior written consent.

10 | 29 March 2017 www.danskeresearch.com
Eu
ro a
rea resea
rch
Euro area research
Disclaimer related to distribution in the United States This research report was created by Danske Bank A/S and is distributed in the United States by Danske Markets Inc., a U.S.
registered broker-dealer and subsidiary of Danske Bank A/S, pursuant to SEC Rule 15a-6 and related interpretations issued
by the U.S. Securities and Exchange Commission. The research report is intended for distribution in the United States solely
to ‘U.S. institutional investors’ as defined in SEC Rule 15a-6. Danske Markets Inc. accepts responsibility for this research
report in connection with distribution in the United States solely to ‘U.S. institutional investors’.
Danske Bank is not subject to U.S. rules with regard to the preparation of research reports and the independence of research
analysts. In addition, the research analysts of Danske Bank who have prepared this research report are not registered or
qualified as research analysts with the NYSE or FINRA but satisfy the applicable requirements of a non-U.S. jurisdiction.
Any U.S. investor recipient of this research report who wishes to purchase or sell any Relevant Financial Instrument may
do so only by contacting Danske Markets Inc. directly and should be aware that investing in non-U.S. financial instruments
may entail certain risks. Financial instruments of non-U.S. issuers may not be registered with the U.S. Securities and
Exchange Commission and may not be subject to the reporting and auditing standards of the U.S. Securities and Exchange
Commission.