investment strategy insights - · pdf fileinvestment strategy insights the persistence of...
TRANSCRIPT

Treasury and Trade Solutions
Investment Strategy
Insights
The Persistence of Memory
Renato Grandmont
Chief Investment Officer
Wealth Management – Latin America
212.559.1766
The Persistence of Memory A Metaphor to Describe the Fed and Interest Rates
© Salvador Dalí, Fundació Gala-Salvador Dalí, Artists Rights Society (ARS), New York 2015

Macroeconomics Diverging Growth Scenarios: US Recovery to Accelerate While Europe Lags
All forecasts are expressions of opinion and are subject to change without notice and are not intended to be a guarantee of future events. Charts and tables are for illustrative purposes only. Refer to Important Information at the end of this presentation.
Global GDP and Inflation Rates
2014F 2015F 2016F 2014F 2015F 2016F
Global 2.7% 2.7% 3.5% 2.6% 2.0% 2.6%Based on PPP 3.4% 3.2% 4.0% 3.3% 3.1% 3.5%Industrial Countries 1.7% 2.0% 2.5% 1.4% 0.3% 1.7%United States 2.4% 2.6% 2.9% 1.3% 0.5% 1.8%Japan 0.0% 0.7% 2.1% 2.7% 0.4% 1.0%Euro Area 0.9% 1.5% 2.1% 0.4% 0.2% 1.5%United Kingdom 2.8% 2.6% 3.0% 1.5% 0.4% 1.5%Emerging Markets 4.3% 3.8% 4.8% 4.3% 4.5% 4.0%China 7.4% 6.9% 6.7% 2.0% 1.5% 1.9%India 7.4% 8.1% 8.4% 5.9% 5.0% 5.0%Korea 3.3% 3.1% 3.5% 1.3% 1.2% 2.3%Russia 0.6% -3.0% 1.6% 7.8% 14.2% 7.4%Brazil 0.1% -1.0% 0.7% 6.3% 8.0% 6.1%Mexico 2.1% 2.8% 3.5% 4.0% 3.2% 3.8%Source: Citi Research, 29 April 2015
GDP Growth CPI Inflation
3

Monetary Policy View Abundant Liquidity… But Who Benefits From More Intervention?
Charts are for illustrative purposes only. Refer to Important Information at the end of this presentation. Bloomberg charts as of 29 April 2015.
0%
10%
20%
30%
40%
50%
60%
70%
Mar 01 Mar 03 Mar 05 Mar 07 Mar 09 Mar 11 Mar 13 Mar 15
US Japan Europe UK
Central Bank Balance Sheet(as a percent of GDP)
Source: Bloomberg and Citi WMLA
4

Monetary Policy View Low Rates for How Long? Time to Lock in Rates
Charts are for illustrative purposes only. Refer to Important Information at the end of this presentation. Bloomberg charts as of 29 April 2015.
0
5
10
15
20
Apr 75 Apr 80 Apr 85 Apr 90 Apr 95 Apr 00 Apr 05 Apr 10 Apr 15
US Treasury 10-Year (%) Fed Funds Target (%)
Source: Bloomberg
Short and Long Rates(in percent)
5
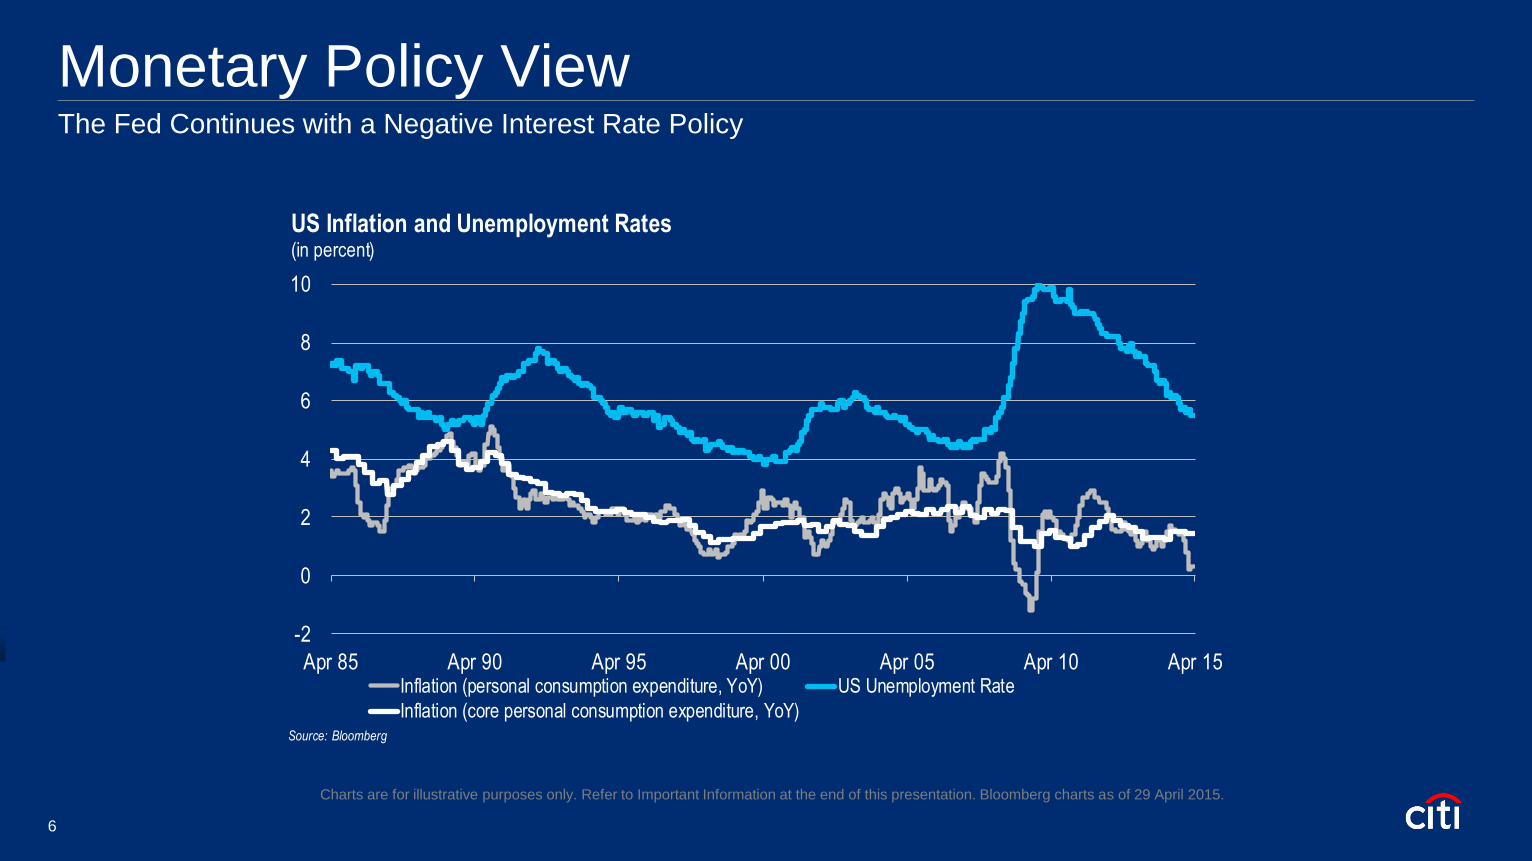
Monetary Policy View The Fed Continues with a Negative Interest Rate Policy
Charts are for illustrative purposes only. Refer to Important Information at the end of this presentation. Bloomberg charts as of 29 April 2015.
-2
0
2
4
6
8
10
Apr 85 Apr 90 Apr 95 Apr 00 Apr 05 Apr 10 Apr 15Inflation (personal consumption expenditure, YoY) US Unemployment Rate
Inflation (core personal consumption expenditure, YoY)Source: Bloomberg
US Inflation and Unemployment Rates(in percent)
6

US Monetary Policy
When will the Fed start to raise interest rates?
A.June 2015
B.September 2015
C.December 2015
D.March 2016 or later
7
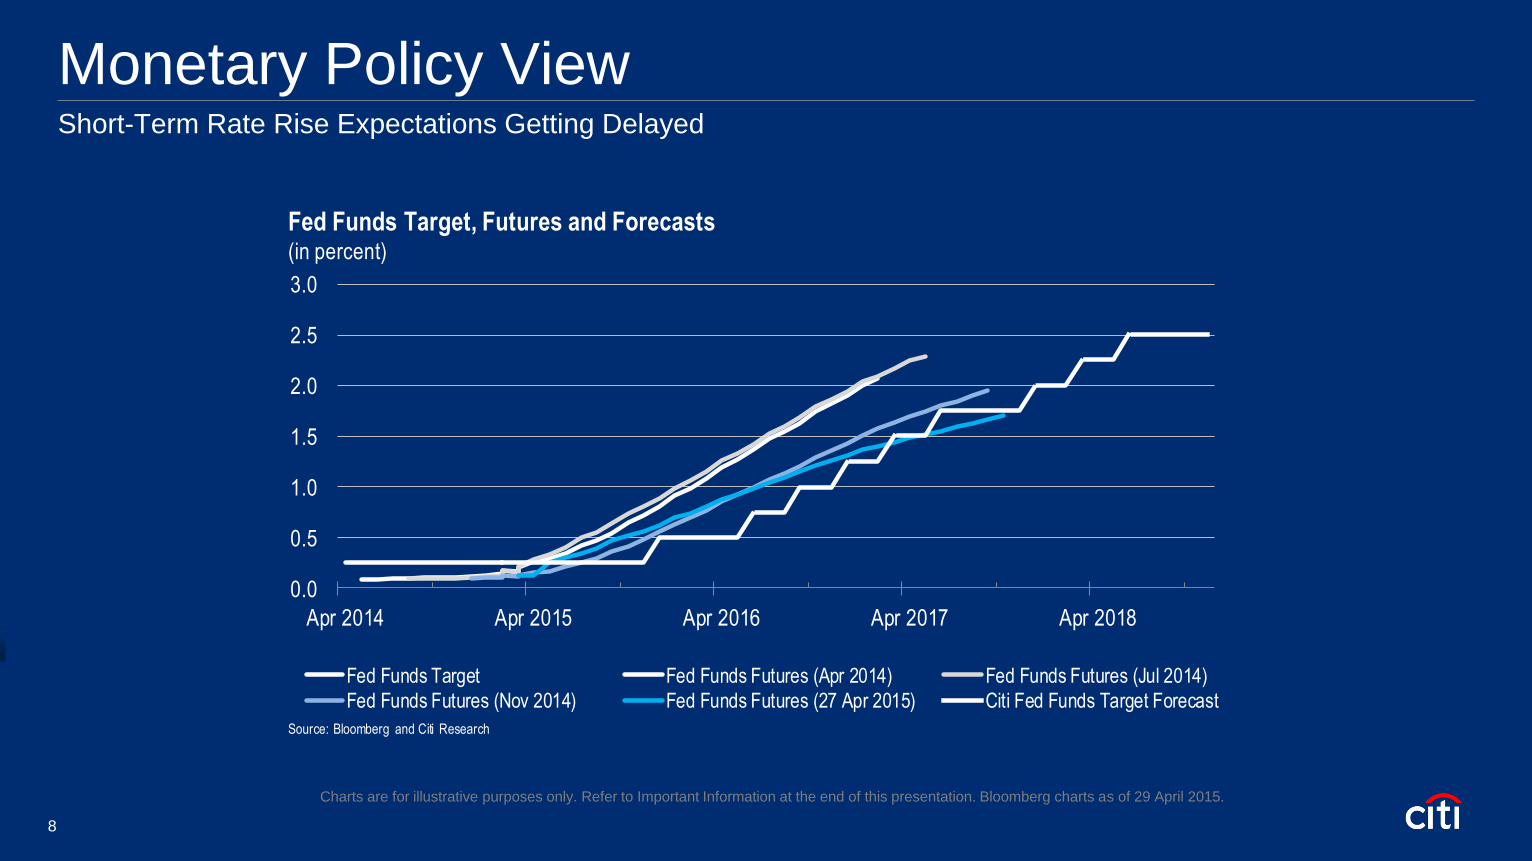
Monetary Policy View Short-Term Rate Rise Expectations Getting Delayed
0.0
0.5
1.0
1.5
2.0
2.5
3.0
Apr 2014 Apr 2015 Apr 2016 Apr 2017 Apr 2018
Fed Funds Target Fed Funds Futures (Apr 2014) Fed Funds Futures (Jul 2014)
Fed Funds Futures (Nov 2014) Fed Funds Futures (27 Apr 2015) Citi Fed Funds Target Forecast
Fed Funds Target, Futures and Forecasts(in percent)
Source: Bloomberg and Citi Research
Charts are for illustrative purposes only. Refer to Important Information at the end of this presentation. Bloomberg charts as of 29 April 2015.
8

European 10-Year Yields Lower Than US Euro: One Currency, One Central Bank… But Varying Costs of Capital
0
1
2
3
4
5
6
Apr 13 Jul 13 Oct 13 Jan 14 Apr 14 Jul 14 Oct 14 Jan 15 Apr 15
US UK Germany Italy France Spain
Ten-Year Yields(in percent)
Source: Bloomberg
Charts are for illustrative purposes only. Refer to Important Information at the end of this presentation. Bloomberg charts as of 29 April 2015.
9
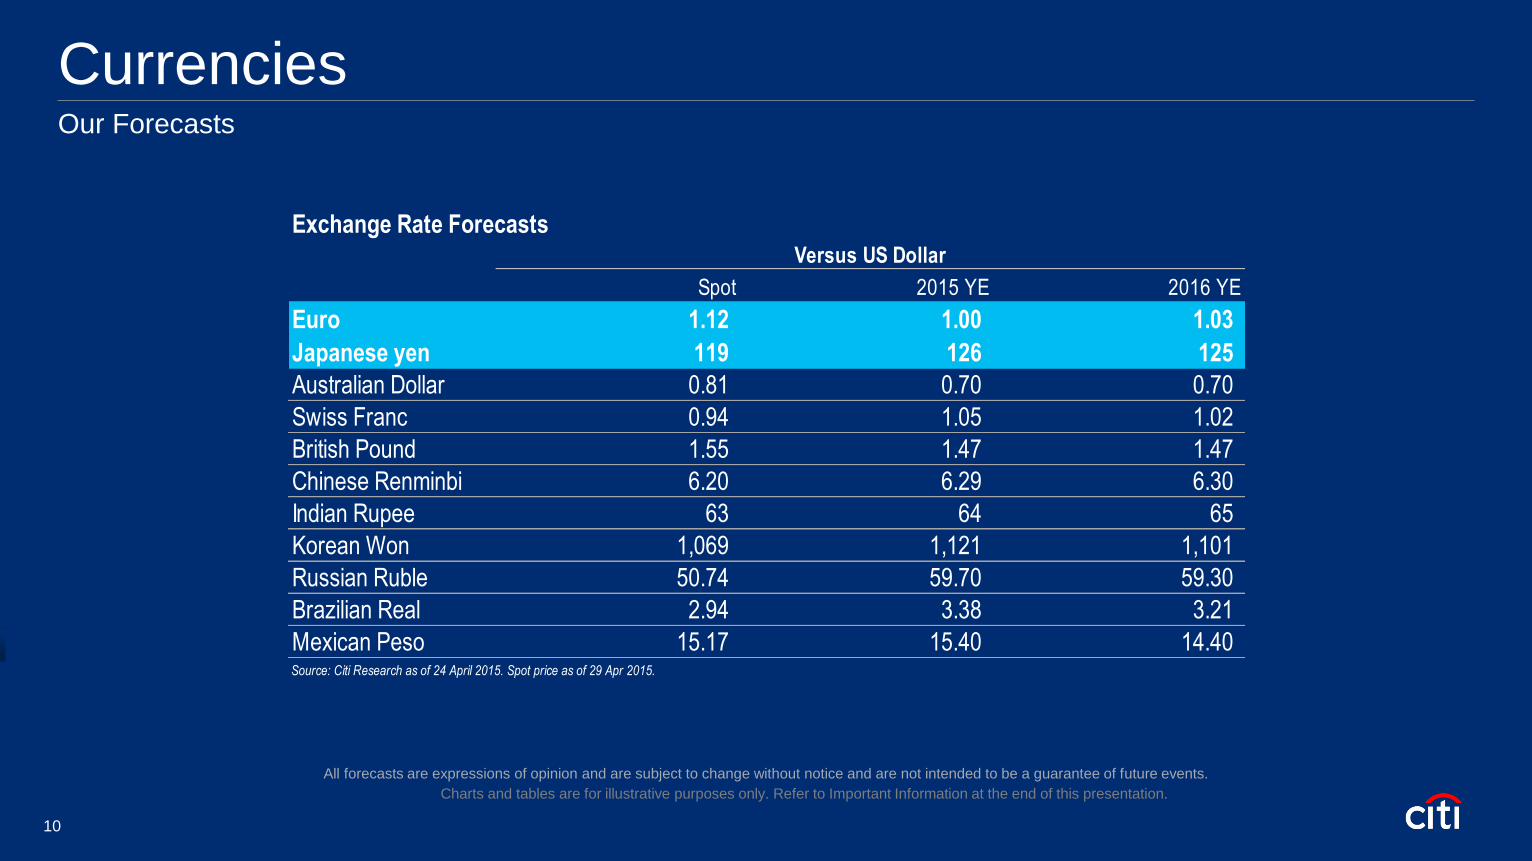
Currencies Our Forecasts
Charts and tables are for illustrative purposes only. Refer to Important Information at the end of this presentation.
All forecasts are expressions of opinion and are subject to change without notice and are not intended to be a guarantee of future events.
Exchange Rate Forecasts
Spot 2015 YE 2016 YE
Euro 1.12 1.00 1.03
Japanese yen 119 126 125
Australian Dollar 0.81 0.70 0.70
Swiss Franc 0.94 1.05 1.02
British Pound 1.55 1.47 1.47
Chinese Renminbi 6.20 6.29 6.30
Indian Rupee 63 64 65
Korean Won 1,069 1,121 1,101
Russian Ruble 50.74 59.70 59.30
Brazilian Real 2.94 3.38 3.21
Mexican Peso 15.17 15.40 14.40 Source: Citi Research as of 24 April 2015. Spot price as of 29 Apr 2015.
Versus US Dollar
10
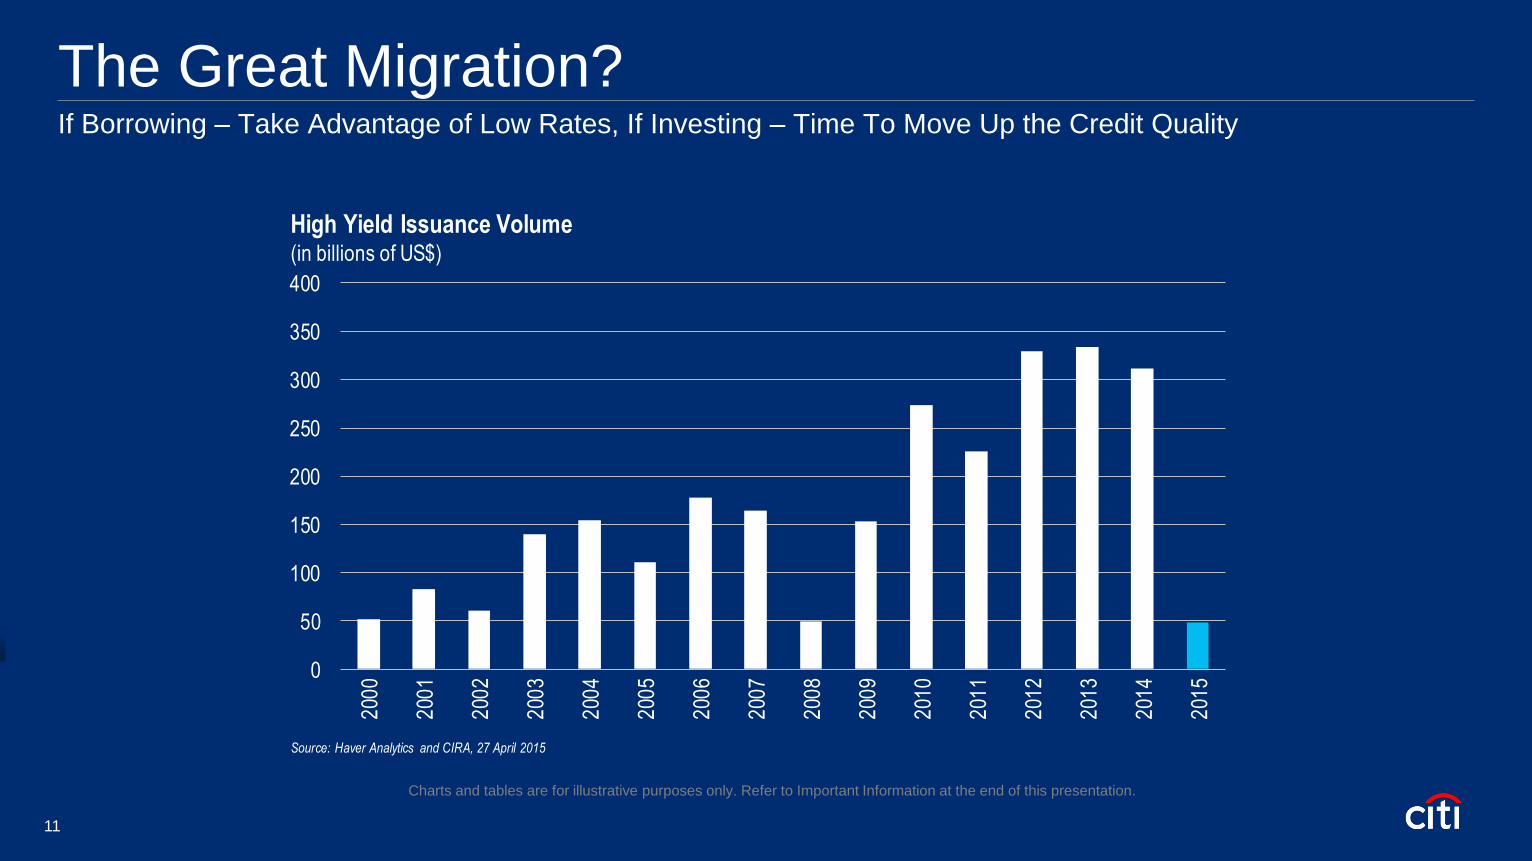
The Great Migration? If Borrowing – Take Advantage of Low Rates, If Investing – Time To Move Up the Credit Quality
Charts and tables are for illustrative purposes only. Refer to Important Information at the end of this presentation.
0
50
100
150
200
250
300
350
400
200
0
200
1
200
2
200
3
200
4
200
5
200
6
200
7
200
8
200
9
201
0
201
1
201
2
201
3
201
4
201
5
Source: Haver Analytics and CIRA, 27 April 2015
High Yield Issuance Volume(in billions of US$)
11

Global Oil Prices WTI Prices Trading Lower Than Brent – How Low Can It Go?
All forecasts are expressions of opinion and are subject to change without notice and are not intended to be a guarantee of future events. Charts are for illustrative purposes only. Refer to Important Information at the
end of this presentation. Bloomberg charts as of 29 April 2015.
30
50
70
90
110
130
150
May 05 May 07 May 09 May 11 May 13 May 15
WTI Brent
Source: Bloomberg
Global Crude Oil Prices(in US$ per barrel)
12

US Energy Supply and Demand The US Could Create a Surplus of Over 3 Million Barrels Per Day by the Year 2020
0
2
4
6
8
10
12
14
Apr 1975 Apr 1985 Apr 1995 Apr 2005 Apr 2015
Oil Production Net US Oil Imports Natural Gas ProductionSource: Citi Research, Bloomberg.
US Oil Production, Net Oil Imports and Natural Gas Production(in millions of barrels per day or equivalents)
Forecasts
All forecasts are expressions of opinion and are subject to change without notice and are not intended to be a guarantee of future events. Charts are for illustrative purposes only. Refer to Important Information at the
end of this presentation. Bloomberg charts as of 29 April 2015.
13

Commodities How Low Can Prices Go?
Charts are for illustrative purposes only. Refer to Important Information at the end of this presentation. Chart as of February 12, 2015.
Citi Commodity Price ForecastsSpot 1Q15 2Q15 3Q15 4Q15 1Q16 2Q16 3Q16 4Q16
Energy
WTI Crude USD/bl 58.71 49 45 45 57 60 56 63 66
Brent Crude USD/bl 66.42 55 55 55 65 67 65 70 75
Natural Gas (USD/MMBtu) 2.60 2.90 2.50 2.60 2.70 2.80 2.90 3.00 3.10
Base Metals
LME Aluminium USD/mt 1,874 1,813 1,780 1,820 1,830 1,850 1,870 1,930 1,950
LME Copper USD/mt 6,118 5,790 6,300 6,600 7,000 7,100 7,250 7,450 7,700
LME Nickel USD/mt 13,445 14,400 14,300 16,000 17,520 19,500 21,000 22,000 23,000
Bulk Commodities
Iron Ore Spot (TSI) USD/mt 59.30 61 44 36 38 42 39 37 40
Precious Metals
Gold USD/oz 1211.23 1,219 1,200 1,180 1,170 1,180 1,205 1,220 1,225
Silver USD/oz 16.72 16.70 16.20 16.20 15.80 15.90 16.20 16.40 16.50
Platinum USD/oz 1161.30 1,195 1,175 1,235 1,250 1,250 1,280 1,325 1,350
Agriculture
Corn (USd/bu) 362.50 385 365 380 370 400 415 425 400
Wheat (USd/bu) 475 524 530 540 530 545 550 550 530
Source: Citi Research 29 April 2015. Estimates are period averages.
14

Charts and tables are for illustrative purposes only. Refer to Important Information at the end of this presentation.
0
2
4
6
8
10
12
14
16
18
20
Mar 07 Mar 08 Mar 09 Mar 10 Mar 11 Mar 12 Mar 13 Mar 14 Mar 15
US Europe Japan
Global Natural Gas Prices(in US$ per million BTU)
Source: World Bank as of 7 April 2015
Natural Gas Prices The US Competitive Advantage
15

Equity Market
How much wealth (Market Cap in US$) has the US Equity Market
generated from the lows of 2009 through today?
A.Less than $1Tn
B.Between $1Tn and $5Tn
C.Between $5Tn and $10Tn
D.Over $10Tn
16

US Equity Market The Wealth Effect: $15 Trillion Gain in Wealth Created Since March 2009
$6,000
$8,000
$10,000
$12,000
$14,000
$16,000
$18,000
$20,000
$22,000
$24,000
Mar 09 Sep 09 Mar 10 Sep 10 Mar 11 Sep 11 Mar 12 Sep 12 Mar 13 Sep 13 Mar 14 Sep 14 Mar 15
Source: Bloomberg
Wilshire 5000 Index(in billions of dollars)
Charts are for illustrative purposes only. Refer to Important Information at the end of this presentation. Bloomberg charts as of 29 April 2015.
17

Equity Market From Fast Rally to Grind Higher - Focused on Earnings Growth
Charts are for illustrative purposes only. Refer to Important Information at the end of this presentation. Bloomberg charts as of 29 April 2015.
100
140
180
220
260
300
340
Mar 09 Mar 10 Mar 11 Mar 12 Mar 13 Mar 14 Mar 15
S&P 500 Index MSCI Emerging Markets Index STOXX Europe 600 IndexSource: Bloomberg
Emerging and Developed Markets Equity Indexes(indexed to 100)
18

US Bank Loans Have Room to Improve Supply and Demand Should Normalize With Improving Macroeconomic Conditions
Charts are for illustrative purposes only. Refer to Important Information at the end of this presentation. Bloomberg charts as of 29 April 2015.
0
1
2
3
4
5
6
7
8
9
Apr 93 Apr 95 Apr 97 Apr 99 Apr 01 Apr 03 Apr 05 Apr 07 Apr 09 Apr 11 Apr 13 Apr 15
Tho
usan
ds
Commercial and Industrial Real Estate Consumer OtherSource: Federal Reserve via Bloomberg
US Commercial Banks Assets & Liabilities: Loans and Leases in Bank Credit(Seasonally adjusted, trillions of US$)
19

Household Net Worth Near Historical Highs Reflect Recovery of Equity and Real Estate Markets
-3.0%
-1.5%
0.0%
1.5%
3.0%
4.5%
6.0%
$30
$40
$50
$60
$70
$80
$90
2001Q3 2003Q1 2004Q3 2006Q1 2007Q3 2009Q1 2010Q3 2012Q1 2013Q3 2015Q1
Hun
dre
ds
Mill
ions
Net Worth (LHS) US Real Personal Consumption Expenditure, YoY% (RHS)Source: Federal Reserve Bank of NY and Bloomberg.
Household Net Worth(in trillions of US$ and percent)
Charts are for illustrative purposes only. Refer to Important Information at the end of this presentation. Bloomberg charts as of 29 April 2015.
20

A Housing Bottom Prices Have Adjusted
Charts and tables are for illustrative purposes only. Refer to Important Information at the end of this presentation.
0
25
50
75
100
125
150
175
200
225
Apr 90 Apr 95 Apr 00 Apr 05 Apr 10 Apr 15
US S&P/Case-Shiller National Home Price Index US S&P/Case-Shiller 20-City Home Price Index
Source: DataStream, 28 April 2015
US S&P/Case-Shiller National Home Price Index(seasonally adjusted)
21

China’s Growing Appetite Strong Growth Over the Past Two Decades Highlights the Need for Basic Consumer Goods
Charts are for illustrative purposes only. Refer to Important Information at the end of this presentation.
$0
$1,000
$2,000
$3,000
$4,000
$5,000
$6,000
$7,000
1965 1975 1985 1995 2005 2015
China Per Capita Gross National Income(in USD)
Source: World Bank as of 30 March 2015
22

Eurozone Debt – Why Worry? Growth, Inflation and Structural Changes Are Needed to Lower Debt Levels
Note: Debt outstanding includes bonds, loans principal and interest.
Source: Citi Research and IMF as of 22 January 2015
Charts and tables are for illustrative purposes only. Refer to Important Information at the end of this presentation.
Japan
$9.2Tn
127.1Mn
247%
US
$14 .7Tn
318.5Mn
106%
Italy
$2.5Tn
60.0Mn
132%
Spain
$1.3Tn
46.5Mn
100%
Greece
$359Bn
11.0Mn
178%
Ireland
$245Bn
4.8Mn
110%
UK
$3.2Tn
64.5Mn
91%
Portugal
$262Bn
10.5Mn
127%
Debt Outstanding* (April 2015)
Population (2014)
Debt/GDP (2015)
23

LatAm Macroeconomics GDP, CPI, and Current Account
Charts and tables are for illustrative purposes only. Refer to Important Information at the end of this presentation. All forecasts are expressions of opinion and are subject to change without notice and are not intended to be a guarantee of future events.
2014F 2015F 2016F 2014F 2015F 2016F 2014F 2015F 2016F
Latin America 0.8% 0.4% 1.9% 7.4% 8.9% 8.2% -2.8% -3.6% -3.5%
Argentina -2.9% -2.5% 0.5% 38.0% 33.3% 35.0% -0.9% -1.7% -1.7%
Brazil 0.1% -1.0% 0.7% 6.3% 8.0% 6.1% -3.9% -4.4% -4.2%
Chile 1.9% 2.5% 4.0% 4.4% 3.8% 3.2% -1.2% -1.2% -2.1%
Colombia 4.6% 3.2% 3.0% 3.5% 3.6% 3.0% -5.3% -5.9% -5.7%
Mexico 2.1% 2.8% 3.5% 4.0% 3.2% 3.8% -2.1% -3.8% -3.6%
Peru 2.4% 3.8% 4.6% 3.2% 3.0% 2.7% -4.0% -4.6% -5.9%
Venezuela -4.0% -7.5% -5.6% 57.7% 86.9% 99.2% 6.1% -8.3% -0.4%Source: Citi Research as of 29 April 2015
LatAm Key Indicators
GDP Growth CPI Inflation Current Account
24
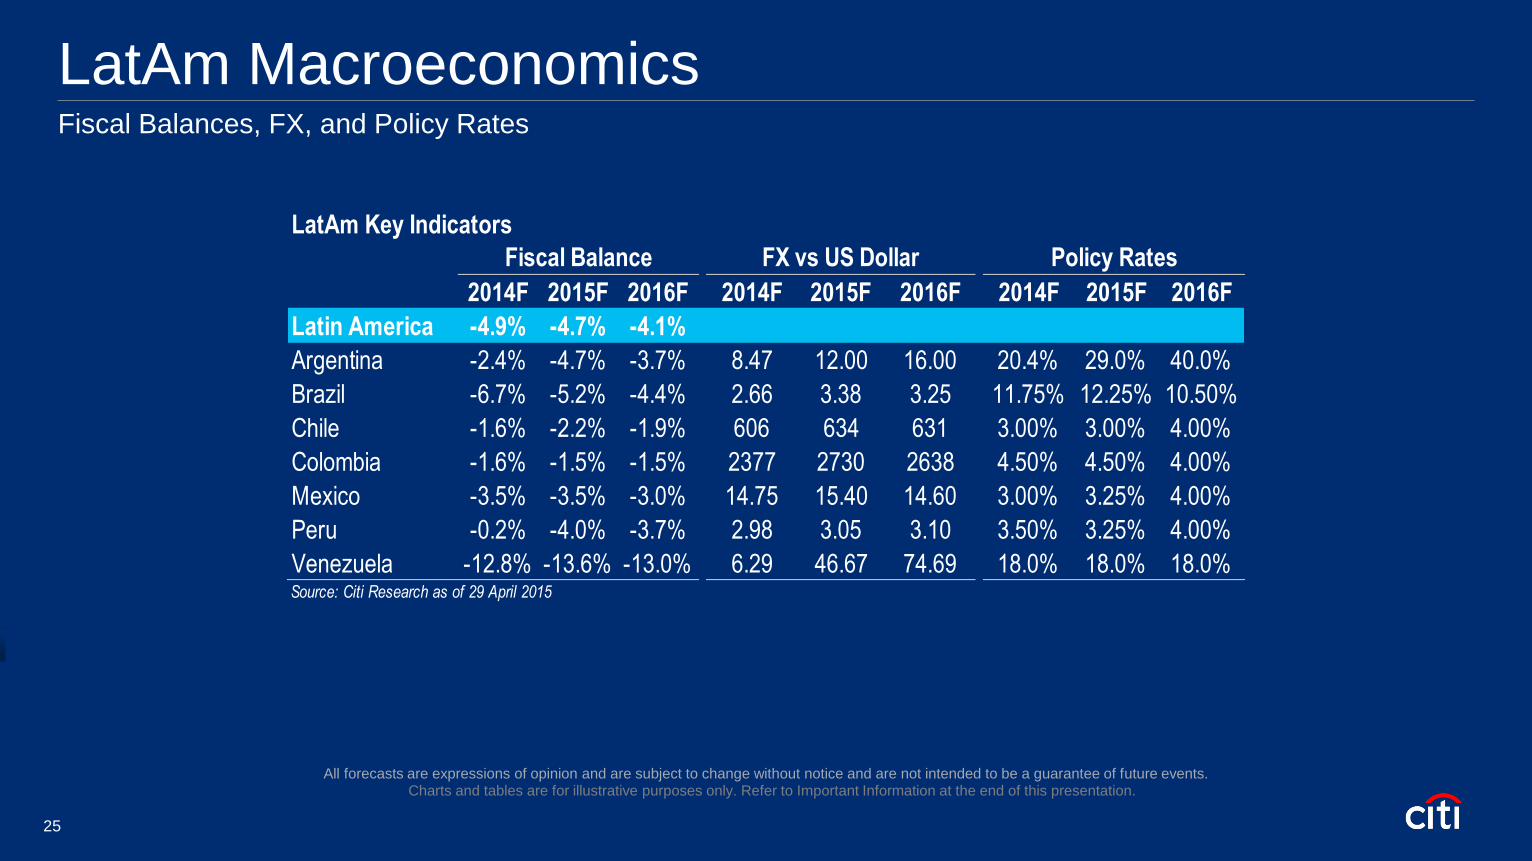
LatAm Macroeconomics Fiscal Balances, FX, and Policy Rates
Charts and tables are for illustrative purposes only. Refer to Important Information at the end of this presentation. All forecasts are expressions of opinion and are subject to change without notice and are not intended to be a guarantee of future events.
LatAm Key Indicators
2014F 2015F 2016F 2014F 2015F 2016F 2014F 2015F 2016F
Latin America -4.9% -4.7% -4.1%
Argentina -2.4% -4.7% -3.7% 8.47 12.00 16.00 20.4% 29.0% 40.0%
Brazil -6.7% -5.2% -4.4% 2.66 3.38 3.25 11.75% 12.25% 10.50%
Chile -1.6% -2.2% -1.9% 606 634 631 3.00% 3.00% 4.00%
Colombia -1.6% -1.5% -1.5% 2377 2730 2638 4.50% 4.50% 4.00%
Mexico -3.5% -3.5% -3.0% 14.75 15.40 14.60 3.00% 3.25% 4.00%
Peru -0.2% -4.0% -3.7% 2.98 3.05 3.10 3.50% 3.25% 4.00%
Venezuela -12.8% -13.6% -13.0% 6.29 46.67 74.69 18.0% 18.0% 18.0%Source: Citi Research as of 29 April 2015
Fiscal Balance FX vs US Dollar Policy Rates
25
My company is planning to ________ investment in Latin America?
A. Increase
B. Maintain (Neutral)
C. Decrease
26
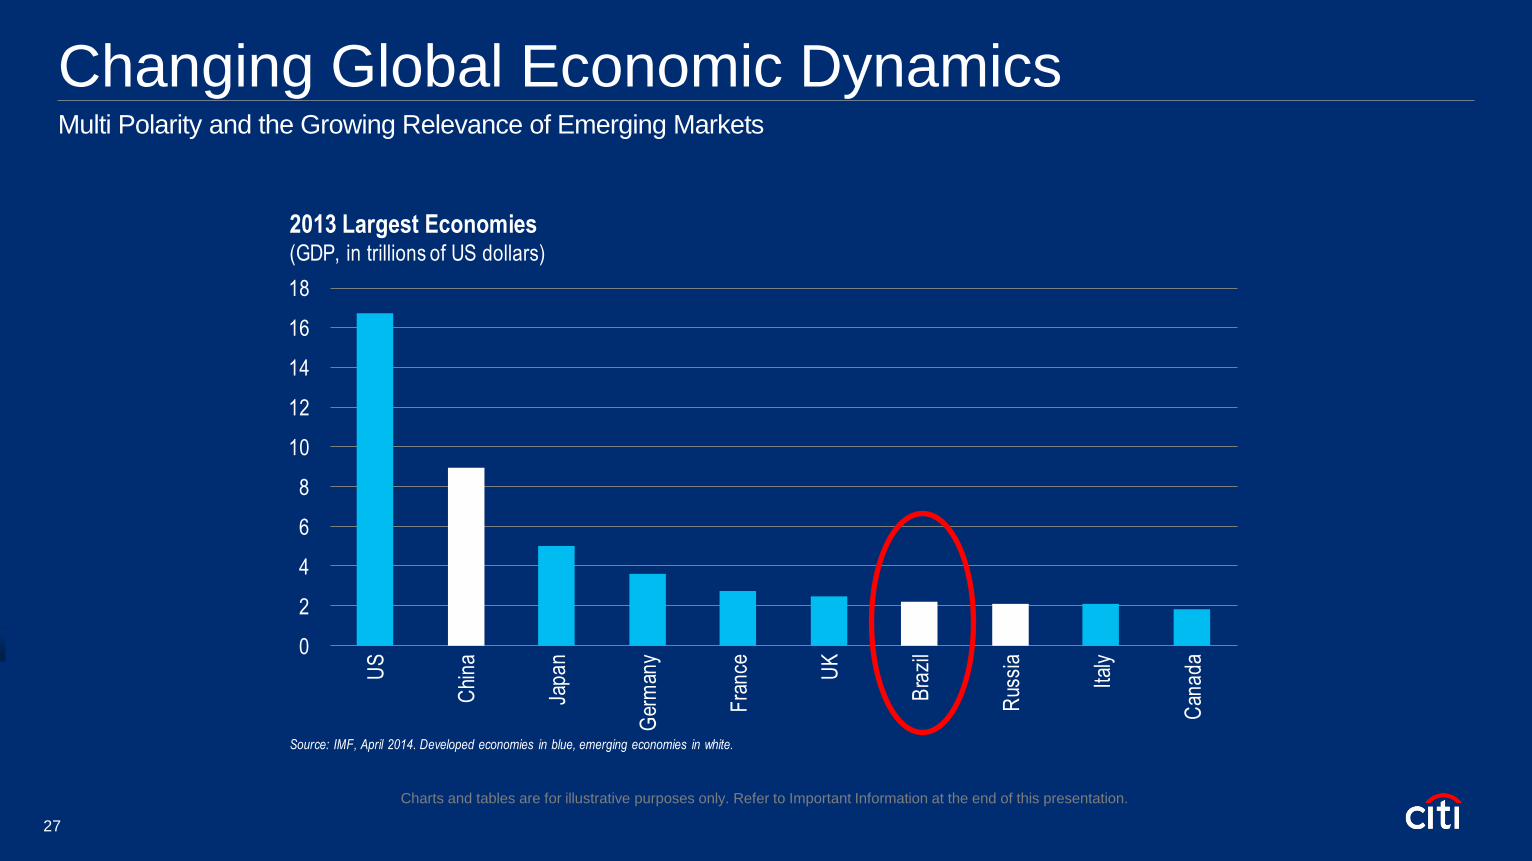
Changing Global Economic Dynamics Multi Polarity and the Growing Relevance of Emerging Markets
Charts and tables are for illustrative purposes only. Refer to Important Information at the end of this presentation.
0
2
4
6
8
10
12
14
16
18
US
Chi
na
Jap
an
Ger
man
y
Fra
nce UK
Bra
zil
Rus
sia
Ital
y
Can
ad
a
Source: IMF, April 2014. Developed economies in blue, emerging economies in white.
2013 Largest Economies(GDP, in trillions of US dollars)
27

Changing Global Economic Dynamics Multi Polarity and the Growing Relevance of Emerging Markets
Charts and tables are for illustrative purposes only. Refer to Important Information at the end of this presentation.
0
20
40
60
80
100
120
US
Chi
na
Indi
a
Jap
an
Ger
man
y
UK
Rus
sia
Fra
nce
Bra
zil
Mex
ico
Source: CIRA, 1 December 2014, Developing economies in white, developed economies in blue.
2025 Top Ten Largest Economies in the World(US indexed to 100)
28
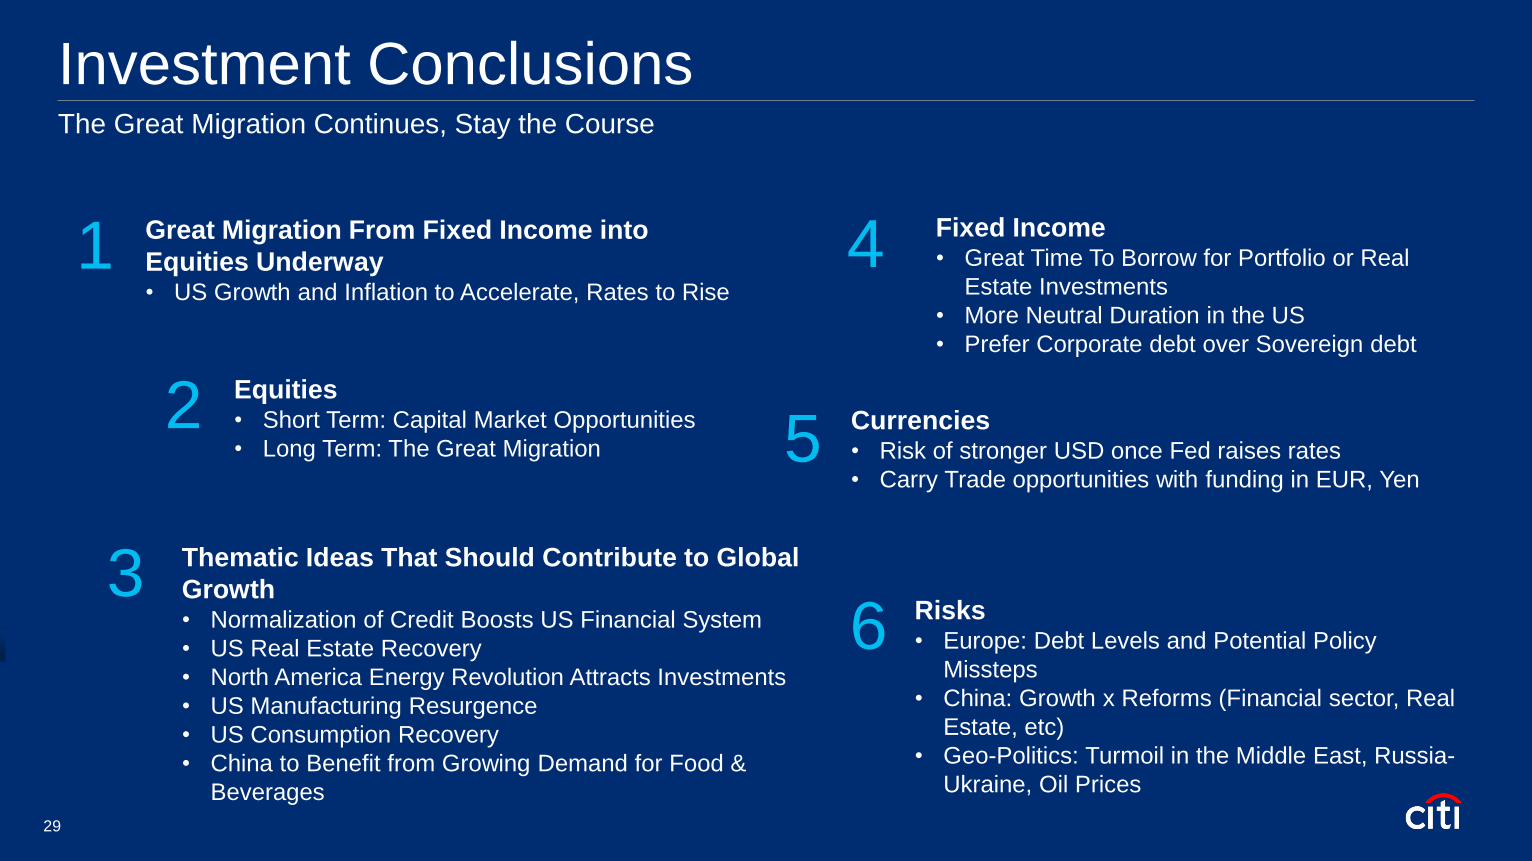
Investment Conclusions The Great Migration Continues, Stay the Course
Great Migration From Fixed Income into
Equities Underway • US Growth and Inflation to Accelerate, Rates to Rise
1
Thematic Ideas That Should Contribute to Global
Growth • Normalization of Credit Boosts US Financial System
• US Real Estate Recovery
• North America Energy Revolution Attracts Investments
• US Manufacturing Resurgence
• US Consumption Recovery
• China to Benefit from Growing Demand for Food &
Beverages
3
Currencies • Risk of stronger USD once Fed raises rates
• Carry Trade opportunities with funding in EUR, Yen 5
Equities • Short Term: Capital Market Opportunities
• Long Term: The Great Migration
2
Fixed Income • Great Time To Borrow for Portfolio or Real
Estate Investments
• More Neutral Duration in the US
• Prefer Corporate debt over Sovereign debt
4
Risks • Europe: Debt Levels and Potential Policy
Missteps
• China: Growth x Reforms (Financial sector, Real
Estate, etc)
• Geo-Politics: Turmoil in the Middle East, Russia-
Ukraine, Oil Prices
6
29

Glossary
Brazilian Bovespa: The Bovespa Index is a gross total return index weighted by traded volume and is comprised of the most liquid stocks traded on the Sao Paulo Exchange. The Bovespa Index has been
divided 10 times by a factor of 10 since Jan 1, 1985: 12/02/85, 08/29/88, 04/14/89, 01/12/90, 05/28/91, 01/21/92, 01/26/93, 08/27/93, 02/10/94, and 03/03/97.
Citigroup Global Markets High Yield Market Index: The High-Yield Market Index includes cash-pay, deferred-interest, and Rule 144A bonds with remaining maturities of at least one year and a minimum
amount outstanding of $100 million. The issuers must be domiciled in the United States or Canada for consideration in this index.
Citigroup Global Emerging Market Sovereign Bond Index: The Global Emerging Market Sovereign Bond Index (ESBI) includes Brady bonds and US dollar-denominated emerging market sovereign debt
issued in the global, Yankee, and Eurodollar markets excluding loans. The ESBI offers diversification benefits with respect to the geographical and asset class dimensions. It comprises debt in Africa, Asia,
Europe, and Latin America.
CPI Inflation: Consumer Price Index (CPI) - The CPI, as it is called, measures the prices of consumer goods and services and is a measure of the pace of US inflation. The US Department of Labor publishes
the CPI every month.
Current Balance: The difference between the nation's total exports of goods, services and transfers and its total imports of them. Current account balance calculations exclude transactions in financial assets
and liabilities.
Currency Abbreviations: AUD: Australia; NZD: New Zealand; NOK: Norway; GBP: UK; EUR: Euro Zone; SEK: Sweden; CAD: Canada; CHF: Switzerland; JPY: Japan; ZAR: South Africa; PLN: Poland; BRL:
Brazil; RUB: Russia; KRW: Korea; TRY: Turkey; MXN: Mexico; CNY: China; INR: India
DJIA: Dow Jones Industrial Average - The best known U.S. index of stocks. A price-weighted average of 30 actively traded blue-chip stocks, primarily industrials including stocks that trade on the New York
Stock Exchange. The Dow, as it is called, is a barometer of how shares of the largest US companies are performing.
DXY Index: The DXY Index represents a basket of currencies, giving a price level for the US dollar.
Event Driven: In the context of hedge funds, a style of management that combines many different types of hedge fund investing such as merger arbitrage, distressed securities and high yield investing, in
conjunction with an important "event" that is supposed to unlock firm value (like a merger announcement, earnings announcement, or a regulator decision).
Fiscal Balance: The Fiscal Balance represents the difference between General Government revenues over expenses. It includes capital expenditure, but excludes depreciation.
Global Macro: Directional Macro strategies frequently employ leverage and may trade futures, options on future contracts and foreign exchange contracts as well as trade in diversified markets or focus on
one market sector. Two types of strategies employed by directional macro managers are discretionary and systematic trading.
Gross Domestic Product (GDP): Gross domestic product (GDP) is the market value of all officially recognized final goods and services produced within a country in a year, or other given period of time.
Industrial Production: Measures the output of the industrial sector of an economy. The industrial sector includes manufacturing, mining, and utilities.
LIBOR: London Interbank Offered Rate - A short-term interest rate often quoted as a 1,3,6-month rate for U.S. dollars.
Managed Futures: In the context of hedge funds, a style of management that focuses on short-term trading in the futures market.
Mexican Bolsa: A capitalization weighted index of the leading stocks traded on the Mexican Stock Exchange. The index was developed with a base level of .78 as of October 30, 1978.

Glossary (Cont’d)
MSCI World Consumer Discretionary Price Index: An index measuring the performance of the Consumer Discretionary equities of developed countries including U.S.; a useful benchmark for global funds.
MSCI World Free Index: An index measuring the performance of equities of developed and EM countries; a useful benchmark for global funds.
Nikkei 225 Index: Applies mainly to international equities. Price-weighted average of 225 stocks of the first section of the Tokyo Stock Exchange started on May 16, 1949. Japanese equivalent of the US Dow.
Repo rate: A repo is a repurchase agreement. A procedure for borrowing money by selling securities to a counterparty and agreeing to buy them back later at a slightly higher price based on a rate of interest
called the repo rate.
Russell Mid-Cap Index: A market capitalization-weighted benchmark index made up of the 800 smallest US companies in the Russell 1000.
Russell Top 200 Growth Index: A market capitalization-weighted benchmark index made up of the largest 200 US companies by market cap that exhibit growth characteristics.
Russell Top 200 Value Index: A market capitalization-weighted benchmark index made up of the largest 200 US companies by market cap that exhibit value characteristics.
Russell 2000 Index: A market capitalization-weighted benchmark index made up of the 2000 smallest US companies in the Russell 3000.
S&P/ Case-Shiller US National is the broadest national measurement of home prices, with coverage going beyond the 20 MSAs that make up the composites.
S&P/Case-Shiller Composite-20 Home Price Index reflects price changes for Atlanta, Charlotte, Cleveland, Dallas, Detroit, Minneapolis, Phoenix, Portland, Seattle, Tampa, Boston, Chicago, Denver, Las
Vegas, Los Angeles, Miami, New York, San Diego, San Francisco and Washington DC. In addition to those 10 markets.
S&P 400 Index: A market capitalization-weighted benchmark index made up of 400 securities with market values between $200 million and $5 billion
S&P 500 Index: Index of 500 widely held common stocks that measures the general performance of the market.
VIX Index: The Chicago Board Options Exchange SPX Volatility Index reflects a market estimate of future volatility, based on the weighted average of the implied volatilities for a wide range of strikes 1st & 2nd
month expirations are used until 8 day from expiration, then the 2nd and 3rd are used.
U.S. Treasuries: Interest-bearing obligations if the U.S. government issued by the U.S. Department of the Treasury as a means of borrowing money to meet government expenditures not covered by tax
revenues. There are three types of marketable Treasury securities-bills, notes and bonds.
U.S. Investment-Grade Bonds: A bond that is assigned a rating in the top four categories by commercial credit rating companies. S&P classifies investment-grade bonds as BBB or higher, and Moody's
classifies investment grade bonds as BAA or higher. Related: High-yield bond.
U.S. High Yield Bonds: A bond with a speculative credit rating of BB (S&P) or BA (Moody's) or lower. Junk or high-yield bonds offer investors higher yields than bonds of financially sound companies. Two
agencies, Standard & Poors and Moody's Investor Services, provide the rating systems for companies' credit.
Wilshire 5000 Index: Measures the performance of all US equity securities with readily available price data. Over 5,000 capitalization weighted security returns are used to adhust the index. The Wilshire 5000
base is its 12/31/1980 capitalization of $1,404.596 billion.
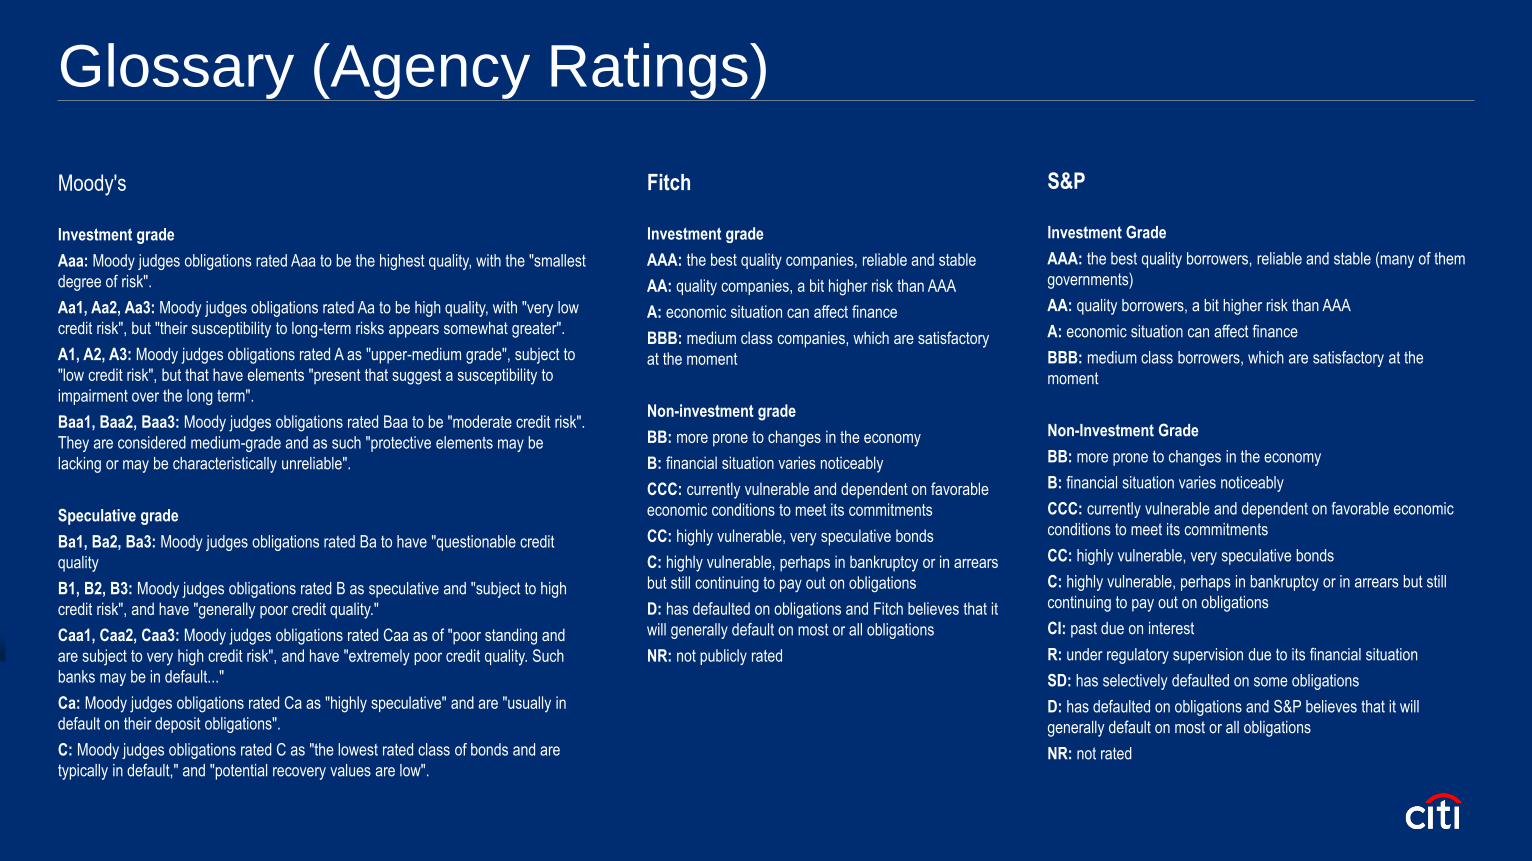
Glossary (Agency Ratings)
Moody's
Investment grade
Aaa: Moody judges obligations rated Aaa to be the highest quality, with the "smallest
degree of risk".
Aa1, Aa2, Aa3: Moody judges obligations rated Aa to be high quality, with "very low
credit risk", but "their susceptibility to long-term risks appears somewhat greater".
A1, A2, A3: Moody judges obligations rated A as "upper-medium grade", subject to
"low credit risk", but that have elements "present that suggest a susceptibility to
impairment over the long term".
Baa1, Baa2, Baa3: Moody judges obligations rated Baa to be "moderate credit risk".
They are considered medium-grade and as such "protective elements may be
lacking or may be characteristically unreliable".
Speculative grade
Ba1, Ba2, Ba3: Moody judges obligations rated Ba to have "questionable credit
quality
B1, B2, B3: Moody judges obligations rated B as speculative and "subject to high
credit risk", and have "generally poor credit quality."
Caa1, Caa2, Caa3: Moody judges obligations rated Caa as of "poor standing and
are subject to very high credit risk", and have "extremely poor credit quality. Such
banks may be in default..."
Ca: Moody judges obligations rated Ca as "highly speculative" and are "usually in
default on their deposit obligations".
C: Moody judges obligations rated C as "the lowest rated class of bonds and are
typically in default," and "potential recovery values are low".
S&P
Investment Grade
AAA: the best quality borrowers, reliable and stable (many of them
governments)
AA: quality borrowers, a bit higher risk than AAA
A: economic situation can affect finance
BBB: medium class borrowers, which are satisfactory at the
moment
Non-Investment Grade
BB: more prone to changes in the economy
B: financial situation varies noticeably
CCC: currently vulnerable and dependent on favorable economic
conditions to meet its commitments
CC: highly vulnerable, very speculative bonds
C: highly vulnerable, perhaps in bankruptcy or in arrears but still
continuing to pay out on obligations
CI: past due on interest
R: under regulatory supervision due to its financial situation
SD: has selectively defaulted on some obligations
D: has defaulted on obligations and S&P believes that it will
generally default on most or all obligations
NR: not rated
Fitch
Investment grade
AAA: the best quality companies, reliable and stable
AA: quality companies, a bit higher risk than AAA
A: economic situation can affect finance
BBB: medium class companies, which are satisfactory
at the moment
Non-investment grade
BB: more prone to changes in the economy
B: financial situation varies noticeably
CCC: currently vulnerable and dependent on favorable
economic conditions to meet its commitments
CC: highly vulnerable, very speculative bonds
C: highly vulnerable, perhaps in bankruptcy or in arrears
but still continuing to pay out on obligations
D: has defaulted on obligations and Fitch believes that it
will generally default on most or all obligations
NR: not publicly rated

Important Information In any instance where distribution of this communication (“Communication”) is subject to the rules of the U.S. Commodity Futures Trading
Commission (“CFTC”), this communication constitutes an invitation to consider entering into a derivatives transaction under U.S. CFTC
Regulations §§ 1.71 and 23.605, where applicable, but is not a binding offer to buy/sell any financial instrument.
This Communication is intended for clients of Citi Wealth Management Latin America ("CWMLA") is a division of Citigroup Inc. ("Citigroup") comprised of Citi Private Bank
Latin America ("CPB"), Citigold® Private Client ("CPC"), Citigold® International ("CI") and International Personal Banking ("IPB") in the United States of America and Banca
Patrimonial Banamex ("Banca Patrimonial") and Banca Privada Banamex ("Banca Privada") in Mexico. provides its clients access to a broad array of products and services
available through Citigroup, its bank and non-bank affiliates worldwide (collectively, “Citi”). In the U.S. securities and brokerage products and services are available through
Citi Personal Investments International a business of Citigroup Inc., which offers securities through Citigroup Global Markets Inc. (CGMI), member SIPC, an investment
advisor and broker-dealer registered with the Securities and Exchange Commission. Or through Citi International Financial Services, LLC (CIFS), member FINRA/SIPC, a
broker-dealer registered with the Securities and Exchange Commission that offers brokerage products and services to Non-US residents/citizens. Accounts are carried by
Pershing LLC, member FINRA/NYSE/SIPC. CGMI, CLA, CIFS, Banca Patrimonial, Banca Privada and Citibank, N.A. are affiliated companies under the common control of
Citigroup. Insurance is offered through Citigroup Life Agency LLC (CLA). In California, CLA does business as Citigroup Life Insurance Agency, LLC (license number
0G56746).
Not all products and services are provided by all affiliates, or are available at all locations.
CWMLA personnel are not research analysts, and the information in this Communication is not intended to constitute “research”, as that term is defined by applicable
regulations. Unless otherwise indicated, any reference to a research report or research recommendation is not intended to represent the whole report and is not in itself
considered a recommendation or research report.
This Communication is provided for information and discussion purposes only, at the recipient’s request. The recipient should notify CWMLA
immediately should it at any time wish to cease being provided with such information. Unless otherwise indicated, (i) it does not constitute an offer or
recommendation to purchase or sell any security, financial instrument or other product or service, or to attract any funding or deposits, and (ii) it does not constitute a
solicitation if it is not subject to the rules of the CFTC (but see discussion above regarding communication subject to CFTC rules) and (iii) it is not intended as an official
confirmation of any transaction.
Important Information Unless otherwise expressly indicated, this Communication does not take into account the investment objectives, risk profile or financial situation of any particular person and
as such, investments mentioned in this document may not be suitable for all investors. Citi is not acting as an investment or other advisor, fiduciary or agent. The information
contained herein is not intended to be an exhaustive discussion of the strategies or concepts mentioned herein or tax or legal advice. Recipients of this Communication
should obtain advice based on their own individual circumstances from their own tax, financial, legal and other advisors about the risks and merits of any transaction before
making an investment decision, and only make such decisions on the basis of their own objectives, experience, risk profile and resources.
The information contained in this Communication is based on generally available information and, although obtained from sources believed by Citi to be reliable, its accuracy
and completeness cannot be assured, and such information may be incomplete or condensed. Any assumptions or information contained in this Communication constitute a
judgment only as of the date of this document or on any specified dates and is subject to change without notice. Insofar as this Communication may contain historical and
forward looking information, past performance is neither a guarantee nor an indication of future results, and future results may not meet expectations due to a variety of
economic, market and other factors. Further, any projections of potential risk or return are illustrative and should not be taken as limitations of the maximum possible loss or
gain. Any prices, values or estimates provided in this Communication (other than those that are identified as being historical) are indicative only, may change without notice
and do not represent firm quotes as to either price or size, nor reflect the value Citi may assign a security in its inventory. Forward looking information does not indicate a
level at which Citi is prepared to do a trade and may not account for all relevant assumptions and future conditions. Actual conditions may vary substantially from estimates
which could have a negative impact on the value of an instrument.
Views, opinions and estimates expressed herein may differ from the opinions expressed by other Citi businesses or affiliates, and are not intended to be a forecast of future
events, a guarantee of future results, or investment advice, and are subject to change without notice based on market and other conditions. Citi is under no duty to update
this document and accepts no liability for any loss (whether direct, indirect or consequential) that may arise from any use of the information contained in or derived from this
Communication.
Investments in financial instruments or other products carry significant risk, including the possible loss of the principal amount invested. Financial instruments or other
products denominated in a foreign currency are subject to exchange rate fluctuations, which may have an adverse effect on the price or value of an investment in such
products. This Communication does not purport to identify all risks or material considerations which may be associated with entering into any transaction.

Important Information Structured products can be highly illiquid and are not suitable for all investors. Additional information can be found in the disclosure documents of the issuer for each
respective structured product described herein. Investing in structured products is intended only for experienced and sophisticated investors who are willing and able to bear
the high economic risks of such an investment. Investors should carefully review and consider potential risks before investing.
OTC derivative transactions involve risk and are not suitable for all investors. Investment products are not insured, carry no bank or government guarantee and may lose
value. Before entering into these transactions, you should: (i) ensure that you have obtained and considered relevant information from independent reliable sources
concerning the financial, economic and political conditions of the relevant markets; (ii) determine that you have the necessary knowledge, sophistication and experience in
financial, business and investment matters to be able to evaluate the risks involved, and that you are financially able to bear such risks; and (iii) determine, having
considered the foregoing points, that capital markets transactions are suitable and appropriate for your financial, tax, business and investment objectives.
This material may mention options regulated by the U.S. Securities and Exchange Commission. Before buying or selling options you should obtain and review the current
version of the Options Clearing Corporation booklet, Characteristics and Risks of Standardized Options. A copy of the booklet can be obtained upon request from Citigroup
Global Markets Inc., 390 Greenwich Street, 3rd Floor, New York, NY 10013 or by clicking the following link, http://www.theocc.com/components/docs/riskstoc.pdf
http://www.theocc.com/components/docs/about/publications/november_2012_supplement.pdf
If you buy options, the maximum loss is the premium. If you sell put options, the risk is the entire notional below the strike. If you sell call options, the risk is unlimited. The
actual profit or loss from any trade will depend on the price at which the trades are executed. The prices used herein are historical and may not be available when you order
is entered. Commissions and other transaction costs are not considered in these examples. Option trades in general and these trades in particular may not be appropriate
for every investor. Unless noted otherwise, the source of all graphs and tables in this report is Citi. Because of the importance of tax considerations to all option transactions,
the investor considering options should consult with his/her tax advisor as to how their tax situation is affected by the outcome of contemplated options transactions.
None of the financial instruments or other products mentioned in this Communication (unless expressly stated otherwise) is (i) insured by the Federal Deposit Insurance
Corporation or any other governmental authority, or (ii) deposits or other obligations of, or guaranteed by, Citi or any other insured depository institution.

Important Information
INVESTMENT PRODUCTS: NOT FDIC INSURED – NOT CDIC INSURED – NOT GOVERNMENT INSURED
– NO BANK GUARANTEE – MAY LOSE VALUE
Citi often acts as an issuer of financial instruments and other products, acts as a market maker and trades as principal in many different financial instruments and other
products, and can be expected to perform or seek to perform investment banking and other services for the issuer of such financial instruments or other products. The
author of this Communication may have discussed the information contained therein with others within or outside Citi, and the author and/or such other Citi personnel may
have already acted on the basis of this information (including by trading for Citi's proprietary accounts or communicating the information contained herein to other customers
of Citi). Citi, Citi's personnel (including those with whom the author may have consulted in the preparation of this communication), and other customers of Citi may be long or
short the financial instruments or other products referred to in this Communication, may have acquired such positions at prices and market conditions that are no longer
available, and may have interests different from or adverse to your interests.
IRS Circular 230 Disclosure: Citi and its employees are not in the business of providing, and do not provide, tax or legal advice to any taxpayer outside Citi. Any
statement in this Communication regarding tax matters is not intended or written to be used, and cannot be used or relied upon, by any taxpayer for the purpose of avoiding
tax penalties. Any such taxpayer should seek advice based on the taxpayer’s particular circumstances from an independent tax advisor.
Neither Citi nor any of its affiliates can accept responsibility for the tax treatment of any investment product, whether or not the investment is purchased by a trust or
company administered by an affiliate of Citi. Citi assumes that, before making any commitment to invest, the investor and (where applicable, its beneficial owners) have
taken whatever tax, legal or other advice the investor/beneficial owners consider necessary and have arranged to account for any tax lawfully due on the income or gains
arising from any investment product provided by Citi.
This Communication is for the sole and exclusive use of the intended recipients, and may contain information proprietary to Citi which may not be reproduced or circulated in
whole or in part without Citi’s prior consent. The manner of circulation and distribution may be restricted by law or regulation in certain countries. Persons who come into
possession of this document are required to inform themselves of, and to observe such restrictions. Citi accepts no liability whatsoever for the actions of third parties in this
respect. Any unauthorized use, duplication, or disclosure of this document is prohibited by law and may result in prosecution.
.
Important Information
INVESTMENT PRODUCTS: NOT FDIC INSURED – NOT CDIC INSURED – NOT GOVERNMENT INSURED
– NO BANK GUARANTEE – MAY LOSE VALUE
This communication is issued by a member of the sales and trading department of Citigroup Global Markets Inc. or one of its affiliates. Sales and trading department personnel are not research analysts, and the information in this communication is not intended to constitute “research” as that term is defined by applicable regulations. Unless otherwise indicated, any reference to a research report or research recommendation is not intended to represent the whole report and is not in itself considered a recommendation or research report. All views, opinions and estimates expressed in this communication (i) may change without notice and (ii) may differ from those views, opinions and estimates held or expressed by Citi or other Citi personnel. This communication is provided for information and discussion purposes only. Unless otherwise indicated, (i) it does not constitute an offer or recommendation to purchase or sell any financial instruments or other products, (ii) it does not constitute a solicitation if it is not subject to the rules of the CFTC (but see discussion above regarding communications subject to CFTC rules), and (iii) it is not intended as an official confirmation of any transaction. Unless otherwise expressly indicated, this communication does not take into account the investment objectives or financial situation of any particular person. Citi is not acting as an advisor, fiduciary or agent. Recipients of this communication should obtain advice based on their own individual circumstances from their own tax, financial, legal and other advisors about the risks and merits of any transaction before making an investment decision, and only make such decisions on the basis of the investor's own objectives, experience and resources. The information contained in this communication is based on generally available information and, although obtained from sources believed by Citi to be reliable, its accuracy and completeness cannot be assured, and such information may be incomplete or condensed. Any assumptions or information contained in this document constitute a judgment only as of the date of this document or on any specified dates and is subject to change without notice.
Important Information
INVESTMENT PRODUCTS: NOT FDIC INSURED – NOT CDIC INSURED – NOT GOVERNMENT INSURED
– NO BANK GUARANTEE – MAY LOSE VALUE
Investments in financial instruments or other products carry significant risk, including the possible loss of the principal amount invested. Financial instruments or other products denominated in a foreign currency are subject to exchange rate fluctuations, which may have an adverse effect on the price or value of an investment in such products. This document does not purport to identify all risks or material considerations which may be associated with entering into any transaction. Citi accepts no liability for any loss (whether direct, indirect or consequential) that may arise from any use of the information contained in or derived from this communication. This document may contain historical and forward looking information. Past performance is not a guarantee or indication of future results. Any prices, values or estimates provided in this communication (other than those that are identified as being historical) are indicative only may change without notice and do not represent firm quotes as to either price or size, nor reflect the value Citi may assign a security in its inventory. Forward looking information does not indicate a level at which Citi is prepared to do a trade and may not account for all relevant assumptions and future conditions. Actual conditions may vary substantially from estimates which could have a negative impact on the value of an instrument. You should contact your local representative directly if you are interested in buying or selling any financial instrument or other product or pursuing any trading strategy that may be mentioned in this communication. For additional important information (including a glossary of terms), please visit the following page: http://www.citibank.com/wealthmanagementlatinamerica/homepage/disclosure/disc_EN.htm Products and strategies are not suitable for every investor and may have eligibility requirements that must be met prior to investing. Information in this report has been prepared without taking account of the objectives, financial situation or needs of any particular investor. Accordingly, investors should, before acting on the information, consider its appropriateness, having regard to their objectives, financial situation and needs. Any decision to purchase securities mentioned herein should be made based on a review of your particular circumstances with your Citi investments professional.

Citi believes that sustainability is good business practice. We work closely with our clients, peer financial institutions, NGOs and other partners to finance solutions to climate change, develop industry standards, reduce our own
environmental footprint, and engage with stakeholders to advance shared learning and solutions. Highlights of Citi’s unique role in promoting sustainability include: (a) releasing in 2007 a Climate Change Position Statement, the
first US financial institution to do so; (b) targeting $50 billion over 10 years to address global climate change: includes significant increases in investment and financing of renewable energy, clean technology, and other carbon-
emission reduction activities; (c) committing to an absolute reduction in GHG emissions of all Citi owned and leased properties around the world by 10% by 2011; (d) purchasing more than 234,000 MWh of carbon neutral power for
our operations over the last three years; (e) establishing in 2008 the Carbon Principles; a framework for banks and their U.S. power clients to evaluate and address carbon risks in the financing of electric power projects; (f)
producing equity research related to climate issues that helps to inform investors on risks and opportunities associated with the issue; and (g) engaging with a broad range of stakeholders on the issue of climate change to help
advance understanding and solutions.
Citi works with its clients in greenhouse gas intensive industries to evaluate emerging risks from climate change and, where appropriate, to mitigate those risks.
efficiency, renewable energy and mitigation
© 2015 Citibank, N.A. All rights reserved. Citi and Citi and Arc Design are trademarks and service marks of Citigroup Inc. or its affiliates and are used and registered throughout the world.
IRS Circular 230 Disclosure: Citigroup Inc. and its affiliates do not provide tax or legal advice. Any discussion of tax matters in these materials (i) is not intended or written to be used, and cannot be used or
relied upon, by you for the purpose of avoiding any tax penalties and (ii) may have been written in connection with the "promotion or marketing" of any transaction contemplated hereby ("Transaction").
Accordingly, you should seek advice based on your particular circumstances from an independent tax advisor.
In any instance where distribution of this communication is subject to the rules of the US Commodity Futures Trading Commission (“CFTC”), this communication constitutes an invitation to consider entering
into a derivatives transaction under U.S. CFTC Regulations §§ 1.71 and 23.605, where applicable, but is not a binding offer to buy/sell any financial instrument.
Any terms set forth herein are intended for discussion purposes only and are subject to the final terms as set forth in separate definitive written agreements. This presentation is not a commitment to lend, syndicate a
financing, underwrite or purchase securities, or commit capital nor does it obligate us to enter into such a commitment, nor are we acting as a fiduciary to you. By accepting this presentation, subject to applicable law or
regulation, you agree to keep confidential the information contained herein and the existence of and proposed terms for any Transaction.
Prior to entering into any Transaction, you should determine, without reliance upon us or our affiliates, the economic risks and merits (and independently determine that you are able to assume these risks) as well as the legal,
tax and accounting characterizations and consequences of any such Transaction. In this regard, by accepting this presentation, you acknowledge that (a) we are not in the business of providing (and you are not relying on us
for) legal, tax or accounting advice, (b) there may be legal, tax or accounting risks associated with any Transaction, (c) you should receive (and rely on) separate and qualified legal, tax and accounting advice and (d) you
should apprise senior management in your organization as to such legal, tax and accounting advice (and any risks associated with any Transaction) and our disclaimer as to these matters. By acceptance of these materials,
you and we hereby agree that from the commencement of discussions with respect to any Transaction, and notwithstanding any other provision in this presentation, we hereby confirm that no participant in any Transaction
shall be limited from disclosing the U.S. tax treatment or U.S. tax structure of such Transaction.
We are required to obtain, verify and record certain information that identifies each entity that enters into a formal business relationship with us. We will ask for your complete name, street address, and taxpayer ID number.
We may also request corporate formation documents, or other forms of identification, to verify information provided.
Any prices or levels contained herein are preliminary and indicative only and do not represent bids or offers. These indications are provided solely for your information and consideration, are subject to change at any time
without notice and are not intended as a solicitation with respect to the purchase or sale of any instrument. The information contained in this presentation may include results of analyses from a quantitative model which
represent potential future events that may or may not be realized, and is not a complete analysis of every material fact representing any product. Any estimates included herein constitute our judgment as of the date hereof
and are subject to change without any notice. We and/or our affiliates may make a market in these instruments for our customers and for our own account. Accordingly, we may have a position in any such instrument at
any time.
Although this material may contain publicly available information about Citi corporate bond research, fixed income strategy or economic and market analysis, Citi policy (i) prohibits employees from offering, directly or indirectly,
a favorable or negative research opinion or offering to change an opinion as consideration or inducement for the receipt of business or for compensation; and (ii) prohibits analysts from being compensated for specific
recommendations or views contained in research reports. So as to reduce the potential for conflicts of interest, as well as to reduce any appearance of conflicts of interest, Citi has enacted policies and procedures designed to
limit communications between its investment banking and research personnel to specifically prescribed circumstances.