investment summary - nyuadamodar/pdfiles/cfprojs/food.pdfinvestment summary . valuation results...
TRANSCRIPT

An Analysis of the Food and
Beverage Industry
by Alexander Raifeld
Mark Gurfinkel Rajeev Rao
Hao (Sara) Xi Shivanker Saxena
Investment Summary
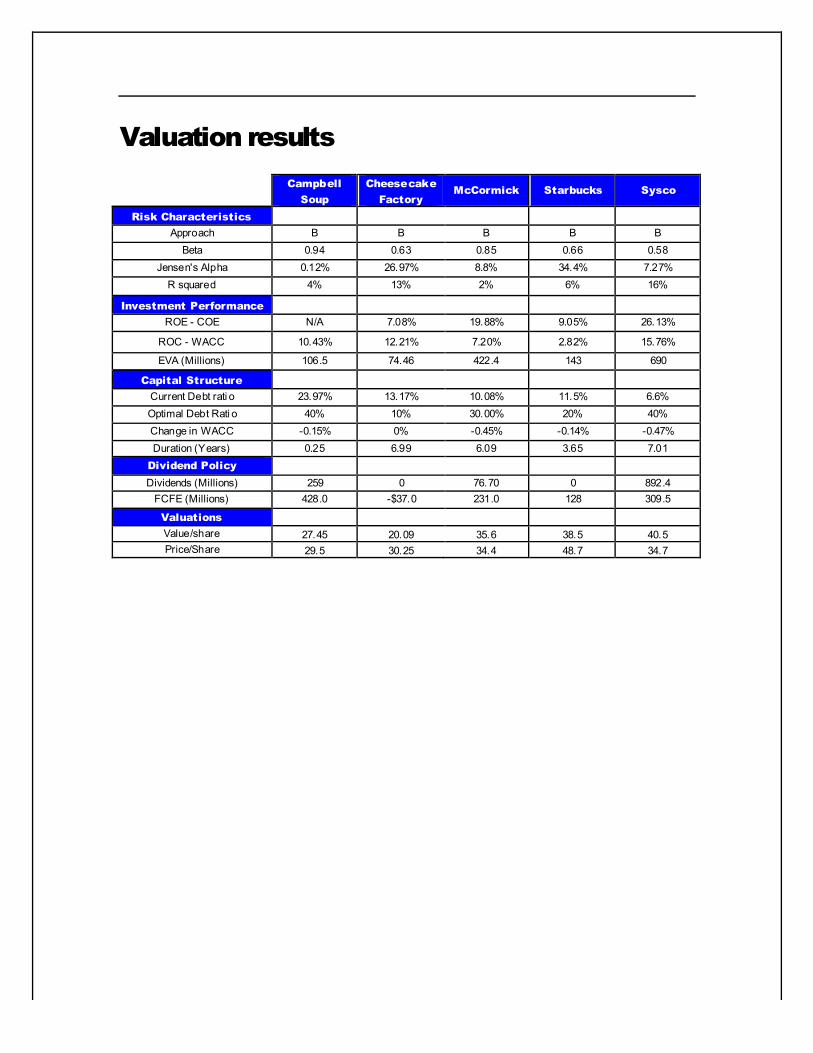
Valuation results
Campbell
Soup
Cheesecake
Factory McCormick Starbucks Sysco
Risk Characteristics Approach B B B B B
Beta 0.94 0.63 0.85 0.66 0.58 Jensen's Alpha 0.12% 26.97% 8.8% 34.4% 7.27%
R squared 4% 13% 2% 6% 16%
Investment Performance ROE - COE N/A 7.08% 19.88% 9.05% 26.13%
ROC - WACC 10.43% 12.21% 7.20% 2.82% 15.76%
EVA (Millions) 106.5 74.46 422.4 143 690
Capital Structure Current Debt rati o 23.97% 13.17% 10.08% 11.5% 6.6% Optimal Debt Rati o 40% 10% 30.00% 20% 40% Change in WACC -0.15% 0% -0.45% -0.14% -0.47% Duration (Years) 0.25 6.99 6.09 3.65 7.01
Dividend Policy
Dividends (Millions) 259 0 76.70 0 892.4 FCFE (Millions) 428.0 -$37.0 231.0 128 309.5
Valuations Value/share 27.45 20.09 35.6 38.5 40.5 Price/Share 29.5 30.25 34.4 48.7 34.7
THE FOOD AND BEVERAGE INDUSTRY PAGE 1 9/19/2006
Chapter
1
Corporate Governance Analysis The purpose of this section is to understand the relationship between managers and stockholders
Managers and Stockholders
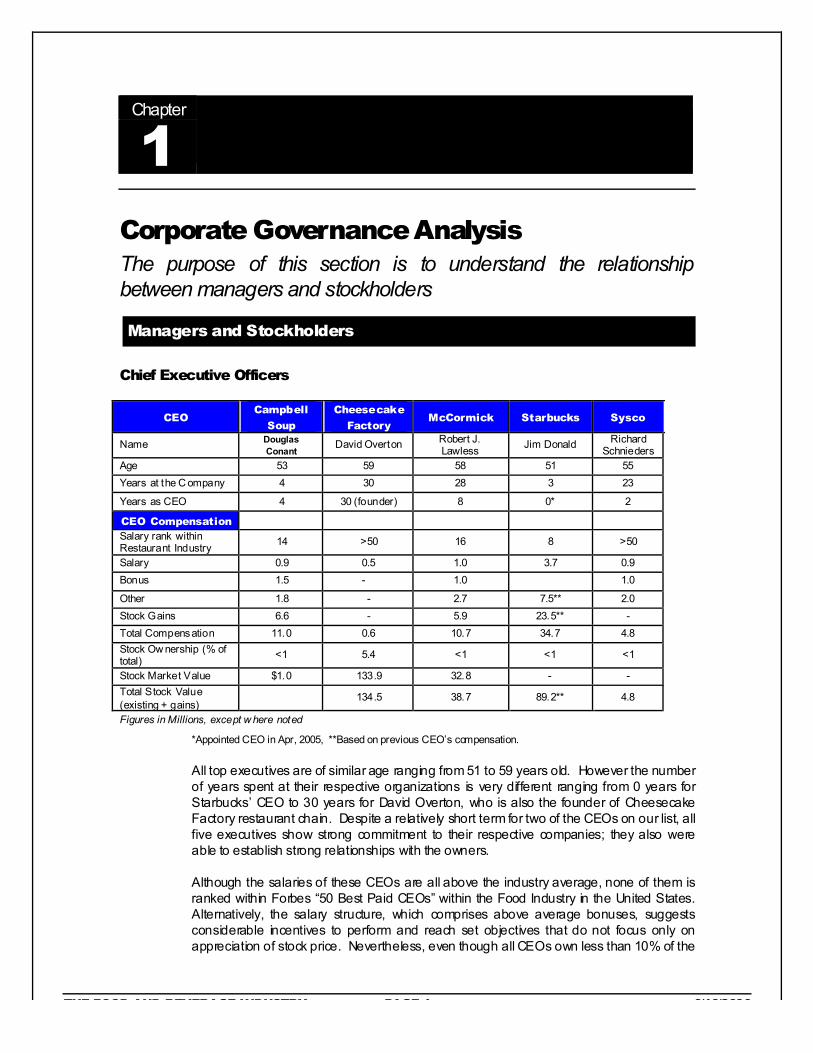
Chief Executive Officers
CEO Campbell
Soup
Cheesecake
Factory McCormick Starbucks Sysco
Name Douglas Conant David Overton Robert J.
Lawless Jim Donald Richard Schnieders
Age 53 59 58 51 55 Years at the C ompany 4 30 28 3 23
Years as CEO 4 30 (founder) 8 0* 2
CEO Compensation Salary rank within Restaurant Industry 14 >50 16 8 >50
Salary 0.9 0.5 1.0 3.7 0.9 Bonus 1.5 - 1.0 1.0
Other 1.8 - 2.7 7.5** 2.0 Stock Gains 6.6 - 5.9 23.5** - Total Compensation 11.0 0.6 10.7 34.7 4.8 Stock Ow nership (% of total) <1 5.4 <1 <1 <1
Stock Market Value $1.0 133.9 32.8 - - Total Stock Value (existing + gains)
134.5 38.7 89.2** 4.8
Figures in Millions, except w here noted
*Appointed CEO in Apr, 2005, **Based on previous CEO’s compensation.
All top executives are of similar age ranging from 51 to 59 years old. However the number of years spent at their respective organizations is very different ranging from 0 years for Starbucks’ CEO to 30 years for David Overton, who is also the founder of Cheesecake Factory restaurant chain. Despite a relatively short term for two of the CEOs on our list, all five executives show strong commitment to their respective companies; they also were able to establish strong relationships with the owners.
Although the salaries of these CEOs are all above the industry average, none of them is ranked within Forbes “50 Best Paid CEOs” within the Food Industry in the United States. Alternatively, the salary structure, which comprises above average bonuses, suggests considerable incentives to perform and reach set objectives that do not focus only on appreciation of stock price. Nevertheless, even though all CEOs own less than 10% of the
THE FOOD AND BEVERAGE INDUSTRY PAGE 2 9/19/2006
total stock, the earnings from shares can be substantial given the size of these large companies. Therefore, CEOs are still concerned about achieving a high stock price, thus dramatically lowering agency costs for the shareholders. McCormick and Cheesecake Factory are special cases in our analysis. CEOs at these companies own more than 5% of common stock; this ensures that their goals are completely aligned with those of other shareholders.
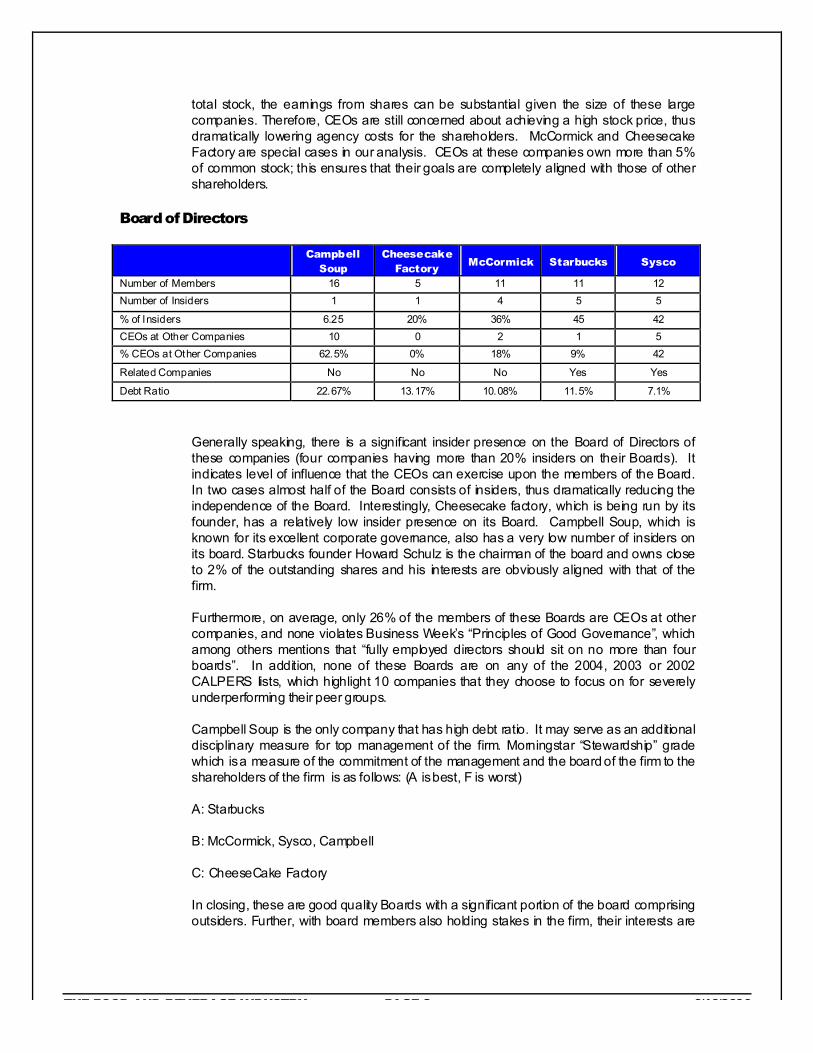
Board of Directors
Campbell
Soup Cheesecake
Factory McCormick Starbucks Sysco
Number of Members 16 5 11 11 12 Number of Insiders 1 1 4 5 5
% of Insiders 6.25 20% 36% 45 42 CEOs at Other Companies 10 0 2 1 5 % CEOs at Other Companies 62.5% 0% 18% 9% 42
Related Companies No No No Yes Yes
Debt Ratio 22.67% 13.17% 10.08% 11.5% 7.1%
Generally speaking, there is a significant insider presence on the Board of Directors of these companies (four companies having more than 20% insiders on their Boards). It indicates level of influence that the CEOs can exercise upon the members of the Board. In two cases almost half of the Board consists of insiders, thus dramatically reducing the independence of the Board. Interestingly, Cheesecake factory, which is being run by its founder, has a relatively low insider presence on its Board. Campbell Soup, which is known for its excellent corporate governance, also has a very low number of insiders on its board. Starbucks founder Howard Schulz is the chairman of the board and owns close to 2% of the outstanding shares and his interests are obviously aligned with that of the firm.
Furthermore, on average, only 26% of the members of these Boards are CEOs at other companies, and none violates Business Week’s “Principles of Good Governance”, which among others mentions that “fully employed directors should sit on no more than four boards”. In addition, none of these Boards are on any of the 2004, 2003 or 2002 CALPERS lists, which highlight 10 companies that they choose to focus on for severely underperforming their peer groups.
Campbell Soup is the only company that has high debt ratio. It may serve as an additional disciplinary measure for top management of the firm. Morningstar “Stewardship” grade which is a measure of the commitment of the management and the board of the firm to the shareholders of the firm is as follows: (A is best, F is worst)
A: Starbucks
B: McCormick, Sysco, Campbell
C: CheeseCake Factory
In closing, these are good quality Boards with a significant portion of the board comprising outsiders. Further, with board members also holding stakes in the firm, their interests are
THE FOOD AND BEVERAGE INDUSTRY PAGE 3 9/19/2006
aligned with that of the firm. As an example, Campbell Soup is widely regarded as a company with one of the best corporate governance in the US.
Share Voting Structure
For all our companies, there is only one type of share with no difference in the voting rights across shares.
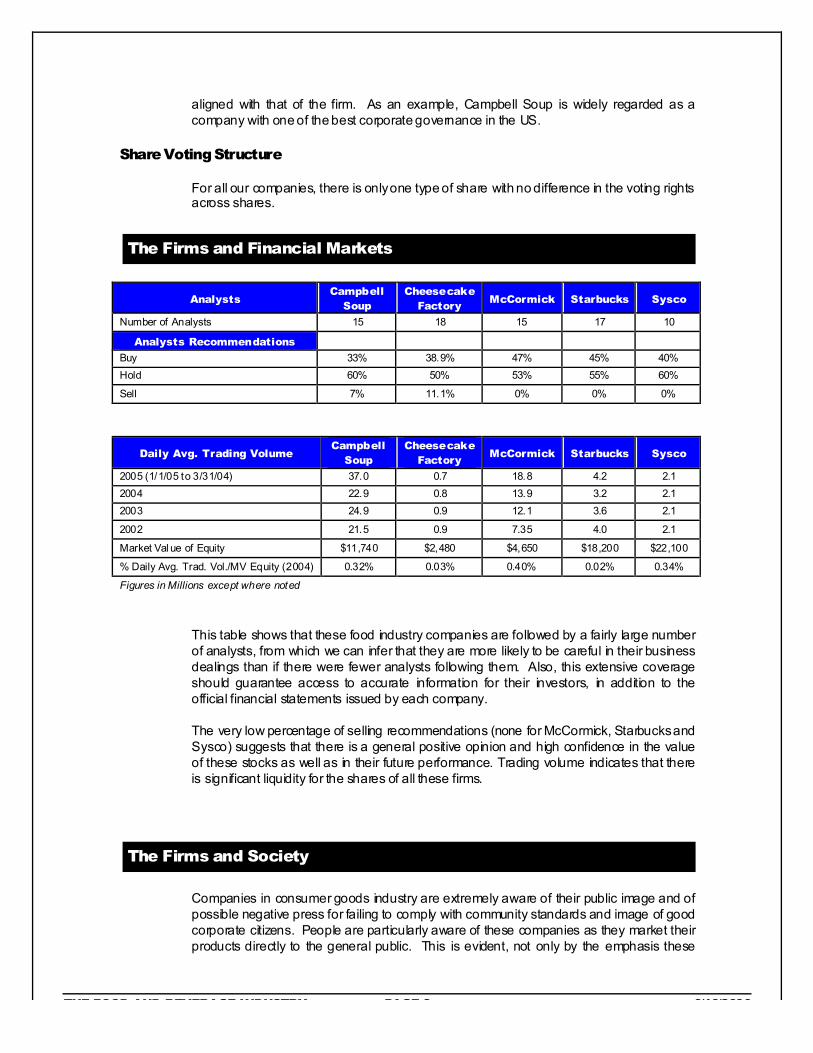
The Firms and Financial Markets
Analysts Campbell
Soup Cheesecake
Factory McCormick Starbucks Sysco
Number of Analysts 15 18 15 17 10
Analysts Recommendations Buy 33% 38.9% 47% 45% 40% Hold 60% 50% 53% 55% 60%
Sell 7% 11.1% 0% 0% 0%
Daily Avg. Trading Volume Campbell
Soup Cheesecake
Factory McCormick Starbucks Sysco
2005 (1/1/05 to 3/31/04) 37.0 0.7 18.8 4.2 2.1 2004 22.9 0.8 13.9 3.2 2.1 2003 24.9 0.9 12.1 3.6 2.1
2002 21.5 0.9 7.35 4.0 2.1
Market Val ue of Equity $11,740 $2,480 $4,650 $18,200 $22,100
% Daily Avg. Trad. Vol./MV Equity (2004) 0.32% 0.03% 0.40% 0.02% 0.34%
Figures in Millions except where noted
This table shows that these food industry companies are followed by a fairly large number of analysts, from which we can infer that they are more likely to be careful in their business dealings than if there were fewer analysts following them. Also, this extensive coverage should guarantee access to accurate information for their investors, in addition to the official financial statements issued by each company.
The very low percentage of selling recommendations (none for McCormick, Starbucks and Sysco) suggests that there is a general positive opinion and high confidence in the value of these stocks as well as in their future performance. Trading volume indicates that there is significant liquidity for the shares of all these firms.
The Firms and Society
Companies in consumer goods industry are extremely aware of their public image and of possible negative press for failing to comply with community standards and image of good corporate citizens. People are particularly aware of these companies as they market their products directly to the general public. This is evident, not only by the emphasis these
THE FOOD AND BEVERAGE INDUSTRY PAGE 4 9/19/2006
companies put on their public image efforts, but also by the substantial contributions they make to charitable organizations and foundations. As a result, most of these companies have been awarded prizes for their contributions to local neighborhoods. In particular, Campbell Soup has an exceptionally good reputation as a corporate citizen demonstrated by its desire to best serve five stakeholder groups: stockholders, employees, customers, the community, and the minorities.
Campbell Soup Company
Campbell Soup (CPB) is an excellent corporate citizen. According to recent surveys, Campbell Soup was recognized as a company with the best corporate governance. This should not come as a surprise, as the company pays a great deal of attention to this matter. Campbell Soup’s efforts in maximizing its corporate transparency and in value creation for its investors were extremely success. Over the past several years its Board received multiple “Board of the Year” awards from Wharton School of Business and SpencerStuart, an international executive search form. The Award recognizes the outstanding performance of Campbell's board of directors and its pivotal role in improving corporate performance and governance. Campbell Soup also started several programs aimed at extermination of poverty in the regions where the company operates. The company considers improving live of Camden, NJ (that is where Campbell Soup headquarter is located) residents to be one of its major goals. To do this the company created Campbell Soup foundation, which is engaged in helping underprivileged neighborhoods. Starting 1993 Campbell Soup organizes “Stamp Out Hunger”- world’s largest single day food drive. Over the past decade the company was able to collect more than half a billion pounds of food for families in need. CS also initiated highly successful “Labels for Education” program, in which the company helps schools to receive educational merchandise in return for Campbell Soup’s product labels. Campbell Soup is very active in employing diverse workforce. The company policy explicitly prohibits discriminating on the basis of sex, race, religion, or sexual preferences. The company’s efforts were welcomed by American Gay Society and Working Mothers Magazine.
Cheesecake Factory
Cheesecake Factory’s current CEO David Overton founded the company in 1970s and has a 5.4% stock ownership of the company. His family tradition and passion for food services has earned him a reputation for dedication to the company’s business. Being the largest individual stockholder, maximizing firm value is in line with his own interest.
On the other hand, Culinary Workers Union has been complaining about excessive amount of stock options awarded to senior managers. From 1995 through 2002, over 7.6 million stock options have been exercised by managers, representing the potential of an additional 9.7% of the company’s shares introduced into the market. Culinary Workers Union was concerned about diluting shareholders and filed a definitive proxy statement with SEC to seek reform of the company’s stock option and corporate governance policies in 2003.
The company actively reaches out to the community particularly where its restaurants locate. It has raised funds for various causes in the past.

THE FOOD AND BEVERAGE INDUSTRY PAGE 5 9/19/2006
McCormick & Company
McCormick and Company is very much aware of its social obligations and proves its commitments to the community mostly through domestic community service programs. It makes sense since consumer spices and flavorings preferences tend to vary a lot throughout the world.
In McCormick’s 115-year history, the record of community service is long and proud. Communities around the world where the Company has facilities have benefited from a variety of philanthropic activities. Through financial contributions and the active participation of employees, McCormick supports numerous causes that improve the quality of life.
The Company has a formal program of charitable giving that grants funds to worthwhile causes with civic, health, welfare, education and the arts receiving the most attention. Programs like the Unsung Heroes Awards, student scholarships, and Charity Day, which fosters employee giving to a wide range of civic causes, have existed for more than 60 years.
In the United States, for example, The McCormick Community Service Award was initiated in 2004 to honor employees who devote time and energy to better their communities. The grand prize-winner was employee Steve Sausnock, who, on behalf of the company distributed the $25,000 grant to numerous charities and organizations such as the Providence (Md.) Volunteer Fire Company. Another good example is “Shop with a Cop” program, which pairs needy children with police officers for mentoring. Finally, company’s runs an extensive network of soup kitchens for needy throughout the country.
Starbucks
Starbucks has an excellent reputation as a corporate citizen. The founder of the current-day Starbucks Howard Schulz was the former CEO and is currently Chairman of the board and the chief global interest. He owns 2% of the firm and hence his interests are quite aligned with those of the firm. In fact, he resigned in June 2000 as CEO because he felt that he needed to bring in professional talent to manage the firm. This is an excellent indication of good quality corporate governance. Amongst its 11 board members, 3 are insiders (including Schulz), 2 are from firms with direct links to Starbucks via contractual arrangements, and the rest are independent. Hence, independent members outnumber insiders 6 to 5 on the board.
Starbucks is well known for ensuring that all levels of its employees have excellent benefits. In addition, Starbucks pays its coffee suppliers rates which are far above the market rate because it believes they should receive a fair price. The firm is also involved in a number of charitable activities, and takes part in various environmental causes. Starbucks has also contributed generous amounts (in the range of tens of millions of dollars every year) to open charitable facilities in the countries from where it purchases coffee to improve the quality of life of its citizens. Overall, Starbucks gets an A for being a socially responsible firm.

THE FOOD AND BEVERAGE INDUSTRY PAGE 6 9/19/2006
Sysco
Sysco Corp's Corporate Governance Quotient (CGQ®) as of 1-Apr-05 is better than 37.7% of S&P 500 companies and 82% of Food & Staples Retailing companies. Corporate Governance Quotient (CGQ®), a corporate governance rating system provided by Institutional Shareholder Services (ISS) on over 7,500 companies worldwide, evaluates the strengths, deficiencies and risks of a company's corporate governance practices and board of directors. In an introductory letter to company’s corporate governance website, the CEO Richard Scnheiders writes, “Our business is built upon quality relationships – with our customers, our suppliers, our communities and, of course, our shareholders. Relationships require a strong foundation of mutual trust and understanding that is nurtured day after day, week after week and year after year. That trust is earned not just by adhering to the letter of the law, but also by acting within the spirit of the law.” On the corporate business analysis site, www.yeald.com, Sysco was rated relatively high, with the following scores:
Business skill rating Weak=1, Strong=10
Corporate Governance 7 Legal 7 Investor relations 6 Executive Management 8 Debt Management 8
Management is focused on shareholder returns and has paid itself very fairly in our opinion. None of the executives, including CEO Richard Schnieders, earns a base salary higher than $1 million. Most long-term compensation is made in the form of restricted stock instead of options, and options diluted net income by less than 2.5% last year. Sysco plans to begin expensing options in 2006. It may be advisable to see directors up for election annually, rather than every three years.

THE FOOD AND BEVERAGE INDUSTRY PAGE 7 9/19/2006
Chapter
2
Stockholder Analysis The purpose of this section is to understand who our companies’ marginal investors are
An analysis of our corporations shows that marginal investors in all five companies are well-diversified institutional investors. Company stock is widely held and stockholders are well diversified. Cheesecake factory is the only company in our list where a top stockholder owns more than 10% of outstanding stock. Large and well-diversified money management funds are top stakeholders in our corporations. No insider owns more than 5% in their companies (with the exception of Cheesecake factory). In this company marginal investors are also well diversified institutions, accounting for 94.6% ownership. The remaining 5.4% ownership is held solely by its found and CEO David Overton. The fact that the marginal investors are institutional investors has implications on how the firms return money to stockholders
What does “buyers” “sellers” mean??
Institutional Ownership
Campbell Soup
Cheesecake Factory
McCormick Starbucks Sysco
#Buyers 219 161 223 406 615
#Sellers 201 130 150 428 472
Shares Held 168.1 77.6 90.6 169.0 439
Shares Sol d 0 1.6 49.6 6.5 1
% Shares Outstandi ng 39.7% 99.4% 75.0% 72.5% 68.9%
#Holders 598 321 536 1,016 1,376
Top Institutional Holder Capital Guardi an Trust Co
Fidelity Management
Fidelity Management
Capital Management
Fidelity Management
Top Holder Percentage 3.1% 11.85% 8.46% 4.86% 3.39% Institutions owning over 5%
0 4 2 0 0
THE FOOD AND BEVERAGE INDUSTRY PAGE 8 9/19/2006
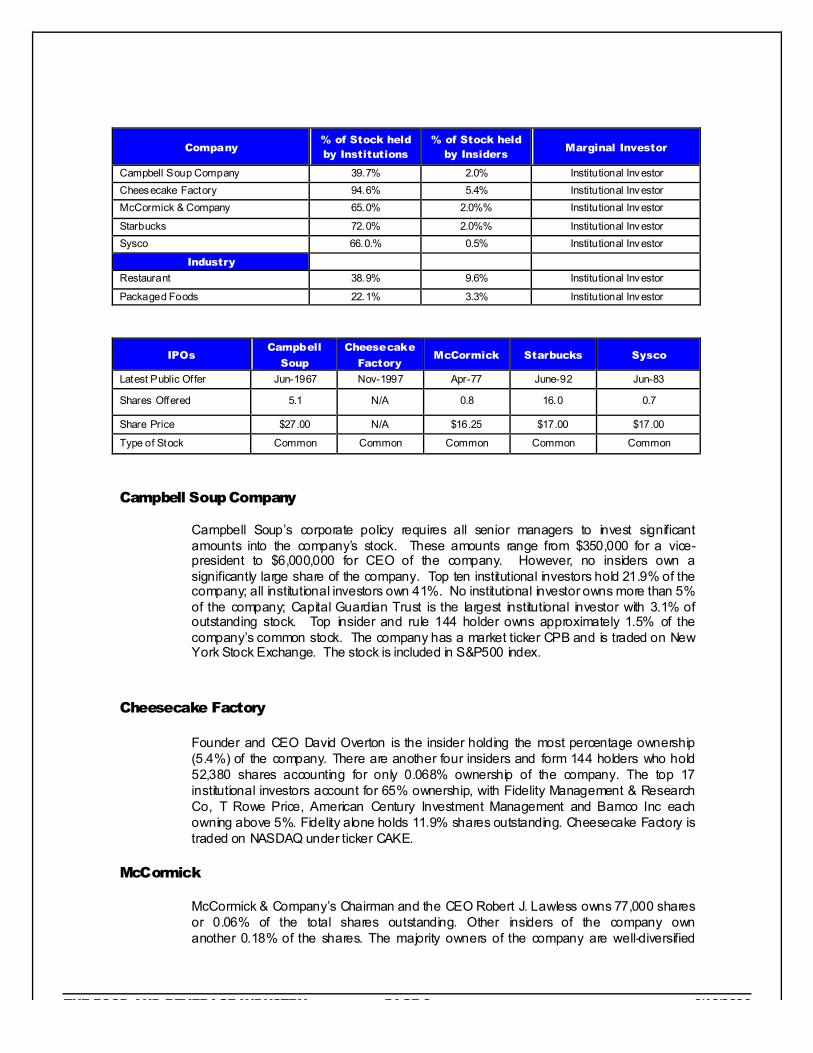
Company % of Stock held by Institutions
% of Stock held by Insiders
Marginal Investor
Campbell Soup Company 39.7% 2.0% Institutional Investor Cheesecake Factory 94.6% 5.4% Institutional Investor McCormick & Company 65.0% 2.0%% Institutional Investor
Starbucks 72.0% 2.0%% Institutional Investor Sysco 66.0.% 0.5% Institutional Investor
Industry Restaurant 38.9% 9.6% Institutional Investor
Packaged Foods 22.1% 3.3% Institutional Investor
IPOs Campbell
Soup
Cheesecake
Factory McCormick Starbucks Sysco
Latest Public Offer Jun-1967 Nov-1997 Apr-77 June-92 Jun-83
Shares Offered 5.1 N/A 0.8 16.0 0.7
Share Price $27.00 N/A $16.25 $17.00 $17.00
Type of Stock Common Common Common Common Common
Campbell Soup Company
Campbell Soup’s corporate policy requires all senior managers to invest significant amounts into the company’s stock. These amounts range from $350,000 for a vice-president to $6,000,000 for CEO of the company. However, no insiders own a significantly large share of the company. Top ten institutional investors hold 21.9% of the company; all institutional investors own 41%. No institutional investor owns more than 5% of the company; Capital Guardian Trust is the largest institutional investor with 3.1% of outstanding stock. Top insider and rule 144 holder owns approximately 1.5% of the company’s common stock. The company has a market ticker CPB and is traded on New York Stock Exchange. The stock is included in S&P500 index.
Cheesecake Factory
Founder and CEO David Overton is the insider holding the most percentage ownership (5.4%) of the company. There are another four insiders and form 144 holders who hold 52,380 shares accounting for only 0.068% ownership of the company. The top 17 institutional investors account for 65% ownership, with Fidelity Management & Research Co, T Rowe Price, American Century Investment Management and Bamco Inc each owning above 5%. Fidelity alone holds 11.9% shares outstanding. Cheesecake Factory is traded on NASDAQ under ticker CAKE.
McCormick
McCormick & Company’s Chairman and the CEO Robert J. Lawless owns 77,000 shares or 0.06% of the total shares outstanding. Other insiders of the company own another 0.18% of the shares. The majority owners of the company are well-diversified
THE FOOD AND BEVERAGE INDUSTRY PAGE 9 9/19/2006
institutional investors. What is particularly interesting about this company is that the CEO of the company has been steadily increasing his stake in the company recently, buying shares for as high as $39.11 per share although current stock price hovers around $38.50. The top 10 institutional investors own about 40.33% of the company, and only Fidelity (8.46%) and State Street (7.69%) own more than 5% of the company. McCormick & Company is traded on NYSE under ticker symbol MKC.
Starbucks
Starbucks’ founder Howard Schulz is still with the firm as Chairman of the Board and Chief global strategist. He owns about 2% of the firm, and is the only insider to have a considerable number of shares of the firm (8 million shares). The fact that Schulz’s interests are aligned with those of the firm should be a powerful incentive for him (and the board) to make decisions in the best interest of the firm and its shareholders. The company makes significant use of stock options in its effort to retain employees. The major holders of the company’s stock are well-diversified institutional investors who hold 72% of the outstanding stock. They are also the marginal investors. Interestingly, no single entity holds more than 5% of the company’s outstanding shares. The top shareholder is Capital Research and Management Company with a 4.86% stake. Starbucks is traded on the NASDAQ under the ticker SBUX.
Sysco
The CEO, Richard Schneiders, together with the COO, Thomas Lankford and other top Sysco executives, hold less than 0.20% of the total shares. Sysco’s Board of Directors holds less than 0.05% of the total shares outstanding. The company’s major shareholders are institutional investors like Fidelity, Barclays Global, Bank of Ireland Asset Management, and State Street all of which hold over 2.5% of the total share capital. The institutional investors together hold over 66% of Sysco total market cap. Sysco is traded on the NYSE under the ticker SYY.
THE FOOD AND BEVERAGE INDUSTRY PAGE 10 9/19/2006
Chapter
3
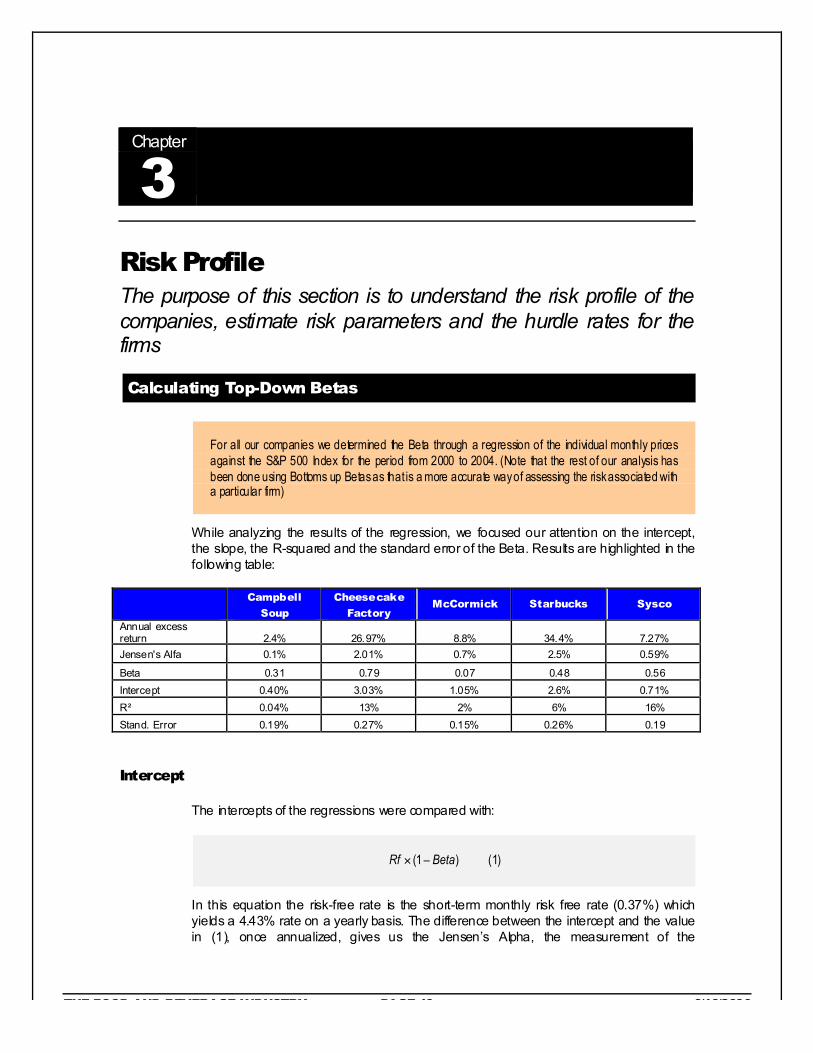
Risk Profile The purpose of this section is to understand the risk profile of the companies, estimate risk parameters and the hurdle rates for the firms
Calculating Top-Down Betas
For all our companies we determined the Beta through a regression of the individual monthly prices against the S&P 500 Index for the period from 2000 to 2004. (Note that the rest of our analysis has been done using Bottoms up Betas as that is a more accurate way of assessing the risk associated with a particular firm)
While analyzing the results of the regression, we focused our attention on the intercept, the slope, the R-squared and the standard error of the Beta. Results are highlighted in the following table:
Campbell
Soup
Cheesecake
Factory McCormick Starbucks Sysco
Annual excess return 2.4% 26.97% 8.8% 34.4% 7.27% Jensen's Alfa 0.1% 2.01% 0.7% 2.5% 0.59%
Beta 0.31 0.79 0.07 0.48 0.56 Intercept 0.40% 3.03% 1.05% 2.6% 0.71% R² 0.04% 13% 2% 6% 16% Stand. Error 0.19% 0.27% 0.15% 0.26% 0.19
Intercept
The intercepts of the regressions were compared with:
)1( BetaRf !" (1)
In this equation the risk-free rate is the short-term monthly risk free rate (0.37%) which yields a 4.43% rate on a yearly basis. The difference between the intercept and the value in (1), once annualized, gives us the Jensen’s Alpha, the measurement of the

THE FOOD AND BEVERAGE INDUSTRY PAGE 11 9/19/2006
performance of each company’s stock on a yearly basis. If positive, the stock performed better than expected by the market.
Campbell
Soup Cheesecake
Factory McCormick Starbucks Sysco
Annual excess return 1.45% 26.97%% 8.8% 34.4% 7.27%
Jensen's Alfa 0.12% 2.01% 0.7% 2.49% 0.59%
According to our calculations, our companies in the Restaurant, Processed Foods and Food Wholesaler sectors are providing a return in excess of the required return. The companies are compensating the investors more than adequately for the risk (beta) assumed by their investors.
Slope
The slopes of the regressions give us the top-down Betas of the Companies; Beta represents the correlation of the firms’ risk with that of the overall market. All our firms have a value of Beta below the average Market risk (Beta = 1), which is not surprising given the essential nature of services provided by this sector (food is one of the most basic needs of man).
Campbell
Soup
Cheesecake
Factory McCormick Starbucks Sysco
Beta 0.31 0.79 0.07 0.48 0.56
From the comparison of the OL, expressed as EBIT Variability Measure, we can notice that higher OL reflects higher Beta..
Campbell
Soup Cheesecake
Factory McCormick Starbucks Sysco
10Yr Avg % change in EBIT ( a) -8% 30.55 6% 34% 15% 10Yr Avg % change in sales (b) 1% 25.29 5% 29% 10%
EBIT Variabil ity measure (a/b) -8.0 1.21 1.20 1.16 1.50
Our Beta calculations make good intuitive sense. All our companies produce non-luxury goods. Production level is fairly stable and is not highly dependent on an overall state of the economy.
R2
The R2 represents the portion of the risk faced by the companies that is diversifiable. After analyzing the numbers, we notice that the Food industry is not materially affected (with the exception of Cheesecake Factory, which provides more expensive dining services) by financial market trends.
Campbell
Soup Cheesecake
Factory McCormick Starbucks Sysco
R² 4% 13% 2% 6% 16%
THE FOOD AND BEVERAGE INDUSTRY PAGE 12 9/19/2006
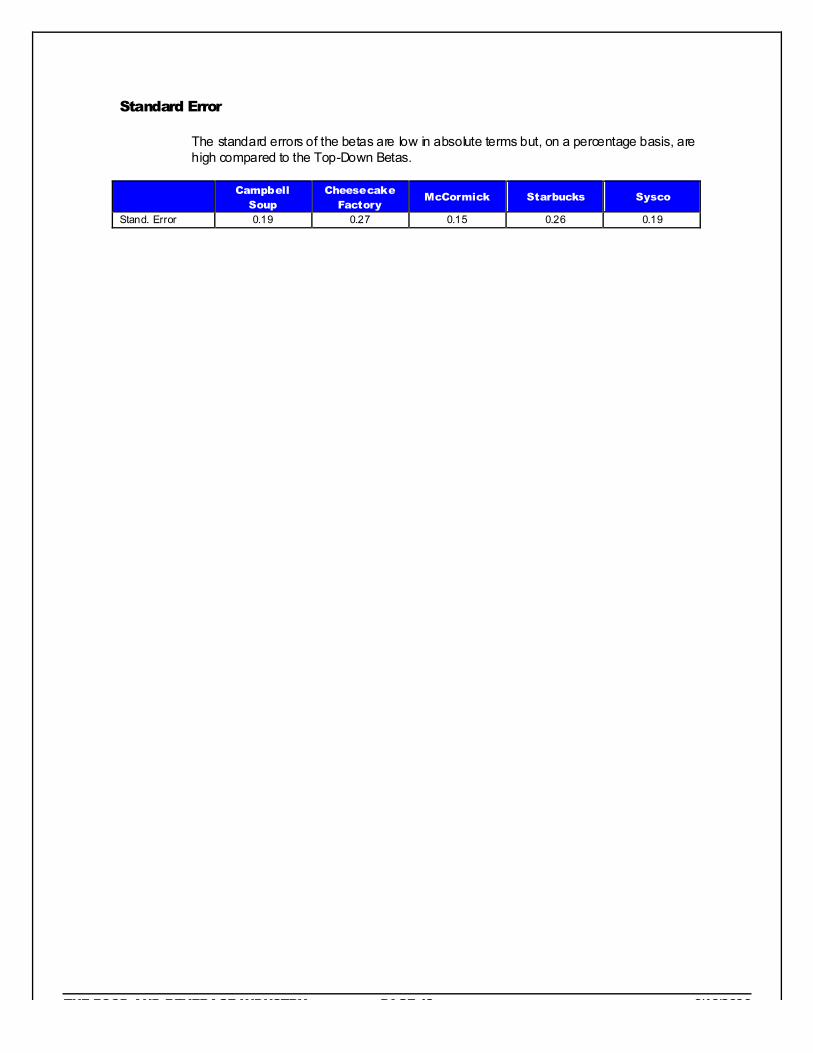
Standard Error
The standard errors of the betas are low in absolute terms but, on a percentage basis, are high compared to the Top-Down Betas.
Campbell
Soup Cheesecake
Factory McCormick Starbucks Sysco
Stand. Error 0.19 0.27 0.15 0.26 0.19
THE FOOD AND BEVERAGE INDUSTRY PAGE 13 9/19/2006
Chapter
4
Investment Return Analysis The purpose of this section is to assess the quality of the firms’ current projects and the managers’ abilities to contribute to increasing the firms’ values
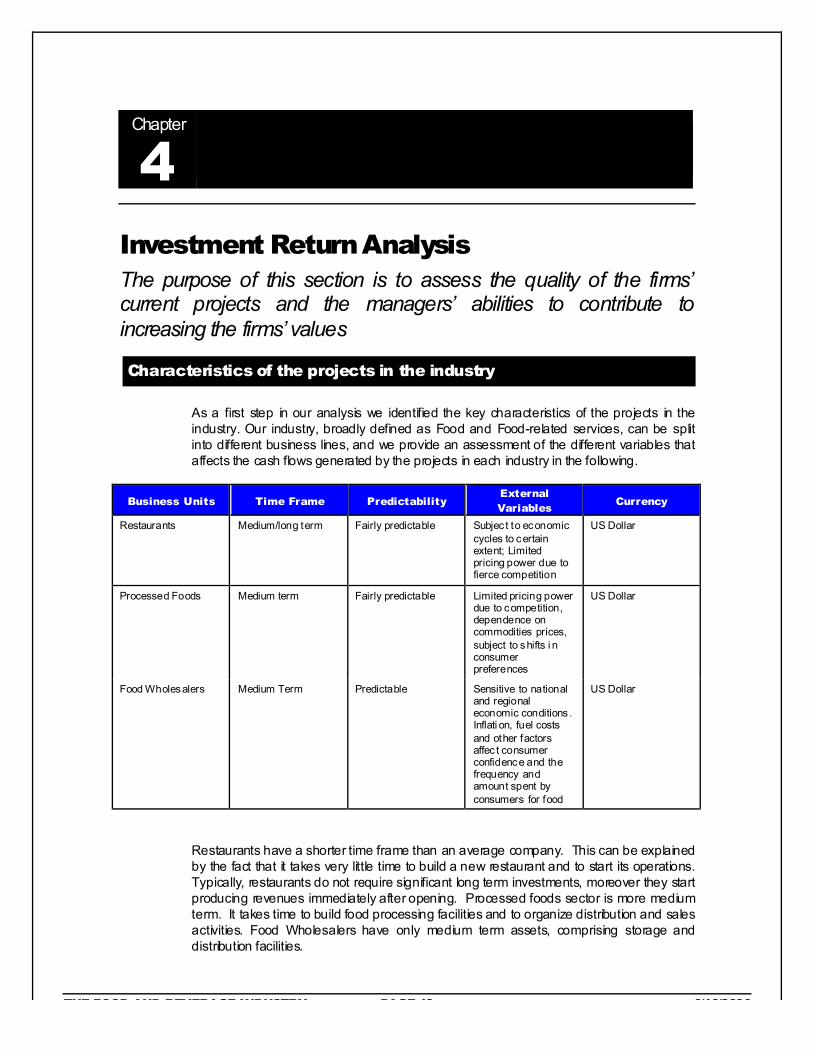
Characteristics of the projects in the industry
As a first step in our analysis we identified the key characteristics of the projects in the industry. Our industry, broadly defined as Food and Food-related services, can be split into different business lines, and we provide an assessment of the different variables that affects the cash flows generated by the projects in each industry in the following.
Business Units Time Frame Predictability External Variables
Currency
Restaurants Medium/long term Fairly predictable Subjec t to economic cycles to certain extent; Limited pricing power due to fierce competition
US Dollar
Processed Foods Medium term Fairly predictable Limited pricing power due to competition, dependence on commodities prices, subject to shifts i n consumer preferences
US Dollar
Food Wholesalers Medium Term Predictable Sensitive to national and regional economic conditions . Inflati on, fuel costs and other factors affec t consumer confidence and the frequency and amount spent by consumers for food
US Dollar
Restaurants have a shorter time frame than an average company. This can be explained by the fact that it takes very little time to build a new restaurant and to start its operations. Typically, restaurants do not require significant long term investments, moreover they start producing revenues immediately after opening. Processed foods sector is more medium term. It takes time to build food processing facilities and to organize distribution and sales activities. Food Wholesalers have only medium term assets, comprising storage and distribution facilities.
THE FOOD AND BEVERAGE INDUSTRY PAGE 14 9/19/2006
Revenues are fairly predictable for the Food industry. Companies operating in processed foods sector have enormous past experience, know market dynamics well, and can accurately predict demand for their products. Revenues are less certain for the restaurant sector, as companies in this field depend more on economic environment as well as on changing consumer tastes. Also competition plays an important factor in this industry. The revenues are quite predicable for Food Wholesalers, but may be adversely affected by prolonged downturn in economy and persistently high inflation, among other economic variables.
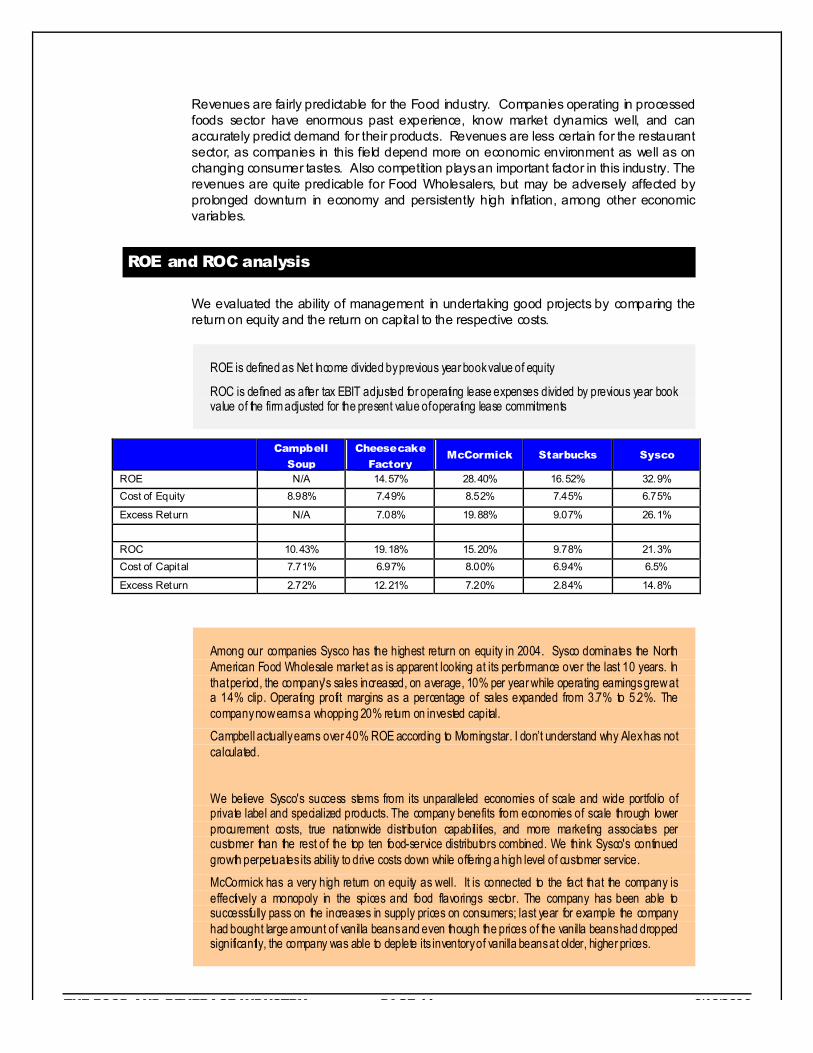
ROE and ROC analysis
We evaluated the ability of management in undertaking good projects by comparing the return on equity and the return on capital to the respective costs.
ROE is defined as Net Income divided by previous year book value of equity
ROC is defined as after tax EBIT adjusted for operating lease expenses divided by previous year book value of the firm adjusted for the present value of operating lease commitments
Campbell
Soup
Cheesecake
Factory McCormick Starbucks Sysco
ROE N/A 14.57% 28.40% 16.52% 32.9% Cost of Equity 8.98% 7.49% 8.52% 7.45% 6.75%
Excess Return N/A 7.08% 19.88% 9.07% 26.1% ROC 10.43% 19.18% 15.20% 9.78% 21.3% Cost of Capital 7.71% 6.97% 8.00% 6.94% 6.5%
Excess Return 2.72% 12.21% 7.20% 2.84% 14.8%
Among our companies Sysco has the highest return on equity in 2004. Sysco dominates the North American Food Wholesale market as is apparent looking at its performance over the last 10 years. In that period, the company's sales increased, on average, 10% per year while operating earnings grew at a 14% clip. Operating profit margins as a percentage of sales expanded from 3.7% to 5.2%. The company now earns a whopping 20% return on invested capital.
Campbell actually earns over 40% ROE according to Morningstar. I don’t understand why Alex has not calculated.
We believe Sysco's success stems from its unparalleled economies of scale and wide portfolio of private label and specialized products. The company benefits from economies of scale through lower procurement costs, true nationwide distribution capabilities, and more marketing associates per customer than the rest of the top ten food-service distributors combined. We think Sysco's continued growth perpetuates its ability to drive costs down while offering a high level of customer service.
McCormick has a very high return on equity as well. It is connected to the fact that the company is effectively a monopoly in the spices and food flavorings sector. The company has been able to successfully pass on the increases in supply prices on consumers; last year for example the company had bought large amount of vanilla beans and even though the prices of the vanilla beans had dropped significantly, the company was able to deplete its inventory of vanilla beans at older, higher prices.
THE FOOD AND BEVERAGE INDUSTRY PAGE 15 9/19/2006
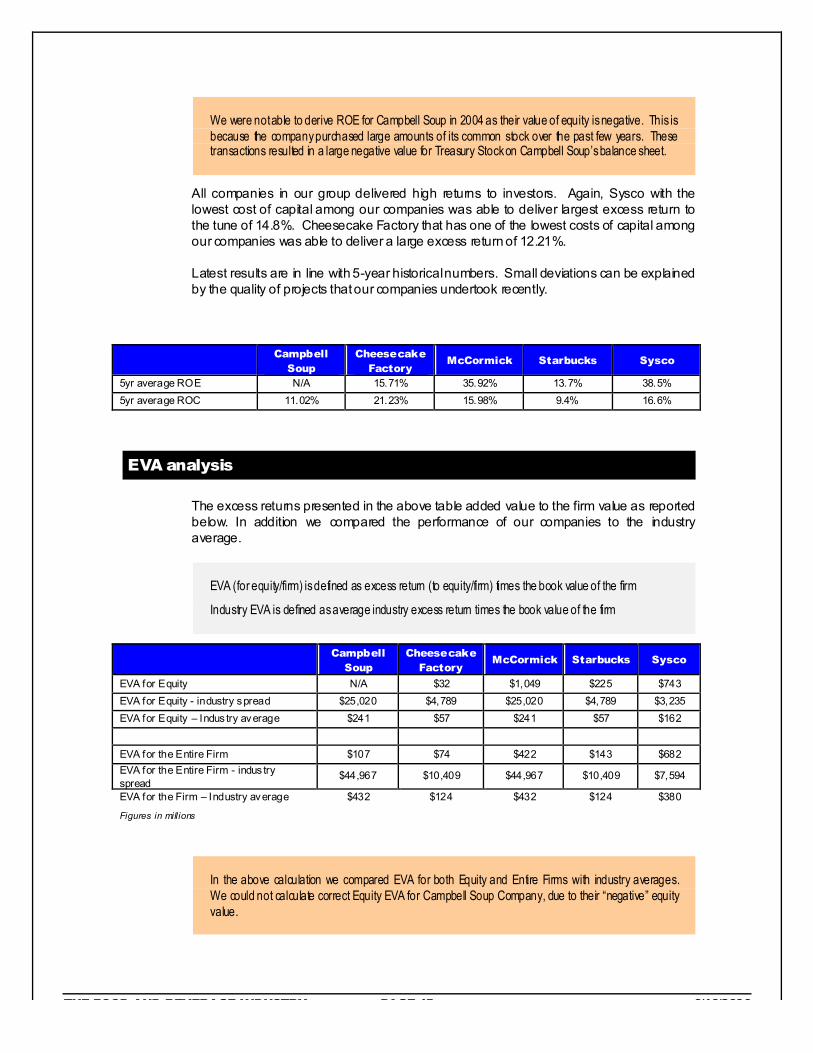
We were not able to derive ROE for Campbell Soup in 2004 as their value of equity is negative. This is because the company purchased large amounts of its common stock over the past few years. These transactions resulted in a large negative value for Treasury Stock on Campbell Soup’s balance sheet.
All companies in our group delivered high returns to investors. Again, Sysco with the lowest cost of capital among our companies was able to deliver largest excess return to the tune of 14.8%. Cheesecake Factory that has one of the lowest costs of capital among our companies was able to deliver a large excess return of 12.21%.
Latest results are in line with 5-year historical numbers. Small deviations can be explained by the quality of projects that our companies undertook recently.
Campbell
Soup Cheesecake
Factory McCormick Starbucks Sysco
5yr average ROE N/A 15.71% 35.92% 13.7% 38.5% 5yr average ROC 11.02% 21.23% 15.98% 9.4% 16.6%
EVA analysis
The excess returns presented in the above table added value to the firm value as reported below. In addition we compared the performance of our companies to the industry average.
EVA (for equity/firm) is defined as excess return (to equity/firm) times the book value of the firm
Industry EVA is defined as average industry excess return times the book value of the firm
Campbell Soup
Cheesecake Factory
McCormick Starbucks Sysco
EVA for Equity N/A $32 $1,049 $225 $743 EVA for Equity - industry spread $25,020 $4,789 $25,020 $4,789 $3,235 EVA for Equity – Indus try average $241 $57 $241 $57 $162
EVA for the Entire Firm $107 $74 $422 $143 $682 EVA for the Entire Firm - indus try spread
$44,967 $10,409 $44,967 $10,409 $7,594
EVA for the Firm – Industry average $432 $124 $432 $124 $380
Figures in millions
In the above calculation we compared EVA for both Equity and Entire Firms with industry averages. We could not calculate correct Equity EVA for Campbell Soup Company, due to their “negative” equity value.
THE FOOD AND BEVERAGE INDUSTRY PAGE 16 9/19/2006
In comparison to the industry average, in general, our companies did relatively better than other firms in similar sectors. This is primarily on account of higher returns and lower costs of capital / equity for our companies, as has been analyzed earlier in this chapter.
While ROE, ROC and EVA are accounting indicators that provides useful insights about a company’s ability to pick good projects, they are backward-looking and cannot be used as reliable indicators of future performance. However these results confirm a strong consistency in high returns and a stable trend.
In conclusion, since all the firms have returns higher than costs of funds and by implication, a positive EVA, it would seem that the management of these firms is doing a good job of picking good projects and adding value to the firm.
THE FOOD AND BEVERAGE INDUSTRY PAGE 17 9/19/2006
Chapter
5
Capital Structure Choices The objective of this section is to analyze the existing financial mix and to assess the benefits and costs of debt
Debt Financing
Short and long term debt
Campbell Soup
Campbell Soup’s total debt was $353 million in 2004. The debt level slightly decreased from the previous year, causing a 6% decline in annual interest expenses. In 2003 the company issues $700 million of long term debt. The proceeds from these issues were used to repay previous higher interest rate debt. The company is actively using SWAP contracts to hedge itself against interest rate changes. The company owns the vast majority of its plants locations, although it leases a couple of locations in the US, Europe and Australia. Total present value of these leases is approximately $264 million. These leases also have renewal options.
Cheesecake Factory
There is no short-term or long-term borrowing on the book. The company maintains a $35 million revolving credit and term loan facility with a major financial institution, but there were no borrowings outstanding as of December 28, 2004 and December 30, 2003. The company leases all of its restaurant locations under operating leases, with primary terms from 10 to 25 years. The leases require contingent rent above the minimum base rent payments based on a percentage of sales from 3.5% to 10%. Most leases have renewal options and have always been exercised in the past. Present value of the leases is $410.99 million.
McCormick and Company
Short-term borrowings and current portion of long-term debt amounted to $481M at the end of 2004. McCormick and Co. prefers to finance itself through various types of medium term notes. The company also has access to substantial credit lines from numerous banks worldwide. Interest rates charged on borrowings are based either on bids provided by banks or the LIBOR rate, plus applicable margins. Additionally, the firm has access to bank letter of credit facilities. These letters of credit typically act as a guarantee of payment to certain third parties in accordance with specified terms and conditions. The unused portion of the Company’s letter of credit facility was $33.7 million at November 30, 2004.

THE FOOD AND BEVERAGE INDUSTRY PAGE 18 9/19/2006
Starbucks
Starbucks has a negligible amount of debt on its balance sheet. Almost all of its debt is via long-term operating leases (which is the way the firm sets up most of its locations) and purchasing agreements. Both of these are obligatory, and not fulfilling them will cause Starbucks to pay penalties. The market value of its debt was estimated to be 2.2 B dollars.
Sysco
Total debt at July 3, 2004 was $1,468 million, of which approximately 60% was at fixed rates averaging 5.2% with an average life of 8 years, and the remainder was at floating rates averaging 4.0%, as adjusted for the effect of the interest rate swaps outstanding at July 3, 2004. Certain loan agreements contain typical debt covenants to protect note holders, including provisions to maintain the company's long-term debt to total capital ratio below a specified level. SYSCO was in compliance with all debt covenants at July 3, 2004.
The company has a revolving loan agreement of $450 million, maturing in fiscal 2008, which supports the company's United States commercial paper program. It is the company's intent to continue to refinance this facility on a long-term basis. As a result, the commercial paper borrowings supported by this agreement have been classified as long-term debt. The company also has a revolving loan agreement in the amount of $100 million in Canadian dollars (CAD), maturing in fiscal 2005, which supports the company's Canadian commercial paper program. The amount outstanding under these agreements was $ 73.8 million as of July 3, 2004. The market value of this long term debt is approximately the same as its book value because the average interest cost is the same the current cost of debt.
Operating Leases
As is illustrated below, all of the companies have lease obligations for various properties and equipment. Capital leases in every case were not significant.
Campbell
Soup Cheesecake
Factory McCormick Starbucks Sysco
Operati ng Leases (NPV) $233.64 $410.99 $49.71 $2,200. $216.5 Capital Leases 0.0 0.0 0.0 0.0 $29.2 Figures in millions
Benefits of debt
The primary benefit of debt over equity instruments is that it yields tax benefits. Our companies have a marginal tax rate of about 36%. Depreciation expense is one of many deductions used by companies to obtain tax advantages. The table below analyzes the companies’ comparative depreciation effect on tax benefits posed to free cash flow.
Campbell
Soup Cheesecake
Factory McCormick Starbucks Sysco
Current Depreciation/Firm BV 6.15% 4.74% 19.9% 11.00% 6.5%

THE FOOD AND BEVERAGE INDUSTRY PAGE 19 9/19/2006
The results revealed that relatively speaking, McCormick surpasses its cohorts for a depreciation tax deduction. Other companies have lower depreciation expenses and will have to pay more in taxes.
Is having more debt really good for businesses? By looking at the EBITDA/Firm value it appears that relatively speaking, all our companies have similar flexibility in their ability to successfully service debt.
Campbell
Soup Cheesecake
Factory McCormick Starbucks Sysco
EBITDA $1,394 $157 $402.2 $1109 $1865.4 Firm Value (Market Value) $15,570 $3,121 $5,865.5 $20,549 $23,835
EBITDA/Firm Value 8.95% 5.03% 6.9% 5.4% 7.9% Weighted Avg. Industry EBITDA/Firm 7.59% 7.39% 7.59% 7.39% 7.59%
Figures in millions except where noted
The second benefit to debt is that it imposes discipline on management by requiring them to make debt payment. Cheesecake Factory’s CEO David Overton is also its founder who has a 5.4% stock ownership. Given that he is already motivated to maximize firm value, it is unlikely that adding debt will impose more management discipline on him. Similarly, Starbucks’ founder Howard Schulz is the Chairman of the board, and owns 2% of the outstanding shares. Hence, at least for these two firms, additional debt provides little additional motivation beyond what is already there.
Costs of Debt
Exposure to bankruptcy costs and default are the biggest costs of debt. The probability of bankruptcy is a function of the size of operating cash flows relative to cash flows on debt obligations, and the variance in operating cash. Below we analyze our companies’ debt servicing ability.
The results of this analysis are surprising. Starbucks has had negative free cash flow for a few years, but has had gradually increasing free cash flows in the last 4 years. At the same time, the FCFF remain relatively low and it may be prudent for Starbucks to remain under-levered till its cash flows warrant moving to higher debt ratio. Among our companies, Starbucks has a relatively high probability of going bankrupt. McCormick also has an extremely high variability of 333% in its ability to generate free cash flow to the firm. Campbell Soup appears to be the most stable of the group followed by Cheesecake Factory (despite their negative FCFF in 2004). These companies have had reliable earnings over the last 10 years and have taken on good projects. Cheesecake Factory incurred $162 million capital expenditure in 2004, out of which new restaurant openings accounted for $119 million. With the lowest cash flows and debt near optimal level, it is apparent that Cheesecake Factory should be wary of financing any new projects with incremental debt.
Sysco has steadily growing cash flows over the last 10 years. Although the variability of its income is high (50%), almost the entire variation is positive, which implies that the company has added financial heft over the last 10 years. Its market cap is the highest

THE FOOD AND BEVERAGE INDUSTRY PAGE 20 9/19/2006
among the companies under consideration and the debt ratio is the lowest, which implies that it is under levered. It follows that the risk of bankruptcy is quite low for Sysco.
Free Cash Flow to the Firm Campbell Soup
Cheesecake Factory
McCormick Starbucks Sysco
2004 $620.76 -$5.0 $231.0 $128 $682.7 2003 $737.76 $81.897 $231.0 $81.7 $570.9
2002 $579.92 $69.784 $154.6 $50.8 $388.0 2001 $752.64 $55.439 $59.5 $52.8 $569.9 2000 $1,080.76 $46.137 $108.8 $(82.6) $289.8 1999 $653.68 $30.862 $134.3 ($51.0) $203.5 1998 $708.36 $17.714 $178.0 ($59.0) $195.5 1997 $779.88 $14.234 $105.9 ($69.0) $311.8 1996 $661.96 $8.756 $112.3 ($25.0) $170.0 1995 $760.64 $10.326 $100.5 - 1994 $509.00 $8.902 $8.9 - -
Variability in Oper ating Cash Flows 21% 92% 52% 54% * 50% Figures in millions except where noted
* (estimated from 2000 to 2005)
THE FOOD AND BEVERAGE INDUSTRY PAGE 21 9/19/2006
Chapter
6
Optimal Capital Structure The objective of this section is to come up with the optimal financing mix for each firm
The Cost of Capital Approach
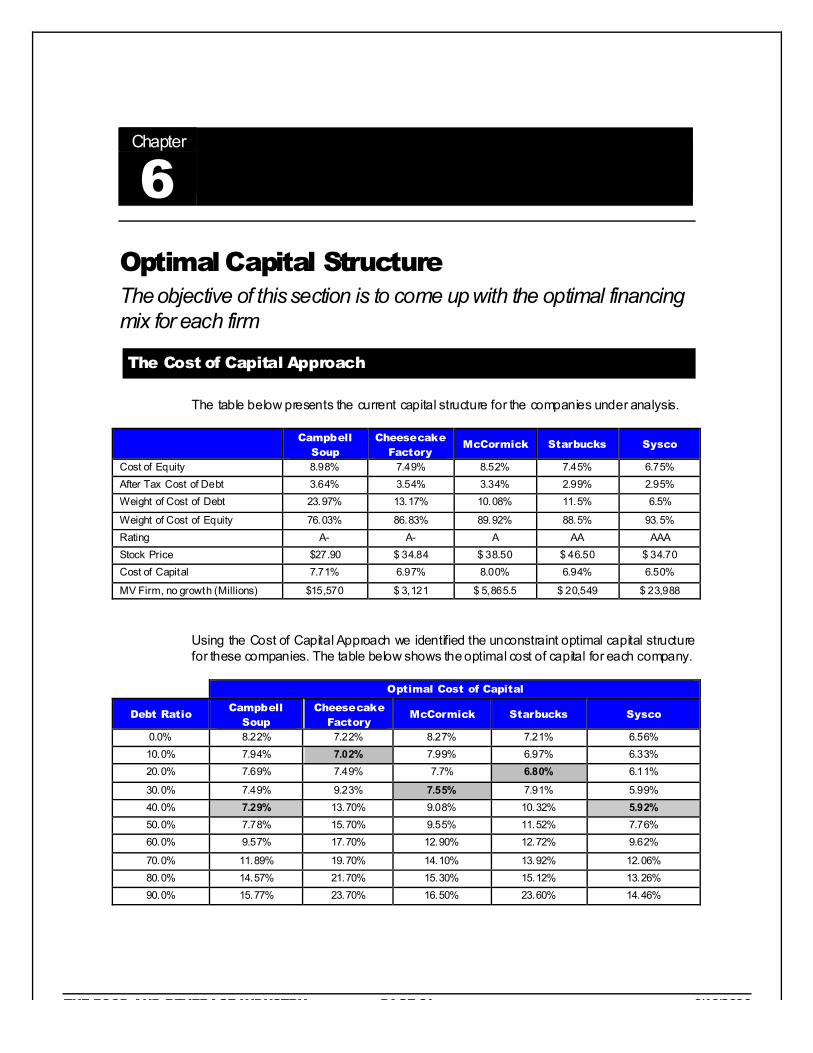
The table below presents the current capital structure for the companies under analysis.
Campbell
Soup Cheesecake
Factory McCormick Starbucks Sysco
Cost of Equity 8.98% 7.49% 8.52% 7.45% 6.75% After Tax Cost of Debt 3.64% 3.54% 3.34% 2.99% 2.95% Weight of Cost of Debt 23.97% 13.17% 10.08% 11.5% 6.5%
Weight of Cost of Equity 76.03% 86.83% 89.92% 88.5% 93.5% Rating A- A- A AA AAA Stock Price $27.90 $ 34.84 $ 38.50 $ 46.50 $ 34.70 Cost of Capital 7.71% 6.97% 8.00% 6.94% 6.50%
MV Firm, no growth (Millions) $15,570 $ 3,121 $ 5,865.5 $ 20,549 $ 23,988
Using the Cost of Capital Approach we identified the unconstraint optimal capital structure for these companies. The table below shows the optimal cost of capital for each company.
Optimal Cost of Capital
Debt Ratio Campbell
Soup Cheesecake
Factory McCormick Starbucks Sysco
0.0% 8.22% 7.22% 8.27% 7.21% 6.56% 10.0% 7.94% 7.02% 7.99% 6.97% 6.33% 20.0% 7.69% 7.49% 7.7% 6.80% 6.11%
30.0% 7.49% 9.23% 7.55% 7.91% 5.99% 40.0% 7.29% 13.70% 9.08% 10.32% 5.92% 50.0% 7.78% 15.70% 9.55% 11.52% 7.76% 60.0% 9.57% 17.70% 12.90% 12.72% 9.62%
70.0% 11.89% 19.70% 14.10% 13.92% 12.06% 80.0% 14.57% 21.70% 15.30% 15.12% 13.26% 90.0% 15.77% 23.70% 16.50% 23.60% 14.46%
THE FOOD AND BEVERAGE INDUSTRY PAGE 22 9/19/2006
Cost of Capital as a function of Debt Ratio
0%
5%
10%
15%
20%
25%
0% 10% 20% 30% 40% 50% 60% 70% 80% 90% 100%
Debt Ratio
Co
st
of
Ca
pit
al
Campbell
Cheesecake
McCormick
Starbucks
Sysco
Optimal Debt Ratio Zone
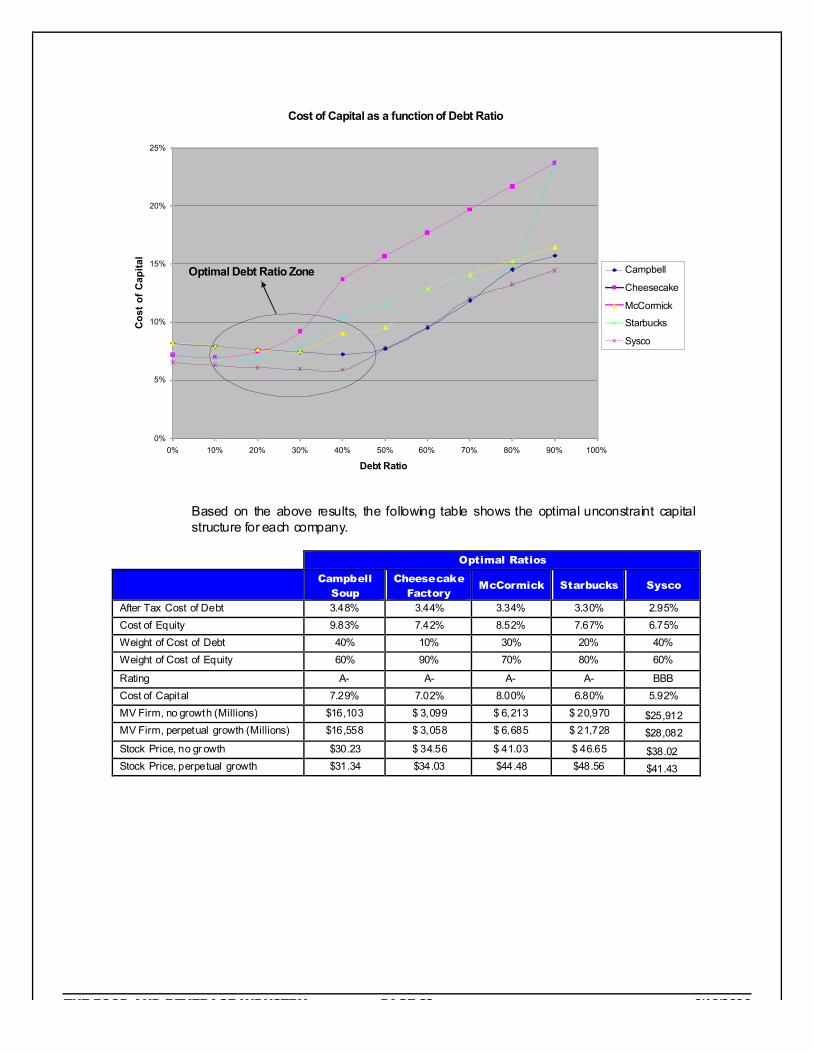
Based on the above results, the following table shows the optimal unconstraint capital structure for each company.
Optimal Ratios
Campbell
Soup Cheesecake
Factory McCormick Starbucks Sysco
After Tax Cost of Debt 3.48% 3.44% 3.34% 3.30% 2.95% Cost of Equity 9.83% 7.42% 8.52% 7.67% 6.75% Weight of Cost of Debt 40% 10% 30% 20% 40% Weight of Cost of Equity 60% 90% 70% 80% 60%
Rating A- A- A- A- BBB Cost of Capital 7.29% 7.02% 8.00% 6.80% 5.92% MV Firm, no growth (Millions) $16,103 $ 3,099 $ 6,213 $ 20,970 $25,912 MV Firm, perpetual growth (Millions) $16,558 $ 3,058 $ 6,685 $ 21,728 $28,082 Stock Price, no gr owth $30.23 $ 34.56 $ 41.03 $ 46.65 $38.02 Stock Price, perpetual growth $31.34 $34.03 $44.48 $48.56 $41.43
THE FOOD AND BEVERAGE INDUSTRY PAGE 23 9/19/2006
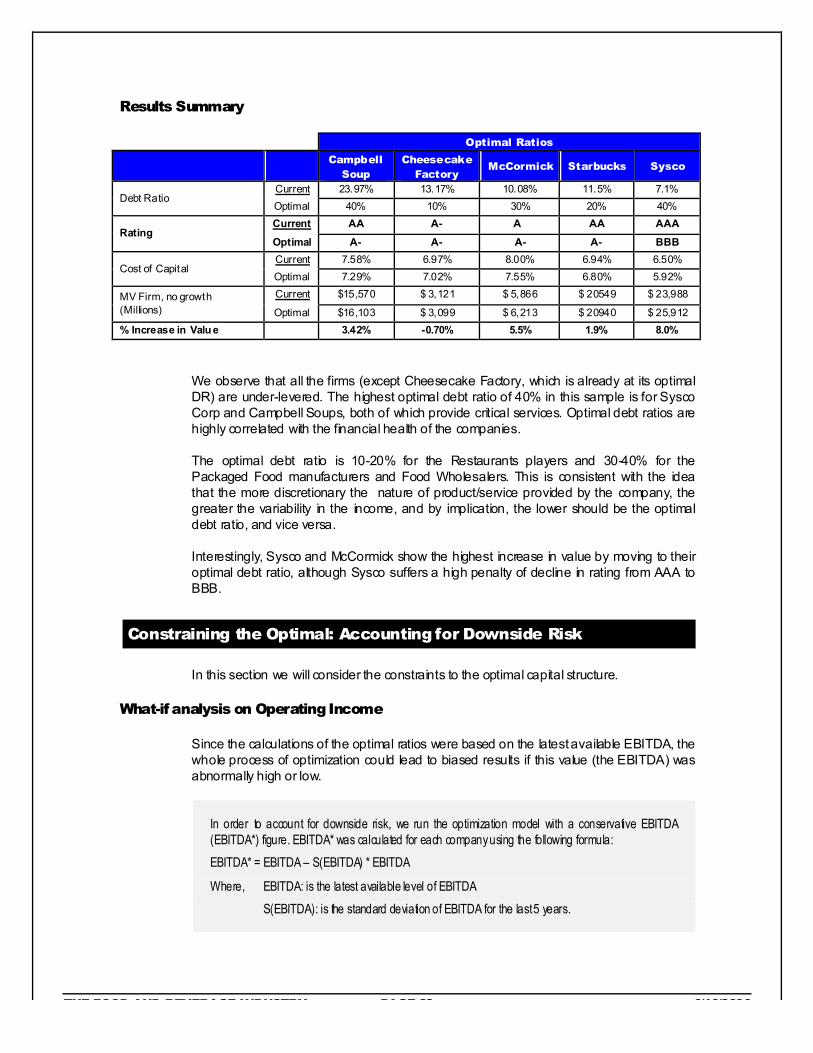
Results Summary
Optimal Ratios
Campbell
Soup Cheesecake
Factory McCormick Starbucks Sysco
Current 23.97% 13.17% 10.08% 11.5% 7.1% Debt Ratio
Optimal 40% 10% 30% 20% 40% Current AA A- A AA AAA
Rating Optimal A- A- A- A- BBB Current 7.58% 6.97% 8.00% 6.94% 6.50%
Cost of Capital Optimal 7.29% 7.02% 7.55% 6.80% 5.92% Current $15,570 $ 3,121 $ 5,866 $ 20549 $ 23,988 MV Firm, no growth
(Millions) Optimal $16,103 $ 3,099 $ 6,213 $ 20940 $ 25,912 % Increase in Value 3.42% -0.70% 5.5% 1.9% 8.0%
We observe that all the firms (except Cheesecake Factory, which is already at its optimal DR) are under-levered. The highest optimal debt ratio of 40% in this sample is for Sysco Corp and Campbell Soups, both of which provide critical services. Optimal debt ratios are highly correlated with the financial health of the companies.
The optimal debt ratio is 10-20% for the Restaurants players and 30-40% for the Packaged Food manufacturers and Food Wholesalers. This is consistent with the idea that the more discretionary the nature of product/service provided by the company, the greater the variability in the income, and by implication, the lower should be the optimal debt ratio, and vice versa.
Interestingly, Sysco and McCormick show the highest increase in value by moving to their optimal debt ratio, although Sysco suffers a high penalty of decline in rating from AAA to BBB.
Constraining the Optimal: Accounting for Downside Risk
In this section we will consider the constraints to the optimal capital structure.
What-if analysis on Operating Income
Since the calculations of the optimal ratios were based on the latest available EBITDA, the whole process of optimization could lead to biased results if this value (the EBITDA) was abnormally high or low.
In order to account for downside risk, we run the optimization model with a conservative EBITDA (EBITDA*) figure. EBITDA* was calculated for each company using the following formula:
EBITDA* = EBITDA – S(EBITDA) * EBITDA
Where, EBITDA: is the latest available level of EBITDA
S(EBITDA): is the standard deviation of EBITDA for the last 5 years.
THE FOOD AND BEVERAGE INDUSTRY PAGE 24 9/19/2006
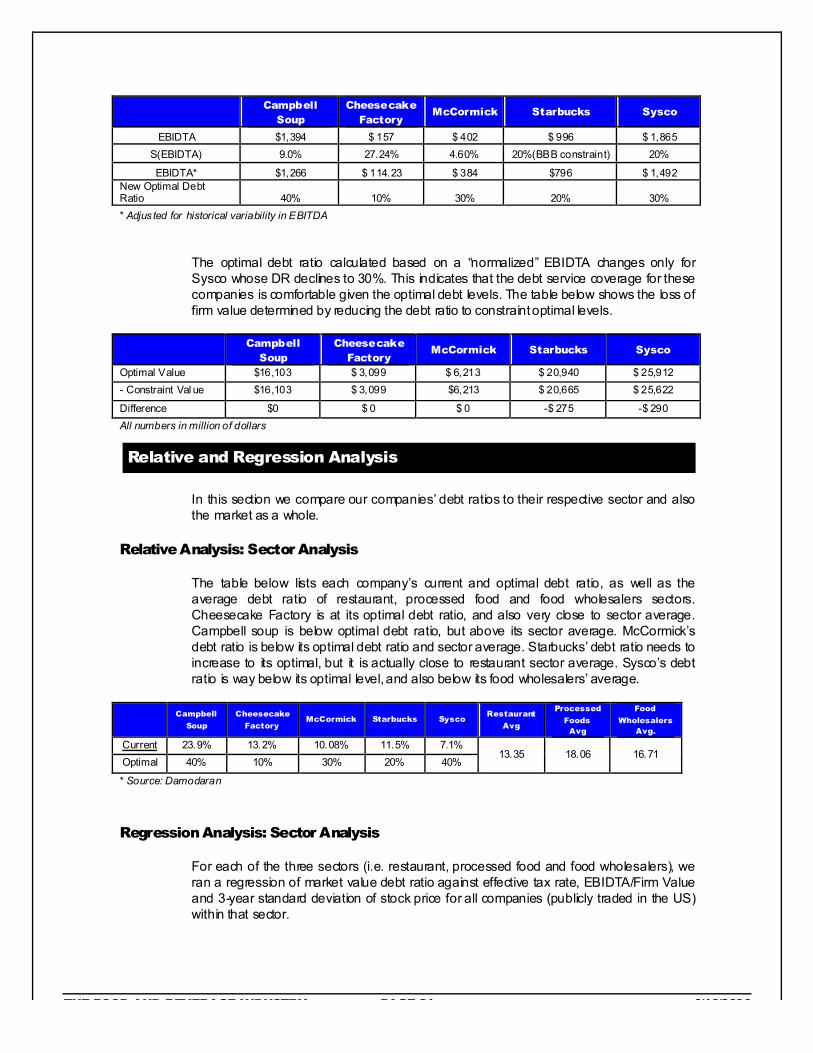
Campbell
Soup Cheesecake
Factory McCormick Starbucks Sysco
EBIDTA $1,394 $ 157 $ 402 $ 996 $ 1,865 S(EBIDTA) 9.0% 27.24% 4.60% 20%(BBB constraint) 20%
EBIDTA* $1,266 $ 114.23 $ 384 $796 $ 1,492 New Optimal Debt Ratio 40% 10% 30% 20% 30% * Adjus ted for historical variability in EBITDA
The optimal debt ratio calculated based on a “normalized” EBIDTA changes only for Sysco whose DR declines to 30%. This indicates that the debt service coverage for these companies is comfortable given the optimal debt levels. The table below shows the loss of firm value determined by reducing the debt ratio to constraint optimal levels.
Campbell
Soup Cheesecake
Factory McCormick Starbucks Sysco
Optimal Value $16,103 $ 3,099 $ 6,213 $ 20,940 $ 25,912 - Constraint Val ue $16,103 $ 3,099 $6,213 $ 20,665 $ 25,622
Difference $0 $ 0 $ 0 -$ 275 -$ 290 All numbers in million of dollars
Relative and Regression Analysis
In this section we compare our companies’ debt ratios to their respective sector and also the market as a whole.
Relative Analysis: Sector Analysis
The table below lists each company’s current and optimal debt ratio, as well as the average debt ratio of restaurant, processed food and food wholesalers sectors. Cheesecake Factory is at its optimal debt ratio, and also very close to sector average. Campbell soup is below optimal debt ratio, but above its sector average. McCormick’s debt ratio is below its optimal debt ratio and sector average. Starbucks’ debt ratio needs to increase to its optimal, but it is actually close to restaurant sector average. Sysco’s debt ratio is way below its optimal level, and also below its food wholesalers’ average.
Campbell
Soup
Cheesecake
Factory McCormick Starbucks Sysco
Restaurant
Avg
Processed
Foods Avg
Food
Wholesalers Avg.
Current 23.9% 13.2% 10.08% 11.5% 7.1% Optimal 40% 10% 30% 20% 40%
13.35 18.06 16.71
* Source: Damodaran
Regression Analysis: Sector Analysis
For each of the three sectors (i.e. restaurant, processed food and food wholesalers), we ran a regression of market value debt ratio against effective tax rate, EBIDTA/Firm Value and 3-year standard deviation of stock price for all companies (publicly traded in the US) within that sector.
THE FOOD AND BEVERAGE INDUSTRY PAGE 25 9/19/2006
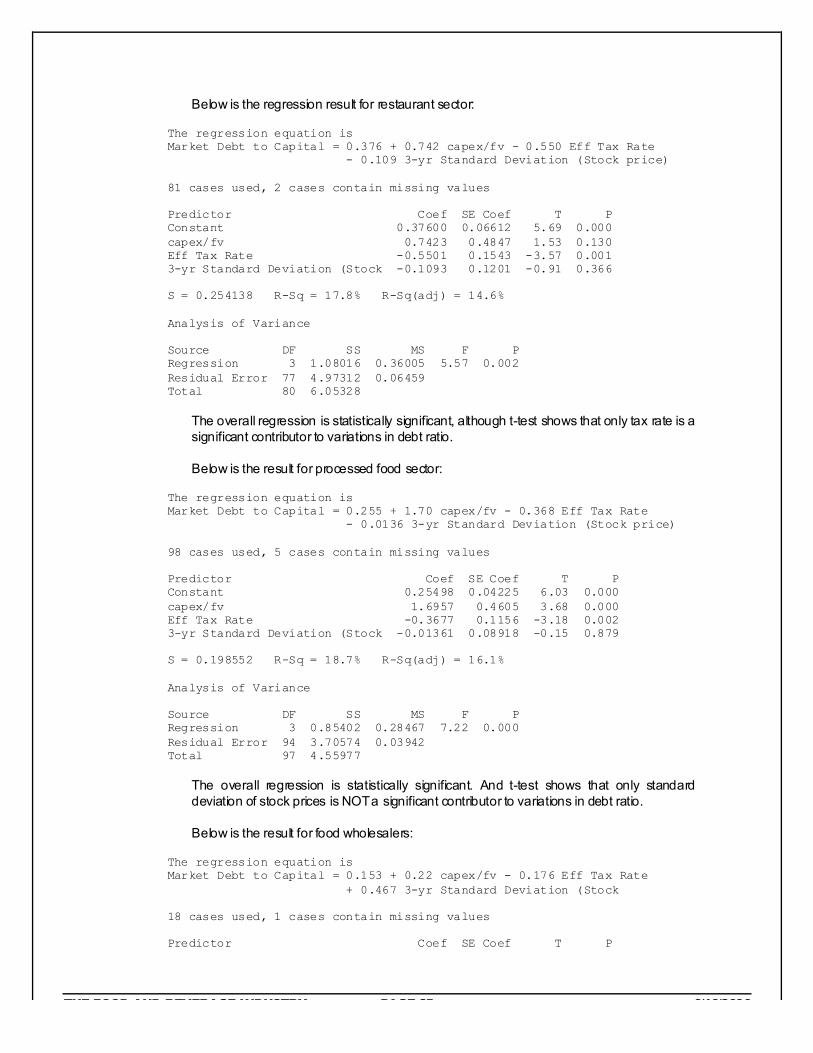
Below is the regression result for restaurant sector:
The regression equation is Market Debt to Capital = 0.376 + 0.742 capex/fv - 0.550 Eff Tax Rate - 0.109 3-yr Standard Deviation (Stock price) 81 cases used, 2 cases contain missing values Predictor Coef SE Coef T P Constant 0.37600 0.06612 5.69 0.000 capex/fv 0.7423 0.4847 1.53 0.130 Eff Tax Rate -0.5501 0.1543 -3.57 0.001 3-yr Standard Deviation (Stock -0.1093 0.1201 -0.91 0.366 S = 0.254138 R-Sq = 17.8% R-Sq(adj) = 14.6%
Analysis of Variance Source DF SS MS F P Regression 3 1.08016 0.36005 5.57 0.002 Residual Error 77 4.97312 0.06459 Total 80 6.05328
The overall regression is statistically significant, although t-test shows that only tax rate is a significant contributor to variations in debt ratio.
Below is the result for processed food sector:
The regression equation is Market Debt to Capital = 0.255 + 1.70 capex/fv - 0.368 Eff Tax Rate - 0.0136 3-yr Standard Deviation (Stock price) 98 cases used, 5 cases contain missing values Predictor Coef SE Coef T P Constant 0.25498 0.04225 6.03 0.000 capex/fv 1.6957 0.4605 3.68 0.000 Eff Tax Rate -0.3677 0.1156 -3.18 0.002 3-yr Standard Deviation (Stock -0.01361 0.08918 -0.15 0.879 S = 0.198552 R-Sq = 18.7% R-Sq(adj) = 16.1% Analysis of Variance Source DF SS MS F P Regression 3 0.85402 0.28467 7.22 0.000 Residual Error 94 3.70574 0.03942 Total 97 4.55977
The overall regression is statistically significant. And t-test shows that only standard deviation of stock prices is NOT a significant contributor to variations in debt ratio.
Below is the result for food wholesalers:
The regression equation is Market Debt to Capital = 0.153 + 0.22 capex/fv - 0.176 Eff Tax Rate + 0.467 3-yr Standard Deviation (Stock 18 cases used, 1 cases contain missing values Predictor Coef SE Coef T P
THE FOOD AND BEVERAGE INDUSTRY PAGE 26 9/19/2006
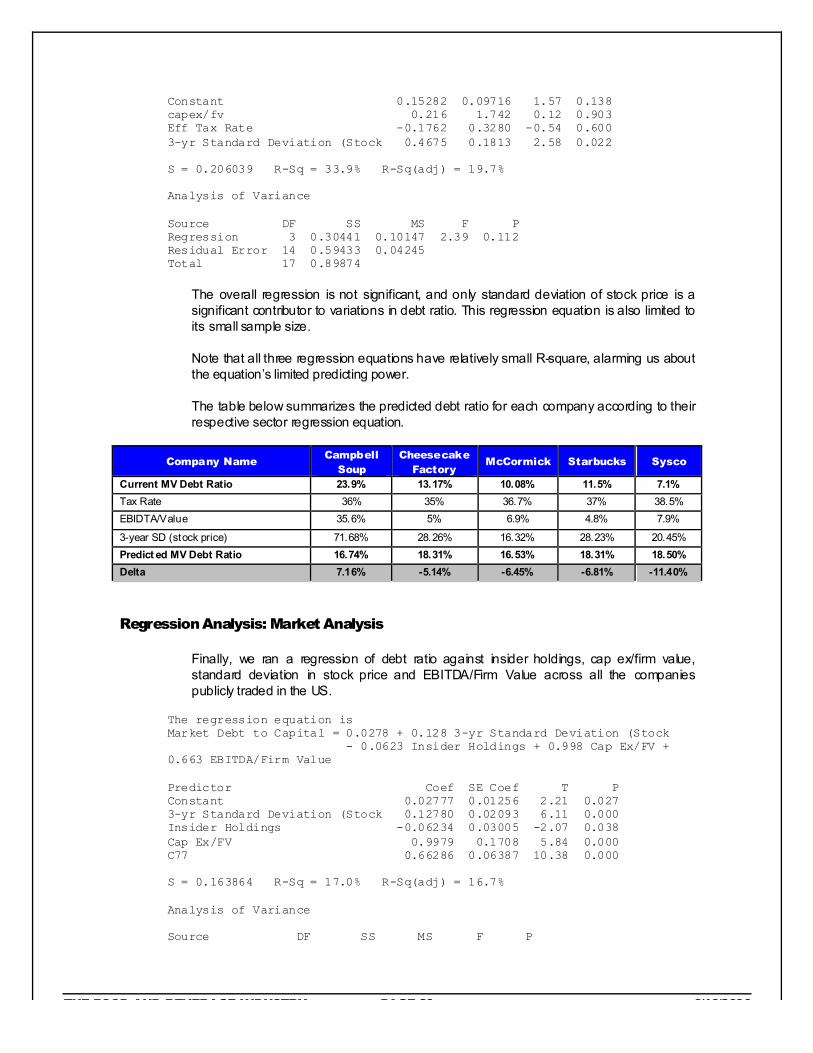
Constant 0.15282 0.09716 1.57 0.138 capex/fv 0.216 1.742 0.12 0.903 Eff Tax Rate -0.1762 0.3280 -0.54 0.600 3-yr Standard Deviation (Stock 0.4675 0.1813 2.58 0.022 S = 0.206039 R-Sq = 33.9% R-Sq(adj) = 19.7% Analysis of Variance Source DF SS MS F P Regression 3 0.30441 0.10147 2.39 0.112 Residual Error 14 0.59433 0.04245 Total 17 0.89874
The overall regression is not significant, and only standard deviation of stock price is a significant contributor to variations in debt ratio. This regression equation is also limited to its small sample size.
Note that all three regression equations have relatively small R-square, alarming us about the equation’s limited predicting power.
The table below summarizes the predicted debt ratio for each company according to their respective sector regression equation.
Company Name Campbell
Soup Cheesecake
Factory McCormick Starbucks Sysco
Current MV Debt Ratio 23.9% 13.17% 10.08% 11.5% 7.1% Tax Rate 36% 35% 36.7% 37% 38.5% EBIDTA/Value 35.6% 5% 6.9% 4.8% 7.9%
3-year SD (stock price) 71.68% 28.26% 16.32% 28.23% 20.45% Predict ed MV Debt Ratio 16.74% 18.31% 16.53% 18.31% 18.50% Delta 7.16% -5.14% -6.45% -6.81% -11.40%
Regression Analysis: Market Analysis
Finally, we ran a regression of debt ratio against insider holdings, cap ex/firm value, standard deviation in stock price and EBITDA/Firm Value across all the companies publicly traded in the US.
The regression equation is Market Debt to Capital = 0.0278 + 0.128 3-yr Standard Deviation (Stock - 0.0623 Insider Holdings + 0.998 Cap Ex/FV + 0.663 EBITDA/Firm Value Predictor Coef SE Coef T P Constant 0.02777 0.01256 2.21 0.027 3-yr Standard Deviation (Stock 0.12780 0.02093 6.11 0.000 Insider Holdings -0.06234 0.03005 -2.07 0.038 Cap Ex/FV 0.9979 0.1708 5.84 0.000 C77 0.66286 0.06387 10.38 0.000 S = 0.163864 R-Sq = 17.0% R-Sq(adj) = 16.7% Analysis of Variance Source DF SS MS F P
THE FOOD AND BEVERAGE INDUSTRY PAGE 27 9/19/2006
Regression 4 7.1160 1.7790 66.25 0.000 Residual Error 1295 34.7726 0.0269 Total 1299 41.8886
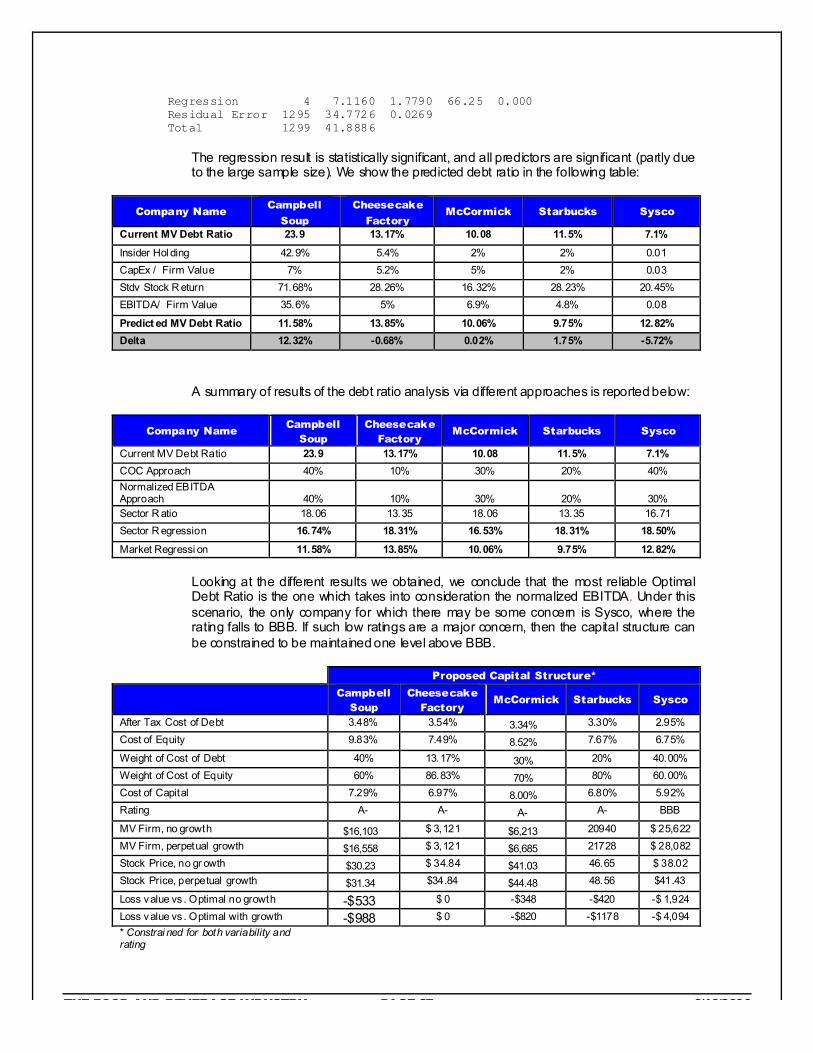
The regression result is statistically significant, and all predictors are significant (partly due to the large sample size). We show the predicted debt ratio in the following table:
Company Name Campbell
Soup
Cheesecake
Factory McCormick Starbucks Sysco
Current MV Debt Ratio 23.9 13.17% 10.08 11.5% 7.1%
Insider Hol ding 42.9% 5.4% 2% 2% 0.01 CapEx / Firm Value 7% 5.2% 5% 2% 0.03 Stdv Stock R eturn 71.68% 28.26% 16.32% 28.23% 20.45% EBITDA/ Firm Value 35.6% 5% 6.9% 4.8% 0.08
Predict ed MV Debt Ratio 11.58% 13.85% 10.06% 9.75% 12.82% Delta 12.32% -0.68% 0.02% 1.75% -5.72%
A summary of results of the debt ratio analysis via different approaches is reported below:
Company Name Campbell
Soup Cheesecake
Factory McCormick Starbucks Sysco
Current MV Debt Ratio 23.9 13.17% 10.08 11.5% 7.1% COC Approach 40% 10% 30% 20% 40% Normalized EBITDA Approach 40% 10% 30% 20% 30% Sector R atio 18.06 13.35 18.06 13.35 16.71 Sector R egression 16.74% 18.31% 16.53% 18.31% 18.50%
Market Regressi on 11.58% 13.85% 10.06% 9.75% 12.82% Looking at the different results we obtained, we conclude that the most reliable Optimal Debt Ratio is the one which takes into consideration the normalized EBITDA. Under this scenario, the only company for which there may be some concern is Sysco, where the rating falls to BBB. If such low ratings are a major concern, then the capital structure can be constrained to be maintained one level above BBB.
Proposed Capital Structure*
Campbell
Soup Cheesecake
Factory McCormick Starbucks Sysco
After Tax Cost of Debt 3.48% 3.54% 3.34% 3.30% 2.95% Cost of Equity 9.83% 7.49% 8.52% 7.67% 6.75%
Weight of Cost of Debt 40% 13.17% 30% 20% 40.00% Weight of Cost of Equity 60% 86.83% 70% 80% 60.00% Cost of Capital 7.29% 6.97% 8.00% 6.80% 5.92% Rating A- A- A- A- BBB
MV Firm, no growth $16,103 $ 3,121 $6,213 20940 $ 25,622 MV Firm, perpetual growth $16,558 $ 3,121 $6,685 21728 $ 28,082 Stock Price, no gr owth $30.23 $ 34.84 $41.03 46.65 $ 38.02 Stock Price, perpetual growth $31.34 $34.84 $44.48 48.56 $41.43
Loss value vs . Optimal no growth -$533 $ 0 -$348 -$420 -$ 1,924 Loss value vs . Optimal with growth -$988 $ 0 -$820 -$1178 -$ 4,094 * Constrai ned for both variability and rating
THE FOOD AND BEVERAGE INDUSTRY PAGE 28 9/19/2006
Figures in Millions except where noted
THE FOOD AND BEVERAGE INDUSTRY PAGE 29 9/19/2006
Chapter
7
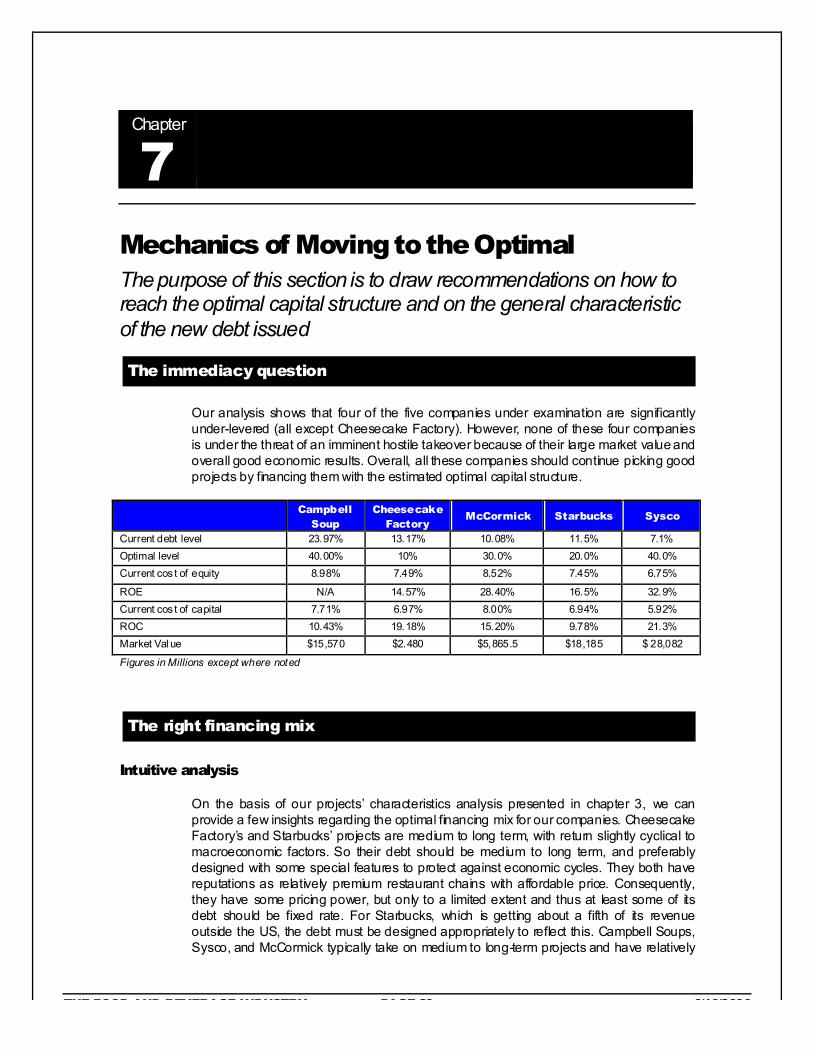
Mechanics of Moving to the Optimal The purpose of this section is to draw recommendations on how to reach the optimal capital structure and on the general characteristic of the new debt issued
The immediacy question
Our analysis shows that four of the five companies under examination are significantly under-levered (all except Cheesecake Factory). However, none of these four companies is under the threat of an imminent hostile takeover because of their large market value and overall good economic results. Overall, all these companies should continue picking good projects by financing them with the estimated optimal capital structure.
Campbell
Soup Cheesecake
Factory McCormick Starbucks Sysco
Current debt level 23.97% 13.17% 10.08% 11.5% 7.1% Optimal level 40.00% 10% 30.0% 20.0% 40.0% Current cos t of equity 8.98% 7.49% 8.52% 7.45% 6.75%
ROE N/A 14.57% 28.40% 16.5% 32.9% Current cos t of capital 7.71% 6.97% 8.00% 6.94% 5.92% ROC 10.43% 19.18% 15.20% 9.78% 21.3% Market Val ue $15,570 $2.480 $5,865.5 $18,185 $ 28,082
Figures in Millions except where noted
The right financing mix
Intuitive analysis
On the basis of our projects’ characteristics analysis presented in chapter 3, we can provide a few insights regarding the optimal financing mix for our companies. Cheesecake Factory’s and Starbucks’ projects are medium to long term, with return slightly cyclical to macroeconomic factors. So their debt should be medium to long term, and preferably designed with some special features to protect against economic cycles. They both have reputations as relatively premium restaurant chains with affordable price. Consequently, they have some pricing power, but only to a limited extent and thus at least some of its debt should be fixed rate. For Starbucks, which is getting about a fifth of its revenue outside the US, the debt must be designed appropriately to reflect this. Campbell Soups, Sysco, and McCormick typically take on medium to long-term projects and have relatively
THE FOOD AND BEVERAGE INDUSTRY PAGE 30 9/19/2006
lower pricing power although their operating income is likely to vary less with the economic cycles as their products/services are more fundamentally necessary than that of Starbucks or Cheesecake Factory. Hence, they should issue medium to long-term floating rate debt, mostly in US currency to reflect the mix of their businesses.
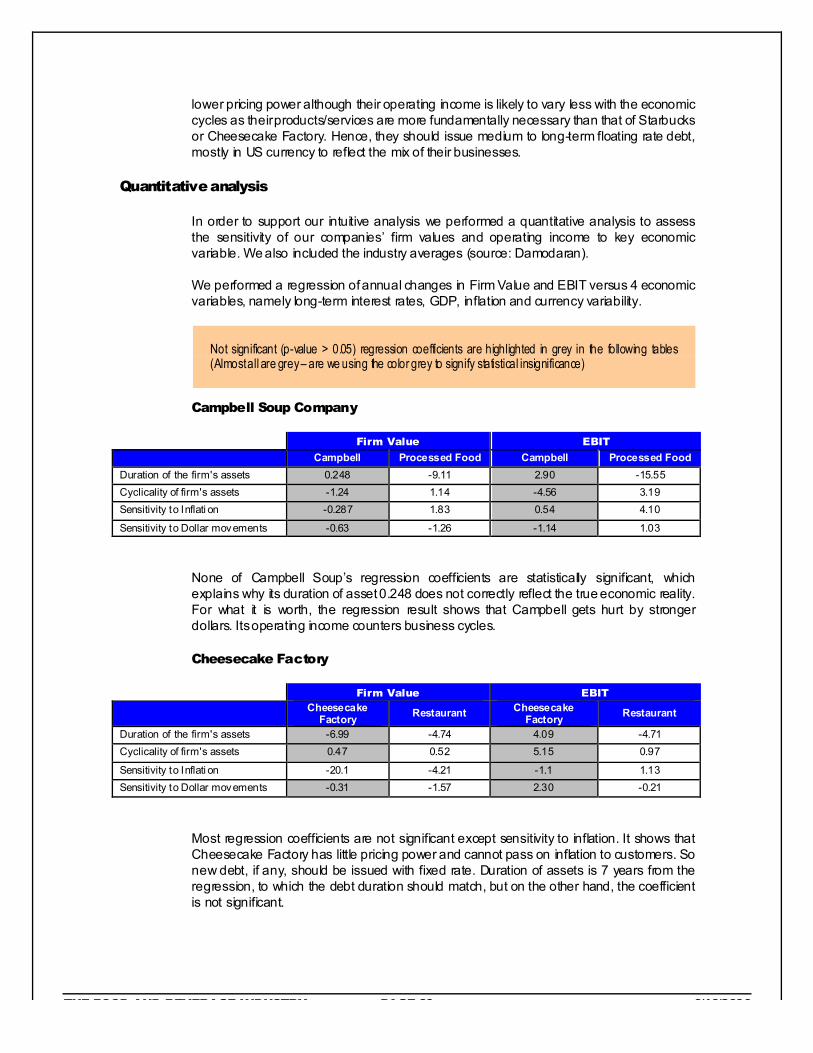
Quantitative analysis
In order to support our intuitive analysis we performed a quantitative analysis to assess the sensitivity of our companies’ firm values and operating income to key economic variable. We also included the industry averages (source: Damodaran).
We performed a regression of annual changes in Firm Value and EBIT versus 4 economic variables, namely long-term interest rates, GDP, inflation and currency variability.
Not significant (p-value > 0.05) regression coefficients are highlighted in grey in the following tables (Almost all are grey – are we using the color grey to signify statistical insignificance)
Campbell Soup Company
Firm Value EBIT
Campbell Processed Food Campbell Processed Food Duration of the firm's assets 0.248 -9.11 2.90 -15.55 Cyclicality of firm's assets -1.24 1.14 -4.56 3.19 Sensitivity to Inflati on -0.287 1.83 0.54 4.10
Sensitivity to Dollar movements -0.63 -1.26 -1.14 1.03
None of Campbell Soup’s regression coefficients are statistically significant, which explains why its duration of asset 0.248 does not correctly reflect the true economic reality. For what it is worth, the regression result shows that Campbell gets hurt by stronger dollars. Its operating income counters business cycles.
Cheesecake Factory
Firm Value EBIT
Cheesecake Factory Restaurant Cheesecake
Factory Restaurant
Duration of the firm's assets -6.99 -4.74 4.09 -4.71 Cyclicality of firm's assets 0.47 0.52 5.15 0.97
Sensitivity to Inflati on -20.1 -4.21 -1.1 1.13 Sensitivity to Dollar movements -0.31 -1.57 2.30 -0.21
Most regression coefficients are not significant except sensitivity to inflation. It shows that Cheesecake Factory has little pricing power and cannot pass on inflation to customers. So new debt, if any, should be issued with fixed rate. Duration of assets is 7 years from the regression, to which the debt duration should match, but on the other hand, the coefficient is not significant.
THE FOOD AND BEVERAGE INDUSTRY PAGE 31 9/19/2006
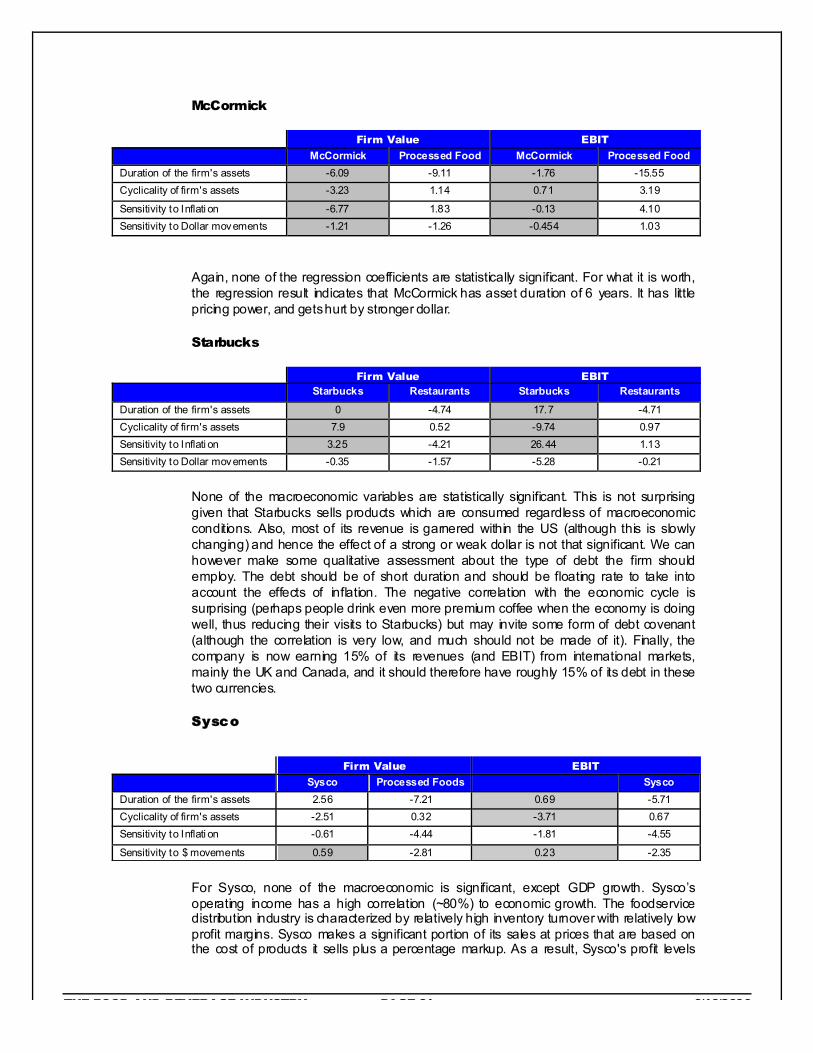
McCormick
Firm Value EBIT
McCormick Processed Food McCormick Processed Food Duration of the firm's assets -6.09 -9.11 -1.76 -15.55 Cyclicality of firm's assets -3.23 1.14 0.71 3.19
Sensitivity to Inflati on -6.77 1.83 -0.13 4.10 Sensitivity to Dollar movements -1.21 -1.26 -0.454 1.03
Again, none of the regression coefficients are statistically significant. For what it is worth, the regression result indicates that McCormick has asset duration of 6 years. It has little pricing power, and gets hurt by stronger dollar.
Starbucks
Firm Value EBIT Starbucks Restaurants Starbucks Restaurants
Duration of the firm's assets 0 -4.74 17.7 -4.71 Cyclicality of firm's assets 7.9 0.52 -9.74 0.97 Sensitivity to Inflati on 3.25 -4.21 26.44 1.13 Sensitivity to Dollar movements -0.35 -1.57 -5.28 -0.21
None of the macroeconomic variables are statistically significant. This is not surprising given that Starbucks sells products which are consumed regardless of macroeconomic conditions. Also, most of its revenue is garnered within the US (although this is slowly changing) and hence the effect of a strong or weak dollar is not that significant. We can however make some qualitative assessment about the type of debt the firm should employ. The debt should be of short duration and should be floating rate to take into account the effects of inflation. The negative correlation with the economic cycle is surprising (perhaps people drink even more premium coffee when the economy is doing well, thus reducing their visits to Starbucks) but may invite some form of debt covenant (although the correlation is very low, and much should not be made of it). Finally, the company is now earning 15% of its revenues (and EBIT) from international markets, mainly the UK and Canada, and it should therefore have roughly 15% of its debt in these two currencies.
Sysco
For Sysco, none of the macroeconomic is significant, except GDP growth. Sysco’s operating income has a high correlation (~80%) to economic growth. The foodservice distribution industry is characterized by relatively high inventory turnover with relatively low profit margins. Sysco makes a significant portion of its sales at prices that are based on the cost of products it sells plus a percentage markup. As a result, Sysco's profit levels
Firm Value EBIT
Sysco Processed Foods Sysco Duration of the firm's assets 2.56 -7.21 0.69 -5.71 Cyclicality of firm's assets -2.51 0.32 -3.71 0.67 Sensitivity to Inflati on -0.61 -4.44 -1.81 -4.55
Sensitivity to $ movements 0.59 -2.81 0.23 -2.35
THE FOOD AND BEVERAGE INDUSTRY PAGE 32 9/19/2006
may be negatively impacted during periods of product cost deflation, even though Sysco’s gross profit percentage may remain relatively constant. Prolonged periods of product cost inflation may also have a negative impact on the company's profit margins and earnings to the extent such product cost increases are not passed on to customers due to resistance to higher prices. The foodservice industry is sensitive to national and regional economic conditions. Inflation, fuel costs and other factors affecting consumer confidence and the frequency and amount spent by consumers for food prepared away from home may negatively impact the company’s sales and operating results. The company’s operating results are also sensitive to, and may be adversely affected by, other factors, including difficulties in the collection of accounts receivable, competitive price pressures, severe weather conditions and unexpected increases in fuel or other transportation-related costs. Although these factors have not had a material adverse impact on the company’s past operations, one or more of these factors may adversely affect future operating results. Since Sysco’s operations are primarily based in North America, the operating income and the firm value are not particularly sensitive to movement in US $. Based on the above analysis, the Sysco’s debt should be medium term, dollar denominated and some component of debt should be floating interest rate.
THE FOOD AND BEVERAGE INDUSTRY PAGE 33 9/19/2006
Chapter
8
Dividend Policy The purpose of this section is to analyze how much the firm has returned to stockholders in the past, and to assess from a qualitative perspective whether it should return more or less
Dividend Policy and Industry Comparison
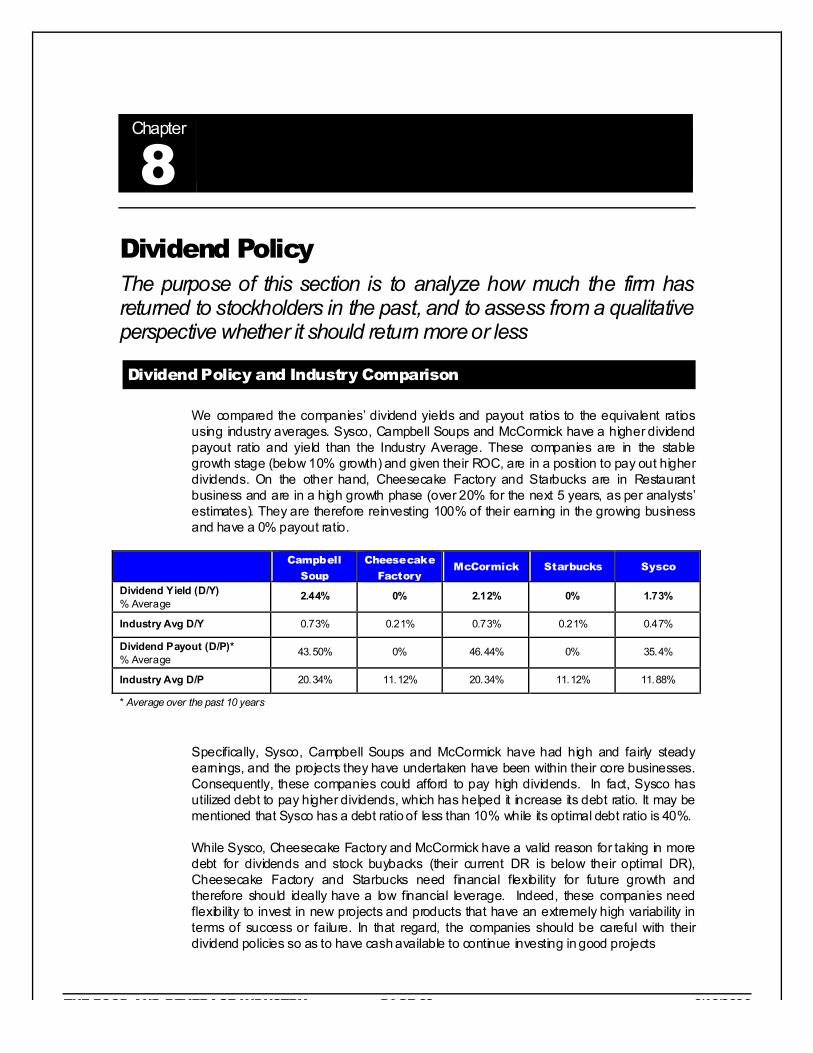
We compared the companies’ dividend yields and payout ratios to the equivalent ratios using industry averages. Sysco, Campbell Soups and McCormick have a higher dividend payout ratio and yield than the Industry Average. These companies are in the stable growth stage (below 10% growth) and given their ROC, are in a position to pay out higher dividends. On the other hand, Cheesecake Factory and Starbucks are in Restaurant business and are in a high growth phase (over 20% for the next 5 years, as per analysts’ estimates). They are therefore reinvesting 100% of their earning in the growing business and have a 0% payout ratio.
Campbell
Soup
Cheesecake
Factory McCormick Starbucks Sysco
Dividend Yield (D/Y) % Average
2.44% 0% 2.12% 0% 1.73%
Industry Avg D/Y 0.73% 0.21% 0.73% 0.21% 0.47%
Dividend Payout (D/P)* % Average
43.50% 0% 46.44% 0% 35.4%
Industry Avg D/P 20.34% 11.12% 20.34% 11.12% 11.88%
* Average over the past 10 years
Specifically, Sysco, Campbell Soups and McCormick have had high and fairly steady earnings, and the projects they have undertaken have been within their core businesses. Consequently, these companies could afford to pay high dividends. In fact, Sysco has utilized debt to pay higher dividends, which has helped it increase its debt ratio. It may be mentioned that Sysco has a debt ratio of less than 10% while its optimal debt ratio is 40%.
While Sysco, Cheesecake Factory and McCormick have a valid reason for taking in more debt for dividends and stock buybacks (their current DR is below their optimal DR), Cheesecake Factory and Starbucks need financial flexibility for future growth and therefore should ideally have a low financial leverage. Indeed, these companies need flexibility to invest in new projects and products that have an extremely high variability in terms of success or failure. In that regard, the companies should be careful with their dividend policies so as to have cash available to continue investing in good projects

THE FOOD AND BEVERAGE INDUSTRY PAGE 34 9/19/2006
Finally, stock prices have traditionally not been affected by the firms’ dividend policies, but rather by macroeconomic trends. Stockholder expectations on the firms are driven by expectations of future growth from investments rather than by the dividend policies of the companies in this sector. Similarly, future cash flows to the firms are more related to expectations of investment in good projects. Consequently, dividend policy is not always the means used to signal financial markets. At the same time, initiation of dividend payout can at times signal that the company no longer has good investment projects on its plate and hence future growth is expected to slow down. That may be taken as a negative signal by the stock markets.
Summary of Conclusions
Dividend Yield Restaurant: Bel ow sector average for Starbucks and Cheesecake Factory Food Processi ng: Above average for McCormick and Campbell Soups Food Wholesalers: Greater than sector average for Sysco
Dividend Payout Restaurant: Bel ow sector average for Starbucks and Cheesecake Factory Food Processi ng: Above average for McCormick and Campbell Soups Food Wholesalers: Greater than sector average for Sysco
Signaling Incentives Dividend policy may be used to attract i nvestors who prefer a s teady dividend – the so called “dividend addicts”. Generally, dividends are not used to signal incentives to institutional and other market savvy i nvestors.
Type of Stockholders The marginal investor is the i nstitutional inves tors for all companies , who prefer capital appreciati on over dividends
Effects on Flexibility High dividends reduce equity val ue and increase D ebt R atio. This may reduce the financial flexi bility for hi gh growth firms. For stable growth firms, dividend payout funded by new debt can be a way of increasi ng debt rati o for under levered firms.
HISTORICAL DIVIDEND POLICIES
Campbell Soup Company
Dec-04 Dec-03 Dec-02 Dec-01 Dec-00 Dividend Paid 259 259 286 374 384 Stock Buyback 56 24 5 681 394
Total Cash to Shareholders 315 283 291 992 778 Dividend Yield % 2.44% 2.60% 3.14% 2.85% 3.08% Dividend Payout % 43.5% 54.5% 57.6% 53.8% 53.3%
Figures in Millions except where noted
Averages: Dividend Yield = 2.91% Dividend Payout = 41.34%
THE FOOD AND BEVERAGE INDUSTRY PAGE 35 9/19/2006
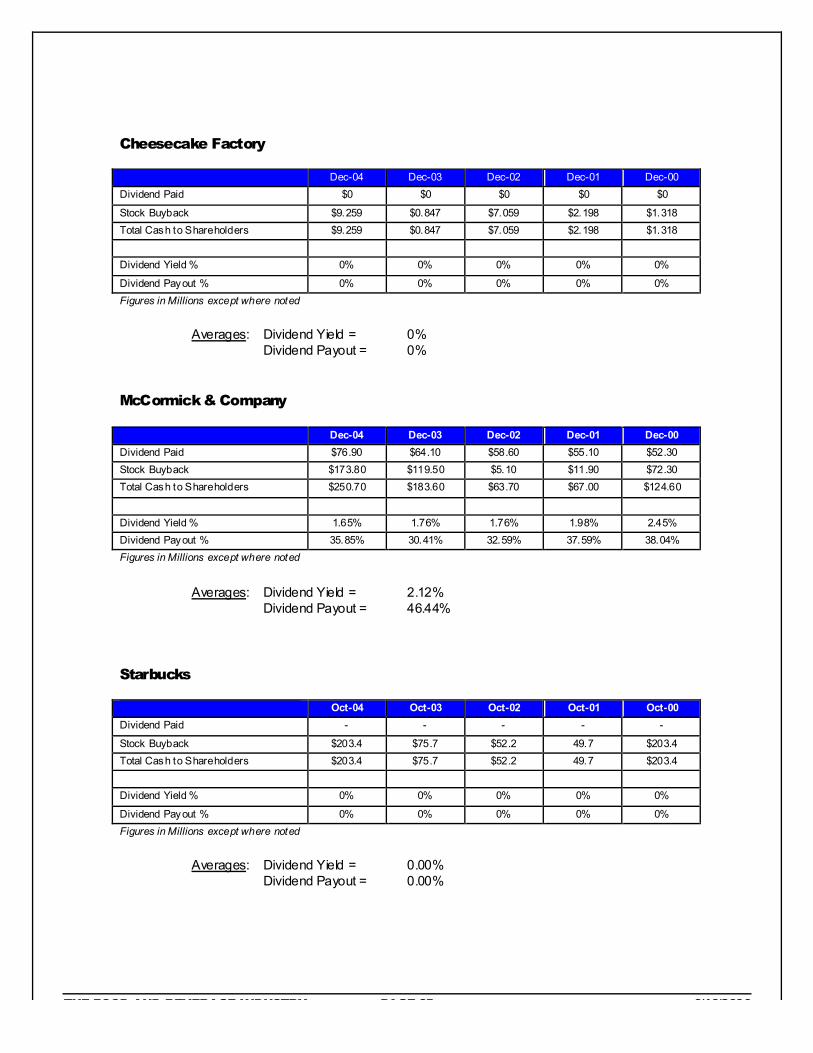
Cheesecake Factory
Dec-04 Dec-03 Dec-02 Dec-01 Dec-00 Dividend Paid $0 $0 $0 $0 $0
Stock Buyback $9.259 $0.847 $7.059 $2.198 $1.318 Total Cash to Shareholders $9.259 $0.847 $7.059 $2.198 $1.318 Dividend Yield % 0% 0% 0% 0% 0%
Dividend Payout % 0% 0% 0% 0% 0% Figures in Millions except where noted Dec-04 Dec-03 Dec-02 Dec-01 Dec-00
Averages: Dividend Yield = 0% Dividend Payout = 0%
McCormick & Company
Dec-04 Dec-03 Dec-02 Dec-01 Dec-00 Dividend Paid $76.90 $64.10 $58.60 $55.10 $52.30 Stock Buyback $173.80 $119.50 $5.10 $11.90 $72.30 Total Cash to Shareholders $250.70 $183.60 $63.70 $67.00 $124.60
Dividend Yield % 1.65% 1.76% 1.76% 1.98% 2.45% Dividend Payout % 35.85% 30.41% 32.59% 37.59% 38.04% Figures in Millions except where noted
Averages: Dividend Yield = 2.12% Dividend Payout = 46.44%
Starbucks
Oct-04 Oct-03 Oct-02 Oct-01 Oct-00 Dividend Paid - - - - -
Stock Buyback $203.4 $75.7 $52.2 49.7 $203.4 Total Cash to Shareholders $203.4 $75.7 $52.2 49.7 $203.4 Dividend Yield % 0% 0% 0% 0% 0%
Dividend Payout % 0% 0% 0% 0% 0% Figures in Millions except where noted
Averages: Dividend Yield = 0.00% Dividend Payout = 0.00%

THE FOOD AND BEVERAGE INDUSTRY PAGE 36 9/19/2006
Sysco
Jul-04 Jul -03 Jul -02 Jul -01 Jul -00 Dividend Paid $309.50 $261.90 $213.30 $173.70 $145.40 Stock Buyback $608.50 $478.50 $473.60 $428.20 $186.00 Total Cash to Shareholders $918.00 $740.40 $686.90 $601.90 $331.40 Dividend Yield % 1.44% 1.35% 1.18% 0.96% 0.81%
Dividend Payout % 35.40% 33.60% 31.40% 29.10% 32.60% Figures in Millions except where noted
Averages: Dividend Yield = 1.15% Dividend Payout = 32.42%
THE FOOD AND BEVERAGE INDUSTRY PAGE 37 9/19/2006
Chapter
9
A Framework for Analyzing Dividends The purpose of this section is to assess how much the firms could have returned to stockholders and whether they should be returning more or less.
Affordable Dividends
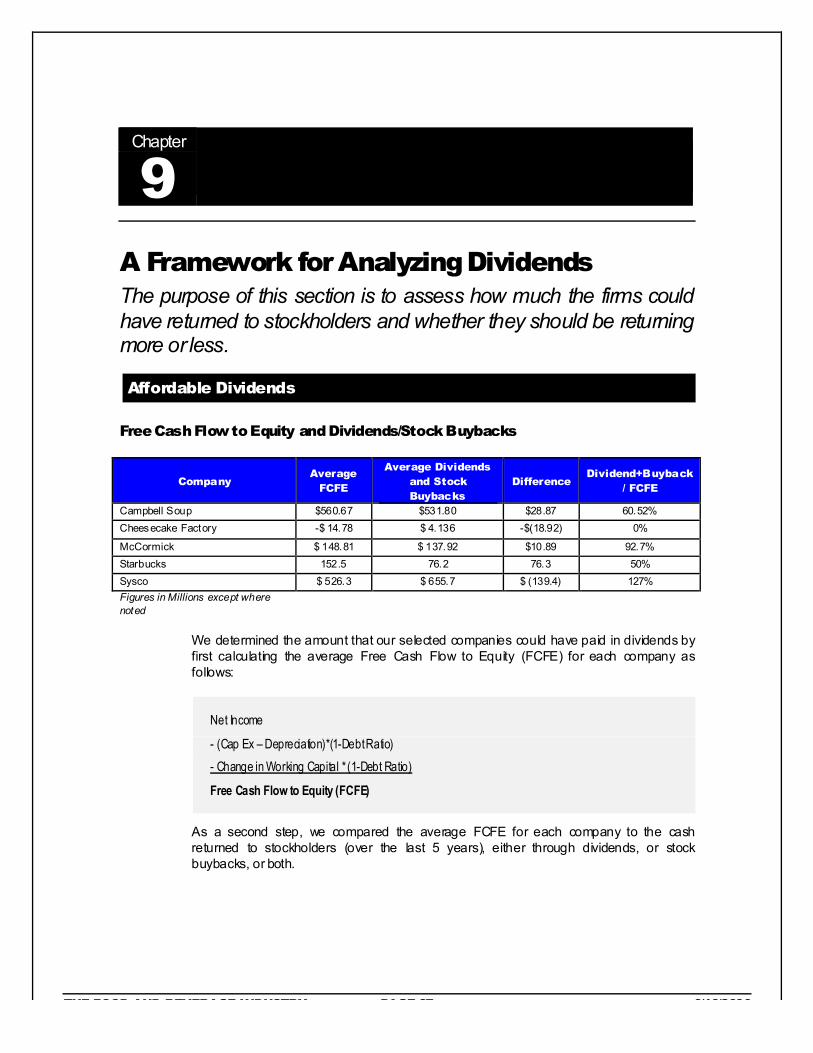
Free Cash Flow to Equity and Dividends/Stock Buybacks
Company Average
FCFE
Average Dividends and Stock Buybacks
Difference Dividend+Buyback
/ FCFE
Campbell Soup $560.67 $531.80 $28.87 60.52% Cheesecake Factory -$ 14.78 $ 4.136 -$(18.92) 0%
McCormick $ 148.81 $ 137.92 $10.89 92.7% Starbucks 152.5 76.2 76.3 50% Sysco $ 526.3 $ 655.7 $ (139.4) 127% Figures in Millions except where noted
We determined the amount that our selected companies could have paid in dividends by first calculating the average Free Cash Flow to Equity (FCFE) for each company as follows:
Net Income
- (Cap Ex – Depreciation)*(1-Debt Ratio)
- Change in Working Capital * (1-Debt Ratio)
Free Cash Flow to Equity (FCFE)
As a second step, we compared the average FCFE for each company to the cash returned to stockholders (over the last 5 years), either through dividends, or stock buybacks, or both.

THE FOOD AND BEVERAGE INDUSTRY PAGE 38 9/19/2006
% of FCFE returned to shareholders
0.00%
20.00%
40.00%
60.00%
80.00%
100.00%
120.00%
140.00%
Campbell Soup McCormick Starbucks Sysco
% F
CF
E r
etu
rn
ed
*Cheesecake Factory not shown as average FCFE is negative
• From the graph, it is clear that Campbell Soup, McCormick, and Starbucks are returning between 50 and 100% of the FCFE to shareholders, whereas Sysco is returning over 100% of the FCFE by taking on more debt. Cheesecake Factory is paying back shareholders even though it has a negative average FCFE.
• Cheesecake Factory and Starbucks return wealth to Shareholders only via stock buybacks, whereas the other firms return wealth to shareholders via both stock buybacks and dividends. Since Cheesecake Factory and Starbucks sell relatively more “discretionary” products with potentially greater variation in operating incomes, it makes sense for them not to get bound by dividends and retain flexibility for future financing needs.
• Sysco is returning an amount greater than its average FCFE. This could be an attempt by Sysco to recapitalize itself by taking on more debt and moving towards its optimal debt ratio (i.e. from 7.1% to 40%). However, the rate of recapitalization is very slow and unlikely to make a major dent on the capital structure in the near future.
• Given that marginal investors for all our firms are institutional investors who probably prefer stock capital gains to dividend payouts, there is little incentive for these firms to pay out a dividend as compared to doing stock buybacks.

THE FOOD AND BEVERAGE INDUSTRY PAGE 39 9/19/2006
Management Trust and Changing Dividend Policy
In order to determine the excess return of the chosen projects to the firm and equity investors, we compared the Return on Equity (ROE) against the Required Return and the Return on Stock against the Required Return.
Company Return on
Equity (ROE) Return on
Stock Required Return
ROE - Required Return
Actual - Required Return
Campbell Soup Co. N/A N/A N/A N/A% N/A Cheesecake Factory 15.7% 15.9% 1.4% 14.3% 14.5% McCormick 28.4% 25.6% 0.1% 28.3% 25.5% Starbucks 13.7% 25.9% 1.2% 12.5% 24.6% Sysco 38.5% 13.4% 1.7% 36.8% 11.7%
Overall, we can state that the managers at these firms have been taking on good projects. Indeed, the high excess returns of the ROE over the Required Return (see above) vouches for a good choice of projects. However, this also suggests that these companies could pay out fewer dividends and still take good projects.
Additionally, the choice of investments made during the period of analysis earned more than the hurdle rates required by equity investors, which very likely won the stockholders’ trust in their companies’ management.
Specifically, our analysis tells us that Starbucks, Cheesecake Factory and McCormick could afford and should pay out fewer dividends and keep on choosing great projects; Campbell does not have a lot of leeway and should pay dividends, while Sysco can gain in firm value by paying out dividends and increasing debt ratio to optimal.
Market Comparison
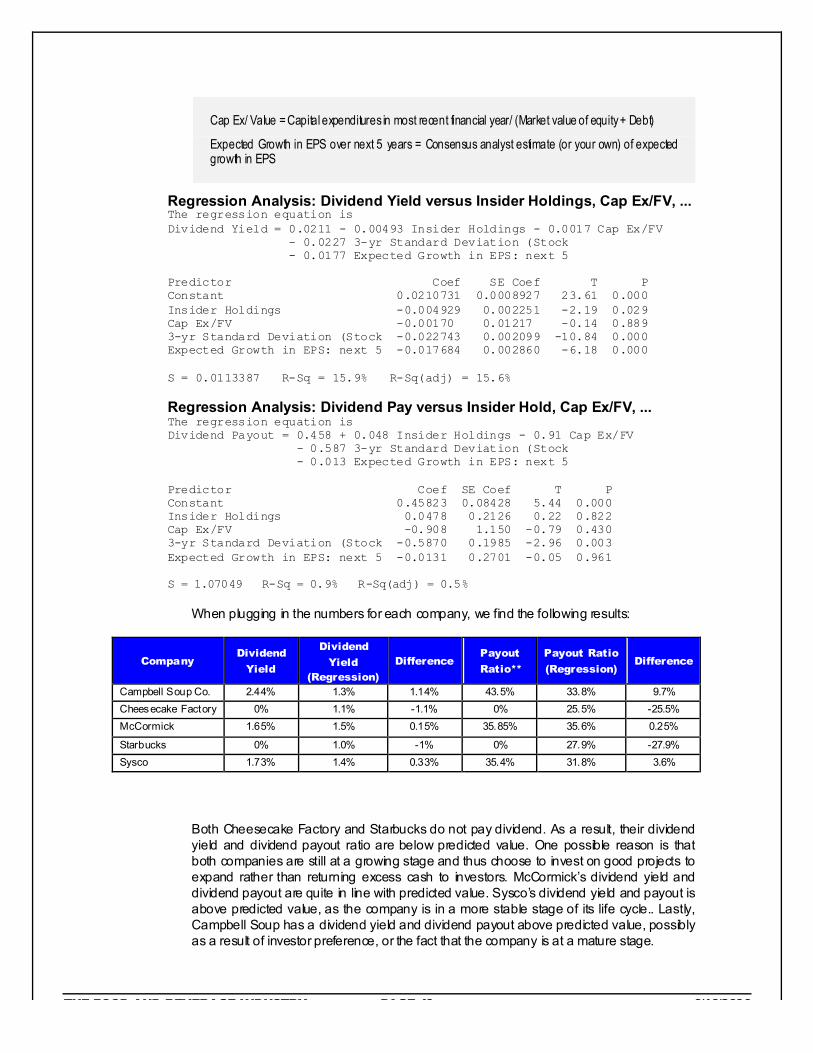
To compare dividend yields and payout ratios with the market, we used the following regression equations:
Expected Dividend yield = 0.0211 –0.00493 Insider Holdings – 0.0017 Cap Ex/ Value of Firm – 0.0227 Standard Deviation – 0.0177 Expected Growth in EPS
Expected Dividend Payout = 0.458 + 0.048 Insider Holdings – 0.91 Cap Ex/ Value of Firm – 0.587 Standard Deviation – 0.013 Expected Growth in EPS
Variables used in these regressions:
Dividend Yield = Dividends per share in most recent year/ Current Stock Price
Dividend Payout Ratio = Dividends / Net Income
Insider Holdings = Shares held by insiders/ Primary number of shares outstanding
Standard Deviation = Annualized Standard deviation in stock prices over last 3 years
THE FOOD AND BEVERAGE INDUSTRY PAGE 40 9/19/2006
Cap Ex/ Value = Capital expenditures in most recent financial year/ (Market value of equity + Debt)
Expected Growth in EPS over next 5 years = Consensus analyst estimate (or your own) of expected growth in EPS
Regression Analysis: Dividend Yield versus Insider Holdings, Cap Ex/FV, ... The regression equation is Dividend Yield = 0.0211 - 0.00493 Insider Holdings - 0.0017 Cap Ex/FV - 0.0227 3-yr Standard Deviation (Stock - 0.0177 Expected Growth in EPS: next 5 Predictor Coef SE Coef T P Constant 0.0210731 0.0008927 23.61 0.000 Insider Holdings -0.004929 0.002251 -2.19 0.029 Cap Ex/FV -0.00170 0.01217 -0.14 0.889 3-yr Standard Deviation (Stock -0.022743 0.002099 -10.84 0.000 Expected Growth in EPS: next 5 -0.017684 0.002860 -6.18 0.000 S = 0.0113387 R-Sq = 15.9% R-Sq(adj) = 15.6%
Regression Analysis: Dividend Pay versus Insider Hold, Cap Ex/FV, ... The regression equation is Dividend Payout = 0.458 + 0.048 Insider Holdings - 0.91 Cap Ex/FV - 0.587 3-yr Standard Deviation (Stock - 0.013 Expected Growth in EPS: next 5 Predictor Coef SE Coef T P Constant 0.45823 0.08428 5.44 0.000 Insider Holdings 0.0478 0.2126 0.22 0.822 Cap Ex/FV -0.908 1.150 -0.79 0.430 3-yr Standard Deviation (Stock -0.5870 0.1985 -2.96 0.003 Expected Growth in EPS: next 5 -0.0131 0.2701 -0.05 0.961 S = 1.07049 R-Sq = 0.9% R-Sq(adj) = 0.5%
When plugging in the numbers for each company, we find the following results:
Company Dividend
Yield
Dividend
Yield (Regression)
Difference Payout
Ratio**
Payout Ratio
(Regression) Difference
Campbell Soup Co. 2.44% 1.3% 1.14% 43.5% 33.8% 9.7% Cheesecake Factory 0% 1.1% -1.1% 0% 25.5% -25.5% McCormick 1.65% 1.5% 0.15% 35.85% 35.6% 0.25%
Starbucks 0% 1.0% -1% 0% 27.9% -27.9% Sysco 1.73% 1.4% 0.33% 35.4% 31.8% 3.6%
Both Cheesecake Factory and Starbucks do not pay dividend. As a result, their dividend yield and dividend payout ratio are below predicted value. One possible reason is that both companies are still at a growing stage and thus choose to invest on good projects to expand rather than returning excess cash to investors. McCormick’s dividend yield and dividend payout are quite in line with predicted value. Sysco’s dividend yield and payout is above predicted value, as the company is in a more stable stage of its life cycle.. Lastly, Campbell Soup has a dividend yield and dividend payout above predicted value, possibly as a result of investor preference, or the fact that the company is at a mature stage.

THE FOOD AND BEVERAGE INDUSTRY PAGE 41 9/19/2006
However, please note that these results only explain up to 16% of the differences in dividend measures (R-Square is 15.9% for dividend yield and only 0.9% for dividend payout).

THE FOOD AND BEVERAGE INDUSTRY PAGE 42 9/19/2006
Chapter
10
Valuation In this final section we value the stocks based on the building blocks developed so far
The Discounting Model – Assumptions
Free Cash Flow to Firm/Equity Discount model
In order to evaluate our companies’ stock, we have chosen among three alternative Discounting Cash Flow (DCF) models:
• The Dividend Discount model (D DM)
• The Free Cash Flow to Equity Discount model (FCFE DM)
• The Free Cash Flow to Firm Discount model (FCFF DM)
For Cheesecake Factory and Starbucks, we have used the FCFE model. Cheesecake Factory is already at its optimal debt level, and is not likely to take on additional debt. Although Starbuck’s current debt level of 11.5% is lower than its debt level optimal of 20%, it is unlikely to taken on additional debt based on its historical approach, as well as the fact that it is expanding rapidly (within the US, but also internationally) and would like to retain financing flexibility and hence stay below its optimal debt level. Accordingly, the value of the firms is assessed by discounting the expected cash flows to equity using the cost of equity.
For Sysco, the current debt ratio is 6.6%, which is way below its optimal debt ratio of 40%. However, as in the case of Starbucks, no further material increase in debt ratio is predicted. Accordingly, we have used the FCFF model to value the firm.
Main Assumptions
FCFE model
The firm specific assumptions are split between the “high growth” period and the “stable” period. The “stable” period assumptions are used to calculate the companies’ terminal value while the “high growth” assumptions are the basis for calculating the companies’ value in the time they earn above industry returns.
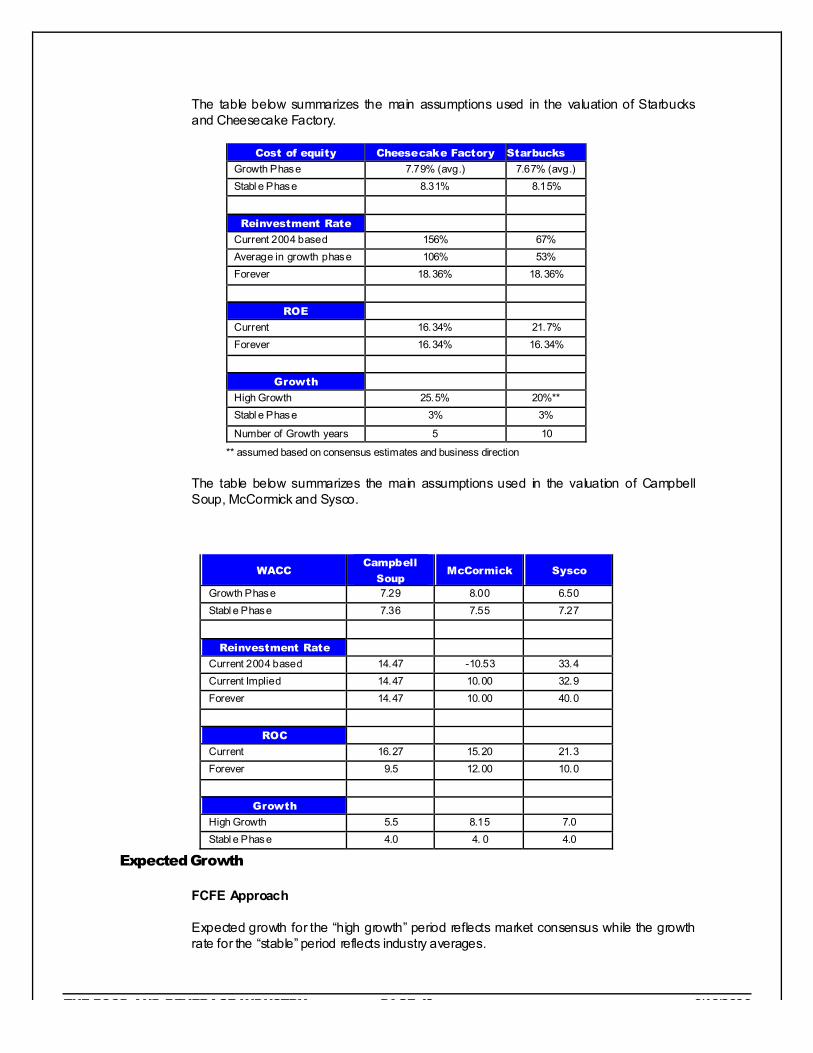
THE FOOD AND BEVERAGE INDUSTRY PAGE 43 9/19/2006
The table below summarizes the main assumptions used in the valuation of Starbucks and Cheesecake Factory.
Cost of equity Cheesecake Factory Starbucks
Growth Phase 7.79% (avg.) 7.67% (avg.) Stabl e Phase 8.31% 8.15%
Reinvestment Rate Current 2004 based 156% 67% Average in growth phase 106% 53% Forever 18.36% 18.36%
ROE Current 16.34% 21.7% Forever 16.34% 16.34%
Growth High Growth 25.5% 20%** Stabl e Phase 3% 3%
Number of Growth years 5 10
** assumed based on consensus estimates and business direction
The table below summarizes the main assumptions used in the valuation of Campbell Soup, McCormick and Sysco.
WACC Campbell
Soup McCormick Sysco
Growth Phase 7.29 8.00 6.50 Stabl e Phase 7.36 7.55 7.27
Reinvestment Rate Current 2004 based 14.47 -10.53 33.4 Current Implied 14.47 10.00 32.9 Forever 14.47 10.00 40.0
ROC Current 16.27 15.20 21.3 Forever 9.5 12.00 10.0
Growth High Growth 5.5 8.15 7.0 Stabl e Phase 4.0 4. 0 4.0
Expected Growth
FCFE Approach
Expected growth for the “high growth” period reflects market consensus while the growth rate for the “stable” period reflects industry averages.
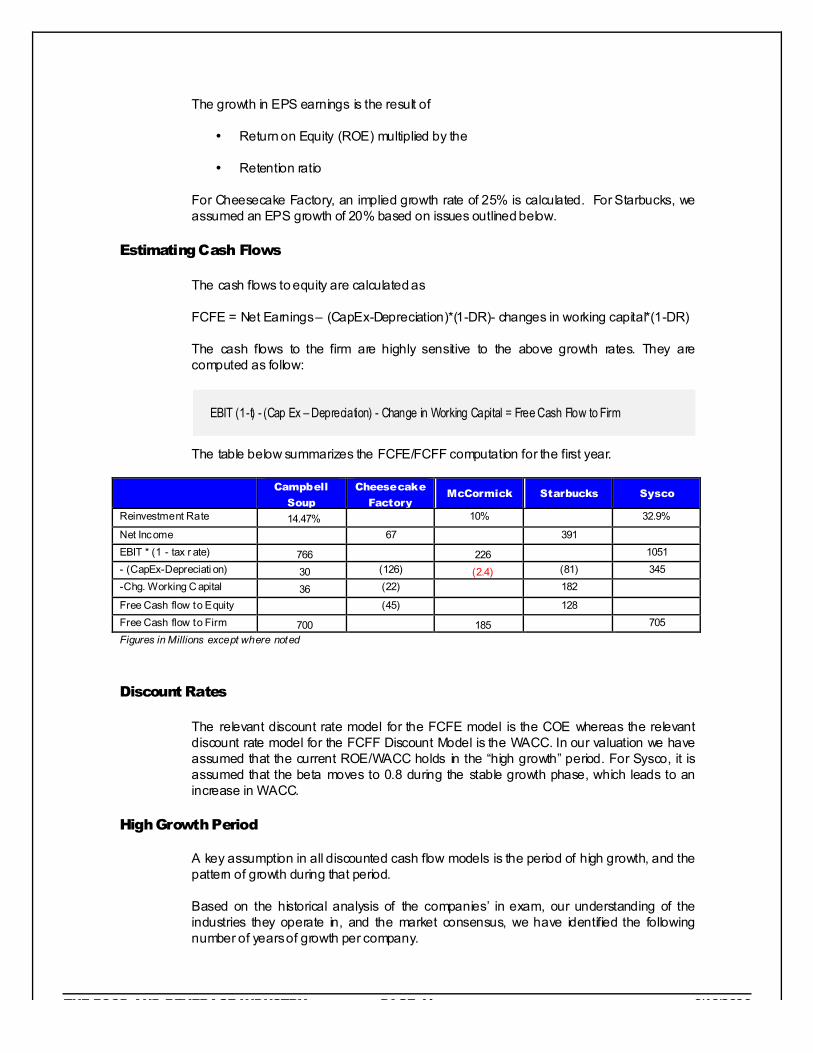
THE FOOD AND BEVERAGE INDUSTRY PAGE 44 9/19/2006
The growth in EPS earnings is the result of
• Return on Equity (ROE) multiplied by the
• Retention ratio
For Cheesecake Factory, an implied growth rate of 25% is calculated. For Starbucks, we assumed an EPS growth of 20% based on issues outlined below.
Estimating Cash Flows
The cash flows to equity are calculated as
FCFE = Net Earnings – (CapEx-Depreciation)*(1-DR)- changes in working capital*(1-DR)
The cash flows to the firm are highly sensitive to the above growth rates. They are computed as follow:
EBIT (1-t) - (Cap Ex – Depreciation) - Change in Working Capital = Free Cash Flow to Firm
The table below summarizes the FCFE/FCFF computation for the first year.
Campbell
Soup
Cheesecake
Factory McCormick Starbucks Sysco
Reinvestment Rate 14.47% 10% 32.9%
Net Income 67 391 EBIT * (1 - tax r ate) 766 226 1051 - (CapEx-Depreciati on) 30 (126) (2.4) (81) 345 -Chg. Working C apital 36 (22) 182
Free Cash flow to Equity (45) 128 Free Cash flow to Firm 700 185 705 Figures in Millions except where noted
Discount Rates
The relevant discount rate model for the FCFE model is the COE whereas the relevant discount rate model for the FCFF Discount Model is the WACC. In our valuation we have assumed that the current ROE/WACC holds in the “high growth” period. For Sysco, it is assumed that the beta moves to 0.8 during the stable growth phase, which leads to an increase in WACC.
High Growth Period
A key assumption in all discounted cash flow models is the period of high growth, and the pattern of growth during that period.
Based on the historical analysis of the companies’ in exam, our understanding of the industries they operate in, and the market consensus, we have identified the following number of years of growth per company.

THE FOOD AND BEVERAGE INDUSTRY PAGE 45 9/19/2006
Campbell
Soup Cheesecake
Factory McCormick Starbucks Sysco
Growth Period # Yrs. 3 5 5 10 10
Starbucks is rapidly maturing in the US urban market where they pursue a sales strategy via market saturation. However, there is still considerable room for expansion in rural areas of the US. Starbucks is also diversifying horizontally (via offering of other complementary products such as food, sandwiches, bottled water) and geographically (in Europe, China, and other parts of Asia). We anticipate that these initiatives will extend its high growth period to 10 years.
Cheesecake Factory operates 92 upscale, full-service, casual dining restaurants under The Cheesecake Factory mark in 26 state and DC and 5 under the Grand Lux Café as of April 1, 2005. It also operates one express self-service restaurant under The Cheesecake Factory Express at Disney in Orlando. It is rapidly expanding within US and opened 14 restaurants under The Cheesecake Factory mark and 2 under the Grand Lux Café in 2004. In 2005, 5 new Cheesecake Factory restaurants have been opened as of April 1, 2005, and 13 more full service restaurants planned for the rest of 2005. With all these planned openings, it estimated that its level of capital expenditure would at least maintain the current level if not increasing slightly over the next few years. As a result, we expect that its high growth period will extend for the next 5 years, taking into account that restaurant sector is a competitive marketplace.
Sysco is the largest North American distributor of food and related products primarily to the foodservice or "food-prepared-away-from-home" industry. It provides its products and services to approximately 400,000 customers, including restaurants, healthcare and educational facilities, lodging establishments and other foodservice customers. Its share of the foodservice industry market in the United States and Canada is an estimated 14%. For the last 5 years, the company’s operating income has grown at annual growth rate of over 13%. We expect that given its streamlined operations, customer relationships and nation wide presence, Sysco would be able to sustain a moderate growth rate of 7% for next 10 years.
In the past three years McCormick acquired more than 12 market leaders in the flavorings and spices all over the world, including Europe and Asia. Especially huge for the company were acquisitions of Zatarain's, the leading New Orleans-style food brand in the United States, and C.M. van Sillevoldt B.V. of the Netherlands, which sells spices, herbs and seasonings under the Silvo brand in The Netherlands and the India brand in Belgium. Furthermore, the company should continue to drive growth and through innovative new products such as grinders, Grill Mates, and the hottest trend in the restaurant industry right now, compound flavors. Therefore, we expect the company to grown moderately for at least 10 next years.

THE FOOD AND BEVERAGE INDUSTRY PAGE 46 9/19/2006
The Valuation
Based on the assumptions above, we run the FCFF/FCFE DM to obtain the following results.
Company Stock Price @
30/04/2004 Value of Stock Situation
Campbell Soup Company 29.5 27.45 Overvalued Cheesecake Factory 30.25 20.09 Overvalued McCormick 34.4 35.6 Fairly valued Starbucks 48.7 38.5 Overvalued Sysco 34.7 40.5 Undervalued
Comparison of Current vs Target Value
-
5.0
10.0
15.0
20.0
25.0
30.0
Campbell
Soup
Cheesecake
Factory
McCormick Starbucks Sysco
$ b
n
Current Market Cap
Fair Valuation
Under / Over Valuation
7%
34%
-3%
21%
-17%-20%
-10%
0%
10%
20%
30%
40%
Campbell Soup Cheesecake
Factory
M cCormick Starbucks Sysco
THE FOOD AND BEVERAGE INDUSTRY PAGE 47 9/19/2006
As it can be seen from the graph above, we believe that Campbell Soup and McCormick are reasonably valued by the market while Starbucks and Cheesecake Factory are somewhat overvalued. Sysco is the only company which is significantly undervalued as per our analysis.