investment summit brussels 2014 marc craquelin, chief...
TRANSCRIPT
Investment Summit Brussels 2014
Marc Craquelin, Chief Investment Officer Financière de l'Echiquier
2
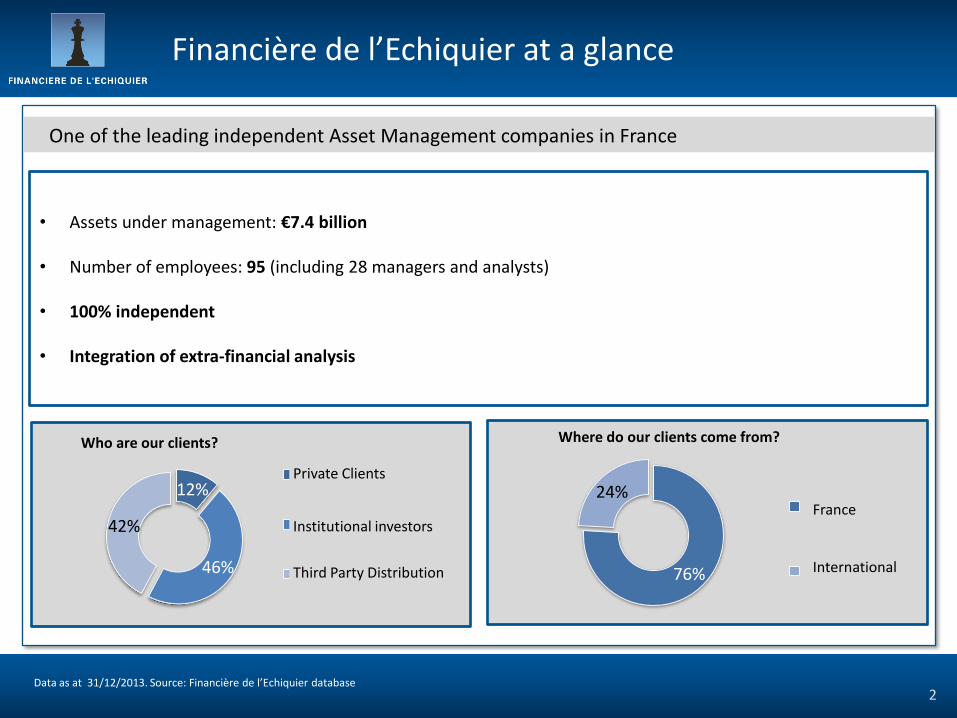
Financière de l’Echiquier at a glance
One of the leading independent Asset Management companies in France
Who are our clients?
12%
46%
42%
Clients privés
Grands comptes etinstitutionnels
Distributeurs 76%
24% France
Hors France
Where do our clients come from?
• Assets under management: €7.4 billion
• Number of employees: 95 (including 28 managers and analysts)
• 100% independent
• Integration of extra-financial analysis
Data as at 31/12/2013. Source: Financière de l’Echiquier database
Private Clients
Institutional investors
Third Party Distribution
France International

Data as at 31/12/2013. Sources: Bloomberg Financière de l’Echiquier database Past performances are not a reliable indicator of future performances and may vary over time. The CAC 40 index is provided as an indication . NR = dividends reinvested 3
2013: performance of core funds
Iboxx Corporate € 3-5 yr
MSCI Eur Small Cap (NR)
Agressor
CAC All Tradable (NR)
Echiquier Major
ARTY
MSCI Europe (NR)
Echiquier Agenor
Echiquier Patrimoine
Echiquier Oblig
Capitalised Eonia
MSCI AC World €(NR)
Composite index (75% Eonia / 25% MSCI Europe NR)
Echiquier Value
+21.8%
+6.4%
+24.3%
+33.4%
+18.6% +19.8%
+39.1%
+6.1%
+0.1%
+2.8%
+8.3%
+5.0%
Echiquier Global
+17.5%
CAC 40 +18.0%
+11.3%
+22.5%

Agressor
Echiquier Value H
Echiquier Agenor
Echiquier Major
Echiquier Oblig ARTY
Echiquier Patrimoine
CAC All Tradable
75% Eonia & 25% MSCI Europe
MSCI Europe Small Cap
MSCI Europe
Daily capitalised EONIA
IBOXX EUR Corp 3-5 Echiquier Japon
Echiquier Amérique
0%
20%
40%
60%
80%
100%
120%
140%
0% 5% 10% 15% 20% 25%
Data in weekly stages as at 28/12/2013. Sources: Morningstar, Financière de l’Echiquier database Performances of the Fund and the benchmark include distributed income (as of the 2013 financial year). However, up to 2012 inclusive, the benchmark’s performance does not include distributed income, except for fixed income products. 4
Funds’ risk/return profile over five years
Performance
Volatility
Diversified and bond funds
Equity funds

M a c r o - e c o n o m i c r e v i e w

Data as at 31/12/2013. Sources: Bloomberg, Financière de l’Echiquier database Past performances are not a reliable indicator of future performances and may vary over time.
2013: Emerging markets were lagging
Macro-economic review
6
+32.1%
+26.4%
+21.0%
+31.0% +31.5%
+30.3%
-26.8%
-1.0%
-20.3%
-1.9%
MSCI United States +31.8%
MSCI Emerging markets -2.6%
MSCI Europe +25.2%
Performances in USD dividends reinvested
0
50
100
150
200
250
300
350
400
450
0
5
10
15
20
25
30
35
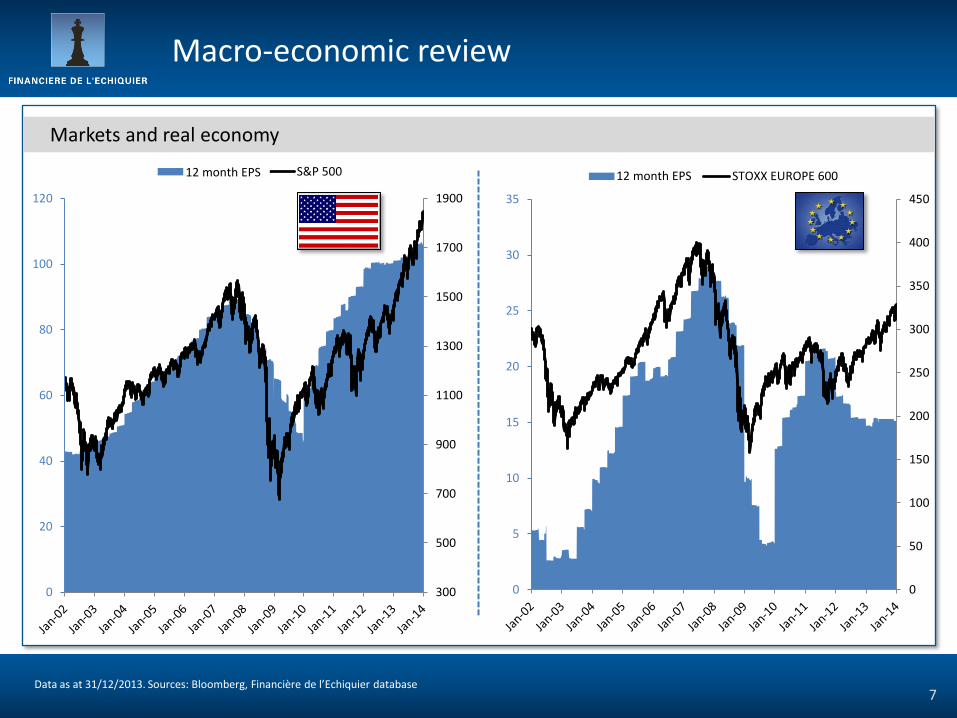
BPA 12 mois STOXX EUROPE 600
7
Macro-economic review
Markets and real economy
Data as at 31/12/2013. Sources: Bloomberg, Financière de l’Echiquier database
300
500
700
900
1100
1300
1500
1700
1900
0
20
40
60
80
100
120
BPA 12 mois S&P 50012 month EPS 12 month EPS

M a c r o - e c o n o m y U n i t e d S t a t e s

30
35
40
45
50
55
60
65
Jan-09 Jan-10 Jan-11 Jan-12 Jan-13
PMI manufacturier aux Etats-Unis
58%
60%
62%
64%
66%
68%
1960 1965 1970 1975 1980 1985 1990 1995 2000 2005 2010
Taux de participation des plus de 16 ans aux Etats-Unis
9
Macro-economic figures in the US
Latest data as at 31/12/2013. Sources: US Bureau of Labor Statistics, Bloomberg, Financière de l’Echiquier database
Momentum remains intact
-6,0%
-4,0%
-2,0%
0,0%
2,0%
4,0%
6,0%
Mar-09 Sep-10 Mar-12 Sep-13
Variation annualisée du PIB trimestriel aux Etats-Unis
dec-13
6%
7%
8%
9%
10%
11%
Jan-09 Jan-10 Jan-11 Jan-12 Jan-13
Taux de chômage aux Etats-Unis
nov-13
Manufacturing PMI in the US Annualised change in quarterly GDP in the US
Unemployment rate in the US Participation rate of over 16 yrs in the US

10
The strength of US companies
Latest data as at 31/12/2013. Sources: Exane Research, Bloomberg, Financière de l’Echiquier database The stocks shown are provided as an example. Neither their presence in the portfolios managed nor their performance are guaranteed .
Keeping things in perspective
Momentum remains intact
5,0%
7,5%
10,0%
12,5%
15,0%
17,5%
20,0%
2003 2005 2007 2009 2011 2013
ROE entreprises américaines ROE entreprises européennes
0
50
100
150
200
250
300
350
400
450Productivité Salaire réel
25
35
45
55
65
-25
-20
-15
-10
-5
0
5
10
15
2000 2002 2004 2006 2008 2010 2012 2014
CAPEX (a/a) ISM Nouvelles commandes
(…)
ISM new orders ROE of European companies ROE of US companies
Productivity Real wages
E m e r g i n g M a r k e t s

12
A less advantageous liquidity environment
Latest data as at 31/12/2013. Sources: Bloomberg, FMI, Datastream, Les Cahiers Verts de l’Economie, Financière de l’Echiquier database
Key macro-economic figures
2013 GDP growth Inflation Gross government
debt (% of GDP) Current balance
(% of GDP) Currency reserves
(% of GDP USD) Central bank interest rates
10-year rate 2013 MSCI
performance (USD)
Turkey 3.8% 8.0% 36.0% -7.4% 13.6% 6.5% 10.2% -28.1%
South Africa 2.0% 5.7% 43.0% -6.1% 11.9% 5.0% 7.9% -8.9%
India 3.8% 9.0% 67.2% -4.4% 15.3% 7.8% 8.8% -5.3%
Indonesia 5.3% 9.5% 26.2% -3.4% 11.5% 7.5% 8.5% -25.0%
Brazil 2.5% 5.9% 68.3% -3.4% 17.1% 10.0% 10.7% -18.7%
Mexico 1.2% 3.3% 44.0% -1.3% 13.3% 3.5% 6.4% -2.0%
Thailand 3.1% 2.0% 47.1% 0.1% 39.7% 2.3% 3.9% -16.9%
China 7.6% 3.0% 22.9% 2.5% 41.0% 6.0% 4.6% +0.4%
Russia 1.5% 6.2% 14.1% 2.9% 22.7% 5.5% 7.9% -2.6%
Malaysia 4.7% 2.0% 57.0% 3.5% 42.2% 3.0% 4.1% +4.2%
Korea 2.8% 1.8% 35.7% 4.6% 28.9% 2.5% 3.6% +3.1%

13
Political reforms headed in the right direction
Source: Financière de l’Echiquier database
Improving social environment Changing demographic
policy Protecting
the environment Reforming
rural policy
Modernising institutions
Reforming fiscal policy
Improving the legal system
Using financial markets Reducing privileges of SOE
Modernising the financial system
Deregulating prices in competitive sectors
Cleaning up market awarding methods
China: the main challenge
M a c r o - e c o n o m y E u r o p e
250
300
350
400
450
500
550
600
65
75
85
95
105
115
125
135
145
Dec-12 Jun-13 Dec-13
Itraxx Main Europe Itraxx CrossOver
15
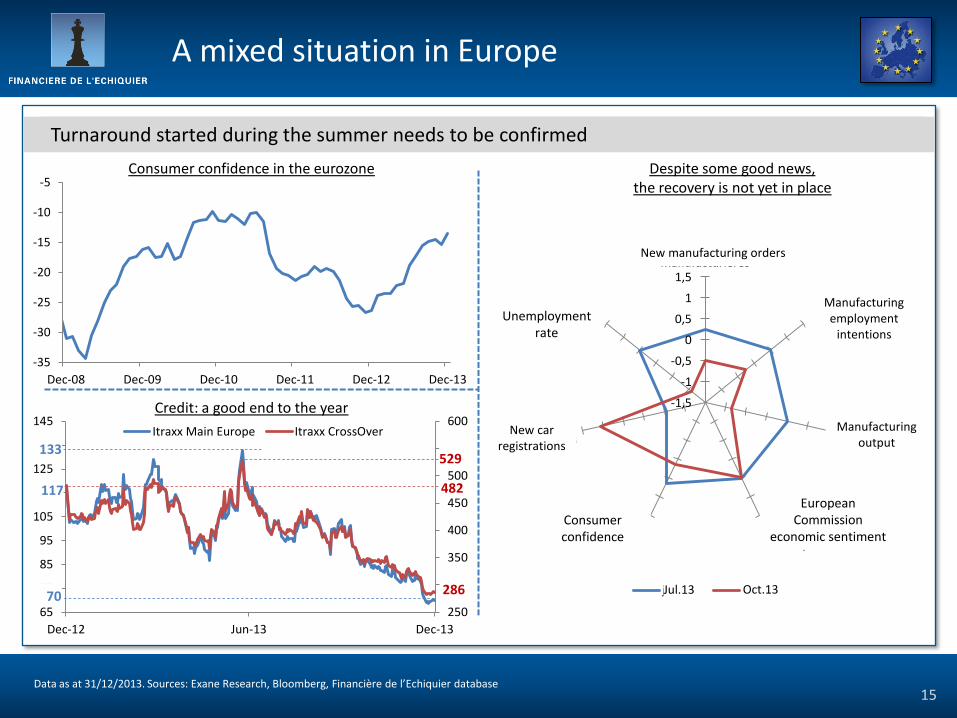
Turnaround started during the summer needs to be confirmed
Data as at 31/12/2013. Sources: Exane Research, Bloomberg, Financière de l’Echiquier database
A mixed situation in Europe
Credit: a good end to the year
Consumer confidence in the eurozone Despite some good news, the recovery is not yet in place
133 529
117 482
70 286
-35
-30
-25
-20
-15
-10
-5
Dec-08 Dec-09 Dec-10 Dec-11 Dec-12 Dec-13
-1,5
-1
-0,5
0
0,5
1
1,5
Nouvelles commandesmanufacturières
Intentionsd'embauches
manufacturières
Productionmanufacturière
Sentimentéconomique de la
CommissionEuropéenne
Confiance desconsommateurs
Nouvellesimmatriculations
Taux de chômage
juil.-13 oct.-13
Manufacturing employment
intentions
New manufacturing orders
Manufacturing output
European Commission
economic sentiment
Unemployment rate
New car registrations
Consumer confidence
Jul.13 Oct.13

16 Data as at 31/12/2013. Sources: BofA Merrill Lynch, Bloomberg, Financière de l’Echiquier database
A changed understanding of Europe vs emerging markets
Change in flows towards developed countries to the detriment of emerging countries
-50 $bn
0 $bn
50 $bn
100 $bn
150 $bn
200 $bn
250 $bn
300 $bn
Dec-12 Mar-13 Jun-13 Sep-13 Dec-13
Cumul des souscriptions sur les fondsactions des pays émergents
Cumul des souscriptions sur les fondsactions des pays développés
-20 $bn
-10 $bn
0 $bn
10 $bn
20 $bn
30 $bn
Dec-12 Mar-13 Jun-13 Sep-13 Dec-13
Cumul des souscriptions sur les obligations émergentes
Cumul des souscriptions sur les obligations High Yield (paysdéveloppés)
-10 $bn
0 $bn
10 $bn
20 $bn
30 $bn
40 $bn
50 $bn
60 $bn
Dec-12 Mar-13 Jun-13 Sep-13 Dec-13
Flux cumulés sur les fonds actions Europe
0 $bn
1 $bn
2 $bn
3 $bn
4 $bn
5 $bn
6 $bn
7 $bn
2000 2002 2004 2006 2008 2010 2012 2014
Cumul des souscriptions ETF Europe(iShare MSCI EMU ETF)
Total subscriptions into emerging markets equity funds
Total subscriptions into developed markets equity funds
Total inflows into equity funds in Europe Total subscriptions for Europe ETFs (iShare MSCI EMU ETF)
Total subscriptions into emerging bond markets
Total subscriptions into high-yield bonds (developed markets)

5,00
7,00
9,00
11,00
13,00
15,00
17,00
19,00
2003 2004 2005 2006 2007 2008 2009 2010 2011 2012 2013
PER (forward 12 mois) MSCI Europe
PER (forward 12 mois) MSCI USA
PER (forward 12 mois) MSCI Emerging
17
Long-term valuation references
Data as at 31/12/2013. Sources: Exane Research, Financière de l’Echiquier database
Less room for disappointment
Extent of variation over 10 years
10.3
13.4
15.6
10.4
18.2
14.2
12.1
10.6
7.4
16.9
14.3
6.3
Median
Median
Median
MSCI Europe 12-month forward PER
MSCI USA 12-month forward PER
MSCI Emerging 12-month forward PER
18
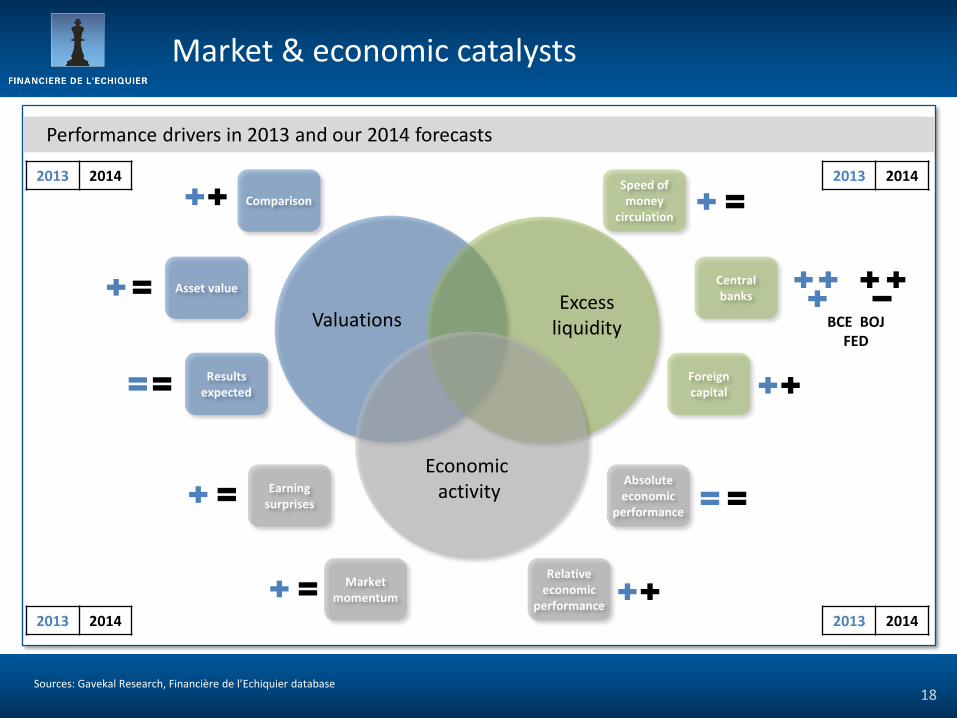
Performance drivers in 2013 and our 2014 forecasts
Sources: Gavekal Research, Financière de l’Echiquier database
Market & economic catalysts
Excess liquidity Valuations
Economic activity
Asset value Central banks
Comparison Speed of money
circulation
Foreign capital
Results expected
Earning surprises
Market momentum
Relative economic
performance
Absolute economic
performance
2013 2014
BCE BOJ FED
2013 2014 2013 2014
2013 2014

19 Source: Financière de l’Echiquier database The stocks shown are provided as an example. Neither their presence in the portfolio managed, nor their performance are guaranteed.
Our investment themes for 2014
Our stock picks
The lagging cycle in Europe The "contrarian" view on Europe
Emerging markets victims Long-term vision still intact
Oil & Gas services Paper
Growth/Value
F i x e d I n c o m e M a r k e t s

21
“Bond-picking”
Data as at 31/12/2013. Sources: Bloomberg, Financière de l’Echiquier database Past performances are not a reliable indicator of future performances and may vary over time. The funds are primarily invested in bonds. They present a risk of capital loss. The stocks shown are provided as an example. Neither their presence in the portfolio managed, nor their performance are guaranteed.
Strong choices paid off…
10-year government bonds
-11.7%
-6.4%
-4.4%
-1.8%
+0.4%
+8.9%
+14.6%
Echiquier "High Yield"
2013 performance
BBB-
BBB+
AA+
AAA
AAA
AA-
5-year corporate bonds
Echiquier Oblig
Iboxx Corporate 3-5 years (BBB)
+6.4%
+2.8%
2013 Performance
+0.5%
+11.1%
+8.4%
B-
BBB
AA

22
Stop the preconceived ideas on corporate credit: the “best” risk/return profile
Data as at 31/12/2013. Sources: Bloomberg, Financière de l’Echiquier database
… with no increase in volatility
Lehman Brothers
Greek crisis
100 day historical volatility
Euro crisis
Announcement of "tapering"
1,00%
1,50%
2,00%
2,50%
3,00%
3,50%
4,00%
4,50%
5,00%
2004 2005 2006 2007 2008 2009 2010 2011 2012 2013 2014
Euro MTS 3-5 ans
Iboxx Corporate 3-5 ansIboxx Corporate 3-5 yrs
Euro MTS 3-5 yrs

23
Our guidelines for 2014
Data as at 31/12/2013. Sources: Bloomberg, Financière de l’Echiquier database The stocks shown are provided as an example. Neither their presence in the portfolios managed, nor their performance are guaranteed.
Our convictions
ECB still active Beware of duration
200 + 200 ≠ 100 + 300
Courbe des taux allemands
Always new ideas
- Subordinated debt (LT2) - Maturity 10 years - Yield on purchase: 7.1%
- Corporate bond - Maturity 6 ½ years - Yield on purchase: 4.9% B
BB-
- Corporate bond - Maturity 6 years - Yield on purchase: 4.1% B
0
200
400
600
800
1000
1200
2005 2006 2007 2008 2009 2010 2011 2012 2013
Itraxx CrossOver
Moyenne mobile 1an glissant
0,00%
0,50%
1,00%
1,50%
2,00%
2,50%
3,00%
3,50%
0 ans 5 ans 10 ans 15 ans 20 ans
Courbe des taux allemands (forward 2 ans)
1-year yoy moving average
German interest rates curve (2-year forward) German interest rates curve
5 yrs 10 yrs 15 yrs 20 yrs
24
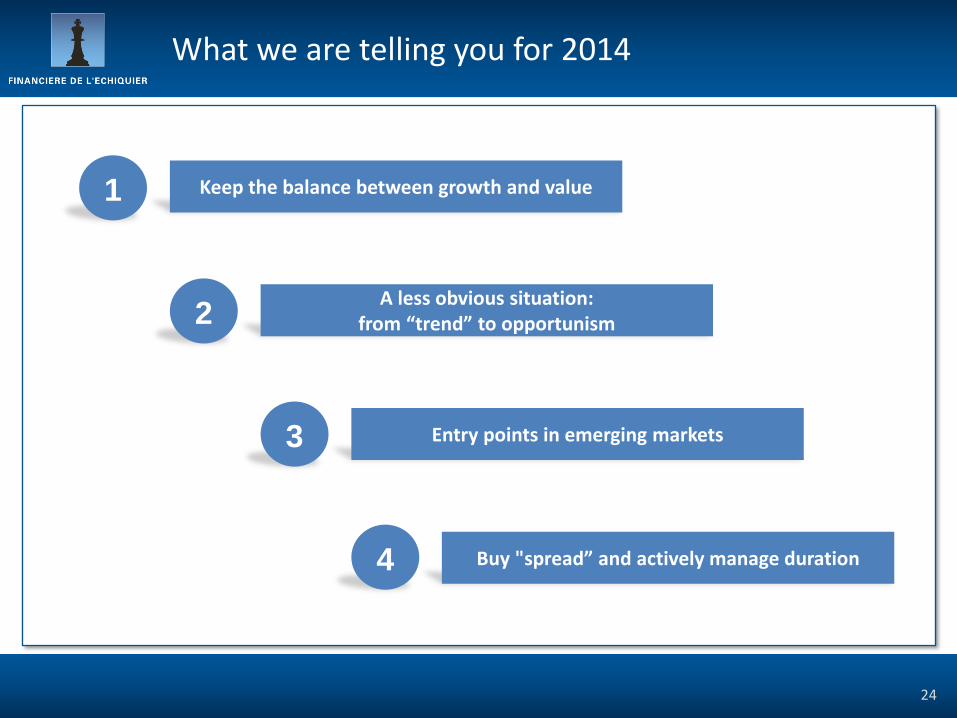
Keep the balance between growth and value 1
A less obvious situation: from “trend” to opportunism 2
Entry points in emerging markets 3
Buy "spread” and actively manage duration 4
What we are telling you for 2014

A G R E S S O R A R T Y

Data as at 31/12/2013. Sources: Bloomberg, Morningstar, Financière de l’Echiquier database The fund is mostly invested in equities. It presents the risk of capital loss. 26
AGRESSOR Fund overview
“Carte blanche” to the portfolio manager since 1991
Contrarian and opportunist
No constraints in style or size
Constant attention paid to the “value of things”
Demanding purchase prices and ability to reduce equity exposure to 60%
Looking for charismatic managers
Projects carried by the best managers with the support of key shareholders
Past performances do not predict future performances and are not constant over time. The performance of the fund and the benchmark indicator take account of distributed income items (as of 2013). In contrast, until 2012, the benchmark indicator performance does not take account of distributed income items.
EV/sales 2014 1.5
P/E 2014 16.6
Yield (%) 2.1
Average capitalisation (€m) 13 320.5
Shares in the portfolio 46
Total assets (€m) 1 446
0
50
100
150
3-years
+26.6% +19.3%
5-years
+48.4%
+21.8%
2013
+140.5%
+22.5%
Benchmark Agressor
Agressor
Agressor has gained 1,571.2% since its creation in 1991 compared with 197.7% for its benchmark index
Data as of 31/01/2014. Source : Database Financière de l’Echiquier
27
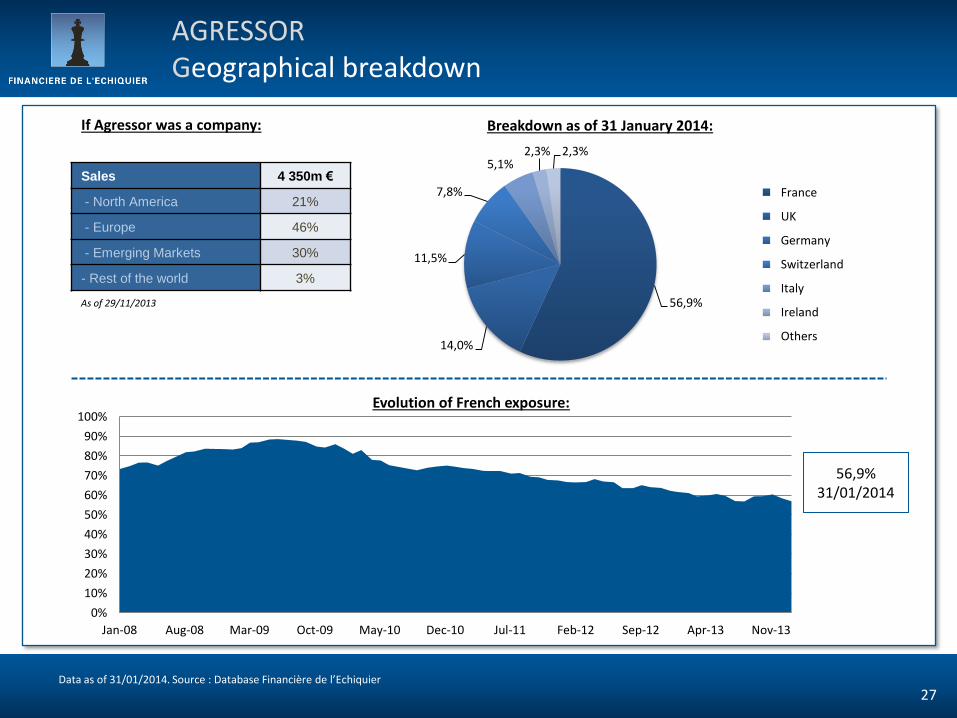
AGRESSOR Geographical breakdown
56,9% 31/01/2014
Breakdown as of 31 January 2014:
Evolution of French exposure:
0%
10%
20%
30%
40%
50%
60%
70%
80%
90%
100%
Jan-08 Aug-08 Mar-09 Oct-09 May-10 Dec-10 Jul-11 Feb-12 Sep-12 Apr-13 Nov-13
56,9%
14,0%
11,5%
7,8%
5,1% 2,3% 2,3%
France
Royaume-Uni
Allemagne
Suisse
Italie
Irlande
Autres
France
UK
Germany
Switzerland
Italy
Ireland
Others
Sales 4 350m €
- North America 21%
- Europe 46%
- Emerging Markets 30%
- Rest of the world 3%
As of 29/11/2013
If Agressor was a company:

The value of things A return to normal
A strongly undervalued quality group An entry point to South-East Asia SAIPEM emerging from a difficult phase
28
AGRESSOR Our choices for 2014
Emerging consumers
MICHELIN is the global leader in tyres.
The group is set to benefit from the recovery in the replacement tyre cycle in Europe and the US, combined with a take-off in the Chinese market.
Specialty tyres (35% of group EBIT), in which the group shares a duopoly with BRIDGESTONE, are worth more than €10bn alone.
MICHELIN has one of the lowest valuations in the market at 8.5x 2014e PER .
SAIPEM is the global co-leader in offshore
oil installations.
The group suffered a very difficult year in 2013 with hefty losses on certain contracts, causing the departure of the management team.
The priority for the new team: to restore strong discipline in new orders and to pay down the group’s debt.
At 1.1x capital employed, the market sees no value creation potential for the group which has proven its quality and its unique expertise in the past.
DKSH is a Swiss group specialised in the
distribution of mass market products in South-East Asia.
The group is the local intermediary for major names in the sector: NESTLE, BEIERSDORF, LINDT and BAYER are among its clients.
Growth potential of more than 10% a year
and ability to improve margins on the back of increasingly sophisticated services.
At 12.4x 2014e EBIT, we can make the most of the outlook for this group which is 100% exposed to consumer spending in emerging markets.
Source: Financière de l’Echiquier database The stocks shown are provided as an example. Neither their presence in the portfolios managed, nor their performance is guaranteed .

29
Keep the balance between growth and value 1
A fund that remains “contrarian” 2
Re-investing on the emerging market theme 3
AGRESSOR Key takeaways

Data as at 31/12/2013. Sources: Bloomberg, Financière de l’Echiquier database The fund is mostly invested in equities and bonds. It presents the risk of capital loss. 30
ARTY Fund overview
An “all-weather” solution for growing your savings
Companies: search for best risk/return profile
Dividends on equities Coupons on bonds
Mobility against volatile markets
Capacity to invest from 0-50% in equities
Past performances do not predict future performances and are not constant over time. Performances by the fund and the benchmark indicator take account of distributed income items (as of 2013). In contrast, until 2012, the performance of the benchmark indicator in the equities segment does not take account of distributed income items.
4.2% Average yield 3.6% Yield to maturity 31.4% EV/sales 2014 1.8
P/E 2014 13.3
Average capitalisation (€m) 43 236
Shares in the portfolio 35
Duration 2.0
No. of bond lines 81
Total assets (€m) 427.3
Exposure to equities
0
5
10
15
20
25
30
35
40
45
50
3-year 5-year
+8.3% +5.0%
2013
+49.9%
+17.5% +14.5%
+6.6%
ARTY
Benchmark ARTY
ARTY has gained 38.9% since it was created in 2008 compared with 8.2% for its benchmark index
-1%
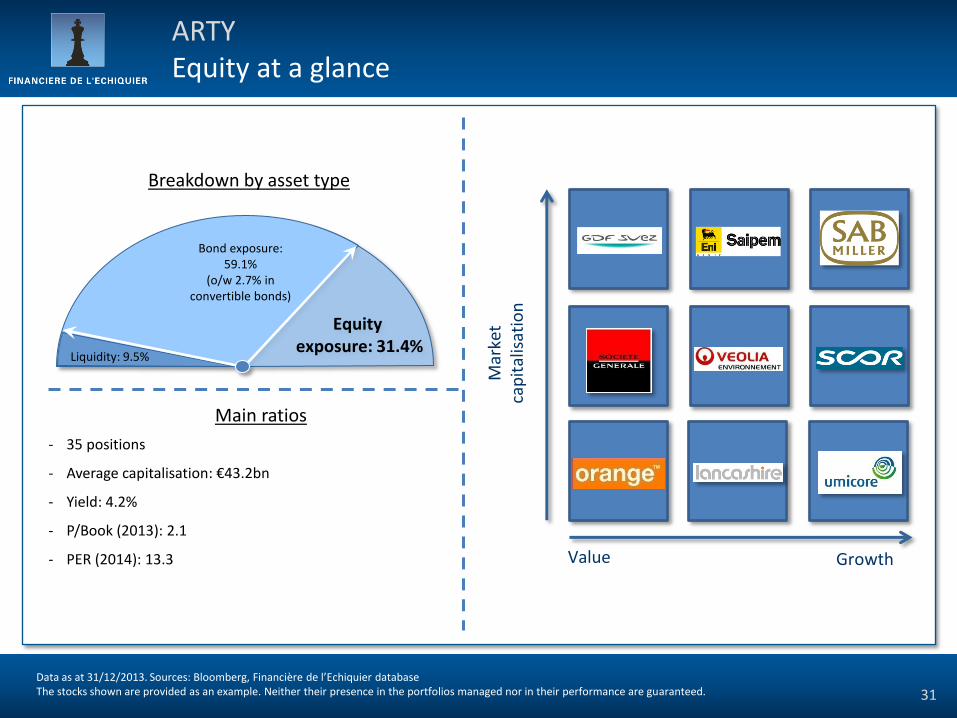
Main ratios
- 35 positions
- Average capitalisation: €43.2bn
- Yield: 4.2%
- P/Book (2013): 2.1
- PER (2014): 13.3 Growth Value
Mar
ket
cap
ital
isat
ion
ORANGE
SOC GEN
SCOR
SABMILLER
Data as at 31/12/2013. Sources: Bloomberg, Financière de l’Echiquier database The stocks shown are provided as an example. Neither their presence in the portfolios managed nor in their performance are guaranteed. 31
ARTY Equity at a glance
VEOLIA
Equity exposure: 31.4%
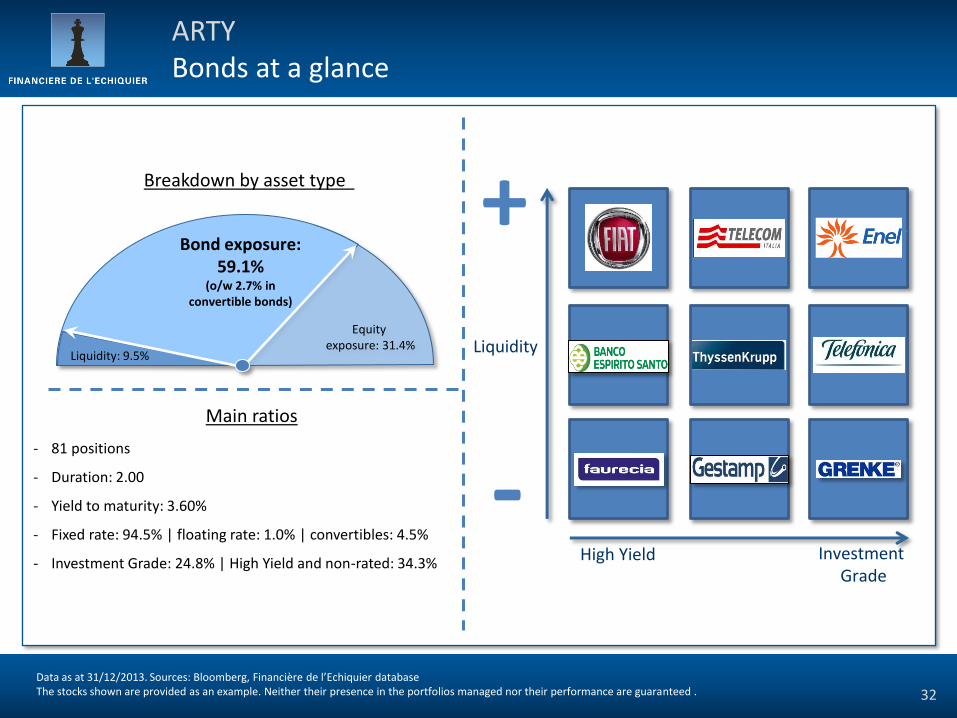
Bond exposure: 59.1%
(o/w 2.7% in convertible bonds)
Liquidity: 9.5%
Breakdown by asset type
-1%
Breakdown by asset type
BES
Investment Grade
High Yield
Liquidity
Main ratios
- 81 positions
- Duration: 2.00
- Yield to maturity: 3.60%
- Fixed rate: 94.5% | floating rate: 1.0% | convertibles: 4.5%
- Investment Grade: 24.8% | High Yield and non-rated: 34.3%
CONTINENTAL 7,50% 2017
CEGEDIM 7,00% 2015
GRENKE 4,00% 2015
Saint-Gobain 7,25% 2013
APRR 5,00% 2017
DEUTSCHE TEL 5,75% 2015
+
-
Equity exposure: 31.4%
Bond exposure: 59.1%
(o/w 2.7% in convertible bonds)
Liquidity: 9.5%
Data as at 31/12/2013. Sources: Bloomberg, Financière de l’Echiquier database The stocks shown are provided as an example. Neither their presence in the portfolios managed nor their performance are guaranteed . 32
ARTY Bonds at a glance

33
ARTY Key takeaways
Mobility in asset allocation 1
Rebalancing Value vs. Growth 2
Buy "spread“ and actively manage duration 3
34
2014 The year of stock-picking!

This document is destined for professional investors and has no contractual value. It cannot be distributed to third parties without the prior agreement of Financière de l’Echiquier. The information is provided from the best sources we possess. This information and the document do not represent an investment recommendation. Past performances are not a reliable indicator of future performances and may vary over time. Past performances must not therefore be the central element in the subscriber’s investment decision: other elements presented in the funds’ prospectus should be taken into consideration. The performances of the funds and the benchmark indicators take account of distributed income items (as of 2013). In contrast, until 2012, the performance of the benchmark indicator does not take account of distributed income items. This is not the case for Echiquier Patrimoine whose benchmark index is the Capitalised Eonia. For further information on the funds presented, please refer to their prospectuses available on simple request from the investment company on +33.(0)1.47.23.90.90 or by contacting your usual representative. Echiquier Value, Echiquier Global Emergents, Echiquier Global Convertibles and Echiquier Entrepreneurs are authorised for marketing in France. Agressor, Echiquier Major, Echiquier Agenor, Echiquier Global, Echiquier Patrimoine and ARTY are authorised for marketing in France, Germany, Belgium, Spain, Italy, The Netherlands and Switzerland. They are also available under the framework of life insurance contracts under Luxemburg law under Freedom to Provide Services (FPS). Acropole Convertibles Monde and Acropole Convertibles Europe are authorised for marketing in France, Austria, Germany and Spain. We thank you for your confidence in us. Fund risk profile:
- The funds present the risk of capital loss. - The funds are primarily invested in equities and bonds. If the stocks to which they are
exposed lose value, the funds’ NAV could fall. - Bonds and convertible bonds, like any other debt security, carry default risk and offer
no guarantee on the payment of coupons. - The management method is discretionary. There is a risk that the funds are not
invested at all times in the best performing stocks. - In the small and midcap markets, the volume of shares listed on the stockmarket is
reduced and market movements are therefore greater on the downside and faster than for large caps. The funds’ NAV can therefore decline more rapidly and to a greater extent.
For Echiquier Global, Echiquier Global Emergents and Acropole Convertibles Monde: A risk associated with investing in emerging markets exists resulting in particular from the way these markets function and are supervised, which can deviate from the standards prevailing on major international stock exchanges, or from political and regulatory factors. We invite you to consult the funds’ prospectuses for all further information on these risks. All of the costs attributable to the funds are available in the prospectuses. Current costs are updated annually and are available in the funds’ KIIDs.
35