investment update–january, 2015 2015.pdf · the first half of 2015. ... upto `1.5 lakhs under...
TRANSCRIPT

Investment update–January, 2015


From the Managing Director’s Desk
2014 was a landmark year for India with the financial markets and the Indian economy
performing much better than what most of us had anticipated at the beginning of the
year. The stock markets have had its best run since 2009 and touched new highs. The
Sensex ended 6,329 points or 30% higher, while the Nifty closed 1,979 points or 31%
higher compared to their respective closing figures as on December 31, 2013. The
current account deficit is also getting under control and the pace of disinflation
especially in the later part of the year has raised anticipations of an interest rate cut in
the first half of 2015. However, the biggest development of 2014 was the election of a
new government at the Centre after 10 years with the electorate delivering its most
decisive mandate in 30 years.
The new government so far has made the right moves by reaching out to India’s
neighbours and global allies, enabling speedy clearance of projects, promoting good
governance in all spheres and introducing ordinances relating to important bills like
Goods and Services Tax (GST), Coal and Power Sector, Land Acquisition etc. Budget
2015 will be keenly watched to see if any bold measures are taken to boost economic
growth as any stop-gap arrangements are unlikely to comfort investors, whether
overseas or domestic. On the International front, the Indian economy and markets
adjusted well to global developments. The fall in commodity prices especially crude
oil was the biggest story and is likely to benefit net importers like India, the extent of
the gains though is still being debated. It also remains to be seen if US economy can
sustain its growth momentum with a stronger dollar, which will affect exports, and
falling oil prices which will affect investments in shale oil. Overall, markets in 2015 are
likely to be driven by the ability of the new government to push reforms and
international factors such as the fallout from falling commodity prices, geopolitics
and the capacity of the US economy to sustain its growth momentum.
The mutual fund industry had one of its best years in 2014 on the back of the gain in
the equity markets. The industry added almost `3 lakh crore to its asset base to
become a ̀ 11 lakh crore market, saw a sharp rise in inflows into equity schemes and
an impressive growth in number of equity folios. SBI Mutual Fund as a fund house saw
opportunities across the time spectrum and asset class and launched equity-based
funds like SBI Equity Opportunities Fund – Series I and II (a 3-year close-ended equity
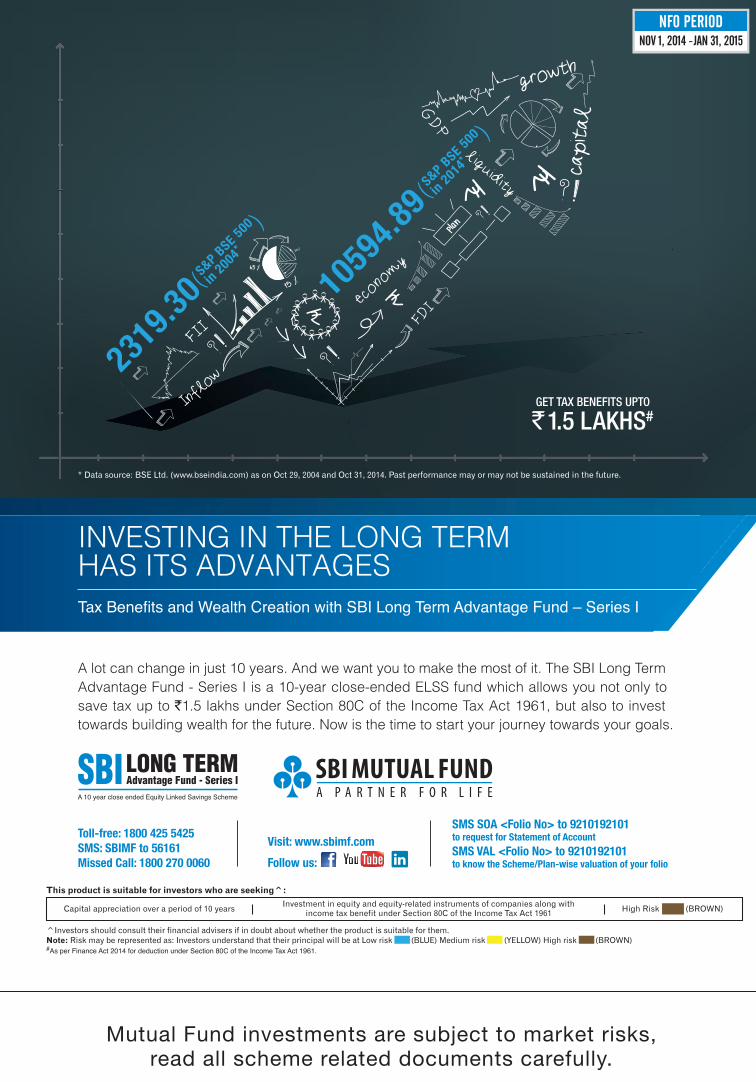
scheme) which allowed investors to participate in the India growth story, and SBI Long
Term Advantage Fund – Series I and II (a 10-year close-ended ELSS), offering the
opportunity to invest to grow your wealth for the long term along with tax benefits
upto ̀ 1.5 lakhs under Section 80C of the Income Tax Act as per the Finance Act 2014.
Dinesh Kumar KharaMD & CEO

SBI Dual Advantage Fund - Series I, II, III, IV, V and VI (a close-ended hybrid scheme with
a tenure of 1111 days) were launched for investors looking for a fund with a mix of
equity and debt to generate income and capital appreciation while SBI Inflation
Indexed Bond Fund (an open-ended debt scheme), a unique offering in the industry,
was launched for investors looking for some stability and inflation-adjusted returns.
We urge investors to invest in such close-ended funds keeping in mind the tenure of
the fund, their portfolio allocation and their goals. We have a comprehensive range of
products suiting investors risk and appetite. Also, as always, investing through a
Systematic Investment Plan (SIP) is ideal for the long-term as India’s growth story
remains intact and one should not be distracted by short-term market movements.
For the New Year, I urge upon you to update your basic information in your investment
folios including your primary email ID and mobile number with all mutual fund
houses. Please assign a nominee if not already done and update your address, if you
have shifted residence. This allows you to receive uninterrupted service and gives you
and your family peace of mind. At SBI Mutual Fund, we remain committed to providing
you unparalleled service and cater to your investment needs. Please feel free to call on
our dedicated customer care numbers 1-800-425-5425 and 080-26599420 from
Monday to Saturday (8am to 10pm) or write to us at [email protected]
with your queries. Alternatively, you can also visit your nearest SBI FMPL Branches for
any assistance. Investors can also experience the convenience of online investing by
visiting our site www.sbimf.com which allows KYC compliant investors to invest in
any of our schemes and NFOs in a few minutes.
I would like to wish you and your family a Happy and Prosperous New Year!
Best Regards,
Dinesh Kumar Khara
Managing Director & Chief Executive Officer
Market Overview
Navneet MunotED & CIO
Equity markets had a stellar year in 2014 with Sensex delivering 30% while BSE mid cap and
BSE small cap index were up 55% and 69% respectively. The rally took a breather in
December following an impasse in the winter session of the Parliament and negative
newsflow from other emerging markets.
Oil prices continued to fall with brent moving below $60 per barrel. The government has
smartly increased the custom duty on crude imports and excise duties on fuel products
that will help bridge the fiscal gap. Lower outgo on fuel by consumers should lead to
higher discretionary spending on other items as well as increase in savings.
While declining commodity prices will benefit our economy at the macro level, they also
reflect the state of the global economy. It will be hard for us to grow exports in a weak
global economy. Revival in the private sector capex is still sometime away. The fiscal
leeway is quite limited so the government has to focus on creating an enabling
environment for pushing infrastructure investments. Banking system is also constrained
in terms of its capacity to fund long tenor projects hence the importance of attracting
foreign investments from every conceivable source as well as boosting domestic savings
which is channelized into the financial instruments. One of the main agenda of this
government seems to be improving the “ease of doing business” which we believe will go a
long way in unleashing the true potential of the economy. India has a real opportunity to
capitalize on lower commodity prices and stand out in a world that is struggling with
anaemic growth.
Given the deadlock in the winter session of the parliament, the government announced
adoption of ordinance route to press ahead with the reforms. Government’s decision of
exercising ordinance route to push through some of the pending legislations on coal
allocation, land acquisition and Insurance, highlights that it means business. The
government is shifting towards EPC from PPP model to revive investments in the road
sector while the transmission and distribution (T&D) segment within the power sector is
seeing renewed activity. We are seeing defense procurement gaining traction after a long
time while the railway ministry is putting right things in place to revive investments in the
sector. The bigger hope we have is from state governments where each state is trying to
outdo each other in terms of reforms to attract investments as well as pushing the
envelope on infrastructure spending. The Jan Dhan Yojana has been highly successful with
over 10 crores new bank accounts getting opened up. Apart from the fruits from financial
inclusion, this would also help in subsidy rationalisation through speedy roll out of Direct
benefit transfer (DBT).
The ability of the government to deliver and eventually revive economic growth, trajectory
of inflation and interest rates and trend in corporate profitability will be the critical factors
to watch out for in the year ahead. We witnessed record FII flows of close to USD 40 billion
across equity and bond market in CY 2014. Barring any adverse global development, India
should continue to attract global capital given the incremental fundamental change in
terms of improving macro, possible rate cuts and a definite positive policy momentum.
Sustained momentum of local investors would provide further liquidity to the markets.
Though mid and small cap indices have run up more and are trading at valuations richer
than large caps, we believe, they stand to gain disproportionately in an environment of
improving macro, declining input and interest cost and favorable eco-system
(Government’s focus on “ease of doing business”, access to capital, advances in supply-
chain, technological enablers etc). While keeping an eye on macro developments and
identifying emerging themes and shifts, our greater focus remains on bottom up stock
picking, which we believe, is the best way to generate alpha on a sustainable basis.
Over the last year, inspite of policy rates remaining stable after the hike in January 2013,
bond yields have moved lower by about 100 bps helped by improving macro situation,
especially on the inflation outlook, policy credibility, stable government and substantial
FII flows which amounted to over USD 26 billion. The downtrend in yields has also been
supported by weaker demand situation as reflected in slow credit off take. Most of these
factors are expected to support bond yields currently, even as FII flows could remain
hostage to global risk appetite.
The macro data points released over the last month continues to provide encouraging
signals on the inflation outlook. The CPI data for November-14 came in at 4.38% y-o-y as
against 5.52% y-o-y the previous month. CPI data prints are likely to move up over the
remainder of the fiscal year as the positive base effect wears off. Significant fall in crude oil
prices continues to augur well for the inflation and fiscal positions given that India imports
more than 80% of its oil requirements. Based on current trends, the uptick in inflation as
the base wears off, would not be material, with the readings likely to be within the RBI
glidepath targets.
The key theme for markets as we settle into the new year would be the expected trajectory
of policy rates with recent soft CPI readings and subdued commodity prices improving the
inflation outlook substantially. With a subdued credit off-take and improved liquidity,
banks’ demand for government securities is likely to remain healthy in the very near term.
With the market incrementally looking at change in RBI stance, supported by CPI printing
below the glide path, the bond markets should remain reasonably well bid in the near
term. The government has been maintaining its Fiscal deficit target at 4.1% of GDP for this
financial year, in spite of revenue shortfalls and lack of progress in disinvestment program
so far. We expect that in spite of a challenging fiscal position, slippages are unlikely on
account of subsidy savings, expenditure rationalization and possible deferment, large
opening cash balances as well as potential big ticket disinvestment proceeds over the next
few months.
Considering the overall improvement in Inflation trajectory and also weak investment
demand, there is a high possibility of the RBI opting for a front loaded reduction in policy
rates in the first half of CY15 once more data points validate a medium term soft trajectory
for CPI inflation.
The RBI stance along with fiscal consolidation measures provides a sound footing to revive
growth in a non-inflationary manner with macroeconomic stability. Overall we would be
inclined to maintain high duration within the overall risk-return template of each fund. We
are maintaining a higher exposure to government bonds in our long term funds as we
believe the G-Sec market offers better value relative to corporate bonds given the
tightening of credit spreads. We would be watchful towards opportunities arising out of
any widening in credit spreads and also the overall portfolio liquidity at an aggregate level.
Navneet Munot
Executive Director & CIO – SBI Funds Management Private Limited
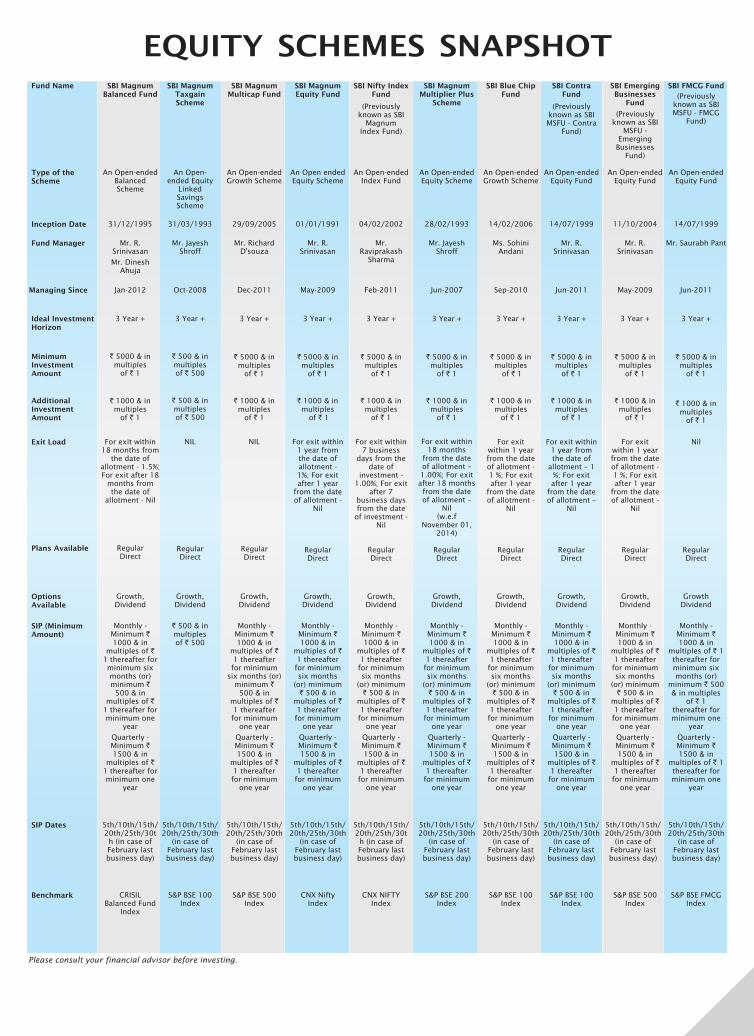
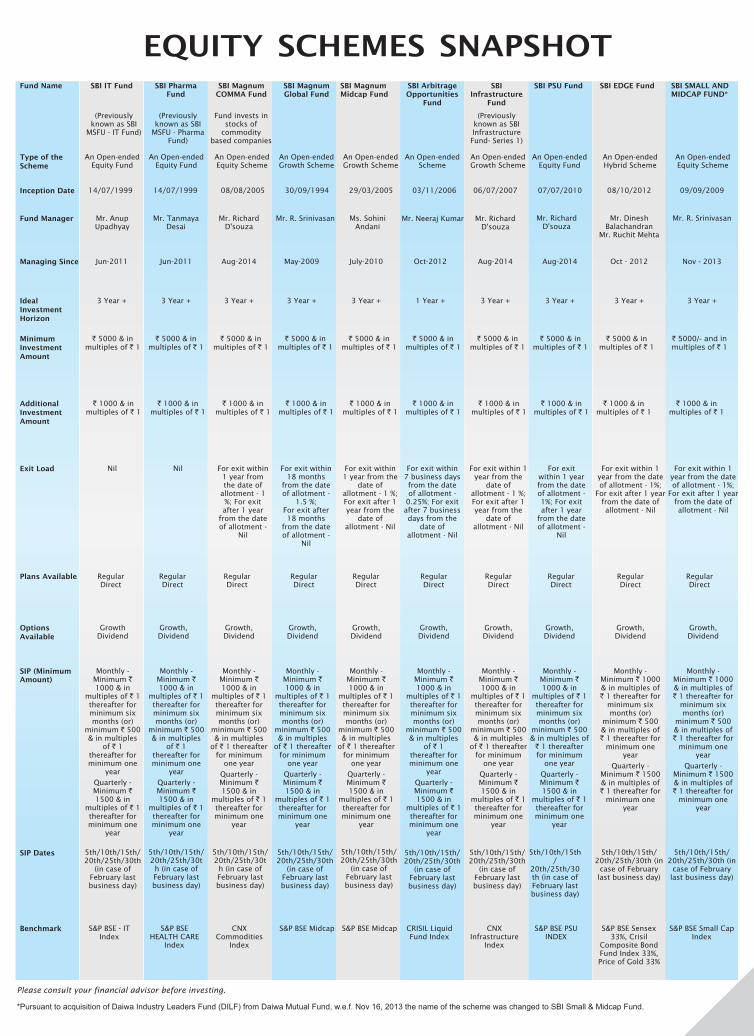
EQUITY SCHEMES SNAPSHOT
Please consult your financial advisor before investing.
Fund Name
Type of the Scheme
Inception Date
Fund Manager
SBI Magnum Balanced Fund
An Open-ended Balanced Scheme
31/12/1995
Mr. R. Srinivasan
Mr. Dinesh Ahuja
SBI Taxgain Scheme
Magnum SBI Multicap Fund
Magnum
An Open-ended Growth Scheme
29/09/2005
Mr. RichardD'souza
SBI Equity Fund
Magnum
An Open ended Equity Scheme
01/01/1991
Mr. R. Srinivasan
SBI Fund
Nifty Index
An Open-ended Index Fund
04/02/2002
Mr. Raviprakash
Sharma
SBI Multiplier Plus
Scheme
Magnum
An Open-ended Equity Scheme
28/02/1993
Mr. Jayesh Shroff
SBI Blue Chip Fund
An Open-ended Growth Scheme
14/02/2006
Ms. Sohini Andani
SBI Emerging Businesses
Fund
An Open-ended Equity Fund
11/10/2004
Mr. R. Srinivasan
SBI FundContra
An Open-ended Equity Fund
14/07/1999
Mr. R. Srinivasan
Managing Since
Ideal Investment Horizon
Minimum Investment Amount
Additional Investment Amount
Jan-2012
3 Year +
` 5000 & in multiples
of ` 1
` 500 & in multiples of ` 500
` 5000 & in multiples
of ` 1
` 5000 & in multiples
of ` 1
` 5000 & in multiples
of ` 1
` 5000 & in multiples
of ` 1
` 5000 & in multiples
of ` 1
` 1000 & in multiples
of ` 1
` 500 & in multiples of ` 500
` 1000 & in multiples
of ` 1
` 1000 & in multiples
of ` 1
` 1000 & in multiples
of ` 1
` 5000 & in multiples
of ` 1
` 1000 & in multiples
of ` 1
` 5000 & in multiples
of ` 1
` 1000 & in multiples
of ` 1
` 1000 & in multiples
of ` 1
` 1000 & in multiples
of ` 1
An Open-ended Equity
Linked Savings Scheme
31/03/1993
Mr. Jayesh Shroff
Oct-2008
3 Year +
Dec-2011
3 Year +
May-2009
3 Year +
Feb-2011
3 Year +
Jun-2007
3 Year +
Sep-2010
3 Year +
May-2009
3 Year +
Jun-2011
3 Year +
Exit Load For exit within 18 months from
the date of allotment - 1.5%;For exit after 18
months from the date of
allotment - Nil
NIL NIL For exit within 1 year from the date of allotment - 1%; For exit after 1 year
from the date of allotment -
Nil
For exit within 7 business
days from the date of
investment - 1.00%; For exit
after 7 business days from the date
of investment - Nil
For exit within 18 months
from the date of allotment – 1.00%; For exit after 18 months from the date of allotment –
Nil(w.e.f
November 01, 2014)
For exit within 1 year from the date of allotment - 1 %; For exit after 1 year
from the date of allotment -
Nil
For exit within 1 year from the date of allotment - 1 %; For exit after 1 year
from the date of allotment -
Nil
For exit within 1 year from the date of
allotment – 1 %; For exit after 1 year
from the date of allotment –
Nil
Options Available
Growth, Dividend
Growth, Dividend
Growth, Dividend
Growth, Dividend
Growth, Dividend
Growth, Dividend
Growth, Dividend
Growth, Dividend
Growth, Dividend
SIP (MinimumAmount)
Monthly - Minimum ` 1000 & in
multiples of ` 1 thereafter for minimum six months (or) minimum `
500 & in multiples of `
1 thereafter for minimum one
year
Quarterly - Minimum ` 1500 & in
multiples of ` 1 thereafter for minimum one
year
` 500 & in multiples of ` 500
Monthly - Minimum ` 1000 & in
multiples of ` 1 thereafter for minimum
six months (or) minimum `
500 & in multiples of ` 1 thereafter for minimum
one year
Quarterly - Minimum ` 1500 & in
multiples of ` 1 thereafter for minimum
one year
Monthly - Minimum ` 1000 & in
multiples of ` 1 thereafter for minimum six months
(or) minimum ` 500 & in
multiples of ` 1 thereafter for minimum
one year
Quarterly - Minimum ` 1500 & in
multiples of ` 1 thereafter for minimum
one year
Monthly - Minimum ` 1000 & in
multiples of ` 1 thereafter for minimum six months
(or) minimum ` 500 & in
multiples of ` 1 thereafter for minimum
one year
Quarterly - Minimum ` 1500 & in
multiples of ` 1 thereafter for minimum
one year
Monthly - Minimum ` 1000 & in
multiples of ` 1 thereafter for minimum six months
(or) minimum ` 500 & in
multiples of ` 1 thereafter for minimum
one year
Quarterly - Minimum ` 1500 & in
multiples of ` 1 thereafter for minimum
one year
Monthly - Minimum ` 1000 & in
multiples of ` 1 thereafter for minimum six months
(or) minimum ` 500 & in
multiples of ` 1 thereafter for minimum
one year
Quarterly - Minimum ` 1500 & in
multiples of ` 1 thereafter for minimum
one year
Monthly - Minimum ` 1000 & in
multiples of ` 1 thereafter for minimum six months
(or) minimum ` 500 & in
multiples of ` 1 thereafter for minimum
one year
Quarterly - Minimum ` 1500 & in
multiples of ` 1 thereafter for minimum
one year
Monthly - Minimum ` 1000 & in
multiples of ` 1 thereafter for minimum six months
(or) minimum ` 500 & in
multiples of ` 1 thereafter for minimum
one year
Quarterly - Minimum ` 1500 & in
multiples of ` 1 thereafter for minimum
one year
SIP Dates 5th/10th/15th/20th/25th/30th (in case of February last business day)
5th/10th/15th/20th/25th/30th
(in case of February last business day)
5th/10th/15th/20th/25th/30th
(in case of February last business day)
5th/10th/15th/20th/25th/30th
(in case of February last business day)
5th/10th/15th/20th/25th/30th (in case of February last business day)
5th/10th/15th/20th/25th/30th
(in case of February last business day)
5th/10th/15th/20th/25th/30th
(in case of February last business day)
5th/10th/15th/20th/25th/30th
(in case of February last business day)
5th/10th/15th/20th/25th/30th
(in case of February last business day)
Benchmark CRISIL Balanced Fund
Index
S&P IndexBSE 100 S&P
Index BSE 500 CNX Nifty
IndexCNX NIFTY
IndexS&P
IndexBSE 200 S&P
IndexBSE 100 S&P BSE 500
IndexS&P
IndexBSE 100
(Previously known as SBI MSFU - Contra
Fund)
(Previously known as SBI
MSFU - Emerging
Businesses Fund)
Regular Direct
Regular Direct
Regular Direct
Regular Direct
Regular Direct
Regular Direct
Regular Direct
Regular Direct
Regular Direct
Plans Available
(Previously known as SBI
Magnum Index Fund)
SBI FMCG Fund
An Open-ended Equity Fund
14/07/1999
Mr. Saurabh Pant
Jun-2011
3 Year +
Nil
Growth Dividend
5th/10th/15th/20th/25th/30th
(in case of February last business day)
S&P BSE FMCG Index
(Previously known as SBI MSFU - FMCG
Fund)
Regular Direct
` 5000 & in multiples
of ` 1
` 1000 & in multiples
of ` 1
Monthly - Minimum ` 1000 & in
multiples of ` 1 thereafter for minimum six months (or)
minimum ` 500 & in multiples
of ` 1 thereafter for minimum one
year
Quarterly - Minimum ` 1500 & in
multiples of ` 1 thereafter for minimum one
year
EQUITY SCHEMES SNAPSHOTFund Name
Type of the Scheme
Inception Date
Fund Manager
Ideal Investment Horizon
Minimum Investment Amount
Additional Investment Amount
Exit Load
Options Available
SIP Dates
Benchmark
SBI IT Fund
An Open-ended Equity Fund
14/07/1999
Mr. Anup Upadhyay
Jun-2011
3 Year +
Nil
Growth Dividend
5th/10th/15th/20th/25th/30th
(in case of February last business day)
S&P BSE - IT Index
SBI Pharma Fund
An Open-ended Equity Fund
14/07/1999
Mr. Tanmaya Desai
Jun-2011
3 Year +
Nil
Growth, Dividend
5th/10th/15th/20th/25th/30th (in case of February last business day)
S&P BSE HEALTH CARE
Index
SBI Magnum COMMA Fund
An Open-ended Equity Scheme
08/08/2005
Mr. RichardD'souza
Aug-2014
3 Year +
For exit within 1 year from the date of
allotment - 1 %; For exit after 1 year
from the date of allotment -
Nil
Growth, Dividend
5th/10th/15th/20th/25th/30th (in case of February last business day)
CNX Commodities
Index
SBI Magnum Global Fund
An Open-ended Growth Scheme
30/09/1994
Mr. R. Srinivasan
May-2009
3 Year +
For exit within 18 months
from the date of allotment -
1.5 %;For exit after 18 months
from the date of allotment -
Nil
Growth, Dividend
5th/10th/15th/20th/25th/30th
(in case of February last business day)
S&P BSE Midcap
SBI Magnum Midcap Fund
An Open-ended Growth Scheme
29/03/2005
Ms. Sohini Andani
July-2010
3 Year +
For exit within 1 year from the
date of allotment - 1 %; For exit after 1 year from the
date of allotment - Nil
Growth, Dividend
5th/10th/15th/20th/25th/30th
(in case of February last business day)
S&P BSE Midcap
SBI Arbitrage Opportunities
Fund
An Open-ended Scheme
03/11/2006
Mr. Neeraj Kumar
Oct-2012
1 Year +
For exit within 7 business days from the date of allotment -
0.25%; For exit after 7 business days from the
date of allotment - Nil
Growth, Dividend
5th/10th/15th/20th/25th/30th
(in case of February last business day)
CRISIL Liquid Fund Index
SBI Infrastructure
Fund
An Open-ended Growth Scheme
06/07/2007
Mr. RichardD'souza
Aug-2014
3 Year +
For exit within 1 year from the
date of allotment - 1 %; For exit after 1 year from the
date of allotment - Nil
Growth, Dividend
5th/10th/15th/20th/25th/30th
(in case of February last business day)
CNX Infrastructure
Index
SBI PSU Fund
An Open-ended Equity Fund
07/07/2010
Mr. RichardD'souza
Aug-2014
3 Year +
For exit within 1 year from the date of allotment - 1%; For exit after 1 year
from the date of allotment -
Nil
Growth, Dividend
5th/10th/15th/
20th/25th/30th (in case of February last business day)
S&P BSE PSU INDEX
Managing Since
(Previously known as SBI
MSFU - IT Fund)
(Previously known as SBI
MSFU - Pharma Fund)
(Previously known as SBI Infrastructure Fund- Series 1)
SBI EDGE Fund SBI SMALL AND MIDCAP FUND*
An Open-ended Hybrid Scheme
An Open-ended Equity Scheme
08/10/2012 09/09/2009
Mr. Dinesh Balachandran
Mr. Ruchit Mehta
Mr. R. Srinivasan
Oct - 2012 Nov - 2013
3 Year + 3 Year +
For exit within 1 year from the date of allotment - 1%;
For exit after 1 year from the date of allotment - Nil
For exit within 1 year from the date of allotment - 1%;
For exit after 1 year from the date of allotment - Nil
5th/10th/15th/20th/25th/30th (in
case of February last business day)
5th/10th/15th/20th/25th/30th (in
case of February last business day)
S&P BSE Sensex 33%, Crisil
Composite Bond Fund Index 33%, Price of Gold 33%
S&P BSE Small Cap Index
Regular Direct
Regular Direct
Regular Direct
Regular Direct
Regular Direct
Regular Direct
Regular Direct
Regular Direct
Plans Available Regular Direct
Regular Direct
Please consult your financial advisor before investing.
Fund invests in stocks of
commodity based companies
Growth, Dividend
Growth, Dividend
` 5000 & in multiples of ` 1
` 5000 & in multiples of ` 1
` 5000 & in multiples of ` 1
` 5000 & in multiples of ` 1
` 5000 & in multiples of ` 1
` 5000 & in multiples of ` 1
` 5000 & in multiples of ` 1
` 5000 & in multiples of ` 1
` 5000 & in multiples of ` 1
` 5000/- and in multiples of ` 1
` 1000 & in multiples of ` 1
` 1000 & in multiples of ` 1
` 1000 & in multiples of ` 1
` 1000 & in multiples of ` 1
` 1000 & in multiples of ` 1
` 1000 & in multiples of ` 1
` 1000 & in multiples of ` 1
` 1000 & in multiples of ` 1
` 1000 & in multiples of ` 1
` 1000 & in multiples of ` 1
SIP (MinimumAmount)
Monthly - Minimum ` 1000 & in
multiples of ` 1 thereafter for minimum six months (or)
minimum ` 500 & in multiples
of ` 1 thereafter for minimum one
year
Quarterly - Minimum ` 1500 & in
multiples of ` 1 thereafter for minimum one
year
Monthly - Minimum ` 1000 & in
multiples of ` 1 thereafter for minimum six months (or)
minimum ` 500 & in multiples
of ` 1 thereafter for minimum one
year
Quarterly - Minimum ` 1500 & in
multiples of ` 1 thereafter for minimum one
year
Monthly - Minimum ` 1000 & in
multiples of ` 1 thereafter for minimum six months (or)
minimum ` 500 & in multiples
of ` 1 thereafter for minimum
one year
Quarterly - Minimum ` 1500 & in
multiples of ` 1 thereafter for minimum one
year
Monthly - Minimum ` 1000 & in
multiples of ` 1 thereafter for minimum six months (or)
minimum ` 500 & in multiples
of ` 1 thereafter for minimum one
year
Quarterly - Minimum ` 1500 & in
multiples of ` 1 thereafter for minimum one
year
Monthly - Minimum ` 1000 & in
multiples of ` 1 thereafter for minimum six months (or)
minimum ` 500 & in multiples
of ` 1 thereafter for minimum
one year
Quarterly - Minimum ` 1500 & in
multiples of ` 1 thereafter for minimum one
year
Monthly - Minimum ` 1000 & in
multiples of ` 1 thereafter for minimum six months (or)
minimum ` 500 & in multiples of
` 1 thereafter for minimum
one year
Quarterly - Minimum ` 1500 & in
multiples of ` 1 thereafter for minimum one
year
Monthly - Minimum ` 1000 & in multiples of ` 1 thereafter for
minimum six months (or)
minimum ` 500 & in multiples of ` 1 thereafter for
minimum one year
Quarterly - Minimum ` 1500 & in multiples of ` 1 thereafter for
minimum one year
Monthly - Minimum ` 1000 & in multiples of ` 1 thereafter for
minimum six months (or)
minimum ` 500 & in multiples of ` 1 thereafter for
minimum one year
Quarterly - Minimum ` 1500 & in multiples of ` 1 thereafter for
minimum one year
Monthly - Minimum ` 1000 & in
multiples of ` 1 thereafter for minimum six months (or)
minimum ` 500 & in multiples
of ` 1 thereafter for minimum
one year
Quarterly - Minimum ` 1500 & in
multiples of ` 1 thereafter for minimum one
year
Monthly - Minimum ` 1000 & in
multiples of ` 1 thereafter for minimum six months (or)
minimum ` 500 & in multiples
of ` 1 thereafter for minimum
one year
Quarterly - Minimum ` 1500 & in
multiples of ` 1 thereafter for minimum one
year
*Pursuant to acquisition of Daiwa Industry Leaders Fund (DILF) from Daiwa Mutual Fund, w.e.f. Nov 16, 2013 the name of the scheme was changed to SBI Small & Midcap Fund.
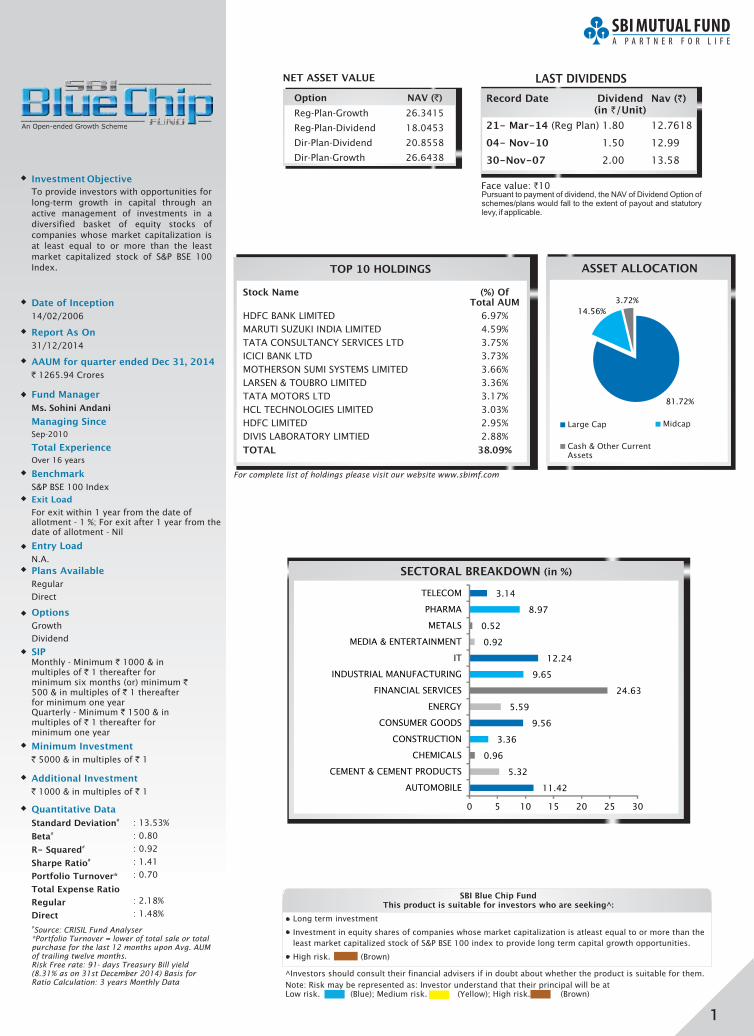
Investment Objective
To provide investors with opportunities for
long-term growth in capital through an
active management of investments in a
diversified basket of equity stocks of
companies whose market capitalization is
at least equal to or more than the least
market capitalized stock of S&P BSE 100
Index.
Date of Inception
14/02/2006
Entry Load
N.A.
Options
Growth
Dividend
Exit Load
For exit within 1 year from the date of allotment - 1 %; For exit after 1 year from the date of allotment - Nil
Quantitative Data
Standard Deviation
Beta
R- Squared
Sharpe Ratio
Portfolio Turnover
Total Expense Ratio
Regular
Direct
#
#
#
#
*
:
:
: 0.92
: 1.41
:
13.53%
0.80
0.70
: 2.18%
: 1.48%
Fund Manager
Ms. Sohini Andani
Sep-2010
Managing Since
Total Experience
Over 16 years
Benchmark
S&P BSE 100 Index
#Source: CRISIL Fund Analyser*Portfolio Turnover = lower of total sale or total purchase for the last 12 months upon Avg. AUM of trailing twelve months.Risk Free rate: 91- days Treasury Bill yield (8.31% as on 31st December 2014) Basis for Ratio Calculation: 3 years Monthly Data
Report As On
31/12/2014
TOP 10 HOLDINGS
For complete list of holdings please visit our website www.sbimf.com
Stock Name (%) OfTotal AUM
HDFC BANK LIMITED 6.97%
MARUTI SUZUKI INDIA LIMITED 4.59%
TATA CONSULTANCY SERVICES LTD 3.75%
ICICI BANK LTD 3.73%
MOTHERSON SUMI SYSTEMS LIMITED 3.66%
LARSEN & TOUBRO LIMITED 3.36%
TATA MOTORS LTD 3.17%
HCL TECHNOLOGIES LIMITED 3.03%
HDFC LIMITED 2.95%
DIVIS LABORATORY LIMTIED 2.88%
TOTAL 38.09%
ASSET ALLOCATION
SECTORAL BREAKDOWN (in %)
AAUM for quarter ended 2014Dec 31,
` 1265.94 Crores
Plans Available
Regular
Direct
Option NAV (`)
Reg-Plan-Growth 26.3415
Reg-Plan-Dividend 18.0453
Dir-Plan-Dividend 20.8558
Dir-Plan-Growth 26.6438
NET ASSET VALUE
Large Cap Midcap
Cash & Other Current Assets
SBI Blue Chip FundThis product is suitable for investors who are seeking^:
• Long term investment
Investment in equity shares of companies whose market capitalization is atleast equal to or more than the
least market capitalized stock of S&P BSE 100 index to provide long term capital growth opportunities.
High risk. (Brown)
•
•
^Investors should consult their financial advisers if in doubt about whether the product is suitable for them.
Record Date Dividend Nav (`)(in `/Unit)
21- Mar-14 (Reg Plan) 1.80 12.7618
04- Nov-10 1.50 12.99
30-Nov-07 2.00 13.58
LAST DIVIDENDS
Face value: `10Pursuant to payment of dividend, the NAV of Dividend Option of schemes/plans would fall to the extent of payout and statutory levy, if applicable.
Note: Risk may be represented as: Investor understand that their principal will be at Low risk. (Blue); Medium risk. (Yellow); High risk. (Brown)
Minimum Investment
` 5000 & in multiples of ` 1
Additional Investment
` 1000 & in multiples of ` 1
SIPMonthly - Minimum ` 1000 & in multiples of ` 1 thereafter for minimum six months (or) minimum ` 500 & in multiples of ` 1 thereafter for minimum one yearQuarterly - Minimum ` 1500 & in multiples of ` 1 thereafter for minimum one year
1
11.42
5.32
0.96
3.36
9.56
5.59
24.63
9.65
12.24
0.92
0.52
8.97
3.14
0 5 10 15 20 25 30
AUTOMOBILE
CEMENT & CEMENT PRODUCTS
CHEMICALS
CONSTRUCTION
CONSUMER GOODS
ENERGY
FINANCIAL SERVICES
INDUSTRIAL MANUFACTURING
IT
MEDIA & ENTERTAINMENT
METALS
PHARMA
TELECOM
81.72%
14.56%
3.72%
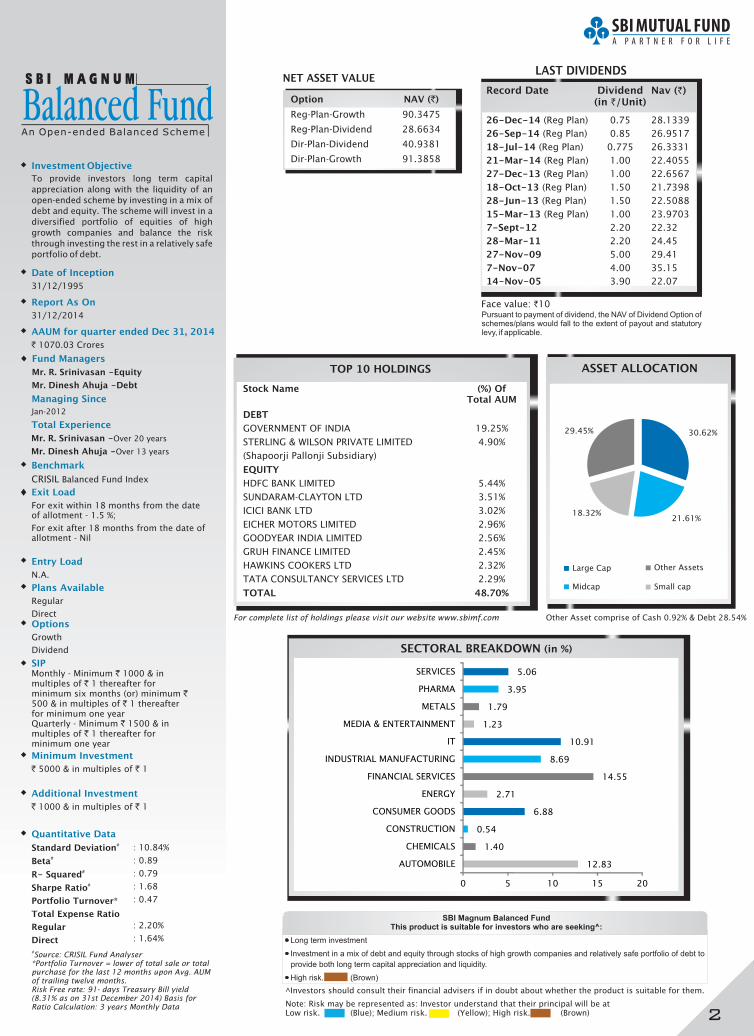
Investment Objective
To provide investors long term capital
appreciation along with the liquidity of an
open-ended scheme by investing in a mix of
debt and equity. The scheme will invest in a
diversified portfolio of equities of high
growth companies and balance the risk
through investing the rest in a relatively safe
portfolio of debt.
Date of Inception
31/12/1995
Entry Load
N.A.
Options
Growth
Dividend
Exit Load
For exit within 18 months from the date of allotment - 1.5 %;
For exit after 18 months from the date of allotment - Nil
Quantitative Data
Standard Deviation
Beta
R- Squared
Sharpe Ratio
Portfolio Turnover
Total Expense Ratio
Regular
Direct
#
#
#
#
*
: 10.84%
: 0.89
: 0.79
: 1.68
: 0.47
: 2.20%
: 1.64%
Fund Managers
Mr. R. Srinivasan -Equity
Mr. Dinesh Ahuja
Mr. R. Srinivasan -
Mr. Dinesh Ahuja -
-Debt
Managing Since
Total Experience
Jan-2012
Over 20 years
Over 13 years
Benchmark
CRISIL Balanced Fund Index
#Source: CRISIL Fund Analyser*Portfolio Turnover = lower of total sale or total purchase for the last 12 months upon Avg. AUM of trailing twelve months.Risk Free rate: 91- days Treasury Bill yield (8.31% as on 31st December 2014) Basis for Ratio Calculation: 3 years Monthly Data
Report As On
31/12/2014
AAUM for quarter ended Dec 31, 2014
` 1070.03 Crores
Plans Available
Regular
Direct
Option NAV (`)
Reg-Plan-Growth 90.3475
Reg-Plan-Dividend 28.6634
Dir-Plan-Dividend 40.9381
Dir-Plan-Growth 91.3858
NET ASSET VALUERecord Date Dividend Nav (`)
(in `/Unit)
LAST DIVIDENDS
SBI Magnum Balanced FundThis product is suitable for investors who are seeking^:
• Long term investment
Investment in a mix of debt and equity through stocks of high growth companies and relatively safe portfolio of debt to
provide both long term capital appreciation and liquidity.
High risk. (Brown)
•
•
^Investors should consult their financial advisers if in doubt about whether the product is suitable for them.
Face value: `10Pursuant to payment of dividend, the NAV of Dividend Option of schemes/plans would fall to the extent of payout and statutory levy, if applicable.
Note: Risk may be represented as: Investor understand that their principal will be at Low risk. (Blue); Medium risk. (Yellow); High risk. (Brown)
Minimum Investment
` 5000 & in multiples of ` 1
Additional Investment
` 1000 & in multiples of ` 1
SIPMonthly - Minimum ` 1000 & in multiples of ` 1 thereafter for minimum six months (or) minimum ` 500 & in multiples of ` 1 thereafter for minimum one yearQuarterly - Minimum ` 1500 & in multiples of ` 1 thereafter for minimum one year
2
For complete list of holdings please visit our website www.sbimf.com
ASSET ALLOCATION
Large Cap Other Assets
Midcap Small cap
TOP 10 HOLDINGS
Other Asset comprise of Cash 0.92% & Debt 28.54%
Stock Name (%) OfTotal AUM
DEBT
GOVERNMENT OF INDIA 19.25%
STERLING & WILSON PRIVATE LIMITED 4.90%
(Shapoorji Pallonji Subsidiary)
EQUITY
HDFC BANK LIMITED 5.44%
SUNDARAM-CLAYTON LTD 3.51%
ICICI BANK LTD 3.02%
EICHER MOTORS LIMITED 2.96%
GOODYEAR INDIA LIMITED 2.56%
GRUH FINANCE LIMITED 2.45%
HAWKINS COOKERS LTD 2.32%
TATA CONSULTANCY SERVICES LTD 2.29%
TOTAL 48.70%
26-Dec-14 (Reg Plan) 0.75 28.1339
26-Sep-14 (Reg Plan) 0.85 26.9517
18-Jul-14 (Reg Plan) 0.775 26.3331
21-Mar-14 (Reg Plan) 1.00 22.4055
27-Dec-13 (Reg Plan) 1.00 22.6567
18-Oct-13 (Reg Plan) 1.50 21.7398
28-Jun-13 (Reg Plan) 1.50 22.5088
15-Mar-13 (Reg Plan) 1.00 23.9703
7-Sept-12 2.20 22.32
28-Mar-11 2.20 24.45
27-Nov-09 5.00 29.41
7-Nov-07 4.00 35.15
14-Nov-05 3.90 22.07
12.83
1.40
0.54
6.88
2.71
14.55
8.69
10.91
1.23
1.79
3.95
5.06
0 5 10 15 20
AUTOMOBILE
CHEMICALS
CONSTRUCTION
CONSUMER GOODS
ENERGY
FINANCIAL SERVICES
INDUSTRIAL MANUFACTURING
IT
MEDIA & ENTERTAINMENT
METALS
PHARMA
SERVICES
SECTORAL BREAKDOWN (in %)
30.62%
21.61%18.32%
29.45%
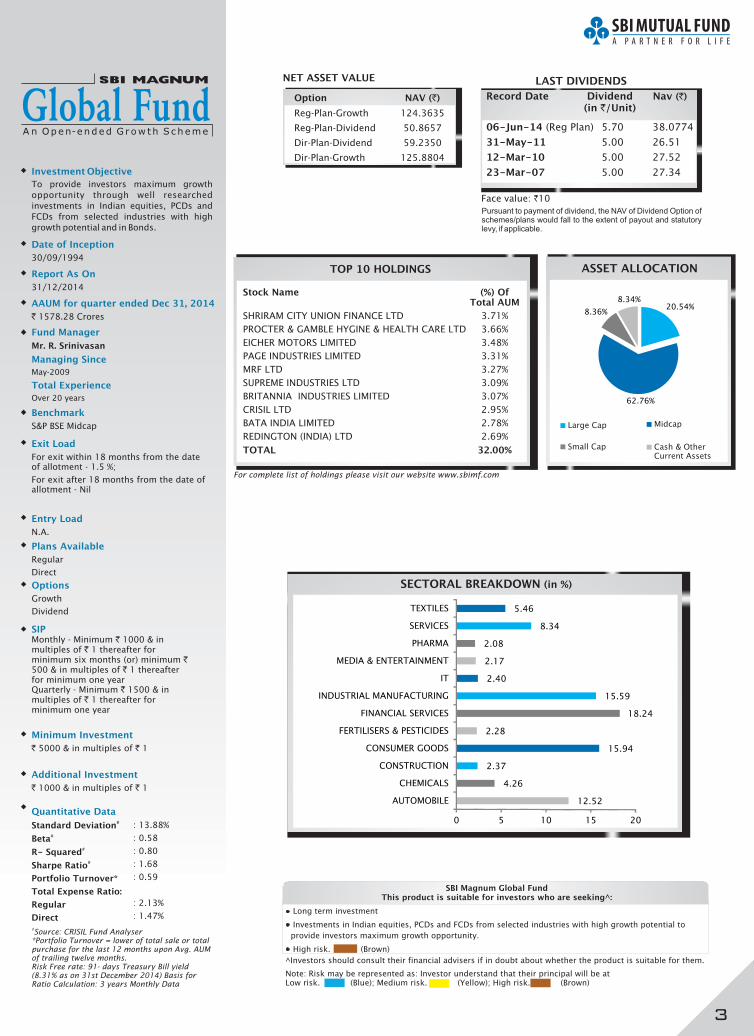
Investment Objective
To provide investors maximum growth
opportunity through well researched
investments in Indian equities, PCDs and
FCDs from selected industries with high
growth potential and in Bonds.
Date of Inception
30/09/1994
Entry Load
N.A.
Options
Growth
Dividend
Exit Load
For exit within 18 months from the date of allotment - 1.5 %;
For exit after 18 months from the date of allotment - Nil
Quantitative Data
Standard Deviation
Beta
R- Squared
Sharpe Ratio
Portfolio Turnover
Total Expense Ratio:
Regular
Direct
#
#
#
#
*
:
: 0.58
: 0.80
: 1.68
: 0.59
: 2.13%
: 1.47%
13.88%
Fund Manager
Mr. R. Srinivasan
May-2009
Over 20 years
Managing Since
Total Experience
Benchmark
S&P BSE Midcap
#Source: CRISIL Fund Analyser*Portfolio Turnover = lower of total sale or total purchase for the last 12 months upon Avg. AUM of trailing twelve months.Risk Free rate: 91- days Treasury Bill yield (8.31% as on 31st December 2014) Basis for Ratio Calculation: 3 years Monthly Data
Report As On
31/12/2014
TOP 10 HOLDINGS
For complete list of holdings please visit our website www.sbimf.com
Stock Name (%) OfTotal AUM
SHRIRAM CITY UNION FINANCE LTD 3.71%
PROCTER & GAMBLE HYGINE & HEALTH CARE LTD 3.66%
EICHER MOTORS LIMITED 3.48%
PAGE INDUSTRIES LIMITED 3.31%
MRF LTD 3.27%
SUPREME INDUSTRIES LTD 3.09%
BRITANNIA INDUSTRIES LIMITED 3.07%
CRISIL LTD 2.95%
BATA INDIA LIMITED 2.78%
REDINGTON (INDIA) LTD 2.69%
TOTAL 32.00%
ASSET ALLOCATION
MidcapLarge Cap
Small Cap
AAUM for quarter ended 2014Dec 31,
` 1578.28 Crores
Plans Available
Regular
Direct
Option NAV (`)
Reg-Plan-Growth 124.3635
Reg-Plan-Dividend 50.8657
Dir-Plan-Dividend 59.2350
Dir-Plan-Growth 125.8804
NET ASSET VALUE
06-Jun-14 (Reg Plan) 5.70 38.0774
31-May-11 5.00 26.51
12-Mar-10 5.00 27.52
23-Mar-07 5.00 27.34
LAST DIVIDENDS
Record Date Dividend Nav (`) (in `/Unit)
Face value: `10
SBI Magnum Global FundThis product is suitable for investors who are seeking^:
• Long term investment
Investments in Indian equities, PCDs and FCDs from selected industries with high growth potential to
provide investors maximum growth opportunity.
High risk. (Brown)
•
•
^Investors should consult their financial advisers if in doubt about whether the product is suitable for them.
Pursuant to payment of dividend, the NAV of Dividend Option of schemes/plans would fall to the extent of payout and statutory levy, if applicable.
Note: Risk may be represented as: Investor understand that their principal will be at Low risk. (Blue); Medium risk. (Yellow); High risk. (Brown)
Minimum Investment
` 5000 & in multiples of ` 1
Additional Investment
` 1000 & in multiples of ` 1
SIPMonthly - Minimum ` 1000 & in multiples of ` 1 thereafter for minimum six months (or) minimum ` 500 & in multiples of ` 1 thereafter for minimum one yearQuarterly - Minimum ` 1500 & in multiples of ` 1 thereafter for minimum one year
Cash & Other Current Assets
3
SECTORAL BREAKDOWN (in %)
12.52
4.26
2.37
15.94
2.28
18.24
15.59
2.40
2.17
2.08
8.34
5.46
0 5 10 15 20
AUTOMOBILE
CHEMICALS
CONSTRUCTION
CONSUMER GOODS
FERTILISERS & PESTICIDES
FINANCIAL SERVICES
INDUSTRIAL MANUFACTURING
IT
MEDIA & ENTERTAINMENT
PHARMA
SERVICES
TEXTILES
20.54%
62.76%
8.36%
8.34%
Investment Objective
To provide investors with opportunities for
long-term growth in capital along with the
liquidity of an open-ended scheme by
investing predominantly in a well diversified
basket of equity stocks of Midcap
companies.
Date of Inception
29/03/2005
Entry Load
N.A.
Options
Growth
Dividend
Exit Load
For exit within 1 year from the date of allotment - 1 %;
For exit after 1 year from the date of allotment - Nil
Quantitative Data
Standard Deviation
Beta
R- Squared
Sharpe Ratio
Portfolio Turnover
Total Expense Ratio
Regular
Direct
#
#
#
#
*
Fund Manager
Ms. Sohini Andani
Over 16 years
Managing Since
Total Experience
July-2010
Benchmark
S&P BSE Midcap
#Source: CRISIL Fund Analyser*Portfolio Turnover = lower of total sale or total purchase for the last 12 months upon Avg. AUM of trailing twelve months.Risk Free rate: 91- days Treasury Bill yield (8.31% as on 31st December 2014) Basis for Ratio Calculation: 3 years Monthly Data
Report As On
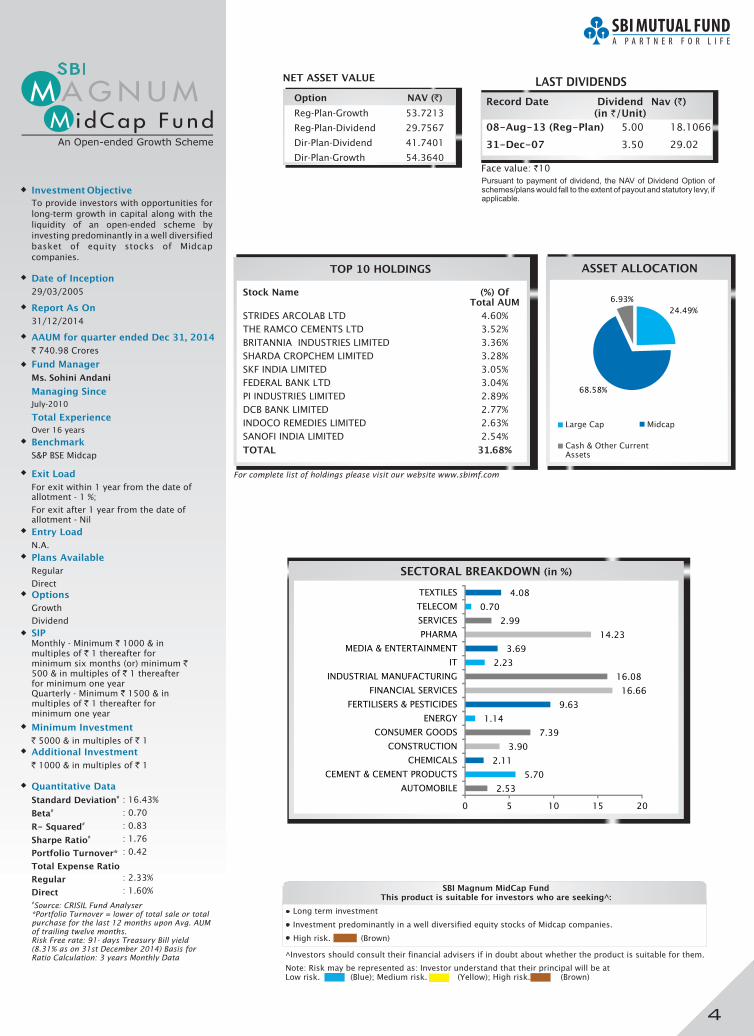
31/12/2014
TOP 10 HOLDINGS
For complete list of holdings please visit our website www.sbimf.com
Stock Name (%) OfTotal AUM
STRIDES ARCOLAB LTD 4.60%
THE RAMCO CEMENTS LTD 3.52%
BRITANNIA INDUSTRIES LIMITED 3.36%
SHARDA CROPCHEM LIMITED 3.28%
SKF INDIA LIMITED 3.05%
FEDERAL BANK LTD 3.04%
PI INDUSTRIES LIMITED 2.89%
DCB BANK LIMITED 2.77%
INDOCO REMEDIES LIMITED 2.63%
SANOFI INDIA LIMITED 2.54%
TOTAL 31.68%
ASSET ALLOCATION
SECTORAL BREAKDOWN (in %)
AAUM for quarter ended Dec 31, 2014
` 740.98 Crores
: 16.43%
: 0.70
: 0.83
: 1.76
: 0.42
: 2.33%
: 1.60%
Plans Available
Regular
Direct
Option NAV (`)
Reg-Plan-Growth 53.7213
Reg-Plan-Dividend 29.7567
Dir-Plan-Dividend 41.7401
Dir-Plan-Growth 54.3640
NET ASSET VALUE
Record Date Dividend Nav (`)(in `/Unit)
08-Aug-13 (Reg-Plan) 5.00 18.1066
31-Dec-07 3.50 29.02
LAST DIVIDENDS
Face value: `10
SBI Magnum MidCap FundThis product is suitable for investors who are seeking^:
• Long term investment
Investment predominantly in a well diversified equity stocks of Midcap companies.
High risk. (Brown)
•
Pursuant to payment of dividend, the NAV of Dividend Option of schemes/plans would fall to the extent of payout and statutory levy, if applicable.
^Investors should consult their financial advisers if in doubt about whether the product is suitable for them.
Note: Risk may be represented as: Investor understand that their principal will be at Low risk. (Blue); Medium risk. (Yellow); High risk. (Brown)
Minimum Investment
` 5000 & in multiples of ` 1
Additional Investment
` 1000 & in multiples of ` 1
SIPMonthly - Minimum ` 1000 & in multiples of ` 1 thereafter for minimum six months (or) minimum ` 500 & in multiples of ` 1 thereafter for minimum one yearQuarterly - Minimum ` 1500 & in multiples of ` 1 thereafter for minimum one year
Large Cap Midcap
Cash & Other Current Assets
4
2.53
5.70
2.11
3.90
7.39
1.14
9.63
16.66
16.08
2.23
3.69
14.23
2.99
0.70
4.08
0 5 10 15 20
AUTOMOBILE
CEMENT & CEMENT PRODUCTS
CHEMICALS
CONSTRUCTION
CONSUMER GOODS
ENERGY
FERTILISERS & PESTICIDES
FINANCIAL SERVICES
INDUSTRIAL MANUFACTURING
IT
MEDIA & ENTERTAINMENT
PHARMA
SERVICES
TELECOM
TEXTILES
24.49%
68.58%
6.93%
Investment Objective
To provide the investor long-term capital
appreciation by investing in high growth
companies along with the liquidity of an
open-ended scheme through investments
primarily in equities and the balance in debt
and money market instruments.
Date of Inception
01/01/1991
Entry Load
N.A.
Plans Available
Regular
Direct
Options
Growth
Dividend
SIPMonthly - Minimum ` 1000 & in multiples of ` 1 thereafter for minimum six months (or) minimum ` 500 & in multiples of ` 1 thereafter for minimum one yearQuarterly - Minimum ` 1500 & in multiples of ` 1 thereafter for minimum one year
Minimum Investment
` 5000 & in multiples of ` 1
Exit Load
For exit within 1 year from the date of allotment - 1 %;
For exit after 1 year from the date of allotment - Nil
Additional Investment
` 1000 & in multiples of ` 1
Quantitative Data
Standard Deviation
Beta
R- Squared
Sharpe Ratio
Portfolio Turnover
Total Expense Ratio:
Regular
Direct
#
#
#
#
*
: 14.59%
: 0.90
: 0.94
: 1.05
: 0.94
: 2.19%
: 1.64%
Fund Manager
Mr. R. Srinivasan
Managing Since
Total Experience
May-2009
Over 20 years
Benchmark
CNX Nifty Index
#Source: CRISIL Fund Analyser*Portfolio Turnover = lower of total sale or total purchase for the last 12 months upon Avg. AUM of trailing twelve months.Risk Free rate: 91- days Treasury Bill yield (8.31% as on 31st December 2014) Basis for Ratio Calculation: 3 years Monthly Data
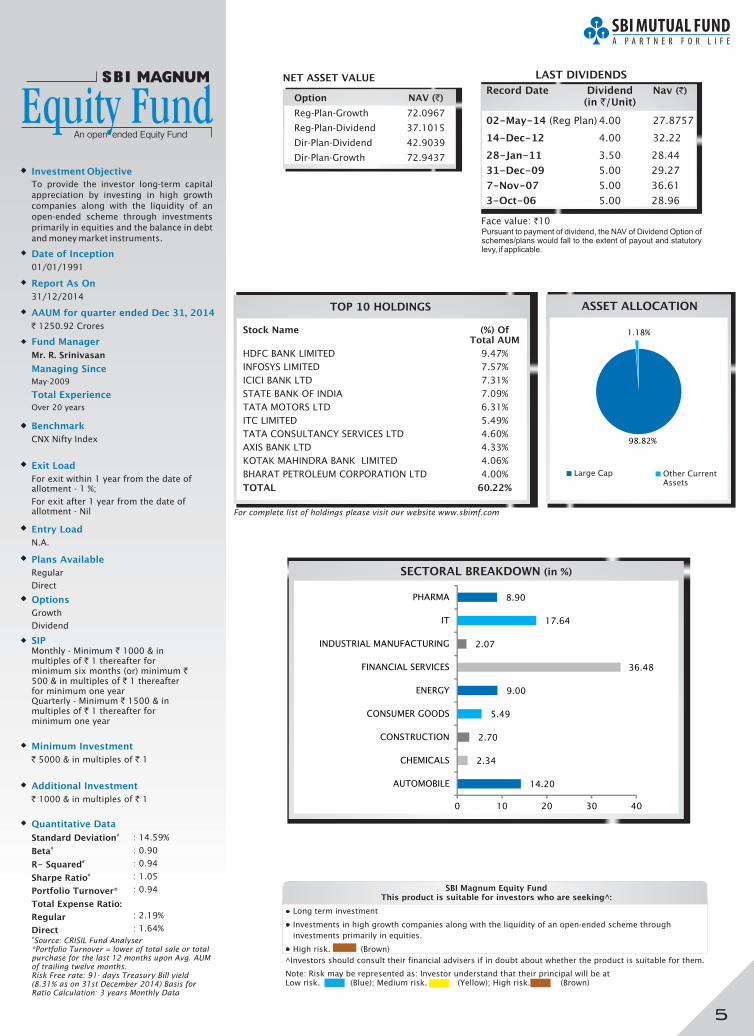
Report As On
31/12/2014
TOP 10 HOLDINGS
For complete list of holdings please visit our website www.sbimf.com
Stock Name (%) OfTotal AUM
HDFC BANK LIMITED 9.47%
INFOSYS LIMITED 7.57%
ICICI BANK LTD 7.31%
STATE BANK OF INDIA 7.09%
TATA MOTORS LTD 6.31%
ITC LIMITED 5.49%
TATA CONSULTANCY SERVICES LTD 4.60%
AXIS BANK LTD 4.33%
KOTAK MAHINDRA BANK LIMITED 4.06%
BHARAT PETROLEUM CORPORATION LTD 4.00%
TOTAL 60.22%
ASSET ALLOCATIONAAUM for quarter ended Dec 31, 2014
` 1250.92 Crores
Pursuant to payment of dividend, the NAV of Dividend Option of schemes/plans would fall to the extent of payout and statutory levy, if applicable.
Large Cap Other Current Assets
Option
Reg-Plan-Growth 72.0967
Reg-Plan-Dividend 37.1015
Dir-Plan-Dividend 42.9039
Dir-Plan-Growth 72.9437
NAV (`)
NET ASSET VALUE
SECTORAL BREAKDOWN (in %)
02-May-14 (Reg Plan) 4.00 27.8757
14-Dec-12 4.00 32.22
28-Jan-11 3.50 28.44
31-Dec-09 5.00 29.27
7-Nov-07 5.00 36.61
3-Oct-06 5.00 28.96
LAST DIVIDENDS
Record Date Dividend Nav (`) (in `/Unit)
Face value: `10
SBI Magnum Equity FundThis product is suitable for investors who are seeking^:
• Long term investment
Investments in high growth companies along with the liquidity of an open-ended scheme through
investments primarily in equities.
High risk. (Brown)
•
•
^Investors should consult their financial advisers if in doubt about whether the product is suitable for them.
Note: Risk may be represented as: Investor understand that their principal will be at Low risk. (Blue); Medium risk. (Yellow); High risk. (Brown)
5
An open ended Equity Fund
14.20
2.34
2.70
5.49
9.00
36.48
2.07
17.64
8.90
0 10 20 30 40
AUTOMOBILE
CHEMICALS
CONSTRUCTION
CONSUMER GOODS
ENERGY
FINANCIAL SERVICES
INDUSTRIAL MANUFACTURING
IT
PHARMA
98.82%
1.18%
Investment Objective
The prime objective of this scheme is to deliver the benefit of investment in a portfolio of equity shares, while offering deduction on such investments made in the scheme under Section 80 C of the Income-tax Act, 1961. It also seeks to distribute income periodically depending on distributable surplus.
Date of Inception
31/03/1993
Entry Load
N.A.
Options
Growth
Dividend
SIP
` 500 & in multiples of ` 500
Exit Load
NIL
Quantitative Data
Standard Deviation
Beta
R- Squared
Sharpe Ratio
Portfolio Turnover
Total Expense Ratio
Regular
Direct
#
#
#
#
*
: 14.61%
: 0.85
: 0.91
: 1.26
:
: 2.01%
: 1.54%
0.19
Fund Manager
Mr. Jayesh Shroff
Oct-2008
Over 10 years
Managing Since
Total Experience
Benchmark
S&P BSE 100 Index
#Source: CRISIL Fund Analyser*Portfolio Turnover = lower of total sale or total purchase for the last 12 months upon Avg. AUM of trailing twelve months.Risk Free rate: 91- days Treasury Bill yield (8.31% as on 31st December 2014) Basis for Ratio Calculation: 3 years Monthly Data
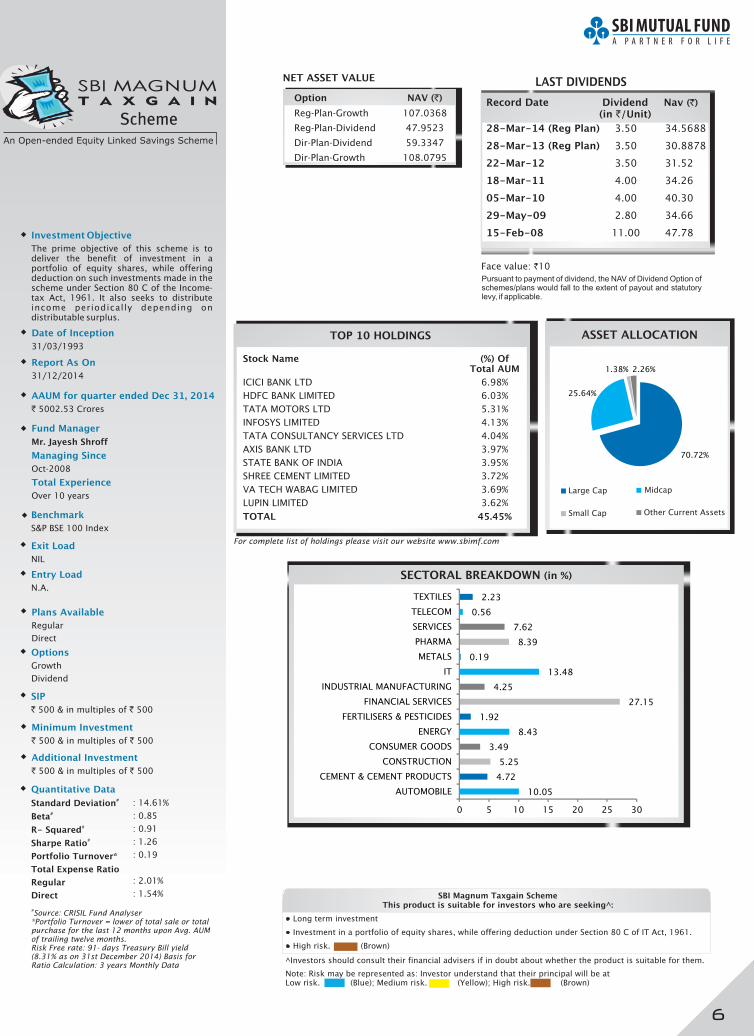
Report As On
31/12/2014
TOP 10 HOLDINGS
For complete list of holdings please visit our website www.sbimf.com
Stock Name (%) OfTotal AUM
ICICI BANK LTD 6.98%
HDFC BANK LIMITED 6.03%
TATA MOTORS LTD 5.31%
INFOSYS LIMITED 4.13%
TATA CONSULTANCY SERVICES LTD 4.04%
AXIS BANK LTD 3.97%
STATE BANK OF INDIA 3.95%
SHREE CEMENT LIMITED 3.72%
VA TECH WABAG LIMITED 3.69%
LUPIN LIMITED 3.62%
TOTAL 45.45%
ASSET ALLOCATION
Large Cap
Small Cap
Midcap
Other Current Assets
SECTORAL BREAKDOWN (in %)
AAUM for quarter ended Dec 31, 2014
` 5002.53 Crores
Plans Available
Regular
Direct
Option NAV (`)
Reg-Plan-Growth 107.0368
Reg-Plan-Dividend 47.9523
Dir-Plan-Dividend 59.3347
Dir-Plan-Growth 108.0795
NET ASSET VALUE
28-Mar-14 (Reg Plan) 3.50 34.5688
28-Mar-13 (Reg Plan) 3.50 30.8878
22-Mar-12 3.50 31.52
18-Mar-11 4.00 34.26
05-Mar-10 4.00 40.30
29-May-09 2.80 34.66
15-Feb-08 11.00 47.78
LAST DIVIDENDS
Face value: `10
SBI Magnum Taxgain SchemeThis product is suitable for investors who are seeking^:
• Long term investment
Investment in a portfolio of equity shares, while offering deduction under Section 80 C of IT Act, 1961.
High risk. (Brown)
•
•
^Investors should consult their financial advisers if in doubt about whether the product is suitable for them.
Pursuant to payment of dividend, the NAV of Dividend Option of schemes/plans would fall to the extent of payout and statutory levy, if applicable.
Note: Risk may be represented as: Investor understand that their principal will be at Low risk. (Blue); Medium risk. (Yellow); High risk. (Brown)
Minimum Investment
` 500 & in multiples of ` 500
Additional Investment
` 500 & in multiples of ` 500
6
Record Date Dividend Nav (`) (in `/Unit)
10.05
4.72
5.25
3.49
8.43
1.92
27.15
4.25
13.48
0.19
8.39
7.62
0.56
2.23
0 5 10 15 20 25 30
AUTOMOBILE
CEMENT & CEMENT PRODUCTS
CONSTRUCTION
CONSUMER GOODS
ENERGY
FERTILISERS & PESTICIDES
FINANCIAL SERVICES
INDUSTRIAL MANUFACTURING
IT
METALS
PHARMA
SERVICES
TELECOM
TEXTILES
70.72%
25.64%
1.38% 2.26%
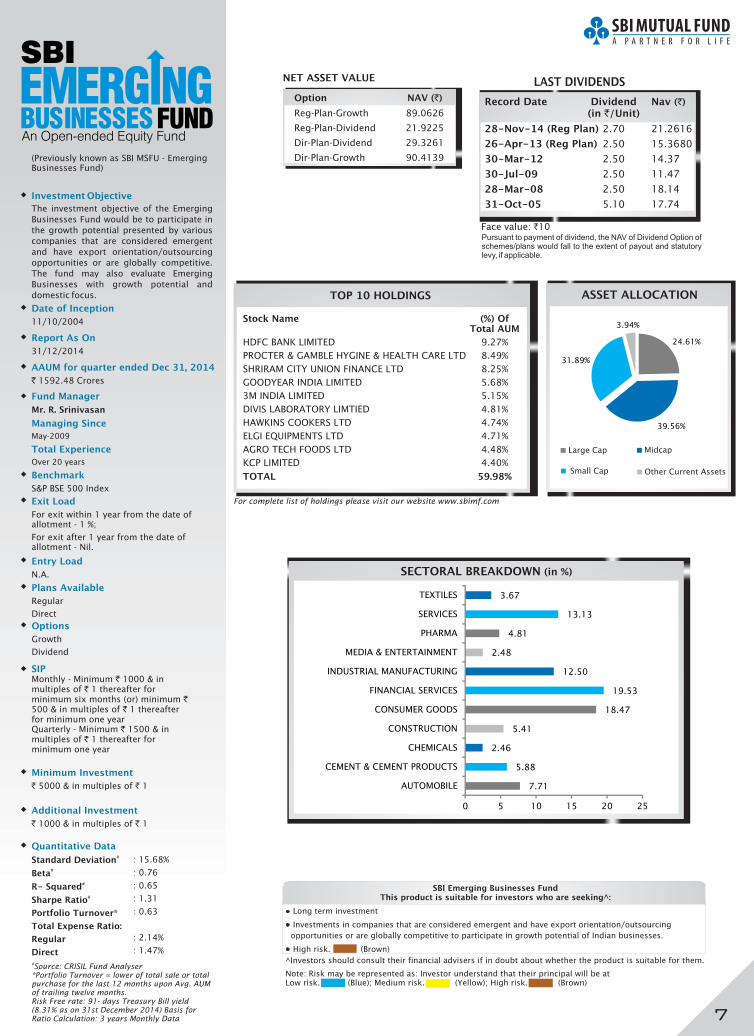
TOP 10 HOLDINGS
For complete list of holdings please visit our website www.sbimf.com
Stock Name (%) OfTotal AUM
HDFC BANK LIMITED 9.27%
PROCTER & GAMBLE HYGINE & HEALTH CARE LTD 8.49%
SHRIRAM CITY UNION FINANCE LTD 8.25%
GOODYEAR INDIA LIMITED 5.68%
3M INDIA LIMITED 5.15%
DIVIS LABORATORY LIMTIED 4.81%
HAWKINS COOKERS LTD 4.74%
ELGI EQUIPMENTS LTD 4.71%
AGRO TECH FOODS LTD 4.48%
KCP LIMITED 4.40%
TOTAL 59.98%
ASSET ALLOCATION
Investment Objective
The investment objective of the Emerging
Businesses Fund would be to participate in
the growth potential presented by various
companies that are considered emergent
and have export orientation/outsourcing
opportunities or are globally competitive.
The fund may also evaluate Emerging
Businesses with growth potential and
domestic focus.
Date of Inception
11/10/2004
Entry Load
N.A.
Options
Growth
Dividend
Exit Load
For exit within 1 year from the date of allotment - 1 %;
For exit after 1 year from the date of allotment - Nil.
Quantitative Data
Standard Deviation
Beta
R- Squared
Sharpe Ratio
Portfolio Turnover
Total Expense Ratio:
Regular
Direct
#
#
#
#
*
: 15.68%
: 0.76
: 0.65
: 1.31
: 0.63
: 2.14%
: 1.47%
Fund Manager
Mr. R. Srinivasan
Managing Since
Total Experience
May-2009
Over 20 years
Benchmark
S&P BSE 500 Index
#Source: CRISIL Fund Analyser*Portfolio Turnover = lower of total sale or total purchase for the last 12 months upon Avg. AUM of trailing twelve months.Risk Free rate: 91- days Treasury Bill yield (8.31% as on 31st December 2014) Basis for Ratio Calculation: 3 years Monthly Data
Report As On
31/12/2014
AAUM for quarter ended Dec 31, 2014
` 1592.48 Crores
An Open-ended Equity Fund
Plans Available
Regular
Direct
(Previously known as SBI MSFU - Emerging Businesses Fund)
Option NAV (`)
Reg-Plan-Growth 89.0626
Reg-Plan-Dividend 21.9225
Dir-Plan-Dividend 29.3261
Dir-Plan-Growth 90.4139
NET ASSET VALUE
Record Date Dividend Nav (`) (in `/Unit)
28-Nov-14 (Reg Plan) 2.70 21.2616
26-Apr-13 (Reg Plan) 2.50 15.3680
30-Mar-12 2.50 14.37
30-Jul-09 2.50 11.47
28-Mar-08 2.50 18.14
31-Oct-05 5.10 17.74
LAST DIVIDENDS
Face value: `10
Midcap
Other Current Assets
Large Cap
Small Cap
SBI Emerging Businesses FundThis product is suitable for investors who are seeking^:
• Long term investment
Investments in companies that are considered emergent and have export orientation/outsourcing
opportunities or are globally competitive to participate in growth potential of Indian businesses.
High risk. (Brown)
•
•
^Investors should consult their financial advisers if in doubt about whether the product is suitable for them.
Pursuant to payment of dividend, the NAV of Dividend Option of schemes/plans would fall to the extent of payout and statutory levy, if applicable.
Note: Risk may be represented as: Investor understand that their principal will be at Low risk. (Blue); Medium risk. (Yellow); High risk. (Brown)
Minimum Investment
` 5000 & in multiples of ` 1
Additional Investment
` 1000 & in multiples of ` 1
SIPMonthly - Minimum ` 1000 & in multiples of ` 1 thereafter for minimum six months (or) minimum ` 500 & in multiples of ` 1 thereafter for minimum one yearQuarterly - Minimum ` 1500 & in multiples of ` 1 thereafter for minimum one year
7
SECTORAL BREAKDOWN (in %)
7.71
5.88
2.46
5.41
18.47
19.53
12.50
2.48
4.81
13.13
3.67
0 5 10 15 20 25
AUTOMOBILE
CEMENT & CEMENT PRODUCTS
CHEMICALS
CONSTRUCTION
CONSUMER GOODS
FINANCIAL SERVICES
INDUSTRIAL MANUFACTURING
MEDIA & ENTERTAINMENT
PHARMA
SERVICES
TEXTILES
24.61%
39.56%
31.89%
3.94%
Investment Objective
To provide the investors maximum growth
opportunity through equity investments in
stocks of growth oriented sectors of the
economy. There are four sub-funds
dedicated to specific investment themes viz.
Information Technology, Pharmaceuticals,
FMCG, Contrarian (investment in stocks
currently out of favour) and Emerging
Businesses.
Date of Inception
14/07/1999
Entry Load
N.A.
Options
Growth
Dividend
Exit Load
Nil
Quantitative Data
Standard Deviation
Beta
R- Squared
Sharpe Ratio
Portfolio Turnover
Total Expense Ratio:
Regular
Direct
#
#
#
#
*
: 14.22%
: 0.84
: 0.85
: 1.38
: 0.42
: 2.56%
: 1.87%
Fund Manager
Mr. Saurabh Pant
Jun-2011
Managing Since
Total Experience
Over 5 years
Benchmark
S&P BSE FMCG Index
#Source: CRISIL Fund Analyser*Portfolio Turnover = lower of total sale or total purchase for the last 12 months upon Avg. AUM of trailing twelve months.Risk Free rate: 91- days Treasury Bill yield (8.31% as on 31st December 2014) Basis for Ratio Calculation: 3 years Monthly Data
Report As On
31/12/2014
TOP 10 HOLDINGS
For complete list of holdings please visit our website www.sbimf.com
Stock Name (%) OfTotal AUM
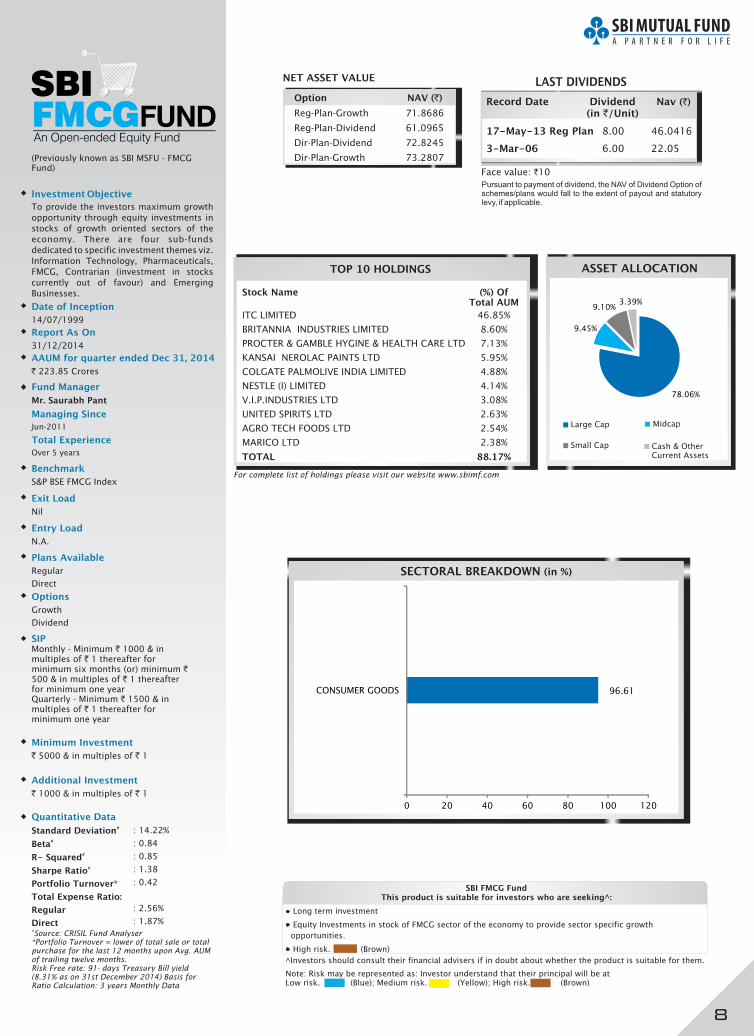
ITC LIMITED 46.85%
BRITANNIA INDUSTRIES LIMITED 8.60%
PROCTER & GAMBLE HYGINE & HEALTH CARE LTD 7.13%
KANSAI NEROLAC PAINTS LTD 5.95%
COLGATE PALMOLIVE INDIA LIMITED 4.88%
NESTLE (I) LIMITED 4.14%
V.I.P.INDUSTRIES LTD 3.08%
UNITED SPIRITS LTD 2.63%
AGRO TECH FOODS LTD 2.54%
MARICO LTD 2.38%
TOTAL 88.17%
SECTORAL BREAKDOWN (in %)
AAUM for quarter ended Dec 31, 2014
` 223.85 Crores
An Open-ended Equity Fund
Plans Available
Regular
Direct
(Previously known as SBI MSFU - FMCG Fund)
Option NAV (`)
Reg-Plan-Growth 71.8686
Reg-Plan-Dividend 61.0965
Dir-Plan-Dividend 72.8245
Dir-Plan-Growth 73.2807
NET ASSET VALUE
Record Date Dividend Nav (`)
(in `/Unit)
17-May-13 Reg Plan 8.00 46.0416
3-Mar-06 6.00 22.05
LAST DIVIDENDS
Face value: `10
SBI FMCG FundThis product is suitable for investors who are seeking^:
• Long term investment
Equity Investments in stock of FMCG sector of the economy to provide sector specific growth
opportunities.
High risk. (Brown)
•
•
^Investors should consult their financial advisers if in doubt about whether the product is suitable for them.
ASSET ALLOCATION
Large Cap
Small Cap
Midcap
Cash & Other Current Assets
Pursuant to payment of dividend, the NAV of Dividend Option of schemes/plans would fall to the extent of payout and statutory levy, if applicable.
Note: Risk may be represented as: Investor understand that their principal will be at Low risk. (Blue); Medium risk. (Yellow); High risk. (Brown)
Minimum Investment
` 5000 & in multiples of ` 1
Additional Investment
` 1000 & in multiples of ` 1
SIPMonthly - Minimum ` 1000 & in multiples of ` 1 thereafter for minimum six months (or) minimum ` 500 & in multiples of ` 1 thereafter for minimum one yearQuarterly - Minimum ` 1500 & in multiples of ` 1 thereafter for minimum one year
8
96.61
0 20 40 60 80 100 120
CONSUMER GOODS
78.06%
9.45%
9.10%3.39%
Investment Objective
To provide the investors maximum growth
opportunity through equity investments in
stocks of growth oriented sectors of the
economy. There are four sub-funds
dedicated to specific investment themes viz.
Information Technology, Pharmaceuticals,
FMCG, Contrarian (investment in stocks
currently out of favour) and Emerging
Businesses.
Date of Inception
14/07/1999
Entry Load
N.A.
Options
Growth
Dividend
Exit Load
Nil
Quantitative Data
Standard Deviation
Beta
R- Squared
Sharpe Ratio
Portfolio Turnover
Total Expense Ratio:
Regular
Direct
#
#
#
#
*
: 14.18%
: 0.93
: 0.89
: 1.86
: 0.72
: 2.52%
: 1.48%
Fund Manager
Mr. Tanmaya Desai
Jun-2011
Managing Since
Total Experience
Over 5 years
Benchmark
S&P BSE HEALTH CARE Index
#Source: CRISIL Fund Analyser*Portfolio Turnover = lower of total sale or total purchase for the last 12 months upon Avg. AUM of trailing twelve months.Risk Free rate: 91- days Treasury Bill yield (8.31% as on 31st December 2014) Basis for Ratio Calculation: 3 years Monthly Data
Report As On
31/12/2014
TOP 10 HOLDINGS
For complete list of holdings please visit our website www.sbimf.com
Stock Name (%) OfTotal AUM
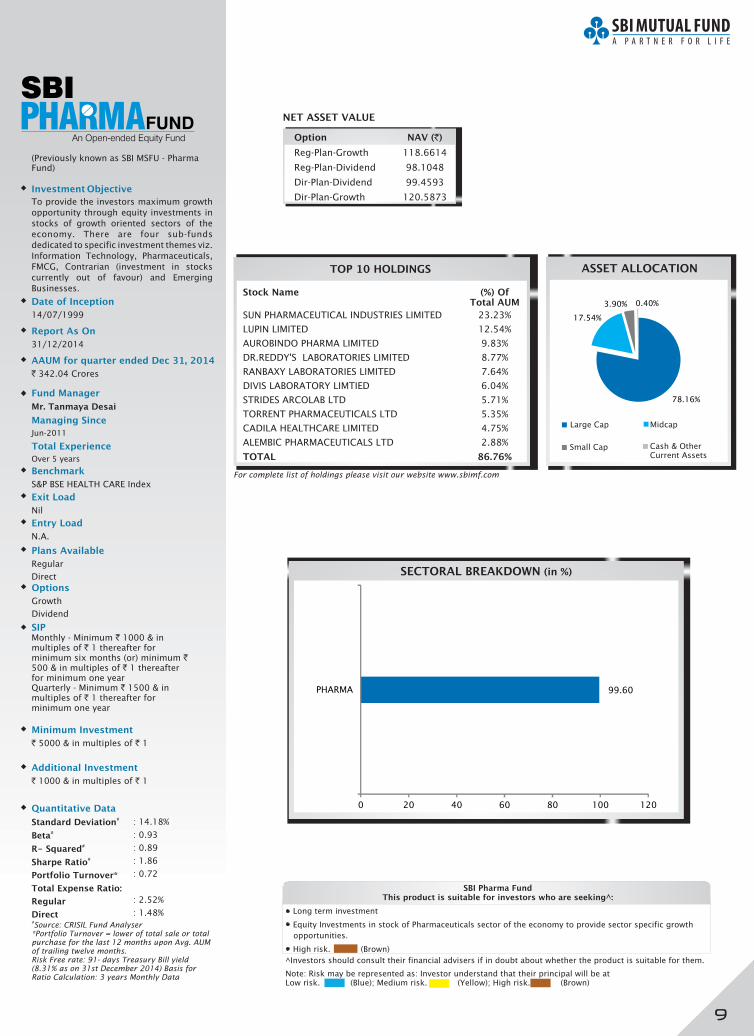
SUN PHARMACEUTICAL INDUSTRIES LIMITED 23.23%
LUPIN LIMITED 12.54%
AUROBINDO PHARMA LIMITED 9.83%
DR.REDDY'S LABORATORIES LIMITED 8.77%
RANBAXY LABORATORIES LIMITED 7.64%
DIVIS LABORATORY LIMTIED 6.04%
STRIDES ARCOLAB LTD 5.71%
TORRENT PHARMACEUTICALS LTD 5.35%
CADILA HEALTHCARE LIMITED 4.75%
ALEMBIC PHARMACEUTICALS LTD 2.88%
TOTAL 86.76%
ASSET ALLOCATION
Cash & Other Current Assets
SECTORAL BREAKDOWN (in %)
AAUM for quarter ended Dec 31, 2014
` 342.04 Crores
An Open-ended Equity Fund
Plans Available
Regular
Direct
(Previously known as SBI MSFU - Pharma Fund)
Option NAV (`)
Reg-Plan-Growth 118.6614
Reg-Plan-Dividend 98.1048
Dir-Plan-Dividend 99.4593
Dir-Plan-Growth 120.5873
NET ASSET VALUE
SBI Pharma FundThis product is suitable for investors who are seeking^:
• Long term investment
Equity Investments in stock of Pharmaceuticals sector of the economy to provide sector specific growth
opportunities.
High risk. (Brown)
•
•
^Investors should consult their financial advisers if in doubt about whether the product is suitable for them.
Note: Risk may be represented as: Investor understand that their principal will be at Low risk. (Blue); Medium risk. (Yellow); High risk. (Brown)
Minimum Investment
` 5000 & in multiples of ` 1
Additional Investment
` 1000 & in multiples of ` 1
SIPMonthly - Minimum ` 1000 & in multiples of ` 1 thereafter for minimum six months (or) minimum ` 500 & in multiples of ` 1 thereafter for minimum one yearQuarterly - Minimum ` 1500 & in multiples of ` 1 thereafter for minimum one year
Large Cap Midcap
Small Cap
9
99.60
0 20 40 60 80 100 120
PHARMA
78.16%
17.54%
3.90% 0.40%
Investment Objective
To provide the investors maximum growth
opportunity through equity investments in
stocks of growth oriented sectors of the
economy. There are four sub-funds
dedicated to specific investment themes viz.
Information Technology, Pharmaceuticals,
FMCG, Contrarian (investment in stocks
currently out of favour) and Emerging
Businesses.
Date of Inception
14/07/1999
Entry Load
N.A.
Options
Growth
Dividend
Exit Load
Nil
Quantitative Data
Standard Deviation
Beta
R-Squared
Sharpe Ratio
Portfolio Turnover
Total Expense Ratio
Regular
Direct
#
#
#
#
*
: 20.66%
: 0.85
: 0.97
: 0.91
: 0.85
: 2.70%
: 1.90%
Fund Manager
Mr. Anup Upadhyay
Jun-2011
Managing Since
Total Experience
Over 5 years
Benchmark
S&P BSE - IT Index
#Source: CRISIL Fund Analyser*Portfolio Turnover = lower of total sale or total purchase for the last 12 months upon Avg. AUM of trailing twelve months.Risk Free rate: 91- days Treasury Bill yield (8.31% as on 31st December 2014) Basis for Ratio Calculation: 3 years Monthly Data
Option NAV (`)
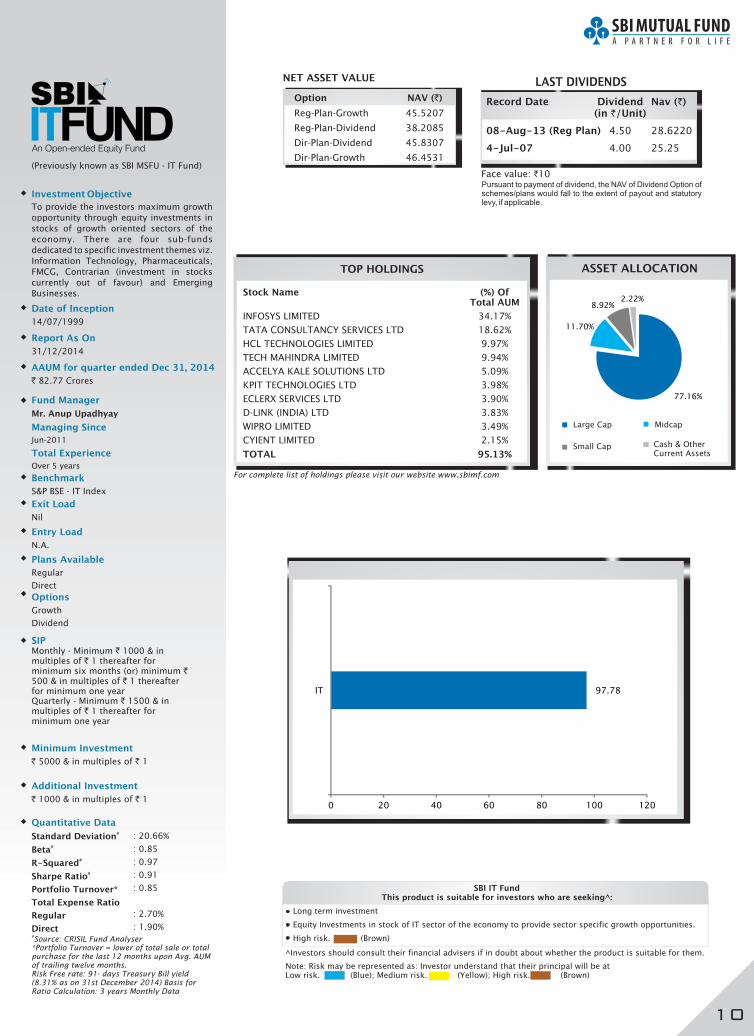
Reg-Plan-Growth 45.5207
Reg-Plan-Dividend 38.2085
Dir-Plan-Dividend 45.8307
Dir-Plan-Growth 46.4531
NET ASSET VALUE
Report As On
31/12/2014
TOP HOLDINGS
For complete list of holdings please visit our website www.sbimf.com
Stock Name (%) OfTotal AUM
INFOSYS LIMITED 34.17%
TATA CONSULTANCY SERVICES LTD 18.62%
HCL TECHNOLOGIES LIMITED 9.97%
TECH MAHINDRA LIMITED 9.94%
ACCELYA KALE SOLUTIONS LTD 5.09%
KPIT TECHNOLOGIES LTD 3.98%
ECLERX SERVICES LTD 3.90%
D-LINK (INDIA) LTD 3.83%
WIPRO LIMITED 3.49%
CYIENT LIMITED 2.15%
TOTAL 95.13%
ASSET ALLOCATION
AAUM for quarter ended Dec 31, 2014
` 82.77 Crores
An Open-ended Equity Fund
Plans Available
Regular
Direct
(Previously known as SBI MSFU - IT Fund)
Record Date Dividend Nav (`)(in `/Unit)
08-Aug-13 (Reg Plan) 4.50 28.6220
4-Jul-07 4.00 25.25
LAST DIVIDENDS
Face value: `10
SBI IT FundThis product is suitable for investors who are seeking^:
• Long term investment
Equity Investments in stock of IT sector of the economy to provide sector specific growth opportunities.
High risk. (Brown)
•
•
^Investors should consult their financial advisers if in doubt about whether the product is suitable for them.
Pursuant to payment of dividend, the NAV of Dividend Option of schemes/plans would fall to the extent of payout and statutory levy, if applicable.
Note: Risk may be represented as: Investor understand that their principal will be at Low risk. (Blue); Medium risk. (Yellow); High risk. (Brown)
Minimum Investment
` 5000 & in multiples of ` 1
Additional Investment
` 1000 & in multiples of ` 1
SIPMonthly - Minimum ` 1000 & in multiples of ` 1 thereafter for minimum six months (or) minimum ` 500 & in multiples of ` 1 thereafter for minimum one yearQuarterly - Minimum ` 1500 & in multiples of ` 1 thereafter for minimum one year
10
Large Cap Midcap
Small Cap Cash & Other Current Assets
97.78
0 20 40 60 80 100 120
IT
77.16%
11.70%
8.92%2.22%
Investment Objective
To provide the investors maximum growth
opportunity through equity investments in
stocks of growth oriented sectors of the
economy. There are four sub-funds
dedicated to specific investment themes viz.
Information Technology, Pharmaceuticals,
FMCG, Contrarian (investment in stocks
currently out of favour) and Emerging
Businesses.
Date of Inception
14/07/1999
Entry Load
N.A.
Options
Growth
Dividend
Exit Load
For exit within 1 year from the date of allotment - 1 %;
For exit after 1 year from the date of allotment - Nil.
Quantitative Data
Standard Deviation
Beta
R-Squared
Sharpe Ratio
Portfolio Turnover
Total Expense Ratio
Regular
Direct
#
#
#
#
*
: 14.76%
: 0.85
: 0.88
: 1.03
: 0.62
: 2.08%
: 1.52%
Fund Manager
Mr. R. Srinivasan
Jun-2011
Managing Since
Total Experience
Over 20 years
Benchmark
S&P BSE 100 Index
#Source: CRISIL Fund Analyser*Portfolio Turnover = lower of total sale or total purchase for the last 12 months upon Avg. AUM of trailing twelve months.Risk Free rate: 91- days Treasury Bill yield (8.31% as on 31st December 2014) Basis for Ratio Calculation: 3 years Monthly Data
Option NAV (`)
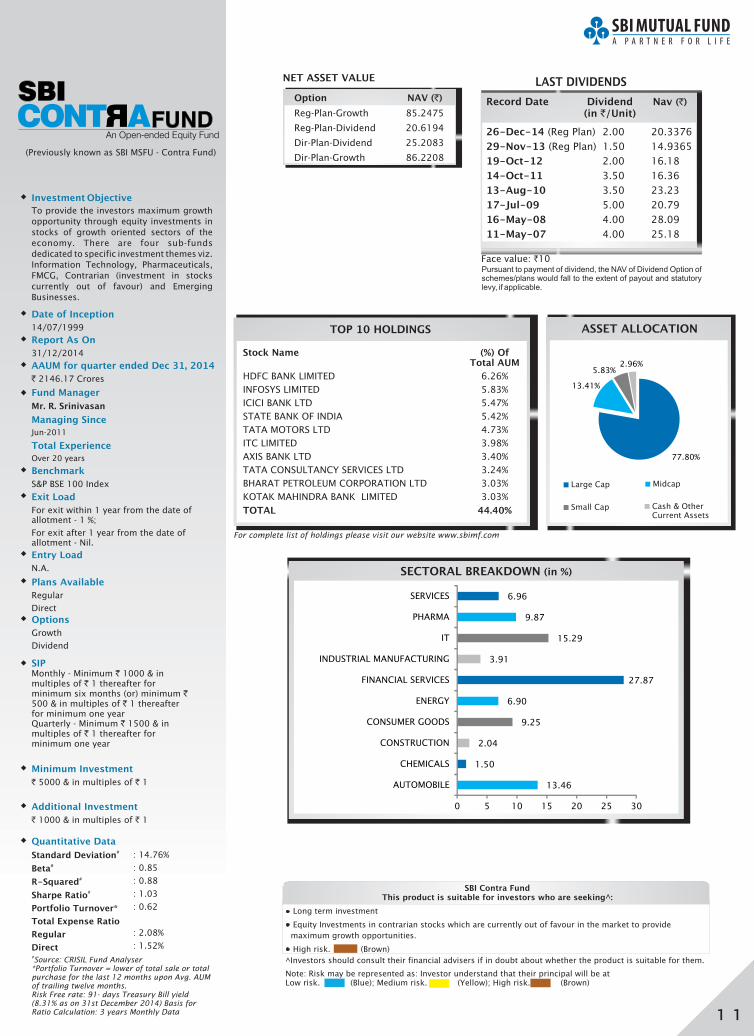
Reg-Plan-Growth 85.2475
Reg-Plan-Dividend 20.6194
Dir-Plan-Dividend 25.2083
Dir-Plan-Growth 86.2208
NET ASSET VALUE
Report As On
31/12/2014
TOP 10 HOLDINGS
For complete list of holdings please visit our website www.sbimf.com
Stock Name (%) OfTotal AUM
HDFC BANK LIMITED 6.26%
INFOSYS LIMITED 5.83%
ICICI BANK LTD 5.47%
STATE BANK OF INDIA 5.42%
TATA MOTORS LTD 4.73%
ITC LIMITED 3.98%
AXIS BANK LTD 3.40%
TATA CONSULTANCY SERVICES LTD 3.24%
BHARAT PETROLEUM CORPORATION LTD 3.03%
KOTAK MAHINDRA BANK LIMITED 3.03%
TOTAL 44.40%
ASSET ALLOCATION
Large Cap
Small Cap
Midcap
Cash & Other Current Assets
SECTORAL BREAKDOWN (in %)
AAUM for quarter ended Dec 31, 2014
` 2146.17 Crores
An Open-ended Equity Fund
Plans Available
Regular
Direct
(Previously known as SBI MSFU - Contra Fund)
Record Date Dividend Nav (`) (in `/Unit)
LAST DIVIDENDS
Face value: `10
SBI Contra FundThis product is suitable for investors who are seeking^:
• Long term investment
Equity Investments in contrarian stocks which are currently out of favour in the market to provide
maximum growth opportunities.
High risk. (Brown)
•
•
^Investors should consult their financial advisers if in doubt about whether the product is suitable for them.
Pursuant to payment of dividend, the NAV of Dividend Option of schemes/plans would fall to the extent of payout and statutory levy, if applicable.
Note: Risk may be represented as: Investor understand that their principal will be at Low risk. (Blue); Medium risk. (Yellow); High risk. (Brown)
Minimum Investment
` 5000 & in multiples of ` 1
Additional Investment
` 1000 & in multiples of ` 1
SIPMonthly - Minimum ` 1000 & in multiples of ` 1 thereafter for minimum six months (or) minimum ` 500 & in multiples of ` 1 thereafter for minimum one yearQuarterly - Minimum ` 1500 & in multiples of ` 1 thereafter for minimum one year
11
13.46
1.50
2.04
9.25
6.90
27.87
3.91
15.29
9.87
6.96
0 5 10 15 20 25 30
AUTOMOBILE
CHEMICALS
CONSTRUCTION
CONSUMER GOODS
ENERGY
FINANCIAL SERVICES
INDUSTRIAL MANUFACTURING
IT
PHARMA
SERVICES
26-Dec-14 (Reg Plan) 2.00 20.3376
29-Nov-13 (Reg Plan) 1.50 14.9365
19-Oct-12 2.00 16.18
14-Oct-11 3.50 16.36
13-Aug-10 3.50 23.23
17-Jul-09 5.00 20.79
16-May-08 4.00 28.09
11-May-07 4.00 25.18
77.80%
13.41%
5.83%2.96%
Investment Objective
To provide investors with opportunities for
long-term growth in capital along with the
liquidity of an open-ended scheme through
an active management of investments in a
diversified basket of equity stocks spanning
the entire market capitalization spectrum
and in debt and money market instruments.
Date of Inception
29/09/2005
Entry Load
N.A.
Options
Growth
Dividend
Exit Load
Nil (w.e.f. September 01, 2014)
Quantitative Data
Standard Deviation
Beta
R- Squared
Sharpe Ratio
Portfolio Turnover
Total Expense Ratio
Regular
Direct
#
#
#
#
*
: 15.43%
: 0.89
: 0.93
: 1.33
: 1.07
: 2.48%
: 1.95%
Fund Manager
Mr. Richard D'souza
Dec-2011
Over 19 years
Managing Since
Total Experience
Benchmark
S&P BSE 500 Index
#Source: CRISIL Fund Analyser*Portfolio Turnover = lower of total sale or total purchase for the last 12 months upon Avg. AUM of trailing twelve months.Risk Free rate: 91- days Treasury Bill yield (8.31% as on 31st December 2014) Basis for Ratio Calculation: 3 years Monthly Data
Report As On
31/12/2014
TOP 10 HOLDINGS
For complete list of holdings please visit our website www.sbimf.com
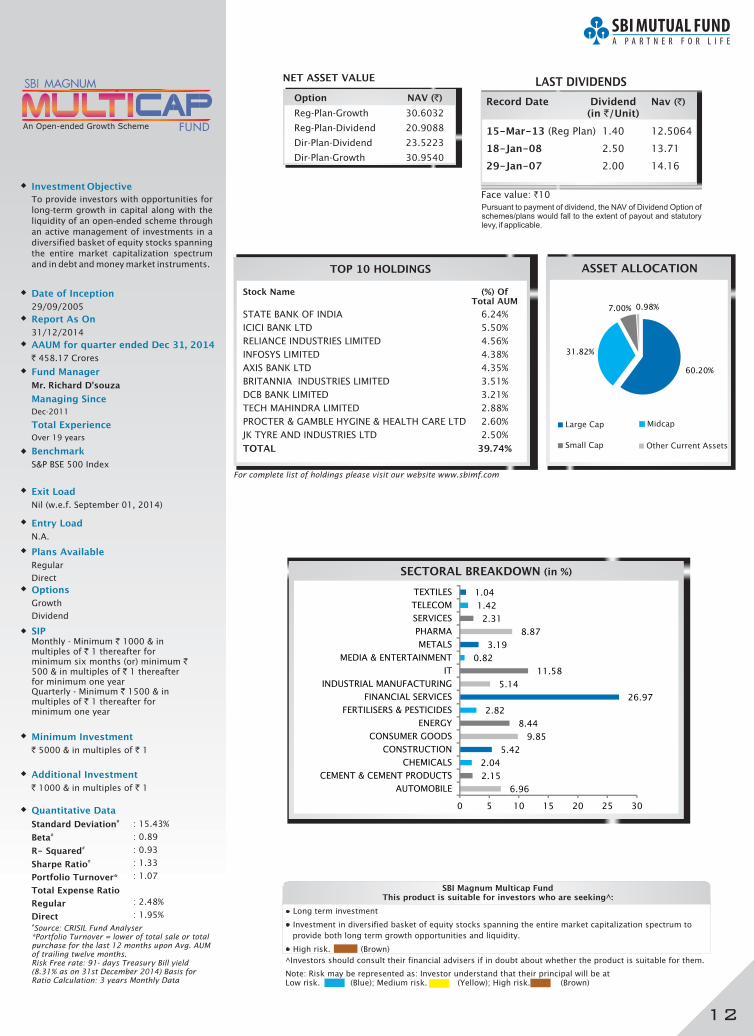
Stock Name (%) OfTotal AUM
STATE BANK OF INDIA 6.24%
ICICI BANK LTD 5.50%
RELIANCE INDUSTRIES LIMITED 4.56%
INFOSYS LIMITED 4.38%
AXIS BANK LTD 4.35%
BRITANNIA INDUSTRIES LIMITED 3.51%
DCB BANK LIMITED 3.21%
TECH MAHINDRA LIMITED 2.88%
PROCTER & GAMBLE HYGINE & HEALTH CARE LTD 2.60%
JK TYRE AND INDUSTRIES LTD 2.50%
TOTAL 39.74%
ASSET ALLOCATION
SECTORAL BREAKDOWN (in %)
AAUM for quarter ended Dec 31, 2014
` 458.17 Crores
Large Cap
Small Cap
Midcap
Other Current Assets
Plans Available
Regular
Direct
Option NAV (`)
Reg-Plan-Growth 30.6032
Reg-Plan-Dividend 20.9088
Dir-Plan-Dividend 23.5223
Dir-Plan-Growth 30.9540
NET ASSET VALUE
Record Date Dividend Nav (`) (in `/Unit)
15-Mar-13 (Reg Plan) 1.40 12.5064
18-Jan-08 2.50 13.71
29-Jan-07 2.00 14.16
LAST DIVIDENDS
Face value: `10
SBI Magnum Multicap FundThis product is suitable for investors who are seeking^:
• Long term investment
Investment in diversified basket of equity stocks spanning the entire market capitalization spectrum to
provide both long term growth opportunities and liquidity.
High risk. (Brown)
•
•
^Investors should consult their financial advisers if in doubt about whether the product is suitable for them.
Pursuant to payment of dividend, the NAV of Dividend Option of schemes/plans would fall to the extent of payout and statutory levy, if applicable.
Note: Risk may be represented as: Investor understand that their principal will be at Low risk. (Blue); Medium risk. (Yellow); High risk. (Brown)
Minimum Investment
` 5000 & in multiples of ` 1
Additional Investment
` 1000 & in multiples of ` 1
SIPMonthly - Minimum ` 1000 & in multiples of ` 1 thereafter for minimum six months (or) minimum ` 500 & in multiples of ` 1 thereafter for minimum one yearQuarterly - Minimum ` 1500 & in multiples of ` 1 thereafter for minimum one year
12
6.96
2.15
2.04
5.42
9.85
8.44
2.82
26.97
5.14
11.58
0.82
3.19
8.87
2.31
1.42
1.04
0 5 10 15 20 25 30
AUTOMOBILE
CEMENT & CEMENT PRODUCTS
CHEMICALS
CONSTRUCTION
CONSUMER GOODS
ENERGY
FERTILISERS & PESTICIDES
FINANCIAL SERVICES
INDUSTRIAL MANUFACTURING
IT
MEDIA & ENTERTAINMENT
METALS
PHARMA
SERVICES
TELECOM
TEXTILES
60.20%
31.82%
7.00% 0.98%
Investment Objective
To provide investors long term capital
appreciation/dividend along with the
liquidity of an open-ended scheme.
Date of Inception
28/02/1993
Entry Load
N.A.
Options
Growth
Dividend
Exit Load
For exit within 18 months from the date of allotment – 1.00%; For exit after 18 months from the date of allotment – Nil
(w.e.f November 01, 2014)
Quantitative Data
Standard Deviation
Beta
R- Squared
Sharpe Ratio
Portfolio Turnover
Total Expense Ratio:
Regular
Direct
#
#
#
#
*
: 14.36%
: 0.83
: 0.90
: 1.31
: 0.66
: 2.17%
: 1.75%
Fund Manager
Mr. Jayesh Shroff
Jun-2007
Managing Since
Total Experience
Over 10 years
Benchmark
S&P BSE 200 Index
#Source: CRISIL Fund Analyser*Portfolio Turnover = lower of total sale or total purchase for the last 12 months upon Avg. AUM of trailing twelve months.Risk Free rate: 91- days Treasury Bill yield (8.31% as on 31st December 2014) Basis for Ratio Calculation: 3 years Monthly Data
Report As On
31/12/2014
TOP 10 HOLDINGS
For complete list of holdings please visit our website www.sbimf.com
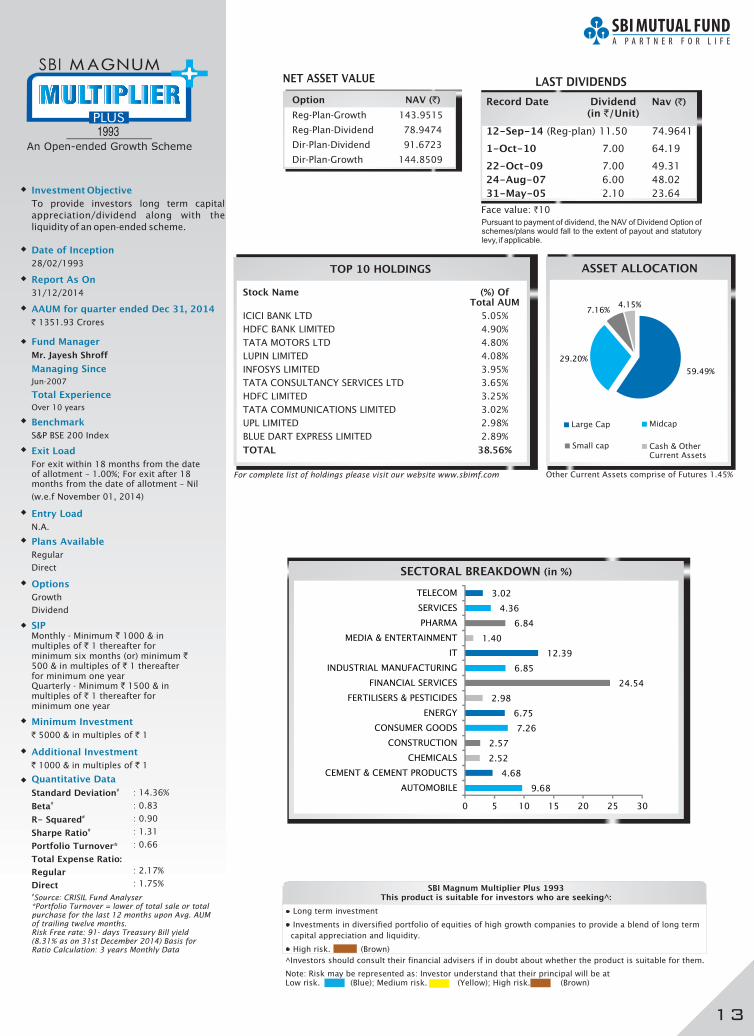
Stock Name (%) OfTotal AUM
ICICI BANK LTD 5.05%
HDFC BANK LIMITED 4.90%
TATA MOTORS LTD 4.80%
LUPIN LIMITED 4.08%
INFOSYS LIMITED 3.95%
TATA CONSULTANCY SERVICES LTD 3.65%
HDFC LIMITED 3.25%
TATA COMMUNICATIONS LIMITED 3.02%
UPL LIMITED 2.98%
BLUE DART EXPRESS LIMITED 2.89%
TOTAL 38.56%
ASSET ALLOCATION
Large Cap Midcap
Small cap Cash & Other Current Assets
SECTORAL BREAKDOWN (in %)
AAUM for quarter ended Dec 31, 2014
` 1351.93 Crores
Plans Available
Regular
Direct
Option NAV (`)
Reg-Plan-Growth 143.9515
Reg-Plan-Dividend 78.9474
Dir-Plan-Dividend 91.6723
Dir-Plan-Growth 144.8509
NET ASSET VALUE
Record Date Dividend Nav (`) (in `/Unit)
12-Sep-14 (Reg-plan) 11.50 74.9641
1-Oct-10 7.00 64.19
22-Oct-09 7.00 49.31
24-Aug-07 6.00 48.02
31-May-05 2.10 23.64
LAST DIVIDENDS
Face value: `10
SBI Magnum Multiplier Plus 1993This product is suitable for investors who are seeking^:
• Long term investment
Investments in diversified portfolio of equities of high growth companies to provide a blend of long term
capital appreciation and liquidity.
High risk. (Brown)
•
•
^Investors should consult their financial advisers if in doubt about whether the product is suitable for them.
Pursuant to payment of dividend, the NAV of Dividend Option of schemes/plans would fall to the extent of payout and statutory levy, if applicable.
Note: Risk may be represented as: Investor understand that their principal will be at Low risk. (Blue); Medium risk. (Yellow); High risk. (Brown)
Minimum Investment
` 5000 & in multiples of ` 1
Additional Investment
` 1000 & in multiples of ` 1
SIPMonthly - Minimum ` 1000 & in multiples of ` 1 thereafter for minimum six months (or) minimum ` 500 & in multiples of ` 1 thereafter for minimum one yearQuarterly - Minimum ` 1500 & in multiples of ` 1 thereafter for minimum one year
13
Other Current Assets comprise of Futures 1.45%
9.68
4.68
2.52
2.57
7.26
6.75
2.98
24.54
6.85
12.39
1.40
6.84
4.36
3.02
0 5 10 15 20 25 30
AUTOMOBILE
CEMENT & CEMENT PRODUCTS
CHEMICALS
CONSTRUCTION
CONSUMER GOODS
ENERGY
FERTILISERS & PESTICIDES
FINANCIAL SERVICES
INDUSTRIAL MANUFACTURING
IT
MEDIA & ENTERTAINMENT
PHARMA
SERVICES
TELECOM
59.49%
29.20%
7.16%4.15%
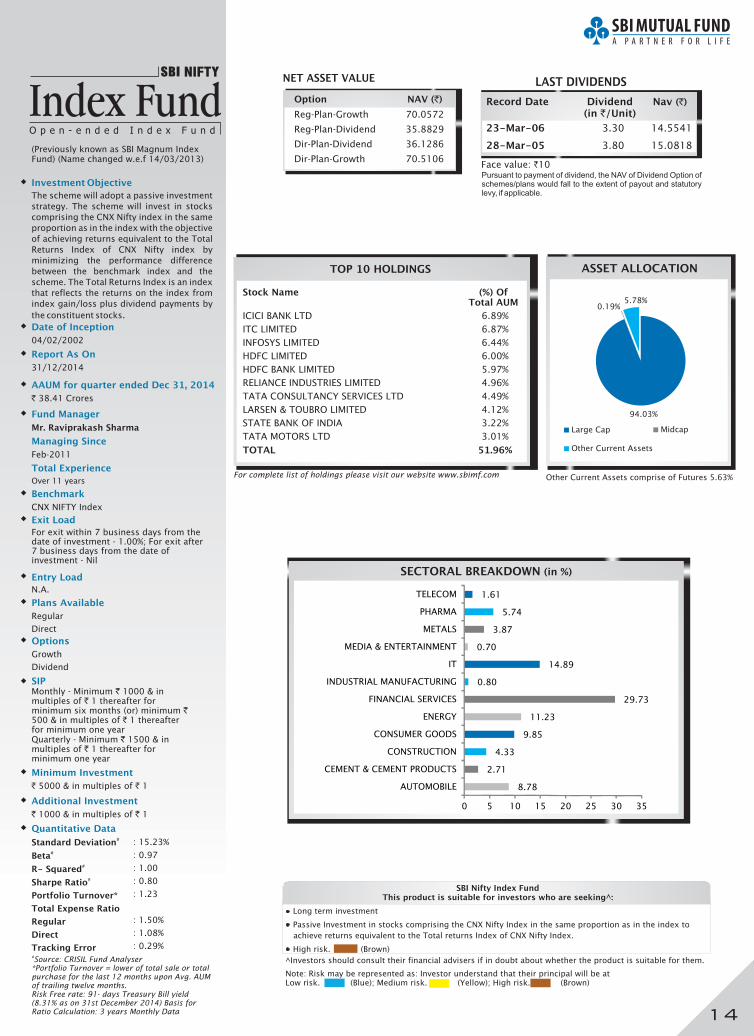
Date of Inception
04/02/2002
Investment Objective
The scheme will adopt a passive investment
strategy. The scheme will invest in stocks
comprising the CNX Nifty index in the same
proportion as in the index with the objective
of achieving returns equivalent to the Total
Returns Index of CNX Nifty index by
minimizing the performance difference
between the benchmark index and the
scheme. The Total Returns Index is an index
that reflects the returns on the index from
index gain/loss plus dividend payments by
the constituent stocks.
Entry Load
N.A.
Options
Growth
Dividend
Exit Load
For exit within 7 business days from the date of investment - 1.00%; For exit after 7 business days from the date of investment - Nil
Quantitative Data
Standard Deviation
Beta
R- Squared
Sharpe Ratio
Portfolio Turnover
Total Expense Ratio
Regular
Direct
Tracking Error
#
#
#
#
*
: 15.23%
: 0.97
: 1.00
: 0.80
: 1.23
: 1.50%
: 1.08%
: 0.29%
Fund Manager
Mr. Raviprakash Sharma
Feb-2011
Managing Since
Total Experience
Over 11 years
Benchmark
CNX NIFTY Index
#Source: CRISIL Fund Analyser*Portfolio Turnover = lower of total sale or total purchase for the last 12 months upon Avg. AUM of trailing twelve months.Risk Free rate: 91- days Treasury Bill yield (8.31% as on 31st December 2014) Basis for Ratio Calculation: 3 years Monthly Data
Report As On
31/12/2014
TOP 10 HOLDINGS
For complete list of holdings please visit our website www.sbimf.com
Stock Name (%) OfTotal AUM
ICICI BANK LTD 6.89%
ITC LIMITED 6.87%
INFOSYS LIMITED 6.44%
HDFC LIMITED 6.00%
HDFC BANK LIMITED 5.97%
RELIANCE INDUSTRIES LIMITED 4.96%
TATA CONSULTANCY SERVICES LTD 4.49%
LARSEN & TOUBRO LIMITED 4.12%
STATE BANK OF INDIA 3.22%
TATA MOTORS LTD 3.01%
TOTAL 51.96%
ASSET ALLOCATION
SECTORAL BREAKDOWN (in %)
AAUM for quarter ended 2014Dec 31,
` 38.41 Crores
Plans Available
Regular
Direct
(Previously known as SBI Magnum In Fund) (Name changed w.e.f 14/03/2013)
dex
Option NAV (`)
Reg-Plan-Growth 70.0572
Reg-Plan-Dividend 35.8829
Dir-Plan-Dividend 36.1286
Dir-Plan-Growth 70.5106
NET ASSET VALUE
Other Current Assets comprise of Futures 5.63%
Record Date Dividend Nav (`) (in `/Unit)
23-Mar-06 3.30 14.5541
28-Mar-05 3.80 15.0818
LAST DIVIDENDS
Face value: `10
SBI Nifty Index FundThis product is suitable for investors who are seeking^:
• Long term investment
Passive Investment in stocks comprising the CNX Nifty Index in the same proportion as in the index to
achieve returns equivalent to the Total returns Index of CNX Nifty Index.
High risk. (Brown)
•
•
^Investors should consult their financial advisers if in doubt about whether the product is suitable for them.
Pursuant to payment of dividend, the NAV of Dividend Option of schemes/plans would fall to the extent of payout and statutory levy, if applicable.
Note: Risk may be represented as: Investor understand that their principal will be at Low risk. (Blue); Medium risk. (Yellow); High risk. (Brown)
Minimum Investment
` 5000 & in multiples of ` 1
Additional Investment
` 1000 & in multiples of ` 1
SIPMonthly - Minimum ` 1000 & in multiples of ` 1 thereafter for minimum six months (or) minimum ` 500 & in multiples of ` 1 thereafter for minimum one yearQuarterly - Minimum ` 1500 & in multiples of ` 1 thereafter for minimum one year
14
Other Current Assets
Large Cap Midcap
8.78
2.71
4.33
9.85
11.23
29.73
0.80
14.89
0.70
3.87
5.74
1.61
0 5 10 15 20 25 30 35
AUTOMOBILE
CEMENT & CEMENT PRODUCTS
CONSTRUCTION
CONSUMER GOODS
ENERGY
FINANCIAL SERVICES
INDUSTRIAL MANUFACTURING
IT
MEDIA & ENTERTAINMENT
METALS
PHARMA
TELECOM
94.03%
0.19%5.78%
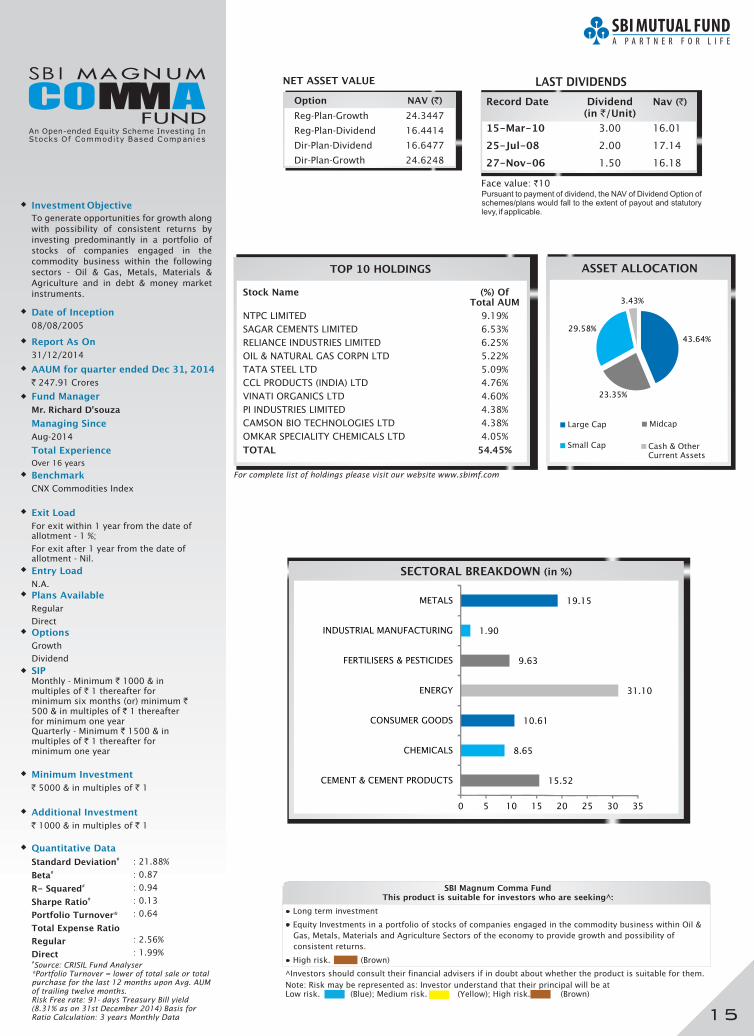
Investment Objective
To generate opportunities for growth along
with possibility of consistent returns by
investing predominantly in a portfolio of
stocks of companies engaged in the
commodity business within the following
sectors - Oil & Gas, Metals, Materials &
Agriculture and in debt & money market
instruments.
Date of Inception
08/08/2005
Entry Load
N.A.
Options
Growth
Dividend
Exit Load
For exit within 1 year from the date of allotment - 1 %;
For exit after 1 year from the date of allotment - Nil.
Quantitative Data
Standard Deviation
Beta
R- Squared
Sharpe Ratio
Portfolio Turnover
Total Expense Ratio
Regular
Direct
#
#
#
#
*
: 21.88%
: 0.87
: 0.94
: 0.13
: 0.64
: 2.56%
: 1.99%
Fund Manager
Mr. Richard D'souza
Managing Since
Total Experience
Aug-2014
Over 16 years
Benchmark
CNX Commodities Index
#Source: CRISIL Fund Analyser*Portfolio Turnover = lower of total sale or total purchase for the last 12 months upon Avg. AUM of trailing twelve months.Risk Free rate: 91- days Treasury Bill yield (8.31% as on 31st December 2014) Basis for Ratio Calculation: 3 years Monthly Data
Report As On
31/12/2014
TOP 10 HOLDINGS
For complete list of holdings please visit our website www.sbimf.com
Stock Name (%) OfTotal AUM
NTPC LIMITED 9.19%
SAGAR CEMENTS LIMITED 6.53%
RELIANCE INDUSTRIES LIMITED 6.25%
OIL & NATURAL GAS CORPN LTD 5.22%
TATA STEEL LTD 5.09%
CCL PRODUCTS (INDIA) LTD 4.76%
VINATI ORGANICS LTD 4.60%
PI INDUSTRIES LIMITED 4.38%
CAMSON BIO TECHNOLOGIES LTD 4.38%
OMKAR SPECIALITY CHEMICALS LTD 4.05%
TOTAL 54.45%
ASSET ALLOCATION
AAUM for quarter ended 2014Dec 31,
` 247.91 Crores
Plans Available
Regular
Direct
Option NAV (`)
Reg-Plan-Growth 24.3447
Reg-Plan-Dividend 16.4414
Dir-Plan-Dividend 16.6477
Dir-Plan-Growth 24.6248
NET ASSET VALUE
SECTORAL BREAKDOWN (in %)
Record Date Dividend Nav (`) (in `/Unit)
15-Mar-10 3.00 16.01
25-Jul-08 2.00 17.14
27-Nov-06 1.50 16.18
LAST DIVIDENDS
Face value: `10
Large Cap
Small Cap
Midcap
Cash & Other Current Assets
SBI Magnum Comma Fund
•
•
This product is suitable for investors who are seeking^:
• Long term investment
Equity Investments in a portfolio of stocks of companies engaged in the commodity business within Oil &
Gas, Metals, Materials and Agriculture Sectors of the economy to provide growth and possibility of
consistent returns.
High risk. (Brown)
^Investors should consult their financial advisers if in doubt about whether the product is suitable for them.
Pursuant to payment of dividend, the NAV of Dividend Option of schemes/plans would fall to the extent of payout and statutory levy, if applicable.
Note: Risk may be represented as: Investor understand that their principal will be at Low risk. (Blue); Medium risk. (Yellow); High risk. (Brown)
Minimum Investment
` 5000 & in multiples of ` 1
Additional Investment
` 1000 & in multiples of ` 1
SIPMonthly - Minimum ` 1000 & in multiples of ` 1 thereafter for minimum six months (or) minimum ` 500 & in multiples of ` 1 thereafter for minimum one yearQuarterly - Minimum ` 1500 & in multiples of ` 1 thereafter for minimum one year
15
15.52
8.65
10.61
31.10
9.63
1.90
19.15
0 5 10 15 20 25 30 35
CEMENT & CEMENT PRODUCTS
CHEMICALS
CONSUMER GOODS
ENERGY
FERTILISERS & PESTICIDES
INDUSTRIAL MANUFACTURING
METALS
43.64%
23.35%
29.58%
3.43%
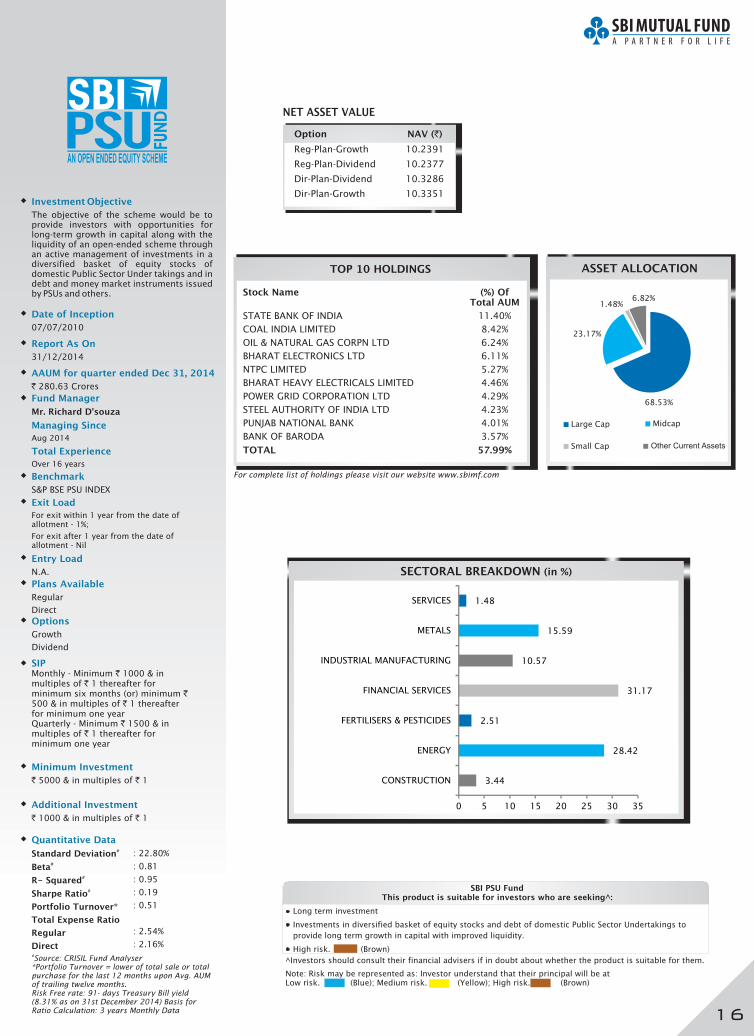
Investment Objective
The objective of the scheme would be to provide investors with opportunities for long-term growth in capital along with the liquidity of an open-ended scheme through an active management of investments in a diversified basket of equity stocks of domestic Public Sector Under takings and in debt and money market instruments issued by PSUs and others.
Date of Inception
07/07/2010
Entry Load
N.A.
Options
Growth
Dividend
Exit Load
For exit within 1 year from the date of allotment - 1%;
For exit after 1 year from the date of allotment - Nil
Quantitative Data
Standard Deviation
Beta
R- Squared
Sharpe Ratio
Portfolio Turnover
Total Expense Ratio
Regular
Direct
#
#
#
#
*
: 22.80%
: 0.81
: 0.95
: 0.19
: 0.51
: 2.54%
: 2.16%
Fund Manager
Mr. Richard D'souza
Managing Since
Total Experience
Aug 2014
Over 16 years
Benchmark
S&P BSE PSU INDEX
#Source: CRISIL Fund Analyser*Portfolio Turnover = lower of total sale or total purchase for the last 12 months upon Avg. AUM of trailing twelve months.Risk Free rate: 91- days Treasury Bill yield (8.31% as on 31st December 2014) Basis for Ratio Calculation: 3 years Monthly Data
Report As On
31/12/2014
SECTORAL BREAKDOWN (in %)
TOP 10 HOLDINGS
For complete list of holdings please visit our website www.sbimf.com
Stock Name (%) OfTotal AUM
STATE BANK OF INDIA 11.40%
COAL INDIA LIMITED 8.42%
OIL & NATURAL GAS CORPN LTD 6.24%
BHARAT ELECTRONICS LTD 6.11%
NTPC LIMITED 5.27%
BHARAT HEAVY ELECTRICALS LIMITED 4.46%
POWER GRID CORPORATION LTD 4.29%
STEEL AUTHORITY OF INDIA LTD 4.23%
PUNJAB NATIONAL BANK 4.01%
BANK OF BARODA 3.57%
TOTAL 57.99%
ASSET ALLOCATION
AAUM for quarter ended 2014Dec 31,
` 280.63 Crores
Large Cap Midcap
Small Cap
Plans Available
Regular
Direct
Option NAV (`)
Reg-Plan-Growth 10.2391
Reg-Plan-Dividend 10.2377
Dir-Plan-Dividend 10.3286
Dir-Plan-Growth 10.3351
NET ASSET VALUE
SBI PSU FundThis product is suitable for investors who are seeking^:
• Long term investment
Investments in diversified basket of equity stocks and debt of domestic Public Sector Undertakings to
provide long term growth in capital with improved liquidity.
High risk. (Brown)
•
•
^Investors should consult their financial advisers if in doubt about whether the product is suitable for them.
Note: Risk may be represented as: Investor understand that their principal will be at Low risk. (Blue); Medium risk. (Yellow); High risk. (Brown)
Minimum Investment
` 5000 & in multiples of ` 1
SIPMonthly - Minimum ` 1000 & in multiples of ` 1 thereafter for minimum six months (or) minimum ` 500 & in multiples of ` 1 thereafter for minimum one yearQuarterly - Minimum ` 1500 & in multiples of ` 1 thereafter for minimum one year
Additional Investment
` 1000 & in multiples of ` 1
16
3.44
28.42
2.51
31.17
10.57
15.59
1.48
0 5 10 15 20 25 30 35
CONSTRUCTION
ENERGY
FERTILISERS & PESTICIDES
FINANCIAL SERVICES
INDUSTRIAL MANUFACTURING
METALS
SERVICES
68.53%
23.17%
1.48%6.82%
Other Current Assets
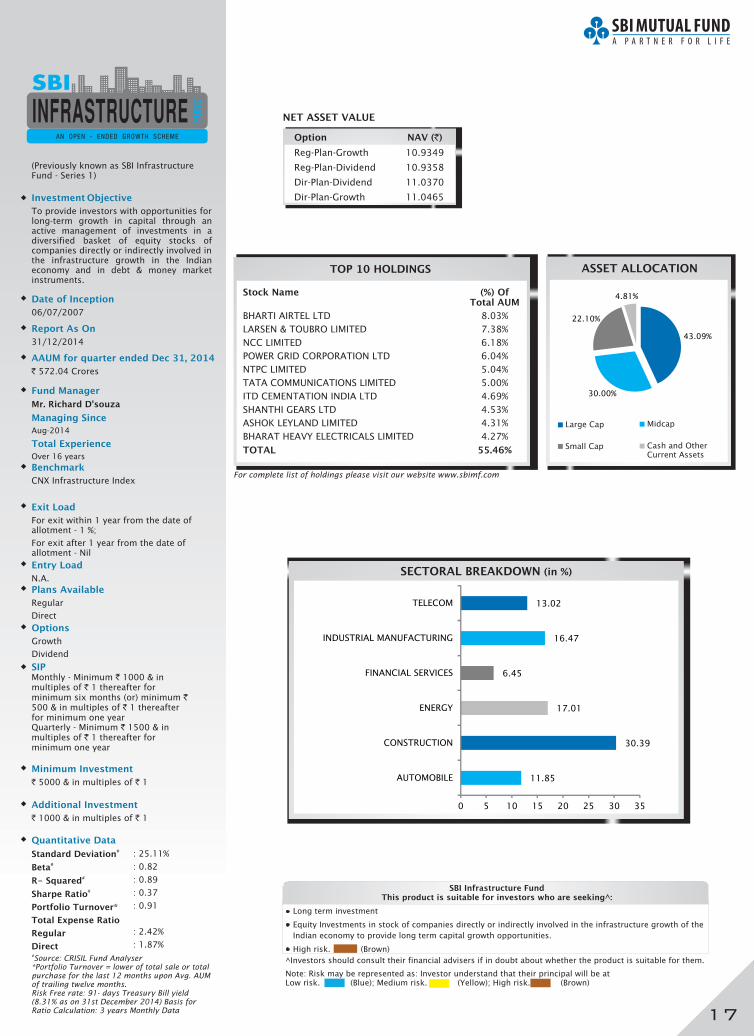
Investment Objective
To provide investors with opportunities for long-term growth in capital through an active management of investments in a diversified basket of equity stocks of companies directly or indirectly involved in the infrastructure growth in the Indian economy and in debt & money market instruments.
Date of Inception
06/07/2007
Fund Manager
Mr. Richard D'souza
Managing Since
Total Experience
Aug-2014
Over 16 years
Benchmark
CNX Infrastructure Index
Entry Load
N.A.
Options
Growth
Dividend
Exit Load
For exit within 1 year from the date of allotment - 1 %;
For exit after 1 year from the date of allotment - Nil
Quantitative Data
Standard Deviation
Beta
R- Squared
Sharpe Ratio
Portfolio Turnover
Total Expense Ratio
Regular
Direct
#
#
#
#
*
: 25.11%
: 0.82
: 0.89
: 0.37
: 0.91
: 2.42%
: 1.87%#Source: CRISIL Fund Analyser*Portfolio Turnover = lower of total sale or total purchase for the last 12 months upon Avg. AUM of trailing twelve months.Risk Free rate: 91- days Treasury Bill yield (8.31% as on 31st December 2014) Basis for Ratio Calculation: 3 years Monthly Data
Report As On
31/12/2014
TOP 10 HOLDINGS
For complete list of holdings please visit our website www.sbimf.com
Stock Name (%) OfTotal AUM
BHARTI AIRTEL LTD 8.03%
LARSEN & TOUBRO LIMITED 7.38%
NCC LIMITED 6.18%
POWER GRID CORPORATION LTD 6.04%
NTPC LIMITED 5.04%
TATA COMMUNICATIONS LIMITED 5.00%
ITD CEMENTATION INDIA LTD 4.69%
SHANTHI GEARS LTD 4.53%
ASHOK LEYLAND LIMITED 4.31%
BHARAT HEAVY ELECTRICALS LIMITED 4.27%
TOTAL 55.46%
ASSET ALLOCATION
Large Cap Midcap
Cash and Other Current Assets
Small Cap
SECTORAL BREAKDOWN (in %)
AAUM for quarter ended 2014Dec 31,
` 572.04 Crores
AN OPEN - ENDED GROWTH SCHEME
Plans Available
Regular
Direct
(Previously known as SBI InfrastructureFund - Series 1)
Option NAV (`)
Reg-Plan-Growth 10.9349
Reg-Plan-Dividend 10.9358
Dir-Plan-Dividend 11.0370
Dir-Plan-Growth 11.0465
NET ASSET VALUE
SBI Infrastructure FundThis product is suitable for investors who are seeking^:
• Long term investment
Equity Investments in stock of companies directly or indirectly involved in the infrastructure growth of the
Indian economy to provide long term capital growth opportunities.
High risk. (Brown)
•
•
^Investors should consult their financial advisers if in doubt about whether the product is suitable for them.
Note: Risk may be represented as: Investor understand that their principal will be at Low risk. (Blue); Medium risk. (Yellow); High risk. (Brown)
Minimum Investment
` 5000 & in multiples of ` 1
SIPMonthly - Minimum ` 1000 & in multiples of ` 1 thereafter for minimum six months (or) minimum ` 500 & in multiples of ` 1 thereafter for minimum one yearQuarterly - Minimum ` 1500 & in multiples of ` 1 thereafter for minimum one year
Additional Investment
` 1000 & in multiples of ` 1
17
11.85
30.39
17.01
6.45
16.47
13.02
0 5 10 15 20 25 30 35
AUTOMOBILE
CONSTRUCTION
ENERGY
FINANCIAL SERVICES
INDUSTRIAL MANUFACTURING
TELECOM
43.09%
30.00%
22.10%
4.81%
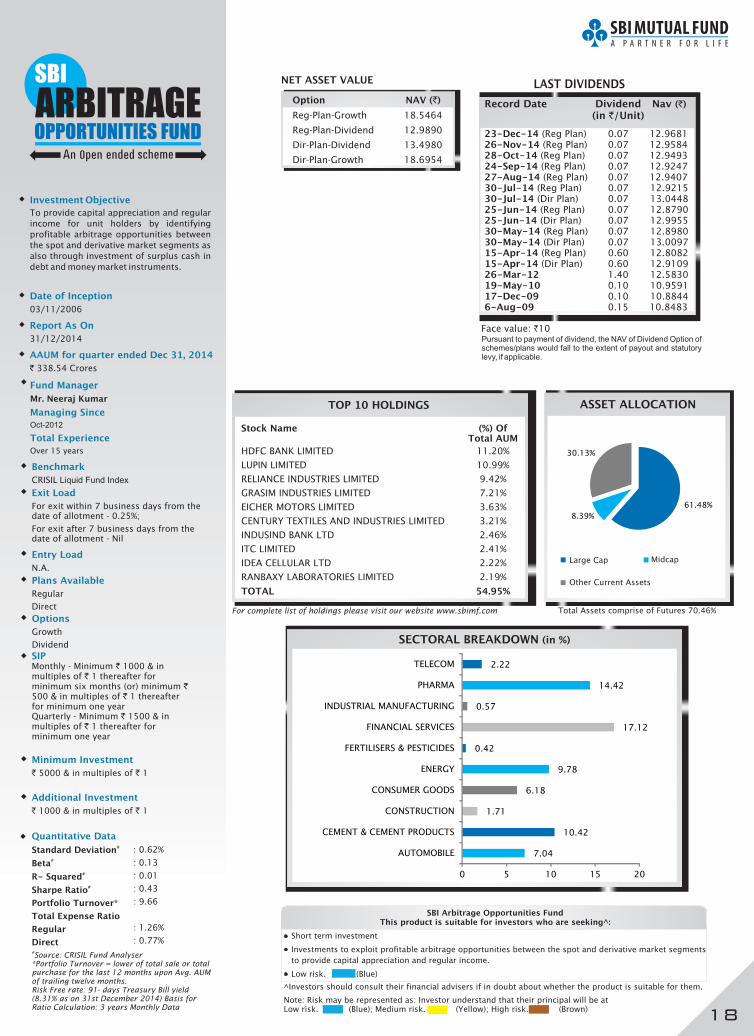
Investment Objective
To provide capital appreciation and regular
income for unit holders by identifying
profitable arbitrage opportunities between
the spot and derivative market segments as
also through investment of surplus cash in
debt and money market instruments.
Date of Inception
03/11/2006
Entry Load
N.A.
Options
Growth
Dividend
Exit Load
For exit within 7 business days from the date of allotment - 0.25%;
For exit after 7 business days from the date of allotment - Nil
Fund Manager
Mr. Neeraj Kumar
Oct-2012
Managing Since
Total Experience
Over 15 years
Benchmark
CRISIL Liquid Fund Index
Quantitative Data
Standard Deviation
Beta
R- Squared
Sharpe Ratio
Portfolio Turnover
Total Expense Ratio
Regular
Direct
#
#
#
#
*
: 0.62%
: 0.13
: 0.01
: 0.43
: 9.66
: 1.26%
: 0.77%#Source: CRISIL Fund Analyser*Portfolio Turnover = lower of total sale or total purchase for the last 12 months upon Avg. AUM of trailing twelve months.Risk Free rate: 91- days Treasury Bill yield (8.31% as on 31st December 2014) Basis for Ratio Calculation: 3 years Monthly Data
Report As On
31/12/2014
SECTORAL BREAKDOWN (in %)
TOP 10 HOLDINGS
For complete list of holdings please visit our website www.sbimf.com
Stock Name (%) OfTotal AUM
HDFC BANK LIMITED 11.20%
LUPIN LIMITED 10.99%
RELIANCE INDUSTRIES LIMITED 9.42%
GRASIM INDUSTRIES LIMITED 7.21%
EICHER MOTORS LIMITED 3.63%
CENTURY TEXTILES AND INDUSTRIES LIMITED 3.21%
INDUSIND BANK LTD 2.46%
ITC LIMITED 2.41%
IDEA CELLULAR LTD 2.22%
RANBAXY LABORATORIES LIMITED 2.19%
TOTAL 54.95%
ASSET ALLOCATION
AAUM for quarter ended 2014Dec 31,
` 338.54 Crores
Plans Available
Regular
Direct
Option NAV (`)
Reg-Plan-Growth 18.5464
Reg-Plan-Dividend 12.9890
Dir-Plan-Dividend 13.4980
Dir-Plan-Growth 18.6954
NET ASSET VALUE
Total Assets comprise of Futures 70.46%
Record Date Dividend Nav (`)
(in `/Unit)
LAST DIVIDENDS
Other Current Assets
SBI Arbitrage Opportunities FundThis product is suitable for investors who are seeking^:
• Short term investment
Investments to exploit profitable arbitrage opportunities between the spot and derivative market segments
to provide capital appreciation and regular income.
Low risk. (Blue)
•
•
^Investors should consult their financial advisers if in doubt about whether the product is suitable for them.
Large Cap Midcap
Note: Risk may be represented as: Investor understand that their principal will be at Low risk. (Blue); Medium risk. (Yellow); High risk. (Brown)
Minimum Investment
` 5000 & in multiples of ` 1
Additional Investment
` 1000 & in multiples of ` 1
SIPMonthly - Minimum ` 1000 & in multiples of ` 1 thereafter for minimum six months (or) minimum ` 500 & in multiples of ` 1 thereafter for minimum one yearQuarterly - Minimum ` 1500 & in multiples of ` 1 thereafter for minimum one year
18
Face value: `10Pursuant to payment of dividend, the NAV of Dividend Option of schemes/plans would fall to the extent of payout and statutory levy, if applicable.
23-Dec-14 (Reg Plan) 0.07 12.968126-Nov-14 (Reg Plan) 0.07 12.958428-Oct-14 (Reg Plan) 0.07 12.949324-Sep-14 (Reg Plan) 0.07 12.924727-Aug-14 (Reg Plan) 0.07 12.940730-Jul-14 (Reg Plan) 0.07 12.921530-Jul-14 (Dir Plan) 0.07 13.044825-Jun-14 (Reg Plan) 0.07 12.879025-Jun-14 (Dir Plan) 0.07 12.995530-May-14 (Reg Plan) 0.07 12.898030-May-14 (Dir Plan) 0.07 13.009715-Apr-14 (Reg Plan) 0.60 12.808215-Apr-14 (Dir Plan) 0.60 12.910926-Mar-12 1.40 12.583019-May-10 0.10 10.959117-Dec-09 0.10 10.88446-Aug-09 0.15 10.8483
7.04
10.42
1.71
6.18
9.78
0.42
17.12
0.57
14.42
2.22
0 5 10 15 20
AUTOMOBILE
CEMENT & CEMENT PRODUCTS
CONSTRUCTION
CONSUMER GOODS
ENERGY
FERTILISERS & PESTICIDES
FINANCIAL SERVICES
INDUSTRIAL MANUFACTURING
PHARMA
TELECOM
61.48%
8.39%
30.13%
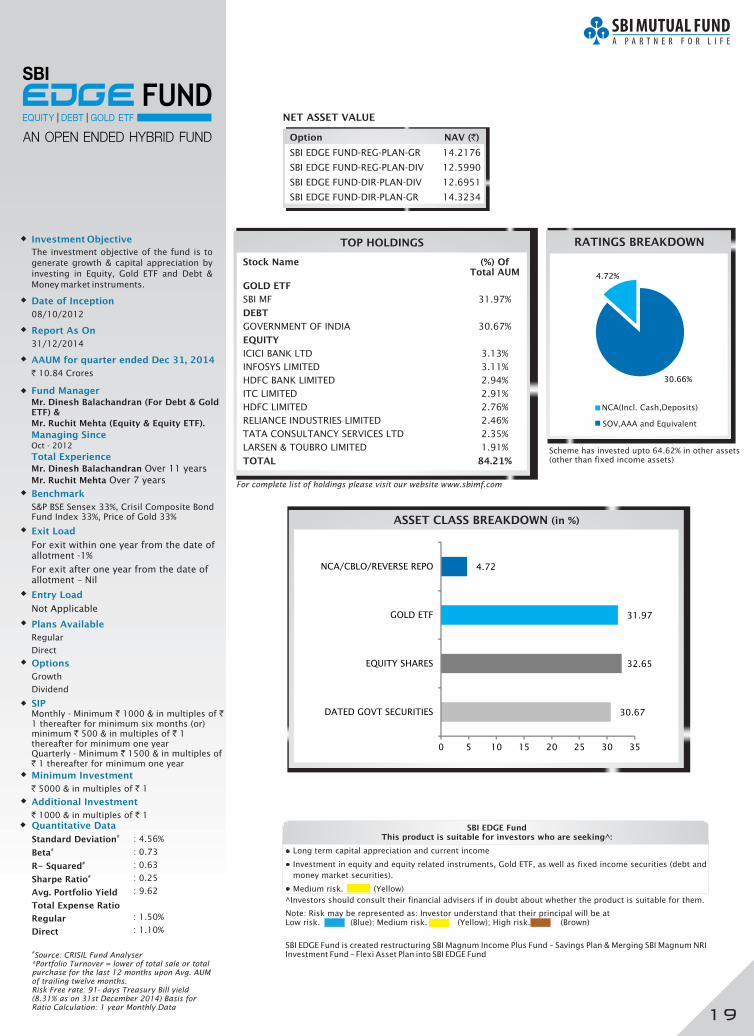
Investment Objective
The investment objective of the fund is to
generate growth & capital appreciation by
investing in Equity, Gold ETF and Debt &
Money market instruments.
Date of Inception
08/10/2012
Entry Load
Not Applicable
Exit Load
For exit within one year from the date of allotment -1%
For exit after one year from the date of allotment – Nil
Fund ManagerMr. Dinesh Balachandran (For Debt & Gold ETF) &
Mr. Ruchit Mehta (Equity & Equity ETF).
Mr. Dinesh Balachandran Over 11 years
Mr. Ruchit Mehta Over 7 years
Managing Since
Total ExperienceOct - 2012
Benchmark
S&P BSE Sensex 33%, Crisil Bond Fund Index 33%, Price of Gold 33%
Composite
Option
SBI EDGE FUND-REG-PLAN-GR 14.2176
SBI EDGE FUND-REG-PLAN-DIV 12.5990
SBI EDGE FUND-DIR-PLAN-DIV 12.6951
SBI EDGE FUND-DIR-PLAN-GR 14.3234
NAV (`)
NET ASSET VALUE
Report As On
31/12/2014
TOP HOLDINGS
For complete list of holdings please visit our website www.sbimf.com
Stock Name (%) OfTotal AUM
GOLD ETF
SBI MF 31.97%
DEBT
GOVERNMENT OF INDIA 30.67%
EQUITY
ICICI BANK LTD 3.13%
INFOSYS LIMITED 3.11%
HDFC BANK LIMITED 2.94%
ITC LIMITED 2.91%
HDFC LIMITED 2.76%
RELIANCE INDUSTRIES LIMITED 2.46%
TATA CONSULTANCY SERVICES LTD 2.35%
LARSEN & TOUBRO LIMITED 1.91%
TOTAL 84.21%
RATINGS BREAKDOWN
AAUM for quarter ended , 2014Dec 31
` 10.84 Crores
Plans Available
Regular
Direct
Options
Growth
Dividend
NCA(Incl. Cash,Deposits)
ASSET CLASS BREAKDOWN (in %)
SBI EDGE FundThis product is suitable for investors who are seeking^:
• Long term capital appreciation and current income
nvestment in equity and equity related instruments, Gold ETF, as well as fixed income securities (debt and
money market securities).
edium risk.
• I
• M (Yellow)
^Investors should consult their financial advisers if in doubt about whether the product is suitable for them.
Note: Risk may be represented as: Investor understand that their principal will be at Low risk. (Blue); Medium risk. (Yellow); High risk. (Brown)
Minimum Investment
` 5000 & in multiples of ` 1
Additional Investment
` 1000 & in multiples of ` 1
SIPMonthly - Minimum ` 1000 & in multiples of ` 1 thereafter for minimum six months (or) minimum ` 500 & in multiples of ` 1 thereafter for minimum one yearQuarterly - Minimum ` 1500 & in multiples of ` 1 thereafter for minimum one year
SBI EDGE Fund is created restructuring SBI Magnum Income Plus Fund – Savings Plan & Merging SBI Magnum NRI Investment Fund – Flexi Asset Plan into SBI EDGE Fund
19
SOV,AAA and Equivalent
Scheme has invested upto 64.62% in other assets(other than fixed income assets)
Quantitative Data
Standard Deviation
Beta
R- Squared
Sharpe Ratio
Total Expense Ratio
Regular
Direct
#
#
#
#
Avg. Portfolio Yield
: 4.56%
: 0.73
: 0.63
: 0.25
: 9.62
: 1.50%
: 1.10%
#Source: CRISIL Fund Analyser*Portfolio Turnover = lower of total sale or total purchase for the last 12 months upon Avg. AUM of trailing twelve months.Risk Free rate: 91- days Treasury Bill yield (8.31% as on 31st December 2014) Basis for Ratio Calculation: 1 year Monthly Data
30.66%
4.72%
30.67
32.65
31.97
4.72
0 5 10 15 20 25 30 35
DATED GOVT SECURITIES
EQUITY SHARES
GOLD ETF
NCA/CBLO/REVERSE REPO
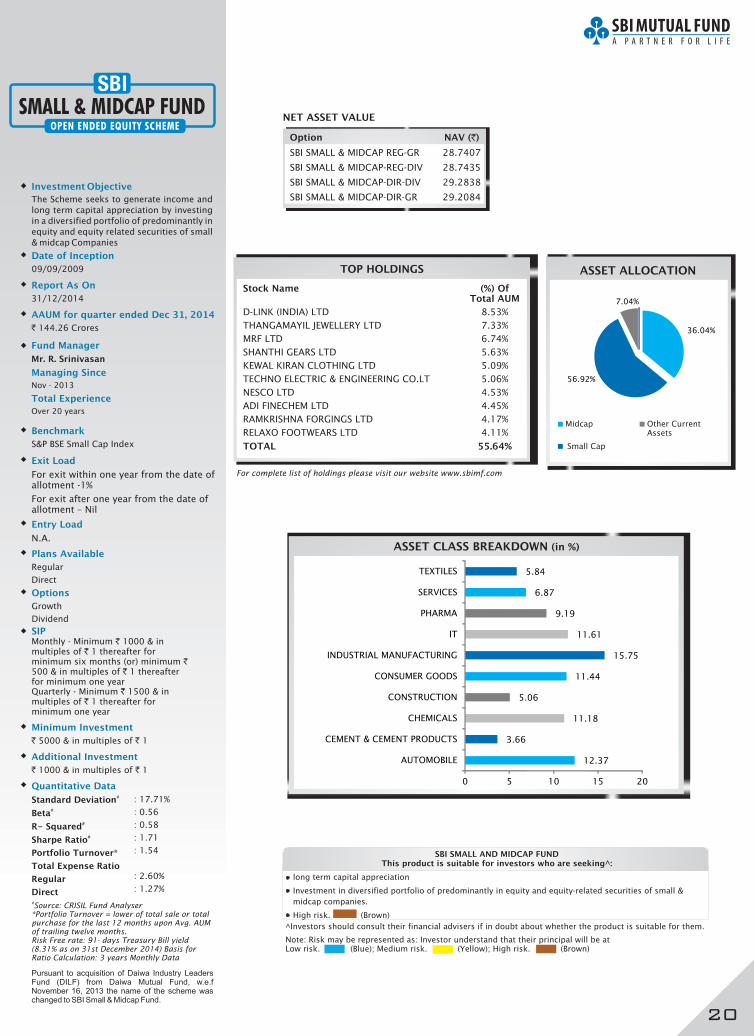
Investment Objective
The Scheme seeks to generate income and
long term capital appreciation by investing
in a diversified portfolio of predominantly in
equity and equity related securities of small
& midcap Companies
Date of Inception
09/09/2009
Entry Load
N.A.
Exit Load
For exit within one year from the date of allotment -1%
For exit after one year from the date of allotment – Nil
Fund Manager
Mr. R. Srinivasan
Over 20 years
Managing Since
Total Experience
Nov - 2013
Benchmark
S&P BSE Small Cap Index
Option
SBI SMALL & MIDCAP REG-GR 28.7407
SBI SMALL & MIDCAP-REG-DIV 28.7435
SBI SMALL & MIDCAP-DIR-DIV 29.2838
SBI SMALL & MIDCAP-DIR-GR 29.2084
NAV (`)
NET ASSET VALUE
Report As On
31/12/2014
TOP HOLDINGS
For complete list of holdings please visit our website www.sbimf.com
Stock Name (%) OfTotal AUM
D-LINK (INDIA) LTD 8.53%
THANGAMAYIL JEWELLERY LTD 7.33%
MRF LTD 6.74%
SHANTHI GEARS LTD 5.63%
KEWAL KIRAN CLOTHING LTD 5.09%
TECHNO ELECTRIC & ENGINEERING CO.LT 5.06%
NESCO LTD 4.53%
ADI FINECHEM LTD 4.45%
RAMKRISHNA FORGINGS LTD 4.17%
RELAXO FOOTWEARS LTD 4.11%
TOTAL 55.64%
AAUM for quarter ended , 2014Dec 31
` 144.26 Crores
Plans Available
Regular
Direct
Options
Growth
Dividend
Quantitative Data
Standard Deviation
Beta
R- Squared
Sharpe Ratio
Portfolio Turnover
Total Expense Ratio
Regular
Direct
#
#
#
#
*
: 17.71%
: 0.56
: 0.58
: 1.71
: 1.54
: 2.60%
: 1.27%
ASSET CLASS BREAKDOWN (in %)
SBI SMALL AND MIDCAP FUNDThis product is suitable for investors who are seeking^:
• long term capital appreciation
risk.
• Investment in diversified portfolio of predominantly in equity and equity-related securities of small &
midcap companies.
• High (Brown)
^Investors should consult their financial advisers if in doubt about whether the product is suitable for them.
Note: Risk may be represented as: Investor understand that their principal will be at Low risk. (Blue); Medium risk. (Yellow); High risk. (Brown)
Minimum Investment
` 5000 & in multiples of ` 1
Additional Investment
` 1000 & in multiples of ` 1
SIPMonthly - Minimum ` 1000 & in multiples of ` 1 thereafter for minimum six months (or) minimum ` 500 & in multiples of ` 1 thereafter for minimum one yearQuarterly - Minimum ` 1500 & in multiples of ` 1 thereafter for minimum one year
Midcap Other Current Assets
Small Cap
20
ASSET ALLOCATION
#Source: CRISIL Fund Analyser*Portfolio Turnover = lower of total sale or total purchase for the last 12 months upon Avg. AUM of trailing twelve months.Risk Free rate: 91- days Treasury Bill yield (8.31% as on 31st December 2014) Basis for Ratio Calculation: 3 years Monthly Data
Pursuant to acquisition of Daiwa Industry Leaders Fund (DILF) from Daiwa Mutual Fund, w.e.f November 16, 2013 the name of the scheme was changed to SBI Small & Midcap Fund.
12.37
3.66
11.18
5.06
11.44
15.75
11.61
9.19
6.87
5.84
0 5 10 15 20
AUTOMOBILE
CEMENT & CEMENT PRODUCTS
CHEMICALS
CONSTRUCTION
CONSUMER GOODS
INDUSTRIAL MANUFACTURING
IT
PHARMA
SERVICES
TEXTILES
36.04%
56.92%
7.04%

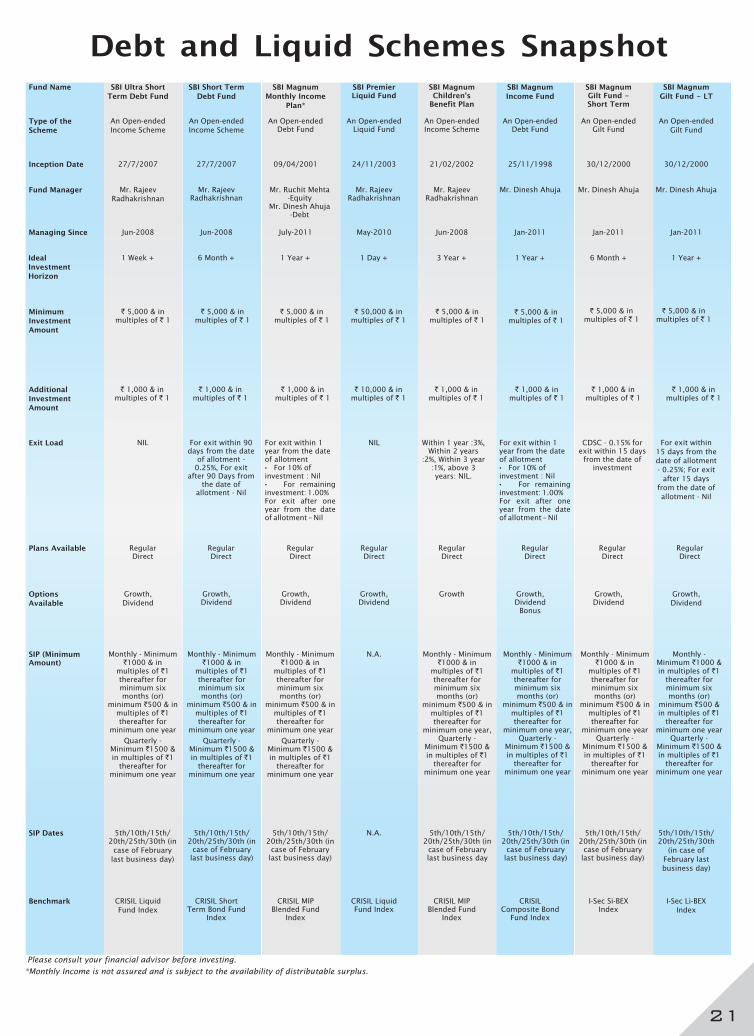
Debt and Liquid Schemes SnapshotFund Name
Type of the Scheme
Inception Date
Fund Manager
Managing Since
Ideal Investment Horizon
Minimum Investment Amount
Additional Investment Amount
Exit Load
Options Available
SIP (MinimumAmount)
SIP Dates
Benchmark
Please consult your financial advisor before investing.
*Monthly Income is not assured and is subject to the availability of distributable surplus.
SBI Ultra Short
Term Debt Fund
An Open-ended Income Scheme
27/7/2007
Mr. Rajeev Radhakrishnan
Jun-2008
1 Week +
` 5,000 & in multiples of ` 1
` 1,000 & in multiples of ` 1
NIL
Growth, Dividend
Monthly - Minimum 1000 & in
multiples of 1 thereafter for minimum six months (or)
minimum 500 & in multiples of 1 thereafter for
minimum one year
Quarterly - Minimum 1500 & in multiples of 1
thereafter for minimum one year
``
``
``
5th/10th/15th/20th/25th/30th (in
case of February last business day)
CRISIL Liquid Fund Index
SBI Short Term
Debt Fund
An Open-ended Income Scheme
27/7/2007
Mr. Rajeev Radhakrishnan
Jun-2008
6 Month +
` 5,000 & in multiples of ` 1
` 1,000 & in multiples of ` 1
For exit within 90 days from the date
of allotment - 0.25%, For exit
after 90 Days from the date of
allotment - Nil
Growth, Dividend
Monthly - Minimum 1000 & in
multiples of 1 thereafter for minimum six months (or)
minimum 500 & in multiples of 1 thereafter for
minimum one year
Quarterly - Minimum 1500 & in multiples of 1
thereafter for minimum one year
``
``
``
5th/10th/15th/20th/25th/30th (in
case of February last business day)
CRISIL Short Term Bond Fund
Index
SBI Magnum
Monthly Income
Plan*
An Open-ended Debt Fund
09/04/2001
Mr. Ruchit Mehta -Equity
Mr. Dinesh Ahuja-Debt
July-2011
1 Year +
` 5,000 & in multiples of ` 1
` 1,000 & in multiples of ` 1
For exit within 1 year from the date of allotment• For 10% of investment : Nil• For remaining investment: 1.00%For exit after one year from the date of allotment – Nil
Growth, Dividend
Monthly - Minimum 1000 & in
multiples of 1 thereafter for minimum six months (or)
minimum 500 & in multiples of 1 thereafter for
minimum one year
Quarterly - Minimum 1500 & in multiples of 1
thereafter for minimum one year
``
``
``
5th/10th/15th/20th/25th/30th (in
case of February last business day)
CRISIL MIP Blended Fund
Index
SBI Premier Liquid Fund
An Open-ended Liquid Fund
24/11/2003
Mr. Rajeev Radhakrishnan
May-2010
1 Day +
` 50,000 & in multiples of ` 1
` 10,000 & in multiples of ` 1
NIL
Growth, Dividend
N.A.
N.A.
CRISIL Liquid Fund Index
SBI Magnum Children's
Benefit Plan
An Open-ended Income Scheme
21/02/2002
Mr. Rajeev Radhakrishnan
Jun-2008
3 Year +
` 5,000 & in multiples of ` 1
` 1,000 & in multiples of ` 1
Within 1 year :3%, Within 2 years
:2%, Within 3 year :1%, above 3 years: NIL.
Growth
Monthly - Minimum 1000 & in
multiples of 1 thereafter for minimum six months (or)
minimum 500 & in multiples of 1 thereafter for
minimum one year, Quarterly -
Minimum 1500 & in multiples of 1
thereafter for minimum one year
``
``
``
5th/10th/15th/20th/25th/30th (in
case of February last business day
CRISIL MIP Blended Fund
Index
SBI Magnum
Income Fund
An Open-ended Debt Fund
25/11/1998
Mr. Dinesh Ahuja
Jan-2011
1 Year +
` 5,000 & in multiples of ` 1
` 1,000 & in multiples of ` 1
For exit within 1 year from the date of allotment• For 10% of investment : Nil• For remaining investment: 1.00%For exit after one year from the date of allotment – Nil
Growth, Dividend
Bonus
Monthly - Minimum 1000 & in
multiples of 1 thereafter for minimum six months (or)
minimum 500 & in multiples of 1 thereafter for
minimum one year, Quarterly -
Minimum 1500 & in multiples of 1
thereafter for minimum one year
``
``
``
5th/10th/15th/20th/25th/30th (in
case of February last business day)
CRISIL Composite Bond
Fund Index
SBI Magnum Gilt Fund - Short Term
An Open-ended Gilt Fund
30/12/2000
Mr. Dinesh Ahuja
Jan-2011
6 Month +
` 5,000 & in multiples of ` 1
` 1,000 & in multiples of ` 1
CDSC - 0.15% for exit within 15 days
from the date of investment
Growth, Dividend
Monthly - Minimum 1000 & in
multiples of 1 thereafter for minimum six months (or)
minimum 500 & in multiples of 1 thereafter for
minimum one yearQuarterly -
Minimum 1500 & in multiples of 1
thereafter for minimum one year
``
``
``
5th/10th/15th/20th/25th/30th (in
case of February last business day)
I-Sec Si-BEX Index
Regular Direct
Regular Direct
Regular Direct
Regular Direct
Regular Direct
Regular Direct
Regular Direct
Plans Available
SBI Magnum
Gilt Fund - LT
An Open-ended Gilt Fund
30/12/2000
Mr. Dinesh Ahuja
Jan-2011
1 Year +
` 5,000 & in multiples of ` 1
` 1,000 & in multiples of ` 1
For exit within 15 days from the date of allotment - 0.25%; For exit
after 15 days from the date of allotment - Nil
Growth, Dividend
Monthly - Minimum `1000 & in multiples of `1
thereafter for minimum six months (or)
minimum `500 & in multiples of `1
thereafter for minimum one year
Quarterly - Minimum `1500 & in multiples of `1
thereafter for minimum one year
5th/10th/15th/20th/25th/30th
(in case of February last business day)
I-Sec Li-BEX Index
Regular Direct
21
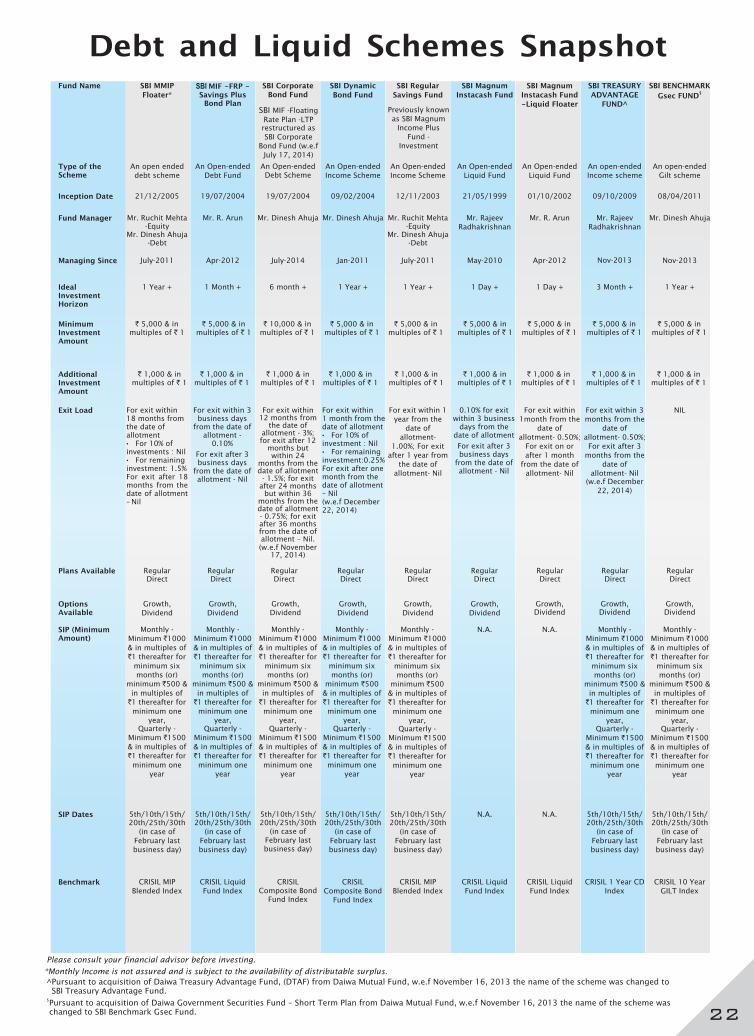
Debt and Liquid Schemes Snapshot
22
Please consult your financial advisor before investing.
Fund Name
Type of the Scheme
Managing Since
Ideal Investment Horizon
Minimum Investment Amount
Additional Investment Amount
Exit Load
Options Available
SIP (MinimumAmount)
SIP Dates
Benchmark
SBI MMIP
Floater*
An open ended debt scheme
July-2011
1 Year +
` 5,000 & in multiples of ` 1
` 1,000 & in multiples of ` 1
For exit within 18 months from the date of allotment• For 10% of investments : Nil• For remaining investment: 1.5%For exit after 18 months from the date of allotment – Nil
Growth, Dividend
Monthly - Minimum `1000
& in multiples of 1 thereafter for
minimum six months (or)
minimum 500 &
in multiples of 1 thereafter for
minimum one year,
Quarterly - Minimum 1500
& in multiples of 1 thereafter for
minimum one year
`
`
`
`
`
5th/10th/15th/20th/25th/30th
(in case of February last business day)
CRISIL MIP Blended Index
SBI MIF -FRP - Savings Plus
Bond Plan
An Open-ended Debt Fund
Apr-2012
1 Month +
` 5,000 & in multiples of ` 1
` 1,000 & in multiples of ` 1
For exit within 3 business days
from the date of allotment -
0.10%
For exit after 3 business days
from the date of allotment - Nil
Growth, Dividend
Monthly - Minimum 1000
& in multiples of 1 thereafter for
minimum six months (or)
minimum 500 &
in multiples of 1 thereafter for
minimum one year,
Quarterly - Minimum 1500
& in multiples of 1 thereafter for
minimum one year
`
`
`
`
`
`
5th/10th/15th/20th/25th/30th
(in case of February last business day)
CRISIL Liquid Fund Index
SBI Corporate Bond Fund
An Open-ended Debt Scheme
July-2014
6 month +
` 10,000 & in multiples of ` 1
` 1,000 & in multiples of ` 1
For exit within 12 months from
the date of allotment - 3%; for exit after 12
months but within 24
months from the date of allotment
- 1.5%; for exit after 24 months
but within 36 months from the date of allotment - 0.75%; for exit after 36 months from the date of allotment – Nil. (w.e.f November
17, 2014)
Growth, Dividend
Monthly - Minimum `1000
& in multiples of `1 thereafter for
minimum six months (or)
minimum `500 &
in multiples of `1 thereafter for
minimum one year,
Quarterly - Minimum `1500
& in multiples of `1 thereafter for
minimum one year
5th/10th/15th/20th/25th/30th
(in case of February last business day)
CRISIL Composite Bond
Fund Index
SBI Dynamic
Bond Fund
An Open-ended Income Scheme
Jan-2011
1 Year +
` 5,000 & in multiples of ` 1
` 1,000 & in multiples of ` 1
For exit within 1 month from the date of allotment• For 10% of investment : Nil• For remaining investment:0.25%For exit after one month from the date of allotment – Nil (w.e.f December 22, 2014)
Growth, Dividend
Monthly - Minimum 1000
& in multiples of 1 thereafter for
minimum six months (or)
minimum 500
& in multiples of 1 thereafter for
minimum one year,
Quarterly - Minimum 1500
& in multiples of 1 thereafter for
minimum one year
`
`
`
`
`
`
5th/10th/15th/20th/25th/30th
(in case of February last business day)
CRISIL Composite Bond
Fund Index
SBI Regular
Savings Fund
An Open-ended Income Scheme
July-2011
1 Year +
` 5,000 & in multiples of ` 1
` 1,000 & in multiples of ` 1
For exit within 1 year from the
date of allotment-
1.00%; For exit after 1 year from
the date of allotment- Nil
Growth, Dividend
Monthly - Minimum 1000
& in multiples of 1 thereafter for
minimum six months (or)
minimum 500
& in multiples of 1 thereafter for
minimum one year,
Quarterly - Minimum 1500
& in multiples of 1 thereafter for
minimum one year
`
`
`
`
`
`
5th/10th/15th/20th/25th/30th
(in case of February last business day)
CRISIL MIP Blended Index
SBI Magnum
Instacash Fund
An Open-ended Liquid Fund
Previously known as SBI Magnum
Income Plus Fund -
Investment
SBI MIF -Floating
Rate Plan -LTPrestructured as SBI Corporate
Bond Fund (w.e.f July 17, 2014)
May-2010
1 Day +
` 5,000 & in multiples of ` 1
` 1,000 & in multiples of ` 1
0.10% for exit within 3 business
days from the date of allotment
For exit after 3 business days
from the date of allotment - Nil
Growth, Dividend
N.A.
N.A.
CRISIL Liquid Fund Index
Regular Direct
Regular Direct
Regular Direct
Regular Direct
Regular Direct
Regular Direct
Plans Available
*Monthly Income is not assured and is subject to the availability of distributable surplus.
An Open-ended Liquid Fund
Apr-2012
1 Day +
` 5,000 & in multiples of ` 1
` 1,000 & in multiples of ` 1
For exit within 1month from the
date of allotment- 0.50%;
For exit on or after 1 month
from the date of allotment- Nil
Growth, Dividend
N.A.
N.A.
CRISIL Liquid Fund Index
Regular Direct
SBI Magnum
Instacash Fund
-Liquid Floater
An open-ended Income scheme
Nov-2013
3 Month +
` 5,000 & in multiples of ` 1
` 1,000 & in multiples of ` 1
For exit within 3 months from the
date of allotment- 0.50%; For exit after 3
months from the date of
allotment- Nil (w.e.f December
22, 2014)
Growth, Dividend
Monthly - Minimum `1000
& in multiples of `1 thereafter for
minimum six months (or)
minimum `500 &
in multiples of `1 thereafter for
minimum one year,
Quarterly - Minimum `1500
& in multiples of `1 thereafter for
minimum one year
5th/10th/15th/20th/25th/30th
(in case of February last business day)
CRISIL 1 Year CD Index
Regular Direct
SBI TREASURY
ADVANTAGE
FUND^
An open-ended Gilt scheme
Inception Date 21/12/2005 19/07/2004 19/07/2004 09/02/2004 12/11/2003 21/05/1999 01/10/2002 09/10/2009 08/04/2011
Fund Manager Mr. Ruchit Mehta -Equity
Mr. Dinesh Ahuja-Debt
Mr. R. Arun Mr. Dinesh Ahuja Mr. Dinesh Ahuja Mr. Ruchit Mehta -Equity
Mr. Dinesh Ahuja-Debt
Mr. Rajeev Radhakrishnan
Mr. R. Arun Mr. Rajeev Radhakrishnan
Mr. Dinesh Ahuja
Nov-2013
1 Year +
` 5,000 & in multiples of ` 1
` 1,000 & in multiples of ` 1
NIL
Growth, Dividend
Monthly - Minimum `1000
& in multiples of `1 thereafter for
minimum six months (or)
minimum `500 &
in multiples of `1 thereafter for
minimum one year,
Quarterly - Minimum `1500
& in multiples of `1 thereafter for
minimum one year
5th/10th/15th/20th/25th/30th
(in case of February last business day)
CRISIL 10 Year GILT Index
Regular Direct
SBI BENCHMARK
Gsec FUND$
^Pursuant to acquisition of Daiwa Treasury Advantage Fund, (DTAF) the name of the scheme was changed to SBI Treasury Advantage Fund.
from Daiwa Mutual Fund, w.e.f November 16, 2013
$Pursuant to acquisition of Daiwa Government Securities Fund – Short Term Plan the name of the scheme was changed to SBI Benchmark Gsec Fund.
from Daiwa Mutual Fund, w.e.f November 16, 2013
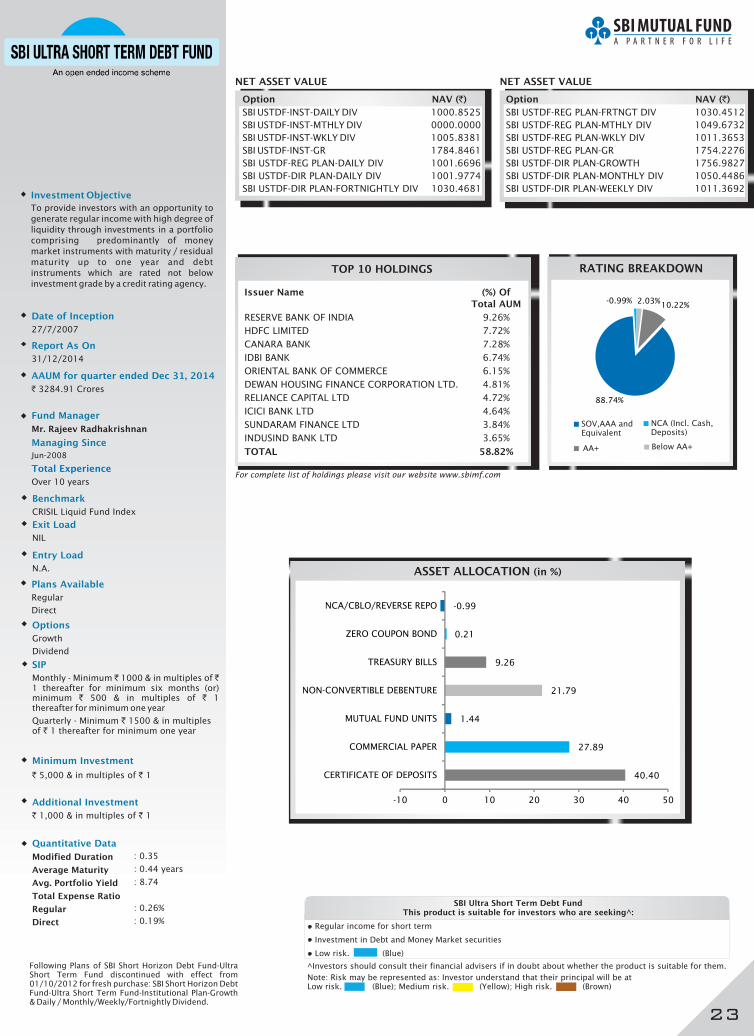
Investment Objective
To provide investors with an opportunity to
generate regular income with high degree of
liquidity through investments in a portfolio
comprising predominantly of money
market instruments with maturity / residual
maturity up to one year and debt
instruments which are rated not below
investment grade by a credit rating agency.
Date of Inception
27/7/2007
Fund Manager
Mr. Rajeev Radhakrishnan
Jun-2008
Managing Since
Total Experience
Over 10 years
Entry Load
N.A.
Exit Load
NIL
Benchmark
CRISIL Liquid Fund Index
NET ASSET VALUE NET ASSET VALUE
Report As On
31/12/2014
ASSET ALLOCATION (in %)
RATING BREAKDOWN
AAUM for quarter ended Dec 31, 2014
` 3284.91 Crores
TOP 10 HOLDINGS
For complete list of holdings please visit our website www.sbimf.com
Options
Growth
Dividend
SIP
Monthly - Minimum ̀ 1000 & in multiples of ̀ 1 thereafter for minimum six months (or) minimum ` 500 & in multiples of ` 1 thereafter for minimum one year
Quarterly - Minimum ` 1500 & in multiples of ` 1 thereafter for minimum one year
Minimum Investment
` 5,000 & in multiples of ` 1
Additional Investment
` 1,000 & in multiples of ` 1
Quantitative Data
Modified Duration
Average Maturity
Avg. Portfolio Yield
Total Expense Ratio
Regular
Direct
: 0.35
: 0.44 years
: 8.74
: 0.26%
: 0.19%
Following Plans of SBI Short Horizon Debt Fund-Ultra Short Term Fund discontinued with effect from 01/10/2012 for fresh purchase: SBI Short Horizon Debt Fund-Ultra Short Term Fund-Institutional Plan-Growth & Daily / Monthly/Weekly/Fortnightly Dividend.
Plans Available
Regular
Direct
SBI Ultra Short Term Debt FundThis product is suitable for investors who are seeking^:
• Regular income for short term
nvestment in Debt and Money Market securities• I
• Low risk. (Blue)
^Investors should consult their financial advisers if in doubt about whether the product is suitable for them.
Note: Risk may be represented as: Investor understand that their principal will be at Low risk. (Blue); Medium risk. (Yellow); High risk. (Brown)
Issuer Name (%) Of
Total AUM
RESERVE BANK OF INDIA 9.26%
HDFC LIMITED 7.72%
CANARA BANK 7.28%
IDBI BANK 6.74%
ORIENTAL BANK OF COMMERCE 6.15%
DEWAN HOUSING FINANCE CORPORATION LTD. 4.81%
RELIANCE CAPITAL LTD 4.72%
ICICI BANK LTD 4.64%
SUNDARAM FINANCE LTD 3.84%
INDUSIND BANK LTD 3.65%
TOTAL 58.82%
Option NAV (`)
SBI USTDF-INST-DAILY DIV 1000.8525
SBI USTDF-INST-MTHLY DIV 0000.0000
SBI USTDF-INST-WKLY DIV 1005.8381
SBI USTDF-INST-GR 1784.8461
SBI USTDF-REG PLAN-DAILY DIV 1001.6696
SBI USTDF-DIR PLAN-DAILY DIV 1001.9774
SBI USTDF-DIR PLAN-FORTNIGHTLY DIV 1030.4681
Option NAV (`)
SBI USTDF-REG PLAN-FRTNGT DIV 1030.4512
SBI USTDF-REG PLAN-MTHLY DIV 1049.6732
SBI USTDF-REG PLAN-WKLY DIV 1011.3653
SBI USTDF-REG PLAN-GR 1754.2276
SBI USTDF-DIR PLAN-GROWTH 1756.9827
SBI USTDF-DIR PLAN-MONTHLY DIV 1050.4486
SBI USTDF-DIR PLAN-WEEKLY DIV 1011.3692
23
NCA (Incl. Cash,Deposits)
SOV,AAA andEquivalent
AA+ Below AA+
2.03%10.22%
88.74%
-0.99%
40.40
27.89
1.44
21.79
9.26
0.21
-0.99
-10 0 10 20 30 40 50
CERTIFICATE OF DEPOSITS
COMMERCIAL PAPER
MUTUAL FUND UNITS
NON-CONVERTIBLE DEBENTURE
TREASURY BILLS
ZERO COUPON BOND
NCA/CBLO/REVERSE REPO
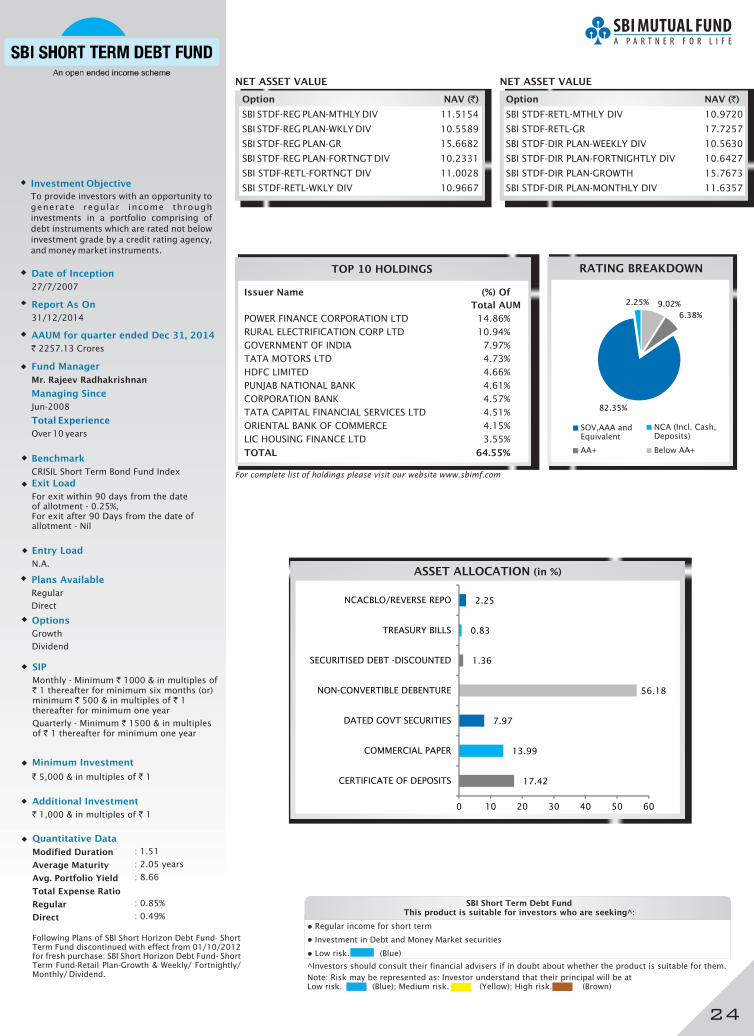
Investment Objective
To provide investors with an opportunity to
generate regular income through
investments in a portfolio comprising of
debt instruments which are rated not below
investment grade by a credit rating agency,
and money market instruments.
Date of Inception
27/7/2007
Fund Manager
Mr. Rajeev Radhakrishnan
Jun-2008
Managing Since
Total Experience
Over 10 years
Entry Load
N.A.
Options
Growth
Dividend
SIP
Monthly - Minimum ` 1000 & in multiples of ` 1 thereafter for minimum six months (or) minimum ` 500 & in multiples of ` 1 thereafter for minimum one year
Quarterly - Minimum ` 1500 & in multiples of ` 1 thereafter for minimum one year
Minimum Investment
` 5,000 & in multiples of ` 1
Exit Load
For exit within 90 days from the date of allotment - 0.25%, For exit after 90 Days from the date of allotment - Nil
Additional Investment
` 1,000 & in multiples of ` 1
Benchmark
CRISIL Short Term Bond Fund Index
Quantitative Data
Modified Duration
Average Maturity
Avg. Portfolio Yield
Total Expense Ratio
Regular
Direct
: 1.51
: 2.05
: 8.66
: 0.85%
: 0.49%
years
Report As On
31/12/2014
ASSET ALLOCATION (in %)
TOP 10 HOLDINGS
For complete list of holdings please visit our website www.sbimf.com
RATING BREAKDOWN
AAUM for quarter ended Dec , 201431
` 2257.13 Crores
Following Plans of SBI Short Horizon Debt Fund- Short Term Fund discontinued with effect from 01/10/2012 for fresh purchase: SBI Short Horizon Debt Fund- Short Term Fund-Retail Plan-Growth & Weekly/ Fortnightly/ Monthly/ Dividend.
Plans Available
Regular
Direct
NET ASSET VALUE NET ASSET VALUE
NCA (Incl. Cash,Deposits)
SOV,AAA andEquivalent
AA+ Below AA+
SBI Short Term Debt FundThis product is suitable for investors who are seeking^:
• Regular income for short term
nvestment in Debt and Money Market securities• I
• Low risk. (Blue)
^Investors should consult their financial advisers if in doubt about whether the product is suitable for them.
Note: Risk may be represented as: Investor understand that their principal will be at Low risk. (Blue); Medium risk. (Yellow); High risk. (Brown)
Issuer Name (%) Of
Total AUM
POWER FINANCE CORPORATION LTD 14.86%
RURAL ELECTRIFICATION CORP LTD 10.94%
GOVERNMENT OF INDIA 7.97%
TATA MOTORS LTD 4.73%
HDFC LIMITED 4.66%
PUNJAB NATIONAL BANK 4.61%
CORPORATION BANK 4.57%
TATA CAPITAL FINANCIAL SERVICES LTD 4.51%
ORIENTAL BANK OF COMMERCE 4.15%
LIC HOUSING FINANCE LTD 3.55%
TOTAL 64.55%
Option NAV (`)
SBI STDF-REG PLAN-MTHLY DIV 11.5154
SBI STDF-REG PLAN-WKLY DIV 10.5589
SBI STDF-REG PLAN-GR 15.6682
SBI STDF-REG PLAN-FORTNGT DIV 10.2331
SBI STDF-RETL-FORTNGT DIV 11.0028
SBI STDF-RETL-WKLY DIV 10.9667
Option NAV (`)
SBI STDF-RETL-MTHLY DIV 10.9720
SBI STDF-RETL-GR 17.7257
SBI STDF-DIR PLAN-WEEKLY DIV 10.5630
SBI STDF-DIR PLAN-FORTNIGHTLY DIV 10.6427
SBI STDF-DIR PLAN-GROWTH 15.7673
SBI STDF-DIR PLAN-MONTHLY DIV 11.6357
24
9.02%
6.38%
82.35%
2.25%
17.42
13.99
7.97
56.18
1.36
0.83
2.25
0 10 20 30 40 50 60
CERTIFICATE OF DEPOSITS
COMMERCIAL PAPER
DATED GOVT SECURITIES
NON-CONVERTIBLE DEBENTURE
SECURITISED DEBT -DISCOUNTED
TREASURY BILLS
NCACBLO/REVERSE REPO
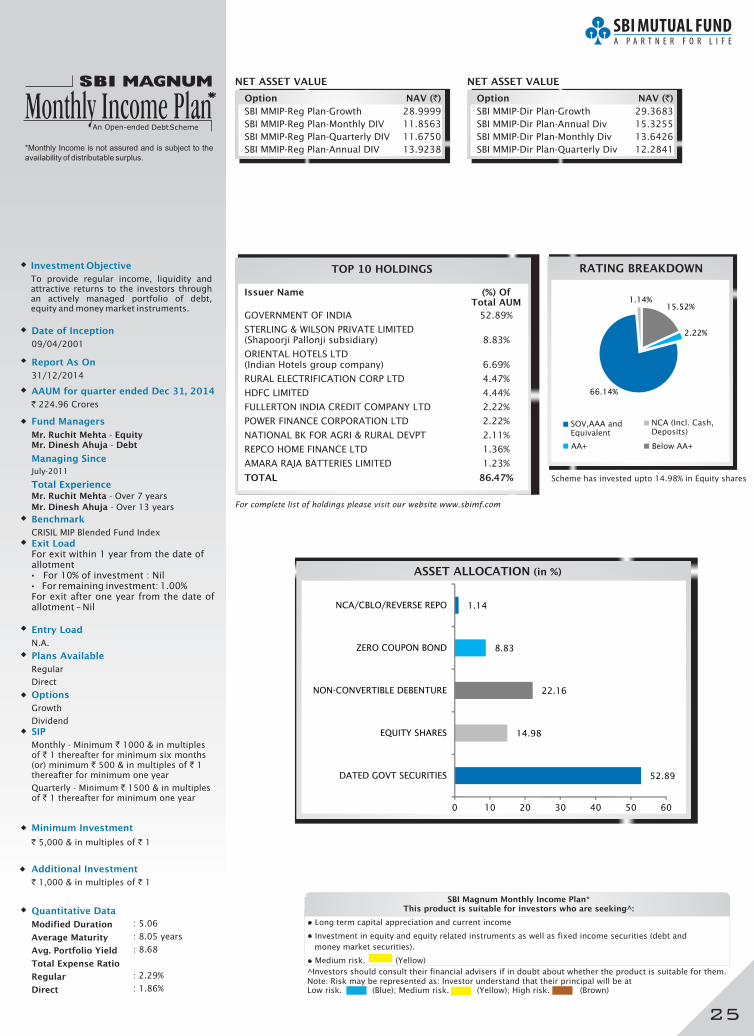
Investment Objective
To provide regular income, liquidity and attractive returns to the investors through an actively managed portfolio of debt, equity and money market instruments.
Date of Inception
09/04/2001
*Monthly Income is not assured and is subject to the availability of distributable surplus.
Fund Managers
Mr. Ruchit Mehta - EquityMr. Dinesh Ahuja - Debt
Managing Since
July-2011
Over 7 years
Over 13 years
Total ExperienceMr. Ruchit Mehta -
Mr. Dinesh Ahuja -
Entry Load
N.A.
Options
Growth
Dividend
SIP
Monthly - Minimum ` 1000 & in multiples of ` 1 thereafter for minimum six months (or) minimum ` 500 & in multiples of ` 1 thereafter for minimum one year
Quarterly - Minimum ` 1500 & in multiples of ` 1 thereafter for minimum one year
Minimum Investment
` 5,000 & in multiples of ` 1
Exit LoadFor exit within 1 year from the date of allotment• For 10% of investment : Nil• For remaining investment: 1.00%For exit after one year from the date of allotment – Nil
Additional Investment
` 1,000 & in multiples of ` 1
Benchmark
CRISIL MIP Blended Fund Index
Quantitative Data
Modified Duration
Average Maturity
Avg. Portfolio Yield
Total Expense Ratio
Regular
Direct
: 5.06
: 8.05
: 8.68
: 2.29%
: 1.86%
years
Report As On
31/12/2014
ASSET ALLOCATION (in %)
TOP 10 HOLDINGS
For complete list of holdings please visit our website www.sbimf.com
Scheme has investe upto 14.98% in Equity sharesd
RATING BREAKDOWN
SOV,AAA andEquivalent
NCA (Incl. Cash,Deposits)
AA+ Below AA+
AAUM for quarter ended Dec , 201431
` 224.96 Crores
Plans Available
Regular
Direct
NET ASSET VALUE NET ASSET VALUE
SBI Magnum Monthly Income Plan*This product is suitable for investors who are seeking^:
• Long term capital appreciation and current income
nvestment in equity and equity related instruments as well as fixed income securities (debt and
money market securities).
edium risk. (Yellow)
• I
• M
^Investors should consult their financial advisers if in doubt about whether the product is suitable for them.Note: Risk may be represented as: Investor understand that their principal will be at Low risk. (Blue); Medium risk. (Yellow); High risk. (Brown)
Issuer Name (%) OfTotal AUM
GOVERNMENT OF INDIA 52.89%
STERLING & WILSON PRIVATE LIMITED (Shapoorji Pallonji subsidiary) 8.83%
ORIENTAL HOTELS LTD (Indian Hotels group company) 6.69%
RURAL ELECTRIFICATION CORP LTD 4.47%
HDFC LIMITED 4.44%
FULLERTON INDIA CREDIT COMPANY LTD 2.22%
POWER FINANCE CORPORATION LTD 2.22%
NATIONAL BK FOR AGRI & RURAL DEVPT 2.11%
REPCO HOME FINANCE LTD 1.36%
AMARA RAJA BATTERIES LIMITED 1.23%
TOTAL 86.47%
Option NAV (`)
SBI MMIP-Reg Plan-Growth 28.9999
SBI MMIP-Reg Plan-Monthly DIV 11.8563
SBI MMIP-Reg Plan-Quarterly DIV 11.6750
SBI MMIP-Reg Plan-Annual DIV 13.9238
Option NAV (`)
SBI MMIP-Dir Plan-Growth 29.3683
SBI MMIP-Dir Plan-Annual Div 15.3255
SBI MMIP-Dir Plan-Monthly Div 13.6426
SBI MMIP-Dir Plan-Quarterly Div 12.2841
25
Debt
15.52%
2.22%
66.14%
1.14%
52.89
14.98
22.16
8.83
1.14
0 10 20 30 40 50 60
DATED GOVT SECURITIES
EQUITY SHARES
NON-CONVERTIBLE DEBENTURE
ZERO COUPON BOND
NCA/CBLO/REVERSE REPO
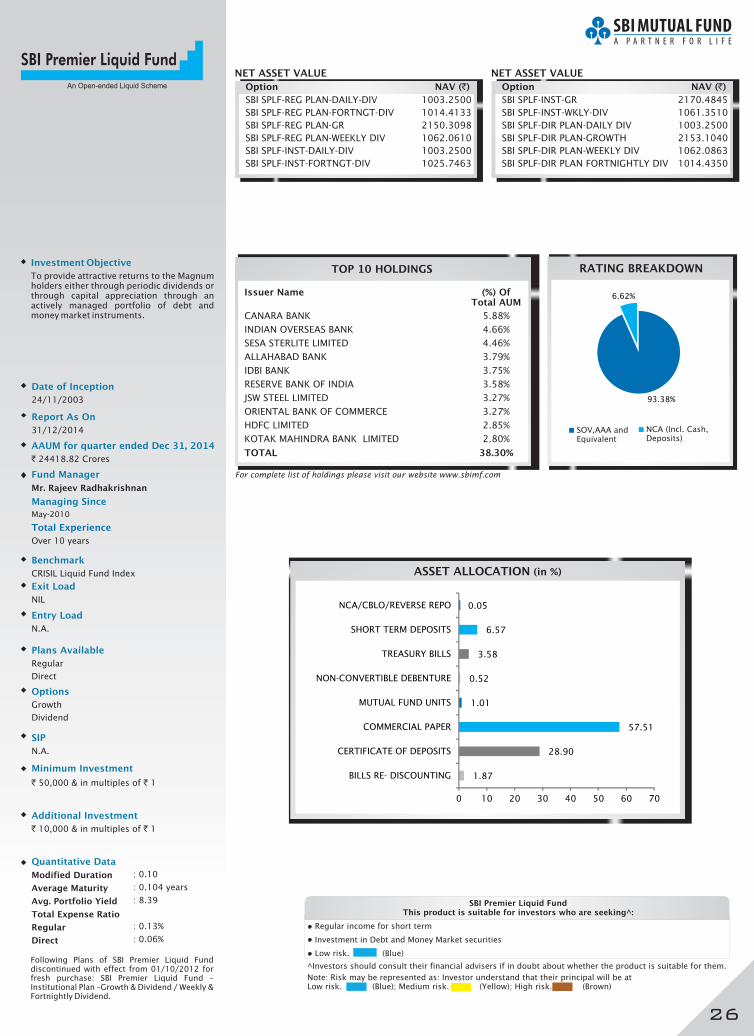
Investment Objective
To provide attractive returns to the Magnum holders either through periodic dividends or through capital appreciation through an actively managed portfolio of debt and money market instruments.
Date of Inception
24/11/2003
Fund Manager
Mr. Rajeev Radhakrishnan
May-2010
Managing Since
Total Experience
Over 10 years
Entry Load
N.A.
Options
Growth
Dividend
SIP
N.A.
Minimum Investment
` 50,000 & in multiples of ` 1
Exit Load
NIL
Additional Investment
` 10,000 & in multiples of ` 1
Benchmark
CRISIL Liquid Fund Index
Quantitative Data
Modified Duration
Average Maturity
Avg. Portfolio Yield
Total Expense Ratio
Regular
Direct
: 0.10
: 0.104 years
: 8.39
: 0.13%
: 0.06%
NET ASSET VALUE NET ASSET VALUE
Report As On
31/12/2014
ASSET ALLOCATION (in %)
TOP 10 HOLDINGS
For complete list of holdings please visit our website www.sbimf.com
RATING BREAKDOWN
AAUM for quarter ended Dec , 201431
` 24418.82 Crores
SOV,AAA and Equivalent
NCA (Incl. Cash,Deposits)
Following Plans of SBI Premier Liquid Fund discontinued with effect from 01/10/2012 for fresh purchase: SBI Premier Liquid Fund – Institutional Plan –Growth & Dividend / Weekly & Fortnightly Dividend.
Plans Available
Regular
Direct
An Open-ended Liquid Scheme
SBI Premier Liquid FundThis product is suitable for investors who are seeking^:
• Regular income for short term
nvestment in Debt and Money Market securities• I
• Low risk. (Blue)
^Investors should consult their financial advisers if in doubt about whether the product is suitable for them.
Note: Risk may be represented as: Investor understand that their principal will be at Low risk. (Blue); Medium risk. (Yellow); High risk. (Brown)
Issuer Name (%) OfTotal AUM
CANARA BANK 5.88%
INDIAN OVERSEAS BANK 4.66%
SESA STERLITE LIMITED 4.46%
ALLAHABAD BANK 3.79%
IDBI BANK 3.75%
RESERVE BANK OF INDIA 3.58%
JSW STEEL LIMITED 3.27%
ORIENTAL BANK OF COMMERCE 3.27%
HDFC LIMITED 2.85%
KOTAK MAHINDRA BANK LIMITED 2.80%
TOTAL 38.30%
Option NAV (`)
SBI SPLF-REG PLAN-DAILY-DIV 1003.2500
SBI SPLF-REG PLAN-FORTNGT-DIV 1014.4133
SBI SPLF-REG PLAN-GR 2150.3098
SBI SPLF-REG PLAN-WEEKLY DIV 1062.0610
SBI SPLF-INST-DAILY-DIV 1003.2500
SBI SPLF-INST-FORTNGT-DIV 1025.7463
Option NAV (`)
SBI SPLF-INST-GR
SBI SPLF-INST-WKLY-DIV 1061.3510
SBI SPLF-DIR PLAN-DAILY DIV 1003.2500
SBI SPLF-DIR PLAN-GROWTH 2153.1040
SBI SPLF-DIR PLAN-WEEKLY DIV 1062.0863
SBI SPLF-DIR PLAN FORTNIGHTLY DIV 1014.4350
2170.4845
26
93.38%
6.62%
1.87
28.90
57.51
1.01
0.52
3.58
6.57
0.05
0 10 20 30 40 50 60 70
BILLS RE- DISCOUNTING
CERTIFICATE OF DEPOSITS
COMMERCIAL PAPER
MUTUAL FUND UNITS
NON-CONVERTIBLE DEBENTURE
TREASURY BILLS
SHORT TERM DEPOSITS
NCA/CBLO/REVERSE REPO
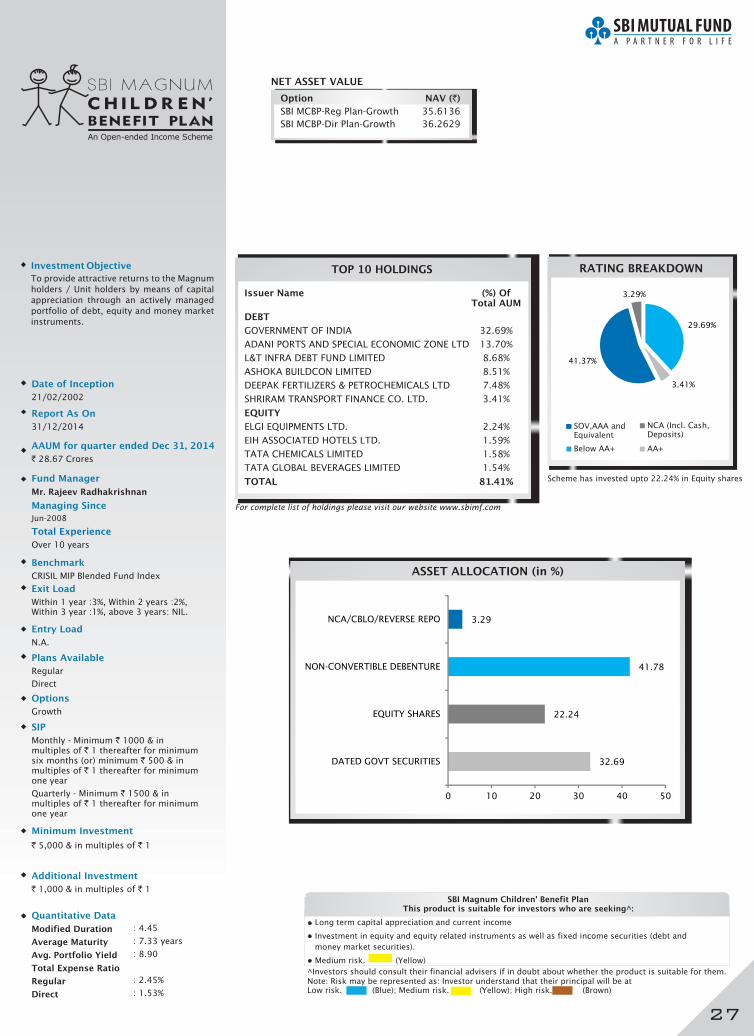
Investment Objective
To provide attractive returns to the Magnum
holders / Unit holders by means of capital
appreciation through an actively managed
portfolio of debt, equity and money market
instruments.
Date of Inception
21/02/2002
Fund Manager
Mr. Rajeev Radhakrishnan
Jun-2008
Managing Since
Total Experience
Over 10 years
Entry Load
N.A.
Options
Growth
SIP
Monthly - Minimum ` 1000 & in multiples of ` 1 thereafter for minimum six months (or) minimum ` 500 & in multiples of ` 1 thereafter for minimum one year
Quarterly - Minimum ` 1500 & in multiples of ` 1 thereafter for minimum one year
Minimum Investment
` 5,000 & in multiples of ` 1
Exit Load
Within 1 year :3%, Within 2 years :2%, Within 3 year :1%, above 3 years: NIL.
Additional Investment
` 1,000 & in multiples of ` 1
Benchmark
CRISIL MIP Blended Fund Index
Quantitative Data
Modified Duration
Average Maturity
Avg. Portfolio Yield
Total Expense Ratio
Regular
Direct
: 4.45
: 7.33
: 8.90
: 2.45%
: 1.53%
years
NET ASSET VALUE
Report As On
31/12/2014
ASSET ALLOCATION (in %)
RATING BREAKDOWN
AAUM for quarter ended Dec , 201431
` 28.67 Crores
TOP 10 HOLDINGS
For complete list of holdings please visit our website www.sbimf.com
Plans Available
Regular
Direct
SBI Magnum Children' Benefit PlanThis product is suitable for investors who are seeking^:
• Long term capital appreciation and current income
nvestment in equity and equity related instruments as well as fixed income securities (debt and
money market securities).
• I
• Medium risk. (Yellow)
^Investors should consult their financial advisers if in doubt about whether the product is suitable for them.Note: Risk may be represented as: Investor understand that their principal will be at Low risk. (Blue); Medium risk. (Yellow); High risk. (Brown)
Issuer Name (%) OfTotal AUM
DEBT
GOVERNMENT OF INDIA 32.69%
ADANI PORTS AND SPECIAL ECONOMIC ZONE LTD 13.70%
L&T INFRA DEBT FUND LIMITED 8.68%
ASHOKA BUILDCON LIMITED 8.51%
DEEPAK FERTILIZERS & PETROCHEMICALS LTD 7.48%
SHRIRAM TRANSPORT FINANCE CO. LTD. 3.41%
EQUITY
ELGI EQUIPMENTS LTD. 2.24%
EIH ASSOCIATED HOTELS LTD. 1.59%
TATA CHEMICALS LIMITED 1.58%
TATA GLOBAL BEVERAGES LIMITED 1.54%
TOTAL 81.41%
Option NAV (`)
SBI MCBP-Reg Plan-Growth 35.6136
SBI MCBP-Dir Plan-Growth 36.2629
27
Scheme has investe upto 22.24% in Equity sharesd
NCA (Incl. Cash,Deposits)
SOV,AAA andEquivalent
Below AA+ AA+
29.69%
3.41%
41.37%
3.29%
32.69
22.24
41.78
3.29
0 10 20 30 40 50
DATED GOVT SECURITIES
EQUITY SHARES
NON-CONVERTIBLE DEBENTURE
NCA/CBLO/REVERSE REPO
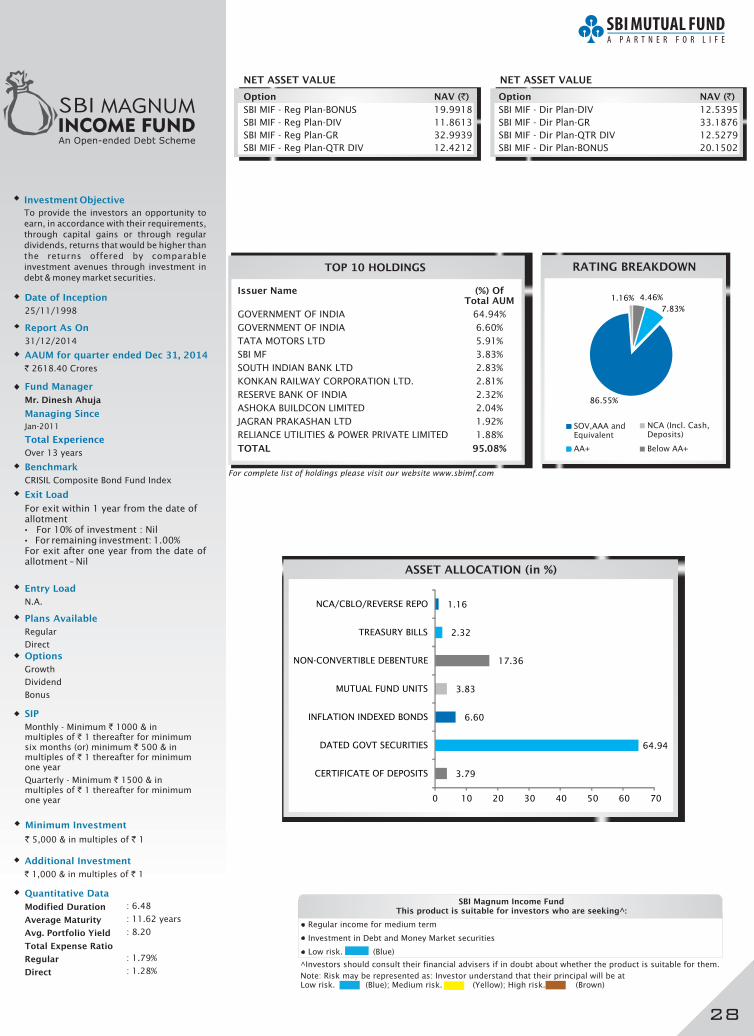
Investment Objective
To provide the investors an opportunity to
earn, in accordance with their requirements,
through capital gains or through regular
dividends, returns that would be higher than
the returns offered by comparable
investment avenues through investment in
debt & money market securities.
Date of Inception
25/11/1998
Fund Manager
Mr. Dinesh Ahuja
Jan-2011
Over 13 years
Managing Since
Total Experience
Entry Load
N.A.
Options
Growth
Dividend
Bonus
SIP
Monthly - Minimum ` 1000 & in multiples of ` 1 thereafter for minimum six months (or) minimum ` 500 & in multiples of ` 1 thereafter for minimum one year
Quarterly - Minimum ` 1500 & in multiples of ` 1 thereafter for minimum one year
Minimum Investment
` 5,000 & in multiples of ` 1
Exit Load
For exit within 1 year from the date of allotment• For 10% of investment : Nil• For remaining investment: 1.00%For exit after one year from the date of allotment – Nil
Additional Investment
` 1,000 & in multiples of ` 1
Benchmark
CRISIL Composite Bond Fund Index
Quantitative Data
Modified Duration
Average Maturity
Avg. Portfolio Yield
Total Expense Ratio
Regular
Direct
: 6.48
: 11.62
: 8.20
: 1.79%
: 1.28%
years
NET ASSET VALUE NET ASSET VALUE
Report As On
31/12/2014
TOP 10 HOLDINGS
For complete list of holdings please visit our website www.sbimf.com
RATING BREAKDOWN
ASSET ALLOCATION (in %)
AAUM for quarter ended Dec , 201431
` 2618.40 Crores
Plans Available
Regular
Direct
SBI Magnum Income FundThis product is suitable for investors who are seeking^:
• Regular income for medium term
nvestment in Debt and Money Market securities • I
• Low risk. (Blue)
^Investors should consult their financial advisers if in doubt about whether the product is suitable for them.
Note: Risk may be represented as: Investor understand that their principal will be at Low risk. (Blue); Medium risk. (Yellow); High risk. (Brown)
Issuer Name (%) OfTotal AUM
GOVERNMENT OF INDIA 64.94%
GOVERNMENT OF INDIA 6.60%
TATA MOTORS LTD 5.91%
SBI MF 3.83%
SOUTH INDIAN BANK LTD 2.83%
KONKAN RAILWAY CORPORATION LTD. 2.81%
RESERVE BANK OF INDIA 2.32%
ASHOKA BUILDCON LIMITED 2.04%
JAGRAN PRAKASHAN LTD 1.92%
RELIANCE UTILITIES & POWER PRIVATE LIMITED 1.88%
TOTAL 95.08%
Option NAV (`)
SBI MIF - Reg Plan-BONUS 19.9918
SBI MIF - Reg Plan-DIV 11.8613
SBI MIF - Reg Plan-GR 32.9939
SBI MIF - Reg Plan-QTR DIV 12.4212
Option NAV (`)
SBI MIF - Dir Plan-DIV 12.5395
SBI MIF - Dir Plan-GR 33.1876
SBI MIF - Dir Plan-QTR DIV 12.5279
SBI MIF - Dir Plan-BONUS 20.1502
NCA (Incl. Cash,Deposits)
SOV,AAA andEquivalent
AA+ Below AA+
28
4.46%
7.83%
86.55%
1.16%
3.79
64.94
6.60
3.83
17.36
2.32
1.16
0 10 20 30 40 50 60 70
CERTIFICATE OF DEPOSITS
DATED GOVT SECURITIES
INFLATION INDEXED BONDS
MUTUAL FUND UNITS
NON-CONVERTIBLE DEBENTURE
TREASURY BILLS
NCA/CBLO/REVERSE REPO
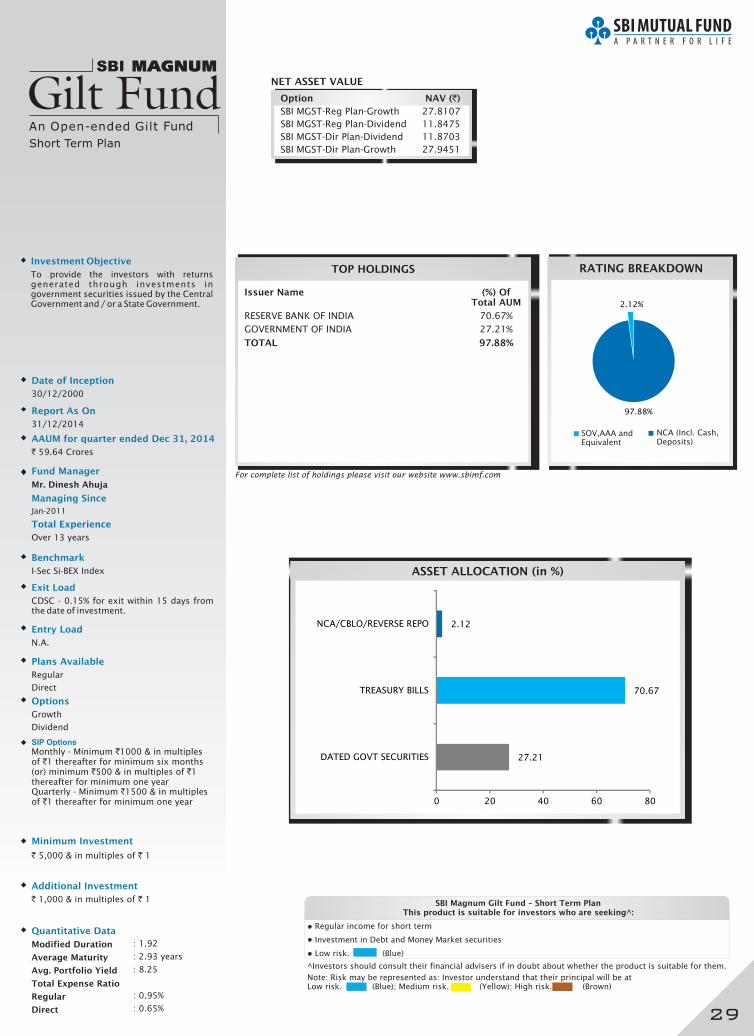
Investment Objective
To provide the investors with returns generated through investments in government securities issued by the Central Government and / or a State Government.
Date of Inception
30/12/2000
Fund Manager
Mr. Dinesh Ahuja
Jan-2011
Over 13 years
Managing Since
Total Experience
Entry Load
N.A.
SIP OptionsMonthly - Minimum `1000 & in multiples of `1 thereafter for minimum six months (or) minimum `500 & in multiples of `1 thereafter for minimum one yearQuarterly - Minimum `1500 & in multiples of `1 thereafter for minimum one year
Minimum Investment
` 5,000 & in multiples of ` 1
Exit Load
CDSC - 0.15% for exit within 15 days from the date of investment.
Additional Investment
` 1,000 & in multiples of ` 1
Benchmark
I-Sec Si-BEX Index
Quantitative Data
Modified Duration
Average Maturity
Avg. Portfolio Yield
Total Expense Ratio
Regular
Direct
: 1.92
: 2.93
: 8.25
: 0.95%
: 0.65%
years
Short Term Plan
NET ASSET VALUE
Report As On
31/12/2014
TOP HOLDINGS
For complete list of holdings please visit our website www.sbimf.com
RATING BREAKDOWN
SOV,AAA andEquivalent
NCA (Incl. Cash,Deposits)AAUM for quarter ended Dec , 201431
` 59.64 Crores
Plans Available
Regular
Direct
Options
Growth
Dividend
SBI Magnum Gilt Fund – Short Term PlanThis product is suitable for investors who are seeking^:
• Regular income for short term
nvestment in Debt and Money Market securities• I
• Low risk. (Blue)
^Investors should consult their financial advisers if in doubt about whether the product is suitable for them.
ASSET ALLOCATION (in %)
Note: Risk may be represented as: Investor understand that their principal will be at Low risk. (Blue); Medium risk. (Yellow); High risk. (Brown)
Issuer Name (%) OfTotal AUM
RESERVE BANK OF INDIA 70.67%
GOVERNMENT OF INDIA 27.21%
TOTAL 97.88%
Option NAV (`)
SBI MGST-Reg Plan-Growth 27.8107
SBI MGST-Reg Plan-Dividend 11.8475
SBI MGST-Dir Plan-Dividend 11.8703
SBI MGST-Dir Plan-Growth 27.9451
29
Fund
97.88%
2.12%
27.21
70.67
2.12
0 20 40 60 80
DATED GOVT SECURITIES
TREASURY BILLS
NCA/CBLO/REVERSE REPO
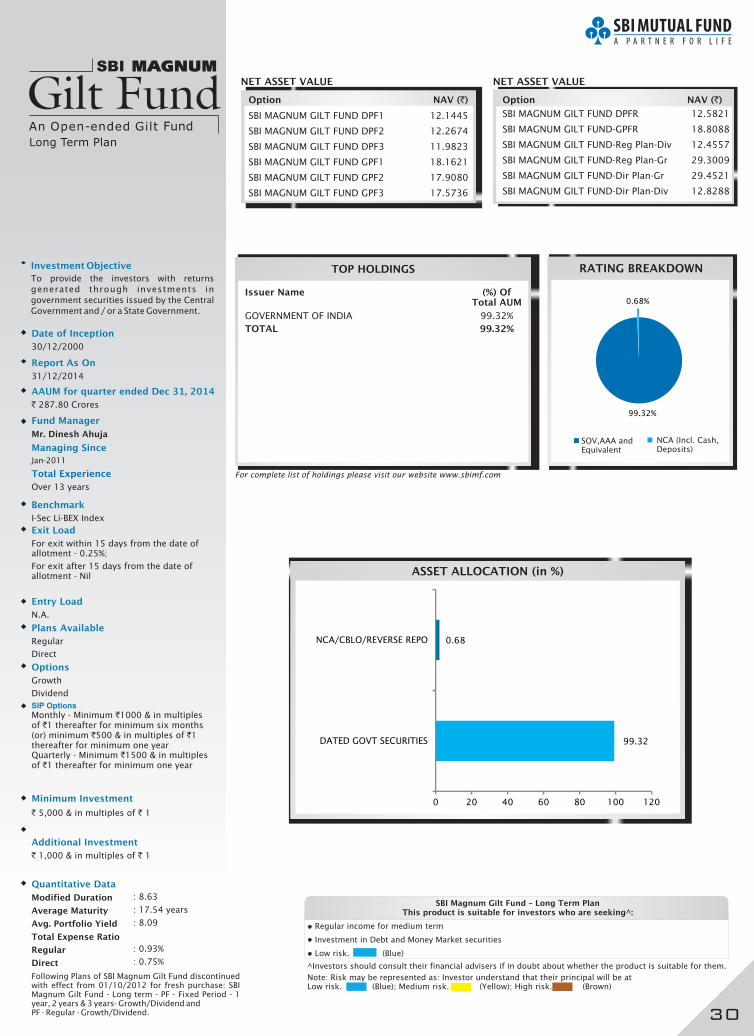
Investment Objective
To provide the investors with returns
generated through investments in
government securities issued by the Central
Government and / or a State Government.
Long Term Plan
NET ASSET VALUE NET ASSET VALUE
TOP HOLDINGS
For complete list of holdings please visit our website www.sbimf.com
ASSET ALLOCATION (in %)
Date of Inception
30/12/2000
Fund Manager
Mr. Dinesh Ahuja
Jan-2011
Managing Since
Total Experience
Over 13 years
Benchmark
I-Sec Li-BEX Index
Exit Load
For exit within 15 days from the date of allotment - 0.25%;
For exit after 15 days from the date of allotment - Nil
Entry Load
N.A.
Report As On
31/12/2014
AAUM for quarter ended Dec , 201431
` 287.80 Crores
SIP OptionsMonthly - Minimum `1000 & in multiples of `1 thereafter for minimum six months (or) minimum `500 & in multiples of `1 thereafter for minimum one yearQuarterly - Minimum `1500 & in multiples of `1 thereafter for minimum one year
Minimum Investment
` 5,000 & in multiples of ` 1
Additional Investment
` 1,000 & in multiples of ` 1
Quantitative Data
Modified Duration
Average Maturity
Avg. Portfolio Yield
Total Expense Ratio
Regular
Direct
:
: 17.54
: 8.09
: 0.93%
: 0.75%
8.63
years
Following Plans of SBI Magnum Gilt Fund discontinued with effect from 01/10/2012 for fresh purchase: SBI Magnum Gilt Fund - Long term - PF - Fixed Period - 1 year, 2 years & 3 years- Growth/Dividend andPF - Regular - Growth/Dividend.
Plans Available
Regular
Direct
Option NAV (`) Option NAV (`)
Options
Growth
Dividend
SBI Magnum Gilt Fund – Long Term PlanThis product is suitable for investors who are seeking^:
• Regular income for medium term
• Investment in Debt and Money Market securities
• Low risk. (Blue)
^Investors should consult their financial advisers if in doubt about whether the product is suitable for them.
Note: Risk may be represented as: Investor understand that their principal will be at Low risk. (Blue); Medium risk. (Yellow); High risk. (Brown)
Issuer Name (%) OfTotal AUM
GOVERNMENT OF INDIA 99.32%
TOTAL 99.32%
SBI MAGNUM GILT FUND DPF1 12.1445
SBI MAGNUM GILT FUND DPF2 12.2674
SBI MAGNUM GILT FUND DPF3 11.9823
SBI MAGNUM GILT FUND GPF1 18.1621
SBI MAGNUM GILT FUND GPF2 17.9080
SBI MAGNUM GILT FUND GPF3 17.5736
SBI MAGNUM GILT FUND DPFR 12.5821
SBI MAGNUM GILT FUND-GPFR 18.8088
SBI MAGNUM GILT FUND-Reg Plan-Div 12.4557
SBI MAGNUM GILT FUND-Reg Plan-Gr 29.3009
SBI MAGNUM GILT FUND-Dir Plan-Gr 29.4521
SBI MAGNUM GILT FUND-Dir Plan-Div 12.8288
30
RATING BREAKDOWN
SOV,AAA andEquivalent
NCA (Incl. Cash,Deposits)
Fund
99.32%
0.68%
99.32
0.68
0 20 40 60 80 100 120
DATED GOVT SECURITIES
NCA/CBLO/REVERSE REPO
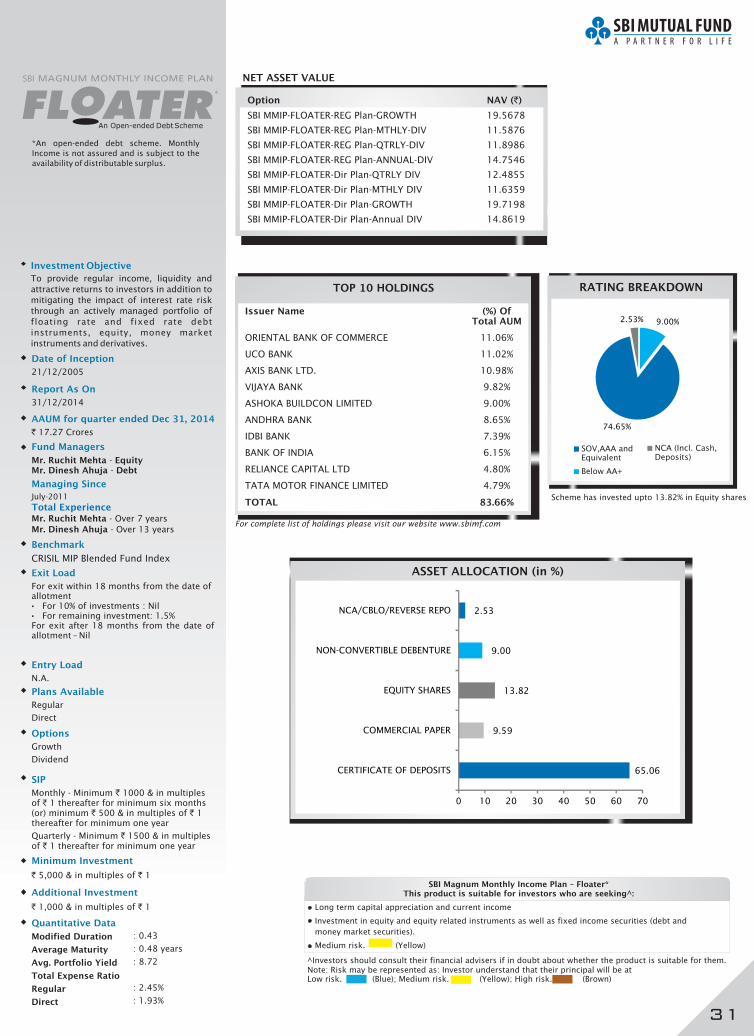
Investment Objective
To provide regular income, liquidity and
attractive returns to investors in addition to
mitigating the impact of interest rate risk
through an actively managed portfolio of
floating rate and fixed rate debt
instruments, equity, money market
instruments and derivatives.
Date of Inception
21/12/2005
Fund Managers
Mr. Ruchit Mehta - EquityMr. Dinesh Ahuja - Debt
Managing Since
July-2011
Over 7 years
Over 13 years
Total ExperienceMr. Ruchit Mehta -
Mr. Dinesh Ahuja -
Entry Load
N.A.
Options
Growth
Dividend
SIP
Monthly - Minimum ` 1000 & in multiples of ` 1 thereafter for minimum six months (or) minimum ` 500 & in multiples of ` 1 thereafter for minimum one year
Quarterly - Minimum ` 1500 & in multiples of ` 1 thereafter for minimum one year
Minimum Investment
` 5,000 & in multiples of ` 1
Exit Load
For exit within 18 months from the date of allotment• For 10% of investments : Nil• For remaining investment: 1.5%For exit after 18 months from the date of allotment – Nil
Additional Investment
` 1,000 & in multiples of ` 1
Benchmark
CRISIL MIP Blended Fund Index
Quantitative Data
Modified Duration
Average Maturity
Avg. Portfolio Yield
Total Expense Ratio
Regular
Direct
: 0.43
: 0.48
: 8.72
: 2.45%
: 1.93%
years
*An open-ended debt scheme. Monthly
Income is not assured and is subject to the
availability of distributable surplus.
NET ASSET VALUE
Report As On
31/12/2014
RATING BREAKDOWN
ASSET ALLOCATION (in %)
AAUM for quarter ended Dec , 201431
` 17.27 Crores
Plans Available
Regular
Direct
SBI Magnum Monthly Income Plan – Floater*This product is suitable for investors who are seeking^:
• Long term capital appreciation and current income
nvestment in equity and equity related instruments as well as fixed income securities (debt and
money market securities).
• I
• Medium risk. (Yellow)
^Investors should consult their financial advisers if in doubt about whether the product is suitable for them.Note: Risk may be represented as: Investor understand that their principal will be at Low risk. (Blue); Medium risk. (Yellow); High risk. (Brown)
*
SBI MMIP-FLOATER-REG Plan-GROWTH 19.5678
SBI MMIP-FLOATER-REG Plan-MTHLY-DIV 11.5876
SBI MMIP-FLOATER-REG Plan-QTRLY-DIV 11.8986
SBI MMIP-FLOATER-REG Plan-ANNUAL-DIV 14.7546
SBI MMIP-FLOATER-Dir Plan-QTRLY DIV 12.4855
SBI MMIP-FLOATER-Dir Plan-MTHLY DIV 11.6359
SBI MMIP-FLOATER-Dir Plan-GROWTH 19.7198
SBI MMIP-FLOATER-Dir Plan-Annual DIV 14.8619
31
Scheme has investe upto 13.82% in Equity sharesd
Debt
Option NAV (`)
TOP 10 HOLDINGS
For complete list of holdings please visit our website www.sbimf.com
Issuer Name (%) OfTotal AUM
ORIENTAL BANK OF COMMERCE 11.06%
UCO BANK 11.02%
AXIS BANK LTD. 10.98%
VIJAYA BANK 9.82%
ASHOKA BUILDCON LIMITED 9.00%
ANDHRA BANK 8.65%
IDBI BANK 7.39%
BANK OF INDIA 6.15%
RELIANCE CAPITAL LTD 4.80%
TATA MOTOR FINANCE LIMITED 4.79%
TOTAL 83.66%
NCA (Incl. Cash,Deposits)
SOV,AAA andEquivalent
Below AA+
9.00%
74.65%
2.53%
65.06
9.59
13.82
9.00
2.53
0 10 20 30 40 50 60 70
CERTIFICATE OF DEPOSITS
COMMERCIAL PAPER
EQUITY SHARES
NON-CONVERTIBLE DEBENTURE
NCA/CBLO/REVERSE REPO
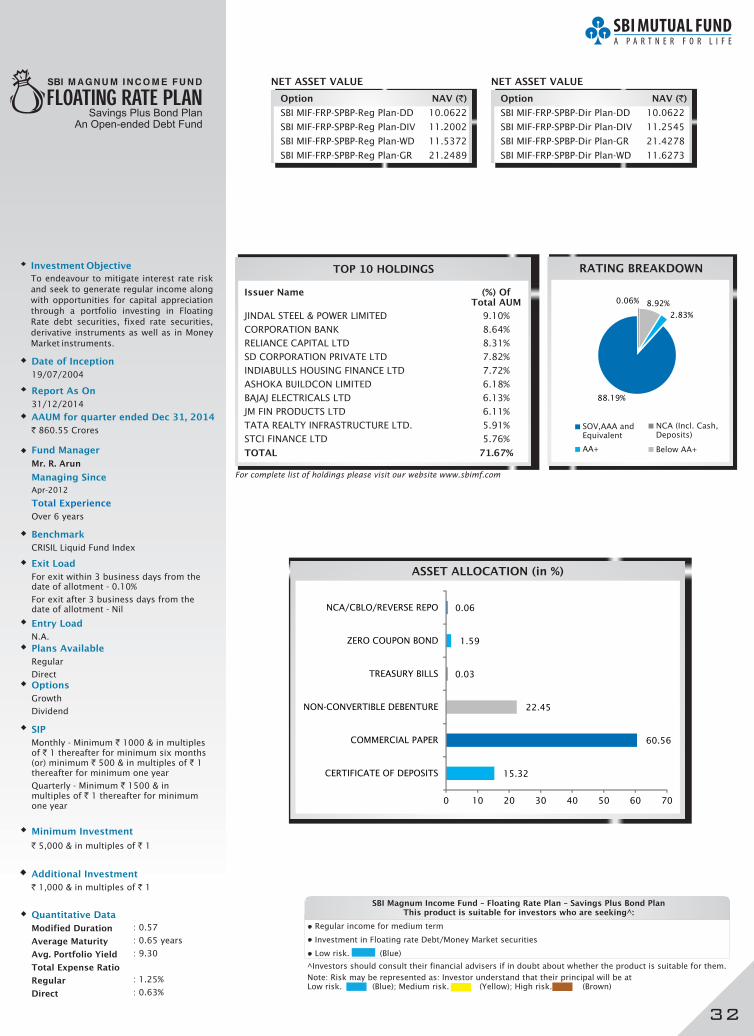
Investment Objective
To endeavour to mitigate interest rate risk
and seek to generate regular income along
with opportunities for capital appreciation
through a portfolio investing in Floating
Rate debt securities, fixed rate securities,
derivative instruments as well as in Money
Market instruments.
Date of Inception
19/07/2004
Savings Plus Bond Plan
Fund Manager
Mr. R. Arun
Managing Since
Apr-2012
Over 6 years
Total Experience
Entry Load
N.A.
Options
Growth
Dividend
SIP
Monthly - Minimum ` 1000 & in multiples of ` 1 thereafter for minimum six months (or) minimum ` 500 & in multiples of ` 1 thereafter for minimum one year
Quarterly - Minimum ` 1500 & in multiples of ` 1 thereafter for minimum one year
Minimum Investment
` 5,000 & in multiples of ` 1
Exit Load
For exit within 3 business days from the date of allotment - 0.10%
For exit after 3 business days from the date of allotment - Nil
Additional Investment
` 1,000 & in multiples of ` 1
Benchmark
CRISIL Liquid Fund Index
: 0.57
: 0.65
: 9.30
: 1.25%
: 0.63%
years
Quantitative Data
Modified Duration
Average Maturity
Avg. Portfolio Yield
Total Expense Ratio
Regular
Direct
NET ASSET VALUE NET ASSET VALUE
Report As On
31/12/2014
TOP 10 HOLDINGS
For complete list of holdings please visit our website www.sbimf.com
RATING BREAKDOWN
ASSET ALLOCATION (in %)
AAUM for quarter ended Dec , 201431
` 860.55 Crores SOV,AAA andEquivalent
AA+
NCA (Incl. Cash,Deposits)
Below AA+
Plans Available
Regular
Direct
An Open-ended Debt Fund
SBI Magnum Income Fund – Floating Rate Plan – Savings Plus Bond PlanThis product is suitable for investors who are seeking^:
• Regular income for medium term
nvestment in Floating rate Debt/Money Market securities• I
• Low risk. (Blue)
^Investors should consult their financial advisers if in doubt about whether the product is suitable for them.
Note: Risk may be represented as: Investor understand that their principal will be at Low risk. (Blue); Medium risk. (Yellow); High risk. (Brown)
Issuer Name (%) OfTotal AUM
JINDAL STEEL & POWER LIMITED 9.10%
CORPORATION BANK 8.64%
RELIANCE CAPITAL LTD 8.31%
SD CORPORATION PRIVATE LTD 7.82%
INDIABULLS HOUSING FINANCE LTD 7.72%
ASHOKA BUILDCON LIMITED 6.18%
BAJAJ ELECTRICALS LTD 6.13%
JM FIN PRODUCTS LTD 6.11%
TATA REALTY INFRASTRUCTURE LTD. 5.91%
STCI FINANCE LTD 5.76%
TOTAL 71.67%
SBI MIF-FRP-SPBP-Reg Plan-DD 10.0622
SBI MIF-FRP-SPBP-Reg Plan-DIV 11.2002
SBI MIF-FRP-SPBP-Reg Plan-WD 11.5372
SBI MIF-FRP-SPBP-Reg Plan-GR 21.2489
Option NAV (`) Option NAV (`)
SBI MIF-FRP-SPBP-Dir Plan-DD 10.0622
SBI MIF-FRP-SPBP-Dir Plan-DIV 11.2545
SBI MIF-FRP-SPBP-Dir Plan-GR 21.4278
SBI MIF-FRP-SPBP-Dir Plan-WD 11.6273
32
8.92%
2.83%
88.19%
0.06%
15.32
60.56
22.45
0.03
1.59
0.06
0 10 20 30 40 50 60 70
CERTIFICATE OF DEPOSITS
COMMERCIAL PAPER
NON-CONVERTIBLE DEBENTURE
TREASURY BILLS
ZERO COUPON BOND
NCA/CBLO/REVERSE REPO
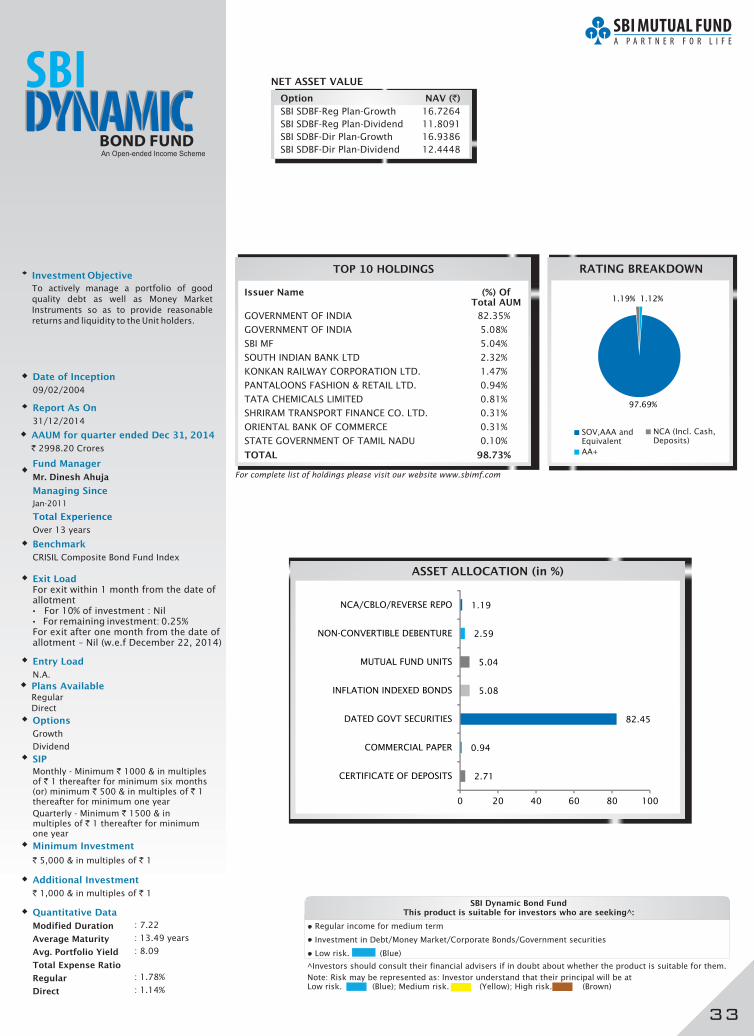
Investment Objective
To actively manage a portfolio of good
quality debt as well as Money Market
Instruments so as to provide reasonable
returns and liquidity to the Unit holders.
Date of Inception
09/02/2004
Fund Manager
Mr. Dinesh Ahuja
Jan-2011
Over 13 years
Managing Since
Total Experience
Entry Load
N.A.
Options
Growth
Dividend
SIP
Monthly - Minimum ` 1000 & in multiples of ` 1 thereafter for minimum six months (or) minimum ` 500 & in multiples of ` 1 thereafter for minimum one year
Quarterly - Minimum ` 1500 & in multiples of ` 1 thereafter for minimum one year
Minimum Investment
` 5,000 & in multiples of ` 1
Exit LoadFor exit within 1 month from the date of allotment• For 10% of investment : Nil• For remaining investment: 0.25%For exit after one month from the date of allotment – Nil (w.e.f December 22, 2014)
Additional Investment
` 1,000 & in multiples of ` 1
Benchmark
CRISIL Composite Bond Fund Index
Quantitative Data
Modified Duration
Average Maturity
Avg. Portfolio Yield
Total Expense Ratio
Regular
Direct
: 7.22
: 13.49
: 8.09
: 1.78%
: 1.14%
years
Report As On
31/12/2014
TOP 10 HOLDINGS
For complete list of holdings please visit our website www.sbimf.com
RATING BREAKDOWN
SOV,AAA andEquivalent
NCA (Incl. Cash,Deposits)
ASSET ALLOCATION (in %)
AA+
AAUM for quarter ended Dec , 201431
` 2998.20 Crores
Plans Available Regular
Direct
An Open-ended Income Scheme
SBI Dynamic Bond FundThis product is suitable for investors who are seeking^:
• Regular income for medium term
nvestment in Debt/Money Market/Corporate Bonds/Government securities• I
• Low risk. (Blue)
^Investors should consult their financial advisers if in doubt about whether the product is suitable for them.
Note: Risk may be represented as: Investor understand that their principal will be at Low risk. (Blue); Medium risk. (Yellow); High risk. (Brown)
Issuer Name (%) OfTotal AUM
GOVERNMENT OF INDIA 82.35%
GOVERNMENT OF INDIA 5.08%
SBI MF 5.04%
SOUTH INDIAN BANK LTD 2.32%
KONKAN RAILWAY CORPORATION LTD. 1.47%
PANTALOONS FASHION & RETAIL LTD. 0.94%
TATA CHEMICALS LIMITED 0.81%
SHRIRAM TRANSPORT FINANCE CO. LTD. 0.31%
ORIENTAL BANK OF COMMERCE 0.31%
STATE GOVERNMENT OF TAMIL NADU 0.10%
TOTAL 98.73%
NET ASSET VALUE
Option NAV (`)
SBI SDBF-Reg Plan-Growth 16.7264
SBI SDBF-Reg Plan-Dividend 11.8091
SBI SDBF-Dir Plan-Growth 16.9386
SBI SDBF-Dir Plan-Dividend 12.4448
33
1.12%
97.69%
1.19%
2.71
0.94
82.45
5.08
5.04
2.59
1.19
0 20 40 60 80 100
CERTIFICATE OF DEPOSITS
COMMERCIAL PAPER
DATED GOVT SECURITIES
INFLATION INDEXED BONDS
MUTUAL FUND UNITS
NON-CONVERTIBLE DEBENTURE
NCA/CBLO/REVERSE REPO
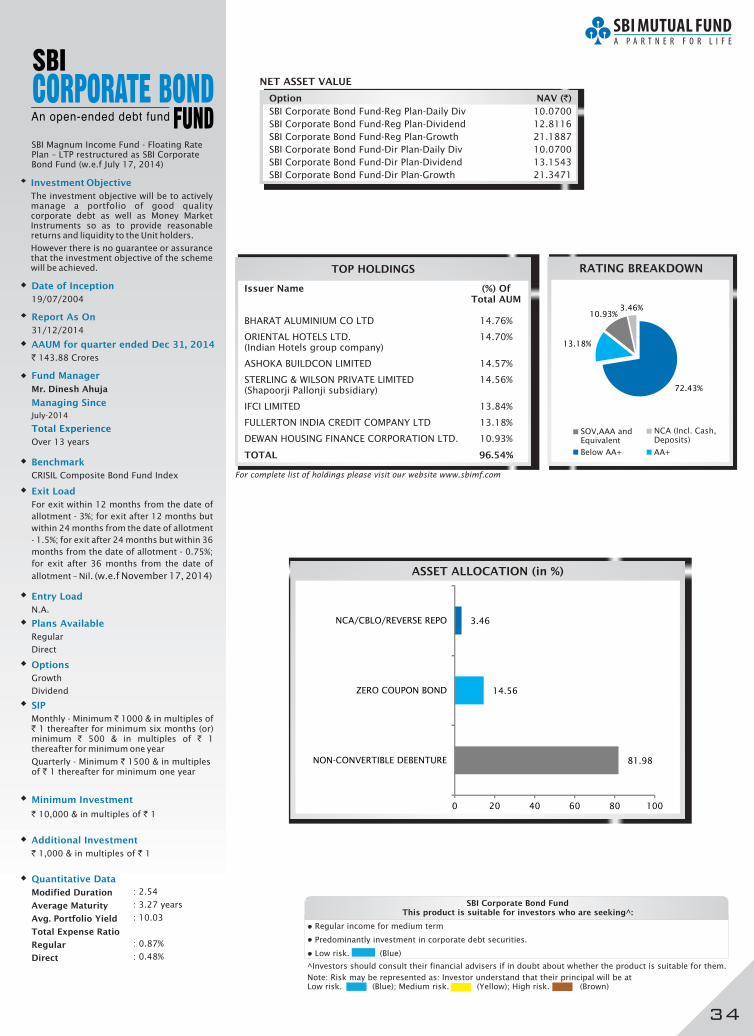
Investment Objective
The investment objective will be to actively manage a portfolio of good quality corporate debt as well as Money Market Instruments so as to provide reasonable returns and liquidity to the Unit holders.
However there is no guarantee or assurance that the investment objective of the scheme will be achieved.
Date of Inception
19/07/2004
Fund Manager
Mr. Dinesh Ahuja
July-2014
Over 13 years
Managing Since
Total Experience
Entry Load
N.A.
Exit Load
For exit within 12 months from the date of
allotment - 3%; for exit after 12 months but
within 24 months from the date of allotment
- 1.5%; for exit after 24 months but within 36
months from the date of allotment - 0.75%;
for exit after 36 months from the date of
allotment – Nil. (w.e.f November 17, 2014)
Benchmark
CRISIL Composite Bond Fund Index
NET ASSET VALUE
Report As On
31/12/2014
TOP HOLDINGS
For complete list of holdings please visit our website www.sbimf.com
RATING BREAKDOWN
SOV,AAA andEquivalent
NCA (Incl. Cash,Deposits)
ASSET ALLOCATION (in %)
AAUM for quarter ended Dec , 201431
` 143.88 Crores
Options
Growth
Dividend
SIP
Monthly - Minimum ` 1000 & in multiples of ` 1 thereafter for minimum six months (or) minimum ` 500 & in multiples of ` 1 thereafter for minimum one year
Quarterly - Minimum ` 1500 & in multiples of ` 1 thereafter for minimum one year
Minimum Investment
` 10,000 & in multiples of ` 1
Additional Investment
` 1,000 & in multiples of ` 1
Quantitative Data
Modified Duration
Average Maturity
Avg. Portfolio Yield
Total Expense Ratio
Regular
Direct
: 2.54
: 3.27
: 10.03
: 0.87%
: 0.48%
years
Plans Available
Regular
Direct
SBI Corporate Bond FundThis product is suitable for investors who are seeking^:
• Regular income for medium term
• Predominantly investment in corporate debt securities.
• Low risk. (Blue)
^Investors should consult their financial advisers if in doubt about whether the product is suitable for them.
Note: Risk may be represented as: Investor understand that their principal will be at Low risk. (Blue); Medium risk. (Yellow); High risk. (Brown)
Issuer Name (%) OfTotal AUM
BHARAT ALUMINIUM CO LTD 14.76%
ORIENTAL HOTELS LTD. 14.70%(Indian Hotels group company)
ASHOKA BUILDCON LIMITED 14.57%
STERLING & WILSON PRIVATE LIMITED 14.56%(Shapoorji Pallonji subsidiary)
IFCI LIMITED 13.84%
FULLERTON INDIA CREDIT COMPANY LTD 13.18%
DEWAN HOUSING FINANCE CORPORATION LTD. 10.93%
TOTAL 96.54%
Option NAV (`)
SBI Corporate Bond Fund-Reg Plan-Daily Div 10.0700
SBI Corporate Bond Fund-Reg Plan-Dividend 12.8116
SBI Corporate Bond Fund-Reg Plan-Growth 21.1887
SBI Corporate Bond Fund-Dir Plan-Daily Div 10.0700
SBI Corporate Bond Fund-Dir Plan-Dividend 13.1543
SBI Corporate Bond Fund-Dir Plan-Growth 21.3471
34
SBI Magnum Income Fund - Floating Rate Plan – LTP restructured as SBI Corporate Bond Fund (w.e.f July 17, 2014)
Below AA+
AA+
72.43%
13.18%
10.93%3.46%
81.98
14.56
3.46
0 20 40 60 80 100
NON-CONVERTIBLE DEBENTURE
ZERO COUPON BOND
NCA/CBLO/REVERSE REPO
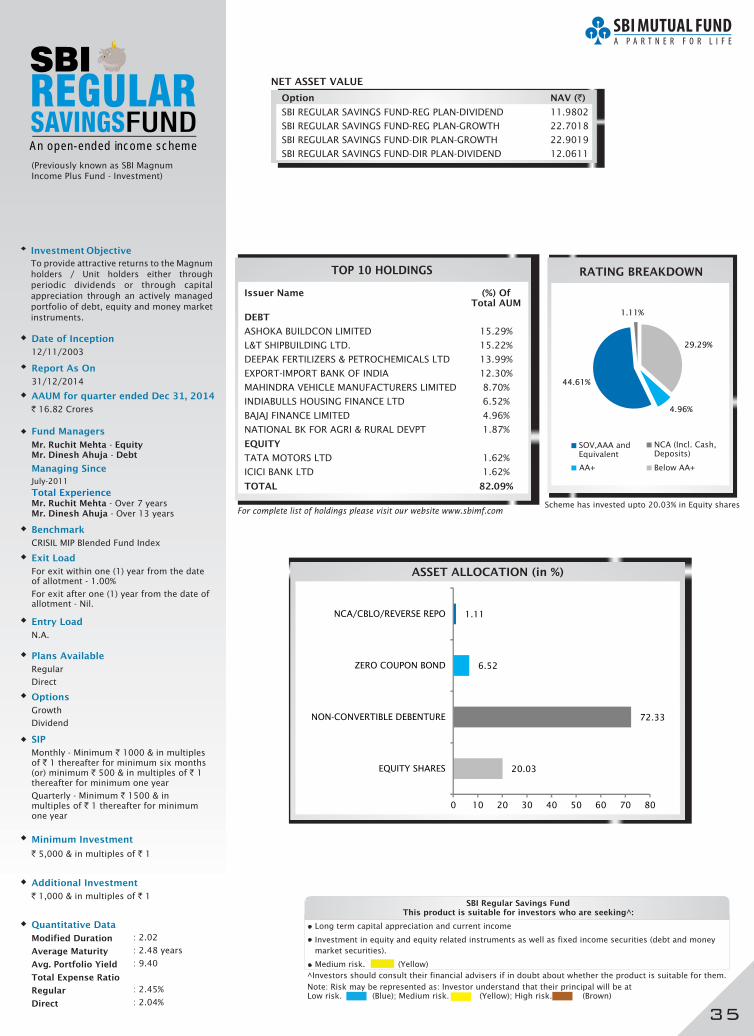
Investment Objective
To provide attractive returns to the Magnum
holders / Unit holders either through
periodic dividends or through capital
appreciation through an actively managed
portfolio of debt, equity and money market
instruments.
Date of Inception
12/11/2003
Fund Managers
Mr. Ruchit Mehta - EquityMr. Dinesh Ahuja - Debt
Managing Since
July-2011
Total ExperienceMr. Ruchit Mehta - Mr. Dinesh Ahuja -
Over 7 years Over 13 years
Entry Load
N.A.
Options
Growth
Dividend
SIP
Monthly - Minimum ` 1000 & in multiples of ` 1 thereafter for minimum six months (or) minimum ` 500 & in multiples of ` 1 thereafter for minimum one year
Quarterly - Minimum ` 1500 & in multiples of ` 1 thereafter for minimum one year
Minimum Investment
` 5,000 & in multiples of ` 1
Exit Load
For exit within one (1) year from the date of allotment - 1.00%
For exit after one (1) year from the date of allotment - Nil.
Additional Investment
` 1,000 & in multiples of ` 1
Benchmark
CRISIL MIP Blended Fund Index
Quantitative Data
Modified Duration
Average Maturity
Avg. Portfolio Yield
Total Expense Ratio
Regular
Direct
: 2.02
: 2.48
: 9.40
: 2.45%
: 2.04%
years
NET ASSET VALUE
Report As On
31/12/2014
TOP 10 HOLDINGS
For complete list of holdings please visit our website www.sbimf.com
RATING BREAKDOWN
ASSET ALLOCATION (in %)
AAUM for quarter ended Dec , 201431
` 16.82 Crores
SOV,AAA andEquivalent
NCA (Incl. Cash,Deposits)
AA+ Below AA+
An open-ended income scheme
(Previously known as SBI Magnum Income Plus Fund - Investment)
Plans Available
Regular
Direct
SBI Regular Savings FundThis product is suitable for investors who are seeking^:
• Long term capital appreciation and current income
• Investment in equity and equity related instruments as well as fixed income securities (debt and money
market securities).
• Medium risk. (Yellow)
^Investors should consult their financial advisers if in doubt about whether the product is suitable for them.
Note: Risk may be represented as: Investor understand that their principal will be at Low risk. (Blue); Medium risk. (Yellow); High risk. (Brown)
Issuer Name (%) OfTotal AUM
DEBT
ASHOKA BUILDCON LIMITED 15.29%
L&T SHIPBUILDING LTD. 15.22%
DEEPAK FERTILIZERS & PETROCHEMICALS LTD 13.99%
EXPORT-IMPORT BANK OF INDIA 12.30%
MAHINDRA VEHICLE MANUFACTURERS LIMITED 8.70%
INDIABULLS HOUSING FINANCE LTD 6.52%
BAJAJ FINANCE LIMITED 4.96%
NATIONAL BK FOR AGRI & RURAL DEVPT 1.87%
EQUITY
TATA MOTORS LTD 1.62%
ICICI BANK LTD 1.62%
TOTAL 82.09%
Option NAV (`)
SBI REGULAR SAVINGS FUND-REG PLAN-DIVIDEND 11.9802
SBI REGULAR SAVINGS FUND-REG PLAN-GROWTH 22.7018
SBI REGULAR SAVINGS FUND-DIR PLAN-GROWTH 22.9019
SBI REGULAR SAVINGS FUND-DIR PLAN-DIVIDEND 12.0611
35
Scheme has investe upto 20.03% in Equity sharesd
29.29%
4.96%
44.61%
1.11%
20.03
72.33
6.52
1.11
0 10 20 30 40 50 60 70 80
EQUITY SHARES
NON-CONVERTIBLE DEBENTURE
ZERO COUPON BOND
NCA/CBLO/REVERSE REPO
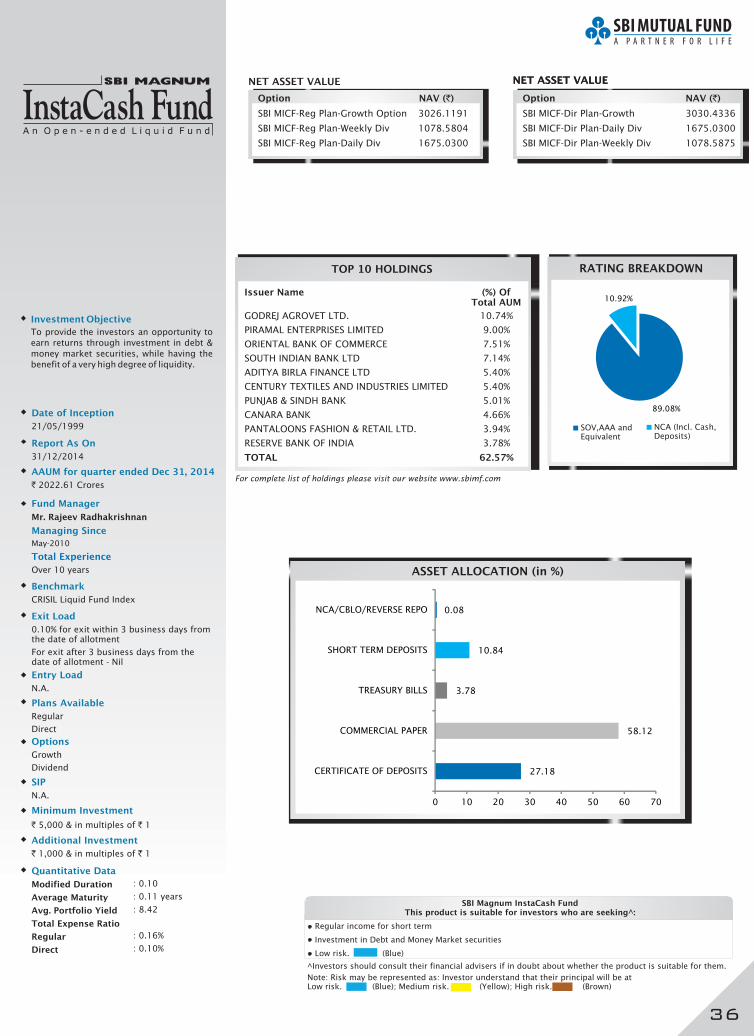
Investment Objective
To provide the investors an opportunity to
earn returns through investment in debt &
money market securities, while having the
benefit of a very high degree of liquidity.
Date of Inception
21/05/1999
Fund Manager
Mr. Rajeev Radhakrishnan
May-2010
Managing Since
Total Experience
Over 10 years
Entry Load
N.A.
Options
Growth
Dividend
SIP
N.A.
Minimum Investment
` 5,000 & in multiples of ` 1
Exit Load
0.10% for exit within 3 business days from the date of allotment
For exit after 3 business days from the date of allotment - Nil
Additional Investment
` 1,000 & in multiples of ` 1
Benchmark
CRISIL Liquid Fund Index
Quantitative Data
Modified Duration
Average Maturity
Avg. Portfolio Yield
Total Expense Ratio
Regular
Direct
: 0.10
: 0.11
: 8.42
: 0.16%
: 0.10%
years
NET ASSET VALUE NET ASSET VALUE
Report As On
31/12/2014
TOP 10 HOLDINGS
For complete list of holdings please visit our website www.sbimf.com
ASSET ALLOCATION (in %)
AAUM for quarter ended Dec , 201431
` 2022.61 Crores
Plans Available
Regular
Direct
RATING BREAKDOWN
SOV,AAA andEquivalent
NCA (Incl. Cash,Deposits)
SBI Magnum InstaCash FundThis product is suitable for investors who are seeking^:
• Regular income for short term
nvestment in Debt and Money Market securities• I
• Low risk. (Blue)
^Investors should consult their financial advisers if in doubt about whether the product is suitable for them.
Note: Risk may be represented as: Investor understand that their principal will be at Low risk. (Blue); Medium risk. (Yellow); High risk. (Brown)
Issuer Name (%) OfTotal AUM
GODREJ AGROVET LTD. 10.74%
PIRAMAL ENTERPRISES LIMITED 9.00%
ORIENTAL BANK OF COMMERCE 7.51%
SOUTH INDIAN BANK LTD 7.14%
ADITYA BIRLA FINANCE LTD 5.40%
CENTURY TEXTILES AND INDUSTRIES LIMITED 5.40%
PUNJAB & SINDH BANK 5.01%
CANARA BANK 4.66%
PANTALOONS FASHION & RETAIL LTD. 3.94%
RESERVE BANK OF INDIA 3.78%
TOTAL 62.57%
Option NAV (`)
SBI MICF-Reg Plan-Growth Option 3026.1191
SBI MICF-Reg Plan-Weekly Div 1078.5804
SBI MICF-Reg Plan-Daily Div 1675.0300
Option NAV (`)
SBI MICF-Dir Plan-Growth 3030.4336
SBI MICF-Dir Plan-Daily Div 1675.0300
SBI MICF-Dir Plan-Weekly Div 1078.5875
NET ASSET VALUE
36
89.08%
10.92%
27.18
58.12
3.78
10.84
0.08
0 10 20 30 40 50 60 70
CERTIFICATE OF DEPOSITS
COMMERCIAL PAPER
TREASURY BILLS
SHORT TERM DEPOSITS
NCA/CBLO/REVERSE REPO
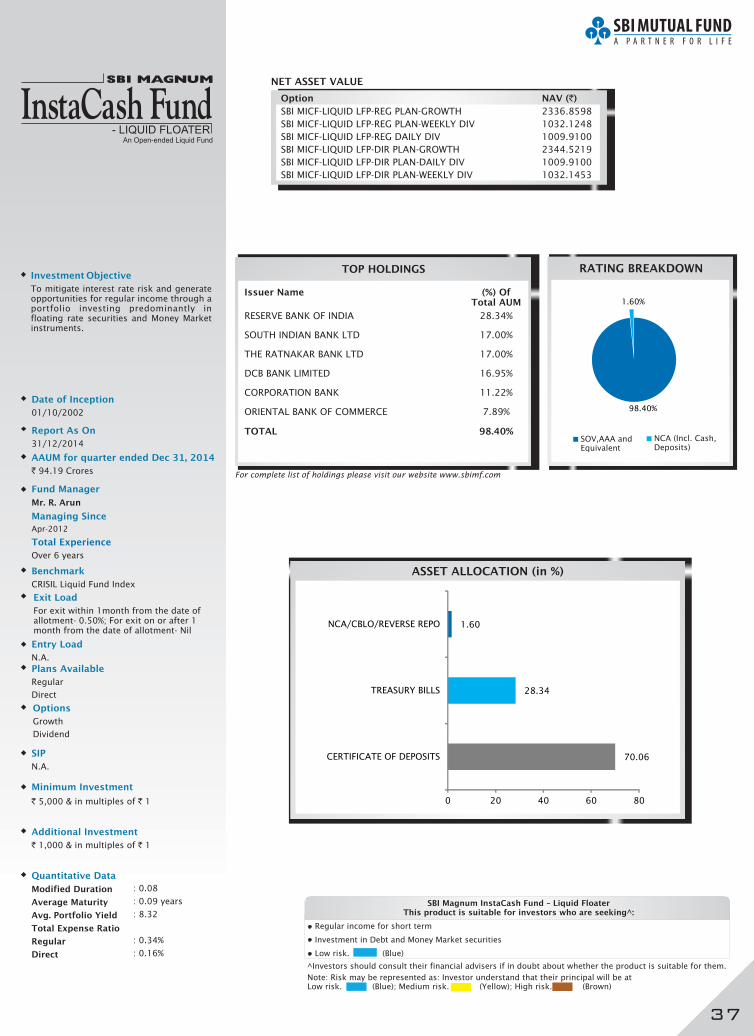
Investment Objective
To mitigate interest rate risk and generate opportunities for regular income through a portfolio investing predominantly in floating rate securities and Money Market instruments.
Date of Inception
01/10/2002
Fund Manager
Mr. R. Arun
Managing Since
Apr-2012
Total Experience
Over 6 years
Entry Load
N.A.
Options
Growth
Dividend
SIP
N.A.
Minimum Investment
` 5,000 & in multiples of ` 1
Exit Load
For exit within 1month from the date of allotment- 0.50%; For exit on or after 1 month from the date of allotment- Nil
Additional Investment
` 1,000 & in multiples of ` 1
Benchmark
CRISIL Liquid Fund Index
Quantitative Data
Modified Duration
Average Maturity
Avg. Portfolio Yield
Total Expense Ratio
Regular
Direct
: 0.08
: 0.09
: 8.32
: 0.34%
: 0.16%
years
Option NAV (`)
SBI MICF-LIQUID LFP-REG PLAN-GROWTH
SBI MICF-LIQUID LFP-REG PLAN-WEEKLY DIV 1032.1248
SBI MICF-LIQUID LFP-REG DAILY DIV 1009.9100
SBI MICF-LIQUID LFP-DIR PLAN-GROWTH 2344.5219
SBI MICF-LIQUID LFP-DIR PLAN-DAILY DIV 1009.9100
SBI MICF-LIQUID LFP-DIR PLAN-WEEKLY DIV 1032.1453
2336.8598
NET ASSET VALUE
Report As On
31/12/2014
TOP HOLDINGS
For complete list of holdings please visit our website www.sbimf.com
RATING BREAKDOWN
ASSET ALLOCATION (in %)
AAUM for quarter ended Dec , 201431
` 94.19 Crores
Plans Available
Regular
Direct
An Open-ended Liquid Fund
SBI Magnum InstaCash Fund – Liquid FloaterThis product is suitable for investors who are seeking^:
• Regular income for short term
nvestment in Debt and Money Market securities• I
• Low risk. (Blue)
^Investors should consult their financial advisers if in doubt about whether the product is suitable for them.
Note: Risk may be represented as: Investor understand that their principal will be at Low risk. (Blue); Medium risk. (Yellow); High risk. (Brown)
Issuer Name (%) OfTotal AUM
RESERVE BANK OF INDIA 28.34%
SOUTH INDIAN BANK LTD 17.00%
THE RATNAKAR BANK LTD 17.00%
DCB BANK LIMITED 16.95%
CORPORATION BANK 11.22%
ORIENTAL BANK OF COMMERCE 7.89%
TOTAL 98.40%SOV,AAA andEquivalent
NCA (Incl. Cash,Deposits)
37
98.40%
1.60%
70.06
28.34
1.60
0 20 40 60 80
CERTIFICATE OF DEPOSITS
TREASURY BILLS
NCA/CBLO/REVERSE REPO
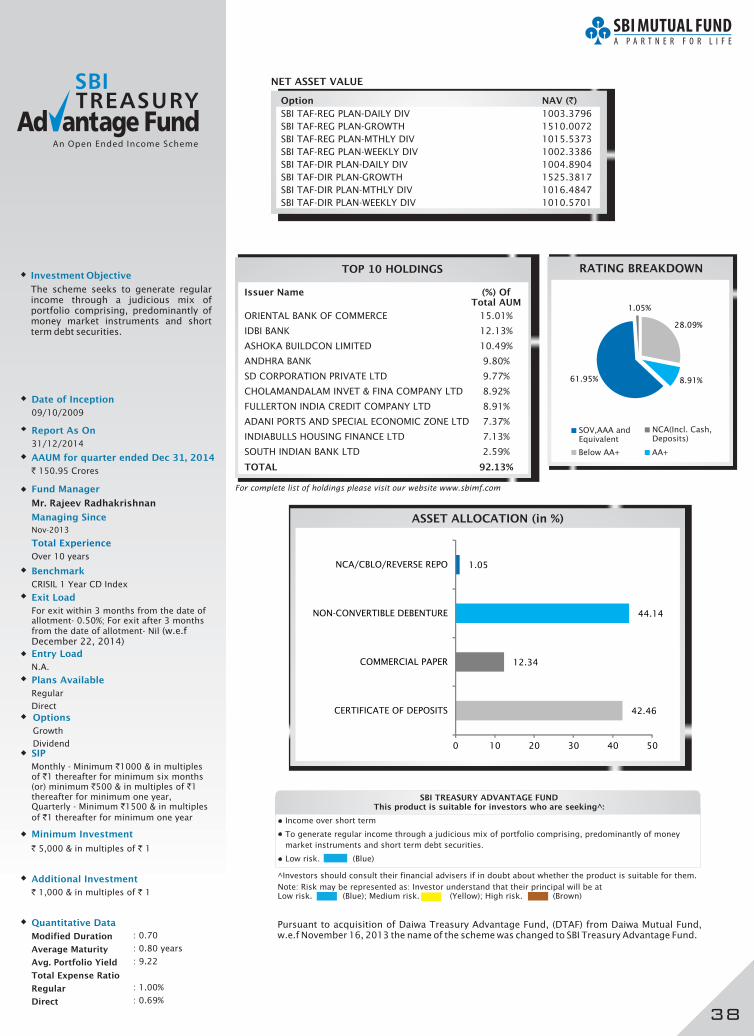
Investment Objective
The scheme seeks to generate regular income through a judicious mix of portfolio comprising, predominantly of money market instruments and short term debt securities.
Date of Inception
09/10/2009
Fund Manager
Mr. Rajeev Radhakrishnan
Managing Since
Nov-2013
Total Experience
Over 10 years
Entry Load
N.A.
Options
Growth
DividendSIP
Monthly - Minimum `1000 & in multiples of `1 thereafter for minimum six months (or) minimum `500 & in multiples of `1 thereafter for minimum one year, Quarterly - Minimum `1500 & in multiples
of `1 thereafter for minimum one year
Minimum Investment
` 5,000 & in multiples of ` 1
Exit Load
For exit within 3 months from the date of allotment- 0.50%; For exit after 3 months from the date of allotment- Nil (w.e.f December 22, 2014)
Additional Investment
` 1,000 & in multiples of ` 1
Benchmark
CRISIL 1 Year CD Index
Quantitative Data
Modified Duration
Average Maturity
Avg. Portfolio Yield
Total Expense Ratio
Regular
Direct
: 0.70
: 0.80 years
: 9.22
: 1.00%
: 0.69%
Option NAV (`)
SBI TAF-REG PLAN-DAILY DIV
SBI TAF-REG PLAN-GROWTH 1510.0072
SBI TAF-REG PLAN-MTHLY DIV 1015.5373
SBI TAF-REG PLAN-WEEKLY DIV 1002.3386
SBI TAF-DIR PLAN-DAILY DIV 1004.8904
SBI TAF-DIR PLAN-GROWTH 1525.3817
SBI TAF-DIR PLAN-MTHLY DIV 1016.4847
SBI TAF-DIR PLAN-WEEKLY DIV 1010.5701
1003.3796
NET ASSET VALUE
Report As On
31/12/2014
TOP 10 HOLDINGS
For complete list of holdings please visit our website www.sbimf.com
RATING BREAKDOWN
ASSET ALLOCATION (in %)
AAUM for quarter ended Dec , 201431
` 150.95 Crores
Plans Available
Regular
Direct
Issuer Name (%) OfTotal AUM
ORIENTAL BANK OF COMMERCE 15.01%
IDBI BANK 12.13%
ASHOKA BUILDCON LIMITED 10.49%
ANDHRA BANK 9.80%
SD CORPORATION PRIVATE LTD 9.77%
CHOLAMANDALAM INVET & FINA COMPANY LTD 8.92%
FULLERTON INDIA CREDIT COMPANY LTD 8.91%
ADANI PORTS AND SPECIAL ECONOMIC ZONE LTD 7.37%
INDIABULLS HOUSING FINANCE LTD 7.13%
SOUTH INDIAN BANK LTD 2.59%
TOTAL 92.13%
SBI TREASURY ADVANTAGE FUNDThis product is suitable for investors who are seeking^:
• Income over short term
• To generate regular income through a judicious mix of portfolio comprising, predominantly of money
market instruments and short term debt securities.
Low risk. (Blue)
^Investors should consult their financial advisers if in doubt about whether the product is suitable for them.
Note: Risk may be represented as: Investor understand that their principal will be at Low risk. (Blue); Medium risk. (Yellow); High risk. (Brown)
38
Pursuant to acquisition of Daiwa Treasury Advantage Fund, (DTAF) from Daiwa Mutual Fund, the name of the scheme was changed to SBI Treasury Advantage Fund.w.e.f November 16, 2013
SOV,AAA andEquivalent
NCA(Incl. Cash, Deposits)
Below AA+ AA+
28.09%
8.91%61.95%
1.05%
42.46
12.34
44.14
1.05
0 10 20 30 40 50
CERTIFICATE OF DEPOSITS
COMMERCIAL PAPER
NON-CONVERTIBLE DEBENTURE
NCA/CBLO/REVERSE REPO
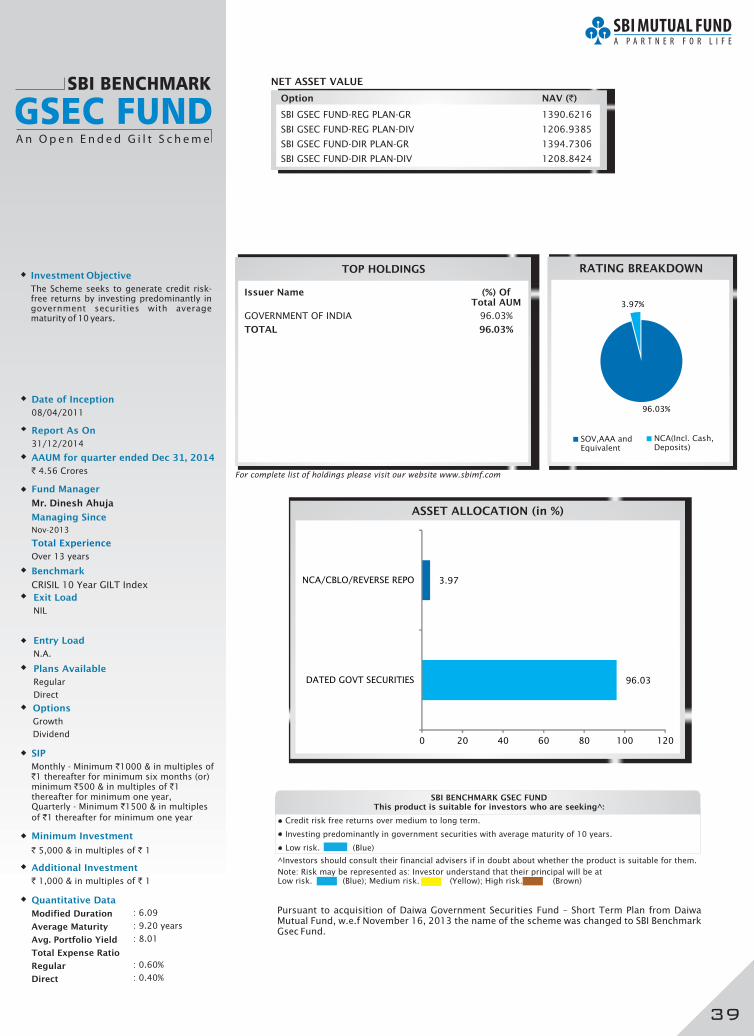
Investment Objective
The Scheme seeks to generate credit risk-free returns by investing predominantly in government securities with average maturity of 10 years.
Date of Inception
08/04/2011
Fund Manager
Mr. Dinesh Ahuja
Managing Since
Nov-2013
Total Experience
Over 13 years
Entry Load
N.A.
Options
Growth
Dividend
SIP
Monthly - Minimum `1000 & in multiples of `1 thereafter for minimum six months (or) minimum `500 & in multiples of `1 thereafter for minimum one year, Quarterly - Minimum `1500 & in multiples
of `1 thereafter for minimum one year
Minimum Investment
` 5,000 & in multiples of ` 1
Exit Load
NIL
Additional Investment
` 1,000 & in multiples of ` 1
Benchmark
CRISIL 10 Year GILT Index
Quantitative Data
Modified Duration
Average Maturity
Avg. Portfolio Yield
Total Expense Ratio
Regular
Direct
: 6.09
: 9.20 years
: 8.01
: 0.60%
: 0.40%
Option NAV (`)
SBI GSEC FUND-REG PLAN-GR
SBI GSEC FUND-REG PLAN-DIV 1206.9385
SBI GSEC FUND-DIR PLAN-GR 1394.7306
SBI GSEC FUND-DIR PLAN-DIV 1208.8424
1390.6216
NET ASSET VALUE
Report As On
31/12/2014
TOP HOLDINGS
For complete list of holdings please visit our website www.sbimf.com
RATING BREAKDOWN
ASSET ALLOCATION (in %)
AAUM for quarter ended Dec , 201431
` 4.56 Crores
Plans Available
Regular
Direct
Issuer Name (%) OfTotal AUM
GOVERNMENT OF INDIA 96.03%
TOTAL 96.03%
SBI BENCHMARK GSEC FUNDThis product is suitable for investors who are seeking^:
• Credit risk free returns over medium to long term.
• Investing predominantly in government securities with average maturity of 10 years.
• Low risk. (Blue)
^Investors should consult their financial advisers if in doubt about whether the product is suitable for them.
Note: Risk may be represented as: Investor understand that their principal will be at Low risk. (Blue); Medium risk. (Yellow); High risk. (Brown)
SOV,AAA andEquivalent
NCA(Incl. Cash, Deposits)
39
Pursuant to acquisition of Daiwa Government Securities Fund – Short Term Plan from Daiwa Mutual Fund, the name of the scheme was changed to SBI Benchmark Gsec Fund.
w.e.f November 16, 2013
96.03%
3.97%
96.03
3.97
0 20 40 60 80 100 120
DATED GOVT SECURITIES
NCA/CBLO/REVERSE REPO
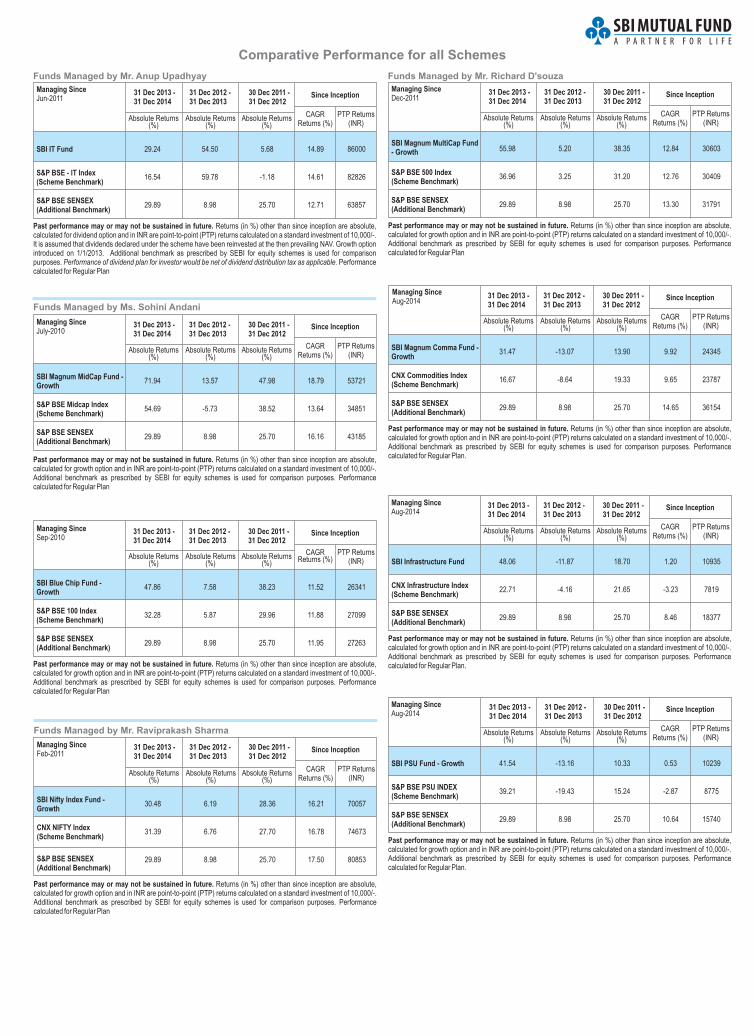
Comparative Performance for all Schemes
Since Inception
SBI Magnum Comma Fund -Growth
Absolute Returns (%)
CAGRReturns (%)
PTP Returns(INR)
CNX Commodities Index (Scheme Benchmark)
S&P BSE SENSEX(Additional Benchmark)
Absolute Returns (%)
Absolute Returns (%)
Past performance may or may not be sustained in future. Returns (in %) other than since inception are absolute, calculated for growth option and in INR are point-to-point (PTP) returns calculated on a standard investment of 10,000/-. Additional benchmark as prescribed by SEBI for equity schemes is used for comparison purposes. Performance calculated for Regular Plan.
Managing SinceAug-2014
31.47 -13.07 13.90 9.92 24345
16.67 -8.64 19.33 9.65 23787
29.89 8.98 25.70 14.65 36154
31 Dec 2013 - 31 Dec 2012 - 30 Dec 2011 -31 Dec 2014 31 Dec 2013 31 Dec 2012
Since Inception
SBI Infrastructure Fund
Absolute Returns (%)
CAGRReturns (%)
PTP Returns(INR)
CNX Infrastructure Index (Scheme Benchmark)
S&P BSE SENSEX (Additional Benchmark)
Absolute Returns (%)
Absolute Returns (%)
Past performance may or may not be sustained in future. Returns (in %) other than since inception are absolute, calculated for growth option and in INR are point-to-point (PTP) returns calculated on a standard investment of 10,000/-. Additional benchmark as prescribed by SEBI for equity schemes is used for comparison purposes. Performance calculated for Regular Plan.
Managing SinceAug-2014
48.06 -11.87 18.70 1.20 10935
22.71 -4.16 21.65 -3.23 7819
29.89 8.98 25.70 8.46 18377
31 Dec 2013 - 31 Dec 2012 - 30 Dec 2011 -31 Dec 2014 31 Dec 2013 31 Dec 2012
Since Inception
SBI PSU Fund - Growth
Absolute Returns (%)
CAGRReturns (%)
PTP Returns(INR)
S&P BSE PSU INDEX (Scheme Benchmark)
S&P BSE SENSEX (Additional Benchmark)
Absolute Returns (%)
Absolute Returns (%)
Past performance may or may not be sustained in future. Returns (in %) other than since inception are absolute, calculated for growth option and in INR are point-to-point (PTP) returns calculated on a standard investment of 10,000/-. Additional benchmark as prescribed by SEBI for equity schemes is used for comparison purposes. Performance calculated for Regular Plan.
Managing SinceAug-2014
41.54 -13.16 10.33 0.53 10239
39.21 -19.43 15.24 -2.87 8775
29.89 8.98 25.70 10.64 15740
31 Dec 2013 - 31 Dec 2012 - 30 Dec 2011 -31 Dec 2014 31 Dec 2013 31 Dec 2012
Since Inception
SBI Magnum MidCap Fund -Growth
Absolute Returns (%)
CAGRReturns (%)
PTP Returns(INR)
S&P BSE Midcap Index (Scheme Benchmark)
S&P BSE SENSEX (Additional Benchmark)
Absolute Returns (%)
Absolute Returns (%)
Past performance may or may not be sustained in future. Returns (in %) other than since inception are absolute, calculated for growth option and in INR are point-to-point (PTP) returns calculated on a standard investment of 10,000/-. Additional benchmark as prescribed by SEBI for equity schemes is used for comparison purposes. Performance calculated for Regular Plan
Since Inception
SBI Blue Chip Fund -Growth
Absolute Returns (%)
CAGR Returns (%)
PTP Returns(INR)
S&P (Scheme Benchmark)
BSE 100 Index
S&P BSE SENSEX (Additional Benchmark)
Absolute Returns (%)
Absolute Returns (%)
Past performance may or may not be sustained in future. Returns (in %) other than since inception are absolute, calculated for growth option and in INR are point-to-point (PTP) returns calculated on a standard investment of 10,000/-. Additional benchmark as prescribed by SEBI for equity schemes is used for comparison purposes. Performance calculated for Regular Plan
Since Inception
SBI Nifty Index Fund -Growth
Absolute Returns (%)
CAGRReturns (%)
PTP Returns(INR)
CNX NIFTY Index (Scheme Benchmark)
S&P BSE SENSEX (Additional Benchmark)
Absolute Returns (%)
Absolute Returns (%)
Past performance may or may not be sustained in future. Returns (in %) other than since inception are absolute, calculated for growth option and in INR are point-to-point (PTP) returns calculated on a standard investment of 10,000/-. Additional benchmark as prescribed by SEBI for equity schemes is used for comparison purposes. Performance calculated for Regular Plan
Funds Managed by Mr. Raviprakash Sharma
Managing SinceFeb-2011
Managing SinceJuly-2010
Managing SinceSep-2010
Funds Managed by Ms. Sohini Andani
30.48 6.19 28.36 16.21 70057
31.39 6.76 27.70 16.78 74673
29.89 8.98 25.70 17.50 80853
47.86 7.58 38.23 11.52 26341
32.28 5.87 29.96 11.88 27099
29.89 8.98 25.70 11.95 27263
71.94 13.57 47.98 18.79 53721
54.69 -5.73 38.52 13.64 34851
29.89 8.98 25.70 16.16 43185
31 Dec 2013 - 31 Dec 2012 - 30 Dec 2011 -31 Dec 2014 31 Dec 2013 31 Dec 2012
31 Dec 2013 - 31 Dec 2012 - 30 Dec 2011 -31 Dec 2014 31 Dec 2013 31 Dec 2012
31 Dec 2013 - 31 Dec 2012 - 30 Dec 2011 -31 Dec 2014 31 Dec 2013 31 Dec 2012
Funds Managed by Mr. Anup Upadhyay
Since Inception
SBI IT Fund
Absolute Returns (%)
CAGRReturns (%)
PTP Returns(INR)
S&P (Scheme Benchmark)
BSE - IT Index
S&P BSE SENSEX (Additional Benchmark)
Absolute Returns (%)
Absolute Returns (%)
Past performance may or may not be sustained in future. Returns (in %) other than since inception are absolute, calculated for dividend option and in INR are point-to-point (PTP) returns calculated on a standard investment of 10,000/-. It is assumed that dividends declared under the scheme have been reinvested at the then prevailing NAV. Growth option introduced on 1/1/2013. Additional benchmark as prescribed by SEBI for equity schemes is used for comparison purposes. Performance of dividend plan for investor would be net of dividend distribution tax as applicable. Performance calculated for Regular Plan
Managing SinceJun-2011
31 Dec 2013 - 31 Dec 2012 - 30 Dec 2011 -31 Dec 2014 31 Dec 2013 31 Dec 2012
Funds Managed by Mr. Richard D'souza
Since Inception
SBI Magnum MultiCap Fund- Growth
Absolute Returns (%)
CAGRReturns (%)
PTP Returns(INR)
S&P (Scheme Benchmark)
BSE 500 Index
S&P BSE SENSEX(Additional Benchmark)
Absolute Returns (%)
Absolute Returns (%)
Past performance may or may not be sustained in future. Returns (in %) other than since inception are absolute, calculated for growth option and in INR are point-to-point (PTP) returns calculated on a standard investment of 10,000/-. Additional benchmark as prescribed by SEBI for equity schemes is used for comparison purposes. Performance calculated for Regular Plan
Managing SinceDec-2011
31 Dec 2013 - 31 Dec 2012 - 30 Dec 2011 -31 Dec 2014 31 Dec 2013 31 Dec 2012
55.98 5.20 38.35 12.84 30603
36.96 3.25 31.20 12.76 30409
29.89 8.98 25.70 13.30 31791
29.24 54.50 5.68 14.89 86000
16.54 59.78 -1.18 14.61 82826
29.89 8.98 25.70 12.71 63857
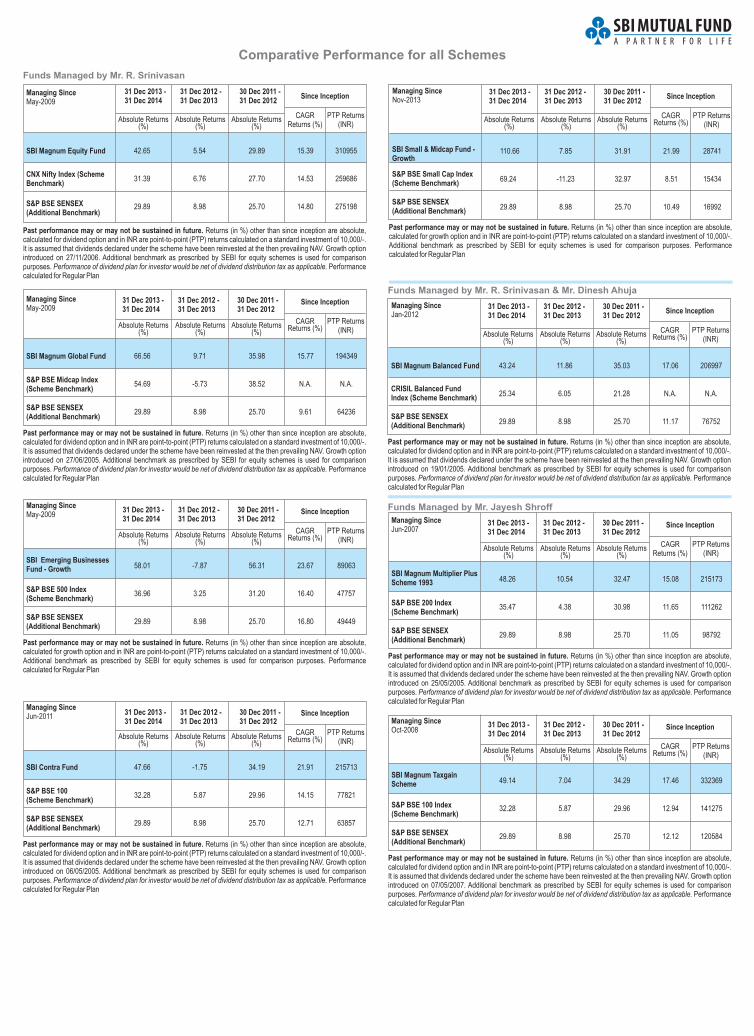
Comparative Performance for all Schemes
Funds Managed by Mr. R. Srinivasan
Since Inception
Absolute Returns (%)
CAGRReturns (%)
PTP Returns(INR)
Absolute(%)
Returns Absolute(%)
Returns
SBI Magnum Equity Fund
CNX Nifty Index (Scheme Benchmark)
S&P BSE SENSEX (Additional Benchmark)
Past performance may or may not be sustained in future. Returns (in %) other than since inception are absolute, calculated for dividend option and in INR are point-to-point (PTP) returns calculated on a standard investment of 10,000/-. It is assumed that dividends declared under the scheme have been reinvested at the then prevailing NAV. Growth option introduced on 27/11/2006. Additional benchmark as prescribed by SEBI for equity schemes is used for comparison purposes. Performance of dividend plan for investor would be net of dividend distribution tax as applicable. Performance calculated for Regular Plan
Since Inception
SBI Magnum Global Fund
Absolute(%)
Returns CAGR Returns (%)
PTP Returns(INR)
S&P BSE Midcap Index (Scheme Benchmark)
S&P BSE SENSEX (Additional Benchmark)
Absolute (%)
Returns Absolute(%)
Returns
Past performance may or may not be sustained in future. Returns (in %) other than since inception are absolute, calculated for dividend option and in INR are point-to-point (PTP) returns calculated on a standard investment of 10,000/-. It is assumed that dividends declared under the scheme have been reinvested at the then prevailing NAV. Growth option introduced on 27/06/2005. Additional benchmark as prescribed by SEBI for equity schemes is used for comparison purposes. Performance of dividend plan for investor would be net of dividend distribution tax as applicable. Performance calculated for Regular Plan
Since Inception
SBI Emerging Businesses Fund - Growth
Absolute(%)
Returns CAGR Returns (%)
PTP Returns(INR)
S&P (Scheme Benchmark)
BSE 500 Index
S&P BSE SENSEX(Additional Benchmark)
Absolute(%)
Returns Absolute(%)
Returns
Past performance may or may not be sustained in future. Returns (in %) other than since inception are absolute, calculated for growth option and in INR are point-to-point (PTP) returns calculated on a standard investment of 10,000/-. Additional benchmark as prescribed by SEBI for equity schemes is used for comparison purposes. Performance calculated for Regular Plan
Since Inception
SBI Contra Fund
Absolute(%)
Returns CAGR Returns (%)
PTP Returns(INR)
S&P (
BSE 100 Scheme Benchmark)
S&P BSE SENSEX(Additional Benchmark)
Absolute(%)
Returns Absolute(%)
Returns
Past performance may or may not be sustained in future. Returns (in %) other than since inception are absolute, calculated for dividend option and in INR are point-to-point (PTP) returns calculated on a standard investment of 10,000/-. It is assumed that dividends declared under the scheme have been reinvested at the then prevailing NAV. Growth option introduced on 06/05/2005. Additional benchmark as prescribed by SEBI for equity schemes is used for comparison purposes. Performance of dividend plan for investor would be net of dividend distribution tax as applicable. Performance calculated for Regular Plan
Managing SinceMay-2009
Managing SinceMay-2009
Managing SinceMay-2009
Managing SinceJun-2011
42.65 5.54 29.89 15.39 310955
31.39 6.76 27.70 14.53 259686
29.89 8.98 25.70 14.80 275198
66.56 9.71 35.98 15.77 194349
54.69 -5.73 38.52 N.A. N.A.
29.89 8.98 25.70 9.61 64236
58.01 -7.87 56.31 23.67 89063
36.96 3.25 31.20 16.40 47757
29.89 8.98 25.70 16.80 49449
47.66 -1.75 34.19 21.91 215713
32.28 5.87 29.96 14.15 77821
29.89 8.98 25.70 12.71 63857
31 Dec 2013 - 31 Dec 2012 - 30 Dec 2011 -31 Dec 2014 31 Dec 2013 31 Dec 2012
31 Dec 2013 - 31 Dec 2012 - 30 Dec 2011 -31 Dec 2014 31 Dec 2013 31 Dec 2012
31 Dec 2013 - 31 Dec 2012 - 30 Dec 2011 -31 Dec 2014 31 Dec 2013 31 Dec 2012
31 Dec 2013 - 31 Dec 2012 - 30 Dec 2011 -31 Dec 2014 31 Dec 2013 31 Dec 2012
Since Inception
SBI Magnum Multiplier Plus Scheme 1993
Absolute(%)
Returns CAGRReturns (%)
PTP Returns(INR)
S&P (Scheme Benchmark)
BSE 200 Index
S&P BSE SENSEX(Additional Benchmark)
Absolute(%)
Returns Absolute(%)
Returns
Past performance may or may not be sustained in future. Returns (in %) other than since inception are absolute, calculated for dividend option and in INR are point-to-point (PTP) returns calculated on a standard investment of 10,000/-. It is assumed that dividends declared under the scheme have been reinvested at the then prevailing NAV. Growth option introduced on 25/05/2005. Additional benchmark as prescribed by SEBI for equity schemes is used for comparison purposes. Performance of dividend plan for investor would be net of dividend distribution tax as applicable. Performance calculated for Regular Plan
Funds Managed by Mr. Jayesh Shroff
Since Inception
SBI Magnum Taxgain Scheme
Absolute(%)
Returns CAGR Returns (%)
PTP Returns(INR)
S&P (Scheme Benchmark)
BSE 100 Index
S&P BSE SENSEX (Additional Benchmark)
Absolute(%)
Returns Absolute(%)
Returns
Past performance may or may not be sustained in future. Returns (in %) other than since inception are absolute, calculated for dividend option and in INR are point-to-point (PTP) returns calculated on a standard investment of 10,000/-. It is assumed that dividends declared under the scheme have been reinvested at the then prevailing NAV. Growth option introduced on 07/05/2007. Additional benchmark as prescribed by SEBI for equity schemes is used for comparison purposes. Performance of dividend plan for investor would be net of dividend distribution tax as applicable. Performance calculated for Regular Plan
Since Inception
SBI Magnum Balanced Fund
Absolute(%)
Returns CAGR Returns (%)
PTP Returns(INR)
CRISIL Balanced Fund Index (Scheme Benchmark)
S&P BSE SENSEX (Additional Benchmark)
Absolute(%)
Returns Absolute(%)
Returns
Past performance may or may not be sustained in future. Returns (in %) other than since inception are absolute, calculated for dividend option and in INR are point-to-point (PTP) returns calculated on a standard investment of 10,000/-. It is assumed that dividends declared under the scheme have been reinvested at the then prevailing NAV. Growth option introduced on 19/01/2005. Additional benchmark as prescribed by SEBI for equity schemes is used for comparison purposes. Performance of dividend plan for investor would be net of dividend distribution tax as applicable. Performance calculated for Regular Plan
Funds Managed by Mr. R. Srinivasan & Mr. Dinesh Ahuja
Managing SinceJan-2012
Managing SinceJun-2007
Managing SinceOct-2008
43.24 11.86 35.03 17.06 206997
25.34 6.05 21.28 N.A. N.A.
29.89 8.98 25.70 11.17 76752
48.26 10.54 32.47 15.08 215173
35.47 4.38 30.98 11.65 111262
29.89 8.98 25.70 11.05 98792
49.14 7.04 34.29 17.46 332369
32.28 5.87 29.96 12.94 141275
29.89 8.98 25.70 12.12 120584
31 Dec 2013 - 31 Dec 2012 - 30 Dec 2011 -31 Dec 2014 31 Dec 2013 31 Dec 2012
31 Dec 2013 - 31 Dec 2012 - 30 Dec 2011 -31 Dec 2014 31 Dec 2013 31 Dec 2012
31 Dec 2013 - 31 Dec 2012 - 30 Dec 2011 -31 Dec 2014 31 Dec 2013 31 Dec 2012
Since Inception
Absolute(%)
Returns CAGR Returns (%)
PTP Returns(INR)
S&P BSE Small Cap Index (Scheme Benchmark)
S&P BSE SENSEX (Additional Benchmark)
Absolute(%)
Returns Absolute(%)
Returns
Past performance may or may not be sustained in future. Returns (in %) other than since inception are absolute, calculated for growth option and in INR are point-to-point (PTP) returns calculated on a standard investment of 10,000/-. Additional benchmark as prescribed by SEBI for equity schemes is used for comparison purposes. Performance calculated for Regular Plan
Managing SinceNov-2013
110.66 7.85 31.91 21.99 28741
69.24 -11.23 32.97 8.51 15434
29.89 8.98 25.70 10.49 16992
31 Dec 2013 - 31 Dec 2012 - 30 Dec 2011 -31 Dec 2014 31 Dec 2013 31 Dec 2012
SBI Small & Midcap Fund - Growth
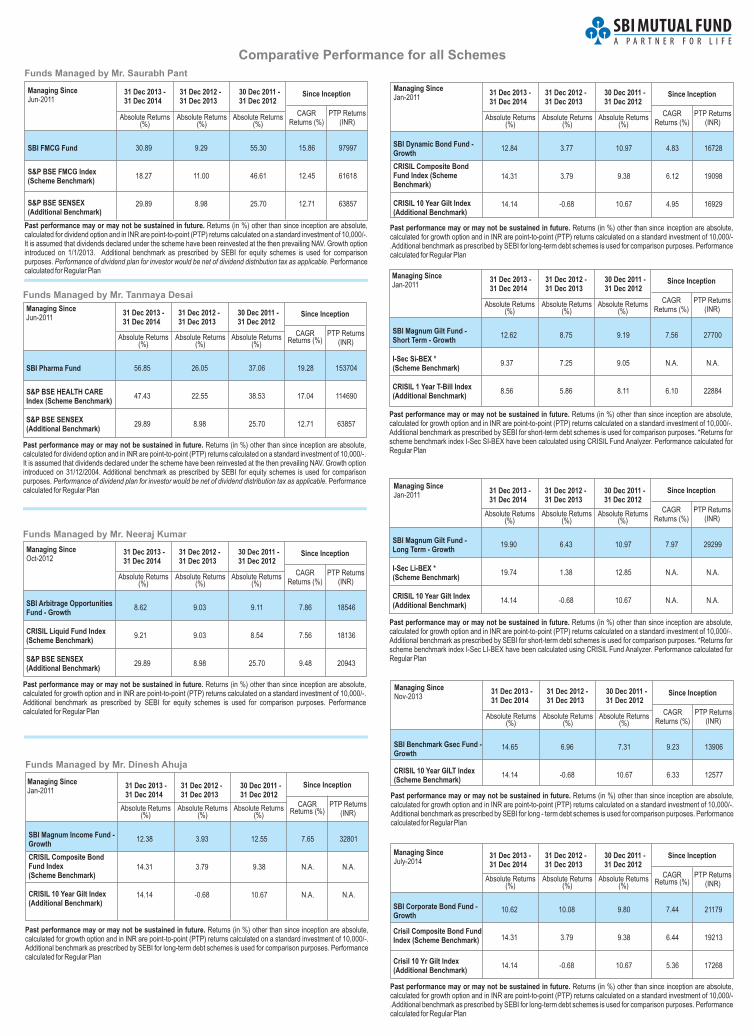
Comparative Performance for all Schemes
Since Inception
SBI Pharma Fund
Absolute Returns (%)
CAGR Returns (%)
PTP Returns(INR)
S&P Index (Scheme Benchmark)
BSE HEALTH CARE
S&P BSE SENSEX(Additional Benchmark)
Absolute Returns (%)
Absolute Returns (%)
Past performance may or may not be sustained in future. Returns (in %) other than since inception are absolute, calculated for dividend option and in INR are point-to-point (PTP) returns calculated on a standard investment of 10,000/-. It is assumed that dividends declared under the scheme have been reinvested at the then prevailing NAV. Growth option introduced on 31/12/2004. Additional benchmark as prescribed by SEBI for equity schemes is used for comparison purposes. Performance of dividend plan for investor would be net of dividend distribution tax as applicable. Performance calculated for Regular Plan
Funds Managed by Mr. Tanmaya Desai
Managing SinceJun-2011
Since Inception
SBI Arbitrage Opportunities Fund - Growth
Absolute Returns (%)
CAGRReturns (%)
PTP Returns(INR)
CRISIL Liquid Fund Index (Scheme Benchmark)
S&P BSE SENSEX (Additional Benchmark)
Absolute Returns (%)
Absolute Returns (%)
Past performance may or may not be sustained in future. Returns (in %) other than since inception are absolute, calculated for growth option and in INR are point-to-point (PTP) returns calculated on a standard investment of 10,000/-. Additional benchmark as prescribed by SEBI for equity schemes is used for comparison purposes. Performance calculated for Regular Plan
Funds Managed by Mr. Neeraj Kumar
Managing SinceOct-2012
Funds Managed by Mr. Dinesh Ahuja
Since Inception
SBI Magnum Income Fund -Growth
Absolute Returns (%)
CAGR Returns (%)
PTP Returns(INR)
CRISIL Composite Bond Fund Index (Scheme Benchmark)
CRISIL 10 Year Gilt Index(Additional Benchmark)
Absolute Returns (%)
Absolute Returns (%)
Past performance may or may not be sustained in future. Returns (in %) other than since inception are absolute, calculated for growth option and in INR are point-to-point (PTP) returns calculated on a standard investment of 10,000/-. Additional benchmark as prescribed by SEBI for long-term debt schemes is used for comparison purposes. Performance calculated for Regular Plan
Managing SinceJan-2011
56.85 26.05 37.06 19.28 153704
47.43 22.55 38.53 17.04 114690
29.89 8.98 25.70 12.71 63857
12.38 3.93 12.55 7.65 32801
14.31 3.79 9.38 N.A. N.A.
14.14 -0.68 10.67 N.A. N.A.
31 Dec 2013 - 31 Dec 2012 - 30 Dec 2011 -31 Dec 2014 31 Dec 2013 31 Dec 2012
31 Dec 2013 - 31 Dec 2012 - 30 Dec 2011 -31 Dec 2014 31 Dec 2013 31 Dec 2012
31 Dec 2013 - 31 Dec 2012 - 30 Dec 2011 -31 Dec 2014 31 Dec 2013 31 Dec 2012
Since Inception
SBI Dynamic Bond Fund -Growth
Absolute Returns (%)
CAGRReturns (%)
PTP Returns(INR)
CRISIL Composite Bond Fund Index (Scheme Benchmark)
CRISIL 10 Year Gilt Index (Additional Benchmark)
Absolute Returns (%)
Absolute Returns (%)
Past performance may or may not be sustained in future. Returns (in %) other than since inception are absolute, calculated for growth option and in INR are point-to-point (PTP) returns calculated on a standard investment of 10,000/-.Additional benchmark as prescribed by SEBI for long-term debt schemes is used for comparison purposes. Performance calculated for Regular Plan
Managing SinceJan-2011
12.84 3.77 10.97 4.83 16728
14.31 3.79 9.38 6.12 19098
14.14 -0.68 10.67 4.95 16929
31 Dec 2013 - 31 Dec 2012 - 30 Dec 2011 -31 Dec 2014 31 Dec 2013 31 Dec 2012
Since Inception
SBI Magnum Gilt Fund - Long Term - Growth
Absolute Returns (%)
CAGRReturns (%)
PTP Returns(INR)
I-Sec Li-BEX * (Scheme Benchmark)
CRISIL 10 Year Gilt Index (Additional Benchmark)
Absolute Returns (%)
Absolute Returns (%)
Past performance may or may not be sustained in future. Returns (in %) other than since inception are absolute, calculated for growth option and in INR are point-to-point (PTP) returns calculated on a standard investment of 10,000/-. Additional benchmark as prescribed by SEBI for short-term debt schemes is used for comparison purposes. *Returns for scheme benchmark index I-Sec LI-BEX have been calculated using CRISIL Fund Analyzer. Performance calculated for Regular Plan
Since Inception
SBI Magnum Gilt Fund - Short Term - Growth
Absolute Returns (%)
CAGRReturns (%)
PTP Returns(INR)
I-Sec Si-BEX * (Scheme Benchmark)
CRISIL 1 Year T-Bill Index (Additional Benchmark)
Absolute Returns (%)
Absolute Returns (%)
Past performance may or may not be sustained in future. Returns (in %) other than since inception are absolute, calculated for growth option and in INR are point-to-point (PTP) returns calculated on a standard investment of 10,000/-. Additional benchmark as prescribed by SEBI for short-term debt schemes is used for comparison purposes. *Returns for scheme benchmark index I-Sec SI-BEX have been calculated using CRISIL Fund Analyzer. Performance calculated for Regular Plan
Managing SinceJan-2011
Managing SinceJan-2011
12.62 8.75 9.19 7.56 27700
9.37 7.25 9.05 N.A. N.A.
8.56 5.86 8.11 6.10 22884
19.90 6.43 10.97 7.97 29299
19.74 1.38 12.85 N.A. N.A.
14.14 -0.68 10.67 N.A. N.A.
31 Dec 2013 - 31 Dec 2012 - 30 Dec 2011 -31 Dec 2014 31 Dec 2013 31 Dec 2012
31 Dec 2013 - 31 Dec 2012 - 30 Dec 2011 -31 Dec 2014 31 Dec 2013 31 Dec 2012
Since Inception
SBI Benchmark Gsec Fund - Growth
Absolute Returns (%)
CAGRReturns (%)
PTP Returns(INR)
CRISIL 10 Year GILT Index (Scheme Benchmark)
Absolute Returns (%)
Absolute Returns (%)
Past performance may or may not be sustained in future. Returns (in %) other than since inception are absolute, calculated for growth option and in INR are point-to-point (PTP) returns calculated on a standard investment of 10,000/-. Additional benchmark as prescribed by SEBI for long - term debt schemes is used for comparison purposes. Performance calculated for Regular Plan
Managing SinceNov-2013
14.65 6.96 7.31 9.23 13906
14.14 -0.68 10.67 6.33 12577
31 Dec 2013 - 31 Dec 2012 - 30 Dec 2011 -31 Dec 2014 31 Dec 2013 31 Dec 2012
Past performance may or may not be sustained in future. Returns (in %) other than since inception are absolute, calculated for dividend option and in INR are point-to-point (PTP) returns calculated on a standard investment of 10,000/-. It is assumed that dividends declared under the scheme have been reinvested at the then prevailing NAV. Growth option introduced on 1/1/2013. Additional benchmark as prescribed by SEBI for equity schemes is used for comparison purposes. Performance of dividend plan for investor would be net of dividend distribution tax as applicable. Performance calculated for Regular Plan
Funds Managed by Mr. Saurabh Pant
Since Inception
SBI FMCG Fund
Absolute Returns (%)
CAGRReturns (%)
PTP Returns(INR)
S&P (Scheme Benchmark)
BSE FMCG Index
S&P BSE SENSEX (Additional Benchmark)
Absolute Returns (%)
Absolute Returns (%)
Managing SinceJun-2011
30.89 9.29 55.30 15.86 97997
18.27 11.00 46.61 12.45 61618
29.89 8.98 25.70 12.71 63857
31 Dec 2013 - 31 Dec 2012 - 30 Dec 2011 -31 Dec 2014 31 Dec 2013 31 Dec 2012
Since Inception
Absolute Returns (%)
CAGR Returns (%)
PTP Returns(INR)
Absolute Returns (%)
Absolute Returns (%)
Past performance may or may not be sustained in future. Returns (in %) other than since inception are absolute, calculated for growth option and in INR are point-to-point (PTP) returns calculated on a standard investment of 10,000/-.Additional benchmark as prescribed by SEBI for long-term debt schemes is used for comparison purposes. Performance calculated for Regular Plan
SBI Corporate Bond Fund - Growth
Crisil Composite Bond Fund Index (Scheme Benchmark)
Crisil 10 Yr Gilt Index (Additional Benchmark)
Managing SinceJuly-2014
10.62 10.08 9.80 7.44 21179
14.31 3.79 9.38 6.44 19213
14.14 -0.68 10.67 5.36 17268
31 Dec 2013 - 31 Dec 2012 - 30 Dec 2011 -31 Dec 2014 31 Dec 2013 31 Dec 2012
8.62 9.03 9.11 7.86 18546
9.21 9.03 8.54 7.56 18136
29.89 8.98 25.70 9.48 20943
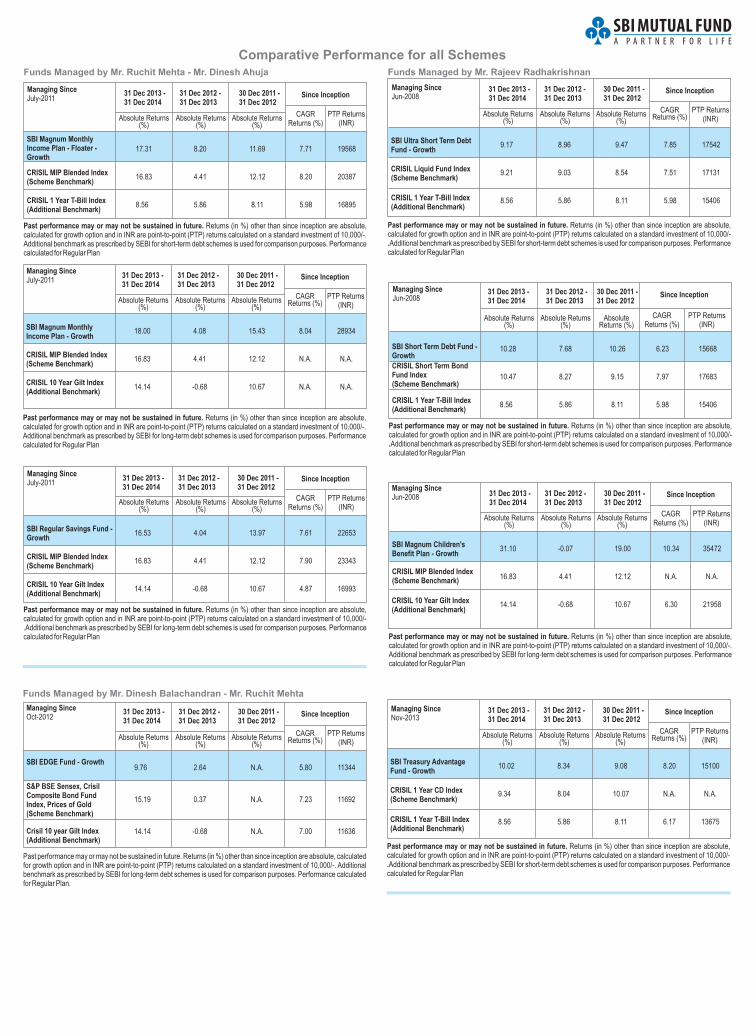
Funds Managed by Mr. Ruchit Mehta - Mr. Dinesh Ahuja
Since Inception
SBI Magnum Monthly Income Plan - Floater - Growth
Absolute Returns (%)
CAGRReturns (%)
PTP Returns(INR)
CRISIL MIP Blended Index (Scheme Benchmark)
CRISIL 1 Year T-Bill Index (Additional Benchmark)
Absolute Returns (%)
Absolute Returns (%)
Past performance may or may not be sustained in future. Returns (in %) other than since inception are absolute, calculated for growth option and in INR are point-to-point (PTP) returns calculated on a standard investment of 10,000/-. Additional benchmark as prescribed by SEBI for short-term debt schemes is used for comparison purposes. Performance calculated for Regular Plan
Managing SinceJuly-2011
17.31 8.20 11.69 7.71 19568
16.83 4.41 12.12 8.20 20387
8.56 5.86 8.11 5.98 16895
31 Dec 2013 - 31 Dec 2012 - 30 Dec 2011 -31 Dec 2014 31 Dec 2013 31 Dec 2012
Comparative Performance for all Schemes
Since Inception
SBI Regular Savings Fund - Growth
Absolute Returns (%)
CAGRReturns (%)
PTP Returns(INR)
CRISIL MIP Blended Index (Scheme Benchmark)
CRISIL 10 Year Gilt Index (Additional Benchmark)
Absolute Returns (%)
Absolute Returns (%)
Past performance may or may not be sustained in future. Returns (in %) other than since inception are absolute, calculated for growth option and in INR are point-to-point (PTP) returns calculated on a standard investment of 10,000/-.Additional benchmark as prescribed by SEBI for long-term debt schemes is used for comparison purposes. Performance calculated for Regular Plan
Managing SinceJuly-2011
16.53 4.04 13.97 7.61 22653
16.83 4.41 12.12 7.90 23343
14.14 -0.68 10.67 4.87 16993
31 Dec 2013 - 31 Dec 2012 - 30 Dec 2011 -31 Dec 2014 31 Dec 2013 31 Dec 2012
Since Inception
SBI Ultra Short Term Debt Fund - Growth
Absolute Returns (%)
CAGR Returns (%)
PTP Returns(INR)
CRISIL Liquid Fund Index (Scheme Benchmark)
CRISIL 1 Year T-Bill Index (Additional Benchmark)
Absolute Returns (%)
Absolute Returns (%)
Past performance may or may not be sustained in future. Returns (in %) other than since inception are absolute, calculated for growth option and in INR are point-to-point (PTP) returns calculated on a standard investment of 10,000/-.Additional benchmark as prescribed by SEBI for short-term debt schemes is used for comparison purposes. Performance calculated for Regular Plan
Funds Managed by Mr. Rajeev Radhakrishnan
Managing SinceJun-2008
9.17 8.96 9.47 7.85 17542
9.21 9.03 8.54 7.51 17131
8.56 5.86 8.11 5.98 15406
31 Dec 2013 - 31 Dec 2012 - 30 Dec 2011 -31 Dec 2014 31 Dec 2013 31 Dec 2012
Since Inception
SBI Magnum Monthly Income Plan - Growth
Absolute Returns (%)
CAGR Returns (%)
PTP Returns(INR)
CRISIL MIP Blended Index (Scheme Benchmark)
CRISIL 10 Year Gilt Index (Additional Benchmark)
Absolute Returns (%)
Absolute Returns (%)
Past performance may or may not be sustained in future. Returns (in %) other than since inception are absolute, calculated for growth option and in INR are point-to-point (PTP) returns calculated on a standard investment of 10,000/-. Additional benchmark as prescribed by SEBI for long-term debt schemes is used for comparison purposes. Performance calculated for Regular Plan
Managing SinceJuly-2011
18.00 4.08 15.43 8.04 28934
16.83 4.41 12.12 N.A. N.A.
14.14 -0.68 10.67 N.A. N.A.
31 Dec 2013 - 31 Dec 2012 - 30 Dec 2011 -31 Dec 2014 31 Dec 2013 31 Dec 2012
Since Inception
SBI Short Term Debt Fund - Growth
Absolute Returns (%)
CRISIL Short Term Bond Fund Index (Scheme Benchmark)
CRISIL 1 Year T-Bill Index (Additional Benchmark)
Absolute Returns (%)
PTP Returns(INR)
Past performance may or may not be sustained in future. Returns (in %) other than since inception are absolute, calculated for growth option and in INR are point-to-point (PTP) returns calculated on a standard investment of 10,000/-.Additional benchmark as prescribed by SEBI for short-term debt schemes is used for comparison purposes. Performance calculated for Regular Plan
Since Inception
SBI Magnum Children's Benefit Plan - Growth
Absolute Returns (%)
CAGRReturns (%)
PTP Returns(INR)
CRISIL MIP Blended Index (Scheme Benchmark)
CRISIL 10 Year Gilt Index (Additional Benchmark)
Absolute Returns (%)
Absolute Returns (%)
Past performance may or may not be sustained in future. Returns (in %) other than since inception are absolute, calculated for growth option and in INR are point-to-point (PTP) returns calculated on a standard investment of 10,000/-. Additional benchmark as prescribed by SEBI for long-term debt schemes is used for comparison purposes. Performance calculated for Regular Plan
Absolute Returns (%)
Managing SinceJun-2008
Managing SinceJun-2008
CAGRReturns (%)
10.28 7.68 10.26 6.23 15668
10.47 8.27 9.15 7.97 17683
8.56 5.86 8.11 5.98 15406
31.10 -0.07 19.00 10.34 35472
16.83 4.41 12.12 N.A. N.A.
14.14 -0.68 10.67 6.30 21958
31 Dec 2013 - 31 Dec 2012 - 30 Dec 2011 -31 Dec 2014 31 Dec 2013 31 Dec 2012
Since Inception
SBI Treasury Advantage Fund - Growth
Absolute Returns (%)
CAGR Returns (%)
PTP Returns(INR)
CRISIL 1 Year CD Index (Scheme Benchmark)
CRISIL 1 Year T-Bill Index (Additional Benchmark)
Absolute Returns (%)
Absolute Returns (%)
Past performance may or may not be sustained in future. Returns (in %) other than since inception are absolute, calculated for growth option and in INR are point-to-point (PTP) returns calculated on a standard investment of 10,000/-.Additional benchmark as prescribed by SEBI for short-term debt schemes is used for comparison purposes. Performance calculated for Regular Plan
Managing SinceNov-2013
10.02 8.34 9.08 8.20 15100
9.34 8.04 10.07 N.A. N.A.
8.56 5.86 8.11 6.17 13675
31 Dec 2013 - 31 Dec 2012 - 30 Dec 2011 -31 Dec 2014 31 Dec 2013 31 Dec 2012
Since Inception
SBI EDGE Fund - Growth
Absolute(%)
Returns CAGR Returns (%)
PTP Returns(INR)
S&P BSE Sensex, Crisil Composite Bond Fund Index, Prices of Gold (Scheme Benchmark)
Crisil 10 year Gilt Index (Additional Benchmark)
Absolute(%)
Returns Absolute(%)
Returns
Past performance may or may not be sustained in future. Returns (in %) other than since inception are absolute, calculated for growth option and in INR are point-to-point (PTP) returns calculated on a standard investment of 10,000/-. Additional benchmark as prescribed by SEBI for long-term debt schemes is used for comparison purposes. Performance calculated for Regular Plan.
Managing SinceOct-2012
9.76 2.64 N.A. 5.80 11344
15.19 0.37 N.A. 7.23 11692
14.14 -0.68 N.A. 7.00 11636
31 Dec 2013 - 31 Dec 2012 - 30 Dec 2011 -31 Dec 2014 31 Dec 2013 31 Dec 2012
Funds Managed by Mr. Dinesh Balachandran - Mr. Ruchit Mehta
31 Dec 2013 - 31 Dec 2012 - 30 Dec 2011 -31 Dec 2014 31 Dec 2013 31 Dec 2012
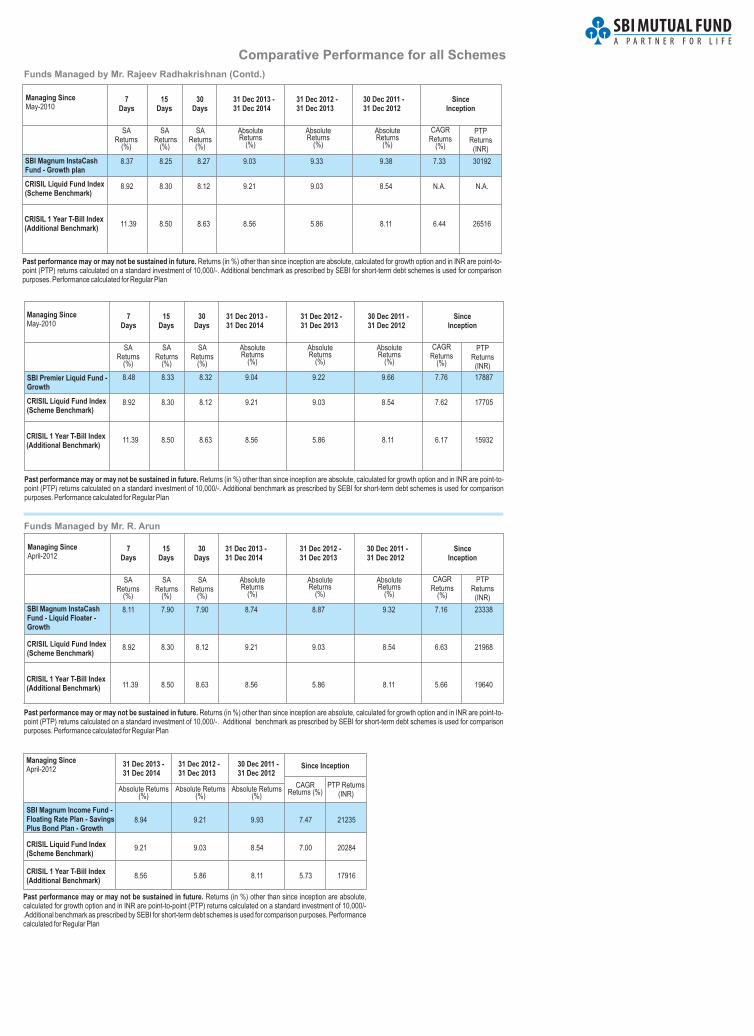
Comparative Performance for all Schemes
Since Inception
SBI Magnum Income Fund - Floating Rate Plan - Savings Plus Bond Plan - Growth
Absolute Returns (%)
CAGR Returns (%)
PTP Returns(INR)
CRISIL Liquid Fund Index (Scheme Benchmark)
CRISIL 1 Year T-Bill Index (Additional Benchmark)
Absolute Returns (%)
Absolute Returns (%)
Past performance may or may not be sustained in future. Returns (in %) other than since inception are absolute, calculated for growth option and in INR are point-to-point (PTP) returns calculated on a standard investment of 10,000/-.Additional benchmark as prescribed by SEBI for short-term debt schemes is used for comparison purposes. Performance calculated for Regular Plan
Managing SinceApril-2012
SBI Fund - Liquid Floater - Growth
Magnum InstaCash
CRISIL Liquid Fund Index (Scheme Benchmark)
CRISIL 1 Year T-Bill Index (Additional Benchmark)
SAReturns
(%)
SAReturns
(%)
7Days
15Days
30Days
SAReturns
(%)
Absolute Returns
(%)
Absolute Returns
(%)
Absolute Returns
(%)
PTPReturns
(INR)
CAGRReturns
(%)
Past performance may or may not be sustained in future. benchmark as prescribed by SEBI for short-term debt schemes is used for comparison
purposes.
Returns (in %) other than since inception are absolute, calculated for growth option and in INR are point-to-point (PTP) returns calculated on a standard investment of 10,000/-. Additional
Performance calculated for Regular Plan
Since Inception
Managing SinceApril-2012
Funds Managed by Mr. R. Arun
8.11 7.90 7.90 8.74 8.87 9.32 7.16 23338
8.92 8.30 8.12 9.21 9.03 8.54 6.63 21968
11.39 8.50 8.63 8.56 5.86 8.11 5.66 19640
8.94 9.21 9.93 7.47 21235
9.21 9.03 8.54 7.00 20284
8.56 5.86 8.11 5.73 17916
31 Dec 2013 - 31 Dec 2012 - 30 Dec 2011 -31 Dec 2014 31 Dec 2013 31 Dec 2012
31 Dec 2013 - 31 Dec 2012 - 30 Dec 2011 -31 Dec 2014 31 Dec 2013 31 Dec 2012
SBI Premier Liquid Fund - Growth
CRISIL Liquid Fund Index (Scheme Benchmark)
CRISIL 1 Year T-Bill Index (Additional Benchmark)
SAReturns
(%)
SAReturns
(%)
7Days
15Days
30Days
SAReturns
(%)
Absolute Returns
(%)
Absolute Returns
(%)
Absolute Returns
(%)
PTPReturns
(INR)
CAGRReturns
(%)
Since Inception
Managing SinceMay-2010
8.48 8.33 8.32 9.04 9.22 9.66 7.76 17887
8.92 8.30 8.12 9.21 9.03 8.54 7.62 17705
11.39 8.50 8.63 8.56 5.86 8.11 6.17 15932
31 Dec 2013 - 31 Dec 2012 - 30 Dec 2011 -31 Dec 2014 31 Dec 2013 31 Dec 2012
Past performance may or may not be sustained in future. benchmark as prescribed by SEBI for short-term debt schemes is used for comparison
purposes.
Returns (in %) other than since inception are absolute, calculated for growth option and in INR are point-to-point (PTP) returns calculated on a standard investment of 10,000/-. Additional
Performance calculated for Regular Plan
Funds Managed by Mr. Rajeev Radhakrishnan (Contd.)
SBI Fund - Growth plan
Magnum InstaCash
CRISIL Liquid Fund Index (Scheme Benchmark)
CRISIL 1 Year T-Bill Index (Additional Benchmark)
SAReturns
(%)
SA Returns
(%)
7Days
15Days
30Days
SAReturns
(%)
Absolute Returns
(%)
Absolute Returns
(%)
Absolute Returns
(%)
PTPReturns
(INR)
CAGRReturns
(%)
Past performance may or may not be sustained in future. Returns (in %) other than since inception are absolute, calculated for growth option and in INR are point-to-point (PTP) returns calculated on a standard investment of 10,000/-. benchmark as prescribed by SEBI for short-term debt schemes is used for comparison purposes.
Additional Performance calculated for Regular Plan
Since Inception
Managing SinceMay-2010
31 Dec 2013 - 31 Dec 2012 - 30 Dec 2011 -31 Dec 2014 31 Dec 2013 31 Dec 2012
8.37 8.25 8.27 9.03 9.33 9.38 7.33 30192
8.92 8.30 8.12 9.21 9.03 8.54 N.A. N.A.
11.39 8.50 8.63 8.56 5.86 8.11 6.44 26516
Disclaimer for data from CRISIL'S FUND ANALYSER: CRISIL has taken due care and caution in compilation of
the Data contained in the CRISIL'S FUND ANALYSER. The Data in the CRISIL'S FUND ANALYSER has been
obtained by CRISIL from sources, which it considers reliable. However, CRISIL does not guarantee the
accuracy, adequacy or completeness of any Data in the CRISIL'S FUND ANALYSER and is not responsible for
any errors or omissions or for the results obtained from the use of such Data. CRISIL especially states that it has
no financial liability whatsoever to the users of CRISIL'S FUND ANALYSER. CRISIL or any of its directors/
employees/ representatives does not accept any liability for any direct or consequential loss arising from the use
of the Data contained in the CRISIL'S FUND ANALYSER or any data generated from the CRISIL'S FUND
ANALYSER.
Disclaimer: This investment update is for information purpose only and is not an offer to sell or a solicitation to
buy any mutual fund units/securities. These views alone are not sufficient and should not be used for the
development or implementation of an investment strategy. It should not be construed as investment advice to any
party. All opinions and estimates included in this schemes guide constitute our view as of this date and are subject
to change without notice. Neither SBI Funds Management Private Limited, nor any person connected with it,
accepts any liability arising from the use of this information. The recipient of this material should rely on their own
investigations and take professional advice on their own.
In the preparation of the material contained in this document, the AMC has used information that is publicly
available, including information developed in-house. Information gathered and material used in this document is
believed to be from reliable sources published by third parties. While such publications are believed to be reliable,
however, neither the AMC, its officers, the trustees, the Fund nor any of their affiliates or representatives assume
any responsibility of the accuracy, reasonableness and/or completeness of any information. For data referred to
of any third party in this material no such party will assume any liability for the same. Further, all opinion included in
this newsletter are as of date and are subject to change without any notice. All recipients of this material should
seek appropriate professional advice and carefully read the scheme information document/ statement of
additional information and before dealing and or transacting in any of the products referred to in this material
make their own investigation.The Fund, the AMC and Trustees and any of its directors, officers, employees and
other personnel shall not liable for any loss, damage of any nature, including but not limited to direct, indirect,
punitive, special, exemplary, consequential, as also any loss of profit in any way arising from the use of this
material in any manner whatsoever. The recipient alone shall be fully responsible/are liable for any decision taken
on the basis of this material.
Disclaimer of SBI Nifty Index Fund: “The “SBI Nifty Index Fund” offered by “SBI Funds Management Private
Limited” is not sponsored, endorsed, sold or promoted by India Index Services & Products Limited (IISL) and its
affiliates. IISL do not make any representation or warranty, express or implied (including warranties of
merchantability or fitness for particular purpose or use) and disclaims all liability to the owners of “SBI Nifty Index
Fund” or any member of the public regarding the advisability of investing in securities generally or in the “SBI Nifty
Index Fund” linked to CNX Nifty Index or particularly in the ability of the CNX Nifty Index to track general stock
market performance in India. Please read the full Disclaimers in relation to the CNX Nifty Index in the Scheme
Information Document.”
Mutual Fund Investments are subject to market risks, read all scheme related documents carefully.
Asset Management Company: SBI Funds Management Private Limited (A joint venture between SBI &
AMUNDI) CIN: U65990MH1992PTC065289. Trustee Company: SBI Mutual Fund Trustee Company Private
Limited CIN: U65991MH2003PTC138496. Registered Office: 9th Floor, Crescenzo, C-38 & 39, G Block,
Bandra-Kurla Complex, Bandra (East), Mumbai 400 051. Tel.: 022-61793000 E-mail : [email protected] •
www. sbimf.com
SBI FUNDS MANAGEMENT PVT LTD BRANCHES
NORTH
SOUTH
EAST
WEST
Chandigarh: (0172) 2709728 • Gurgaon: (0124) 4200828 • Jaipur: (0141) 2740016 / 2740061 • Kanpur: (0512) 2331631 • Lucknow: 522 2286741, 2286742 • Ludhiana: (0161)2449849 • New Delhi: (011) 23466666 Aligarh: (0571) 2402017 • Ambala: (0171) 2653400 • Bathinda: (0164) 2218415 • Dehradun: (0135) 2651719 • Dhanbad: (0326) 2301545 • Dharamshala: (01892) 225814 • Faizabad • Faridabad: (0129) 4030661 • Ferozepur: 9855008415 • Ghaziabad: 0120-2797582 Gorakhpur: (0551) 03378 • Gulbarga: 9980872463 • Haldwani: 9412084061 • Hissar: 01662 238415 Hosiharpur: 0188-2228415 • Jabalpur: (0761) 2450542 Jalandhar: (0181) 2238415 • Jammu: (0191) 2474975 • Jhansi: 0510-2330298 • Jodhpur: (0291) 2611928,(0291) 2611929 • Leh: 09469468778 • Meerut: 9719998894 • Moradabad: (0591) 2411411 • Muzzaffarpur: 9473199059 • Panchakula: 9592008415 • Panipat: (0180) 2648415 • Pathankot: 08872008415 • Patiala: 0175-2300058 • Rohtak: (0126) 2258415 • Saharanpur: 0132-2720789 • Shimla: (0177) 2807608 • Sonepat: 011- 23466666 • Udaipur: 9928191961 • Varanasi: 0542-2222492 Nehru Place (Delhi): (011) 26224606 • Noida: (0120) 4232214 • Pitam Pura (Delhi): (011) 23751974
Bangalore: 080-25580014 / 25580051 / 22122507 / 22272284 / 22123784 • Chennai : (044) 2854 3382 / 3383, 044 2854 3384 / 3385 • Coimbatore: (0422) 2541666 • Ernakulam: (0484) 2318886,2318886,2323489 • Hyderabad: (040) 24756241 • Thrivanthapuram: 0471-4011590 / 4011591 / 4011592 • Vijayawada: 0866 2436113 / 2438217 Bareilly: 7830111140 • Belgaum: 0831-2422463 • Bellary: 08392-271775 • Calicut: 0495 2768270, 4020079 • Cuttack: 0671-2422972 • Davangere: 08192-231463 • Guntur: 0863-2211022 • Hubli: 0836-2368477 • Kannur 0497-2708180 • Kollam: na • Kottayam: 9562008100 • Kurnool: 07680004555 • Madurai: (0452)4374242 • Mangalore: (0824)2222463 • Mysore: (0821)4242919 • Nellore: 0861-2338688 • Pondichery: 9445196934 • Rajahmundry: (0883)2434002 • Salem: 0427-4552289 • Shimoga: 8182222463 • Thiruchirapalli: 0431-4000667 • Thrissur: 8129354324 • Thrissur: 0487-2445700 • Tinsukia: 03742332365 • Tirunelveli: 0462 4220023 • Tirupati (0877)6450828 • Vellore: 0416-2225005 • Vishakapatnam: 0891-3293018 • Warangal: 0870-2430307
Bhubaneshwar: (0674) 2392401/501 • Guwahati: (0361) 2463704 • Kolkata: 22882342 / 22883767 / 22883768 • Patna: (0612) 3242047 • Raipur: (0771) 2543355 / 4263256 • Ranchi: (0651) 2213413 Agartala: (0381) 2384107 • Asansol: 09800241133 • Balasore: (0678) 2262646 • Bhagalpur: (0641) 2420661 • Bhilai: (0788) 2273261 / 2272344 • Bokaro: 9304823011 • Bokaro: (06542) 232561 • Burdwan: 09830896180 • Darbhanga: (0627) 2245004 • Dimapur: (0386) 2224267 • Durgapur: 2544191 / 192 • Gaya: (0631) 2222405 • Hazaribagh: (06546) 270415 • Imphal: (0385) 2443689 • Itanagar: (0360) 2292416 • Jamshedpur: (0657) 2440446 • Jorhat: (0376) 2932558 • Kalyani: 09830896180 • Kharagpur: (03222) 225592 • Malda: 09832499374 • Port Blair: 03192-230506 • Rourkela: (0661) 2400299 • Sambalpur: (0663) 2410001 • Shillong: 9436730174 • Silchar: (0384) 2221109 • Siliguri: (0353) 2537065 • Sriganganagar: 9829067384
Ahmedabad: (079) 26423060 / 26463090 • Bhopal: (0755) 2557341 • Goa: (0832) 2235283 / 6642475 • Indore: (0731) 2541141 • Mumbai: (022) 66532800 • Nagpur: (0712) 6458368 • Pune: (020) 25670961 • Surat: (0261) 2462764 / 3994800 / 6646555 • Vadodara: (0265) 2323010 Agra: (0562) 32555061 / 4008091 • Ajmer: (0145)2426284 • Allahabad: (0532) 2261028 • Alwar: (0144) 2332035 • Amravati: 08600017448 • Amritsar:(0183) 2221755 • Anand: (02692) 243210 • Aurangabad: (0240) 3244781 • Bavnagar: (0278) 2523788 • Bharuch: (02642) 247550 • Bhilwara: (0148) 2240122 • Bhuj: (02832) 250900 • Bilaspur: (07752) 495006 • Gandhidham: (02836) 233615 • Gwalior (0751) 2447272 • Jalgaon: 09422283450 • Jamnagar: (0288) 2660104 • Junagadh: (0285) 2670350 • Kolhapur: (0231) 2680880 • Korba: 09826159729 • Kota: (0744) 2390631 • Margao: 09881148869 • Mehsana: (02762) 233872 • Nadiad: (0268) 2560110 • Nashik: (0253) 6575888 / 2232553 • Navsari: (02637) 242266 • Raipur: (0771) 2543355 / 4263256 • Rajkot: (0281) 2239437 • Ratlam: 07748800554 • Sagar: (0758) 2241367 • Solapur: 09226389292 • Srinagar: (0194) 2474864 • Valsad: (02632) 245440 • Vapi: (0260) 2400480 Borivali (Mumbai): (022) 28927551 / 28922741 • Chinchwad: (020) 27355721 • Kalyan: (0251) 2311850 / 2311980 • Thane: (022) 25401690 / 25414594 • Vashi: (022) 27810371 / 27810368

Dividend History Of Debt Funds
Pursuant to payment of dividend, the NAV of Dividend Option of schemes/plans would fall to the extent of payout and statutory levy, if applicable.Existing plans under the scheme named Regular w.e.f. 01/01/2013 are
SBI Magnum Gilt Fund Short Term
30-Sep-14 0.08200 0.08200 11.6782
31-Oct-14 0.08500 0.08500 11.7657
31-Oct-14 0.08500 0.08500 11.7495
28-Nov-14 0.10000 0.10000 11.8257
28-Nov-14 0.10000 0.10000 11.8065
31-Dec-14 0.20000 0.20000 11.8703
31-Dec-14 0.20000 0.20000 11.8475
Scheme Name Record Date Individual Corporate Nav(in Rs./Unit) (in Rs./Unit)
Regular Plan - Dividend
Direct Plan - Dividend
Regular Plan - Dividend
Direct Plan - Dividend
Regular Plan - Dividend
Direct Plan - Dividend
Regular Plan - Dividend
Face value: `10
SBI Regular Savings Fund - Quarterly Dividend
28-Mar-14 0.17000 0.17000 11.3571
28-Mar-14 0.17000 0.17000 11.4022
27-Jun-14 0.32000 0.32000 11.6629
27-Jun-14 0.32000 0.32000 11.7239
29-Sep-14 0.24100 0.24100 11.7567
29-Sep-14 0.24200 0.24200 11.8316
29-Dec-14 0.25000 0.25000 11.9486
29-Dec-14 0.26000 0.26000 12.0290
Scheme Name Record Date Individual Corporate Nav(in Rs./Unit) (in Rs./Unit)
Regular Plan - Dividend
Direct Plan - Dividend
Regular Plan - Dividend
Direct Plan - Dividend
Regular Plan - Dividend
Direct Plan - Dividend
Regular Plan - Dividend
Direct Plan - Dividend
Face value: `10
SBI Magnum Income Fund - FRP - Savings Plus Bond Plan
30-Sep-14 0.07800 0.07800 11.2100
31-Oct-14 0.08000 0.08000 11.1776
31-Oct-14 0.08000 0.08000 11.2198
28-Nov-14 0.06500 0.06500 11.1916
28-Nov-14 0.06500 0.06500 11.2396
31-Dec-14 0.06500 0.06500 11.2002
31-Dec-14 0.06500 0.06500 11.2545
Scheme Name Record Date Individual Corporate Nav(in Rs./Unit) (in Rs./Unit)
Direct Plan - Dividend
Regular Plan - Dividend
Direct Plan - Dividend
Regular Plan - Dividend
Direct Plan - Dividend
Regular Plan - Dividend
Direct Plan - Dividend
SBI Magnum Monthly Income Plan
28-Aug-14 0.95000 0.09500 11.4239
26-Sep-14 0.09500 0.09500 11.4686
31-Oct-14 0.09500 0.09500 11.6408
28-Nov-14 0.10000 0.10000 11.7484
26-Dec-14 0.10000 0.10000 13.5270
26-Dec-14 0.10000 0.10000 11.7565
Scheme Name Record Date Individual Corporate Nav(in Rs./Unit) (in Rs./Unit)
Regular Plan - Mthly Div
Regular Plan - Mthly Div
Regular Plan - Mthly Div
Regular Plan - Mthly Div
Direct Plan - Mthly Div
Regular Plan - Mthly Div
Face value: `10
Face value: `10
SBI Magnum Monthly Income Plan - Floater
31-Oct-14 0.09000 0.09000 11.5062
31-Oct-14 0.09000 0.09000 11.5446
28-Nov-14 0.10000 0.10000 11.5391
28-Nov-14 0.10000 0.10000 11.5815
31-Dec-14 0.06500 0.06500 11.5876
31-Dec-14 0.06500 0.06500 11.6359
Scheme Name Record Date Individual Corporate Nav(in Rs./Unit) (in Rs./Unit)
Reg.Plan - Monthly Div
Direct Plan - Monthly Div
Reg.Plan - Monthly Div
Direct Plan - Monthly Div
Reg.Plan - Monthly Div
Direct Plan - Monthly Div
Face value: `10
SBI Short Term Debt Fund
30-Jun-14 0.07660 0.07660 10.8946
31-Jul-14 0.07000 0.07000 10.8768
28-Aug-14 0.75000 0.07500 10.8614
30-Sep-14 0.07800 0.07800 10.8810
31-Oct-14 0.08000 0.08000 10.9389
28-Nov-14 0.08000 0.08000 10.9700
31-Dec-14 0.08000 0.08000 10.9720
Scheme Name Record Date Individual Corporate Nav(in Rs./Unit) (in Rs./Unit)
Regular Plan - Mthly Div
Regular Plan - Mthly Div
Regular Plan - Mthly Div
Regular Plan - Mthly Div
Regular Plan - Mthly Div
Regular Plan - Mthly Div
Regular Plan - Mthly Div
Face value: `10
SBI Ultra Short Term Debt Fund - Retail Plan
30-May-14 6.00000 6.00000 1045.3861
30-Jun-14 6.30000 6.30000 1046.5158
30-Jun-14 6.30000 6.30000 1046.7751
31-Jul-14 6.50000 6.50000 1047.1081
31-Jul-14 6.50000 6.50000 1047.4407
30-May-14 6.00000 6.00000 1045.1610
Scheme Name Record Date Individual Corporate Nav(in Rs./Unit) (in Rs./Unit)
Retail Plan
Retail Plan - Dir - Mthly Div
Retail Plan
Retail Plan - Dir - Mthly Div
Retail Plan
Retail Plan - Dir - Mthly Div
Face value: `1000
SBI Short Term Debt Fund - Retail Plan
31-Oct-14 0.08000 0.08000 11.5892
31-Oct-14 0.08000 0.08000 11.4727
28-Nov-14 0.08000 0.08000 11.6260
28-Nov-14 0.08000 0.08000 11.5093
31-Dec-14 0.08000 0.08000 11.6357
31-Dec-14 0.08000 0.08000 11.5154
Scheme Name Record Date Individual Corporate Nav(in Rs./Unit) (in Rs./Unit)
Retail Plan - Dir Mthly Div
Retail Plan - Mthly Div
Retail Plan - Dir Mthly Div
Retail Plan - Mthly Div
Retail Plan - Dir Mthly Div
Retail Plan - Mthly Div
Face value: `10
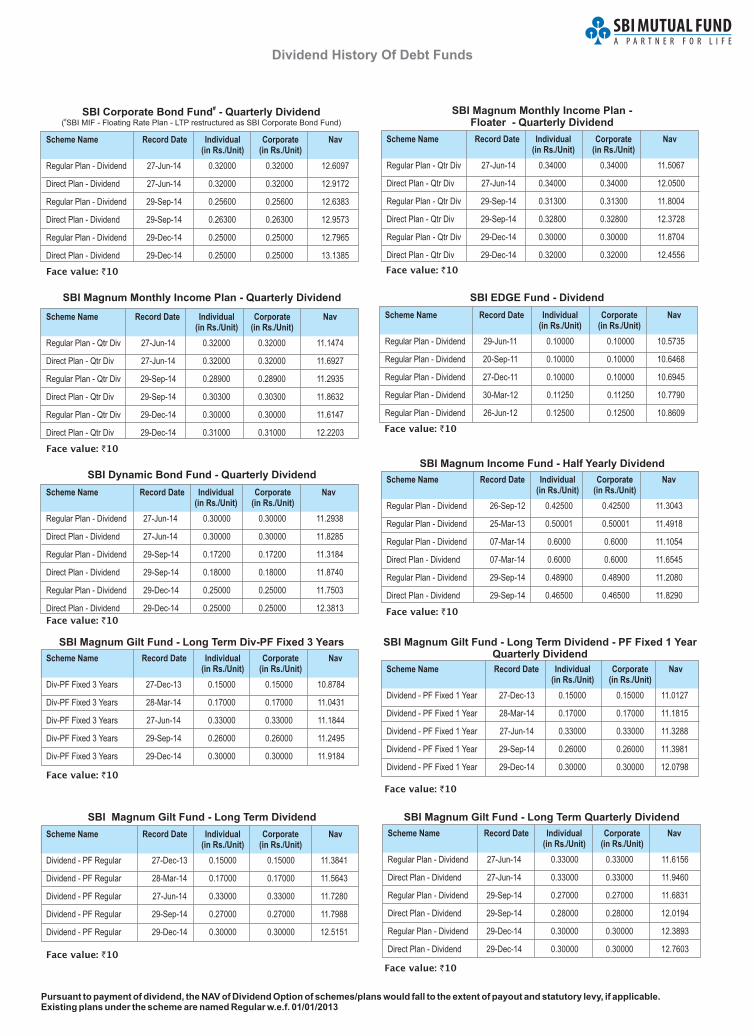
Dividend History Of Debt Funds
27-Jun-14 0.32000 0.32000 12.6097
27-Jun-14 0.32000 0.32000 12.9172
29-Sep-14 0.25600 0.25600 12.6383
29-Sep-14 0.26300 0.26300 12.9573
29-Dec-14 0.25000 0.25000 12.7965
29-Dec-14 0.25000 0.25000 13.1385
Scheme Name Record Date Individual Corporate Nav(in Rs./Unit) (in Rs./Unit)
Regular Plan - Dividend
Direct Plan - Dividend
Regular Plan - Dividend
Direct Plan - Dividend
Regular Plan - Dividend
Direct Plan - Dividend
SBI Magnum Monthly Income Plan - Quarterly Dividend
Scheme Name Record Date Individual Corporate Nav(in Rs./Unit) (in Rs./Unit)
Regular Plan - Qtr Div
Direct Plan - Qtr Div
Regular Plan - Qtr Div
Direct Plan - Qtr Div
Regular Plan - Qtr Div
Direct Plan - Qtr Div
#SBI Corporate Bond Fund - Quarterly Dividend(#SBI MIF - Floating Rate Plan - LTP restructured as SBI Corporate Bond Fund)
Face value: `10
Face value: `10
27-Jun-14 0.30000 0.30000 11.2938
27-Jun-14 0.30000 0.30000 11.8285
29-Sep-14 0.17200 0.17200 11.3184
29-Sep-14 0.18000 0.18000 11.8740
29-Dec-14 0.25000 0.25000 11.7503
29-Dec-14 0.25000 0.25000 12.3813
Scheme Name Record Date Individual Corporate Nav(in Rs./Unit) (in Rs./Unit)
Regular Plan - Dividend
Direct Plan - Dividend
Regular Plan - Dividend
Direct Plan - Dividend
Regular Plan - Dividend
Direct Plan - Dividend
SBI Dynamic Bond Fund - Quarterly Dividend
Face value: `10
SBI Magnum Income Fund - Half Yearly Dividend
26-Sep-12 0.42500 0.42500 11.3043
25-Mar-13 0.50001 0.50001 11.4918
07-Mar-14 0.6000 0.6000 11.1054
07-Mar-14 0.6000 0.6000 11.6545
29-Sep-14 0.48900 0.48900 11.2080
29-Sep-14 0.46500 0.46500 11.8290
Scheme Name Record Date Individual Corporate Nav(in Rs./Unit) (in Rs./Unit)
Regular Plan - Dividend
Regular Plan - Dividend
Regular Plan - Dividend
Direct Plan - Dividend
Regular Plan - Dividend
Direct Plan - Dividend
Face value: `10
SBI EDGE Fund - Dividend
29-Jun-11 0.10000 0.10000 10.5735
20-Sep-11 0.10000 0.10000 10.6468
27-Dec-11 0.10000 0.10000 10.6945
30-Mar-12 0.11250 0.11250 10.7790
26-Jun-12 0.12500 0.12500 10.8609
Scheme Name Record Date Individual Corporate Nav(in Rs./Unit) (in Rs./Unit)
Regular Plan - Dividend
Regular Plan - Dividend
Regular Plan - Dividend
Regular Plan - Dividend
Regular Plan - Dividend
Face value: `10
Pursuant to payment of dividend, the NAV of Dividend Option of schemes/plans would fall to the extent of payout and statutory levy, if applicable.Existing plans under the scheme are named Regular w.e.f. 01/01/2013
SBI Magnum Monthly Income Plan - Floater - Quarterly Dividend
27-Jun-14 0.34000 0.34000 11.5067
27-Jun-14 0.34000 0.34000 12.0500
29-Sep-14 0.31300 0.31300 11.8004
29-Sep-14 0.32800 0.32800 12.3728
29-Dec-14 0.30000 0.30000 11.8704
29-Dec-14 0.32000 0.32000 12.4556
Scheme Name Record Date Individual Corporate Nav(in Rs./Unit) (in Rs./Unit)
Regular Plan - Qtr Div
Direct Plan - Qtr Div
Regular Plan - Qtr Div
Direct Plan - Qtr Div
Regular Plan - Qtr Div
Direct Plan - Qtr Div
Face value: `10
SBI Magnum Gilt Fund - Long Term Div-PF Fixed 3 Years
27-Dec-13 0.15000 0.15000 10.8784
28-Mar-14 0.17000 0.17000 11.0431
27-Jun-14 0.33000 0.33000 11.1844
29-Sep-14 0.26000 0.26000 11.2495
29-Dec-14 0.30000 0.30000 11.9184
Scheme Name Record Date Individual Corporate Nav(in Rs./Unit) (in Rs./Unit)
Div-PF Fixed 3 Years
Div-PF Fixed 3 Years
Div-PF Fixed 3 Years
Div-PF Fixed 3 Years
Div-PF Fixed 3 Years
Face value: `10
27-Dec-13 0.15000 0.15000 11.3841
28-Mar-14 0.17000 0.17000 11.5643
27-Jun-14 0.33000 0.33000 11.7280
29-Sep-14 0.27000 0.27000 11.7988
29-Dec-14 0.30000 0.30000 12.5151
Scheme Name Record Date Individual Corporate Nav(in Rs./Unit) (in Rs./Unit)
Dividend - PF Regular
Dividend - PF Regular
Dividend - PF Regular
Dividend - PF Regular
Dividend - PF Regular
SBI Magnum Gilt Fund - Long Term Dividend
Face value: `10
SBI Magnum Gilt Fund - Long Term Dividend - PF Fixed 1 Year Quarterly Dividend
27-Dec-13 0.15000 0.15000 11.0127
28-Mar-14 0.17000 0.17000 11.1815
27-Jun-14 0.33000 0.33000 11.3288
29-Sep-14 0.26000 0.26000 11.3981
29-Dec-14 0.30000 0.30000 12.0798
Scheme Name Record Date Individual Corporate Nav(in Rs./Unit) (in Rs./Unit)
Dividend - PF Fixed 1 Year
Dividend - PF Fixed 1 Year
Dividend - PF Fixed 1 Year
Dividend - PF Fixed 1 Year
Dividend - PF Fixed 1 Year
Face value: `10
SBI Magnum Gilt Fund - Long Term Quarterly Dividend
Scheme Name Record Date Individual Corporate Nav(in Rs./Unit) (in Rs./Unit)
27-Jun-14 0.33000 0.33000 11.6156
27-Jun-14 0.33000 0.33000 11.9460
29-Sep-14 0.27000 0.27000 11.6831
29-Sep-14 0.28000 0.28000 12.0194
29-Dec-14 0.30000 0.30000 12.3893
29-Dec-14 0.30000 0.30000 12.7603
Face value: `10
Regular Plan - Dividend
Direct Plan - Dividend
Regular Plan - Dividend
Direct Plan - Dividend
Regular Plan - Dividend
Direct Plan - Dividend
27-Jun-14 0.32000 0.32000 11.1474
27-Jun-14 0.32000 0.32000 11.6927
29-Sep-14 0.28900 0.28900 11.2935
29-Sep-14 0.30300 0.30300 11.8632
29-Dec-14 0.30000 0.30000 11.6147
29-Dec-14 0.31000 0.31000 12.2203
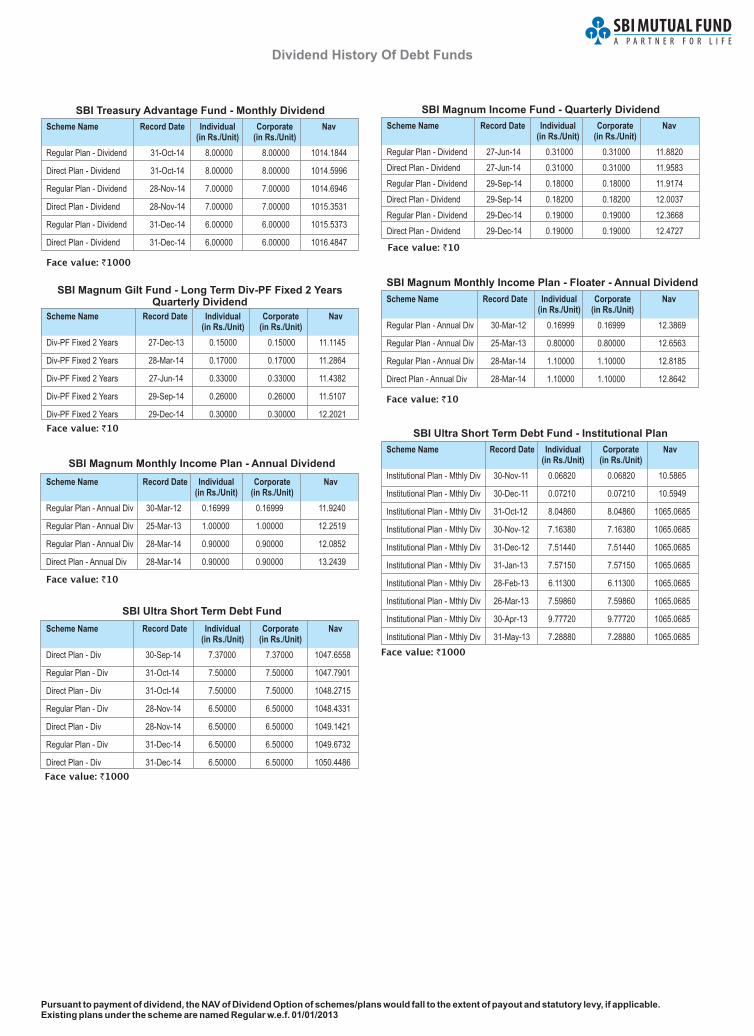
Dividend History Of Debt Funds
SBI Magnum Income Fund - Quarterly Dividend
27-Jun-14 0.31000 0.31000 11.8820
27-Jun-14 0.31000 0.31000 11.9583
29-Sep-14 0.18000 0.18000 11.9174
29-Sep-14 0.18200 0.18200 12.0037
29-Dec-14 0.19000 0.19000 12.3668
29-Dec-14 0.19000 0.19000 12.4727
Scheme Name Record Date Individual Corporate Nav(in Rs./Unit) (in Rs./Unit)
Regular Plan - Dividend
Direct Plan - Dividend
Regular Plan - Dividend
Direct Plan - Dividend
Regular Plan - Dividend
Direct Plan - Dividend
Face value: `10
SBI Magnum Monthly Income Plan - Annual Dividend
30-Mar-12 0.16999 0.16999 11.9240
25-Mar-13 1.00000 1.00000 12.2519
28-Mar-14 0.90000 0.90000 12.0852
28-Mar-14 0.90000 0.90000 13.2439
Scheme Name Record Date Individual Corporate Nav(in Rs./Unit) (in Rs./Unit)
Regular Plan - Annual Div
Regular Plan - Annual Div
Regular Plan - Annual Div
Direct Plan - Annual Div
Face value: `10
SBI Ultra Short Term Debt Fund - Institutional Plan
30-Nov-11 0.06820 0.06820 10.5865
30-Dec-11 0.07210 0.07210 10.5949
31-Oct-12 8.04860 8.04860 1065.0685
30-Nov-12 7.16380 7.16380 1065.0685
31-Dec-12 7.51440 7.51440 1065.0685
31-Jan-13 7.57150 7.57150 1065.0685
28-Feb-13 6.11300 6.11300 1065.0685
26-Mar-13 7.59860 7.59860 1065.0685
30-Apr-13 9.77720 9.77720 1065.0685
31-May-13 7.28880 7.28880 1065.0685
Scheme Name Record Date Individual Corporate Nav(in Rs./Unit) (in Rs./Unit)
Institutional Plan - Mthly Div
Institutional Plan - Mthly Div
Institutional Plan - Mthly Div
Institutional Plan - Mthly Div
Institutional Plan - Mthly Div
Institutional Plan - Mthly Div
Institutional Plan - Mthly Div
Institutional Plan - Mthly Div
Institutional Plan - Mthly Div
Institutional Plan - Mthly Div
Face value: `1000
Pursuant to payment of dividend, the NAV of Dividend Option of schemes/plans would fall to the extent of payout and statutory levy, if applicable.Existing plans under the scheme are named Regular w.e.f. 01/01/2013
30-Sep-14 7.37000 7.37000 1047.6558
31-Oct-14 7.50000 7.50000 1047.7901
31-Oct-14 7.50000 7.50000 1048.2715
28-Nov-14 6.50000 6.50000 1048.4331
28-Nov-14 6.50000 6.50000 1049.1421
31-Dec-14 6.50000 6.50000 1049.6732
31-Dec-14 6.50000 6.50000 1050.4486
Scheme Name Record Date Individual Corporate Nav(in Rs./Unit) (in Rs./Unit)
Direct Plan - Div
Regular Plan - Div
Direct Plan - Div
Regular Plan - Div
Direct Plan - Div
Regular Plan - Div
Direct Plan - Div
SBI Ultra Short Term Debt Fund
Face value: `1000
SBI Treasury Advantage Fund - Monthly Dividend
31-Oct-14 8.00000 8.00000 1014.1844
31-Oct-14 8.00000 8.00000 1014.5996
28-Nov-14 7.00000 7.00000 1014.6946
28-Nov-14 7.00000 7.00000 1015.3531
31-Dec-14 6.00000 6.00000 1015.5373
31-Dec-14 6.00000 6.00000 1016.4847
Scheme Name Record Date Individual Corporate Nav(in Rs./Unit) (in Rs./Unit)
Regular Plan - Dividend
Direct Plan - Dividend
Regular Plan - Dividend
Direct Plan - Dividend
Regular Plan - Dividend
Direct Plan - Dividend
Face value: `1000
27-Dec-13 0.15000 0.15000 11.1145
28-Mar-14 0.17000 0.17000 11.2864
27-Jun-14 0.33000 0.33000 11.4382
29-Sep-14 0.26000 0.26000 11.5107
29-Dec-14 0.30000 0.30000 12.2021
Scheme Name Record Date Individual Corporate Nav(in Rs./Unit) (in Rs./Unit)
Div-PF Fixed 2 Years
Div-PF Fixed 2 Years
Div-PF Fixed 2 Years
Div-PF Fixed 2 Years
Div-PF Fixed 2 Years
SBI Magnum Gilt Fund - Long Term Div-PF Fixed 2 Years Quarterly Dividend
Face value: `10
SBI Magnum Monthly Income Plan - Floater - Annual Dividend
30-Mar-12 0.16999 0.16999 12.3869
25-Mar-13 0.80000 0.80000 12.6563
28-Mar-14 1.10000 1.10000 12.8185
28-Mar-14 1.10000 1.10000 12.8642
Scheme Name Record Date Individual Corporate Nav(in Rs./Unit) (in Rs./Unit)
Regular Plan - Annual Div
Regular Plan - Annual Div
Regular Plan - Annual Div
Direct Plan - Annual Div
Face value: `10

FamilySolution