investmentinsights - wordpress.com does careful attention to risk control have the same beneficial...
TRANSCRIPT

by andrew r. olma and laurence b. siegel
5.04m ay 2 0 0 4
v o l u m e 7 i s s u e 3
a new framework for
INTERNATIONAL INVESTING
The Investment Research Journal from barclays global investors
InvestmentInsights

InvestmentInsights
c o n t r i b u t i n g w r i t e r s
Andrew R. OlmaHead of Active International Equity
Andrew R. Olma heads up the Non-US Active Equity Strategies Group
in San Francisco where he oversees all International Tilts and AIE strate-
gies managed in SF. He joined the firm in 1992 as a portfolio manager
for US small cap index funds and later went on to become the Chief
Investment Strategist for US and non-US developed market equity
index strategies. In 1998, he moved to the Global Advanced Active
Group working on projects for Blake Grossman and helping out with
International Tilts, which he took over in 2000. Before joining BGI, Andy
was a consultant for four years with Watson Wyatt in Chicago working
primarily with corporate pension plans. Andy was also an officer in the
US Air Force for four years. He has an MBA from Boston University
and a bachelor’s degree in electrical engineering from MIT. Andy is
a Chartered Financial Analyst and has previously served on the
FTSE World index committee.
Laurence B. SiegelDirector of Investment Policy Research, Ford Foundation
Guest co-author Laurence B. Siegel is director of investment policy
research at the Ford Foundation in New York, where he has worked
since 1994. Previously, he was a managing director of Ibbotson
Associates, a Chicago-based investment consulting and data firm he
helped to establish in 1979. He has also worked at the Marmon Group
and the American Enterprise Institute. Larry chairs the investment com-
mittee of the Trust for Civil Society in Central and Eastern Europe, and
serves on the investment committee of the NAACP Legal Defense Fund.
He is on the editorial board of The Journal of Portfolio Management, the
Research Foundation of AIMR, and the Journal of Investing. His first
book, Benchmarks and Investment Management, was published in
2003. Larry received his BA in urban studies in 1975, and his MBA
in finance in 1977, both from the University of Chicago.
e x e c u t i v e e d i t o r s
Barton Waring415 597 2064 phone415 618 1474 [email protected]
Kathy Taylor415 908 7738 phone415 618 1470 [email protected]
e d i t o r
David Kurapka415 597 2705 phone415 618 1434 [email protected]

1m a y 2 0 0 4
Table of Contentsi n t h i s i s s u e
Introduction . . . . . . . . . . . . . . . . . . . . . . . . . . . . . . . . . . . . . . . . 2
Why invest internationally?Restating the case for international equities . . . . . . . . . . . . . . . . . 3
Sidebar: Country effects versus sector effects . . . . . . . . . . . . . . . . 8
Should international investors take a lot of active risk? . . . . . . . . 13
The new international framework: Making bets in three independent dimensions . . . . . . . . . . . . . . 19
Conclusion . . . . . . . . . . . . . . . . . . . . . . . . . . . . . . . . . . . . . . . . 25
a new framework for
INTERNATIONAL INVESTING

InvestmentInsights2
Introduction
If the investor decides to invest in international
equities, should he or she take a lot of active risk,
hoping to profit from market inefficiencies that are
perceived to be larger internationally than in the
US? Or does careful attention to risk control have
the same beneficial effects on a portfolio of inter-
national equities that it does in other asset classes?
Finally, assuming that controlling the active risk
in an international equity portfolio is important,
does it make sense to think about and manage
that active risk in a multidimensional context?
International equities involve dimensions of
decision making—country allocation and currency
management—that are not required in home-
country portfolios. Is the traditional practice
of allowing stock selection to dictate country and
currency positions sound, or can one earn addi-
tional returns by allowing the manager to separate
these decisions and manage country and currency
positions independently of stock holdings?
In our experience, plan sponsors ask a whole
barrage of questions when contemplating their
allocations to international equities, although not
always with the clean separation of issues that one
might prefer when trying to answer them. Our goal
in this paper is to provide both a framework for
how to think about international equities, and
to set forth sensible answers that are capable
of being put into action.
hy invest internationally? Do international equities still offer
diversification opportunities not available in the US? After more than a decade
of underperformance, should we be shying away from international assets, or
should we instead be looking to these assets for diversification and, perhaps,
superior future performance?
w

3
Why invest internationally? Restating the case for international equities
WHY INVESTORS ARE QUESTIONING THEIR INTERNATIONAL EQUITY ALLOCATIONS
After decades of exceptional performance, interna-
tional equities (from the viewpoint of US investors)
have lagged US equities since about 1990. Over-
shadowed as a diversifying asset by bonds, real
estate and hedge funds, international equities have
become a topic of reflection and skepticism among
plan sponsors, many of whom have been starting
to challenge the basic premises underlying inter-
national equity investing.
■ Exhibit 1 shows the history that has led to
this skepticism. Beyond the simple fact of
underperformance since 1990, some of the
challenges to international investing that we
hear in plan sponsors’ discussions include:
“International investing no longer diversifies
the risk of US equities.”
■ “US-based multinational companies are those
best positioned to thrive in an environment of
increased globalization.”
■ “Non-US companies are particularly subject to
opacity in financial reporting, government con-
trol, and motives other than shareholder value.”
■ “In addition to the ordinary market risks to
which all equities are exposed, international
equities expose the investor to currency fluc-
tuations, which add risk but not return.”
Mostly these concerns do not hold up to rigorous
scrutiny, but each contains a tempting seed of
intuition. We respond to each of these concerns
by restating and updating, in a relatively brief
space, the case for international equity investing
by US-based sponsors that the present authors,
along with Patricia Dunn, set forth at greater
length in a 1999 Investment Insights.1
The principal arguments for international
investing, as presented in the 1999 Investment
Insights, are:
■ The success of US companies in global mar-
kets over the last decade reinforces the case
for international investing: high profit margins
are a target, not a moat.
1 Patricia C. Dunn, Andrew R. Olma, and Laurence B. Siegel, “The Case for International Investing,” Investment Insights, Barclays Global Investors, San Francisco, May 1999.
YEARS
GR
OW
TH O
F $1
.00
INV
ESTE
D
DEC
EMB
ER 3
1, 1
969
Exhibit 1historical total returns on the s&p 500 and eafe indexes
0.1
1
10
100
1969 1971 1973 1975 1977 1979 1981 1983 1985 1987 1989 1991 1993 1995 1997 1999 2001
Sources: MSCI, S&P.
MSCI EAFE S&P 500
m a y 2 0 0 4

InvestmentInsights4
■ Global markets are not all that integrated nor
should we expect their returns to be excessively
correlated; today’s high correlation is likely to
be an aberration.
■ The US is not a complete investment universe.
Unique companies and industries exist outside
the United States. One can diversify risk
through market completion.
■ Non-US economies, especially emerging
markets, offer faster rates of long-term
economic growth than the US.
■ Some liabilities are better offset by inter-
nationally diversified investments than by
US-only investments.
Although we did not say so in 1999, we would add:
■ Currency risk, at least in developed markets,
can be managed to an optimal level or if the
investor so prefers, even avoided entirely.
Here, we review and update these arguments.
DOMINANCE OF THE UNITED STATES: A PERILOUS ILLUSION
During the 1990s boom, many US companies
increased their share of the global market for
their products or services. This phenomenon was
accompanied by exceptional performance of the
US stock market, reflecting growing profit margins.
Rightly or wrongly, many analysts and corporate
managers came to regard US-based companies
as having a “moat” of protection around them,
consisting of technological superiority, skillful
supply-chain management, labor mobility and
limited government regulation.
Although the contraction of 2000–2002 cut very
sharply into corporate earnings in the United
States, the S&P still beat EAFE in the associated
bear market. The bear market years seemed to
reinforce, rather than to counteract, the idea that
international investing is a no-win proposition.2
Recently, US corporate profits have started to
improve. While the go-go years of the 1990s have
not returned, the impression is once again wide-
spread that US companies can earn extraordinary
profits in the long run.
But let’s recall a basic principle from Economics
101: extraordinary profits are an irresistible target.
They get competed away. There is plenty of financ-
ing available (at low costs of capital) for those who
would try. That is what markets are for.
The economist Joseph Schumpeter coined the
vivid phrase “creative destruction” as a metaphor
for competitive capitalism. In a world of creative
destruction, there are no permanent advantages.
Not only European and Japanese companies, but
also organizations in China, India and in the rest
of the developing world, stand to benefit tremen-
dously if they can erode the US advantage in any
number of goods and services.
Some of this erosion has already been achieved.
Even after 13 years of recession in Japan, com-
panies in that country are globally dominant
in automobiles and consumer electronics.3
The world capital of the semiconductor industry
is Taiwan. Most of the world’s clothing is manufac-
tured in east and south Asia. The steel industry,
once a powerful fixture of corporate America, is
now concentrated in China, Brazil and South
2 EAFE did beat the S&P in the rally or “new bull market” that began in the spring of 2003, but that was entirely due to currency fluctuations (i.e. EAFE underperformed in local-currency terms, but the dollar declined so that EAFE in US dollars outperformed the S&P). At any rate that is too short a period from which to draw much of a conclusion.
3 The formal definition of “recession” doesn’t apply to the entire 1990–2003 period in Japan, but as a descriptive device it seems accurate.

5m a y 2 0 0 4
Korea. European financial institutions control a
vast swath of banking, insurance and investment
management assets. The world’s second and third
largest aircraft manufacturers are European and
Brazilian, respectively.
US multinational corporations do gain some of the
profits from this global manufacturing and trading
melee; this has been one of the secrets of their past
success. But, as Hardy (1997) has demonstrated,
the performance of US multinationals is much
more closely aligned with that of other US stocks
than with international stocks.4 The investor must
buy international stocks (that is, stocks not in the
US benchmark) to take advantage of the full range
of opportunities that will arise from non-US com-
panies attempting to capture some of the large
profit margins that US companies have been
able to achieve in recent years.
CORRELATION OF MARKET INDEXESWhile the correlation of the US equity market
with international markets is currently quite high,
investors shouldn’t assume that it always will be.
Exhibit 2 shows the rolling 60-month correlation
of the S&P 500 with several MSCI international
equity indexes. Note that as recently as 1997,
when the world was not all that different than
it is now, this correlation was near a historic low,
about 0.3. This wide fluctuation suggests that the
currently high US/non-US equity correlation is not
a fundamental feature of the investment landscape
but a happenstance.
We can identify at least one of the causes of
today’s high correlation: starting in 1998, the
global, technology-led equity price bubble and
subsequent reversal caused correlations to soar;
in other words, the “technology factor” had a large
influence on equity returns in many different
countries. As a result, looking back five years
from today, the US/non-US equity correlation is
above 0.8, and stands at its all-time high. But the
relevant correlation for investors today is the cor-
relation over the next five years, not over the last
five years. We do not expect another bubble. And
as one can easily see from the exhibit, historical
While the correlation of the US equity market with international markets is currently quite high, investors
shouldn’t assume that it always will be.
4 Describing the work of Hardy (1997), Dunn, Olma, and Siegel (1999) write: “Hardy. . .uses returns-based style analysis. . .to examine the extent to which international exposure can be achieved by buying stocks of US-based multinationals. [If so,] ‘these US stocks would have to behave like foreign securities,’ [Hardy writes]. ‘A simple way to test this idea,’ [Hardy continues], ‘is to do a style analysis on these companies. If these stocks behave at all like foreign markets, it will be demonstrated by significant weightings in the EAFE index.’ Of seven [US multinational] companies [that Hardy analyzed], only Coca-Cola and Colgate-Palmolive showed any weight at all in EAFE when regressed against five factors (EAFE plus the four Russell domestic style indices). Moreover, the EAFE weights are small: 5.3% in EAFE for Coca-Cola, which earns 80% of its profits outside the US, and 9.6% in EAFE for Colgate-Palmolive. Avon Products, Gillette, McDonalds, Philip Morris, and Procter & Gamble showed no evidence of being influenced by EAFE using this methodology.”
Hardy concluded that one cannot gain exposure to the non-US market factor by constructing a portfolio of these popular US growth stocks. He performed a similar analysis for US multinational-company mutual funds, with the same result. See Stephen R. Hardy, “International Exposure—Going Multi–National,” The Advisor, vol. 21 (November 18, 1997), Zephyr Associates, Zephyr Cove, Nev.
InvestmentInsights6
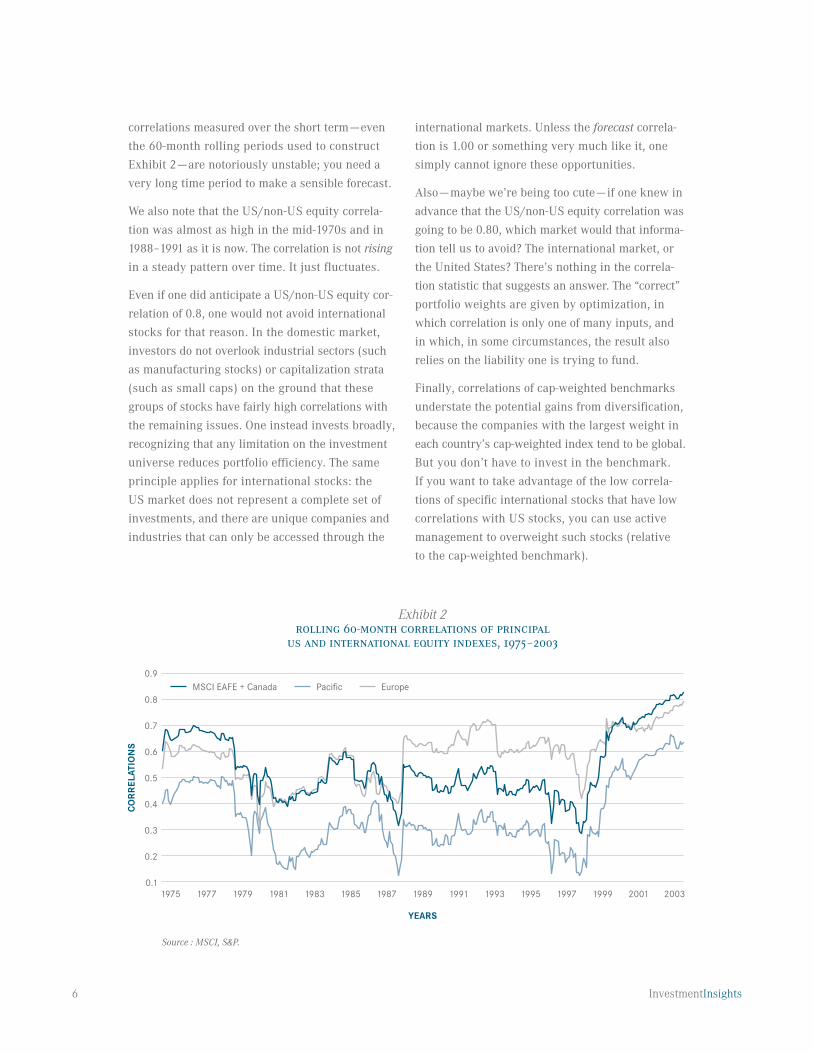
correlations measured over the short term—even
the 60-month rolling periods used to construct
Exhibit 2—are notoriously unstable; you need a
very long time period to make a sensible forecast.
We also note that the US/non-US equity correla-
tion was almost as high in the mid-1970s and in
1988–1991 as it is now. The correlation is not rising
in a steady pattern over time. It just fluctuates.
Even if one did anticipate a US/non-US equity cor-
relation of 0.8, one would not avoid international
stocks for that reason. In the domestic market,
investors do not overlook industrial sectors (such
as manufacturing stocks) or capitalization strata
(such as small caps) on the ground that these
groups of stocks have fairly high correlations with
the remaining issues. One instead invests broadly,
recognizing that any limitation on the investment
universe reduces portfolio efficiency. The same
principle applies for inter national stocks: the
US market does not represent a complete set of
investments, and there are unique companies and
industries that can only be accessed through the
international markets. Unless the forecast correla-
tion is 1.00 or some thing very much like it, one
simply cannot ignore these opportunities.
Also—maybe we’re being too cute—if one knew in
advance that the US/non-US equity correlation was
going to be 0.80, which market would that informa-
tion tell us to avoid? The international market, or
the United States? There’s nothing in the correla-
tion statistic that suggests an answer. The “correct”
portfolio weights are given by optimization, in
which correlation is only one of many inputs, and
in which, in some circumstances, the result also
relies on the liability one is trying to fund.
Finally, correlations of cap-weighted benchmarks
understate the potential gains from diversification,
because the companies with the largest weight in
each country’s cap-weighted index tend to be global.
But you don’t have to invest in the benchmark.
If you want to take advantage of the low correla-
tions of specific international stocks that have low
correlations with US stocks, you can use active
management to overweight such stocks (relative
to the cap-weighted benchmark).
Exhibit 2rolling 60-month correlations of principal
us and international equity indexes, 1975–2003
CO
RR
ELAT
ION
S
0.1
0.2
0.3
0.4
0.5
0.6
0.7
0.8
0.9
YEARS
200320011975 1977 1979 1981 1983 1985 1987 1989 1991 1993 1995 1997 1999
Source : MSCI, S&P.
Pacific EuropeMSCI EAFE + Canada

7m a y 2 0 0 4
Correlations in the long run. A very long view
of global equity market correlations helps to gain
further understanding of the dynamics of interna-
tional investing. Goetzmann, Li, and Rouwenhorst
(2002) note that the correlations of equity market
returns across countries have ebbed and flowed,
reaching highs in the mid-nineteenth century, in
the early twentieth century, and then again very
recently.5 Correlations have tended to be low at
most other times. Exhibit 3 shows the average
correlation across all pairs of countries for which
Goetzmann et al. were able to obtain return data.6
Goetzmann et al. indicate that correlations have
tended to be high when the investment opportu-
nity set was expanding rapidly, a condition that
corresponds to high or rising levels of global mar-
ket integration. Like the period from 1890 to 1914,
the current time period is marked by such integra-
tion and by burgeoning markets, for both financial
and real assets, all over the world.
But the spread of market economies has to stop
somewhere—one eventually runs out of countries—
and the Ricardian process of specialization among
countries begins to affect market returns, lowering
the correlations.7 In an integrated world, each
country produces what it is best at (since its
AVER
AGE
CO
RR
ELAT
ION
Exhibit 3average 60-month correlation of equity indexes across pairs of countries, 1860–2000
1860 1880 1900 1920 1940 1960 1980 2000
Source: Goetzmann, Li, and Rouwenhorst (2002).
YEARS
0.0
0.1
0.2
0.3
0.4
0.5
5 William N. Goetzmann, Lingfeng Li, and K. Geert Rouwenhorst, “Long-Term Global Market Correlations,” Yale International Center for Finance Working Paper No. 00-60, 2002, http://papers.ssrn.com/abstract=288421.
6 Note that Exhibit 3 overstates the diversification benefit available to US investors in international equities because (1) the analysis weights all countries equally, rather than according to their capitalizations; and (2) the analysis does not isolate the correlation of the US with each country, but treats all cross-correlations equally.
7 It’s also conceivable that, instead of triumphing, global capitalism could decline; under such conditions, markets would tend to become more segregated and correlations would fall. The argument by David Ricardo (1817 [1996]) that nations, like individuals, find their area of specialty or comparative advantage if trade among them is pos-sible was enunciated in an investment-returns context in Roll (1992), and is also discussed, without attribution, in Dunn, Olma, and Siegel (1999). See David Ricardo, [On the] Principles of Political Economy and Taxation, Prometheus Books, Amherst, NY, 1996 (originally published in 1817), chapter 7.

InvestmentInsightsInvestmentInsights8
If profitable arbitrage opportunities can be found,
then markets are segmented (since, in integrated
markets, arbitrageurs would have eliminated these
opportunities). But in equity markets, it’s harder
to determine whether arbitrage opportunities exist
across countries, since the relevant test is whether
the expected equity risk premium (per unit of
risk) is the same in different countries. You can’t
observe expected equity risk premia directly, and
using realized premia as a proxy for expected
premia involves far too much noise. Thus the
fruitful research on equity market integration
has focused on whether country or industrial
sector has greater power in explaining the cross-
section of stock returns.
The answer at least through the middle 1990s
has been that the country effect dominates, sug-
gesting substantial market segmentation since
stock returns should cluster by sector if markets
are integrated. This was demonstrated by one of
the landmark country-versus-sector effect studies,
that of Heston and Rouwenhorst (1995).* Their find-
ing that country effects dominated in the period
they studied, 1978–1992, indicates that interna-
tional equity markets were still quite segmented
over that period, despite the superficial appear-
ance of integration (due to the existence of global
investment funds and other such institutions).
To see how a country/sector study provides evi-
dence on capital market integration or segregation,
think about stock returns in states of the US, where
the capital market really is integrated across state
lines, with one national currency, a national yield
curve, a national equity market in New York and
so on. Do Californian stocks move together as a
regional “asset class”? No, tech companies in
California tend to co-vary with tech companies
in Massachusetts, and agricultural firms in Texas
and Iowa have similar returns. In the integrated
US market, sector (as opposed to “state”) explains
almost everything.
But a more up-to-date BGI study shows that, in
accordance with intuition, sectors are becoming
important in explaining equity returns, at least in
developed markets. (Part of this new importance
of sector returns arises from the influence of the
technology factor across global markets in 1998–
2003.) Yet, as shown in Exhibit A, country variation
is still more important than sector variation—
about 1.2 times as important, down from being
almost three times as important a decade ago. Just
because something is less important than it used
to be doesn’t mean that it should be ignored!
Moreover, market segmentation will probably con-
tinue indefinitely into the future. One reason is the
“home country bias,” in which investors persis-
Much effort has gone into research that attempts to determine whether
global capital markets are integrated or segmented. Integration studies in
fixed income and currency markets give fairly clear-cut results, since one
can test for uncovered interest parity and other conditions that strongly
suggest integration or segmentation.
Country effects versus sector effects
* Steven L. Heston and K. Geert Rouwenhorst, “Industry and Country Effects in International Stock Returns,” The Journal of Portfolio Management, Spring 1995, pp. 53–58.

m a y 2 0 0 4m a y 2 0 0 4
tently overweight their own country’s markets.
They do so partly because their liabilities are mostly
denominated in the home currency, but also out
of fear of the unknown and out of concerns about
investment costs, lack of information and transpar-
ency, and other difficult-to-manage risks in other
countries. Exhibit B compares cross-border invest-
ments by pension funds in various countries with
those countries’ weights in a global equity bench-
mark (the MSCI World index). In every case, the
home country weight is much larger than the
benchmark weight. Such behavior—dramatically
visible after more than two decades of international
managers striving to get plan sponsors to do the
opposite—will keep segmented markets, and thus
country effects on stock returns, alive for a long
time to come: possibly forever. The “borderless
world” anticipated by some pundits a decade or
two ago does not look like a particularly good
forecast any more.
If there is still a substantial country effect, then
it makes sense to undertake country selection
as a discipline independent of stock selection or
currency selection. The evidence indicates that
country effects—the dispersion among the returns
of cap-weighted equity benchmarks in different
countries—are very much alive, so that, as we
argue in more depth later, country selection
can be profitable.
PER
CEN
T O
F A
SSET
S
Exhibit Bhome country bias of pension fund investments in various countries
USA Japan UK Other
Source: InterSec.
0
20
40
60
80
100
Percentage of pension fund invested domestically
Weight of country's equity market as a percentage of global equity market capitalization
RAT
IO O
F C
OU
NTR
Y A
ND
SE
CTO
R ST
AN
DA
RD
DEV
IATI
ON
S
Exhibit Acountry variation compared to sector variation
in developed international equity markets, 1989–2003
0.5
1.0
1.5
2.0
2.5
3.0
Sources: MSCI, BGI.
YEARS
2000 2001 2002 20031989 1990 1991 1992 1993 1994 1995 1996 1997 1998 1999
9

InvestmentInsights10
people can trade for any goods in the world that
they want). As a result, the industrial mix differs
from one country to another. This is in contrast
to a segmented world in which each country must
be self-sufficient, with an agricultural sector an
extractive industries sector, a banking sector
and so on. Thus, country returns will be imper-
fectly correlated even if capital markets are
entirely integrated.
THE UNITED STATES IS NOT A COMPLETE INVESTMENT UNIVERSE
Perhaps the easiest way to see that international
equities offer diversification and active manage-
ment opportunities that are different from those
afforded by US equities is to compare industry
weights across country indexes. Exhibit 4 provides
this comparison. While the data mostly speak for
themselves, let’s note a few specifics:
■ Korea and Taiwan are dominated by technology
firms (in fact, there are whole subc ategories of
technology in which one simply cannot invest
through US companies).
■ Industrials and consumer discretionary stocks
are more prevalent in Japan and Germany than
in the US.
■ The large size of European and British banks
cause financials to have a larger weight outside
the US than within it.
Exhibit 4, then, tends to confirm the intuition that
the US equity market does not fully capture the
world’s industrial mix. Moreover, even if the US
had the same sector weights as non-US economies,
the specific companies differ, and (it should go
without saying) the US companies are not always
superior. In other words, US sector portfolios are
not as diversified as global sector portfolios.
Exhibit 4sector weights in various countries
Notes: EAFE = Europe, Australasia, Far East equity index. EMF = Emerging Markets Free equity index. Data for individual countries represent the MSCI equity index for the country indicated. As of 9/30/03.Source: BGI, based on Fact Set Data.
US MSCI MSCIGICS sector S&P 500 EAFE Selected countries in EAFE EMF Selected countries in EMF
France Germany Japan UK Mexico Korea Taiwan
Consumer discretionary 11.1 11.5 14.8 15.8 21.9 10.5 7.0 11.9 12.8 4.1
Consumer staples 12.9 9.0 13.5 3.7 6.4 10.7 6.3 23.4 3.1 1.0
Energy 5.7 8.1 17.1 – 0.8 13.9 11.1 – 0.6 –
Financials 20.8 25.9 17.3 22.1 15.7 27.1 16.4 7.2 15.4 17.0
Health care 13.8 9.2 10.5 4.9 5.8 13.2 2.8 – 0.2 –
Industrials 10.6 9.0 6.7 15.2 15.3 5.4 6.1 3.5 5.2 4.3
Information technology 17.6 7.2 7.1 8.1 16.9 0.8 17.9 – 40.8 58.8
Materials 2.8 6.6 5.9 12.1 7.5 4.0 16.5 12.7 8.9 12.2
Telecommunication services 3.4 7.5 4.0 7.8 4.6 10.3 12.1 41.3 9.3 2.5
Utilities 2.9 4.6 3.1 10.1 5.2 4.1 3.8 – 3.6 –
100.0 100.0 100.0 100.0 100.0 100.0 100.0 100.0 100.0 100.0

11m a y 2 0 0 4
Active management opportunities outside the US. We noted earlier some of the unique com-
panies and industries that can be found outside
the US. In quantitative terms, these not only give
a different character to any given benchmark (at
the sector, country or multicountry level), but also
add to the range of risk-factor exposures that can
be achieved by making active bets away from
any given benchmark. In other words, active deci-
sions have greater potential breadth in the global
equity market than in just one country (the US).
As Grinold and Kahn (2000) show, such breadth—
which they define as the number or variety of
different investment decisions to which a given
set of active management skills can be applied—
translates mathematically to a higher expected
alpha, if all other things are held equal and, of
course, if the manager actually has skill.8 We’ll
present this mathematical relationship later in
a slightly different context on page 20.
FASTER GROWTH OUTSIDE THE UNITED STATES
When we suggest that economic growth and thus
potentially, capital market returns, may be faster
outside the US than inside it, we’re mostly referring
to emerging markets. The process of developing
the physical, commercial and financial infrastruc-
ture of a country generates enormous wealth. The
trick for shareholders is capturing some of it;
historically, the connection (across countries)
between GDP growth and equity returns has been
tenuous. To some extent that is because workers
(consumers) capture much of the GDP gain, as
they should. But there should be plenty left over
for providers of risk capital. (There had better be,
or the whole process of economic development
will grind to a halt.)
The historical failure of emerging markets to
provide returns commensurate with the develop-
ment of the real economies is, in our view, mostly
due to inadequate legal protections for shareholders
from the predations of management and politicians
(perhaps that is why these markets are not already
developed). As the success of South Korea, Singa-
pore and other countries that have transitioned
from Third to First World status is studied and
emulated, we can expect other developing coun-
tries to adopt more enlightened policies. As a
result, we anticipate a closer match between real
economic growth and the returns available to
international equity investors.
In addition, only a modern-day Oswald Spengler
would write off the developed world, outside the
United States, as a sinkhole of economic decline.9
Britain was the “sick man of Europe” only 25 years
ago, and the United States didn’t look much better.
Germany and Japan were booming. These rela-
tionships have largely been reversed. Although
stagnation in Japan and in much of the European
Union could persist, we believe that market and
The process of developing the physical, commercial and financial infrastructure of a country generates enormous
wealth. The trick for shareholders is capturing some of it.
8 Richard C. Grinold, and Ronald N. Kahn, Active Portfolio Management, 2nd edition, McGraw-Hill, New York, 2000.
9 Spengler, a German social critic, wrote The Decline of the West (somewhat prematurely) in 1922.

InvestmentInsights12
political forces tend to correct such problems, at
least in the very long run. Voters, for example, react
to economic hardship by trying new programs and
systems. Today, there are stirrings of liberalization
in Japan that would, if effective, lead to a renewal
of economic growth in that country, and it is not
unreasonable to forecast a similar chain of events
in “Old Europe.”10
If that is not enough to get US investors to look
abroad, equity valuations are, as of this writing,
considerably cheaper in both developed non-US
markets and in emerging markets than in the US.
Since relative valuations can change quickly, how-
ever, we won’t emphasize them too much.
ASSET-LIABILITY MANAGEMENT USING INTERNATIONAL EQUITIES
As we pointed out in 1999,11 many pension plans
and other institutions have liabilities with long-term
exposure to international markets. We’re referring
to pension plans for US, not foreign, employees.
The reason, which we’ll admit is subtle, is that the
sponsoring company often earns a great deal of its
income outside the US, or because it sells to or
buys from other companies with such exposures.
Additionally, the plan must provide purchasing
power for beneficiaries whose consumption
patterns are influenced by global factors.
While the correlation between international equi-
ties in the asset mix and international risk factors
in the liability is far from perfect, there is a partial
hedge from which plan sponsors can benefit. For
example, mobile telephone hardware is mostly a
non-US business. If the wage costs (and thus the
pension liabilities) of a US-based mobile phone
manufacturer rise because a telecom boom
increases global demand for engineers qualified
to work in that industry, an investment position
in global mobile-phone stocks helps to hedge
that increase.
MANAGING CURRENCY RISKNow that we’ve reviewed the basic case for
international diversification, we look at issues
surrounding the implementation of an investor’s
decision to hold international equity assets. First,
we question the commonly held view that inter-
national equity portfolios are a particularly
fertile field in which to take active risk. Later
we focus on the problem of currency manage-
ment in international equity portfolios, noting
that this problem receives surprisingly little
attention given how important it is in deter-
mining investment performance.
If the wage costs (and thus the pension liabilities) of a US-based mobile phone manufacturer rise because a telecom
boom increases global demand for engineers qualified to work in that industry, an investment position in global mobile-
phone stocks helps to hedge that increase.
10 There are a number of economic “tigers” in Europe, including Ireland and several countries east of the former Iron Curtain. The current stagnation is centered in France and Germany.
11 With Patricia C. Dunn as a co-author. See Dunn, Olma, and Siegel (1999).

13m a y 2 0 0 4
Should international investors take a lot of active risk?
One of the persistent myths of international invest-
ing is that high levels of active risk (with the
resulting expectation of generating a high alpha)
are desirable. Two kinds of arguments are used
to support this contention: first, high alphas have
been earned by international managers in the past;
and second, international markets are likely to be
less efficient than the US market. We’ll address
each of these issues in turn. To begin, however,
let’s review the general principles of active return
and active risk, as set forth in Waring, Whitney,
Pirone, and Castille (2000) and Waring and Siegel
(2003a, 2003b).12
WHY INVESTORS SHOULD BE AVERSE TO ACTIVE RISK
The dream of getting something for nothing dies
hard. If the US market is too efficient for most
active managers to prosper, maybe they can find
greener pastures abroad. After all, many non-US
markets look like they might be quite inefficient—
they are less transparent, offer less security
analysis, and have fewer institutional investors.
If there’s still a place in the world for managers
who cast the benchmark aside and “just buy stocks
that go up,”13 it must be in countries where price
and value are more widely separated than they
are in the United States.
We believe that this kind of thinking is danger-
ously flawed. The fact that active management is
a zero-sum game, the a priori efficiency of the
market portfolio, and the special aversion that
investors should have to active risk apply in inter-
national markets just as much as they do in the
United States.
the zero-sum nature of active management
The zero-sum nature of active management is
simply a mathematical fact, and has nothing to
do with whether the market is efficient or whether
the capital asset pricing model (CAPM) holds or any-
thing else. If the benchmark is properly specified,
so that it embraces the opportunity set of invest-
ments in a given asset class, country, sector or
other aggregation, then the returns of all investors
in that market must, by mathematical construc-
tion, sum to the return on the benchmark. The
Nobel Prize–winning economist William Sharpe
demonstrated this a generation ago, although his
best exposition of it is relatively recent (and only
two pages long).14
Because any alpha in a portfolio is earned at
the expense of other investors in the same asset
class, alpha is difficult to achieve. It’s even more
difficult to sustain over time in a statistically
significant manner. That is what happens when
smart people play a zero-sum game with each
other. Only if there are a great many players in
a market who are motivated by something other
than profit (as in currency markets, as we’ll argue
later) can one justify active management as a good
general approach. Under normal circumstances,
where most players in the market are seeking
12 Barton M. Waring, Duane Whitney, John Pirone, and Charles Castille, “Optimizing Manager Structure and Budgeting Manager Risk,” The Journal of Portfolio Management, Spring 2000. Barton M. Waring, and Laurence B. Siegel [2003a], “The Dimensions of Active Management,” The Journal of Portfolio Management, Spring 2003. Barton M. Waring, and Laurence B. Siegel [2003b], “Understanding Active Management,” Investment Insights, Barclays Global Investors, San Francisco, April 2003.
13 As Will Rogers advised investors to do. (He was kidding.) The full quote is: “Take all your savings and buy some good stock and hold it ’til it goes up, then sell it. If it don’t go up, don’t buy it.” Bryan B. Sterling, and Frances N. Sterling, eds., A Will Rogers Treasury: Reflections and Observations, Crown Publishers Inc., New York, 1982, p. 157 (quoted in Dunn, Olma, and Siegel [1999]).
14 William F. Sharpe, “The Arithmetic of Active Management,” Financial Analysts Journal, January/February 1991.

InvestmentInsights14
to maximize their return and to control risk,
active managers usually get beaten by their
own benchmark.
The zero-sum game argument applies, of course,
only before costs have been deducted from investor
returns. After costs—which are typically substan-
tial for active managers in international equity
markets, as they tend to be even in the US—
active management is a negative-sum game.
Then why do it? Waring and Siegel (2003a) note
that there are two conditions which must apply
before any plan sponsor can rationally decide to
use active managers:
■ The sponsor must believe that skillful active
managers exist—in other words, that there are
managers who can beat their properly specified
benchmarks, after costs, not just by luck but
through skill that is persistent enough over time
to deliver a statistically significant alpha, and at
the desired level of active risk (tracking error).
■ The sponsor must believe that he or she has the
skill to identify these managers (out of a much
larger population of managers who don’t meet
these criteria).
Few sponsors will have trouble with the first
condition; people differ too much in their native
abilities, and in their training, for all advantages to
have already been wiped out. Nor it is sensible to
believe that analysts have properly incorporated
all available information into security prices.
The second condition is tougher, since historical
performance may be due to luck and not repeat-
able, and the other criteria that one can reasonably
use to select skillful managers are “fuzzy.” But,
in our experience, just about all sponsors do in
fact hire at least some active managers. It is impor-
tant that they keep these two conditions in mind
when doing so.
the a priori efficiency of the market portfolio
But let’s take this a step farther. In a story too
often retold, so we’ll keep it short, Markowitz
(1952) showed how to build “efficient” portfolios
of securities, so that the expected return on the
portfolio is maximized at each risk level.15 He
called this procedure “optimization.” Sharpe
(1964) showed that if all investors behave as
Markowitz prescribed, and if they also agree
on the expected return and risk of each security
and on the expected correlations of each security
with every other,16 then the cap-weighted market
portfolio itself—the market benchmark—is
the most efficient portfolio (again in the sense
of having the highest expected return at a
given level of risk).17 Sharpe’s discovery is
15 Harry M. Markowitz, “Portfolio Selection,” Journal of Finance, March 1952. Published in book form as Harry M. Markowitz, Portfolio Selection: Efficient Diversification of Investments, 1st edition, 1959; 2nd edition, Oxford: Basil Blackwell, 1991.
16 And if one imposes a few other conditions. For a discussion, see William F. Sharpe, Gordon J. Alexander, and Jeffery V. Bailey, Investments, 5th ed., Prentice-Hall, Englewood Cliffs, N.J., 1995, chapter 10.
17 William F. Sharpe, “Capital Asset Prices: A Theory of Market Equilibrium under Conditions of Risk,” Journal of Finance, September 1964 (vol. 19, no. 3), pp. 425–442. John Lintner, Jan Mossin and Jack Treynor discovered the CAPM at about the same time as Sharpe.
Sponsors generally are several times more averse to active risk than to policy risk.

15m a y 2 0 0 4
known as the capital-asset pricing model or CAPM
(actually the CAPM tells a richer story, but we’ll
stop there).
Now, the CAPM is not entirely realistic. The con-
ditions are too stringent: not everyone optimizes,
and investors disagree with one another on return,
risk and correlation estimates. Researchers have
found many anomalies, or reasons to believe that
the market isn’t perfectly efficient or that the
CAPM doesn’t hold precisely. The strong risk-
adjusted performance of small-capitalization
stocks as compared to large ones, and of value
stocks as compared to growth stocks, are just
the best known of these anomalies. There are
many others. Active managers rightly use such
discoveries to justify their continuing efforts.
Yet the burden continues to be on active man-
agers to show that their portfolios are more
efficient than the market portfolio or the bench -
mark that they’re trying to beat. The burden
arises from the clean logic of Sharpe’s CAPM
as well as from the zero-sum nature of active
management. Historically, most active man-
agers have underperformed.18
why investors are or should be averse to active risk
The CAPM also provides a way to break up total
investment risk into two very different parts:
■ Policy risk: the part of total risk that arises
from exposure to or co-movement with the
market benchmark.
■ Active risk: the part of total risk arising from
active bets, or deviations from the benchmark.
Policy, or beta, risk is rewarded by the delivery of
the equity risk premium, which exists in equilib-
rium because almost all participants in a market
are averse to risk and so price riskier assets to
have higher expected returns than riskless or low-
risk assets. Active risk, as we showed earlier, is
rewarded only to the extent that one investor is
able to take alpha away from the other investors
in the market. As we almost said earlier, and we’ll
complete the thought now that we have the tools
to do so, beta is easy and alpha is hard.
Reflecting this state of affairs, sponsors generally are
several times more averse to active risk than to pol-
icy risk. This behavior is rational, precisely because
obtaining a reward for taking beta risk is easy but
getting paid for alpha risk is hard. The apportionment
of total risk between its policy and active components
is beyond the scope of this brief review, but to get
a general idea of how much active risk to take, con-
sider Grinold’s (1990) and Kahn’s (2000) formula:
hmgr ~ E IRmgr •
1qmgr
= E q2mgr
amgr
(1)
where:
hmgr is the holdings weight of portfolio or
manager (its percentage allocation),
IRmgr
is the expected information ratio
of the manager,
amgr is the manager’s expected alpha,
and
qmgr is the expected tracking error, or volatility
of the manager’s pure alpha around a properly
established benchmark.19
18 Mark M. Carhart, “On Persistence in Mutual Fund Performance,” Journal of Finance, March 1997 (vol. 52, no. 1).
19 Richard C. Grinold, “The Sponsor’s View of Risk,” in Frank J. Fabozzi, ed., Pension Fund Investment Management: A Handbook for Investors and Their Advisors, Probus, Chicago, 1990; Ronald N. Kahn, “Most Pension Plans Need More Enhanced Indexing,” in Brian R. Bruce, ed., Enhanced Indexing: New Strategies and Techniques for Investors, Institutional Investor, Inc. Investment Guides, New York, 2000.

InvestmentInsights16
Note that the holdings weight or desired allocation
to a manager is thus proportional to the expected
alpha, divided by the tracking error squared. As a
result, well-crafted portfolios of managers tend to
have high allocations to index funds and to risk-
controlled, quantitative active products, and low
allocations to traditional medium-or high-risk
active managers.20
We’ll say this one more time: all this depends on
a given active manager actually having skill—on
expected alpha being a positive number.
WHY ACTIVE INTERNATIONAL MANAGERS HISTORICALLY BEAT THEIR BENCHMARKS
Over, say, the last ten or fifteen years, a period
long enough that persistent patterns found in it
should be taken seriously, why did active interna-
tional managers handily beat their benchmarks?
This doesn’t seem possible. As we’ve argued at
length, active management is a zero-sum game, so
that active managers as a group, whose holdings
sum to the securities in the benchmark, cannot
collectively beat that benchmark.21
But large institutional managers of US portfolios
invested in international markets most certainly
did beat the widely used MSCI EAFE benchmark,
on average over that period. Over 1990–2002 they
earned, on average, a compound annual return
some 2.3% higher than EAFE, according to the
investment consulting firm InterSec.22 How did
they manage to do that?
By underweighting Japan, as they had done for a
very long time. In the 1980s, when the Japanese
market was rising rapidly, these same managers
underperformed EAFE because of their below-
benchmark weight in Japan. Specifically, over
1982–1989, they earned, on average, a compound
annual return 3.2% lower than EAFE. Then, when
the Japanese market turned downward in 1990, the
same bet—underweighting Japan—began to have a
positive impact on performance.23 Viewed over the
relevant time period—that is, over the whole cycle
of Japanese stock market outperformance and then
underperformance—the decision by US managers
to underweight Japan had almost a zero net payoff.24
This result is unsurprising for two reasons. First,
it is consistent with the expectation that active
management should not have a positive payoff on
average over time. Second, it reflects the reason
that managers underweighted Japan in the first
place: for risk control. Most managers who under-
weighted Japan didn’t have a directional view on
that country’s market; they simply wanted to
control risk by avoiding too large an investment
in any single country. (Stated another way, the
underweight in Japan is an attempt to reduce the
correlation of the overall international portfolio
20 In addition, well-engineered, market-neutral long-short equity hedge funds, while having relatively high levels of active risk, may have a substantial place in this well-crafted portfolio because they do not suffer from the loss of portfolio efficiency associated with the long-only constraint that applies to traditional active managers.
21 That’s before fees, and indirect costs such as transaction costs. After these deductions, active management is a negative-sum game.
22 See Exhibit 3 on page 24 of Waring and Siegel (2003b). The underlying sources of the data in this exhibit are InterSec (a division of Deutsche Bank) and MSCI.
23 On December 29, 1989, the last trading day of the year, the Nikkei closed at 38,916, the highest level ever reached, before or since, by that index.
24 Over the full 1982–2002 period, the managers studied by InterSec beat EAFE by 0.5% per year. Because the two subperiods (1982–1989 and 1990–2002) are of unequal length, the –3.2% and +2.3% benchmark-relative returns in these subperiods average to a positive, not a negative, number (but the positive number is very small).

17m a y 2 0 0 4
with the market of any one country.) This concern
was not entirely misplaced: over the full 1982–
2002 period, the decision to underweight Japan
did dampen volatility while doing almost nothing
to add to return.
But managers are human and might be expected to
put their best foot forward by only reporting results
from the second half of the period, and characteriz-
ing these results as having added alpha. Investors
need to see past this and analyze the results more
critically. If managers were really consistently
smart, if it were easy to add alpha in international
markets, they would have won in Japan in both
up and down periods.
By the way, active management is a zero-sum
game in every period, if compared to the right
benchmark and if all of the participants in a
market are counted. Thus, in the 1990s, when
US-based international equity managers were
beating their EAFE benchmark, someone must
have been underperforming the benchmark. It’s
likely that these losing investors were corporations,
institutions and individuals in Japan. Because of
the home country bias that we referred to earlier,
in which investors in a given country tend to
overweight the securities of issuers in that coun-
try, and because of regulations and traditions,
Japanese investors held a great deal more in
Japanese equities than they would have if they
had held the EAFE benchmark.
As Siegel (2003) pointed out, if most managers
beat their benchmarks in a given asset class, or
if most managers are beaten by their benchmarks,
it’s unlikely that the managers were collectively all
that smart or stupid.25 More likely, the benchmark
was no good. That EAFE was a poor benchmark for
international equities over the last few decades is
pretty obvious, given the lack of float adjustment
and the fact that so many managers beat it in the
years since 1990. On May 31, 2002, EAFE began to
be fully float-adjusted; as of December 2003, Japan
constituted only 21% of EAFE. Now that Japan has
a much lower weight in EAFE, managers will have
less to gain, in terms of risk control, from under-
weighting Japan and will have to decide to over- or
underweight that country based on its investment
merits. Active risk will no longer give the illusion
of a large payoff. Managers will have to earn their
alphas in international equities, and they will have
to “take a penalty” for the active risk to which they
expose their investors in the pursuit of that alpha.
As in any other asset class, it’s all about the pur-
suit of information ratio—the amount of alpha
earned per unit of active risk taken.
IS THE INTERNATIONAL EQUITY MARKET INEFFICIENT?
The supposedly greater inefficiency of interna-
tional equity markets is the reason usually given
for turning up the risk dial in those markets.
Let’s examine this proposition.
Now that Japan has a much lower weight in EAFE, managers will have less to gain, in terms of risk control, from underweighting
Japan and will have to decide to over- or underweight that country based on its investment merits.
25 Laurence B. Siegel, Benchmarks and Investment Management, Association for Investment Management and Research, Charlottesville, VA, 2003, p. 99.

InvestmentInsights18
It’s a reasonable guess that, as we noted earlier,
there is less transparency, less professional secu-
rity analysis and less institutional holding of assets
than in the US. All these conditions point to at
least a slightly more inefficient market, a higher
likelihood that in any given case the price of an
asset might differ from its fair value.
But we shouldn’t underestimate the level of
sophistication in foreign markets. Non-US nation-
als are just as capable as anyone else of applying
the principles of security analysis and portfolio
management that are taught globally in business
schools, and that are honed through lifetimes of
experience. It’s just that, at least on the surface, the
institutional setting is not quite as highly devel-
oped outside the US, even in “developed” markets.
Extreme levels of inefficiency would be relevant
to the active-risk decision. If no one analyzed
securities in a given market, price would be
unrelated to value. One could then earn a high
alpha by selecting a few of the most undervalued
securities and waiting for the market to recognize
their true worth.
But such an extreme condition doesn’t begin to
apply, at least not in any international market
that has a significant weight in global benchmarks.
Absent the institutional structure that some believe
makes the US market so efficient, other actors
must step in to cause prices to converge to fair
value, and they do. Brokers, private investors and
issuers (companies) all contribute to the price-
discovery process, even if buy-side security analysts
are entirely absent from a given market. And there
is no market in the world that buy-side analysts
have completely overlooked. At the very least, US
and British investment management firms, if not
locals, have adequate if not ideal coverage of every
market economy in the world. A security does not
have to be analyzed in the country in which it is
issued for the price to be roughly fair.
And information is not perfect, nor security analysis
all that reliable, in the US either—witness Enron,
WorldCom and many of the technology and tele-
com stock “blow-ups” of the last few years.
Our conclusion is basically that the international
equity market is just another asset class, just
another benchmark to beat—and you should use
the same rules to beat it (as exposited by Grinold and
Kahn) that you do anywhere. You should separate
policy and active risk, and you should be several
times more averse to active than to policy risk.
The international equity market is not inefficient,
in comparison to the US, by enough of a margin
to be really relevant to the active-risk decision.
And, as we’ve already cautioned, the historical
outperformance of active managers in interna-
tional equities is time-specific and arises from a
risk-control bet against Japan, rather than the true
production of alpha. It’s not a reason to take on
extra helpings of active risk.
We now turn to the question of how to allocate
active risk when investing in international mar-
kets. Specifically, we argue that by disaggregating
the investment decision into its component dimen-
sions—security selection, country allocation and
currency management—the investor gains the
ability to take as much or as little active risk in
each dimension as desired.
The international equity market is just another asset class, just another benchmark to beat—and you should use the same rules to beat it (as exposited by Grinold and Kahn) that you do anywhere.

19m a y 2 0 0 4
The new international framework: Making bets in
three independent dimensionsBUYING AN INTERNATIONAL SECURITY
INVOLVES MULTIPLE DECISIONSNow that we’ve restated the case for international
equities and noted that active management pres-
ents the same risks in that asset class that it does
anywhere, we turn to the multiple decisions that
underlie international investing. Every international
investor makes at least three decisions—either
implicitly or explicitly—when he or she buys
an international security:
■ A security selection decision.
■ A country allocation decision.
■ A currency management decision.26
Let’s say that the investor starts with an EAFE
index fund, and then buys some Toyota Motor
Corporation stock by proportionately reducing
all other positions. (Our example is conveyed in
“benchmark-relative” terms, since active decisions
are made with the hope of adding alpha relative to
a specified benchmark. One could also portray the
example in absolute-return terms.) The decision
to buy Toyota will have three effects:
■ To increase the weight of Toyota relative to
other stocks in the yen–denominated Japanese
equity benchmark.
■ To increase the weight of Japanese equities
relative to their weight in EAFE.
■ To increase the weight of the Japanese yen
relative to its weight in EAFE.
Now, let’s think about why an investor might buy
Toyota. Perhaps the investor believes that Toyota
stands to win in competition with Ford, General
Motors and Volkswagen in the worldwide automo-
tive market. That is a good reason to buy Toyota,
and it’s the kind of logic that drives most security
selection decisions. But it doesn’t imply that one
is bullish on either Japanese equities or the yen.
In fact, one reason to be bullish on Toyota is that
the yen might decline, making that company’s
exports more competitive.
In fact, stock selection and country allocation
decisions rely on substantially different kinds of
information. Stock selection focuses on company-
specific characteristics that suggest that one stock
will outperform another. Country allocation focuses
on the common drivers of all stocks within a given
market—the tide that raises and lowers all boats.
And currency management involves yet a third
kind of information: monetary policy, trade and
capital flows, and price momentum.
It is also key to note that by disaggregating the
stock, country and currency decisions, the investor
has much more explicit control over the degree he
26 A sector/industry decision is also relevant. That said, unlike country and currency decisions, which can be implemented through country index futures and currency forwards, there is currently no good way to inde-pendently make an international sector/industry bet. Should a financial instrument allowing sector/industry decisions be developed, then investors would want to add that dimension to their decision-making process.
By disaggregating the stock, country and currency decisions, the investor has much more explicit control over the degree he or
she wishes to take on active risk in each of these dimensions.

InvestmentInsights20
or she wishes to take on active risk in each of
these dimensions. For example, recalling Grinold
and Kahn’s (2000) Fundamental Law of Active
Management,27 an investor might prefer to take
on more active risk through stock selection than
in the other two dimensions given the superior
breadth involved. Conversely, an investor who has
a high degree of confidence in interpreting the
range of economic data affecting overall country
markets and currencies may prefer to concentrate
his or her bets in these two dimensions. Regard-
less of the specific bets one chooses to make, to
disaggregate the stock, country and currency
decisions presents the investor with a degree
of flexibility (and with it opportunity) that is
not available to an investor holding a portfolio
solely based on stock decisions.
STOCK SELECTION VERSUS COUNTRY SELECTION
It’s obvious that a “good” stock could be located
in a “bad” country, and vice versa. Let’s stick with
Toyota for a moment. Exhibit 5 compares the total
returns on Toyota stock, expressed in US dollars,
to the MSCI Japan index, also in US dollars. Toyota
had strong returns while the country benchmark
was dramatically underperforming. This is far from
an isolated example: In any rising country market,
there are many stocks that decline, and in a falling
country market, there are many stocks that rise.
To avoid holding good companies in bad countries
(or bad companies in good countries where one
wants to bet on the country market for macro-
economic reasons but not on “loser” stocks), it
makes sense to separate the stock selection and
country selection decisions. This separation can
also be viewed as helpful to portfolio efficiency
in a more quantitative context, which we discuss
in detail later—that of the transfer coefficient (the
amount of information in the investment man-
ager’s insights that is captured by the portfolio).
If one has independent information on stock and
country returns, then tying the stock and country
decisions together—by allowing stock choices to
dictate country weights—eliminates the benefit
that could be obtained by using both streams of
information independently.
There are thousands of stocks in the international
markets, and an active manager can have a view
on each of them. (Quantitative methods make it
easier to cover such a large number of securities
while having a value-added view on most or all of
them.) By making a large number of independent
stock bets, rather than by just betting on coun-
tries—of which there are only 23 developed
markets, and 50 if one includes emerging
markets—one maximizes breadth and thus
the expected alpha of the portfolio.
27 In a formal context, if one has real skill at active management, then one’s active return per unit of active risk, or information ratio (IR), will be proportional to the square root of the number of independent “bets” that one can make using that information. Grinold and Kahn (2000) refer to this principle as the Fundamental Law of Active Management and express it mathematically as follows:
E ( IRmgr ) = ICmgr • BR (2) where
E (IRmgr) is the expected information ratio for a given manager; that is, the manager’s expected alpha divided by his or her active risk or tracking error;
ICmgr is the manager’s information coefficient, or correlation of the manager’s security-specific expected alphas with subsequent realizations (a measure of the manager’s raw ability to make forecasts that differ from the con-sensus forecast); and
BR is breadth, “the number of independent forecasts of exceptional return we make per year.” Grinold and Kahn (2000), p. 148.

21m a y 2 0 0 4
COUNTRY SELECTION VERSUS CURRENCY SELECTION
The tendency of stocks in a given country and
the currency of that country to move opposite one
another is a well-known phenomenon. Exhibit 6
gives a historical example of this principle, indicat-
ing that when monetary policy was accommodative
(low interest rates), stock markets were strong but
currency markets were weak. When monetary
policy was restrictive (high interest rates), stocks
fell and currencies rallied. This pattern is widely
thought to occur because low interest rates pro-
mote economic growth in a country (which helps
stocks), but cause funds to flow out of the coun-
try’s currency because fixed income and cash
investors want to earn the highest interest rate
available. Also, fixed-income investors may be
concerned about unexpected inflation when a
country has an “easy” monetary policy; unex-
pected inflation, of course, hurts bond prices.
Monetary policy is only the most obvious example
of why one should separate country from currency
decisions. There are many other scenarios under
which one would have different expectations for
a country’s equity market and for its currency.
As we’ve argued, country and currency decisions
require a different information stream and differ-
ent processing skills. And the argument we’ve
made for separating the country and currency
decision, naturally, also holds for separating the
stock and currency decision.
THREE MYTHS OF CURRENCY MANAGEMENT
An international manager who proposes to imple-
ment the above framework will probably behave
as follows:
■ Start with a US dollar-denominated benchmark
such as EAFE.
■ Make active stock bets (by over- or under-
weighting stocks relative to the benchmark).
YEARS
GR
OW
TH O
F $1
.00
IN
VES
TED
MAY
31,
199
3Exhibit 5
comparative performance of toyota motor corporation and japan index (in us dollars, unhedged), may 1993–october 2003
0.1
1
10
1993 1994 1995 1996 1997 1998 1999 2000 2001 2002 2003
Source: Yahoo! finance (Toyota), MSCI (MSCI Japan).
Toyota Motor Corp total returns in US dollars
MSCI Japan total return index in US dollars
Exhibit 6equity and currency returns in various monetary regimes
Source: Bridgewater Associates. Average of equity and currency markets in G7 countries plus Australia from January 1970 to December 1997.
Excess equity Currency return (%) return (%)
Loose monetary policy 12.8 –1.4
Tight monetary policy –10.4 3.1
Full period 3.4 0.1

InvestmentInsights22
■ Unwind any unintentional country or currency
bets caused by the stock decisions. This will
typically be accomplished using futures,
exchange-traded funds (ETFs), or swaps.
■ Make intentional country and currency bets,
using the same kinds of instruments used to
unwind the unintended bets.
These last two activities will have the look and feel
of a country tactical asset allocation (TAA) overlay
program and a currency overlay program. In our
experience, managers encounter resistance when
asked to consider such programs, especially with
regard to the currency overlay.
This resistance arises from what we call the “three
myths of currency management.” Briefly stated,
these myths are that:
■ Currencies take care of themselves in the
long run.
■ The impact of currency fluctuations is insignif-
icant in portfolios that have small or moderate
allocations to international markets.
■ Currencies are a zero-sum game, so it’s a
losing proposition to play the game.
Let’s examine each of these in turn.
Currencies take care of themselves in the long run. The basic economic principle called the
Law of One Price dictates that the price of a good
in two locations cannot differ by more than the
cost of transporting the good from one location to
another. Violations of this law are prevented by
arbitrageurs, who buy the good in the cheaper
location and sell it in the expensive one.
The Law of One Price has been applied to currency
markets to suggest that these markets are subject
to a condition called Purchasing Power Parity (PPP).
PPP states that the exchange rate between two
currencies, say, the dollar and the yen, adjusts so
that a dollar buys the same basket of consumer
goods in the US that an equivalent amount of yen,
converted from dollars at market rates, buys in
Japan. Arbitrage across markets for real economic
goods and services are cited as the enforcement
mechanism for PPP.
If PPP holds, then currencies quickly tend toward
fair value and there is little or nothing to be gained
from currency management.
The problem with PPP is that most economic goods
cannot be transported at low cost. Water, electric-
ity, and fresh foods are among the goods that are
the most difficult or costly to transport, relative
to their value. Services are even less amenable
to intern ational arbitrage: one wants one’s doctor
to be right here in town, not in Mexico or China.
Thus the conditions for arbitrage of goods and ser-
vices that could theoretically cause PPP to hold
accurately are not present, and we should not
expect PPP to hold except as a loose relationship.
Exhibit 7 documents variations from PPP experi-
enced by several major currencies. As you can see,
deviations from PPP have been surprisingly large
and persistent. No wonder that Americans found
shopping in Europe to be a gratifying experience
around 1970! And we should have not been sur-
prised that Japanese shoppers found the United
States enticing in the late 1980s and early 1990s.
There is simply not enough cross-border trade in
consumer goods (or transportation costs are too
high) for these differences to be arbitraged away.
Nevertheless, there is evidence that, over the
very long run, PPP holds to within an order of
approximation: the loose relationship posited
above is actually observed.28 Simple logic dictates
28 For evidence that exchange rates trend slowly toward purchasing power parity, see, for example, Kenneth Rogoff, “The Purchasing Power Parity Puzzle,” Journal of Economic Literature, June 1996, vol. 34, no. 2, pp. 647–668.

23m a y 2 0 0 4
that gross violations of PPP cannot hold for long;
while the US dollar price of a Big Mac (the consumer
good used by The Economist magazine to test PPP
because it is said to be a paragon of global unifor-
mity) may vary in a three- or even five-to-one
range between expensive locales and cheap ones,
it cannot vary in, say, a 10,000-to-one range. There
is no place, and logic dictates that there cannot be
a place, where a Big Mac costs one cent or a hun-
dred dollars. The idea behind PPP is not wrong.
But as Exhibit 7 documents, the long run, in which
PPP is said to hold and in which currency fluctua-
tions “work themselves out” by converging to fair
value, can be very, very long, measured in decades
and far beyond the planning horizon or even the
career horizon of a plan sponsor. In any time
frame—quarters, years or several-year periods—
that matters to the plan sponsor in practice,
currency fluctuations do not “work themselves
out,” and currency management is needed to
address the risk caused by these fluctuations.
Currency impact is insignificant for small allocations to international. No, it’s not. Cur-
rency fluctuations can be large, and they have the
same impact on total portfolio returns as security
price fluctuations.
In the first few years of its life, the euro fell
30% relative to the US dollar. The weight of the
euro zone in EAFE is 35%, so that an unhedged
portfolio indexed or benchmarked to EAFE lost
0.30 x 0.35 = 10.5% in US dollar terms due to
currency depreciation alone. If the typical plan
sponsor’s allocation to international equities is 15%
of the total fund (which is 25% of the equity allo-
cation in a “60/40” equity/fixed income mix), the
impact of the euro’s decline is 0.105 x 0.15 = 1.6%.
A 1.6% “hit” to fund performance is dramatically
large, whether one compares it to the expected
return on assets, the spread between high and
low performing funds, the cash flows into a typ -
ical pension or endowed-institution portfolio, or
the cash flows out of it. There is nothing insignif-
icant about it.
The euro exposure in an EAFE portfolio should
have been at least partially hedged. Even a passive
currency hedge provides protection against such
moves in currencies. Active management might
have been able to add further value.
Currencies are a zero-sum game. Like any
asset class, currencies are indeed a zero-sum game
relative to an appropriately specified benchmark.
However, in contrast to equity and other asset
0.50
0.75
1.00
1.25
1.50
1.75
2.00
OV
ER–
OR
UN
DER
EVA
LUAT
ION
O
F C
UR
REN
CY*
Exhibit 7deviations from purchasing power parity
YEARS
1970 1972 1974 1976 1978 1980 1982 1984 1986 1988 1990 1992 1994 1996 1998 2000 2002
*Relative to US dollar (market exchange rate/PPP exchange rate. Source: Sauder School of Business, University of British Columbia, OECD.
Japan Switzerland United KingdomGermany/Euro

InvestmentInsights24
markets where just about all participants seek
return and shun risk, currency markets are
heavily populated by participants who have
other motives:
■ Central banks. Central banks typically act
to defend currencies, which means buying cur-
rencies that are declining in value, or that the
central bank fears will decline. While there’s
only a finite amount of money they can spend
in such activities, they expect to lose money.
Central banking activity is one reason why price
momentum may be an effective predictor of
currency returns.
■ Corporate hedgers. Many corporations use
currency forward contracts to lock in the prices
of goods and services they know they will need to
purchase or sell. They are willing to pay an insur-
ance premium, or risk premium, in exchange for
the knowledge that they will be able to exchange
currency at a rate known in advance.
■ Tourists. Tourists hold surprisingly large
currency balances. Their motivations are like
those of corporate hedgers—they are trying to
lock in the prices of goods they intend to buy.
■ International equity managers. Interna -
tional equity managers trade currencies to
effect their positions. Most do so without
information on the currencies.
In such an environment, it seems outright impru-
dent to invest passively. If ever there were an area
where active management is justified by the fun-
damentals, it’s currency.
LET’S NOT THROW AWAY INFORMATION: MAXIMIZING THE TRANSFER COEFFICIENT
The active international manager, then, must
transform the information regarding individual
securities, countries and currencies into alpha, or
outperformance relative to the asset-class bench-
mark. How can he or she do this more efficiently?
Recall, from earlier (see footnote 29), Grinold and
Kahn’s equation (2). This equation is a general frame-
work for estimating the expected information ratio
of a portfolio, but it holds only if there are no artifi-
cial constraints, such as the long-only constraint,
handicapping the efficiency of the portfolio.
The effectiveness of a portfolio in turning infor-
mation into alpha is called the transfer coefficient,
TC. Formally, as described by Clarke, de Silva, and
Thorley, it is the cross-sectional correlation, across
the securities in the portfolio, between the fore-
casted alpha of each security and the actual weight
of that security in the portfolio.29
In the absence of any portfolio constraints, all of
the information in the alpha forecasts is incorpo-
rated in the portfolio holdings weights, and TC = 1.
As one adds constraints, TC drops sharply. Clarke
29 Roger Clarke, Harindra de Silva, and Steven Thorley, “Portfolio Constraints and the Fundamental Law of Active Management,” Financial Analysts Journal, September/October 2002. The formal derivation of TC is in the article, which is an elaboration of a point in Richard C. Grinold, and Ronald N. Kahn, “The Surprisingly Large Impact of the Long-Only Constraint,” Investment Insights, Barclays Global Investors, San Francisco, May 2000 (vol. 3, no. 2).
The active international manager, then, must transform the information regarding individual securities, countries and
currencies into alpha, or outperformance relative to the asset-class benchmark. How can he or she do this more efficiently?

25m a y 2 0 0 4
(although some sort of less binding budget
constraint may remain) and portfolio efficiency,
as measured by the expected information ratio,
should be greatly improved.
ConclusionInternational equity markets are like most other
markets: they’re efficient enough to frustrate most
active managers. US investors in international
equities should invest like US investors in domes-
tic equities. They should first decide how much
policy or beta risk to take. Then they should decide
whether or not to take active risk. If the decision
is to take active risk, it should be done moderately
and with careful attention to the tradeoff between
active return (which is not guaranteed, no matter
how smart the manager is) and active risk (the
delivery of which is guaranteed).
Most active international equity portfolios not only
take too much active risk, they do it inefficiently.
They get too little return for the risk taken. That
is because active decisions are typically made
at the stock-selection level, with the result that
country and currency weights are the accidental
by-product of the stock-selection decisions and
ignore any information one might have about
the countries and the currencies. When you tie
together decisions that are naturally separate,
you lose a lot of efficiency.
So let’s “untie” the decisions. The stock-selection,
country and currency holdings should be managed
separately. Remember that successful active man-
agement (of any kind of portfolio) is concerned
with maximizing the information ratio, or expected
alpha per unit of active risk. When one decides the
stock, country and currency weights indepen-
dently of one another, the portfolio uses a much
greater proportion of information gathered, and
thus has a better chance of maintaining a superior
information ratio over the long run.
et al. use simulation to test the effect on TC of
various portfolio constraints and combinations of
constraints. Their results range from 0.31 (multi-
ple constraints) to 0.78 (long-only with a tracking
error of 2%); a long-only portfolio with a tracking
error of 5%—typical of traditional, medium-risk
active managers—has a TC of only 0.58.
When one adopts a portfolio construction process
that ties together naturally separate decisions, such
as the stock, country and currency decisions in an
international equity portfolio, the effect on TC is
similar to that caused by the constraints that Clarke
et al. tested. In the traditional or tied-together inter-
national equity portfolio, not only are the stocks
constrained to be long-only, the countries are
constrained (1) to be long-only and (2) to have the
same country weights as the stocks (whatever
those weights happen to be). Yet another, similar
constraint comes from currency weights being set
to whatever exposures the stocks happen to deliver.
While we don’t have simulation results for a tradi-
tional international equity portfolio, logic suggests
that TC is quite low.
TC has a direct, multiplicative impact on alpha
(and it always hurts, never helps—it is less than
or equal to one by definition). Clarke et al. revise
equation (2)—Grinold and Kahn’s Fundamental
Law of Active Management—to read as follows:
E ( IRmgr ) = TCmgr • ICmgr • BR
(3)
where TCmgr is the transfer coefficient for a given
manager, and other variables are as defined earlier.
To the extent it’s realistic to do so, investors want
TC to be as high as possible. They don’t want to
throw away information. In other words, they want
to avoid constraints that hurt the portfolio’s effi-
ciency. Using the new framework for international
active equity management that we’ve presented,
several damaging constraints are removed

australiabarclays global investorsabn 33 001 804 566Level 1, 111 Harrington StreetSydney, nsw 2000p.o. Box n43, Grosvenor Placensw 1220Telephone 61 2 9272 2200
canadabarclays global investorsbce Place, 161 Bay StreetSuite 2500p.o. Box 614, Toronto, on m5j 2s1
Telephone 1 416 643 4000
barclays global investors1000 Sherbrooke ouestSuite 1730Montréal, qc h3a 3g4Telephone 1 514 843 9595
hong kongbarclays global investorsOne International Finance CentreSuite 2901
1 Harbour View Street, CentralHong KongTelephone 852 2295 5288
japanbarclays global investorsjapan limitedEbisu Prime Square Tower1-1-39 Hiroo, Shibuya-ku, Tokyo150 8402Telephone 81 3 5469 4100
barclays global investorsjapan trust & bankingTelephone 81 3 5469 4300
singaporebarclays global investors23 Church Street#13 04 Capital SquareSingapore 049481
Telephone 65 6395 3320
the netherlandsbarclays global investorsWorld Trade CenterTower d, 6th FloorStrawinskylaan 667, 1077 xxAmsterdamTelephone 31 20 798 0060
united kingdombarclays global investorsMurray House1 Royal Mint CourtLondon, ec3n 4hhTelephone 44 207 668 8000
united statesbarclays global investors45 Fremont StreetSan Francisco, ca 94105Telephone 1 415 597 2000
barclays global investorsOne International Place, 45th FloorBoston, ma 02110Telephone 1 617 279 4100
www.barclaysglobal.com
“BGI” may be used to refer to Barclays Global Investors and its affiliates. Barclays Global Investors, N.A., a national bank-ing association operating as a limited purpose trust company, manages collective investment products and services and provides fiduciary and custody services to various institutional investors. Barclays Global Fund Advisors (BGFA) provides investment advisory services to US registered exchange-traded funds and other registered investment company products. Barclays Global Investors Services (BGIS) provides marketing support to certain distributors of registered investment companies. BGFA and BGIS are wholly owned subsidiaries of Barclays Global Investors, N.A. BGI is located at 45 Fremont Street, San Francisco, CA 94105.
Any strategies discussed in this publication are strictly for illustrative and educational purposes and are not to be con-strued as an endorsement, recommendation, or solicitation to buy or sell securities. The information is not intended to provide investment advice. BGI does not guarantee the suitability or potential value of any particular investment.
Past performance is no guarantee of future results. There are risks involved with investing, including possible loss of principal. Risk controls, asset allocation models, and propri-etary technology do not promise any level of performance or guarantee against loss of principal.
The information included in this publication has been taken from trade and other sources considered reliable. No repre-sentation is made that this information is complete and should not be relied upon as such. Any opinions expressed in this publication reflect our judgment at this date and are subject to change. No part of this publication may be reproduced in any manner without the prior written permission of Barclays Global Investors.
Approved for issue in the UK by Barclays Global Investors Limited, which is authorized and regulated by the Financial Services Authority. Barclays Global Investors Limited. Registered in London, England. Registered Number 796793.
©2004, Barclays Global Investors, N.A.
Investment InsightsPublished by Barclays Global Investors45 Fremont StreetSan Francisco, ca 94105
a