investor & analyst presentation - home - australian ... august 2016 rebekah o’flaherty - ceo i...
TRANSCRIPT

Rebekah O’Flaherty - CEO I Jonathan Kenny - CFO25th August 2016
Investor &Analyst PresentationFull YearResults 30 June2016
For
per
sona
l use
onl
y

1 Overview
2 Strategic Priorities
3 FY16 Financial Results
4 FY17 Outlook
5 Q&A
6 Appendices
Agenda
2FY16 Results Presentation 25 August 2016
For
per
sona
l use
onl
y

Section OneOverview
3FY16 Results Presentation 25 August 2016
For
per
sona
l use
onl
y

Pro forma*
$M FY16 FY15 Mvmt Growth
Revenue 49.3 44.8 4.5 10%
ANZ 30.8 30.1 0.7 2%
EMEA 12.6 10.3 2.3 23%
Americas 5.9 4.4 1.5 33%
Mathletics 36.9 32.9 4.0 12%
Reading Eggs 6.8 6.2 0.7 11%
Spellodrome 2.1 1.7 0.4 24%
Into Science 0.8 0.5 0.2 47%
Other** 2.7 3.5 (0.8) (24%)
Expenses (36.5) (28.0) (8.5) 30%
Underlying EBITDA 12.8 16.8 (4.0) (24%)
Share of Associate's Profit *** 0.5 0.0 0.5 NM
Underlying Core EBITDA 13.3 16.8 (3.5) (21%)
EBITDA margin (%) 27% 38% (11%)
Underlying NPAT 5.3 10.8 (5.5) (51%)
4
10% revenue growth reflects growth in all regions and all
products (ANZ +2%, EMEA +23%, Americas +33%)
License growth +6% to 5.65 million
Underlying Core EBITDA $13.3M (down 21% YoY) reflecting
investment in North America, products and global support
Stronger result than our June trading update due to stronger
than expected copyright revenue and cost control
ARPU +2% to $8.48
Learnosity continued to perform strongly with revenue growth
of 62% to $12.5M (US$9.0M) and share of profit after tax of
$0.5M
NPAT impacted increase in amortization expense associated
with product development investment
* Pro forma financial information which has been prepared to reflect 3P’s financial performance and position as if accounting policies have been consistently applied over the
historical period and with adjustments made for significant abnormal and/or non-recurring items including the impact of the IPO.
** Other revenue includes copyright fees, workbook sales and sponsorships
*** Share of associate profit is Learnosity contribution based on 23.07% share of NPAT for 9 Sep – 18 Jan 2016 and 40% share for 19 Jan 2016 – 30 Jun 2016
FY16 Results Highlights
FY16 Results Presentation 25 August 2016
For
per
sona
l use
onl
y

Section TwoStrategic Priorities
5FY16 Results Presentation 25 August 2016
For
per
sona
l use
onl
y

3 Year Strategic Priorities
Year 1 Strengthen Product Portfolio and build a Scalable Global Operating ModelPrioritising Product Development and Innovation, Developing Scalable Sales and Implementing a
Global Operating Model
FY16 Results Presentation 25 August 2016
Year 2 Optimise SalesLeverage our scalable Global Operating Model to grow sales through product and geographic
expansion
Year 3 Accelerate Growth
Build upon 3PL’s foundation of
Talented team
Strong customer advocates (students, parents and teachers)
Award winning product brands
Recurring SaaS business model
Large installed base to accelerate profitable global growth
For
per
sona
l use
onl
y

7
Strengthen Product Portfolio and Scalable Global Operating Model
1) Stronger and more Profitable Product portfolio
Goal Strategy Progress
Centralised Global
Product Development and Marketing
Revitalise flagship
Mathletics brand
Drive cost efficiencies
Improve market insight and time to
market
Move to Product P/L
New secondary interface
Segment generic K-10 audience
into 5 distinct audiences
Product Development Leaders direct
report to CEO to accelerate
progress
Restructure of product teams
complete; $1.5M reduction in capex
forecast
Delivered Jul 16
Baby Mathletics app due Nov 16,
relaunch Mathletics July 17 into
Little, Junior and Mathletics Pro
Build complementary product to Reading Eggs
Develop organic literacy build with initial focus on writing
Market assessment underway
Launch expected July 17
Review IntoScience Review future product strategy Well underway and will be complete
by FY17 H1
FY16 Results Presentation 25 August 2016
For
per
sona
l use
onl
y

8
Strengthen Product Portfolio and Scalable Global Operating Model
2) Establishing a Scalable Sales Model
Goal Strategy Progress
Develop 3rd party sales
channels
Establish alternative distribution
channels to complement direct
sales
Robert Mercer commenced as Chief
Sales and Marketing Officer
MOU with Microsoft’s largest
Education reseller in Australia (Other
countries to follow)
Enhanced sales
productivity and diversity
Undertake distribution of third party
products
Licence agreement to distribute
Mathseeds serving K-2 (excl. US)
Geographic expansion Utilise third party distributors Well progressed with one of the
largest national resellers in India
(>100,000 private schools)
Digital platform to
accelerate growth
Establish digital channels for sales,
marketing and service
Scope and design phase underway
FY16 Results Presentation 25 August 2016
For
per
sona
l use
onl
y
9
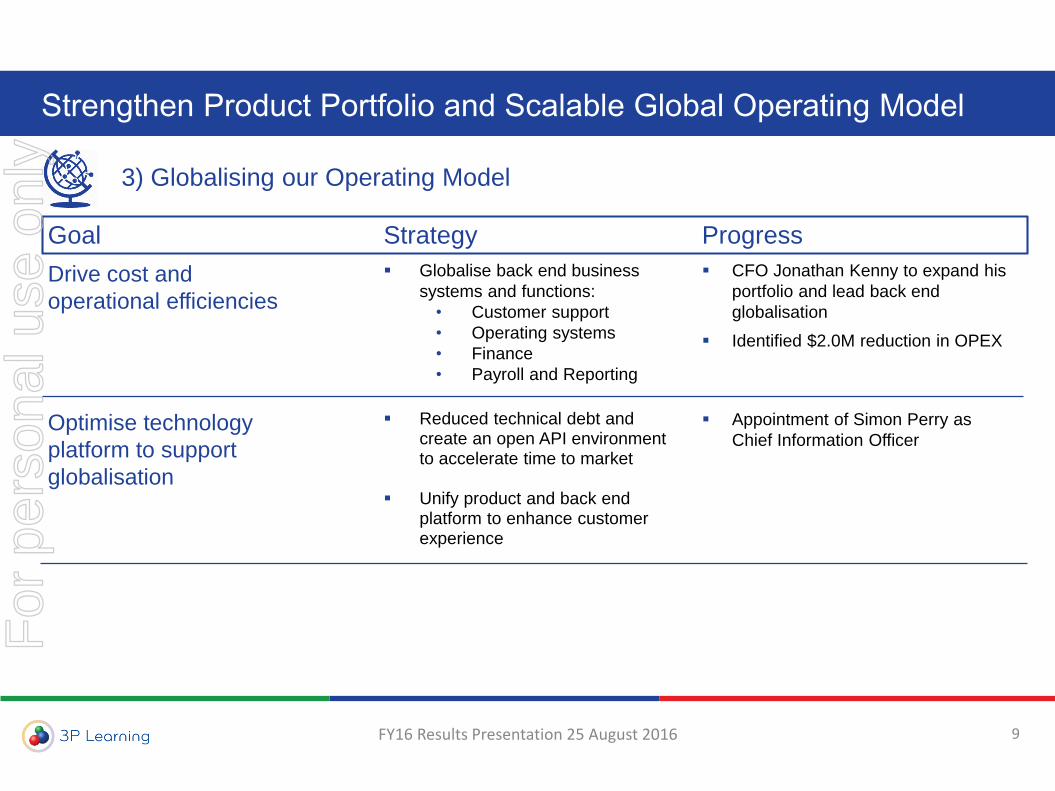
Strengthen Product Portfolio and Scalable Global Operating Model
3) Globalising our Operating Model
Goal Strategy Progress
Drive cost and
operational efficiencies
Globalise back end business
systems and functions:
• Customer support
• Operating systems
• Finance
• Payroll and Reporting
CFO Jonathan Kenny to expand his
portfolio and lead back end
globalisation
Identified $2.0M reduction in OPEX
Optimise technology
platform to support
globalisation
Reduced technical debt and create an open API environment to accelerate time to market
Unify product and back end platform to enhance customer experience
Appointment of Simon Perry as
Chief Information Officer
FY16 Results Presentation 25 August 2016
For
per
sona
l use
onl
y

10
Robert Mercer, Chief Sales & Marketing Officer
Extensive experience in Sales, Marketing, Training, Development and General Management
Previously Senior Vice President Global Sales & Services for Enterprise & Education at Rosetta Stone
Commenced Jul 2016
Jonathan Kenny, Chief Financial Officer
20 years+ experience in finance and operations roles for ASX listed and multinational corporations
Previously chief financial officer of ASX listed RP Data Limited and Bravura Solutions Pty Ltd
Tania Black, Chief People Officer
Extensive experience in leading people strategy, with focus on business transformation in the media sector
Led the integration of HR across Nine Entertainment Co
Commenced Nov 2015
An experienced Global Leadership Team ready to execute
Simon Perry, Chief Information Officer
20 years of global experience in leading technology teams
Previously led the Technology function for Core Logic and Veda
Commencing late Aug 2016
Rebekah O’Flaherty, Chief Executive Officer
Acting Chief Product Officer Extensive experience in technology companies
and digital in the United States, Europe and APAC
Previously VP Hewlett Packard, Executive Director Telstra, General Manager Origin Energy
Commenced Jun 2016
FY16 Results Presentation 25 August 2016
For
per
sona
l use
onl
y

Section ThreeFY16 Financial
Results
11FY16 Results Presentation 25 August 2016
For
per
sona
l use
onl
y

Pro forma
$M FY16 FY15 Mvmt Growth
Licence revenue 28.1 26.6 1.5 6%
Copyright fees, sponsorships and other 2.7 3.5 (0.8) (24%)
Total revenue 30.8 30.1 0.7 2%
Costs (9.1) (8.6) (0.5) 6%
EBITDA before corporate overheads* 21.7 21.5 0.2 NM
EBITDA margin (%) 70% 71% NM
Licences at period end (000s) 2,733 2,696 37.1 1%
ARPU ($) $10.35 $10.18 $0.17 2%
Full Time Equivalent (number) 65 59 6 11%
Licence revenue growth of 6% offset by
decline in one-off sponsorship revenue
Increase in K-6 primary licence
numbers offset by decline in secondary
7-12 school licences (approximately
65k)
ARPU increased 2% as impacted by
higher proportion of Reading Eggs
sales, which are recorded net of
royalties
ANZ costs increased 6% due to modest
headcount increases
2,236
2,500 2,524
2,6962,733
FY12 FY13 FY14 FY15 FY16
12
Key Points
FY17 Focus & Outlook
Released a new secondary interface in
Jul 16 to improve retention in secondary
schools
Focus on growing market share
Modest price increases above CPI
* Refer to appendices for reconciliation to Statutory EBITDA
ANZ licences (000s)
ANZ – Growing leading market position
ANZ Financials
FY16 Results Presentation 25 August 2016
For
per
sona
l use
onl
y

Pro forma
$M FY16 FY15 Mvmt Growth
Revenue 12.6 10.3 2.3 23%
Costs (5.9) (5.7) (0.2) 4%
EBITDA 6.7 4.6 2.1 46%
EBITDA margin (%) 53% 45% 19%
Licences at period end (000s) 1,854 1,685 169 10%
ARPU ($) $7.12 $6.49 $0.64 10%
Full Time Equivalent (number) 64 58 6 10%
13
FY17 Focus & Outlook
EMEA licences (000s)
Strong revenue growth of 23% (14% on
a constant currency basis)
Revenue growth supported by 10%
gain in licences and 10% ARPU
expansion due to price rise and FX
Costs increased 4% and decreased 5%
on a constant currency basis.
Brexit not anticipated to materially impact
education sector. GBP depreciation to
impact FY17 performance
Opportunity for scalable sales model as
change in government policy sees schools
transitioning to academies structure
Legacy Middle East contract renewal at
risk ~ 200k licences, $200k revenue
impact. Other opportunities could more
than cover.
9121,005
1,480
1,685
1,854
FY12 FY13 FY14 FY15 FY16
EMEA – Growing margin and market share
Key PointsEMEA Financials
FY16 Results Presentation 25 August 2016
For
per
sona
l use
onl
y

14
Revenue growth of 33% (19% on a
constant currency basis)
Revenue growth supported by 14% gain in
licences and 6% ARPU increase
Costs increased 64% and 44% on a
constant currency basis. Headcount
increased from 39 to 56 in the year
primarily in sales
US cashflow break even
FY17 Focus & Outlook
Americas licences (000s)
New district agreements signed in FY16
H2 providing platform to grow revenues
and licences in FY17
Chicago public schools (4th largest
US school district);
Houston independent school district
(8th largest US school district)
Drive penetration into existing districts
Cost base expected to be stable – intend
to drive a more efficient and scalable
model by establishing more indirect
channels
316358
662
931
1,065
FY12 FY13 FY14 FY15 FY16
Americas – Building a scalable sales model
Key PointsAmericas Financials
FY16 Results Presentation 25 August 2016
Pro forma
$M FY16 FY15 Mvmt Growth
Revenue 5.9 4.4 1.5 33%
Costs (7.6) (4.6) (3.0) 64%
EBITDA (1.7) (0.2) (1.5) NM
EBITDA margin (%) (29%) (5%) NM
Licences at period end (000s) 1,065 931 134 14%
ARPU ($) $5.91 $5.58 $0.33 6%
Full Time Equivalent (number) 56 39 17 43%
For
per
sona
l use
onl
y

15
Revenue growth of 52% to €$8.2M
(US$9M) reflecting growing global
demand for online assessment and
strong growth in blue chip customer
numbers
Underlying NPAT of €$0.9M
A$0.5M contribution to the Group’s
Underlying Core EBITDA
FY17 Focus & Outlook
Learnosity Financials
*Since investment 9/8/15-30/6/16
Growing global demand for online
assessment
Future revenue will be invested to support
growth
Continual integration in 3P’s core products
to accelerate product development
Learnosity– Valuable strategic investment delivering strong growth
Key Points
Market leading assessment tool powering 3P products
Active users went up 9.8x from 1.6 million to 15.6 million
between June 2015 and June 2016 as customers roll out
Learnosity Assessments
Integration of Learnosity software into 3P products
provides market leading assessment capability
FY16 Results Presentation 25 August 2016
€M FY16 FY15 Mvmt Growth
Revenue 8.2 5.4 2.8 52%
Underlying EBITDA 1.2 0.9 0.3 33%
Underlying NPAT 0.9 0.7 0.2 29%
A$M
Revenue 12.5 7.7 4.8 62%
Underlying EBITDA 1.7 1.3 0.4 31%
Underlying NPAT 1.3 1.0 0.3 30%
3P Share of profit * 0.5
For
per
sona
l use
onl
y

Pro forma
$M FY16 FY15 Mvmt Growth
Total Revenue 49.3 44.8 4.5 10%
Employee (23.7) (19.3) (4.4) (23%)
Marketing (3.1) (2.3) (0.8) (35%)
Technology and occupancy (4.9) (3.1) (1.8) (57%)
Other (4.8) (3.2) (1.6) (49%)
Expenses (36.5) (27.9) (8.6) (31%)
Underlying EBITDA 12.8 16.9 (4.1) (24%)
Share of Associate's Profit* 0.5 - 0.5 NM
Underlying Core EBITDA 13.3 16.9 (3.6) (21%)
EBITDA margin (%) 27% 38%
Depreciation & amortisation (5.1) (3.1) (2.0) (67%)
EBIT 8.2 13.8 (5.6) (41%)
EBIT margin 17% 31%
Net interest (0.5) 0.6 (1.1) NM
Profit before tax 7.7 14.4 (6.7) (46%)
PBT margin 16% 32%
Tax Benefit/(Expense) (2.4) (3.6) 1.2 33%
Tax rate 31% 25%
Underlying NPAT* 5.3 10.8 (5.5) (51%)
Restructure costs (after tax) (1.6) - (1.6) NM
NPAT 3.7 10.8 (7.1) (66%)
Underlying EPS (cents) 3.87 8.10 (4.2) (52%)
Statutory EPS (cents) 2.66 3.04 (0.4) (13%)
16
Increased headcount to 338 from 284 YoY primarily in
sales
Marketing costs increases to support Americas and
EMEA sales teams, $0.5m impact from the WEG
Technology costs increase reflect transition to cloud with
reclassified from depreciation to opex; higher occupancy
costs reflect increase in headcount
Other expenses included higher travel expenses of
$0.5M, WEG $0.3M, professional fees and other costs
Expenses increased 23% (constant currency)
Amortisation increased due to product development
investment (see slide 19 for details)
Net interest expense increase reflects strategic
investment in Learnosity
Effective tax rate 31% increased due to non recognition
of FY16 US tax losses
Restructuring costs of $1.6m (net of tax) reflect CEO
transition, new leadership appointments and Learnosity
acquisition costs
FY16 – Income Statement
Key Points
* Learnosity share of profit for period 9 September 2015 to 30 June 2016
FY16 Results Presentation 25 August 2016
For
per
sona
l use
onl
y

$M 30 June 2016 30 June 2015
Cash and cash equivalents 4.3 30.9
Trade and other receivables 8.0 8.7
Other current assets 0.0 0.6
Total current Assets 12.3 40.2
Royalty receivable 0.1 0.1
Property, plant and equipment 1.2 1.0
Deferred tax assets 5.9 7.6
Intangibles and goodwill 23.9 17.2
Available for sale financial asset 6.6 6.6
Investments accounted for using the equity method 48.9 -
Total non-current assets 86.6 32.5
Total assets 98.9 72.7
Trade and other payables 10.8 7.4
Derivative financial instruments 0.3 -
Income tax payable - 2.0
Deferred revenue 28.4 23.9
Provisions 2.0 2.3
Total current liabilities 41.5 35.6
Provisions 0.6 0.9
Borrowings 11.5 -
Deferred revenue 1.8 3.1
Total long term liabilities 13.9 4.0
Total liabilities 55.4 39.6
Net assets 43.5 33.1
Contributed equity 34.0 25.1
Retained earnings 2.2 1.0
Reserves 7.3 7.0
Total equity 43.5 33.1
17
Cash and cash equivalents reduced due to
investment in Learnosity. Net Debt of $7.2m at
30 June 2016, represents Net Debt/EBITDA
ratio of 0.57x
Increased due to product development (see
slide 19)
Includes $6.2M of deferred consideration on
Learnosity investment
Current deferred revenue increased 19% YoY
Gross debt of $11.5M is non-current at 30
June 2016. Debt facility has increased from
$20M to $30M subsequent to year end.
$8.6M issued with respect to investment in
Learnosity
FY16 – Balance sheet
Key Points
FY16 Results Presentation 25 August 2016
For
per
sona
l use
onl
y

Pro forma
$M FY 2016 FY 2015 Mvmt
Underlying Core EBITDA 13.3 16.9 (3.6)
Non-cash expense (0.6) (1.1) 0.5
Change in working capital 3.6 6.0 (2.4)
Operating free cash flow before intangibles 16.3 21.8 (5.5)
Investment in product development & other intangibles (11.4) (8.5) (2.9)
Operating free cash flow after intangibles 4.9 13.3 (8.4)
Interest received 0.1 0.6 (0.5)
Net interest paid (0.4) (0.5) 0.1
Income tax (paid)/refunded (2.2) 1.3 (3.5)
Short term deposits 0.5 1.7 (1.2)
Net cash flows before dividends 2.9 16.4 (13.5)
Payments of business and investments (35.6) (5.3) (30.3)
Purchase of PP&E (0.9) (0.3) (0.6)
Net cash flows after investments (33.6) 10.8 (44.4)
Cash flow conversion1 (before capital expenditure) 123% 129% (6%)
Cash flow conversion2 (after capital expenditure) 37% 79% (42%)
18
Increased investment in product
development and systems to support
global growth
• FY17 capex forecast to reduce by
$1.5M
Investment in Learnosity and Desmos
Learnosity acquisition funding:
• A$48.5m total consideration
• FY16 funding
- A$33.7m in cash and working
capital facility
- A$8.6m share placement
• FY17 funding
- A$6.2m deferred payment
(H1FY17 A$3.5M and H2FY17
A$2.7M)
No dividend declared for FY16
FY16 – Cash flow
Key Points
1 Cash flow conversion calculated as operating free cash flow before capital expenditure as a percentage of Underlying Core EBITDA.
2 Cash flow conversion calculated as operating free cash flow after capital expenditure as a percentage of Underlying Core EBITDA.
FY16 Results Presentation 25 August 2016
For
per
sona
l use
onl
y

* Amortisation profile represents the amortisation charged to the profit and loss assuming no additional capital expenditure
subsequent to 30 June 2016
19
Key Points
Strategic review of IntoScience
New CIO to review technology
environment and technology
assets
Intangibles and Amortisation Profile
Amortisation profile of current
carrying value of $19.4M as at
30 June 16
$M
FY17 FY18 FY19 FY20 FY21 Total
Mathletics (3.7) (3.8) (3.3) (2.3) (0.8) (13.9)
Spellodrome (0.2) (0.2) (0.2) (0.1) - (0.7)
IntoScience (0.9) (1.0) (0.8) (0.5) (0.1) (3.3)
Systems (0.4) (0.3) (0.3) (0.3) (0.2) (1.4)
Capitalised Product Development (5.2) (5.3) (4.6) (3.2) (1.1) (19.4)
Amortisation Profile*
FY16 Results Presentation 25 August 2016
$M Carrying Value Additions Amortisation Carrying Value
30 June 2015 30 June 2016
Mathletics 8.7 8.2 (3.0) 13.9
Spellodrome 0.5 0.4 (0.2) 0.7
IntoScience 2.7 1.5 (0.8) 3.3
Systems 0.3 1.3 (0.2) 1.4
Capitalised Product Development 12.2 11.4 (4.2) 19.4
Spellodrome 0.5 - - 0.5
IntoScience 2.5 - - 2.5
Goodwill 3.0 - - 3.0
Total Product 15.2 11.4 (4.2) 22.4
South Africa Goodwill 1.4 - - 1.4
Other Intangibles 0.4 - (0.3) 0.1
Total Intangibles per Note 15 17.0 11.4 (4.5) 23.9
For
per
sona
l use
onl
y

20
Section FourFY17 Outlook
FY16 Results Presentation 25 August 2016
For
per
sona
l use
onl
y

FY17 Outlook
21
Transition 3P to be a Global Digital Business that can profitably scale sales through diversification of
products, multi sales channels and select geographic expansion
Revitalisation of Mathletics with an expanded offering to toddlers (Baby Mathletics App) and a renewed
suite of Mathletics products (Little, Junior and Mathletics Pro)
Moving to a global operating model to improve operating performance to drive out unnecessary cost and
become more effective through centralisation and digitisation
In Year 1 (FY17) of our strategic plan, we expect to deliver revenue growth ahead of cost growth in all
markets and products
We are setting up the business so we can leverage our scalable global operating model to accelerate
sales growth in Years 2 and 3 of our strategic plan
FY16 Results Presentation 25 August 2016
For
per
sona
l use
onl
y

22
Section FiveQ&A
FY16 Results Presentation 25 August 2016
For
per
sona
l use
onl
y

23
Section SixAppendices
FY16 Results Presentation 25 August 2016
For
per
sona
l use
onl
y
24
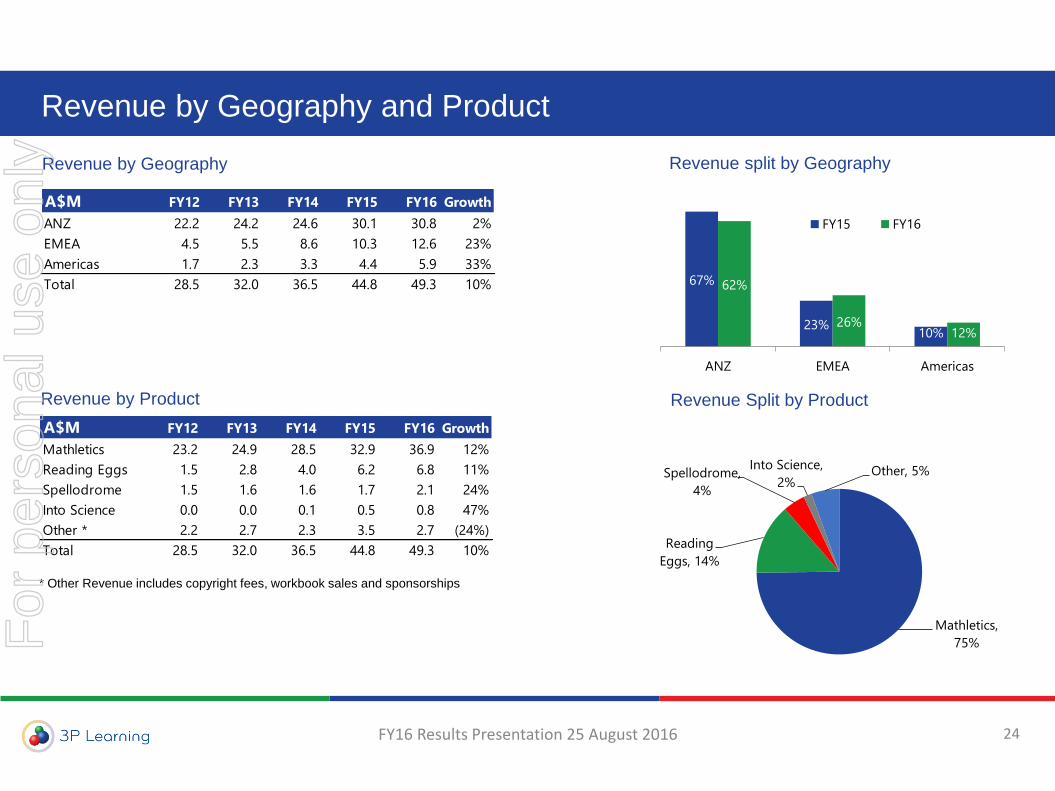
Revenue by Geography and Product
Revenue by Geography
Revenue by Product
Revenue split by Geography
Revenue Split by Product
* Other Revenue includes copyright fees, workbook sales and sponsorships
67%
23%10%
62%
26%12%
ANZ EMEA Americas
FY15 FY16
Mathletics,
75%
Reading
Eggs, 14%
Spellodrome,
4%
Into Science,
2%Other, 5%
A$M FY12 FY13 FY14 FY15 FY16 Growth
ANZ 22.2 24.2 24.6 30.1 30.8 2%
EMEA 4.5 5.5 8.6 10.3 12.6 23%
Americas 1.7 2.3 3.3 4.4 5.9 33%
Total 28.5 32.0 36.5 44.8 49.3 10%
A$M FY12 FY13 FY14 FY15 FY16 Growth
Mathletics 23.2 24.9 28.5 32.9 36.9 12%
Reading Eggs 1.5 2.8 4.0 6.2 6.8 11%
Spellodrome 1.5 1.6 1.6 1.7 2.1 24%
Into Science 0.0 0.0 0.1 0.5 0.8 47%
Other * 2.2 2.7 2.3 3.5 2.7 (24%)
Total 28.5 32.0 36.5 44.8 49.3 10%
FY16 Results Presentation 25 August 2016
For
per
sona
l use
onl
y
25
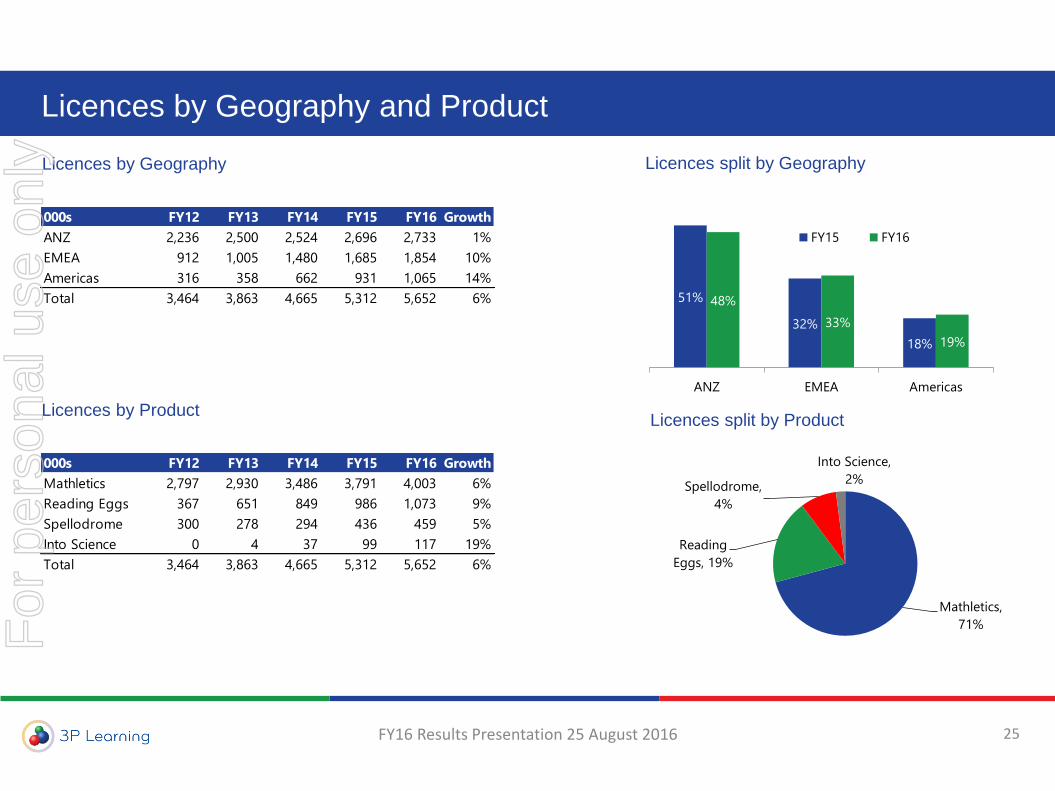
Licences by Geography and Product
Licences by Geography
Licences by Product
Licences split by Geography
Licences split by Product
51%
32%
18%
48%
33%
19%
ANZ EMEA Americas
FY15 FY16
Mathletics,
71%
Reading
Eggs, 19%
Spellodrome,
4%
Into Science,
2%
000s FY12 FY13 FY14 FY15 FY16 Growth
ANZ 2,236 2,500 2,524 2,696 2,733 1%
EMEA 912 1,005 1,480 1,685 1,854 10%
Americas 316 358 662 931 1,065 14%
Total 3,464 3,863 4,665 5,312 5,652 6%
000s FY12 FY13 FY14 FY15 FY16 Growth
Mathletics 2,797 2,930 3,486 3,791 4,003 6%
Reading Eggs 367 651 849 986 1,073 9%
Spellodrome 300 278 294 436 459 5%
Into Science 0 4 37 99 117 19%
Total 3,464 3,863 4,665 5,312 5,652 6%
FY16 Results Presentation 25 August 2016
For
per
sona
l use
onl
y

26
Statutory EBITDA
Reconciliation of Segment EBITDA to Statutory EBITDA
FY16 Results Presentation 25 August 2016
Statutory EBITDA as disclosure in Note 4 of Financial Statements
Pro forma
$M FY16 FY15 Mvmt Growth
ANZ EBITDA 21.7 21.5 0.2 1%
Less : Corporate Costs and
Development (13.8) (9.0) (4.8) (53%)
Add : Intersegment royalties 6.8 5.4 1.4 26%
Less : IPO costs - (9.4) 9.4 N/M
Statutory EBITDA 14.7 8.5 6.2 73%
EMEA EBITDA 6.7 4.6 2.1 46%
Less : Intersegment Royalties (4.6) (3.7) (0.9) (24%)
Statutory EBITDA 2.1 0.9 1.2 133%
Americas EBITDA (1.7) (0.2) (1.5) (750%)
Less : Intersegment Royalties (2.3) (1.8) (0.5) (28%)
Statutory EBITDA (4.0) (2.0) (2.0) (100%)
Group Statutory EBITDA 12.8 7.4 5.4 73%
For
per
sona
l use
onl
y

27
Important Notice and Disclaimer
The material in this presentation is a summary of 3P Learning Limited’s (‘3P’) activities and results as at the time of preparation, 25 August 2016.
No representation, express or implied, is made as to the fairness, accuracy, completeness or correctness of information contained in this presentation,
including the accuracy, likelihood of achievement or reasonableness of any forecasts, prospects, returns or statements in relation to future matters
contained in this presentation (‘forward-looking statements’). Such forward-looking statements are by their nature not based on historical facts and
are subject to significant uncertainties and contingencies and are based on a number of estimates and assumptions that are subject to change (and in
many cases are outside the control of 3P and its Directors and officers) which may cause the actual results or performance of 3P to be materially
different from any future results or performance expressed or implied by such forward-looking statements. Reliance should not be placed on
forward-looking statements and except as required by law or regulation 3P assumes no obligation to update these forward-looking statements. To
the maximum extent permitted by law, 3P and its related corporations, directors, officers, employees and agents disclaim any obligation or
undertaking to release any updates or revisions to the information in this presentation to reflect any change in expectation or assumptions and
disclaim all responsibility and liability for the forward-looking statements (including without limitation, liability for fault or negligence).
This presentation provides information in summary form only and is not intended or represented to be complete. Further, it is not intended to be
relied upon as advice to investors or potential investors and does not take into account the investment objectives, financial situation, or needs of any
particular investor.
Due care and consideration should be undertaken when considering and analysing 3P’s financial performance. All references to $ are to Australian $
unless otherwise stated.
To the maximum extent permitted by law, neither 3P nor its related corporations, directors, officers, employees and agents, nor any other person,
accepts any liability, including without limitation, any liability arising from fault or negligence, for any loss arising from the use or reliance on this
presentation or its content or otherwise arising in connection with it.
This presentation is not and should not be considered as an offer or invitation to acquire shares in 3P and does not and will not form part of any
contract for the acquisition of shares.
This presentation should be read in conjunction with other publicly available materials. Further information is available on 3P’s website at:
http://www.3plearning.com/investors/
FY16 Results Presentation 25 August 2016
For
per
sona
l use
onl
y