investor day final2
TRANSCRIPT

Investor Day 2012: The Path Forward
Investor Day 2012: The Path Forward
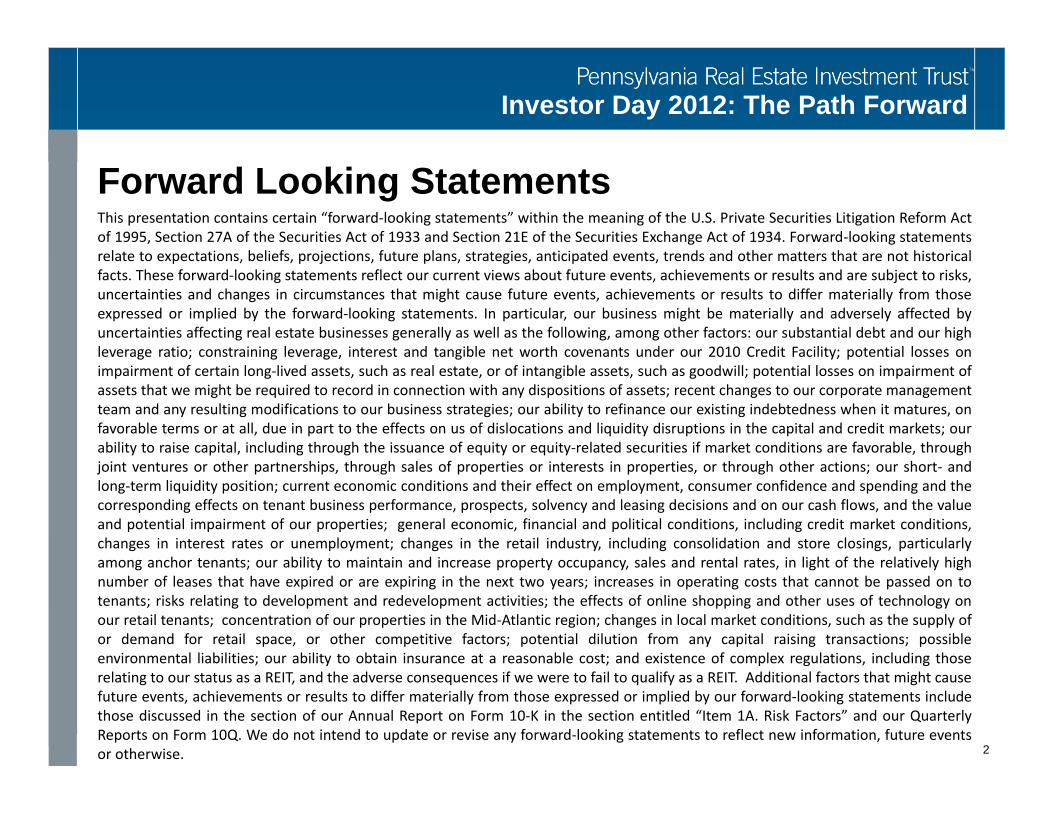
Forward Looking StatementsThis presentation contains certain “forward‐looking statements” within the meaning of the U.S. Private Securities Litigation Reform Actof 1995, Section 27A of the Securities Act of 1933 and Section 21E of the Securities Exchange Act of 1934. Forward‐looking statementsrelate to expectations, beliefs, projections, future plans, strategies, anticipated events, trends and other matters that are not historicalfacts. These forward‐looking statements reflect our current views about future events, achievements or results and are subject to risks,uncertainties and changes in circumstances that might cause future events, achievements or results to differ materially from thoseexpressed or implied by the forward‐looking statements. In particular, our business might be materially and adversely affected byuncertainties affecting real estate businesses generally as well as the following, among other factors: our substantial debt and our highleverage ratio; constraining leverage, interest and tangible net worth covenants under our 2010 Credit Facility; potential losses onimpairment of certain long‐lived assets, such as real estate, or of intangible assets, such as goodwill; potential losses on impairment ofassets that we might be required to record in connection with any dispositions of assets; recent changes to our corporate managementteam and any resulting modifications to our business strategies; our ability to refinance our existing indebtedness when it matures, onfavorable terms or at all, due in part to the effects on us of dislocations and liquidity disruptions in the capital and credit markets; ourability to raise capital, including through the issuance of equity or equity‐related securities if market conditions are favorable, throughjoint ventures or other partnerships, through sales of properties or interests in properties, or through other actions; our short‐ andlong‐term liquidity position; current economic conditions and their effect on employment, consumer confidence and spending and thecorresponding effects on tenant business performance, prospects, solvency and leasing decisions and on our cash flows, and the valueand potential impairment of our properties; general economic, financial and political conditions, including credit market conditions,changes in interest rates or unemployment; changes in the retail industry, including consolidation and store closings, particularlyamong anchor tenants; our ability to maintain and increase property occupancy, sales and rental rates, in light of the relatively highnumber of leases that have expired or are expiring in the next two years; increases in operating costs that cannot be passed on totenants; risks relating to development and redevelopment activities; the effects of online shopping and other uses of technology onour retail tenants; concentration of our properties in the Mid‐Atlantic region; changes in local market conditions, such as the supply ofor demand for retail space, or other competitive factors; potential dilution from any capital raising transactions; possibleenvironmental liabilities; our ability to obtain insurance at a reasonable cost; and existence of complex regulations, including thoserelating to our status as a REIT, and the adverse consequences if we were to fail to qualify as a REIT. Additional factors that might causefuture events, achievements or results to differ materially from those expressed or implied by our forward‐looking statements includethose discussed in the section of our Annual Report on Form 10‐K in the section entitled “Item 1A. Risk Factors” and our QuarterlyReports on Form 10Q. We do not intend to update or revise any forward‐looking statements to reflect new information, future eventsor otherwise. 2

Investor Day 2012: The Path Forward
• Virtual Property Tour 8:15
• Management Presentations 8:30– Strategic Roadmap– Implementing our Strategy– Measures of Success
• Q&A 10:00
• Virtual Property Tour 10:20
• Property Tour 10:30– Willow Grove Park featuring the new
Nordstrom Rack and jcpenney– Lunch at Willow Grove Park– Plymouth Meeting Mall (driving tour)– Cherry Hill Mall– Moorestown Mall (driving tour)
• Dinner at Osteria 6:00
3
Investor Day 2012: The Path Forward
Joseph F. CoradinoCEO
4

Investor Day 2012: The Path Forward
5
Robert McCaddenExecutive Vice President and CFOPREIT Tenure:
May, 2004
Joseph AristoneSenior Vice President LeasingPREIT Tenure:
August, 1994
Bruce GoldmanExecutive Vice President –General Counsel & SecretaryPREIT Tenure:
September, 2000
Jon BellSenior Vice President and Chief Accounting OfficerPREIT Tenure:
September, 1999
Andrew IoannouSenior Vice President Capital Markets & TreasurerPREIT Tenure:
June, 2001
Mario Ventresca, Jr.Senior Vice President Asset Management & AcquisitionsPREIT Tenure:
June, 1994

Investor Day 2012: The Path Forward
Joseph F. CoradinoCEO
6

Investor Day 2012: The Path Forward
7
Company Overview

Investor Day 2012: The Path Forward
Company Overview
8
History Founded in 1960 as one of the first publicly held equity REITs
Ticker Common: PEI; Preferred Series A: PEIPRA; Preferred Series B: PEIPRB
Common Dividend $0.64 annually, 3.9% yield, 142 consecutive payments
PortfolioApproximately 33 million square feet 49 properties, including 38 shopping malls, eight strip and power centers, and three development properties.
Occupancyas of 9/30/12
Total: 92.9% Non-Anchor: 89.1%
Sales as of 9/30/12
$379 per square foot

Investor Day 2012: The Path Forward
PREIT’s Path Forward
9
Execution of our strategic objectives…
…will drive NAV and improve the shareholder value proposition.

Investor Day 2012: The Path Forward
Priorities Implemented since becoming CEO
• Course Corrections• Flatten organization
• Reorganize personnel
• Recruiting new talent
• Establish a culture of
accountability
• Reduce G&A
10
• Implement Operational Enhancements
• Create renewed focus on core
business
• Develop property-level strategic
plans
• Focus on improving ROA
• Modify capital allocation process
• Revise transactional process
• Focus on driving ancillary
revenues
Have undergone deep organizational review in order to best
implement long term strategy and strategic objectives

Investor Day 2012: The Path Forward
Strengths• Well-located Real Estate
• Strong Tenant Relationships
• Redevelopment Expertise
• Solid Portfolio Demographics
• Pioneer of Big Boxes and
Alternative Uses
• Regional Dominance
Weaknesses• Leverage
• ROA
• Perception of Asset Quality
• Scale
• Articulation of Strategy
Threats• Stalled Improvement in US Economy
• Omni-channel Retailing & e-commerce
• Competitive Centers
• Department Store Consolidation
Opportunities• Operational Improvements
• Unlock Value in Core Portfolio
• Disposition of Non-core Properties
• Reduce Leverage
• Grow our Platform
• Enhanced Investor Communication11

Investor Day 2012: The Path Forward
Strategic RoadmapDrive shareholder value through creation of dynamic and
compelling shopping environments for the retailers, consumers and communities we serve.
Vision
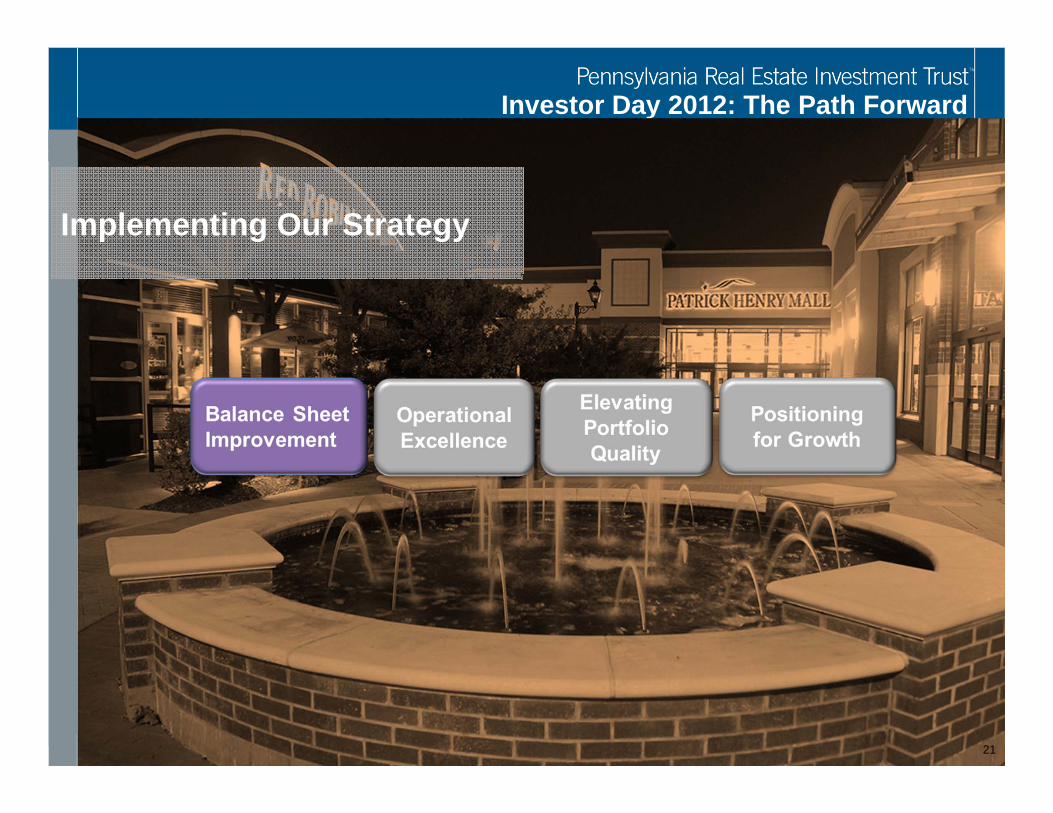
Operational Excellence
Strategic Objectives
Elevating Portfolio Quality
Balance Sheet Improvement
Positioning for Growth
- Monetize sales growth- Drive occupancy- Increase renewal spreads
- Manage expense recoveries
Implementation Tactics
Completed/Underway
- Dispose of non-core properties
- Targeted merchandising strategies
- Develop & expand quality retailer relationships
- Preferred Share offerings
- Non-core asset sales
- Harvest returns on previous investments
- Capitalize on organic opportunities
- Increase ancillary revenuesFuture Tactics - Continue to pare
portfolio as necessary
- Replace existing Credit Facility
- Opportunistic equity issuance
- Strategic acquisition program
12

Investor Day 2012: The Path Forward
13
Portfolio Overview

Investor Day 2012: The Path Forward
Geographic Footprint
14
76%NOI from Top 100 MSA
33%NOI from Philadelphia Region
Region Malls/Centers
GLA (000s) % of GLA
Philadelphia Metro 12 9,873 29.8 %
Other PA, NJ, DE 19 13,145 29.6 %
VA, MD 5 3,696 11.1 %
Other 10 6,454 19.5 %
Development 3 Land ‐
TOTAL OWNED 49 33,169 100.0 %
Investor Day 2012: The Path Forward
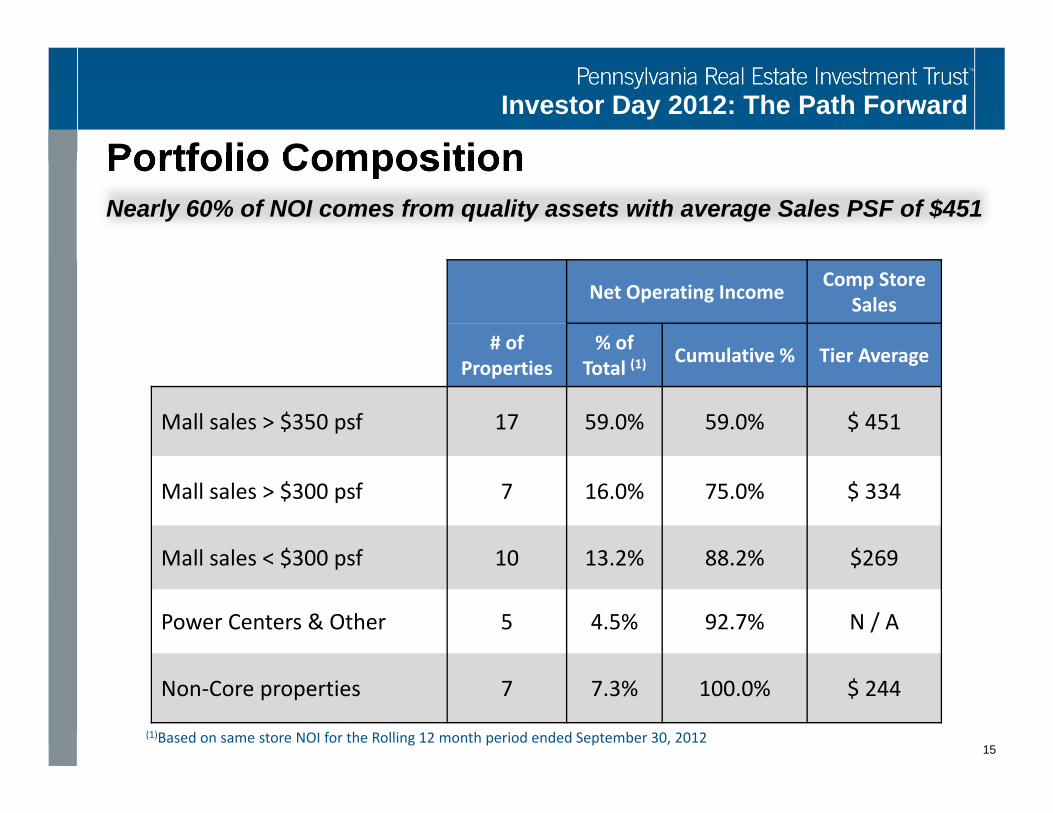
Portfolio Composition
Net Operating Income Comp Store Sales
# of Properties
% of Total (1) Cumulative % Tier Average
Mall sales > $350 psf 17 59.0% 59.0% $ 451
Mall sales > $300 psf 7 16.0% 75.0% $ 334
Mall sales < $300 psf 10 13.2% 88.2% $269
Power Centers & Other 5 4.5% 92.7% N / A
Non‐Core properties 7 7.3% 100.0% $ 244
(1)Based on same store NOI for the Rolling 12 month period ended September 30, 201215
Nearly 60% of NOI comes from quality assets with average Sales PSF of $451

Investor Day 2012: The Path Forward
The AMTRAK Corridor200 Mile radius around Philadelphia
• Gross Regional Product: $2.8 trillion
• 5th largest economy in the world
• Densely populated with favorable demographics, psychographics & spending habits
(1) Source: Select Greater Philadelphia’s 2011 Regional Report
63% of portfolio located here
16

Investor Day 2012: The Path Forward
Philadelphia Region Quality
17
6th largestpopulation
5.8M
• Ideally situated along I-95 between New York City and Washington DC
• Hub for healthcare, life sciences, higher education and financial services
• Produces one in every five physicians in the US
• Tourism mecca with hundreds of historical, cultural and natural destinations

Investor Day 2012: The Path Forward
Philadelphia Dominance
• Controls 45% of enclosed mall GLA in the seven county Philadelphia market
• PREIT malls in the Philadelphia region serve a population of approximately 6 million
18PREIT is a principal landlord in a meaningful MSA

Investor Day 2012: The Path Forward
19
Evolution of the Mall
Yesterday’s Enclosed Mall
Today’s Community Hub
We painstakingly consider the behavior of our customers…

Investor Day 2012: The Path Forward
Creative Solutions
20
Dining EntertainmentRetail
AdditionsAnchors& Boxes
Mix of Uses
Capital City . PA XCherry Hill . NJ X X XCrossroads . WV X XDartmouth . MA X XThe Gallery . PA X XJacksonville . NC X X XLycoming. PA XMall at Prince Georges . MD XMoorestown . NJ X XNew River Valley . VA X X X XPatrick Henry . VA X X XPlymouth Meeting . PA X X X X XSpringfield . PA XValley . MD X XVoorhees Town Center . NJ X X XWillow Grove Park . PA X X X
Investor Day 2012: The Path Forward
21
Implementing Our Strategy
Investor Day 2012: The Path Forward
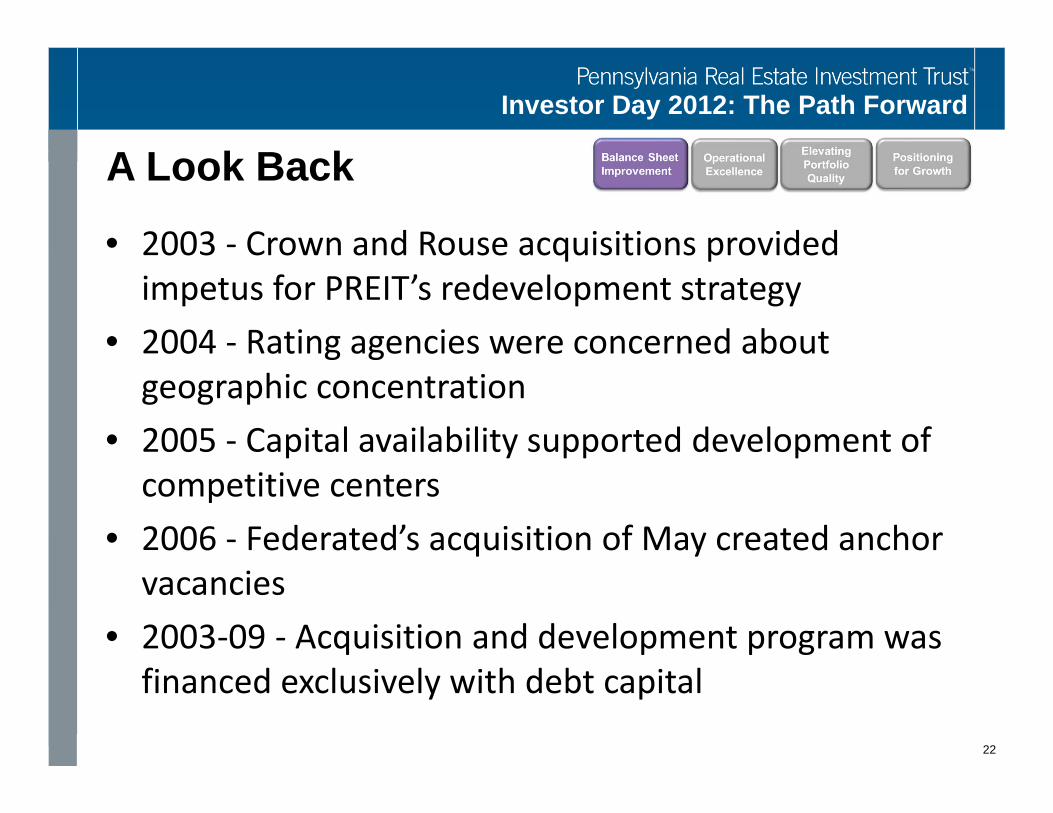
A Look Back
22
• 2003 ‐ Crown and Rouse acquisitions provided impetus for PREIT’s redevelopment strategy
• 2004 ‐ Rating agencies were concerned about geographic concentration
• 2005 ‐ Capital availability supported development of competitive centers
• 2006 ‐ Federated’s acquisition of May created anchor vacancies
• 2003‐09 ‐ Acquisition and development program was financed exclusively with debt capital

Investor Day 2012: The Path Forward
Acquisitions & Development
$0
$100
$200
$300
$400
2004 2005 2006 2007 2008 2009 2010 2011 2012YTD
Millions
Acquisitions Development 23
Spending on external growth tapered considerably…

Investor Day 2012: The Path Forward
Portfolio Investments
$16$41
$146$176
$260
$105
$15 $26 $32$0
$100
$200
$300
$400
2004 2005 2006 2007 2008 2009 2010 2011 2012YTD
Millions
Redevelopment Tenant Allowances Recurring CapEx24
Majority of portfolio reinvestment has been completed…

Investor Day 2012: The Path Forward
$0
$100,000
$200,000
$300,000
2004 2005 2006 2007 2008 2009 2010 2011 2012YTD
Thou
sand
s
Recession Redevelopment Development
Assets placed in service
25

Investor Day 2012: The Path Forward
7.72
10.25
4
6
8
10
12
$1,000
$1,500
$2,000
$2,500
$3,000
Mar‐07 Sep‐07 Mar‐08 Sep‐08 Mar‐09 Sep‐09
Millions
Debt Debt/EBITDA
Debt/EBITDA
26

Investor Day 2012: The Path Forward
Financial Priorities
27
• Reduce leverage to mitigate risk and create platform for external growth
• Extend debt maturities• Maintain strong liquidity position• Unencumber assets to optimize financing options• Improve the terms of our financial instruments
Management focused on developing platform built on financial strength

Investor Day 2012: The Path Forward
Reducing leverage
28
• March 2010 – leverage peaked at 71% (debt to GAV)• May 2010 ‐ $160M raised in common equity offering• September 2010 ‐ $135M generated from sale of power centers
• April 2012 ‐ $115M Series A preferred (8.25%)• October 2012 ‐ $86M Series B preferred (7.375%)• Pending – sale of power centers and malls• Pro forma leverage – approximately 60%
A key priority of Management

Investor Day 2012: The Path Forward
40%
50%
60%
70%
80%
$1,000
$1,500
$2,000
$2,500
$3,000
Millions
Debt Leverage Ratio
Power Center Sale
Leverage
29
Equity Offering
Asset SalesPreferred Offerings
Pro forma
Steps have been taken in order to achieve < 55% goal in 24 – 36 months

Investor Day 2012: The Path Forward
4
6
8
10
12
$1,000
$1,500
$2,000
$2,500
$3,000
Millions
Debt Debt/EBITDA
Power Center Sale
Debt/EBITDA
30
Equity Offering
Asset Sales
Preferred Offerings
Pro forma

Investor Day 2012: The Path Forward
Completed financings: 2011
Property Prior Loan Amount ($M)
Prior AvgInt Rate
New Loan Amount
($M)
New AvgInt Rate
Interest Savings
($M)
Net Proceeds
($M)
801 Market n/a n/a $27.7 3.73% n/a $27.7
Metroplex $57.8 7.25% $87.5 5.00% $1.3 $29.7
Red Rose $12.1 6.00% $15.0 5.14% $0.1 $2.9
Court at Oxford Valley $16.0 8.02% $30.0 5.56% $0.4 $14.0
Total $85.9 7.22% $160.2 4.90% $1.8 $74.3
31

Investor Day 2012: The Path Forward
Completed financings: 2012
Property Prior Loan Amount ($M)
Prior AvgInt Rate
New Loan Amount
($M)
New AvgInt Rate
Interest Savings
($M)
Net Proceeds
($M)
New River Valley $28.1 4.66% $28.1 4.66% - -
Capital City Mall $48.2 7.61% $65.8 5.30% $1.1 $17.6
Christiana Center $44.2 3.52% $50.0 4.64% $(0.5) $5.8
Cumberland Mall $41.1 6.42% $52.0 4.40% $0.8 $10.9
Cherry Hill Mall $231.5 5.44% $300.0 3.90% $3.6 $68.5
Total $392.9 5.54% $495.8 4.25% $5.0 $102.9 32

Investor Day 2012: The Path Forward
3.4
5.2
2
3
4
5
6
Years
Average Term
Extending Mortgage Maturities
33
Investor Day 2012: The Path Forward
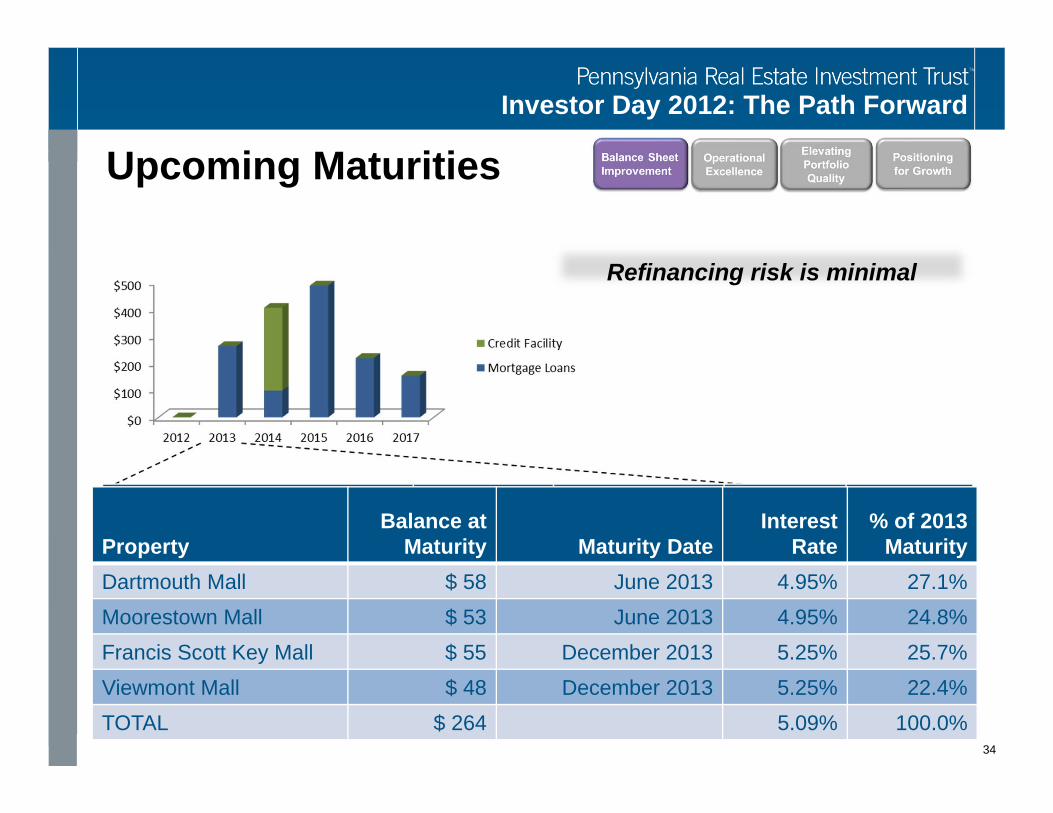
Upcoming Maturities
34
Refinancing risk is minimal
PropertyBalance at
Maturity Maturity DateInterest
Rate% of 2013
MaturityDartmouth Mall $ 58 June 2013 4.95% 27.1%Moorestown Mall $ 53 June 2013 4.95% 24.8%Francis Scott Key Mall $ 55 December 2013 5.25% 25.7%Viewmont Mall $ 48 December 2013 5.25% 22.4%TOTAL $ 264 5.09% 100.0%

Investor Day 2012: The Path Forward
35
$0
$50
$100
$150
$200
$250
$300
Dec 07 Dec 08 Dec 09 Dec 10 Dec 11 Sep 12 Sep 12 Pro‐forma*
Millions
Cash Borrowing Capacity
Liquidity
We have ample resources…
*Reflects Series B Preferred Shares Issuance

Investor Day 2012: The Path Forward
Capital Requirements
36
Current Needs:• Recurring CapEx - $15 to 18M per annum• Tenant Allowances - $15 to $25M per annum• Existing redevelopment projects - $20 to $30M to
complete– Moorestown– Residual spending on existing projects
Potential Future Considerations:• Development projects – minimal• Acquisitions
Future capital commitments require a careful, measured approach.36
Investor Day 2012: The Path Forward
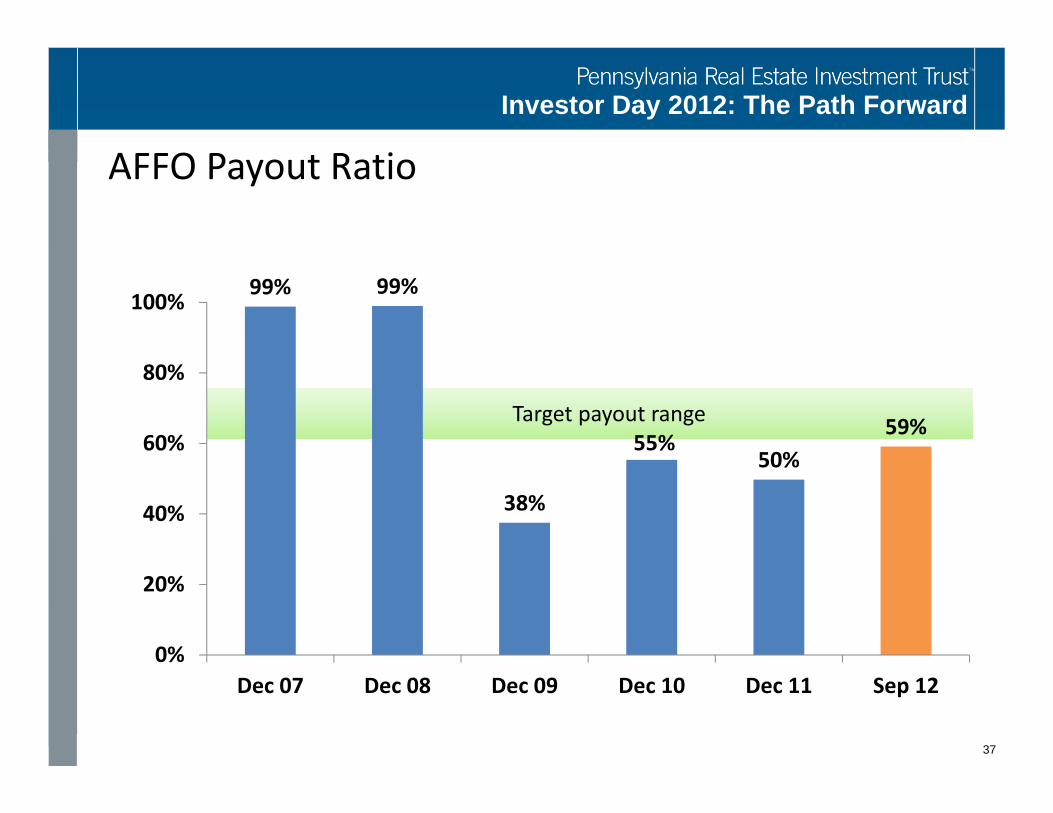
99% 99%
38%
55%50%
59%
0%
20%
40%
60%
80%
100%
Dec 07 Dec 08 Dec 09 Dec 10 Dec 11 Sep 12
AFFO Payout Ratio
Target payout range
37

Investor Day 2012: The Path Forward
A Look Ahead
38
• Close sale of non‐core assets• Establish valuation mark for other non‐core assets• Evaluate dividend policy in light of improving operating metrics
• Pursue modification to bank credit facility• Equity & equity‐linked instruments, subject to market conditions
Goal is to reduce leverage to < 55% in 24 – 36 months.

Investor Day 2012: The Path Forward
39
Investor Day 2012: The Path Forward
40
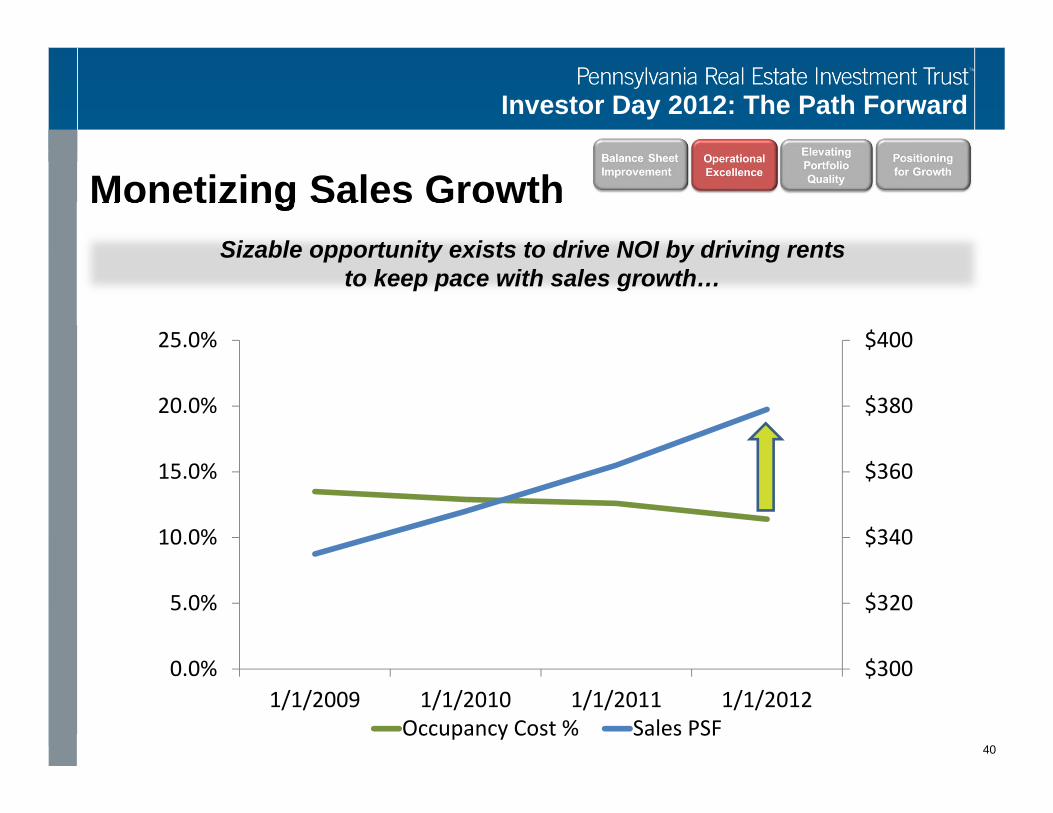
Monetizing Sales Growth
$300
$320
$340
$360
$380
$400
0.0%
5.0%
10.0%
15.0%
20.0%
25.0%
1/1/2009 1/1/2010 1/1/2011 1/1/2012Occupancy Cost % Sales PSF
Sizable opportunity exists to drive NOI by driving rentsto keep pace with sales growth…

Investor Day 2012: The Path Forward
41
Monetizing Sales Growth
Non-Core Dispositions
Replacing Underperforming Tenants
Expirations at Better Properties
From maintaining occupancy at lower productivity malls…
…To driving value at better quality, lower cap rate properties

Investor Day 2012: The Path Forward
Driving Occupancy
• Recent progress– Non-anchor mall occupancy increased from
86.4% to 88.5% from 9/09 to 9/12– Total mall occupancy increased from 89.7% to
92.9% from 9/09 to 9/12
• New talent– Average experience of group: 16 years
• New tenants added to portfolio
42

Investor Day 2012: The Path Forward
Driving Occupancy
43
Expanding our relationships with quality retailers

Investor Day 2012: The Path Forward
44
Lease Expirations> 55% of near-term expirations are in our Premier and Core Growth Portfolio
41.6%
13.5%5.0%
11.7%
28.2%
2012-2014 Expirations
Core Growth Premier Power Centers Non Core Opportunistic

Investor Day 2012: The Path Forward
45
Renewal Spreads
‐20.0%
‐15.0%
‐10.0%
‐5.0%
0.0%
5.0%
10.0%
Sep‐10 Dec‐10 Mar‐11 Jun‐11 Sep‐11 Dec‐11 Mar‐12 Jun‐12 Sep‐12
7 consecutive quarters of positive renewal spreads

Investor Day 2012: The Path Forward
46
Ancillary Revenue
Sources of Ancillary Revenue:• Specialty Leasing
(excluding temporary in-line space)
• Sponsorship Marketing• Promotional Income
012345678
2008 2009 2010 2011 2012 (F)
% of N
OI
% of NOI Goal
Approximately $2.3 Million of additional NOI could be gained by driving ancillary revenues to 7.5% of NOI

Investor Day 2012: The Path Forward
47
Managing Expense Recoveries
Expenses• Controlled with fixed
increases– Housekeeping and
Maintenance– Security– Landscaping
• Active control programs– Utilities– Real Estate Taxes
Revenues• Fixed CAM program• Annual increases,
providing for certainty of revenue stream
Business cycle postponed implementation of fixed CAM program

Investor Day 2012: The Path Forward
48

Investor Day 2012: The Path Forward
Enclosed Mall Portfolio Segmentation
49
Premier Properties Growing in value and will benefit from selective tenant upgrading.
Core Growth Properties Benefit from either solid trade areas and/or limited competition where value remains to be realized through thorough remerchandising plans and targeted asset strategies.
Opportunistic Properties Moderate sales with stability in cash flows and tenancy. These properties are likely to either become Core Growth Properties or Non-Core over time.
Non-Core Properties Properties that are targeted for sale.
Investor Day 2012: The Path Forward
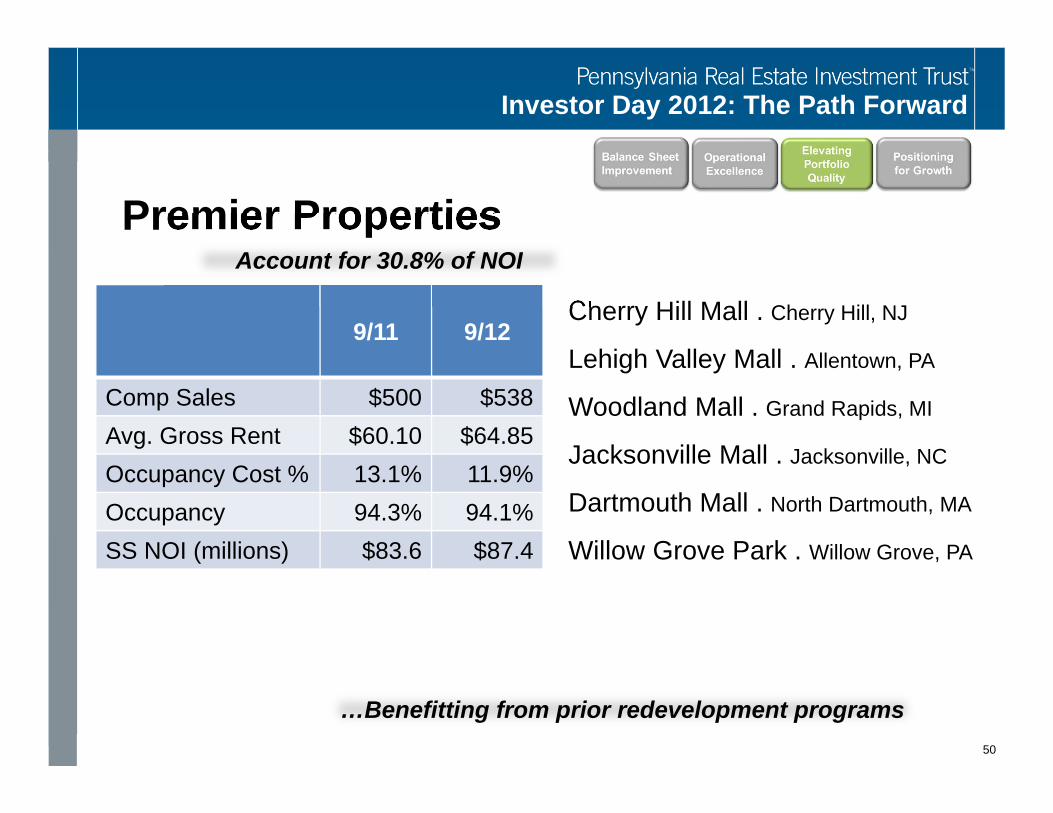
Premier Properties
50
9/11 9/12
Comp Sales $500 $538Avg. Gross Rent $60.10 $64.85Occupancy Cost % 13.1% 11.9%Occupancy 94.3% 94.1%SS NOI (millions) $83.6 $87.4
Cherry Hill Mall . Cherry Hill, NJ
Lehigh Valley Mall . Allentown, PA
Woodland Mall . Grand Rapids, MI
Jacksonville Mall . Jacksonville, NC
Dartmouth Mall . North Dartmouth, MA
Willow Grove Park . Willow Grove, PA
Account for 30.8% of NOI
…Benefitting from prior redevelopment programs

Investor Day 2012: The Path Forward
CHERRY HILL MALLCherry Hill, NJ
Key Demographics:Trade Area
Total Population 2,021,568
Total Households 767,727
Median Age 35.4
Average HHI $64,975
Source: ESRI 51
$220M redevelopment successfully transformed property into the region’s fashion & dining destination – over 228,000 sf of new retail added
Unsurpassed visibility & accessibility at Haddonfield Rd & Rt 38. S. Jersey’s busiest intersection; 100,000+ vehicles per day
Well established trade area from surrounding counties and Center City Philadelphia –146,000 households earn $100,000 +
Property comp sales at all-time high of $639/sf
Major employers in area reflect a stable & diverse economy; Cooper Health System, Virtua Health, Lockheed Martin, Campbell Soup, TD Bank & more

Investor Day 2012: The Path Forward
CHERRY HILL MALLCherry Hill, NJ
52
Sales psf $639Total Occupancy 92.6%Non-Anchor Occupancy 91.1%
First-to-Philadelphia market tenants
First-to-South Jersey market tenants
Other tenants added

Investor Day 2012: The Path Forward
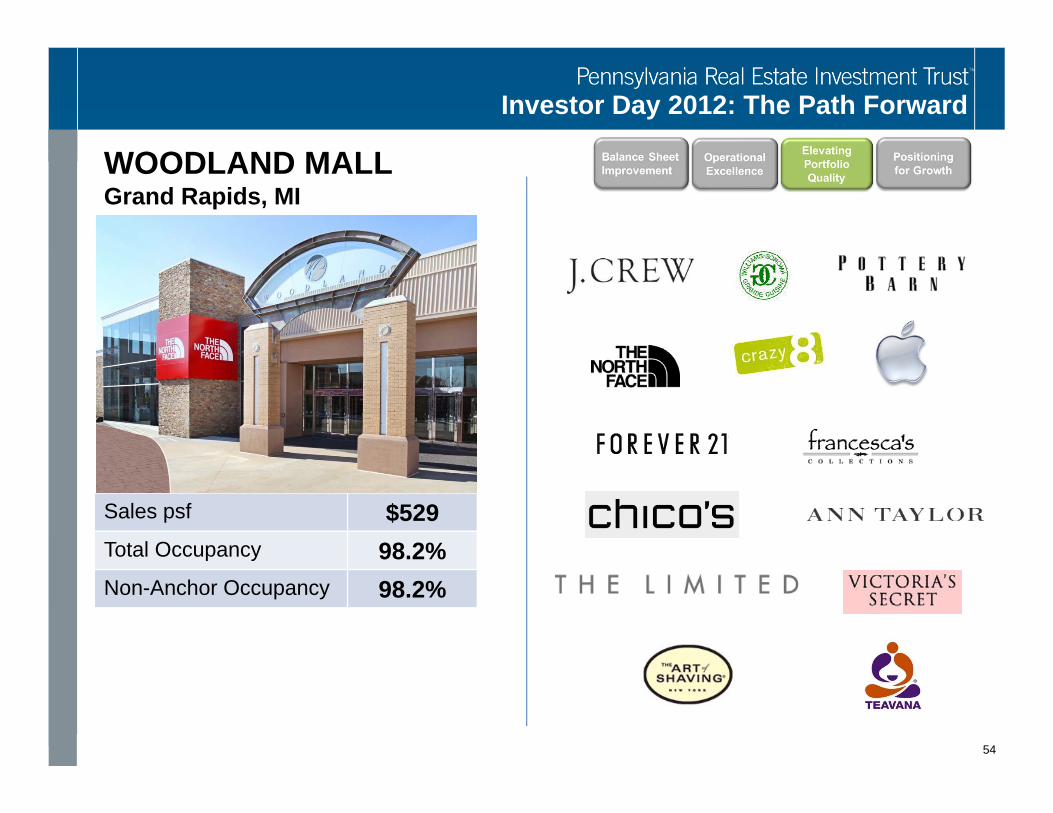
WOODLAND MALLGrand Rapids, MI
Key Demographics:Trade Area
Total Population 881,767
Total Households 325,310
Median Age 34.9
Average HHI $58,799
Source: ESRI 53
Region’s rapidly growing healthcare sector has added 17,000 jobs and $1 billion in payroll since 2004
Situated at one of the busiest intersections in the state with 85,000 + vehicles per day
Anchors jcpenney & Sears and flagship Barnes & Noble are among the top performers in their respective companies
Located in the heart of the region’s premier retail hub
The region enjoys a growing economyfueled by healthcare, technology, and pharmaceutical industries & businesses such as Spectrum Health, Meijer, Steelcase and more
Investor Day 2012: The Path Forward
WOODLAND MALLGrand Rapids, MI
Sales psf $529Total Occupancy 98.2%Non-Anchor Occupancy 98.2%
54

Investor Day 2012: The Path Forward
JACKSONVILLE MALLJACKSONVILLE, NC
Key Demographics:Trade Area
Total Population 341,139
Total Households 128,014
Median Age 31.4
Average HHI $50,249
Source: ESRI 55
Economic impact of nearby USMC Camp LeJueune is over $3.5 billion, with over 145,000 active and retired military and their families making their home in the region
Over 2,660 rooms in over 30 hotels cater to friends and family of service members
Average daily traffic on WesterBoulevard exceeds 46,000 vehicles
Only regional enclosed mall within 50 miles
Jacksonville, NC ranks 32rd out of the 366 US metros for per capita income
ULTA and Barnes & Noble are unique to the market and are major traffic drivers.

Investor Day 2012: The Path Forward
JACKSONVILLE MALLJacksonville, NC
Sales psf $504Total Occupancy 99.6%Non-Anchor Occupancy 99.1%
56
Investor Day 2012: The Path Forward
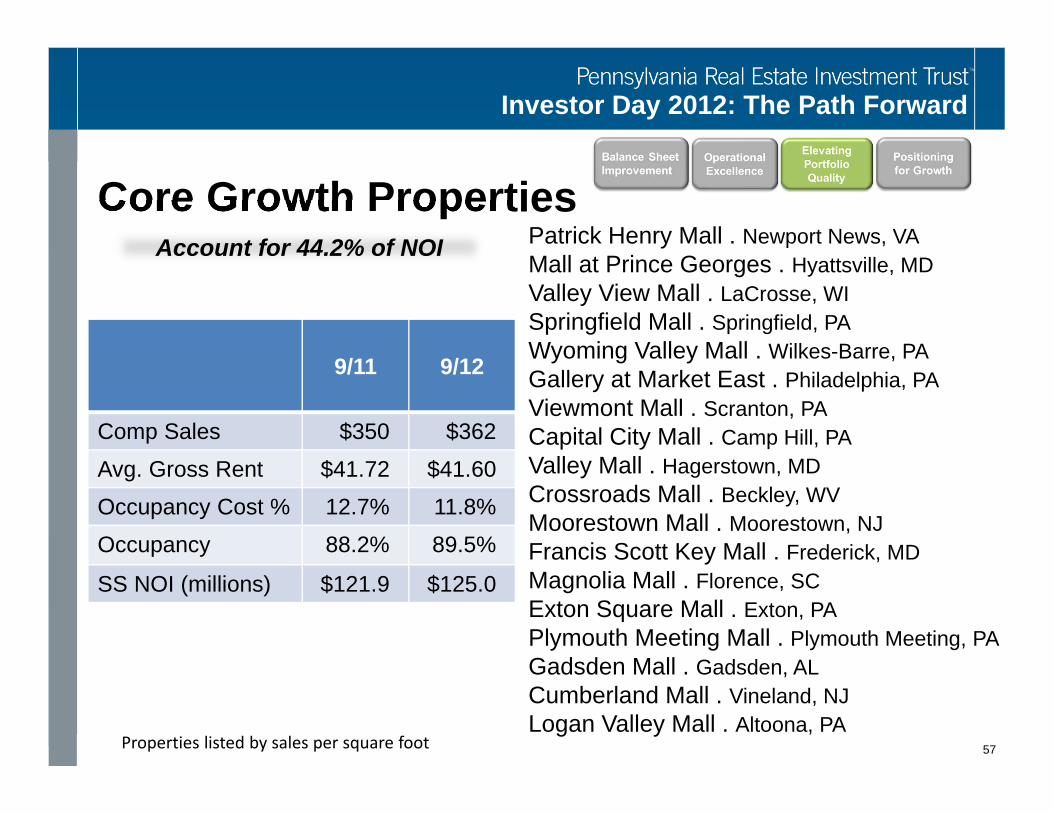
Core Growth Properties
57
9/11 9/12
Comp Sales $350 $362
Avg. Gross Rent $41.72 $41.60
Occupancy Cost % 12.7% 11.8%
Occupancy 88.2% 89.5%
SS NOI (millions) $121.9 $125.0
Patrick Henry Mall . Newport News, VAMall at Prince Georges . Hyattsville, MDValley View Mall . LaCrosse, WISpringfield Mall . Springfield, PAWyoming Valley Mall . Wilkes-Barre, PAGallery at Market East . Philadelphia, PAViewmont Mall . Scranton, PACapital City Mall . Camp Hill, PAValley Mall . Hagerstown, MDCrossroads Mall . Beckley, WVMoorestown Mall . Moorestown, NJFrancis Scott Key Mall . Frederick, MDMagnolia Mall . Florence, SCExton Square Mall . Exton, PAPlymouth Meeting Mall . Plymouth Meeting, PAGadsden Mall . Gadsden, ALCumberland Mall . Vineland, NJLogan Valley Mall . Altoona, PA
Account for 44.2% of NOI
Properties listed by sales per square foot

Investor Day 2012: The Path Forward
CAPITAL CITY MALLCamp Hill, PA
Key Demographics:Trade Area
Total Population 564,947
Total Households 229,977
Median Age 40.5
Average HHI $70,665
Source: ESRI & Alexander Babbage 58
Strong daytime populations bolstered by Federal and State employees. Over 39,000 government workers approximately 8 miles from the center
Average daily traffic on adjacent Rt 11/15 is over 83,000 vehicles with direct visibility & accessibility from the highway
Local economy has grown to become vastly diversified with a large representation of service-related industries, especially health care and a growing technological industry
Dominant mall in the region featuring an array of first-to-market retailers
Other major employers in region are Penn State, Milton Hershey Medical Center, Giant Food, Hershey Entertainment & Resorts and Rite-Aid

Investor Day 2012: The Path Forward
CAPITAL CITY MALLCamp Hill, PA
Sales psf $372Total Occupancy 96.2%Non-Anchor Occupancy 93.5%
59

Investor Day 2012: The Path Forward
CAPITAL CITY MALLCamp Hill, PA
60
Playing off of the property’s market dominance, upgrade merchandise offerings, adding restaurants, lifestyle and in-demand junior retail to become a fashion and dining destination in the Harrisburg market.
Strategic Vision
Proposed Restaurants
Proposed Lifestyle Tenants
Proposed Lifestyle Tenant
Proposed Junior Apparel Tenant
Proposed Specialty Goods Tenants
Proposed Fast Casual
Proposed Specialty Goods Tenants DSW
Opening Spring 2013

Investor Day 2012: The Path Forward
VIEWMONT MALLScranton, PA
Key Demographics:Trade Area
Total Population 373,182
Total Households 150,629
Median Age 43.1
Average HHI $56,279
Source: ESRI 61
Convenient to I-84, I-81, I-380, Rt 6 & the PA Turnpike – area roads deliver over 70,000 vehicles per day
Over 35,000 high school & college students within the trade area
Over 1,000 hotel rooms within 1 mile of the mall
Area’s long established, family friendly shopping destination, featuring a wide array of in-demand national retailers
Top area employers include: US Gov’t, Allied Services, Kane Transportation, Commonwealth of PA, Moses Taylor Hospital
Growing regional tourist destination with new attractions dedicated to the area’s coal mining and steam train history

Investor Day 2012: The Path Forward
VIEWMONT MALLScranton, PA
Sales psf $377Total Occupancy 98.7%Non-Anchor Occupancy 96.6%
62

Investor Day 2012: The Path Forward
VIEWMONT MALLScranton, PA
To solidify our position as the dominant shopping center in the region by becoming the fashion destination, adding first-to-market, in-demand tenants and offering more for our customers by expanding the sit-down dining offerings while replacing underperforming stores and improving our merchandise offerings.
63
Strategic Vision
Proposed Fashion Junior Anchor Proposed
Women’s & Juniors Tenants

Investor Day 2012: The Path Forward
VALLEY MALLHagerstown, MD
Key Demographics:Trade Area
Total Population 492,995
Total Households 188,933
Median Age 39.8
Average HHI $63,741
Source: ESRI 64
Located at second busiest intersection in Washington County, accessible to I-81 &I-70. Average Daily Traffic around mall
exceeds 110,000
Regal Cinemas is the largest stadium seating theatre within 25 miles and is a major driver of mall traffic
Top employers include Washington County Public School, First Data, State of Maryland, Meritus Medical Center, CitiGroup Financial
Dominant regional enclosed shopping center within 30 miles, attracting shoppers in the tri-state area of MD, PA & WV
Washington County is experiencing a population boom as the western edge of Washington DC metro pushes out
Defense, aviation and aerospace Industries growing rapidly in the region

Investor Day 2012: The Path Forward
VALLEY MALLHagerstown, MD
Sales psf $368Total Occupancy 94.7%Non-Anchor Occupancy 90.9%
65

Investor Day 2012: The Path Forward
VALLEY MALLHagerstown, MD
66
Enhance the NOI and sales productivity of the property by upgrading the tenant mix to include trendy fashion-forward junior tenants and additional dining options.
Strategic Vision
Proposed Footwear Tenant Café Rio Mexican Grill Proposed
Fashion Tenant
p.s. from Aeropostale
Proposed Fashion Tenants
Proposed Music & Entertainment Tenant
Proposed Accessory Tenant
Proposed Fashion TenantProposed Restaurant
Body Central
Tilted Kilt Men’s Wearhouse
Investor Day 2012: The Path Forward
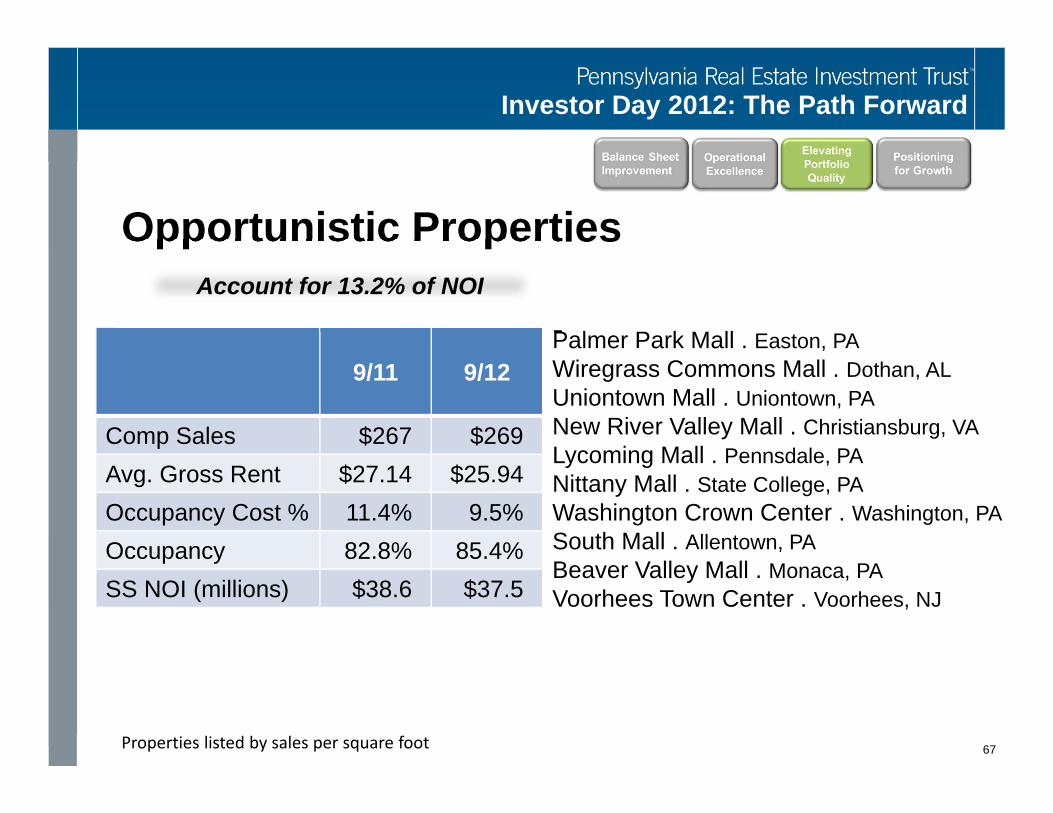
Opportunistic Properties
67
9/11 9/12
Comp Sales $267 $269Avg. Gross Rent $27.14 $25.94Occupancy Cost % 11.4% 9.5%Occupancy 82.8% 85.4%SS NOI (millions) $38.6 $37.5
Palmer Park Mall . Easton, PAWiregrass Commons Mall . Dothan, ALUniontown Mall . Uniontown, PANew River Valley Mall . Christiansburg, VALycoming Mall . Pennsdale, PANittany Mall . State College, PAWashington Crown Center . Washington, PASouth Mall . Allentown, PABeaver Valley Mall . Monaca, PAVoorhees Town Center . Voorhees, NJ
Account for 13.2% of NOI
Properties listed by sales per square foot
Investor Day 2012: The Path Forward
Integrating Non-Retail Uses
• Office
• Government
• Education
• Healthcare
• Community Agencies
68
828,000 sf (2.5% of portfolio) is dedicated to non-retail uses

Investor Day 2012: The Path Forward
Voorhees Town CenterMunicipal Offices
69

Investor Day 2012: The Path Forward
New River Valley MallCommunity College
70

Investor Day 2012: The Path Forward
Beaver Valley MallCommunity Agencies
• Job Training for Beaver Co• DCI Career Institute• Beaver Co. Office on Aging• PA CareerLink
71
Investor Day 2012: The Path Forward
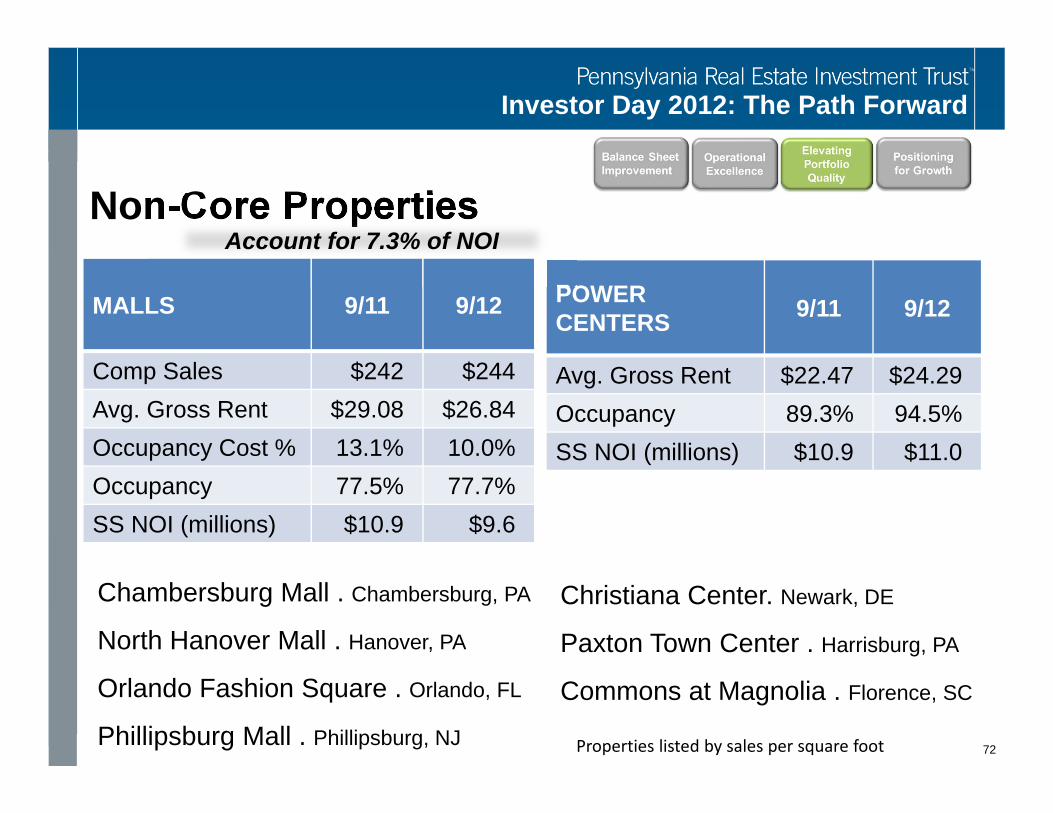
Non-Core Properties
72
MALLS 9/11 9/12
Comp Sales $242 $244Avg. Gross Rent $29.08 $26.84Occupancy Cost % 13.1% 10.0%Occupancy 77.5% 77.7%SS NOI (millions) $10.9 $9.6
POWER CENTERS 9/11 9/12
Avg. Gross Rent $22.47 $24.29Occupancy 89.3% 94.5%SS NOI (millions) $10.9 $11.0
Account for 7.3% of NOI
Chambersburg Mall . Chambersburg, PA
North Hanover Mall . Hanover, PA
Orlando Fashion Square . Orlando, FL
Phillipsburg Mall . Phillipsburg, NJ
Christiana Center. Newark, DE
Paxton Town Center . Harrisburg, PA
Commons at Magnolia . Florence, SC
Properties listed by sales per square foot

Investor Day 2012: The Path Forward
88.5%
89.5%
In‐line Mall Occupancy
Impact of Non-Core Dispositions
$379
$389
Sales psf
92.9%
93.2%
Total Occupancy
Marketed assets include Chambersburg Mall, North Hanover Mall, Orlando Fashion Square, Phillipsburg Mall, Christiana Center, The Commons at Magnolia, and Paxton Towne Centre. There can be no assurance that the marketed assets will be sold, or sold within any particular time frame, or that the sales per square foot of the balance of the portfolio will remain static. This slide illustrates the effect if such marketed assets had been sold as of Sept. 30, 2012. 73

Investor Day 2012: The Path Forward
74

Investor Day 2012: The Path Forward
Acquisition Criteria
75
• Strategic location• Fundamentals equal to or better than existing portfolio
averages• NOI growth potential• Stable or growing demographics• Opportunity to upgrade tenancy
Future potential growth platform

Investor Day 2012: The Path Forward
Moorestown Mall
Marc Vetri’s Osteria to open in 2013. Currently negotiating leases for 3 other restaurants.
Regal to open the only 12-Screen Premium Experience Theater concept in the region in Summer 2013. 76
Property vision: Convenient retail, dining and entertainment environment in a family friendly atmosphere.
Project underway…

Investor Day 2012: The Path Forward
Plymouth Meeting Mall
Incorporate hotel and multi-family uses at well-located property to increase density surrounding the retail.
77
Monetizing land…
Investor Day 2012: The Path Forward
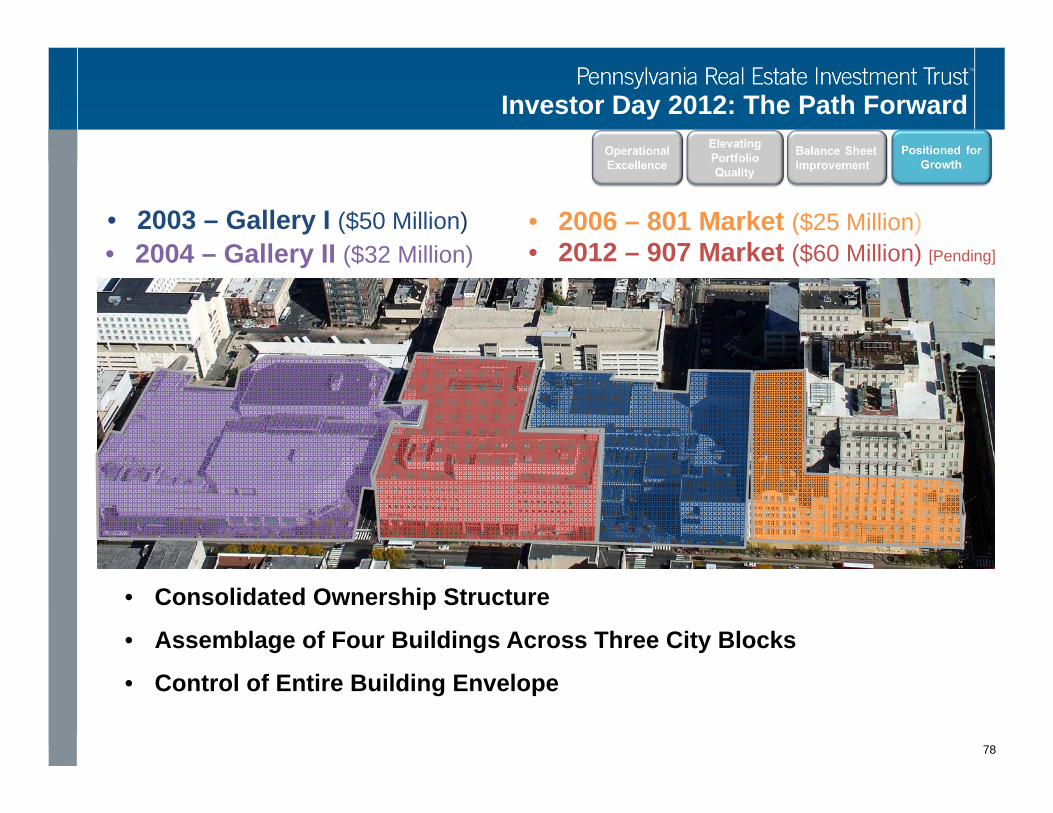
• Consolidated Ownership Structure
• Assemblage of Four Buildings Across Three City Blocks
• Control of Entire Building Envelope
78
• 2003 – Gallery I ($50 Million)• 2004 – Gallery II ($32 Million)
• 2006 – 801 Market ($25 Million)• 2012 – 907 Market ($60 Million) [Pending]

Investor Day 2012: The Path Forward
al
2
3
4
5
6
THE GALLERY Mellon Independence
Center
13th
St Boutique &
Restaurant Corridor
Market Street
Washington Square
Curtis
Center
RestaurantRow
Girard Estate
Retail
Restaurant Row
Justice Center
Restaurant
Apartments
Apartm
ents
Hilton
Home2 Suites
Retail Retail
79

Investor Day 2012: The Path Forward
Exton Square MallExisting K Mart parcel
• Over 60,000 vehicles
passing by daily
• Located in Chester
County, PA - the 24th
richest county in the US
• Parcel is available in
2016
• Strategic to adjacent mall
property80
Investor Day 2012: The Path Forward
81
Measuring our Success

Investor Day 2012: The Path Forward
Key Performance IndicatorsMeasure of Success Today 2015
Leverage 62% < 55%
Debt/EBITDA 8.8 < 7.5
SS NOI Growth 1–2% > 3%
Total Mall Occupancy 92.6% 95.0%
Occupancy Cost 11.4% 12.5%
Sales PSF $379 > $400
82

Investor Day 2012: The Path Forward
Key Takeaways
83
• Dominant player in the Philadelphia market
• Focused on improving financial position
• 60% of NOI comes from quality assets with average sales psf of
$451
• Future capital commitments require a careful, measured
approach
• Significant value to be realized in portfolio by driving
occupancy costs and strategic re-tenanting in our Core Growth
portfolio
We are committed to:The Path Forward

Investor Day 2012: The Path Forward