investor deep dive - d b
TRANSCRIPT

10 December 2019 Deutsche Bank
Confidential
Investor Deep Dive
James von MoltkeChief Financial Officer

James von MoltkeInvestor Deep Dive, 10 December 2019
Summary
1
Cost reductions driven by infrastructure, technology, Capital Release Unit and German retail integration
Disciplined capital management to maintain CET 1 ratio at or above target levels
Affirming 8% return on tangible equity target for 2022 – working to fully overcome headwinds
On track to reach short-term targets

James von MoltkeInvestor Deep Dive, 10 December 2019
Stabilizing the Core BankExcluding specific items(1), in € bn
2
Revenues(2) Adjusted profit before tax(3)
Note: Throughout this presentation totals may not sum due to rounding differences(1) Specific items defined on slide 18(2) Excluding specific revenue items(3) Based on revenues ex specific items and noninterest expenses ex transformation related charges (9M 2019 transformation charges: € 111m, Q3 2019
transformation related restructuring and severance: € 135m and 9M 2019 impairment of goodwill: € 1,037m)
17.6 17.4
1.6
9M 2018
0.5
19.2
9M 2019
CapitalRelease
Unit
CoreBank
17.9
2.1 2.2
(1.7)CapitalReleaseUnit
(1.0)
9M 2018 9M 2019
CoreBank(1)%
(70)%

James von MoltkeInvestor Deep Dive, 10 December 2019
3
4% 1%
2%
2%
Corporate & Other
CorporateBank
9M 2019 Core Bank ex items(1)
PrivateBank
InvestmentBank
0%
Asset Management
(1%)
2022Core Bank
target
>9%
All businesses support improving Core Bank profitability Post-tax return on tangible equity, in %
(1) Items include specific revenue items, impairments of goodwill and other intangible assets, software and real estate impairments, transformation related restructuring and severance and deferred tax asset valuation adjustments. 9M 2019 reported post-tax return on tangible equity: (10.3)%. For further details see slides 18 and 19

James von MoltkeInvestor Deep Dive, 10 December 2019
Improving returns over time
4
Corporate Bank 12-13%
Investment Bank
Asset Management >20%
Private Bank 10-11%
Corporate Bank 9%
Investment Bank 2%
AssetManagement 19%
Private Bank 4%
2018 post-tax return on tangible equity(1) 2022 targeted post-tax return on tangible equity
7-8%
(1) 2018 post-tax return on tangible equity includes refinements of revenue and cost allocations between the Corporate Bank and the Private Bank to be reflected in our financial disclosure from Q4 2019. See page 20 for further details. 2018 Corporate Bank reported post-tax return on tangible equity: 10%, Private Bank: 4%
James von MoltkeInvestor Deep Dive, 10 December 2019
Group Sales & Trading
5
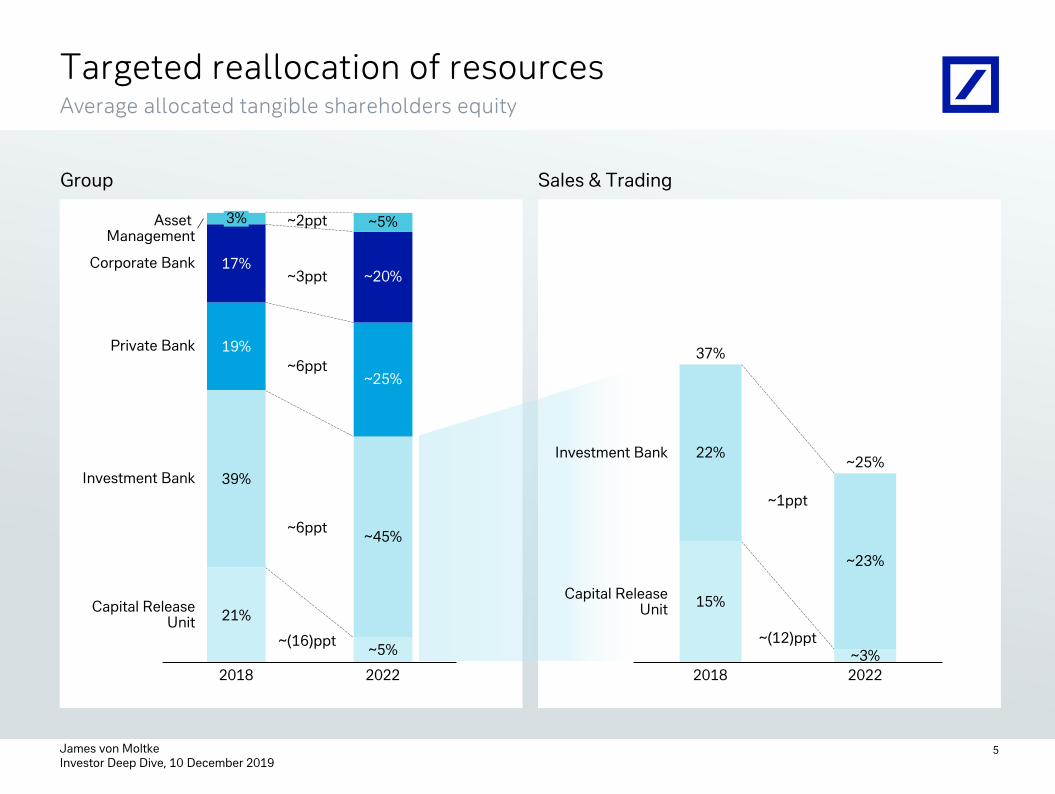
Targeted reallocation of resourcesAverage allocated tangible shareholders equity
21%
39%
19%
17%
2018
3% ~5%
~45%
~20%
~25%
~5%
2022
Asset Management
Corporate Bank
Private Bank
Investment Bank
Capital ReleaseUnit
~6ppt
~6ppt
~3ppt
~2ppt
~3%2022
22%
2018
15%
~23%
Capital ReleaseUnit
Investment Bank
37%
~25%
~(16)ppt
~1ppt
~(12)ppt
James von MoltkeInvestor Deep Dive, 10 December 2019
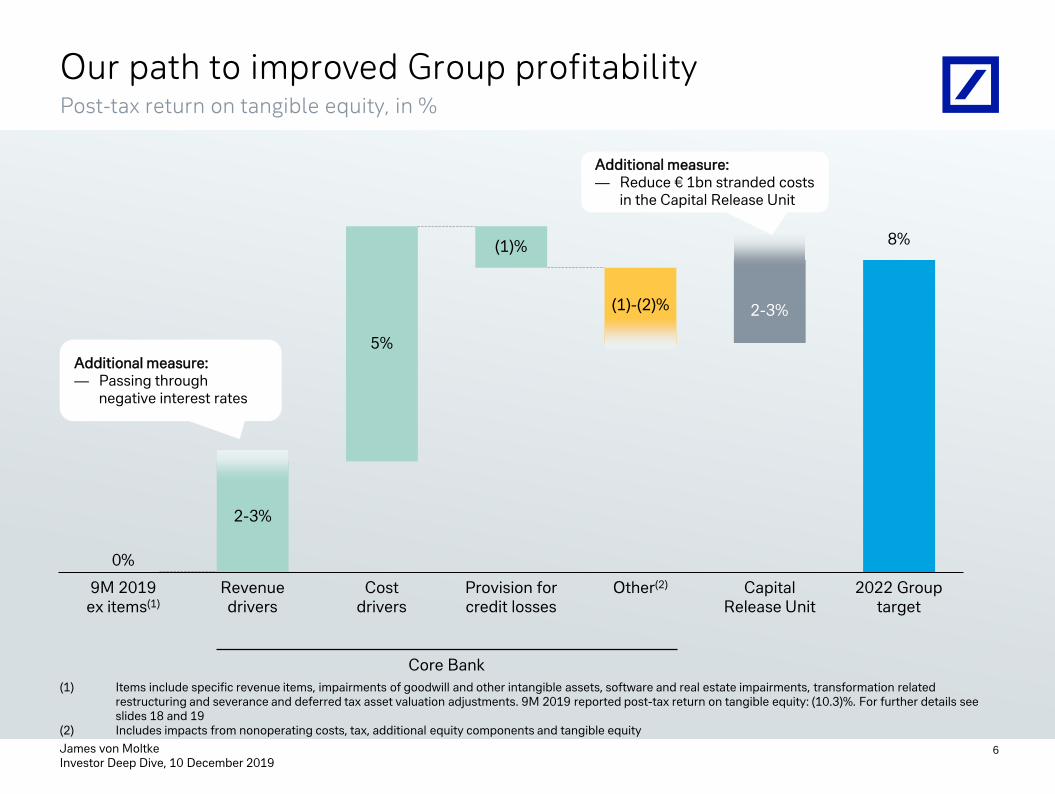
Our path to improved Group profitabilityPost-tax return on tangible equity, in %
6
(1)%
Revenuedrivers
9M 2019 ex items(1)
Provision for credit losses
Costdrivers
2-3%
5%
(1)-(2)%
Other(2) Capital Release Unit
2022 Group target
0%
8%
(1) – (2)
(1) Items include specific revenue items, impairments of goodwill and other intangible assets, software and real estate impairments, transformation related restructuring and severance and deferred tax asset valuation adjustments. 9M 2019 reported post-tax return on tangible equity: (10.3)%. For further details see slides 18 and 19
(2) Includes impacts from nonoperating costs, tax, additional equity components and tangible equity
2-3%
Core Bank
Additional measure:— Passing through
negative interest rates
Additional measure:— Reduce € 1bn stranded costs
in the Capital Release Unit

James von MoltkeInvestor Deep Dive, 10 December 2019
Mitigation measures to offset headwindsIn € bn, unless otherwise stated
7
67
34
105
44
6
63
30
Euro current accounts
Charging agreements
in place(1)
Under review for charging
agreements(1)
259
~20
~110
<€ 100k
>€ 100k
>€ 2m
Private Bankex Wealth Management
(1) Indicates current account balances held by clients. Thresholds and client behaviour will impact actual balances charged
Interest rate impact ~(0.9)
~23.8
Revenue plan (as of 10 Dec) ~24.5
Revenue plan (as of 8 July) ~25.0
Mitigationmeasures in place
~0.1
Perimeter adjustments ~0.6
Additional pass through of negative interest rates
2022 Q3 2019
Wealth Management
>€ 2m
Corporate Bank
<€ 1m
<€ 20m
>€ 20m
More conservative equity market assumptions ~(0.3)
ECB tiering
To be determined
Changevs. July
<€ 2m
Passing through negative interest rates ~0.1
Current account balances held above thresholds

James von MoltkeInvestor Deep Dive, 10 December 2019
Updated revenue growth assumptionsCompound annual growth rate in revenues
8
(1) Excluding interest rate and balance sheet efficiency impacts(2) Including interest rate and balance sheet efficiency impacts
Core Bank
Corporate Bank
Investment Bank
Private Bank
Asset Management
Reported(2)
2018 – 2022
1%
3%
2%
0%
1%
2%
3%
0%
2%
2%
Operating(1)
2018 – 2022
Strategy announcement (July)
Updated plan
James von MoltkeInvestor Deep Dive, 10 December 2019
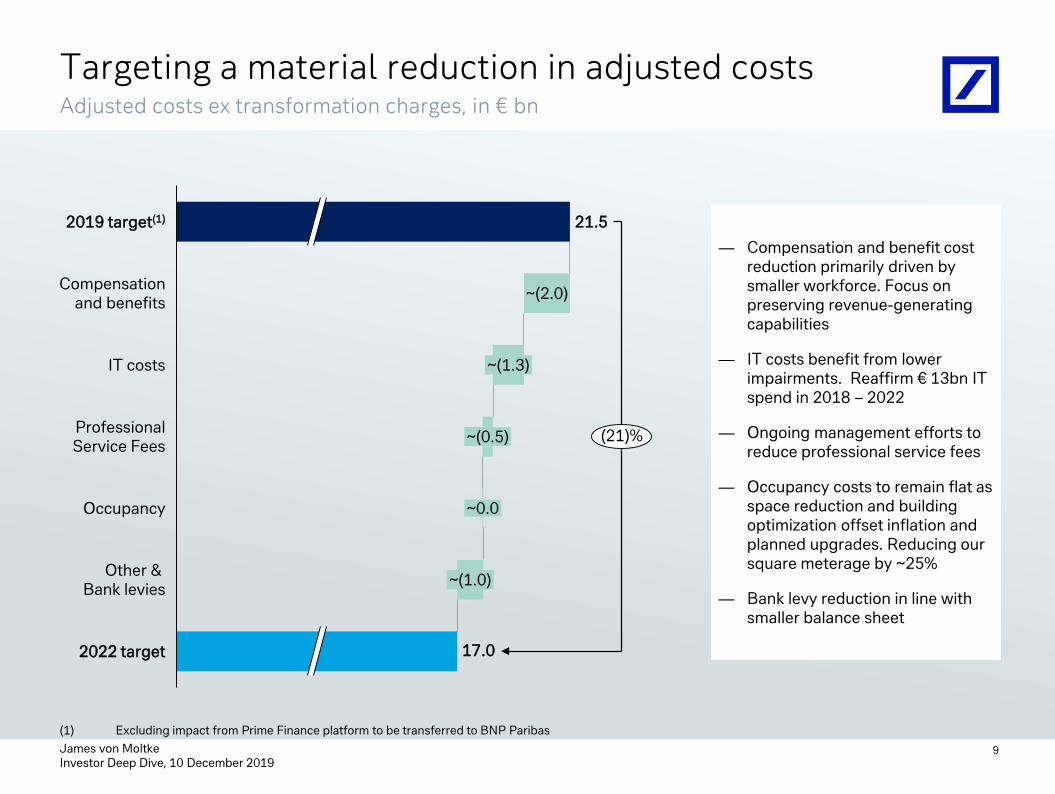
Targeting a material reduction in adjusted costsAdjusted costs ex transformation charges, in € bn
9
2022 target
~(2.0)
2019 target(1)
Occupancy
Compensationand benefits
~(1.3)IT costs
17.0
~(0.5)ProfessionalService Fees
~0.0
Other & Bank levies ~(1.0)
21.5
(21)%
— Compensation and benefit cost reduction primarily driven by smaller workforce. Focus on preserving revenue-generating capabilities
— IT costs benefit from lower impairments. Reaffirm € 13bn IT spend in 2018 – 2022
— Ongoing management efforts to reduce professional service fees
— Occupancy costs to remain flat as space reduction and building optimization offset inflation and planned upgrades. Reducing our square meterage by ~25%
— Bank levy reduction in line with smaller balance sheet
(1) Excluding impact from Prime Finance platform to be transferred to BNP Paribas
~(0.5)
~0.0

James von MoltkeInvestor Deep Dive, 10 December 2019
10
Benefitting from investments in cost management tools
What? Benefits When?
Driver Based Cost Management
Granular activity based charging of infrastructure costs to businesses
Transparency on cost of internal servicesProvides measures on a unit cost basis
Launched in H2 2019, starting with non-technology infrastructure
External spend governance
Decision making body overseeing external spend behaviour
Cross-divisional governance with clear expense line ownership driving more disciplined external spend
Implemented in 2018
Process mappingUse digital footprints to measure and visualize process flows
More efficient and effective process optimizationFind and eliminate bottlenecks and duplications
Q4 2019
Balanced Scorecards
Manages and tracks implementation of key objectives
PrioritizationAccountabilityData accuracy
2018: Management Board2019/2020: top ~200 managers
Cost Catalystprogram
Identifies and tracks cost reduction measures Flagship program to drive cultural change
Tangible cost impact of identified measuresEmployee engagement
Initiated in Q2 2018

James von MoltkeInvestor Deep Dive, 10 December 2019
0.7 0.5 0.4
0.8
0.4 0.2
1.0
0.4
2.8
0.1
2019
0.1
2020
0.1
20210.1
2022
Transformation costs to execute our strategy quicklyIn € bn
11
Deferred tax asset valuation adjustment
Goodwill impairment(1)
Software impairmentReal estate impairment
Restructuring & Severance
Deferred Tax Asset valuation adjustment
Goodwill impairment(1)
Software impairment
Real estate impairment
Restructuring & Severance
3.4
1.0
1.2
0.3
1.7
-
0.3
0.6
-
(0.6)
2019 – 2022 cumulative expenses
Change vs. Strategy
announcement (July 2019)
Note: Assumed restructuring and severance, impairments and deferred tax valuation adjustments in future periods are preliminary and subject to change. Non-tax items are shown on a pre-tax basis. See slide 18 for further details
(1) Non-tax deductible
Pre-tax items

James von MoltkeInvestor Deep Dive, 10 December 2019
20202019 Core Bank capital accretion
Capital Release Unit net impact
Regulatory impact 2021and beyond
12.7%
>13%
Managing our capital positionCET1 ratio outlook, in %
12
Capital forfuture distribution
from 2022
Maximum Distributable
Amount(1)
Note: 9M 2019 reported CET1 ratio: 13.4%(1) Reduced Pillar 2 requirement of 2.5% following 2019 Supervisory Review and Evaluation Process (SREP), applicable from 1 January 2020
11.6%
At least 12.5%
11.8%

James von MoltkeInvestor Deep Dive, 10 December 2019
Well positioned to offset regulatory headwindsRisk weighted assets, in € bn
13
July 2019
December 2019
Guidance
Note: Impacts and timings of regulatory headwinds are subject to uncertainty and finalization of rules(1) Compared to Q3 2019 total risk weighted assets
2020 2021 2022 2023 2024 2028/2029
25 5 - 25 - Not given
15 15 - - 25 10% – 15% of RWA(1)
Principally EBA guideline
Basel 3 final rules (output floors)
Basel 3 final rules (internal models)
…
…
…
Expected net income generation of ~1% of risk weighted assets(1) per year
10

James von MoltkeInvestor Deep Dive, 10 December 2019
14
3.9% 4.0%
4.5%
0.5%
0.5%
20229M 2019
0.1%
2019 2020
~5.0%
Material improvement in leverage ratio planned Leverage ratio (CRD 4, fully loaded), in %
~€ 100bn planned reduction from Capital Release Unit, partially offset by select business growth
Phase 1: Run-down Phase 2: Capital generation
Retained earnings after distributions

James von MoltkeInvestor Deep Dive, 10 December 2019
Near-term objectives
15
(1) Excluding transformation charges and impact from Prime Finance platform to be transferred to BNP Paribas
Leverage ratio 4%
Adjusted costs(1) € 21.5bn € 19.5bn
4.5%
2019 2020
CET1 ratio >13% At least 12.5%

James von MoltkeInvestor Deep Dive, 10 December 2019
Financial targets
16
8%Group return on tangible equity
€ 17bnAdjusted costs
70%Cost income ratio
At least 12.5%CET1 ratio
2022
~5%Leverage ratio
>9%Core Bank return on tangible equity

Deutsche Bank
Appendix

James von MoltkeInvestor Deep Dive, 10 December 2019
9M 2019 specific revenue items and adjusted costsIn € m
9M 2019 9M 2018
CB IB PB AM C&OCore Bank CRU Group CB IB PB AM C&O
Core Bank CRU Group
Revenues 3,920 5,443 6,311 1,662 95 17,431 385 17,816 3,857 6,087 6,617 1,673 (111) 18,122 1,619 19,741
DVA - IB Other / CRU(1) - (126) - - - (126) (19) (146) - 59 - - - 59 - 59
Change in valuation of an investment - FIC S&T - 101 - - - 101 - 101 - 84 - - - 84 - 84
Gain on sale - Global Transaction Banking - - - - - - - - 57 - - - - 57 - 57
Gain from property sale - Private Bank Germany - - - - - - - - - - 156 - - 156 - 156
Sal. Oppenheim workout - Wealth Management - - 84 - - 84 - 84 - - 136 - - 136 - 136
Update in valuation methodology - CRU - - - - - - (81) (81) - - - - - - - -
Revenues ex. specific items 3,920 5,468 6,227 1,662 95 17,373 485 17,858 3,800 5,944 6,324 1,673 (111) 17,630 1,619 19,249
Noninterest expenses 3,436 4,813 6,129 1,273 288 15,940 2,740 18,681 2,794 5,021 5,752 1,307 292 15,167 2,653 17,819
Impairment of goodwill and other intangible assets 492 - 545 - - 1,037 - 1,037 - - - - - - - -
Litigation charges, net (12) 140 (38) 1 99 191 69 260 6 83 (75) 17 50 81 (32) 49
Restructuring and severance 27 119 (17) 38 53 221 112 332 31 194 39 17 39 320 62 382
Adjusted costs 2,929 4,554 5,639 1,234 136 14,491 2,560 17,051 2,757 4,744 5,788 1,273 203 14,765 2,623 17,388
Transformation charges(2) 6 77 17 9 2 111 426 537 - - - - - - - -
Adjusted costs ex. transformation charges 2,923 4,476 5,623 1,225 134 14,381 2,134 16,514 2,757 4,744 5,788 1,273 203 14,765 2,623 17,388
18
(1) Including an update of the DVA valuation methodology in Q3 2019(2) Costs related to Deutsche Bank’s transformation as a result of the strategy announcement on 7 July 2019. Charges include impairment of software and real estate,
legal fees related to asset disposals as well as amortization on software related to the Equities Sales and Trading business

James von MoltkeInvestor Deep Dive, 10 December 2019
9M 2019 impact of transformation effectsIn € m, unless otherwise stated
19
ReportedTransformation
effects
Excluding transformation
effects Comment
Revenues 17,816 - 17,816
Adjusted costs(1) (17,051) (537) (16,514)
Impairment of software and accelerated depreciation of real estate assets, legal fees related to asset disposals, provisions for existing service contracts and quarterly amortization of software related to Equities
Nonoperating costs(2) (1,629) (1,270) (360)Impairment of goodwill and Q3 2019 group-wide Restructuring and severance
Noninterest expenses (18,681) (1,807) (16,874)
Provisions for credit losses (477) - (477)
Profit (loss) before tax (1,341) (1,807) 465
Net income (loss) (3,781) (4,076) 295Includes above effects includingtaxes and valuation adjustments on Deferred Tax Assets
Cost / income ratio 105% 10 ppt 95%
RoTE(3) (10)% (10) ppt (0)%
Tangible book value per share (in €)
24.36 (1.20) 25.57
(1) As detailed on slide 18(2) Includes impairment of goodwill and other intangible assets, net litigation charges, and restructuring and severance(3) RoTE calculated using the monthly average tangible equity through the period. As a result of the transformation charges, the tangible equity used in the reported
numbers is lower than the definition excluding items

James von MoltkeInvestor Deep Dive, 10 December 2019
Overview of Corporate Bank / Private Bank refinementsIn € m
FY 2018 9M 2019
CB IB PB AM C&O CoreBank CRU Group CB IB PB AM C&O Core
Bank CRU Group
Net revenues 5,193 7,467 8,712 2,187 (120) 23,438 1,878 25,316 3,920 5,443 6,311 1,662 95 17,431 385 17,816
Corporate Bank / Private Bank refinements 71 - (71) - - - - - 52 - (52) - - - - -
Net revenues post refinements 5,263 7,467 8,641 2,187 (120) 23,438 1,878 25,316 3,973 5,443 6,259 1,662 95 17,431 385 17,816
Noninterest expenses (3,697) (6,501) (7,742) (1,735) (421) (20,096) (3,365) (23,461) (3,436) (4,813) (6,129) (1,273) (288) (15,940) (2,740) (18,681)
Corporate Bank / Private Bank refinements (148) - 148 - - - - - (112) - 112 - - - - -
Noninterest expenses post refinements (3,846) (6,501) (7,593) (1,735) (421) (20,096) (3,365) (23,461) (3,548) (4,813) (6,018) (1,273) (288) (15,940) (2,740) (18,681)
Adjusted costs (3,619) (6,172) (7,708) (1,657) (311) (19,467) (3,343) (22,810) (2,929) (4,554) (5,639) (1,234) (136) (14,491) (2,560) (17,051)
Corporate Bank / Private Bank refinements (148) - 148 - - - - - (112) - 112 - - - - -
Adjusted costs post refinements (3,767) (6,172) (7,560) (1,657) (311) (19,467) (3,343) (22,810) (3,040) (4,554) (5,528) (1,234) (136) (14,491) (2,560) (17,051)
20

James von MoltkeInvestor Deep Dive, 10 December 2019
Speaker biography
21
James von Moltke has been Chief Financial Officer and Member of the Management Board of Deutsche Bank AG since July 2017.
Prior to joining Deutsche Bank, he was Treasurer of Citigroup. In this capacity he was responsible for capital and funding as well as liquidity and interest rate risk, and played a significant role in Citigroup’s restructuring following the global financial crisis. He worked at Morgan Stanley, where he led the Financial Technology Advisory team, and spent ten years at J.P. Morgan working in New York and Hong Kong.
Born in Heidelberg, he is a dual citizen of Germany and Australia and received a Bachelor of Arts degree from New College, Oxford.

James von MoltkeInvestor Deep Dive, 10 December 2019
CFO organisational structure
22
James von Moltke
Chief Accounting
Officer
Treasury
Planning & Performance
Mgt.
CFO Infrastructure
Group Finance
Group Tax
Infra Transfor-
mation
Investor Relations
CFO Corporate
Bank
CFO Investment
Bank
CFO DWS
CFO Private Bank
Regional / Legal Entity / Geography
Division / BusinessGroup-wide Functions
Business CFOs (solid line into MB members accountable for respective business)
CFO Americas
CFO Regions

James von MoltkeInvestor Deep Dive, 10 December 2019
Cautionary statements
23
Non-IFRS Financial MeasuresThis document contains non-IFRS financial measures. For a reconciliation to directly comparable figures underIFRS, to the extent not provided herein, please refer to the Financial Data Supplement which can bedownloaded from www.db.com/ir.
Forward-Looking StatementsThis document contains forward-looking statements. Forward-looking statements are statements that are nothistorical facts; they include statements about our beliefs and expectations and the assumptions underlyingthem. These statements are based on plans, estimates and projections as they are currently available to themanagement of Deutsche Bank. Forward-looking statements therefore speak only as of the date they aremade, and we undertake no obligation to update publicly any of them in light of new information or futureevents.By their very nature, forward-looking statements involve risks and uncertainties. A number of important factorscould therefore cause actual results to differ materially from those contained in any forward-looking statement.Such factors include the conditions in the financial markets in Germany, in Europe, in the United States andelsewhere from which we derive a substantial portion of our revenues and in which we hold a substantialportion of our assets, the development of asset prices and market volatility, potential defaults of borrowers ortrading counterparties, the implementation of our strategic initiatives, the reliability of our risk managementpolicies, procedures and methods, and other risks referenced in our filings with the U.S. Securities andExchange Commission. Such factors are described in detail in our SEC Form 20-F of 22 March 2019 under theheading “Risk Factors”. Copies of this document are readily available upon request or can be downloaded fromwww.db.com/ir.