investor discussion pack - westpac · pdf file2 investor discussion pack – mar 2004...
TRANSCRIPT

Investor Discussion Pack
25 March 2004

Investor Discussion Pack – Mar 20042
Index
Summary of resultsRecent financial performance 3Loan growth and margins 5Impact of rising AUD/NZD 8Dividends and payout 9
Sources of future growth 10Business lending 11Insurance 12Acquisition guidelines 14
Wealth Management 15Sustainability 19Executive team 20Credit quality and portfolio composition 21
International exposures 25Basel II 28Conversion to international reporting standards 29Structured finance business 30Housing market – portfolio characteristics and key drivers of growth 31Medium term drivers 39Investor Relations contacts 41
Investor Discussion Pack – Mar 20043
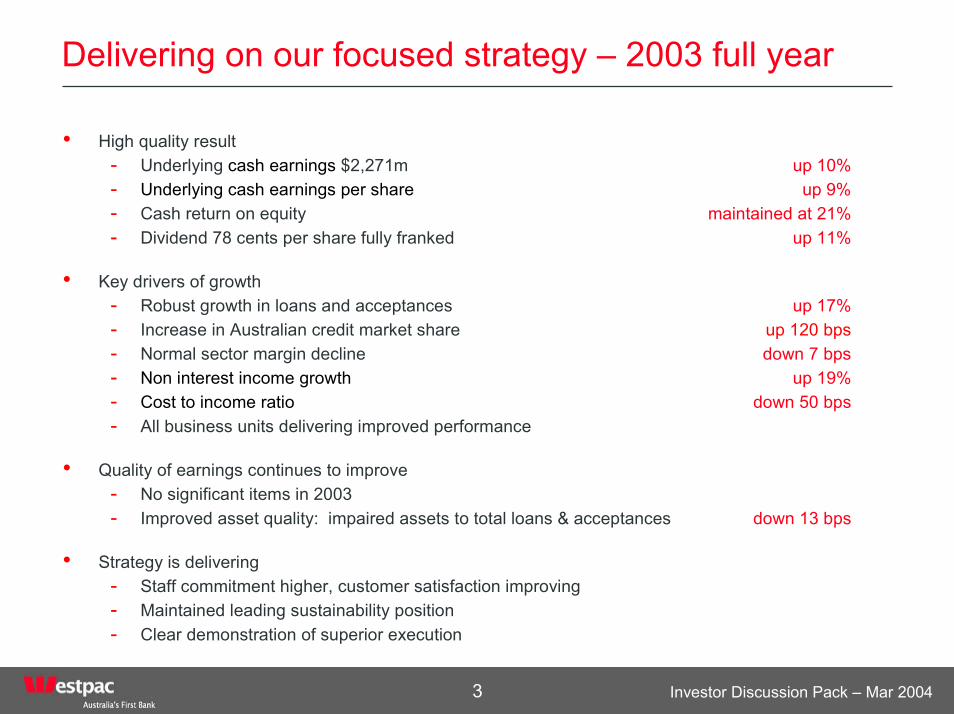
Delivering on our focused strategy – 2003 full year
• High quality result- Underlying cash earnings $2,271m up 10%- Underlying cash earnings per share up 9%- Cash return on equity maintained at 21%- Dividend 78 cents per share fully franked up 11%
• Key drivers of growth- Robust growth in loans and acceptances up 17%- Increase in Australian credit market share up 120 bps- Normal sector margin decline down 7 bps- Non interest income growth up 19% - Cost to income ratio down 50 bps- All business units delivering improved performance
• Quality of earnings continues to improve- No significant items in 2003- Improved asset quality: impaired assets to total loans & acceptances down 13 bps
• Strategy is delivering- Staff commitment higher, customer satisfaction improving- Maintained leading sustainability position- Clear demonstration of superior execution
Investor Discussion Pack – Mar 20044
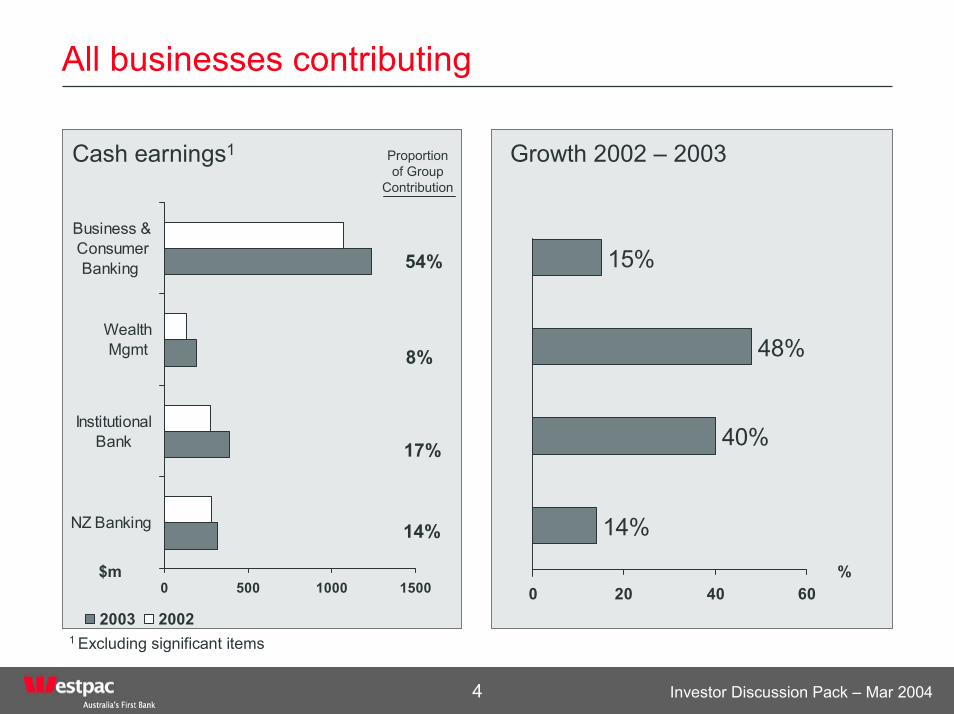
All businesses contributing
15%
48%
14%
40%
0 20 40 600 500 1000 1500
NZ Banking
InstitutionalBank
WealthMgmt
Business &ConsumerBanking
2003 2002
Cash earnings1
$m
Growth 2002 – 2003
1 Excluding significant items
54%
8%
17%
14%
Proportion of Group
Contribution
%
Investor Discussion Pack – Mar 20045
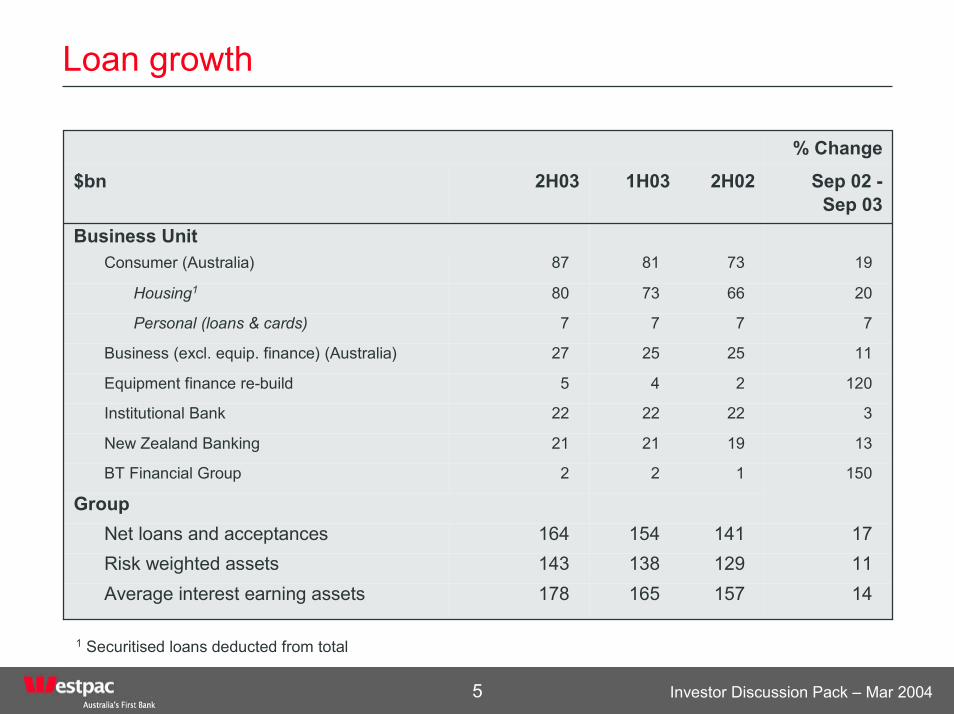
Loan growth
120245Equipment finance re-build
7777Personal (loans & cards)
20667380Housing1
19738187Consumer (Australia)
% Change
141117
150
13
3
11
Sep 02 -Sep 03
122BT Financial Group
Business Unit
252527Business (excl. equip. finance) (Australia)
222222Institutional Bank
192121New Zealand Banking
Group
157129141
2H02
178143164
2H03
165Average interest earning assets138Risk weighted assets154Net loans and acceptances
1H03$bn
1 Securitised loans deducted from total

Investor Discussion Pack – Mar 20046
Margin dynamics
%
2.65
2.80
2.71
2.50
2.60
2.70
2.80
2.90
2002 AGC 2002Adjusted
Productmargindecline
Overseas Hybrids Freefunds
2003
(7) bps4 bps
2 bps (5) bps
(9) bps

Investor Discussion Pack – Mar 20047
Non-interest income analysis
2,518
2,986
(54)(49)
352
204 15
1,000
1,200
1,400
1,600
1,800
2,000
2,200
2,400
2,600
2,800
3,000
2002 AGC P'holderRec.
Ongoing BT/RAAM Hastings 2003
$m
11 month contribution
from BTPick-up in fees and stronger financial markets income
2H03

Investor Discussion Pack – Mar 20048
Impact of rising Australian dollar
• Balance sheet- 18% of exposures1 outside of Australia (15% of which is in New Zealand)
• Capital - Lower NZD/USD risk weighted assets in A$ terms but higher foreign
currency translation reserve (FCTR) deduction from capital
• Profit and loss- Limited impact given modest earnings outside Australia
• Economic- Focus on assisting exporting customers manage currency impact- Resources sector – increased commodity prices offsetting stronger A$
1 Total Committed Exposure (TCE)

Investor Discussion Pack – Mar 20049
Consistent dividend growth
62.3
50
55
60
65
2H99 1H00 2H00 1H01 2H01 1H02 2H02 1H03 2H03
Payout ratio2 (%)
• Dividend growing at or above earnings. In 2003:- Cash EPS up 9%- Dividends up 11%
• Medium term drivers of payout ratio:- Sustainable cash earnings growth- Organic capital requirements
• Franking capacity no longer a constraint – franking balance $612m at Sept 03
2 Based on underlying cash earnings
43 4754
6270
78
39
0102030405060708090
1997 1998 1999 2000 2001 2002 2003
Dividends per share (cents)
Investor Discussion Pack – Mar 200410
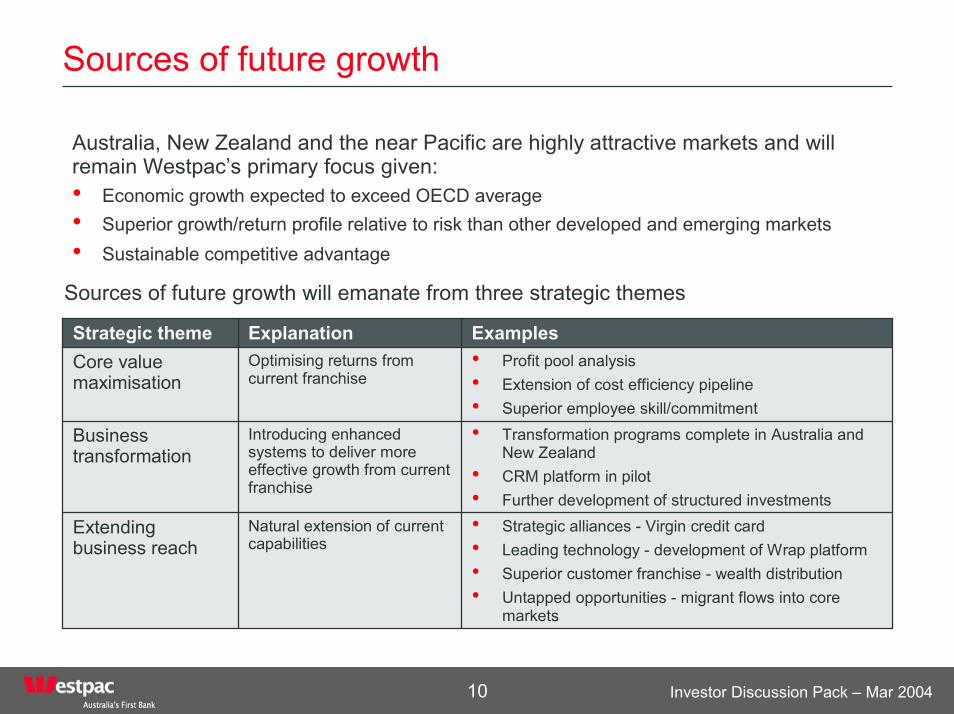
Sources of future growth
Australia, New Zealand and the near Pacific are highly attractive markets and will remain Westpac’s primary focus given:• Economic growth expected to exceed OECD average• Superior growth/return profile relative to risk than other developed and emerging markets• Sustainable competitive advantage
Sources of future growth will emanate from three strategic themes
ExamplesExplanationStrategic theme
Natural extension of current capabilities
Introducing enhanced systems to deliver more effective growth from current franchise
Optimising returns from current franchise
• Strategic alliances - Virgin credit card• Leading technology - development of Wrap platform• Superior customer franchise - wealth distribution• Untapped opportunities - migrant flows into core
markets
Extending business reach
• Transformation programs complete in Australia and New Zealand
• CRM platform in pilot • Further development of structured investments
Business transformation
• Profit pool analysis• Extension of cost efficiency pipeline• Superior employee skill/commitment
Core value maximisation

Investor Discussion Pack – Mar 200411
Growth in business lending
• Business lending increased 11% over the year to September 03, excluding the reacquisition of the business finance portfolio
• Middle market lending has been the predominant source of growth with small and medium enterprises (SME) providing an increasing contribution
• Initiatives boosting growth included:- Industry specialisation - 6 industry packages
now in place and more planned- Rolling out CRM to business bankers- Selective increase in business bankers in
branches- Number 1 in customer satisfaction compared to
peers for past 3 years,
• Growth achieved while improving portfolio quality
• Equipment finance portfolio - Original reacquisition targets met – one year
ahead of schedule- Cash earnings from the re-build of the
equipment finance portfolio in 2003 $49m- Not a contributor to risk weighted asset growth- Remarketing agreement expires May 2004
0.0
1.0
2.0
3.0
4.0
5.0
May-02 Jun-02 Sep-02 Mar-03 Sep-03 Sep-04
Actual re-acquisition of business bookInitial planned rate of re-acquisition
Equipment Finance portfolio (Original balance - $5.1bn)
$bn
40%
45%
50%
55%
60%
65%
70%
75%
Dec-01 Jun-02 Dec-02 Jun-03 Dec-03
SMEMiddle Markets
Business customer satisfaction
Source: TNS Business Finance Monitor

Investor Discussion Pack – Mar 200412
Insurance – growing businesses
26112Total
3214Lenders mortgage insurance (Australia)
3632General insurance (Australia)
2922New Zealand
1644Australia
Life insurance
% growth
2003 cash earnings
$m
• Life insurance contributed $66m in cash earnings in 2003
- Strong growth in risk in-force premiums, up 24%- 18% increase in risk sales from both better
customer cross sell and increased sales from direct channels
- Number 3 life insurer by new flows
• General insurance focused on consumer insurances particularly home and contents insurance. 2003 earnings boosted by:
- Strong housing growth - Improved customer penetration - Good underwriting conditions
• Lenders mortgage insurance is an attractive business given synergies with home lending and low losses on mortgage loans. Strong rise in 2003 earnings due to:
- Increase in housing activity- Higher capital held in captive insurer- Continued low levels of delinquencies

Investor Discussion Pack – Mar 200413
Capital usage of life insurance business
Cumulative cash flow and MoS profit of a life insurance policy
1 3 5 7 9 11 13 15 17 19 21 23
Years
Cash FlowMoS Profit
$0
• BT Financial Group is in a high growth phase and is not generating excess capital
• However the division is self funding as life insurance cash flows can be funded from surplus generated by managed funds
• Cash flow on life insurance is negative in year 1 because of acquisition costs but positive from year 2 onwards.
• Costs of acquiring business include commissions, medicals and origination costs
• Margin on Services (MoS) accounting spreads costs over the life of the product, thereby recording profits from year 1.
• Investment management is generally cash flow positive from year 1 as front end fees cover acquisition costs.
• Cash flow needs of the business requires the retention of capital in the near term.
• In the medium to long term the business is expected to be a net cash generator

Investor Discussion Pack – Mar 200414
Acquisition guidelines
• No particular requirement to acquire customers- Customer franchise enhanced in Australia and New Zealand with three
regional bank acquisitions 1995 – 1998
• Filled major strategic gaps- Wealth management capability enhanced with three acquisitions in
2002
• Subject to acquisition disciplines, some opportunities remain in core markets with not all assets in the hands of their natural owners
• Disciplined approach- Aligned with strategic direction - Strict valuation criteria- Not unduly diverting

Investor Discussion Pack – Mar 200415
Wealth management - BT Financial Group
• Investment consistent with the size of the wealth management opportunity
• Modern wealth management operation
- Funds management- Life insurance and risk- Wrap and corporate
superannuation- Margin lending- Broking
• Only large bank with a major Wrap capability
$190mCash earnings
$251mIn force premiums
$13bnAssets under admin
$43bnFunds under mgt
Sept 2003
Funds Mgt61%
Life Insurance &
Risk35%
Other4%
Composition of cash earnings 2003

Investor Discussion Pack – Mar 200416
BT – our competitive position
7
-7.2122.6Institutional
310.6310.7Broking
7.759.2Retail
N/a9.3214.4Margin lending
310.676.7Life and risk
3*15.1*311.1Wrap and master trust
311.456.0Corporate super
RankMarket share
(%)RankMarket share
(%)Product
Share of new businessCurrent market share
* Impact on market share and rank due to large transfer of administration of AMP Investment Solutions to ASGARD in Dec 2003
Sources: Retail& Wrap & M’trust - ASSIRT February 2004 (as at Dec 2003)
- New Business – September 2003 – ASSIRT Market share report September 2003Corporate super - Dexx&r Employer Super League Table September 2003Life and risk - Dexx&r Life analysis, Quarterly Statistics ending 30 September 2003Margin lending - BT loan book verses RBA industry total – 31 December 2003Broking - ASX market analysis (January) 9 Feb 2004Institutional - Institutional Rainmaker Mandate Analysis 2003 – 04 (does not include externally managed FUM)

Investor Discussion Pack – Mar 200417
BT Integration – nearing completion
• Integration is approximately two thirds complete
• The process aimed to ensure that the core business was insulated from the integration task
• Dedicated project management resource
• Resolved key people, roles and location issues quickly
• Synergies ahead of plan – over 85% of 2004 synergies locked-in
Integration progress
Jul-0
2
Oct
-02
Jan-
03
May
-03
Aug-
03
Nov
-03
Mar
-04
Jun-
04
Sep-
04
Dec
-04
People & Location
Systems
Customer Contact
Investment Management
Registry consolidation & selected back office insourcing
Customer MIS
Complete
In progress

Investor Discussion Pack – Mar 200418
The benefits are now appearing
0
1
2
3
4
5
6
7
8
9
10
11
Mar-98
Dec-98
Sep-99
Jun-0
0Mar-
01Dec-0
1Sep
-02 A
pr -03
Dec-03
Wrap funds under administration$bn
-2.5%
-2.0%
-1.5%
-1.0%
-0.5%
0.0%
0.5%
1.0%
1.5%
May-02
Jul-0
2Sep
-02Nov
-02Ja
n-03
Mar-03
May-03
Jul-0
3Sep
-03Nov
-03Ja
n-03
-8%
-6%
-4%
-2%
0%
2%
4%
6%
Monthly excess return(LHS)
One year excess return (RHS)
Excess investment returns Australian equities

Investor Discussion Pack – Mar 200419
Reputation/sustainability – enhancing returnsSustainability - supporting the value chain
Employees Customers Returns
Number 1 In the global banking sector 2003/04 - for the second year in a row.
GovernanceMetrics International – One of 22 (out of 2,100) companies globally to achieve a top 10.0 score for corporate governance
Australia - Number 1 company overall – only company to receive a AAA rating.
• Improved employee retention
• Enhanced ability to attract quality staff
A company where people want to work
• Ethical and responsible• Trustworthy• Increased customer
satisfaction
An institution customers want to do business with
• Enhanced employee productivity
• Improve customer share of wallet
Enhance sustainability of returns

Investor Discussion Pack – Mar 200420
An experienced executive team
Joined Westpac 1982, Appointed CFO in Feb 2001. Previously Deputy CFO and has held CFO roles in both retail and institutional banking
Feb 2001Chief Financial OfficerPhilip Chronican
BiographyDate joined Group
Executive
TitleName
Mar 2000
Apr 2002
Jan 2002
May 2002
Jul 2000
Nov 2002
Oct 1990
Group Executive New Zealand & Pacific Banking
Group Executive Business and Consumer Banking
Group Executive Business & Technology Solutions & Services
Group Executive Westpac Institutional Bank
Chief Executive Officer BT Financial Group
Group Executive People and Performance
Chief Executive Officer
Joined Westpac in 1994, in current role since October 2002. Ann has headed People and Performance for the Group and was CEO Bank of Melbourne following the Merger in 1997
Ann Sherry
Joined Westpac in April 2002 as Group Executive New Zealand & Pacific Banking. Appointed to current role in August 2002. Extensive experience in retail banking including CEO Australian Financial Services for National Australia Bank and CEO Bank of New Zealand
Mike Pratt
Joined Westpac to current role in January 2002. Michael has 30 years experience in Information Technology covering a broad range of industries
Michael Coomer
Joined Westpac 1996, in current role since 2002. Previously with AIDC, Citicorp Global Asset Management and Citigroup
Philip Coffey
Joined Westpac 2000, and appointed to current role September 2002. Prior to that headed the Australian Business & Consumer Bank. Before joining Westpac was an Executive Director of Lend Lease and CEO of MLC Ltd
David Clarke
Joined Westpac 2000, as Group Secretary and General Counsel. Previously Partner of a Major Law firm, Mallesons Stephen Jaques. In current role since 2002
Ilana Atlas
Joined 1990, CEO since 1999. Headed all major business units in Westpac prior to CEO appointment in March 1999. Extensive prior experience in financial sector including in the IMF and the Australian Federal Treasury
David Morgan

Investor Discussion Pack – Mar 200421
Forward credit indicators in good shape
Housing Portfolio - 90 day delinquencies
1.04
0.64
0.150.150.38
0.150.230.250.26
0.0
0.5
1.0
1.5
1996 1997 1998 1999 2000 2001 2002 2003 1Q2004
%
1.911.28
0.63
1.471.53
0.51 0.58
0.0
0.5
1.0
1.5
2.0
2.5
1998 1999 2000 2001 2002 2003 1Q2004
Business Banking - 90 day delinquencies%
WIB - impaired assets to committed exposure%
0.470.51
0.14
0.530.63
0.290.37
0.25
0.34
0.00.10.20.30.40.50.60.7
1996 1997 1998 1999 2000 2001 2002 2003 1Q2004
1.011.07 1.02
1.98
0.96 1.140.9
0.630.82
0.0
0.5
1.0
1.5
2.0
2.5
1996 1997 1998 1999 2000 2001 2002 2003 1Q2004
Including AGCExcluding AGC
Consumer Unsecured - 90 day delinquencies %

Investor Discussion Pack – Mar 200422
Stressed exposures continue to decline
Categories of stressed exposuresas a % of total commitments1
Specific provisions / impaired assets
20
30
40
50
60
FY98 FY99 FY00 FY01 FY02 FY 03
%
%
General provisions / non-housing performing loans & acceptances
1.0
1.5
2.0
FY98 FY99 FY00 FY01 FY02 FY 03
WBC ANZ CBA NAB
0.0%
0.2%
0.4%
0.6%
0.8%
1.0%
1.2%
1.4%
1.6%
1.8%
Sep 99 Sep 00 Sep 01 Sep 02 Sep 03 Dec-03
AGC stressed loans
Watchlist & substandard
90 days past due w ellsecuredImpaired
1 Methodology for the calculation of total commitments changed from 30/09/2003. For comparative purposes prior periods have been re-based.

Investor Discussion Pack – Mar 200423
Bad debt analysis
1.7%1,394(271)(95)
(176)27
(70)(133)2H03
(271)(190)(214)Net bad debt expense1,3011,1621,309General provision
493547Recoveries of debts previously W/O
1.8%1.7%1.7%General provision to non-housing loans & acceptances
(10)161(136)Increase in general provision(261)(206)(78)Bad debt charge-off
(208)(171)(142)Write-offs(102)(70)17Net transfer to/from specific provisions
1H022H021H03$m
1. Adjusted ($133m) for provisions transferred on sale of AGC
43
148
16 16 17
3239
26 2934
0
10
20
30
40
50
1995 1996 1997 1998 1999 2000 2001 1H02 2H02 1H03 2H03
bp Long run expectation 25-35 basis points
Total bad & doubtful debt charge (annualised) to average loans and acceptances

Investor Discussion Pack – Mar 200424
Composition of portfolio
• Mortgages represent 42% of total commitments and 51% of funded lending
• 64% business / corporate portfolio exceeding investment grade
• Other consumer includes credit cards, personal lending and margin lending
57% 55% 54% 51% 49%
34% 36% 38% 40% 42%
9%9%8%9%9%
0%
20%
40%
60%
80%
100%
Sep-01 Mar-02 Sep-02 Mar-03 Sep-03Business/Institutional Consumer Mortgages Other Consumer
Portfolio by customer segment 1
Personal Loans
CardsMargin Lending
Other consumer6%
Mortgages51%
Business / Institutional
43%
On balance sheet lending
17% 17% 18% 14% 13%
11% 8% 8% 7%
12% 12% 11%12% 12%
16% 17% 15% 16% 16%
9%
0.9%0.9%0.9%1.2%1.3%
-10%
10%
30%
50%
70%
Sep-01 Mar-02 Sep-02 Mar-03 Sep-03
AAA to AA- A+ to A- BBB+ to BBB- BB+ to B+ <B+
Corporate/Business portfolio 1
1. % of Total Exposure - 30 September 2003

Investor Discussion Pack – Mar 200425
Total exposure by region1
• Exposures outside core markets represent less than 5% of total committed exposures – sub investment grade represent less than 0.5% of total exposures
19,87000002,86517,005Unsecured consumer
266,1911851754,3593,27840,610217,584
115,279000016,47398,806Secured consumer
2,2840262392215551,244<B+
44,2674527456456,80236,893BB+ to B+
32,1810312,0428555,69523,560BBB+ to BBB-
18,160001,1781,6431,98913,350A+ to A-34,150140914455156,23226,727AAA to AA-
GroupJapanAsia ex JapanEuropeAmericasNZ /
PacificAustralia$m
2
2
1. Total committed exposures by booking office at 30 September 20032. Changes in the calculation of total committed exposures has seen an increase in reported consumer commitments. Actual
drawn amounts for secured consumer in Australia $83,157 and in NZ/Pacific $14,018. Drawn amounts for unsecured consumer in Australia $6,908 and in NZ/Pacific $948

Investor Discussion Pack – Mar 200426
Reduced single name exposures
0 200 400 600 800 1,000
A-
BBB
BBB
A
AA-
A+
BBB+
AAA
A-
BBB+
Top 10 exposures to corporations and NBFIs – Sept 03
S&P Rating or equivalent$m
0.0%
0.5%
1.0%
1.5%
2.0%
2.5%
3.0%
3.5%
2000 2001 2002 2003
Top 10 exposures as a % of total committed exposure – Sept 03
Total exposure of Top 10 = $5.6bn -
Sep 2003

Investor Discussion Pack – Mar 200427
Industry concentrations
% Total Group Committed Exposure1 – Sept 03
0 1 2 3 4 5 6 7
WOOD & PAPER PRODUCTS
COMMUNICATIONS
OIL, GAS & COAL EXPL/PROD/REFINING
INSURANCE
MINING
MEDICAL SERVICES
MANUFACTURING: CHEMICALS
HOSPITALITY
MANUFACTURING: MACHINERY & EQUIPMENT
TRANSPORTATION
BUSINESS PRODUCTS WHOLESALE
CONSUMER SERVICES
MANUFACTURING: FOOD & BEVERAGE
MANUFACTURING NEC
CONSTRUCTION & CONSTRUCTION MATERIALS
AGRICULTURE
UTILITIES
BUSINESS SERVICES
CONSUMER RETAIL/WHOLESALE
FINANCE
PROPERTY
1. Excludes banks and governments

Investor Discussion Pack – Mar 200428
Basel II highlights the low risk of the balance sheet
Proportion of assets across classes
0%
10%
20%
30%
40%
Corporate Mortgage OtherRetail
SME OtherExposure
Group 1 banksWestpac
• Westpac has more of its balance sheet in assets with a higher average reduction in risk weight than the average Group 1 banks
• Across asset classes, Westpac has a lower average risk weight (except for other retail) than Group 1 banks leading to a larger reduction in risk assets
Change in RWA under Advanced IRB
-80%
-60%
-40%
-20%
0%
20%
Corporate Mortgage OtherRetail
SME OtherExposure
Group 1 banks
Westpac
Group 1 banks are large, diversified and internationally active with Tier 1 capital in excess of Euro 3bn

Investor Discussion Pack – Mar 200429
Conversion to international reporting standards
L
M
H
L
M
M
H
H
Financial impact
M
L
L
M
H
H
M
H
Business impact
Interest calculations
Provisions for doubtful debts
Business combinations
Special purpose vehicles (SPVs)
Superannuation
Debt vs equity
Life insurance
Hedge Accounting
Key areas of impact • All Australian companies required to move to new IFRS standards on, or after, 1 January 2005
• Westpac has moved to some standards early eg: IAS 19 (accounting for superannuation/pension)
• Project team in place since early 2003
• To reduce impact of IFRS 39 on our business a compliance framework has been established for all existing and new transactions maturing after October 2005.
• Working with customers to help minimise the impact on their businesses
H = High M = Medium L = Low

Investor Discussion Pack – Mar 200430
Structured finance business
• Westpac conducts certain structured finance transactions to meet the needs of customers operating in our core markets.
• Key characteristics of the portfolio:- Total portfolio size approx $8bn- Most transactions booked for 5 years with unilateral
rights to break afforded to each party. - Early termination can be triggered with short notice
(usually 5-30 days) - Strong Australasian focus with 75% of exposures
domiciled in Australia or New Zealand- High credit quality with 80% of exposures rated AA or
above• Balanced spread of deal type across jurisdictions including:
- Film financing- Infrastructure bonds- Offshore carry forward losses- Exempt income
• Tax rulings and/or strong legal opinions on transactions sought to control tax, legal and regulatory issues
• The New Zealand Inland Revenue Department is conducting an industry wide audit and review of structured finance transactions. Westpac’s NZ bank is currently under review but is confident the appropriate tax treatment has been applied and that the review will not have a materially adverse outcome
43%
9%
48%AustraliaUSNew Zealand
Structured finance, portfolio by geography, Sept 03
9%
44%
31%
4% 6% 5%1%
0%
10%
20%
30%
40%
50%
AAA AA+ AA AA- A+ A A-
Structured finance portfolio exposure by rating, Sept 03

Investor Discussion Pack – Mar 200431
Housing market – state of play
• Housing prices have risen 76% over last 5 years
• Credit growth similarly strong, averaging 16% over last 5 years
• Recent growth driven by:
- Second and subsequent home buyers
- Spending on existing dwellings
Real house prices indexed
50
100
150
200
250
300
1959/60 1969/70 1979/80 1989/90 1999/00
index
50
100
150
200
250
300index
Housing finance
05
10152025303540
Aug-92 Aug-96 Aug-00 Aug-92 Aug-96 Aug-00
no. '000
0510152025303540
no. '000
* owner occupiers
first home buyers
second home buyers established ex-refinancing
new dwellings

Investor Discussion Pack – Mar 200432
Drivers of housing credit growth
• Housing credit growth will, on average, continue to grow ahead of nominal GDP, supported by:
- Continuing positive population growth
- Decrease in average household size
- A higher proportion of earnings is devoted to dwelling investment as standards of living increase
• Growth expected to ease in year ahead
0.00.20.40.60.81.01.21.41.6
1990/91 1992/93 1994/95 1996/97 1998/99 2000/01
%
2.5
2.6
2.6
2.7
2.7
2.8
2.8
2.9People
Population growth (lhs)
Persons per dwelling, avg (rhs)
Drivers of household formation
0
4
8
12
16
20
24
28
Dec-80
Dec-84
Dec-88
Dec-92
Dec-96
Dec-00
Dec-04
Market estimates
Long term average 14%
Housing credit growth%
Source: APRA

Investor Discussion Pack – Mar 200433
Housing market – affordability and debt servicing
• Housing has become less affordable as house prices have risen
• Average repayment burden up 15% on March 2002 but still at acceptable levels
• Debt servicing for investors has risen more sharply than for owner occupiers
0
3
6
9
12
Dec-80 Dec-83 Dec-86 Dec-89 Dec-92 Dec-95 Dec-98 Dec-010
3
6
9
12
%
principal plus interestinterestprincipal
Household debt servicing ratioPayments/household income%
0
10
20
30
40
50
60
1978/79 1984/85 1990/91 1996/97 2002/03
%
0
4
8
12
16
20%
investors - interest only (lhs)owner occupiers - interest + principal (rhs)
Debt servicing ratios

Investor Discussion Pack – Mar 200434
Mortgage portfolio characteristics
• Market share of housing eased marginally on strong volumes- Owner occupied up 10%- Investment up 22%
• Funding for alterations and additions has resulted in equity access loans growing 82% from a low base
• Average LVR of new loans 63% -up from 61% in 1999
• Average LVR for mortgage insured loans 88%
• 77% of loans from customers with an existing active relationship
$37 $40 $41 $43 $45
$19$21 $23 $25 $28
$10$7
$5$4
$3
0
10
20
30
40
50
60
70
80
90
2H01 1H02 2H02 1H03 2H03
A$bn
Equity access (% of portfolio = 12%)Investment housing (% of portfolio = 34%)Owner occupied (% of portfolio = 54%)
Australian Mortgage Portfolio

Investor Discussion Pack – Mar 200435
Mortgages - broker introduced loans
• 23% of outstanding mortgage portfolio is broker originated
• Brokers introduced 31% of new loans in 2003
• Average size of loan is up to 15% higher than branch originated loan
• Same underwriting standards applied to all applications, and more rigorous validation process
• Broker introduced loans have lower churn and longer average life than bank originated loans
3234 33 34 34 35
36
32 3130
31 31 32 3331
0
5
10
15
20
25
30
35
Jun-
02Se
p-02
Nov-
02
Jan-
03 M
ar-0
3M
ay-0
3
Jul-0
3Se
p-03
%
Broker introduced loans(Proportion of total by value)
Investor Discussion Pack – Mar 200436
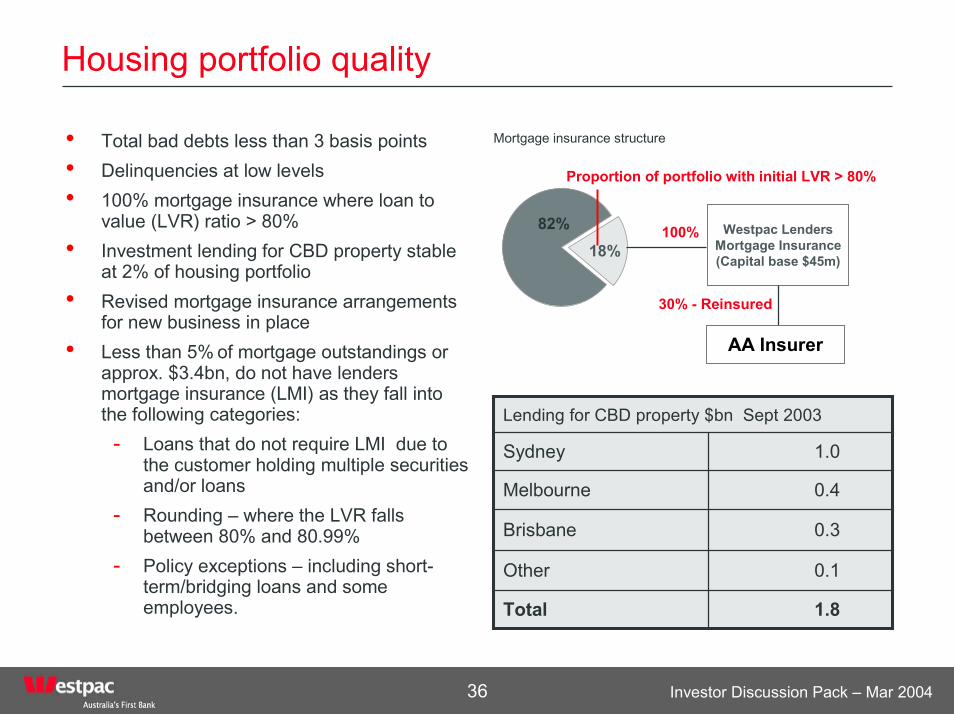
Housing portfolio quality
• Total bad debts less than 3 basis points• Delinquencies at low levels• 100% mortgage insurance where loan to
value (LVR) ratio > 80%• Investment lending for CBD property stable
at 2% of housing portfolio• Revised mortgage insurance arrangements
for new business in place• Less than 5% of mortgage outstandings or
approx. $3.4bn, do not have lenders mortgage insurance (LMI) as they fall into the following categories:
- Loans that do not require LMI due to the customer holding multiple securities and/or loans
- Rounding – where the LVR falls between 80% and 80.99%
- Policy exceptions – including short-term/bridging loans and some employees.
Mortgage insurance structure
18%82%
Proportion of portfolio with initial LVR > 80%
Westpac Lenders Mortgage Insurance (Capital base $45m)
100%
30% - Reinsured
AA Insurer
0.1Other
1.8Total
0.3Brisbane
0.4Melbourne
1.0Sydney
Lending for CBD property $bn Sept 2003

Investor Discussion Pack – Mar 200437
Housing portfolio quality
• APRA stress testing confirmed overall industry strength• Westpac’s updated stress testing provides further validation• Increase in maximum losses previously estimated (10 basis points at March
2003) due to a lower base in key model variables - interest rates and unemployment rate
• Capacity to absorb interest rate rises strong with 73% of amortising borrowers repaying in excess of required minimum
Scenario BScenario ABase case
113.014.3
19.12.4
0.00.0
Combined effect $mCombined effect - bps
8.13.9
7.11.4
6.10.0
Unemployment rate - % Individual effect $m
2025.5
107.5
00.0
Housing prices fall - % Individual effect $m
10.67.1
8.62.8
6.60.0
Interest rates - % paIndividual effect $m
Westpac 2003 stress testing results

Investor Discussion Pack – Mar 200438
Earnings guidance
• Medium term earnings drivers, revised at July 2003 market update are unchanged
• No additional earnings guidance or EPS forecast to be provided for 2004 or beyond
• Westpac believes it is generally unwise to focus management on narrow range of outcomes in the short term
• The regulatory environment does not support specific guidance: - UK - LSE listing rules - US – Reg G and prospectus liability
• 2003 guidance was issued to maintain an informed market given the uncertainty generated by:- Acquisition of BT and RAAM and the sale of AGC- Significant items and accounting changes

Investor Discussion Pack – Mar 200439
Medium term drivers – not 2004 earnings guidance
25-35 bpsBad debts
6-10Post-tax cash earnings23-25Tax rate1
2-4Expenses5-8Operating revenue5-9Non-interest income5-8Interest income
Likely Ranges (%)
As set out in July 2003 - Assuming stable macro-economic environment, medium term drivers of earnings would lead to following outcomes in most scenarios
Surplus capital generation can leverage cash earnings up by 1% – 3% in cash EPS terms 1. Updated for removal of interest gross-up
Investor Discussion Pack – Mar 200440
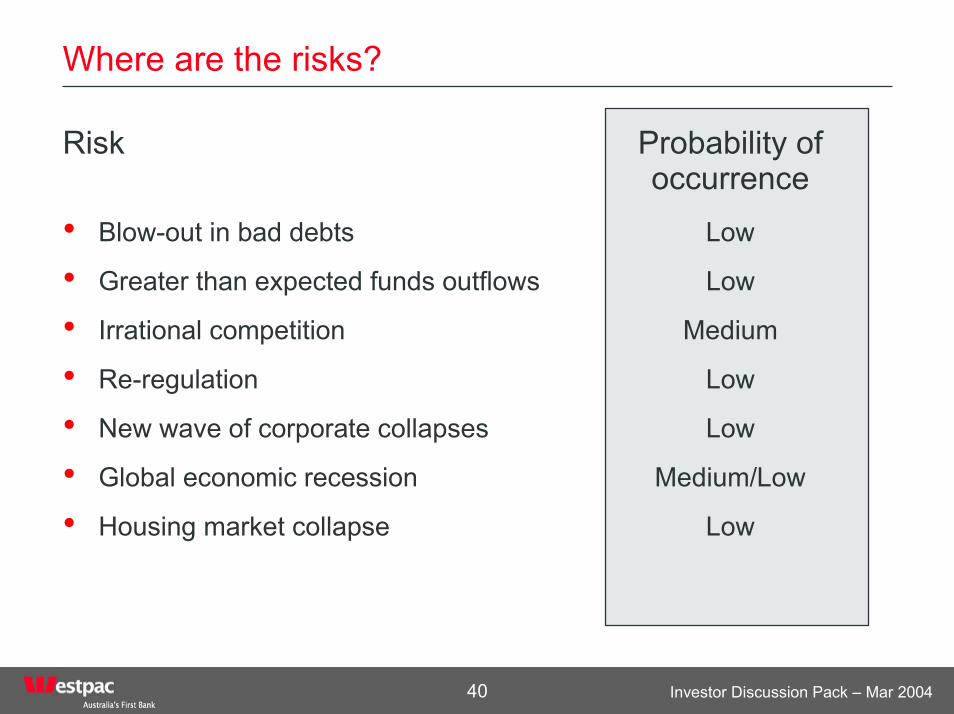
Where are the risks?
Risk Probability of occurrence
• Blow-out in bad debts Low
• Greater than expected funds outflows Low
• Irrational competition Medium
• Re-regulation Low
• New wave of corporate collapses Low
• Global economic recession Medium/Low
• Housing market collapse Low

Investor Discussion Pack – Mar 200441
Investor relations contacts
Westpac’s Investor Relations Team
Andrew Bowden 61 2 9226 [email protected]
Hugh Devine 61 2 9226 [email protected]
Suzanne Evans 61 2 9226 [email protected]
AddressLevel 2560 Martin PlaceSydney NSW 2000AustraliaFax 61 2 9226 1539
For further information on Westpac including:
• Annual reports• Financial result announcements• Presentations and webcasts• Corporate history• Key policies
Please visit our dedicated investor website
www.westpac.com.au/investorcentre

Disclaimer
The material contained in this presentation is intended to be general background information on Westpac Banking Corporation and its activities.
The information is supplied in summary form and is therefore not necessarily complete. Also, it is not intended that it be relied upon as advice to investors or potential investors, who should consider seeking independent professional advice depending upon their specific investment objectives, financial situation or particular needs.