investor presentationibtplc.com/wp-content/uploads/2016/07/international-biotechnology... ·...
TRANSCRIPT

Investor
PresentationThis document has been issued in the UK by SV Health Managers LLP
(authorised and regulated by the Financial Conduct Authority), and may
only be distributed to persons falling within the definition of authorised
persons, investment professionals or high net worth bodies as defined
in the Financial Services & Markets Act 2000.
2017

2
This document is issued for information purposes only by SV Health Managers LLP who is authorised and regulated by the Financial Conduct
Authority (“FCA”). It does not constitute an offer by SV Health Managers LLP to enter into any contract/agreement nor is it a solicitation to buy,
sell, hold or subscribe for any investment. Nothing in this document should be deemed to constitute the provision of financial, investment or
other professional advice in any way. The contents of this document are based upon sources of information believed to be reliable, however,
save to the extent required by applicable law or regulations, no guarantee, warranty or representation (express of implied) is given as to its
accuracy or completeness and SV Health Managers LLP , its members, officers and employees of the managing member do not accept any
liability or responsibility in respect of the information or any views expressed herein. Holdings are subject to change and should not be
construed as research or investment advice. Similarly, any reference to a specific company does not constitute a recommendation to buy, sell,
hold or subscribe in any company or its securities.
Prospective investors should inform themselves as to any applicable legal requirements, taxation and exchange control regulations in the
countries of their citizenship, residence or domicile which might be relevant. Past performance is not indicative of future results, which may vary.
The value of investments and the income derived from investments can go down as well as up. Future returns are not guaranteed, and a loss of
principal may occur.
All views expressed in this document are current as of the date of this presentation and may be subject to change. No part of this material may,
without SV Health Managers prior written consent, be (i) copied, photocopied or duplicated in any form, by any means, or (ii) distributed to any
person that is not an employee, officer, director, or authorised agent of the recipient.
Copyright © 2017, SV Health Managers LLP . All rights reserved.
Disclaimer

3
Agenda
Introduction and management team
Biotech sector
International Biotechnology Trust

4
Introduction
Award winning
closed end
fund
Biotechnology
Sector focused
Yield and capital
growth
Adding value through active
management
Managed by
specialist experts
Diversified
portfolio
Investment and Wealth
Management Awards 2015
Cumulative Return Return Return Return
31 August 2017 1 YR 2YR 3YR
IBT Cum NAV (GBP) (adjusted for dividend) 20.9% 75.7% 199.1%
NASDAQ Biotechnology Index (GBP) 21.7% 57.0% 208.3%
Source: Bloomberg and SV Health Managers LLP
NAV=GBP252M, 31 August 2017
Geography
Market Cap

5
Management Team
Ailsa Craig
Investment Manager
BSc
10 years healthcare investing,
3 years analyst
Previously, at Baring Asset
Management as a research analyst,
and Insight Investment / Rothschild
Asset Management (merged 2003)
within the Global/US investment
team
Dr Carl Harald Janson
Lead Investment Manager
CEFA, PhD, Medical Doctor
13 years healthcare investing,
7 years pharmaceuticals industry
experience
Prior Carnegie Asset Management,
Danske, H&Q, KD, Astra
Five year performance record at
Carnegie Asset Management;
Carnegie Biotechnology Fund +115%,
NBI +1%. Bloomberg rated it as the
top performing fund out of 40 peers
worldwide, for the 6 years and
3 months that Carl Harald Janson was Principal Fund Manager
Kate Bingham
Investment Manager
MBA
25 years healthcare investing
Kate has a first class degree in
Biochemistry from Oxford University
and graduated from Harvard
Business School with an MBA (Baker
Scholar)
Previously Kate worked in business
development for Vertex
Pharmaceuticals, a biotechnology
company in Cambridge, MA and at
Monitor Company, a strategy
consulting firm

6
SV Health Investors
One of the world’s leading dedicated life sciences investors
Founded 1993
100% focused
on healthcare
USD 2.4bn raised in seven venture funds
External recognition, through winning the
Dementia Discovery Fund in a highly competitive
process
55 staff worldwide
USD 2.4bn raised in seven SV venture funds
GBP 145m raised by Dementia Discovery Fund
Based in SV’s busy London office, International Biotechnology
Trust is a significant part of SV, which has advised or managed it
since 2001
Global reach
- Boston, San Francisco and London Offices
Over 70 live venture investments in
Healthcare, Biotechnology and Medical Devices
11PhD’s, 7MD’s, 13MBA’s
- Oncology, Molecular biology, Neuroscience,
Neuropharmacology, Physiology, Biochemistry, Chemistry
External recognition, through winning the Dementia Discovery Fund in a highly competitive process

7
Agenda
Introduction and management team
Biotech sector
International Biotechnology Trust

8
Biotech is a high growth sector
Source: Bloomberg
13.08% y/y
NASDAQ Biotech
Index (NBI)
6.33% y/y MSCI
World Equity Index
(MXWO)
NASDAQ biotech index has consistently outperformed the world equity and healthcare indices
8.38% y/y MSCI
World Healthcare
Index (MXWO0HC)
Biotech return 13% yoy over
the last 20 years
2017

9
Demand is growing
and so is innovation
Increasingly elderly population
%
Source: US Census Bureau – Worldwide population
0
10
20
30
40
50
60
70
80
90
100
2008 2040
>65 years <65 years
7%
Disclosed Worldwide Active R&D Projects in Development by Stage
Source: Pharmaceutical Research and Manufacturers of America (PhRMA),
Pharmaprojects, Bank of America Merrill Lynch Global Research
Phase 2
More drugs in development
Phase 3
*N.B. Most large pharmaceutical companies do not
disclose all their phase 1 programs due to “lack of
materiality”.2100
1800
1500
1200
900
600
300
20
02
20
04
20
06
20
08
20
10
20
12
20
14
20
16
Phase 1
14%
10
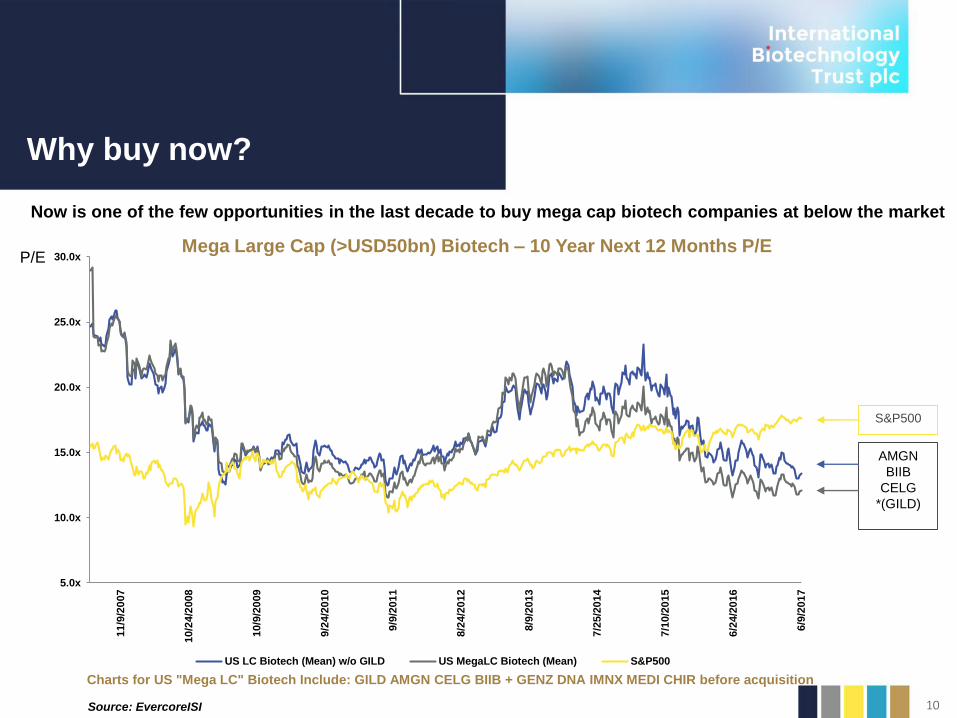
Charts for US "Mega LC" Biotech Include: GILD AMGN CELG BIIB + GENZ DNA IMNX MEDI CHIR before acquisition
Source: EvercoreISI
P/E
Why buy now?
Mega Large Cap (>USD50bn) Biotech – 10 Year Next 12 Months P/E
Now is one of the few opportunities in the last decade to buy mega cap biotech companies at below the market
AMGN
BIIB
CELG
*(GILD)
S&P500
5.0x
10.0x
15.0x
20.0x
25.0x
30.0x
6/9
/201
7
6/2
4/2
016
7/1
0/2
015
7/2
5/2
014
8/9
/201
3
8/2
4/2
012
9/9
/201
1
9/2
4/2
010
10/9
/20
09
10/2
4/2
008
11/9
/20
07
US LC Biotech (Mean) w/o GILD US MegaLC Biotech (Mean) S&P500

11
M&A a constant theme
Over the past three years, 13 companies in International Biotechnology Trust’s portfolio have been acquired
(five in 2016/2017)
0
50
100
150
200
250
300
350
400
450
500
2006 2007 2008 2009 2010 2011 2012 2013 2014 2015
Average 320
events/year
Announced M
&A
tra
nsactio
ns
Source: ‘Life Sciences Dealmaking 2015’ Thomson Reuters
Volume of announced life sciences industry-wide M&A events by year
30 – 60%
premium
Premiums for listed U.S and European Biopharma Companies
42%
49% 49%
61%
50%
43%
69%
53%
33%
55%
36%
0%
10%
20%
30%
40%
50%
60%
70%
80%
2005 2006 2007 2008 2009 2010 2011 2012 2013 2014
Avera
ge P
rem
ium
s P
aid
*
Source: HBM Pharma/Biotech M&A Report 2016
*US Deals, no data for European
2015
Big pharma and big biotech have accrued significant cash reserves which they may deploy

12
Drug pricing
11% of Federal healthcare spending is on therapeutic drugs
Source: Avalere Health, Piper Jaffray, Organisation for Economic Co-operation and Development
Hospitals 42%
Physicians 19%
Brand Drugs 9%
Generic drugs 2%
Nursing homes 7%
Home health 6%
Professionals 2%
Durable Medicals Equipment 1% Other 11%
Estimated Distribution of U.S. Federal Spending on Healthcare 2015-2024
Political debate on drug pricing is ebbing away
Republicans appear to be ‘industry friendly’
Major changes are not expected
• Innovation drugs will continue to command premium prices
• Price increases on marketed drugs will be capped
• Generic drug pricing will remain under pressure

13
Agenda
Introduction and management team
Biotech sector
International Biotechnology Trust

14
Performance – 1, 3, 5 years
*
Cumulative Return to 31 August 2017 12m (%) 3yr (%) 5yr (%)
International Biotechnology Trust Share Price Total Return (GBP) 30.5 106.5 217.6
International Biotechnology Trust NAV (adjusted for dividends) (GBP) 20.9 75.7 199.1
Quoted* 31.2 81.6 242.7
NASDAQ Biotechnology Index (GBP) 21.7 57.0 208.3
S&P 500 (GBP) 18.5 69.0 140.4
FTSE All-Share (GBP) 14.4 24.8 63.7
FTSE 100 (GBP) 14.0 22.3 57.0
Source: Bloomberg and SV Health Managers LLP
*excludes fees
International Biotechnology Trust has outperformed vs its benchmark in rising and falling markets
Lead fund manager (Carl Harald Janson) started in September 2013
*See table on page 8 of the annual report for definition of “unquoted” portfolio. This part of the portfolio was 10.8% of NAV at the period end.
The remainder of the portfolio (89.2% of NAV) is the “quoted” portfolio.

15
Results
12 months to 31 August 2017
International Biotechnology Trust returns
• Share price returned 30.5%, NAV/share returned 20.9% versus 21.7% NASDAQ Biotech Index (GBP)
• Discount narrowed from 13.5% to 7.3%, using cum NAV
• Quoted* return of 31.2% & unquoted* return of (25.7)%
Contributors
• Positive contributors: Exelixis GBP 7.1M, Vertex GBP 6.6M, Ariad GBP 6.5M, Incyte GBP 5.9M,
and Tesaro GBP 5.5M
• Negative contributors: Shire GBP (2.0)M, Reshape Medical GBP (1.5)M, EBR Systems GBP (1.3)M,
OncoEthix GBP (1.2M), and Kalvista GBP (1.2)M
Other
• Currency – positive impact of GBP 5.4M
• Turnover 199% annualised
• Gearing at the beginning of the period (31 August 2016) was -6%, end of period (31 August 2017) was -2%,
range over period (-7% to 5%)
*See table on page 8 of the annual report for definition of “unquoted” portfolio. This part of the portfolio was 10.8% of NAV at the period end.
The remainder of the portfolio (89.2% of NAV) is the “quoted” portfolio.

16
Dividend up 17.4% y-o-y*
0.00
1.00
2.00
3.00
4.00
5.00
6.00
7.00
8.00
1997 2000 2003 2006 2009 2012 2015
UK Base Rate in last 20 years
Source: Bank of England ‘Statistical Interactive
Database - official Bank Rate history’
Source: SV Health Managers LLP
%
– Response to current low yield environment
– In 2016, a dividend of 4% of NAV introduced
– Met out of capital reserves, without affecting investment strategy
– Proposed dividend represents a rise of 17.4% above previous
year
Year ended Aug 16 Proposed for Year ended Aug 17
First Interim
Dividend
Second Interim
Dividend
First Interim
Dividend
Second Interim
Dividend
Amount 11.5p 11.5p 13.5p* (+17.4%) 13.5p*
Declared 13 Dec 16 12 Jul 17 At AGM*
Ex-Div Date 07 Jan 17 04 Aug 17 05 Jan 18*
Payment date 31 Jan 17 31 Aug 17 31 Jan 18* 31 Aug 18*
* Subject to Shareholder Approval at AGM in Dec 17
Source: SV Health Managers LLP

17
Profitable 51%
Revenue 23%
Development Stage 26%
Source: SV Health Managers LLP
Geography
Portfolio breakdown
Stage
US & Canada 85%
Europe & UK 15%
>USD30BN 40%
USD5-30BN 20%
USD1-5 BN 18%
USD500M-1BN 8%
<USD500M 14%
Market cap
31 August 2017, NAV GBP 252M
Therapeutic areas
Oncology 33%
Rare Diseases 14%
Neurology/Psychiatry 12%
Infectious Diseases 11%
Ophthalmology 8%
Inflammation 7%
Metabolic Disorders 5%
Medtech 2%
Other 8%
18
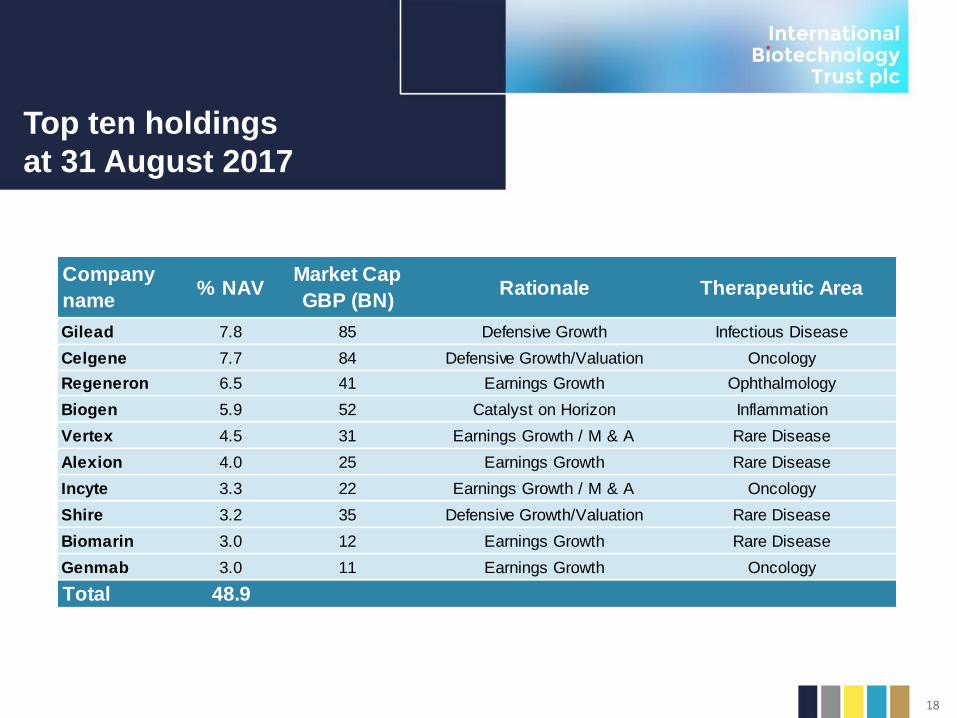
Top ten holdings
at 31 August 2017
Company
name% NAV
Market Cap
GBP (BN) Rationale Therapeutic Area
Gilead 7.8 85 Defensive Growth Infectious Disease
Celgene 7.7 84 Defensive Growth/Valuation Oncology
Regeneron 6.5 41 Earnings Growth Ophthalmology
Biogen 5.9 52 Catalyst on Horizon Inflammation
Vertex 4.5 31 Earnings Growth / M & A Rare Disease
Alexion 4.0 25 Earnings Growth Rare Disease
Incyte 3.3 22 Earnings Growth / M & A Oncology
Shire 3.2 35 Defensive Growth/Valuation Rare Disease
Biomarin 3.0 12 Earnings Growth Rare Disease
Genmab 3.0 11 Earnings Growth Oncology
Total 48.9

19
Buybacks
Source: Bloomberg
NAV/Share
Share price
Discount
Buybacks
Dividend announced

20
Cash/Gearing
Investment process
Investment
Process
Risk Mitigation News Flow
Management
DCF Valuation M&ASell Discipline
Medical/Investment
Conferences
Actively managing investments in shares
with high risk news events
VIX

21
Awards
2015 UK Tech Awards ‘Best Tech Fund Manager’
2015 Investor Chronicle Financial Times ‘Best Specialist Fund’
2016 Most Significant Contribution Kate Bingham
Investment and
Wealth Management
Awards 2015
2017 BIA Lifetime Achievement Award Kate Bingham
2017 Citywire Investment Trust Awards ‘Best Specialist Equities’

22
Summary
Biotech sector has strong fundamentals but is currently undervalued
Top performing trust in sector, outperforming in rising and falling markets
Access to full spectrum of quoted and unquoted biotech companies
Exposure to both growth and yield
Unique approach to risk mitigation
Support and expertise from leading industry players at SV Health Investors