investor non-deal roadshowivl.listedcompany.com/misc/presentation/20180823-presentation.pdfthis...
TRANSCRIPT
Investor Non-Deal Roadshow Organized by DBSV
Hong Kong
August 23-24, 2018
2
This presentation contains “forward-looking” statements of Indorama Ventures Public Company Limited (the “Company”) that relate to future events, which are, by their nature, subject to significant risks and uncertainties. All statements, other than statements of historical fact contained herein, including, without limitation, those regarding the future financial position and results of operations, strategy, plans, objectives, goals and targets, future developments in the markets where the Company participates or is seeking to participate and any statements preceded by, followed by or that include the words “target”, “believe”, “expect”, “aim”, “intend”, “will”, “may”, “anticipate”, “would”, “plan”, “could”, “should, “predict”, “project”, “estimate”, “foresee”, “forecast”, “seek” or similar words or expressions are forward-looking statements. Such forward-looking statements involve known and unknown risks, uncertainties and other important factors beyond the Company’s control that could cause the actual results, performance or achievements of the Company to be materially different from the future results, performance or achievements expressed or implied by such forward-looking statements. These forward-looking statements are based on numerous assumptions regarding the Company’s present and future business strategies and the environment in which the Company will operate in the future and are not a guarantee of future performance. Such forward-looking statements speak only as at the date of this presentation, and the Company does not undertake any duty or obligation to supplement, amend, update or revise any such statements. The Company does not make any representation, warranty or prediction that the results anticipated by such forward-looking statements will be achieved.
Disclaimer

3
Investment Highlights

4
0.30 0.35 0.76
1.06
1.79
2.91
3.86 461 478 568
640
775
1,004
1,262
0
500
1,000
1,500
2012 2013 2014 2015 2016 2017 2Q18LTM0.0
1.0
2.0
3.0
4.0
5.0
EPS (THB) EBITDA ($m)
Why Invest in IVL?
$m THB • Growth driven by
consumer-led industrial demand
• Global industry leadership
• Balanced portfolio between volume and value
• Well-defined roadmap for
selective and accretive growth
• Proven track record of delivering high TSR

5
Leveraging Improved Performance and Earnings Growth Opportunities
+44% Core LTM 2Q18 EBITDA growth
driven by structural shifts in our industry
$923m Operating Cash
Flow strengthening
balance sheet to
fund growth plans
Solid 1H 2018
Performance Strong industry fundamentals
enhanced visibility of
earnings
Strong projects and
M&A pipeline to
continue to add sustainable
earnings growth

6
IVL In A Nutshell
Diversified Portfolio Revenue
$9.3B 43% West Necessities
20% Asia Necessities
37% HVA
Diversified Geography
Revenue $9.3B
34% EMEA
29% Asia
37% Americas
11 R&D Centers
>90% Domestic Sales
15,400 Employees
A global Presence in
29 countries 85
Operating Sites
2Q18 LTM Key Figures

7
PET bottles are made from IVL polymers
Premium baby diapers are made from IVL fibers
Airbags are made from IVL yarns
1 in 4 1 in 2
1 in 4
Tires are made from IVL fabrics
1 in 5
Global Industry Leader
Source: Industry Data, IVL Analysis
8
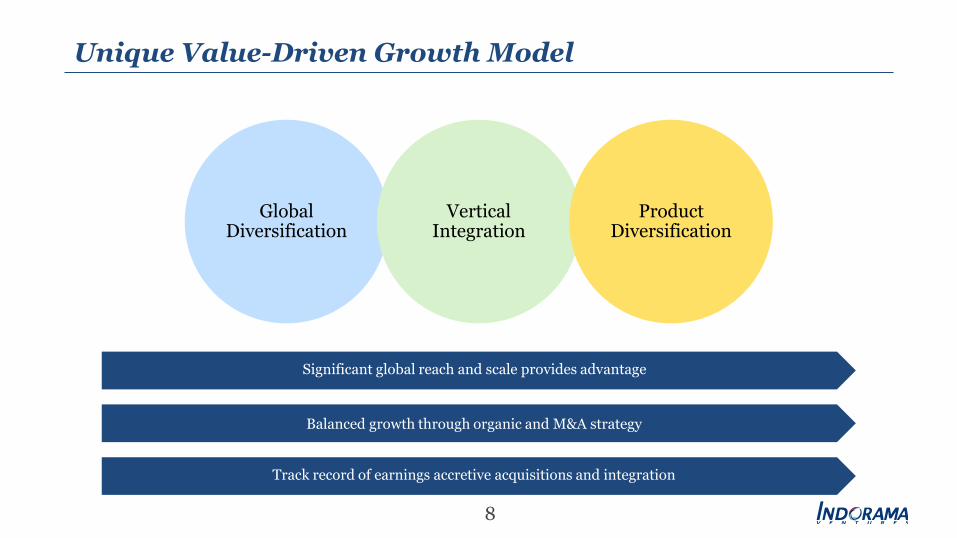
Unique Value-Driven Growth Model
Global Diversification
Significant global reach and scale provides advantage
Balanced growth through organic and M&A strategy
Track record of earnings accretive acquisitions and integration
Vertical Integration
Product Diversification

9
Globally Diversified Portfolio
Legacy Assets (2012) Acquisitions (2013-2018YTD)
North America
Capacity 5.2 MMt
#Countries 3 #Sites 14
South America
Capacity 0.6 MMt
#Countries 1 #Sites 1
Europe
Capacity 3.5 MMt
#Countries 13 #Sites 20
Middle East & Africa
Capacity 1.1 MMt
#Countries 5 #Sites 7
Asia
Capacity 4.1 MMt
#Countries 7 #Sites 28

10
Fibers
PET
EOEG Ethylene
PTA PX IPA
NDC
Polyester, PA66, Rayon
HVA Automotive
Polyester, PP, PE
HVA Hygiene
Unique Value Chain, Resilient to Downturns and Vital to Upswings
Strong Integration Profile
2.8 1.6
2.9 1.6
3.4 1.6
3.9 2.1
3.9 3.3 3.9 3.6 4.7 4.3
1.2
0.3
1.2
0.3
1.4
0.3
1.6
0.3
1.6
0.3
1.6 0.3
1.9
0.3 1.0 1.0 1.0
1.4 2.2
0.6
2.4
0.6
2.8
0.6 0.1 0.1 0.1
0.1 0.1
0.2
0.1
0.2
0.1
0.2 0.3 0.3 0.3
0.3 0.3 0.3
0.3
0.4
2012 2013 2014 2015 2016 2017 2018
PTA MEG PX IPA Ethylene
35% 34% 31% 34% 55% 58% 59%
MMt
Pro
du
ctio
n
Req
uir
emen
t
% Integration >>>
2012 2013 2014 2015 2016 2017 2018

11
Integration as Source of Superior Performance
Resilient Performance Reduced Earnings Volatility Superior Asset Utilization
-50%
0%
50%
100%
PET σ = 20
Fibers σ = 32
Feedstock σ = 24
IVL σ = 19
YoY change of EBITDA/t ($)
70%
80%
90%
100%
IVL PET IVL PTA
Industry PET Industry PTA
Op. Rate (%)
214 236 262 247 286 296 471 70 97 124 195 205 208
216
173 146 189
197 271
501
569 88
82 91 91 89
110
132
0
500
1,000
1,500
Feedstock Fibers
PET IVL Core EBITDA/t
EBITDA ($M) EBITDA/t ($)
Source: WoodMac Chemicals, IVL Analysis

12
Creating Value with M&A
Production (MMt) 5.25 5.80 6.23 7.02 8.73 9.10 10.03 11%
Legacy Assets 5.25 5.80 6.11 6.30 6.40 6.39 6.82 4%
Acquisitions 0.11 0.73 2.33 2.71 3.21
ROCE (%) 7.2% 6.4% 8.2% 9.7% 10.5% 11.9% 18.6%
Legacy Assets 7.2% 6.4% 8.6% 9.9% 10.3% 9.0% 19.7%
Acquisitions 7.7% 0.5% 8.9% 11.0% 17.9% 16.7%
461 477 559 555 554 579
972 86
221 425
536
461 478 568
640 775
1,004
1,508
0
50
100
150
200
0
500
1,000
1,500
2,000
2012 2013 2014 2015 2016 2017 1H18Annualized
Legacy
IVL
EB
ITD
A (
$M
)
EB
ITD
A (
$/t
on
)
CAGR
Acquisitions

13
High-Value Added Growth Platform
2012 2Q18LTM
HVA platform Products Demand CAGR 2018-21E
Automotive & Industrial Airbag yarns
Tire cord fabrics Industrial fabrics
>8%
Hygiene
Baby diapers Feminine care
Adult incontinence Medical disposable textiles
>7%
Specialty Polymers Specialty PET Packaging
>6%
Chemicals
IPA NDC EO
>6%
871 KMT HVA volume
1,905 KMT HVA volume

14
Creating Value with HVA
348 308 324 328 403 469
722 113 170
245 313
373
536
540
461 478 568
640
775
1,004
1,262
0
100
200
300
400
0
500
1,000
1,500
2012 2013 2014 2015 2016 2017 LTM2Q18
EB
ITD
A (
$M
)
EB
ITD
A (
$/t
on
)
Production (MMt) 5.25 5.80 6.23 7.02 8.73 9.10 9.56 11%
Necessities 4.38 4.72 4.91 5.56 7.08 7.31 7.66 10%
HVA 0.87 1.08 1.32 1.46 1.65 1.79 1.90 14%
CAGR
HVA EBITDA/t
IVL
Nec- essities

1,357
227
423
926 1,052
873
1,125
0.0
1.0
2.0
3.0
4.0
5.0
6.0
0
500
1,000
1,500
2,000
2,500
2012 2013 2014 2015 2016 2017 LTM2Q18
Growth CAPEX Maintenance CAPEX Net Operating Debt/Equity(x) Net Operating Debt/EBITDA(x)
Stronger Business
Profile
Balancing Growth and Leverage
$M
2Q18 LTM OCF $0.9 B
Equity Boost W1- $0.5 B W2- $0.4 B
Times

13% 87%
16
Natural Hedges Reduce Currency Exposure
$
€
B
O Others
USD 35%
44%
15%
23%
49% 23%
2% 10%
0%
20%
40%
60%
80%
100%
Long Term Debt Fixed CapitalEmployed
US$ 2.95B US$ 6.48B
Net Working Capital
US$ 1.25B
Long Term (Jun 2018) Short Term (Jun 2018)
Natural Hedge
21%
79%
Paper Hedges
Open Exposure to
Currency Risk
FX Impact to P&L
11.6
1.4
15.4
(1.0)
17.9
2014 2015 2016 2017 1H18
Forex gain/loss ($M)
Cu
rren
cy
Ex
po
sure
EUR
THB

17
Leveraging Improved Performance and Earnings Growth Opportunities
+44% Core LTM 2Q18 EBITDA growth
driven by structural shifts in our industry
$923m Operating Cash
Flow strengthening
balance sheet to
fund growth plans
Solid 1H 2018
Performance Strong industry fundamentals
enhanced visibility of
earnings
Strong projects and
M&A pipeline to
continue to add sustainable
earnings growth

18
2Q 2018 Financial Results
19
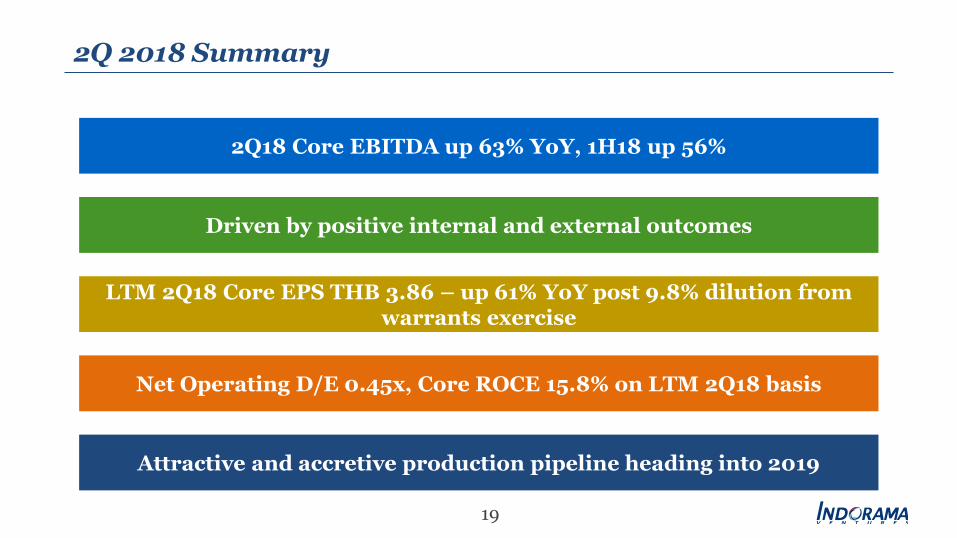
2Q 2018 Summary
2Q18 Core EBITDA up 63% YoY, 1H18 up 56%
Driven by positive internal and external outcomes
LTM 2Q18 Core EPS THB 3.86 – up 61% YoY post 9.8% dilution from warrants exercise
Net Operating D/E 0.45x, Core ROCE 15.8% on LTM 2Q18 basis
Attractive and accretive production pipeline heading into 2019

20
1H 2018 Year-on-Year Reported Financial Highlights
+57% YoY
Reported Net Profit
$443M
+109% YoY
Operating Cash Flow
$489M
+1% YoY
Core EPS per diluted share
THB 2.30
+68% YoY
Reported EBITDA
$742M
Production
4.9MMt +10% YoY

21
2Q 2018 Results – IVL
• Strong demand growth led by Asia supporting enhanced margins in the Polyester Value Chain
• IVL benefits from integrated PET platform globally, HVA has mixed results – gains in PEO and Packaging offset by negative lag in HVA fibers and normalizing IPA margins
• Portfolio enhanced and well positioned for 2H18 – 2019 with USA Cracker, Rotterdam-Portugal-Indonesia PTA, Brazil-Egypt-India PET JV consolidation as well as Avgol and Kordarna synergies in HVA
1. After PERP Interest
2Q18 2Q17 2Q18LTM 2Q17LTM
Core ROCE (%) 20.4% 12.6% 15.8% 11.2%
Core EBITDA ($/t) 153 107 132 97
Core EBITDA Margin 14.8% 11.4% 13.5% 11.2%
2Q18LTM
2Q17LTM
2Q18 2Q172Q18 2Q17 2Q18LTM
2Q17LTM
Core EBITDA ($M) Core EPS1 (THB)
+63% YoY
+80% YoY
+61% YoY
+44% YoY
239
879
0.73 2.39
388
1,262
1.31 3.86

22
2Q 2018 Results – West Necessities
West Necessities Core EBITDA ($M)
• West PET business delivers strong growth in production and earnings year-on-year on higher operating rates and increased margins on spot volume, driven by Asia and regional supply disruptions
• West Feedstock in 2Q18 benefits from strong EG margins and recovering sales of PTA in North America, partially offset by strong secondary raw materials costs
• Recent addition of 1.1 million tons of PET capacity in Brazil and Egypt and another 1.1 million tons of PTA via Rotterdam expansion and Portugal, to contribute fully in the following quarters
176
72
2Q18 2Q17
557
307
2Q18 LTM 2Q17 LTM
+81% YoY
+73 % margin/ cost/mix
+8% volume
+143% YoY
+125% margin/ cost/mix
+18% volume
2Q18 2Q17 2Q18LTM 2Q17LTM
Core EBITDA ($/t) 134 65 113 67
Core EBITDA Margin 15.3% 7.7% 13.8% 8.9%
Note: West Necessities include West PET , West Feedstock and West Fibers

23
2Q 2018 Results – East Necessities
East Necessities Core EBITDA ($M)
• Asia PET business delivers strong earnings growth year-on-year supported by high utilization rates, driven by global demand and structural improvements
• Strong recovery in Asia PTA earnings driven by improving industry structure and higher operating rates, partly offset by high secondary raw material costs
• Asia Fibers business delivers improved performance and is poised for new output from Indonesian expansion in 2H18
74
27
2Q18 2Q17
159
100
2Q18 LTM 2Q17 LTM
+170% YoY
+163% margin /cost/mix
+7% volume
+59% YoY
+59% margin/ cost/mix
+0% volume
2Q18 2Q17 2Q18LTM 2Q17LTM
Core EBITDA ($/t) 102 40 59 37
Core EBITDA Margin 14.2% 6.8% 8.5% 6.2%
Note: East Necessities include Asia PET, Asia PTA and Asia Fibers
24
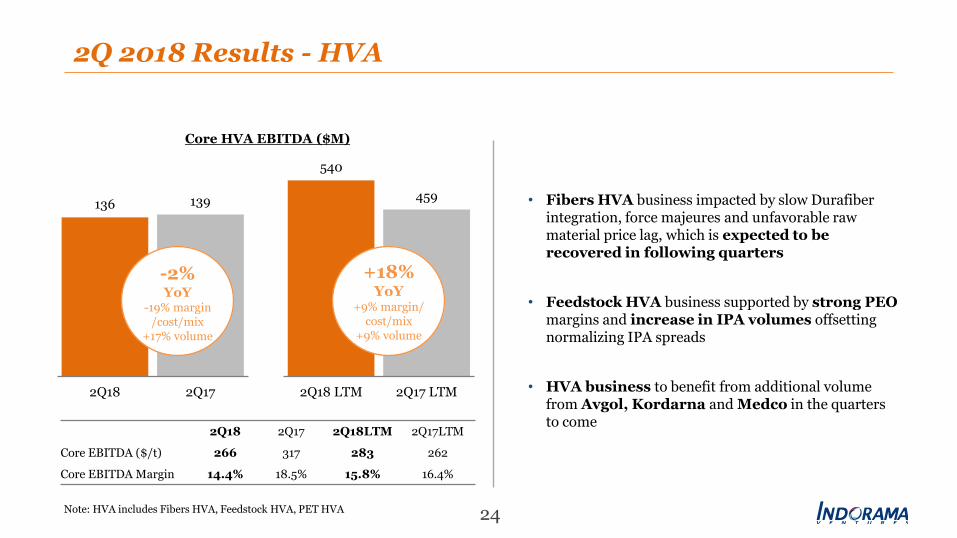
2Q 2018 Results - HVA
Core HVA EBITDA ($M)
• Fibers HVA business impacted by slow Durafiber integration, force majeures and unfavorable raw material price lag, which is expected to be recovered in following quarters
• Feedstock HVA business supported by strong PEO margins and increase in IPA volumes offsetting normalizing IPA spreads
• HVA business to benefit from additional volume from Avgol, Kordarna and Medco in the quarters to come
136 139
2Q18 2Q17
540
459
2Q18 LTM 2Q17 LTM
-2% YoY
-19% margin /cost/mix
+17% volume
+18% YoY
+9% margin/ cost/mix
+9% volume
2Q18 2Q17 2Q18LTM 2Q17LTM
Core EBITDA ($/t) 266 317 283 262
Core EBITDA Margin 14.4% 18.5% 15.8% 16.4%
Note: HVA includes Fibers HVA, Feedstock HVA, PET HVA

25
Sustaining Growth Momentum Across Portfolio
Core EBITDA ($M)
471 256
216
201
569
410
1,262
879
LTM2Q18 LTM2Q17
Feedstock Fibers PET
571 411
400
256
290
212
1,262
879
LTM2Q18 LTM2Q17
Asia EMEA Americas
540 459
557
307
159
100
1,262
879
LTM2Q18 LTM2Q17
East Necessities West Necessities HVA
By Segment By Region By Portfolio
Increasing contribution from Necessities portfolio reflects ongoing structural change
+44% YoY
+44% YoY
+44% YoY
57% Necessities
52% HVA
Note: Total of all segments and portfolio may not match to IVL due to holding

36% 45%
30% 29%
34% 26%
Production Core EBITDA
Americas EMEA Asia
26
Enhancing Visibility on Earnings
Asia PTA margins recovery while PET outperforms
Asia
EMEA
Americas
1H18
$0.7B 4.9MMt
2Q18 2Q17 1H18 1H17
Production (MMt) 0.76 0.60 1.46 1.24
Core EBITDA ($m) 111 87 207 156
Core EBITDA/t 145 145 142 126
2Q18 2Q17 1H18 1H17
Production (MMt) 0.94 0.84 1.77 1.63
Core EBITDA ($m) 166 96 328 201
Core EBITDA/t 177 114 185 123
2Q18 2Q17 1H18 1H17
Production (MMt) 0.85 0.79 1.64 1.55
Core EBITDA ($m) 112 56 180 101
Core EBITDA/t 133 71 110 65
37% 44%
28%
34%
35% 22%
Production Core EBITDA
1H17
4.4MMt $0.5B
1H18 1H17
Core EBITDA/t ($) 147 104
Core EBITDA Margin 14.2% 11.1%
Core ROCE 18.6% 10.7%

27
2019 Guidance Update

28
Strong Demand Growth Outlook
PET prolongs the shelf life and quality of the products and prevent wastage
PET is safe and non-toxic since PET polymer is very stable and inert
Lightweight PET save resources and also cuts costs & environmental impact during transportation
PET reduces carbon footprint because it uses less energy, creates fewer GHG emissions and generates less solid waste
PET: Safe, Convenient, Sustainable Material Choice
PET is 100% recyclable
~7% ~7% ~8%
Fibers PET Film
Source: Industry Data, IVL Analysis
Demand CAGR 2017-2019F

29
193 201 191
181 171
193 182 182 190 195 205
221 243
274
0
50
100
150
200
250
3001Q
15A
2Q
15A
3Q
15A
4Q
15A
1Q16
A
2Q
16A
3Q
16A
4Q
16A
1Q17
A
2Q
17A
3Q
17A
4Q
17A
1Q18
A
2Q
18A
West PET
Asia PET
US EG
West PTA
Asia PTA
IVL Spread
Sustained Margin Environment
26 18 14 14 19 16 15 15 20 17 -13 8 17 -17 IVL Premium
to Industry
IVL vs Industry Spreads – Necessities Portfolio ($/t)
Note: Based on IVL portfolio Note: 1Q16: Plant turnaround/catalyst change/ loss of production/Lower MEG margin; 1Q18: EG EBITDA adjusted by $21m for insurance claim Source: IVL, Industry Data, IVL Analysis
30
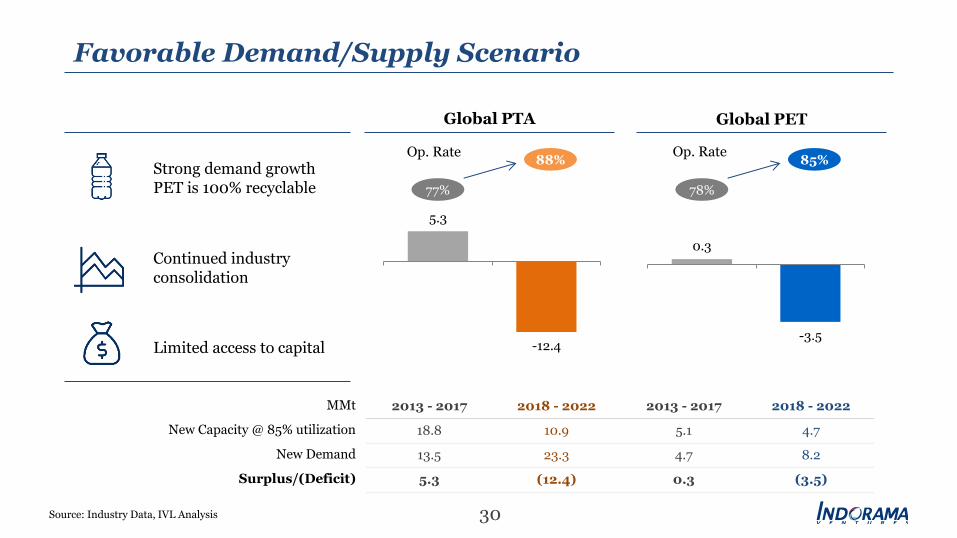
Favorable Demand/Supply Scenario
Strong demand growth PET is 100% recyclable
Continued industry consolidation
Limited access to capital
MMt 2013 - 2017 2018 - 2022 2013 - 2017 2018 - 2022
New Capacity @ 85% utilization 18.8 10.9 5.1 4.7
New Demand 13.5 23.3 4.7 8.2
Surplus/(Deficit) 5.3 (12.4) 0.3 (3.5)
Global PTA Global PET
5.3
-12.4 -15.0
-10.0
-5.0
0.0
5.0
10.0
2013-2017 2018-2022
77%
88%
0.3
-3.5 -5.0
-4.0
-3.0
-2.0
-1.0
0.0
1.0
2.0
3.0
4.0
5.0
2012-2017 2018-2022
78%
85%
Source: Industry Data, IVL Analysis
Op. Rate Op. Rate

31
2019 Guidance Update EBITDA Outlook for 2019 Raised Up 74% Over 2017
536 540
1,456 93 165 375
557
559
-70
2017 LTM2Q18 Product Mix &Volume
Margins 2019 NewGuidance
2019 OldGuidance
West Necessities
East Necessities
HVA
2017 to 2019 Core EBITDA ($M)
Core EBITDA ($/MT) 110 132 134 123
Production (MMt) 9.1 9.6 13.0 11.9
1,262
1,750
1,004
+74%

32
2019 Margin Projections
Core EBITDA ($/t)
LTM 2Q18
1H18 2019F Rationale and Potential
West Necessities
1091 1261 111
• LTM 2Q18 margins considered to be safe and sustainable • Repricing of 2019 contract sales can have positive impact • Ethylene integration, Brazil, Portugal Egypt will be positive • MEG margins difficult to foresee from their strong levels at present • Corpus Christi expected to be delayed into 2020 • No impact from US ADD considered
Asia Necessities
59 80 74
• Avg LTM 2Q18 – 1H18 margins considered • India and Indonesia JV consolidation will be positive • Fiber expansion in Indonesia is positive • 1H18 Asia PTA margins considered sustainable • 2Q18 Asia PET margins corrected to LTM 2Q18 level
HVA 284 271 268
• PEO, NDC, Packaging margins steady • IPA margins lowered to sustainable level • HVA Fibers margins to expand post 1H18 supply issues • Avgol, Kordarna and PF expansion in China will enhance Hygiene and Auto
business
IVL 1301 1421 134
1. Adjusted for one-time income of $21m from insurance claim at IVOG in 1Q18 Note: 2019F Core EBITDA/t based on LTM 2Q18 margins and 2019 portfolio
33
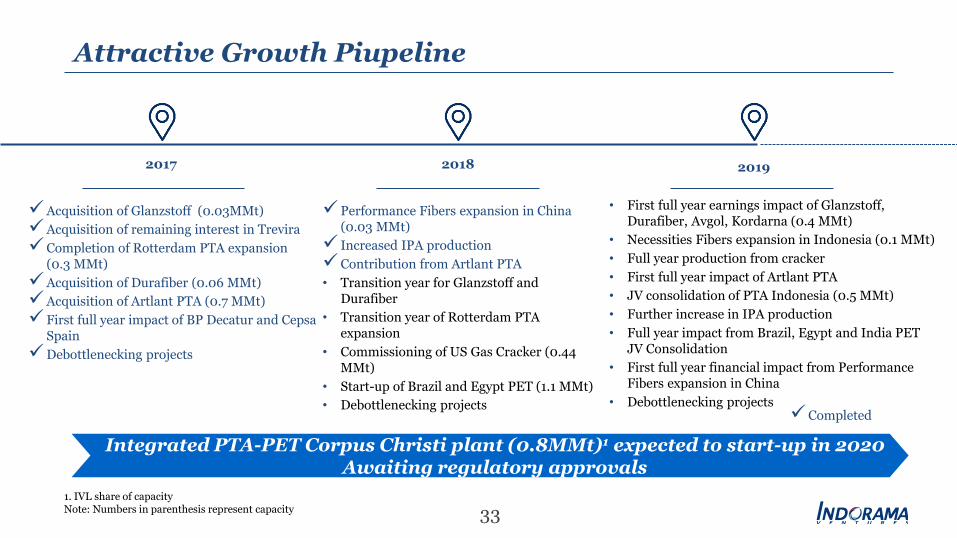
Attractive Growth Piupeline
2017 2018 2019
Performance Fibers expansion in China (0.03 MMt)
Increased IPA production
Contribution from Artlant PTA
• Transition year for Glanzstoff and Durafiber
• Transition year of Rotterdam PTA expansion
• Commissioning of US Gas Cracker (0.44 MMt)
• Start-up of Brazil and Egypt PET (1.1 MMt)
• Debottlenecking projects
• First full year earnings impact of Glanzstoff, Durafiber, Avgol, Kordarna (0.4 MMt)
• Necessities Fibers expansion in Indonesia (0.1 MMt)
• Full year production from cracker
• First full year impact of Artlant PTA
• JV consolidation of PTA Indonesia (0.5 MMt)
• Further increase in IPA production
• Full year impact from Brazil, Egypt and India PET JV Consolidation
• First full year financial impact from Performance Fibers expansion in China
• Debottlenecking projects
Integrated PTA-PET Corpus Christi plant (0.8MMt)1 expected to start-up in 2020 Awaiting regulatory approvals
Acquisition of Glanzstoff (0.03MMt)
Acquisition of remaining interest in Trevira
Completion of Rotterdam PTA expansion (0.3 MMt)
Acquisition of Durafiber (0.06 MMt)
Acquisition of Artlant PTA (0.7 MMt)
First full year impact of BP Decatur and Cepsa Spain
Debottlenecking projects
Completed
1. IVL share of capacity Note: Numbers in parenthesis represent capacity

34
Acquisitions Announced Till Date
Business Region Status Capacity Strategic Rationale
Brazil PET
West PET Brazil Signed: Mar 16, 2018 Closed: May 24,
2018
550 KMT • Expands global footprint with presence in South America • Growth and margin enhancement through scale advantage and
cost synergies • Complementing IVL’s existing operations and technologies
Egypt PET
West PET Egypt Signed: Jun 14, 2018 Closed: Jun 14,
2018
540 KMT • Restart serves growing need for sustainable packaging in Egypt and in the region
• Duty free access to key Western markets currently facing critically low supply
• Feedstock synergy with IVL Portugal PTA
Avgol
Fibers HVA Israel, USA, China, Russia and India
Signed: May 13, 2018 Closed: July 25,
2018
203 KMT • Enhances IVL’s HVA portfolio and market share in the personal hygiene segment
• Strengthens Indorama’s global footprint in leading markets • Deepens relationships with global brands through long-term
partnerships
Kordarna
Fibers HVA Czech R. and Slovakia
Signed: Jun 28, 2018 Closing: 3Q18E
Fabrics: 50 KMT
Fibers: 21 KMT
• Propels IVL to a leading tire cord producer in Europe and globally, with a complete range of tire reinforcement products
• Provides great long-term potential for use of our free cash flow in a diversified earnings stream
Medco Packaging Egypt Signed: Jul 18, 2018 Closing: 3Q18E
Preforms: 70 KMT
• Leading converter position in Egypt and strong customer relationship
• Strong synergy potential through integration across value chain
Sorepla Recycle France Signed: Jul31, 2018 Closed: Jul 31,
2018
52 KMT • Driving closed loop solutions and embraces the Circular Economy
• Enhances opportunities to serve increasing demand for rPET • Enhances supply chain synergies for IVL Recycled business
Ne
ce
ssit
ies
H
VA
Closed

35
Thank You

36
Annexure

37
Indorama Ventures (IVL) at A Glance
Aiming to be a World-Class
Chemical Company
Global #1 Thai Company with 85 sites in 29
countries and 5 continents
Global #1 Integrated PET producer with ~20% market
share
20%
80%
43%
57%
EBITDA US$ 1,262
Million
High Value Added:
Films Automotive Hygiene Industrial Packaging Specialty-Chemicals (PEO, IPA, NDC etc.)
Necessities: PET PTA Necessity Fibers MEG Ethylene & Propylene - (to start in 1H18)
Volumes
EBITDA
30.6%
Retail
Domestic
Institutions
Free Float
Promotors
Shareholding Structure Jun’18
• Bloomberg Ticker : IVL.TB
• THB 451B ($13.6B) Enterprise Value Jun’18
• Listed in Thailand
• Avg. daily trading volume: ~28M shares
• Part of SET 50 and MSCI
Foreign Institutions
(including NVDR 100%)
Note: IVL LTM2Q18 financials, Core Financials on this slide and henceforth unless otherwise stated
65.5% 34.5% 45.3%
41.6%
13.1%

38
IVL’s Unique Value Chain
Polymer
PET Nylon 66 Fibers
IPA
PTA
MEG
*Ethylene
Paraxylene *Ethane/Propane Cracker
Oil Refinery
PEO
*Propylene
HVA PEO
HVA Nylon 66 Fibers
HVA PP Fibers
HVA Polyester Fibers PET Resin Polyester Fibers
PP Fibers
Benzene Butadiene Ammonia
Shale Gas or Oil
Metaxylene
Capacity Reservation
IVL Necessities Value Chain I IVL HVA Value Chain
Polyester Fibers
Coatings
Rayon Tire Cord
HVA Rayon Fibers
Wood Pulp
Polyester Fibers
Polypropylene (PP)
ADA/ADN NDC
PEN Film and others
Note: * Ethylene Gas Cracker of IVL is expected to start in 2018

IVL’s Necessities Portfolio
39
Volume
80%
Revenue
63%
EBITDA
57%
PET Fibers PX & PTA MEG * Ethylene
#1 Global Producer Lowest Cost of Manufacturing
in Indonesia
100% Captive Integration
100% Captive Integration
~9 bn
…from 7 to 9 billion people by 2050
Industry Growth ~5% p.a.
…of the world population will live in the cities by
2050
Driven By Megatrends
75%
…more food needed by 2050
30%
~80% Captive Integration
*1H18
Note: IVL LTM2Q18 financials, Captive integration is based on in-house raw material requirements
Population Growth
Rapid Urbanization
Modern Retail Growth
Health Awareness
40
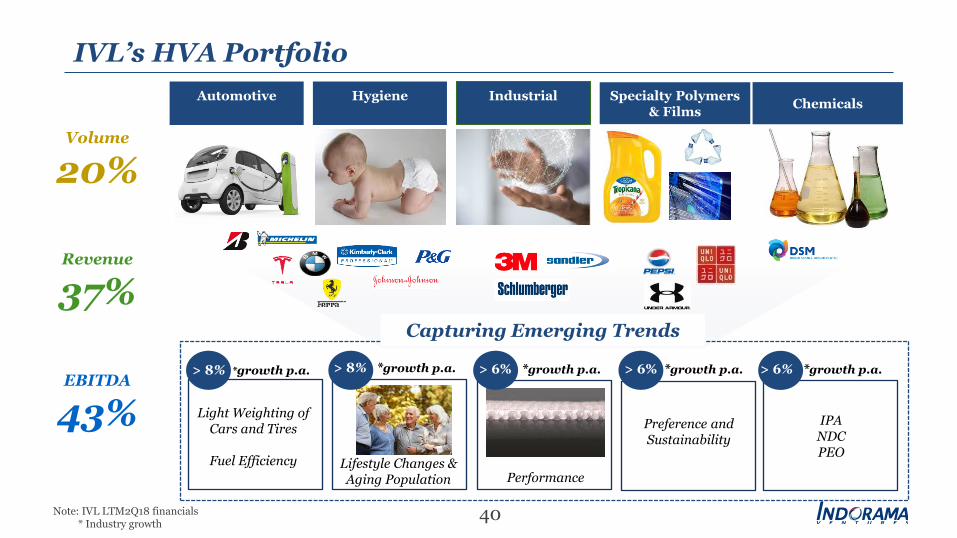
IVL’s HVA Portfolio
> 8% *growth p.a.
Light Weighting of Cars and Tires
Fuel Efficiency Lifestyle Changes &
Aging Population
Capturing Emerging Trends
> 8% *growth p.a.
Performance
> 6% *growth p.a.
Preference and Sustainability
IPA NDC PEO
> 6% *growth p.a.
Automotive
Hygiene
Industrial
Specialty Polymers & Films
Chemicals
> 6% *growth p.a.
Volume
20%
Revenue
37%
EBITDA
43%
Note: IVL LTM2Q18 financials * Industry growth

41
Hedging
• Naturally hedging Forex position
• Substantially hedged with largely funding investments in the currency of operating cash flows
• 63% interest fixing for 1H2018 (2017: 50%)
Funding
• Diversification of funding sources and debt maturities to minimize refinance risk
• Interest cost reduction from cross currency swap
• Long term THB and SGD bonds : 51% (2017: 43%)
• Relationship with 7 domestic and 66 international banks
• Secured Debt to Total assets ~ 3% (~3% in 2017)
Tax optimization
• Optimization on current tax expenses for IVL for an amount of ~ TH B 2.4 Billion in year 2018
• Additional savings expected with expected IVOL’s start up in Q’3 2018 and bonus depreciation rules as introduced in US Tax reforms kicking in.
• Saving of $100mn on Deferred Tax - new US tax policy
• Europe: Synergy in repatriation tax with European Headquarter
1.31
0.84 0.96
1.06
0.70 0.64
2013 2014 2015 2016 2017 2Q18
Bond and bank debt covenant Not more than 2.0x
Board Guidance Not more than 1.5x
Consistently meet internal thresholds and debt agreements
Net Debt / Equity (x)
Conservative Financial Policy

42
A constituent of the 2018 FTSE4Good Index
2017 Climate Change Rating: B
A member of 2017 DJSI Emerging Markets Chemicals Industry
Leading in SET Index: 2017 Bloomberg ESG Disclosure Scores
Top 5 of all global chemical companies
Ranked among
EcoVadis Gold Recognition:
Top 3% of suppliers in all categories
RobecoSAM’s Sustainability Yearbook 2018
Silver Class Industry Mover
IVL’s Commitment Towards Sustainability
Closed Loop Economy Initiative

• China capacity coming back to balance
• China has been able to build and back integrate unlike some producers in the west
• Exports have mainly been to the Middle East, India and not to the West
• Improving margins
• 2018 sees a surge in PTA use as it looks to substitute some virgin for recycle
• Large captive investments into refinery will require margin discipline to recover capex costs
70
75
80
8552
0
50
36
34
38
40
42
44
46
48
2015 2017 2016 2019
Na
mep
late
uti
lisa
tio
n (
%)
MM
t
2020 2018
Capacity
Consumption Production
Utilisation Rate (right hand scale)
China PTA Environment
PTA Industry Outlook
Source: Industry Data, IVL Analysis

0
10
20
30
4033
15
2025 2015 2005
10
0
10
20
30
40
2005 2015 2025
17
31
39
Asia Europe Middle East N America S America
PX capacity with captive PTA (KMT)
Merchant PX Capacity (KMT)
• China expected to be long on PX due to new supply additions
• Current improvements in PTA margin reflective of the need for cash flow to fund the upcoming mega projects
• Recover upstream capex through downstream margin
• IVL sees a potential upside to its margins - not yet built into the forecast - with melt costs going down on account of discounts on raw materials and higher downstream prices
PX Industry Outlook
Source: Industry Data, IVL Analysis
