investor overview | graco
TRANSCRIPT
1 1
Company Overview Investor Presentation
First Quarter 2021
/ / / / / / / / / / / / / / / / / /
2 2 2 2
Safe Harbor
Today’s presentation includes forward-looking statements that reflect
management’s current expectations about the Company’s future business and
financial performance.
These statements are subject to certain risks and uncertainties that could
cause actual results to differ from anticipated results.
Factors that could cause actual results to differ from anticipated results are
identified in Part 1, Item 1A of the Company’s Form 10-K, and the current
Quarterly Report on Form 10-Q.
/ / / / / / / / / / / / / / / / / /
3 3 3 3
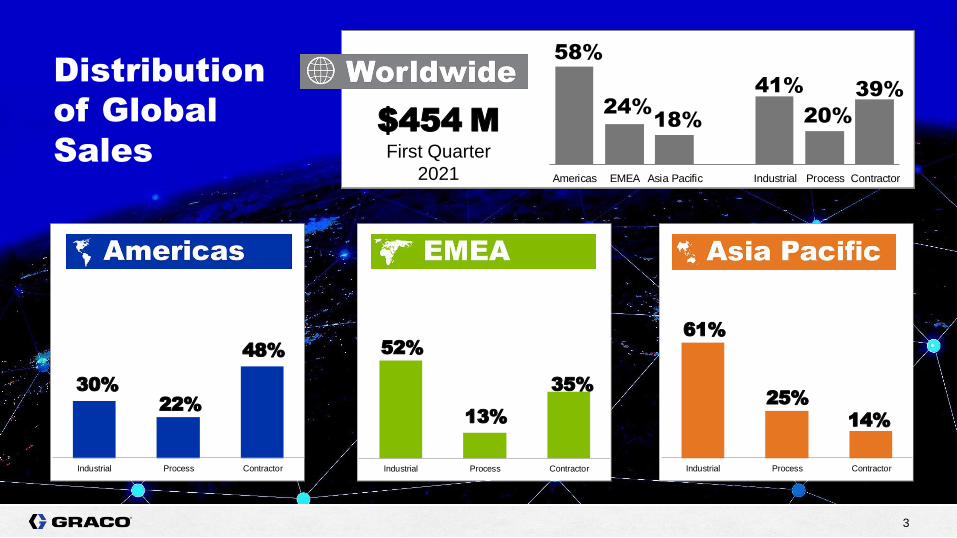
Distribution
of Global
Sales
58%
24%18%
41%
20%
39%
Americas EMEA Asia Pacific Industrial Process Contractor
$454 M First Quarter
2021
30%22%
48%
Industrial Process Contractor
52%
13%
35%
Industrial Process Contractor
61%
25%
14%
Industrial Process Contractor
4 4 4 4
/ / / / / / / / / / / / / / / / / /
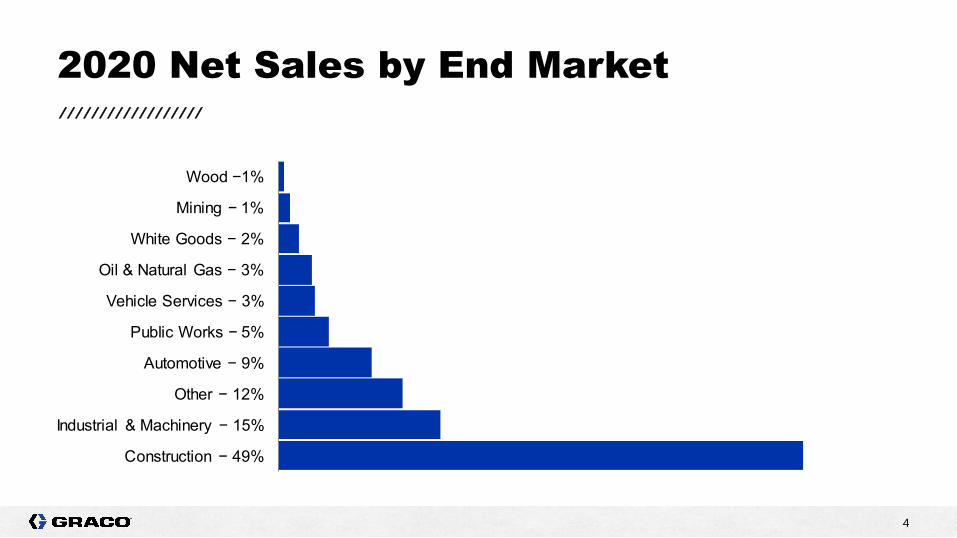
2020 Net Sales by End Market
Construction − 49%
Industrial & Machinery − 15%
Other − 12%
Automotive − 9%
Public Works − 5%
Vehicle Services − 3%
Oil & Natural Gas − 3%
White Goods − 2%
Mining − 1%
Wood −1%
5 5 5 5
Graco is part of your
everyday life.

6 6 6 6
Graco is part of your
everyday life.
7 7 7 7 7 7
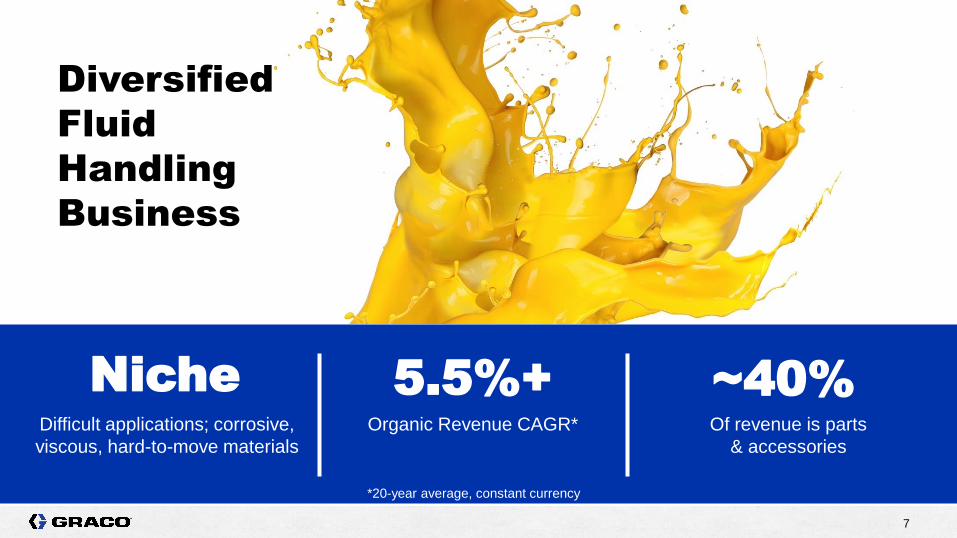
Difficult applications; corrosive,
viscous, hard-to-move materials
Niche Organic Revenue CAGR*
5.5%+ Of revenue is parts
& accessories
~40%
Diversified
Fluid
Handling
Business
*20-year average, constant currency
8 8 8 8
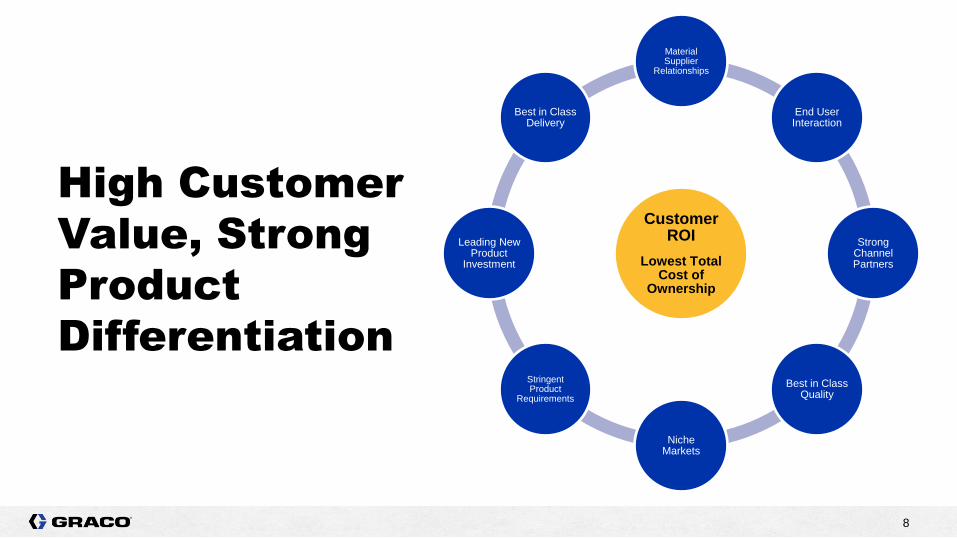
High Customer
Value, Strong
Product
Differentiation
Customer ROI
Lowest Total Cost of
Ownership
Material Supplier
Relationships
End User Interaction
Strong Channel Partners
Best in Class Quality
Niche Markets
Stringent Product
Requirements
Leading New Product
Investment
Best in Class Delivery
9 9 9 9
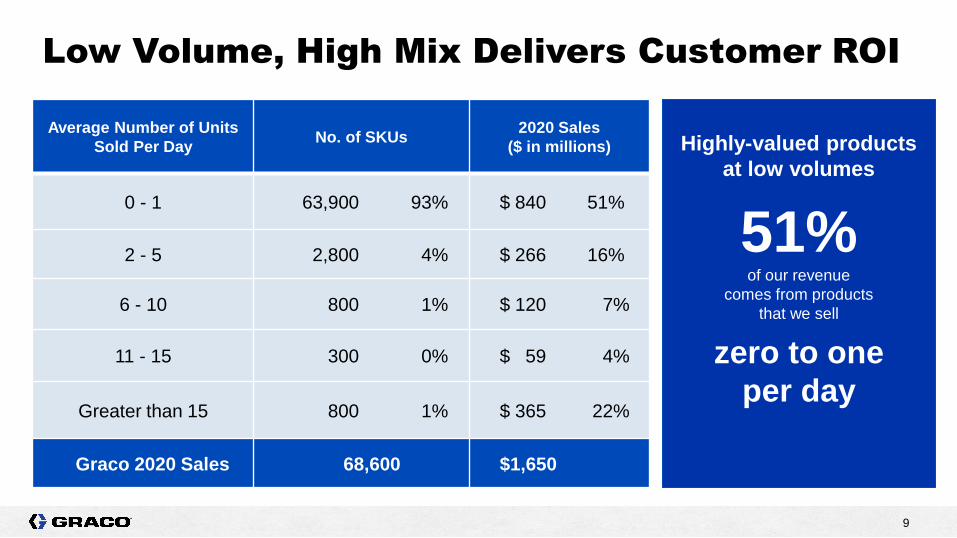
Low Volume, High Mix Delivers Customer ROI
Average Number of Units
Sold Per Day No. of SKUs
2020 Sales
($ in millions)
0 - 1 63,900 93% $ 840 51%
2 - 5 2,800 4% $ 266 16%
6 - 10 800 1% $ 120 7%
11 - 15 300 0% $ 59 4%
Greater than 15 800 1% $ 365 22%
Graco 2020 Sales 68,600 $1,650
Highly-valued products
at low volumes
51% of our revenue
comes from products
that we sell
zero to one
per day
10 10 10 10
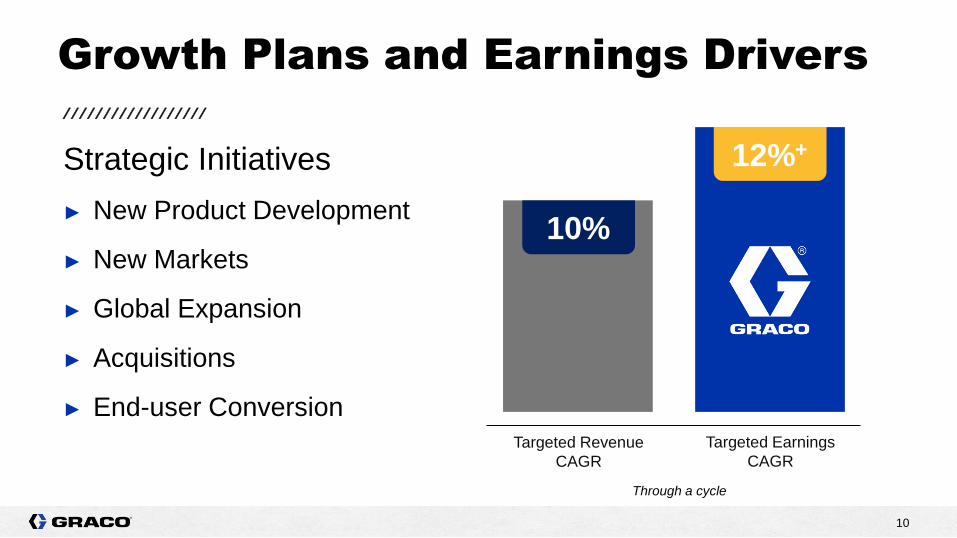
Growth Plans and Earnings Drivers
Targeted Revenue
CAGR
Targeted Earnings
CAGR
Strategic Initiatives
► New Product Development
► New Markets
► Global Expansion
► Acquisitions
► End-user Conversion
/ / / / / / / / / / / / / / / / / /
Through a cycle
10%
12%+

11 11 11 11
3%
12%+
Industrial Production
Average Growth Rate
Targeted Earnings
CAGR
Price
1-2%
Strategic
Initiatives
1-2%
Acquisitions
3-4%
Growth Plans and Earnings Drivers
/ / / / / / / / / / / / / / / / / /
12%+
5-7%
Targeted Organic
CAGR
9-10%
Through a cycle
Targeted
Revenue CAGR
12 12
12 12 12 12
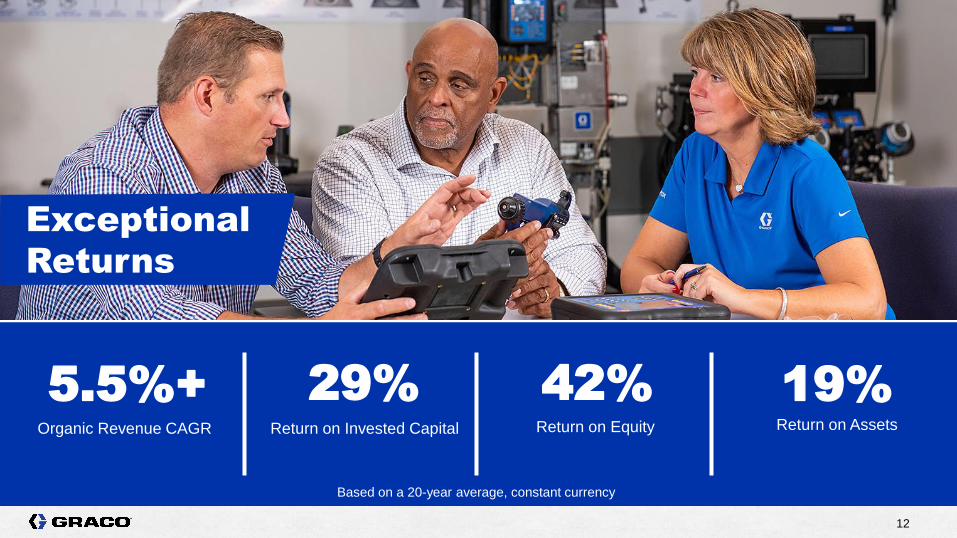
Organic Revenue CAGR
5.5%+ Return on Invested Capital
29% 19% Return on Assets Return on Equity
42%
Exceptional
Returns
Based on a 20-year average, constant currency
13 13
Company Overview ▶ Brand Promise
▶ Operational Excellence
▶ Engineering & Manufacturing Excellence
▶ Extensive Reach
/ / / / / / / / / / / / / / / / / /
Business Model
13
14 14
IMAGE/COPY
SLIDE TITLE
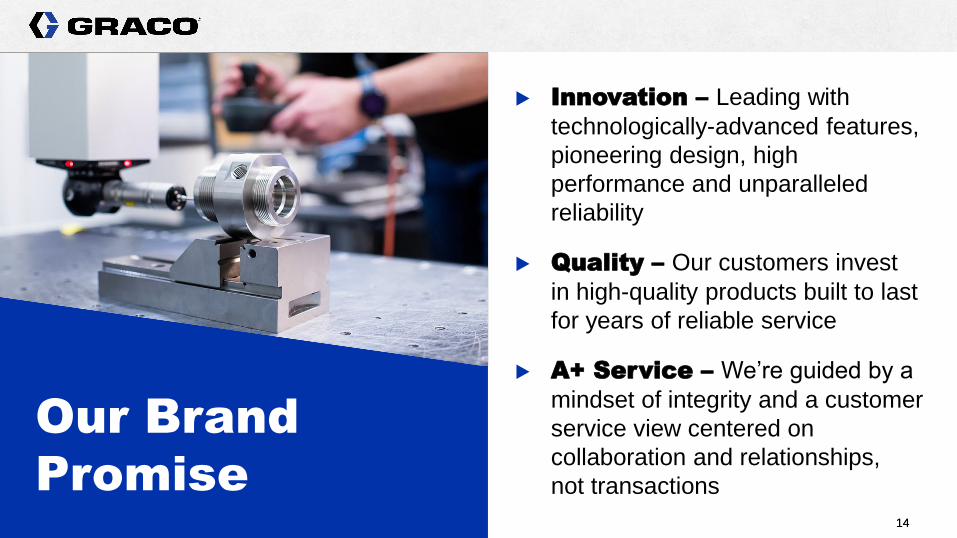
▶ Innovation – Leading with
technologically-advanced features,
pioneering design, high
performance and unparalleled
reliability
▶ Quality – Our customers invest
in high-quality products built to last
for years of reliable service
▶ A+ Service – We’re guided by a
mindset of integrity and a customer
service view centered on
collaboration and relationships,
not transactions
Our Brand
Promise
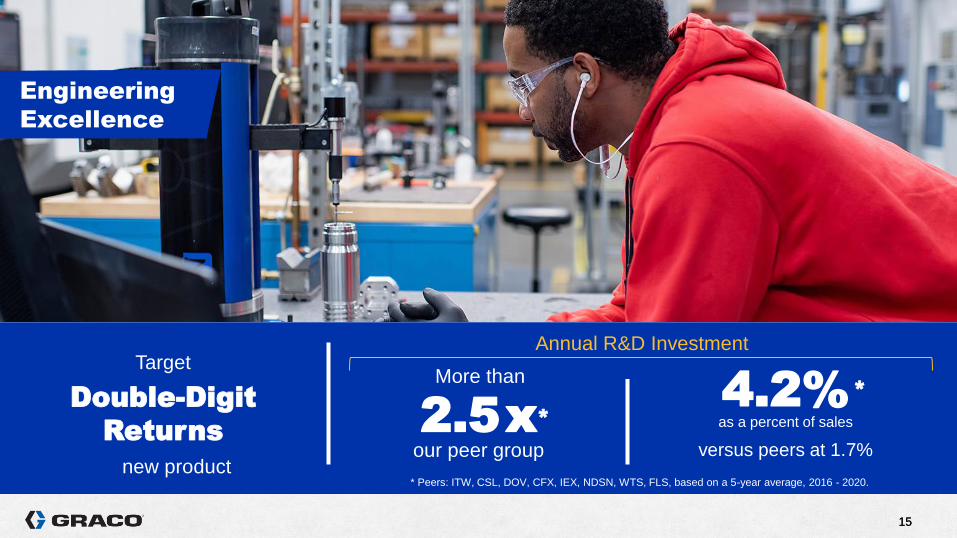
15 15
15 15
Engineering
Excellence
▶ new product
Double-Digit
Returns
Target
2.5 x More than
*
our peer group
Annual R&D Investment
4.2%
* Peers: ITW, CSL, DOV, CFX, IEX, NDSN, WTS, FLS, based on a 5-year average, 2016 - 2020.
versus peers at 1.7%
as a percent of sales
*
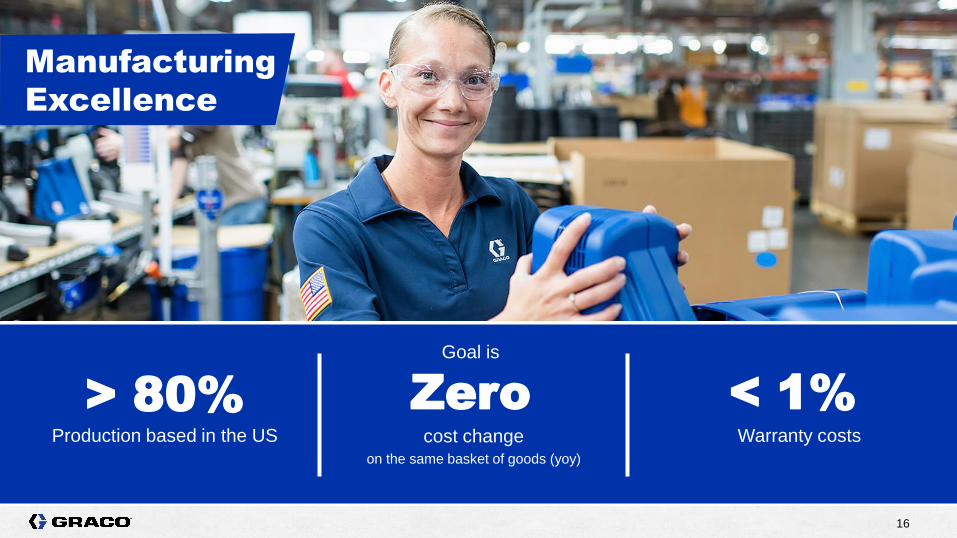
16 16 16 16 16 16
Production based in the US
> 80% cost change
on the same basket of goods (yoy)
Zero Warranty costs
< 1%
Manufacturing
Excellence
Goal is

17 17 17 17 17 17
Orders in by noon,
ship the same day
Same Day In-stock service level
96%+
Service
Excellence
(goal is > 92%)

18 18 18 18 18 18
Outlets/Distributors
30,000+ countries
years old
~100
100
Extensive Reach
Customers in over
Facilities in
countries
12
Installed base
19 19
Company Overview ▶ Industrial
▶ Process
▶ Contractor
/ / / / / / / / / / / / / / / / / /
Company Segments
19
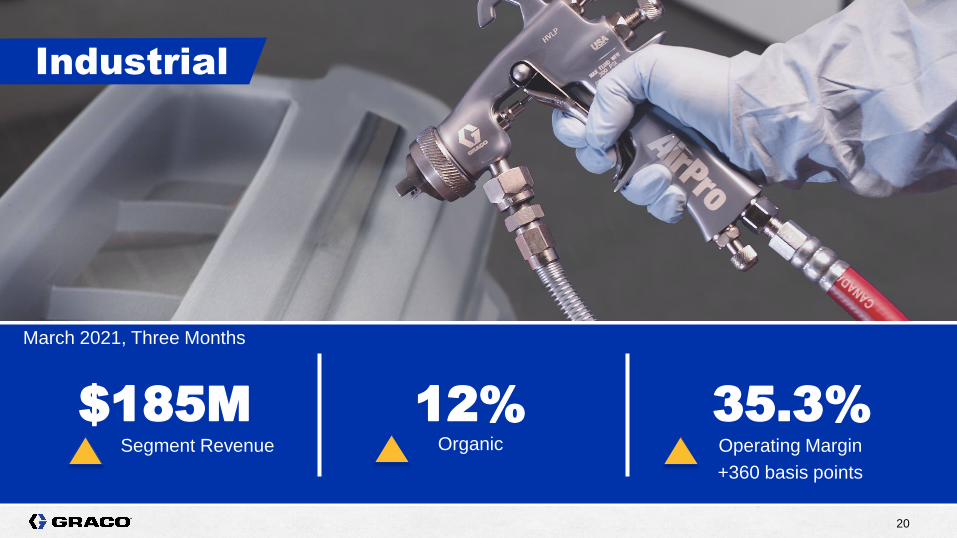
20 20 20 20 20 20
Segment Revenue
$185M 35.3% Operating Margin
+360 basis points
Industrial
March 2021, Three Months
Organic
12%

21 21 21 21
Key End Markets
▶ General industrial
▶ Automotive
▶ Res & non-res construction
▶ Alternative energy & others
Growth Drivers & Trends
▶ Factory movement & upgrades
▶ Automation
▶ Technology upgrades
▶ Energy-efficiency upgrades
▶ Material changes
Select Representative Industry Participants:
Public : Nordson, Carlisle, Exel
Private: Wagner and many other regional
players
Industrial

22 22 22 22 22 22
Process
Segment Revenue
$91M Organic
7% 23.8% Operating Margin
+280 basis points
March 2021, Three Months
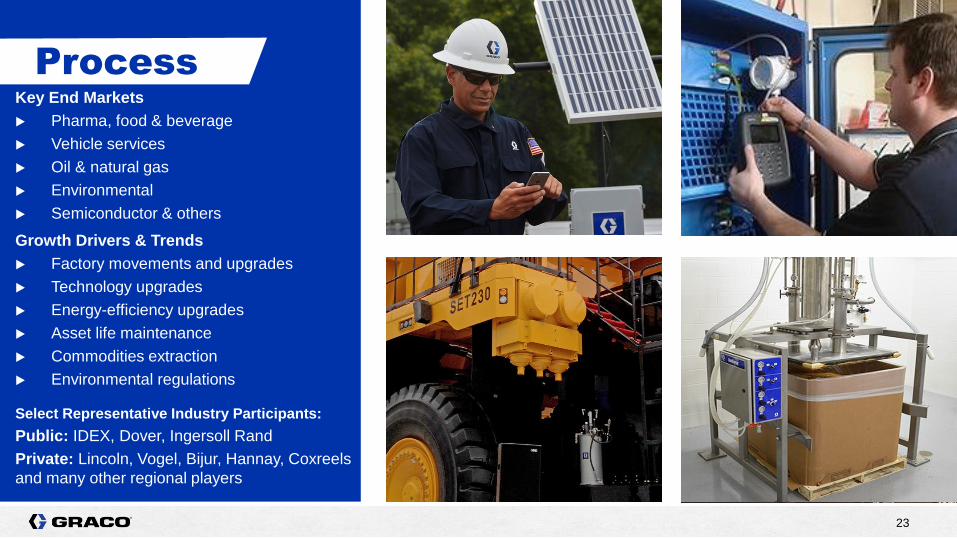
23 23 23 23
Process Key End Markets
▶ Pharma, food & beverage
▶ Vehicle services
▶ Oil & natural gas
▶ Environmental
▶ Semiconductor & others
Growth Drivers & Trends
▶ Factory movements and upgrades
▶ Technology upgrades
▶ Energy-efficiency upgrades
▶ Asset life maintenance
▶ Commodities extraction
▶ Environmental regulations
Select Representative Industry Participants:
Public: IDEX, Dover, Ingersoll Rand
Private: Lincoln, Vogel, Bijur, Hannay, Coxreels
and many other regional players
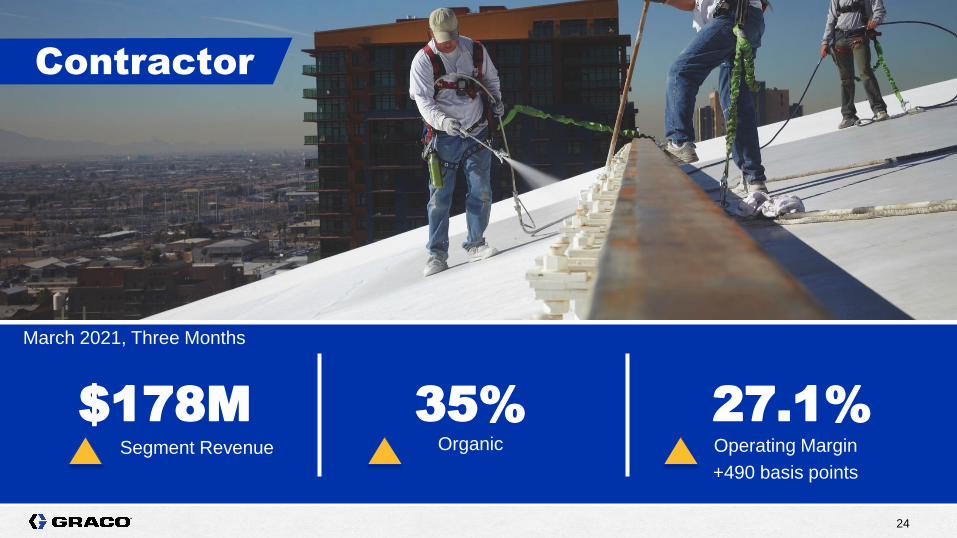
24 24 24 24 24 24
Contractor
Segment Revenue
$178M 27.1% Operating Margin
+490 basis points
Organic
35%
March 2021, Three Months

25 25 25 25
Key End Markets
► Res & non-res construction
► Res & non-res remodeling
► Transportation Infrastructure
Growth Drivers & Trends
► End user conversion from brush and roll
► Product innovation & channel expansion
► Housing & new construction
► Infrastructure spending
► Regional labor rates
► New markets
► Material changes
Select Representative Industry Participants:
Private: Wagner/Titan, Campbell Hausfeld,
Bedford, China copiers and other regional
players
Contractor

26 26
Company Overview / / / / / / / / / / / / / / / / / /
Capital Allocation
26
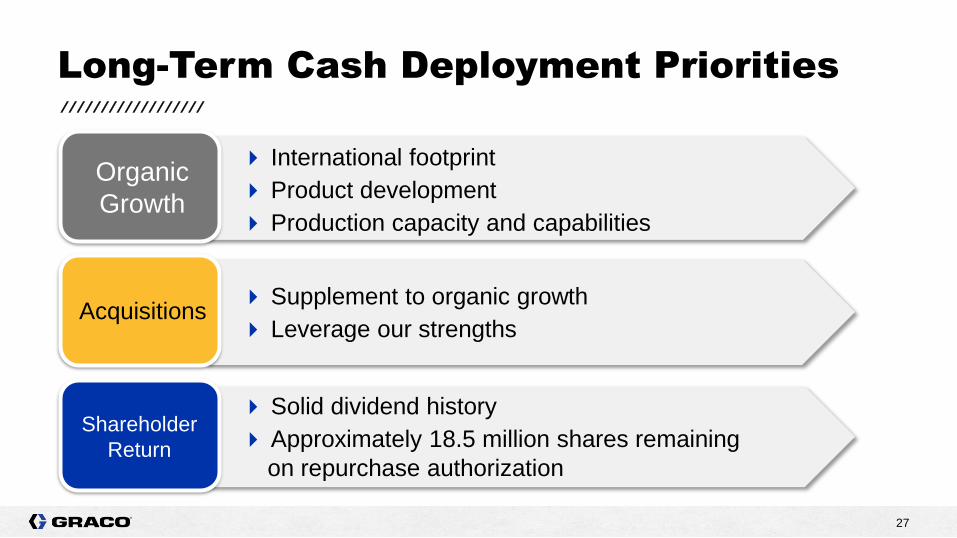
27 27 27 27
Long-Term Cash Deployment Priorities / / / / / / / / / / / / / / / / / /
International footprint
Product development
Production capacity and capabilities
Organic
Growth
Supplement to organic growth
Leverage our strengths Acquisitions
Solid dividend history
Approximately 18.5 million shares remaining
on repurchase authorization
Shareholder
Return
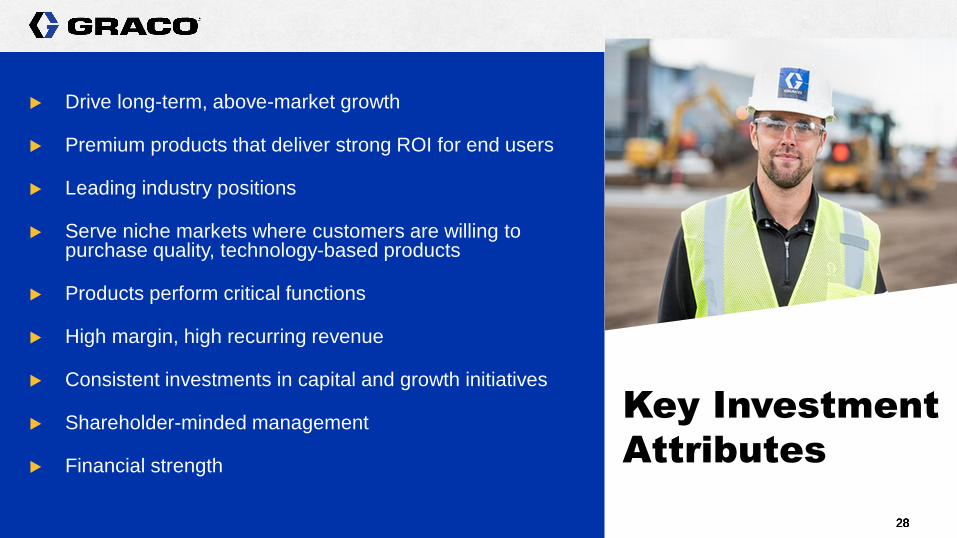
28 28 28 28
▶ Drive long-term, above-market growth
▶ Premium products that deliver strong ROI for end users
▶ Leading industry positions
▶ Serve niche markets where customers are willing to purchase quality, technology-based products
▶ Products perform critical functions
▶ High margin, high recurring revenue
▶ Consistent investments in capital and growth initiatives
▶ Shareholder-minded management
▶ Financial strength
Key Investment
Attributes
29 29
Company Overview / / / / / / / / / / / / / / / / / /
Acquisitions
29
30 30 30 30
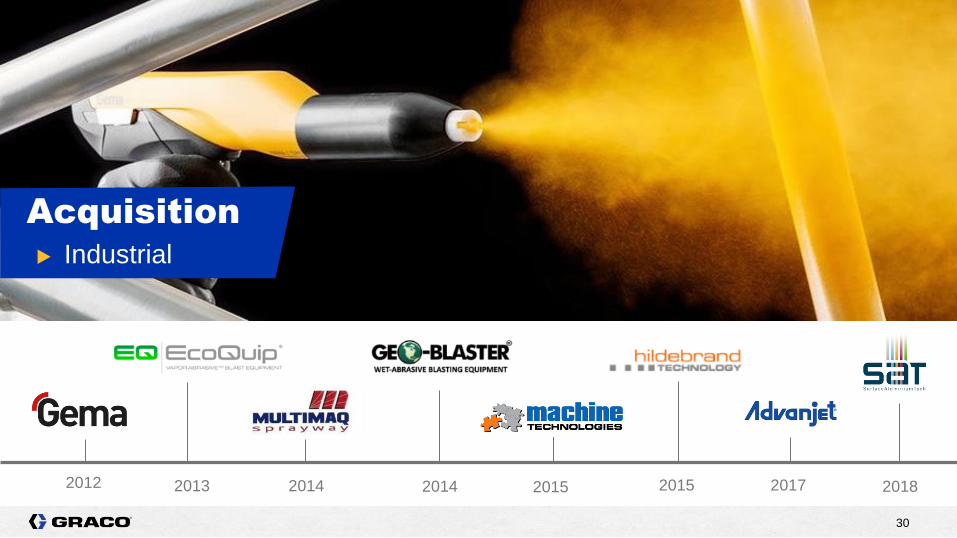
Acquisition
▶ Industrial
2014 2018 2015 2013 2015 2014 2012 2017
31 31 31 31
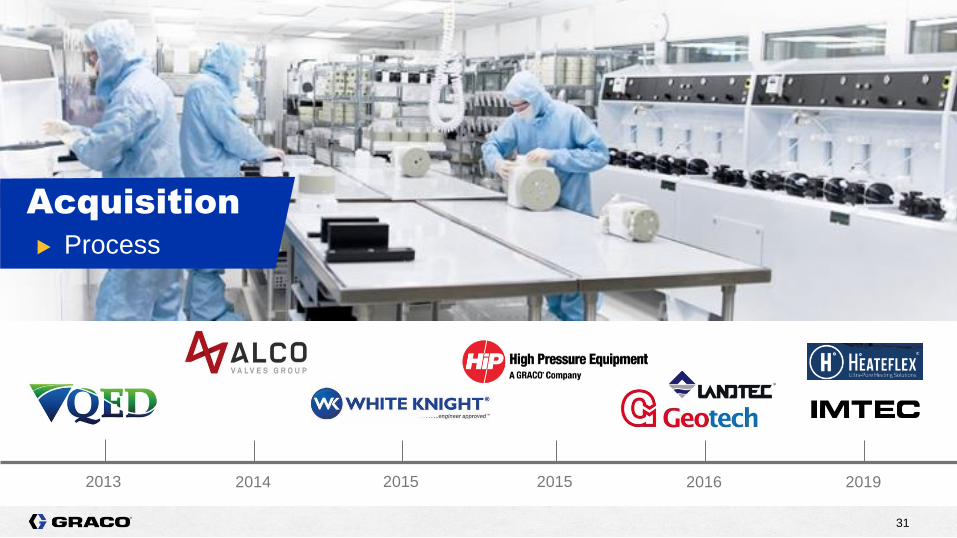
Acquisition
▶ Process
2015 2013 2016 2015 2014 2019
32 32
Company Overview / / / / / / / / / / / / / / / / / /
Financial Results
32
33 33
33 33 33 33
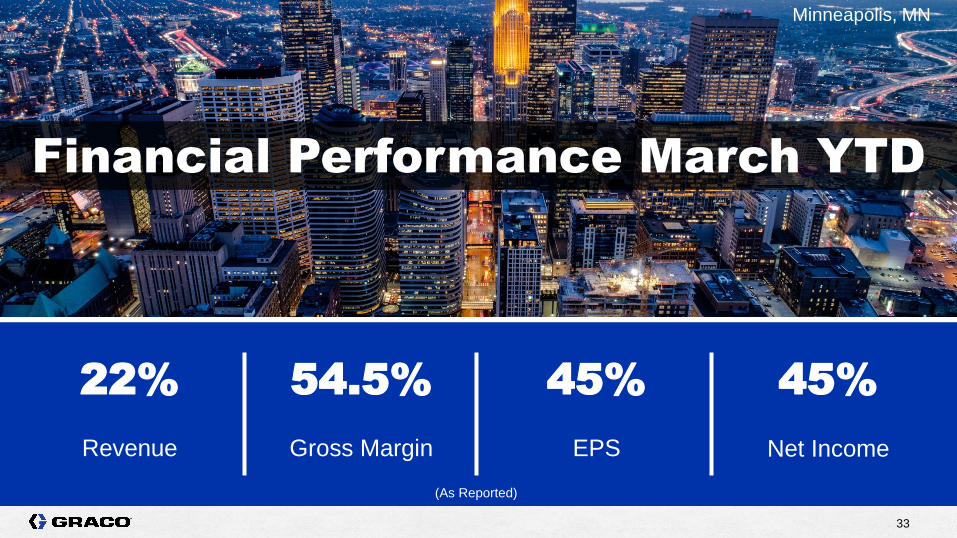
Revenue
22%
Gross Margin
54.5%
EPS
45%
Net Income
45%
Financial Performance March YTD
(As Reported)
Minneapolis, MN
34 34 34 34
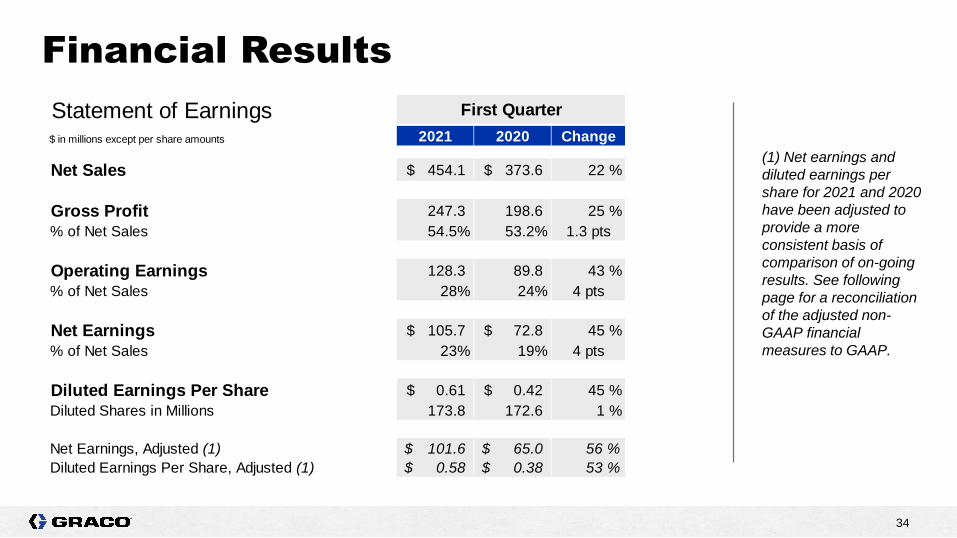
Financial Results
(1) Net earnings and
diluted earnings per
share for 2021 and 2020
have been adjusted to
provide a more
consistent basis of
comparison of on-going
results. See following
page for a reconciliation
of the adjusted non-
GAAP financial
measures to GAAP.
Statement of Earnings First Quarter
$ in millions except per share amounts 2021 2020 Change
Net Sales 454.1$ 373.6$ 22 %
Gross Profit 247.3 198.6 25 %
% of Net Sales 54.5% 53.2% 1.3 pts
Operating Earnings 128.3 89.8 43 %
% of Net Sales 28% 24% 4 pts
Net Earnings 105.7$ 72.8$ 45 %
% of Net Sales 23% 19% 4 pts
Diluted Earnings Per Share 0.61$ 0.42$ 45 %
Diluted Shares in Millions 173.8 172.6 1 %
Net Earnings, Adjusted (1) 101.6$ 65.0$ 56 %
Diluted Earnings Per Share, Adjusted (1) 0.58$ 0.38$ 53 %
35 35 35 35
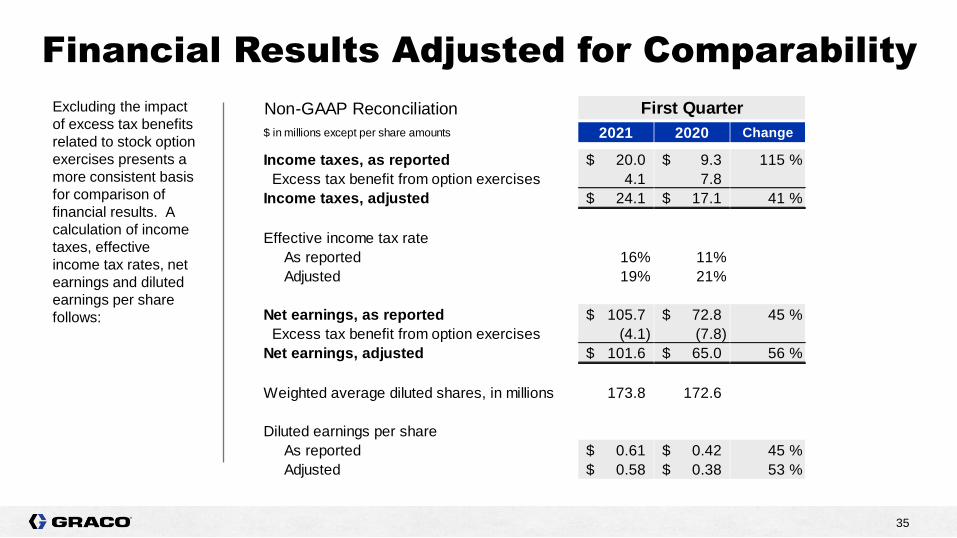
Financial Results Adjusted for Comparability
Excluding the impact
of excess tax benefits
related to stock option
exercises presents a
more consistent basis
for comparison of
financial results. A
calculation of income
taxes, effective
income tax rates, net
earnings and diluted
earnings per share
follows:
Non-GAAP Reconciliation First Quarter
$ in millions except per share amounts 2021 2020 Change
Income taxes, as reported 20.0$ 9.3$ 115 %
Excess tax benefit from option exercises 4.1 7.8
Income taxes, adjusted 24.1$ 17.1$ 41 %
Effective income tax rate
As reported 16% 11%
Adjusted 19% 21%
Net earnings, as reported 105.7$ 72.8$ 45 %
Excess tax benefit from option exercises (4.1) (7.8)
Net earnings, adjusted 101.6$ 65.0$ 56 %
Weighted average diluted shares, in millions 173.8 172.6
Diluted earnings per share
As reported 0.61$ 0.42$ 45 %
Adjusted 0.58$ 0.38$ 53 %

36 36 36 36
First Quarter 2021 Results
Net Sales ► Up 22 percent from 2020, up 18 percent at consistent translation rates
Gross Margin ► Rate up 1.3 percentage points from 2020
Favorable effects of changes in currency translation rates, realized pricing and
higher production volume were partially offset by unfavorable impact of mix
Operating
Earnings
► Operating earnings up $38 million, 43%
Increase in volume driving operating earnings growth
Other Expense ► Decreased $5 million
Driven by market value fluctuations on investments held to fund certain retirement
benefits liabilities
Taxes
► Effective tax rate for the quarter was 16%, up 5 percentage points from
first quarter 2020
Increase in the effective rate due primarily to a decrease in excess tax benefits
related to stock option exercises
37 37 37 37
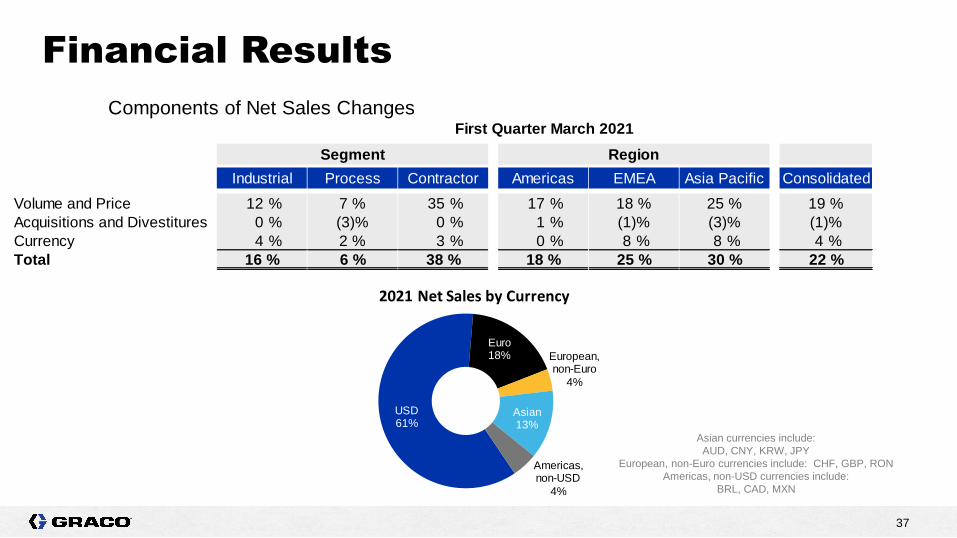
Financial Results
Asian currencies include:
AUD, CNY, KRW, JPY
European, non-Euro currencies include: CHF, GBP, RON
Americas, non-USD currencies include:
BRL, CAD, MXN
Components of Net Sales ChangesFirst Quarter March 2021
Segment Region
Industrial Process Contractor Americas EMEA Asia Pacific Consolidated
Volume and Price 12 % 7 % 35 % 17 % 18 % 25 % 19 %
Acquisitions and Divestitures 0 % (3)% 0 % 1 % (1)% (3)% (1)%
Currency 4 % 2 % 3 % 0 % 8 % 8 % 4 %
Total 16 % 6 % 38 % 18 % 25 % 30 % 22 %
USD61%
Euro18% European,
non-Euro
4%
Asian13%
Americas, non-USD
4%
2021 Net Sales by Currency
38 38 38 38
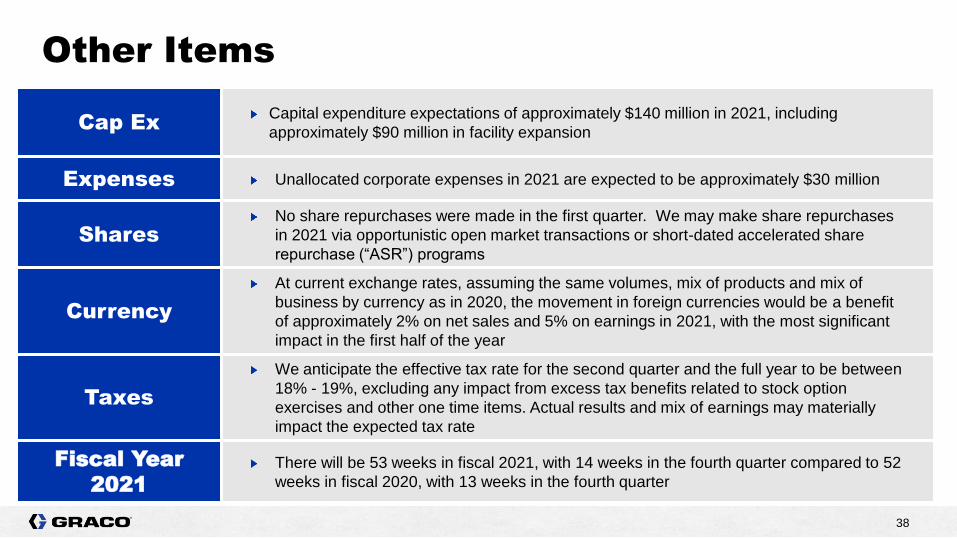
Other Items
Cap Ex Capital expenditure expectations of approximately $140 million in 2021, including
approximately $90 million in facility expansion
Expenses Unallocated corporate expenses in 2021 are expected to be approximately $30 million
Shares No share repurchases were made in the first quarter. We may make share repurchases
in 2021 via opportunistic open market transactions or short-dated accelerated share
repurchase (“ASR”) programs
Currency
At current exchange rates, assuming the same volumes, mix of products and mix of
business by currency as in 2020, the movement in foreign currencies would be a benefit
of approximately 2% on net sales and 5% on earnings in 2021, with the most significant
impact in the first half of the year
Taxes
We anticipate the effective tax rate for the second quarter and the full year to be between
18% - 19%, excluding any impact from excess tax benefits related to stock option
exercises and other one time items. Actual results and mix of earnings may materially
impact the expected tax rate
Fiscal Year
2021 There will be 53 weeks in fiscal 2021, with 14 weeks in the fourth quarter compared to 52
weeks in fiscal 2020, with 13 weeks in the fourth quarter
39 39
Company Overview ▶ 2020 Appendix
/ / / / / / / / / / / / / / / / / /
Financial Summary
40 40 40 40
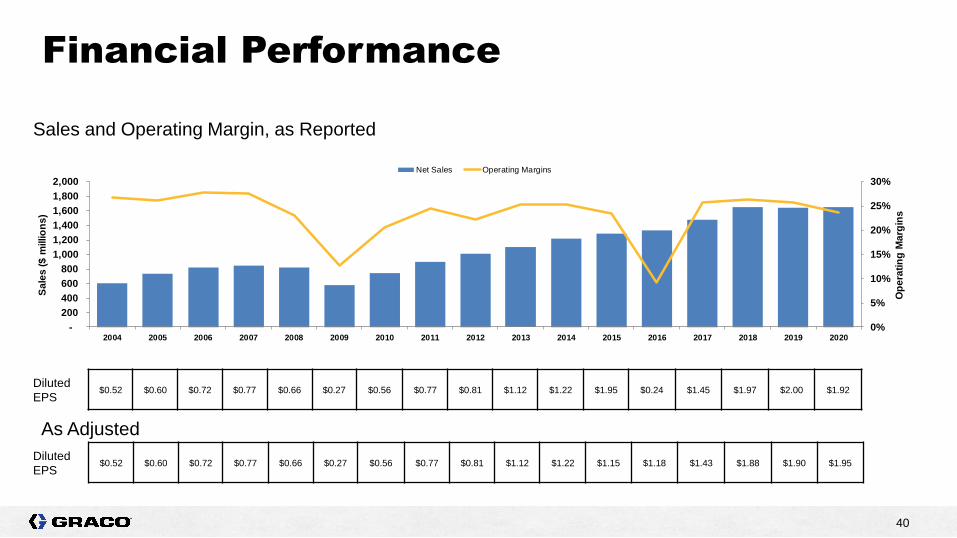
Financial Performance
Sales and Operating Margin, as Reported
Diluted
EPS $0.52 $0.60 $0.72 $0.77 $0.66 $0.27 $0.56 $0.77 $0.81 $1.12 $1.22 $1.95 $0.24 $1.45 $1.97 $2.00 $1.92
Diluted
EPS $0.52 $0.60 $0.72 $0.77 $0.66 $0.27 $0.56 $0.77 $0.81 $1.12 $1.22 $1.15 $1.18 $1.43 $1.88 $1.90 $1.95
As Adjusted
0%
5%
10%
15%
20%
25%
30%
-
200
400
600
800
1,000
1,200
1,400
1,600
1,800
2,000
2004 2005 2006 2007 2008 2009 2010 2011 2012 2013 2014 2015 2016 2017 2018 2019 2020
Op
era
tin
g M
arg
ins
Sa
les
($
millio
ns
)
Net Sales Operating Margins
41 41 41 41
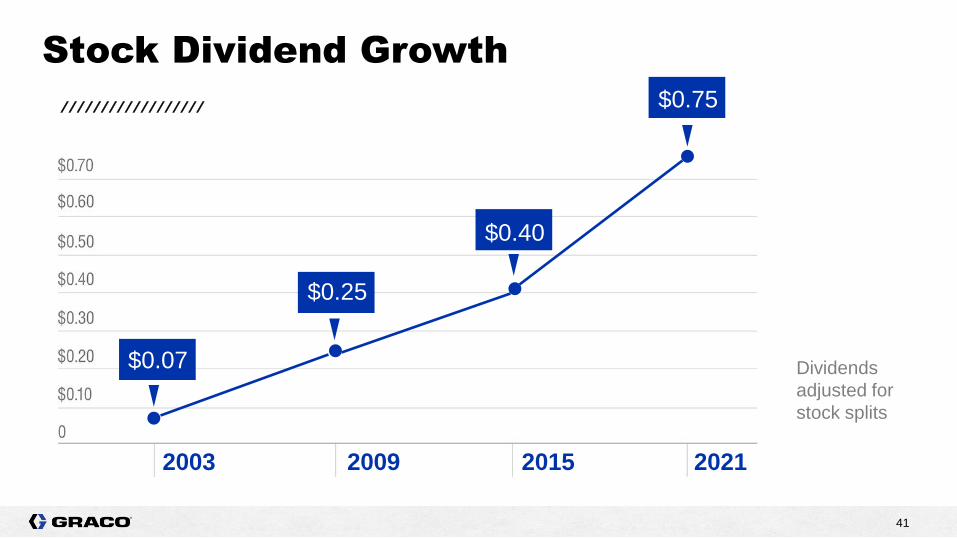
Dividends
adjusted for
stock splits
$0.64
Stock Dividend Growth
$0.70 / / / / / / / / / / / / / / / / / / $0.75
$0.25
$0.07
2003 2009 2015
$0.40
2021

42 42 42 42
Strong Cash Generation
2016 – Impairment of Intangibles, net of tax, charge of $161 million was reflected in net income. $191 million and related change in deferred
taxes ($31) million included in adjustments to reconcile net earnings
2015 – Divestiture of Liquid Finishing Held Separate assets net gain $141 million reflected in net income; effect of taxes on the gain,
transaction costs and Foundation contribution are included in operating cash flows
($ Millions) 2020 2019 2018 2017 2016 2015 2014 2013 2012 2011
Operating Cash Flows 394$ 419$ 368$ 338$ 276$ 190$ 241$ 243$ 190$ 162$
% of Net Income 119% 122% 108% 134% 679% 55% 107% 115% 127% 114%
Capital Expenditures 71 128 54 40 42 42 31 23 18 24
Free Cash Flow 323$ 291$ 314$ 298$ 234$ 148$ 210$ 220$ 172$ 138$
($ Millions) 2020 2019 2018 2017 2016 2015 2014 2013 2012 2011
Dividends 117$ 106$ 89$ 80$ 73$ 69$ 66$ 61$ 54$ 51$
Acquisitions 28 27 11 28 49 189 185 12 667 2
Share Repurchases * 21 (38) 236 54 18 256 165 26 (29) 21
95$ 95$ 336$ 162$ 140$ 514$ 416$ 99$ 692$ 74$
* Net of shares issued

43 43 43 43
Capital Efficiency – 5 Year Average
/ / / / / / / / / / / / / / / / / /
Note: 5 year average
includes adjustment for
2016 impairment charge
Source: S&P Capital IQ
Peer Group: CSL, NDSN, IEX, DOV, IR
44 44
Move | Measure | Mix | Control | Dispense | Spray
WORLDWIDE LEADERS IN FLUID HANDLING
www.graco.com
44