investor presentation - ahipreit.com · 5 well positioned for the economic environment daily...
TRANSCRIPT

Investor PresentationTSX: HOT.UN (CAD$) TSX: HOT.U (US$) TSX: HOT.DB.U (Debentures)
March 2018 (Q4 2017 Information)

Forward Looking StatementsThis corporate update is a summary and should be read together with the more detailed information, financial data and statements made available by American Hotel Income Properties REIT LP (the “REIT”). This corporate update contains forward-looking statements which reflect management’s expectations regarding objectives, plans, goals, strategies, future growth, results of operations, performance and business prospects and opportunities of the REIT. The words “plans”, “expects”, “scheduled”, “estimates”, “intends”, “anticipates”, “projects”, “believes” or variations of such words and phrases or statements to the effect that certain actions, events or results “may”, “will”, “could”, “would”, “might”, “occur”, “be achieved” or “continue” and similar expressions identify forward-looking statements. Some of the specific forward- looking statements in this corporate update include, but are not limited to, statements with respect to the ability of the REIT to execute its growth strategies; the expected tax treatment of the REIT and of the REIT’s distribution to Unitholders; the expected growth in the U.S. lodging industry and trends; and other considerations which are outlined in the REIT’s Annual Information Form dated March 27, 2017. Forward-looking statements are necessarily based on a number of estimates and assumptions that, while considered reasonable by management of the REIT as of the date of this corporate update, are inherently subject to significant business, economic and competitive uncertainties and contingencies. The REIT’s estimates, beliefs and assumptions, which may prove to be incorrect, include the various assumptions set forth herein, including, but not limited to the REIT’s future growth potential, results of operations, future prospects and opportunities, industry trends remaining unchanged, no change in legislative or regulatory matters, future levels of indebtedness, the tax laws as currently in effect remaining unchanged, the continual availability of capital and the current economic conditions remaining unchanged. When relying on forward-looking statements to make decisions, the REIT cautions readers not to place undue reliance on these statements, as forward-looking statements involve significant risks and uncertainties, should not be read as guarantees of future performance or results, and will not necessarily be accurate indications of whether or not the times at or by which such performance or results will be achieved. A number of factors could cause actual results to differ materially from the results discussed in the forward-looking statements, including, but not limited to, the factors discussed under the “Risk Factors” in the REIT’s latest Management’s Discussion and Analysis. The forward-looking information contained herein is made as of March 15, 2018 and, except as expressly required by applicable law, the REIT assumes no obligation to publicly update or revise such information.
All figures presented are in U.S. dollars, unless otherwise stated.

3
Company Overview
115 Hotels; 11,708Rooms
33States; 92 Cities
53.9% Debt-to-Gross Book Value
10.0% Yield
American Hotel Income Properties REIT LP (“AHIP”)
▪ Invests in high-quality premium branded hotel properties, primarily in the Upscale to Upper-Upscale chains, including such brands as Residence Inn (by Marriot), Hampton Inn and Suites (by Hilton) and Holiday Inn Express (by IHG).
▪ Hotel properties are located across the U.S. , primarily in secondary markets (such as Cincinnati or Baltimore) that benefit from multiple demand generators, including business parks, sports arenas, medical centres, universities and interstates/airports
▪ In addition, AHIP’s Economy Lodging portfolio provides accommodations for guests in more remote locations and caters to the lodging needs of railway crews along major rail lines.
Properties are purchased with an average 8% cap rate using long-term fixed-rate debt that averages 4.61%.

AHIP provides a $0.051 USD monthly cash distribution to unitholders, equivalent to USD $0.648 per unit on an annualized basis.
▪ All units receive USD cash distributions, regardless of whether the units were purchased using our Canadian dollar listing (TSX: HOT.UN) or USD listing (TSX: HOT.U, OTC:AHOTF)
Equivalent to a 10% yield¹ - one of the highest in the Canadian and US REIT sector
The increasing value of the US dollar relative to the Canadian dollar benefits Canadian unitholders
▪ AHIP generates its revenue and income in USD, and provides its monthly cash distribution to unitholders in USD.
▪ Canadian investors have benefited from a 3.9% increase in the USD relative to the Canadian dollar since January 1, 2018²
Monthly USD cash distributions
4(1) Based on March 15, 2018 HOT.UN trading price of $8.05 CAD(2) 1.2517 USD/CAD rate as of Jan 1, 2018 to 1.3010 USD/CAD on March 15, 2018
American Hotel Income Properties trades in both the Canadian dollar (HOT.UN) and U.S. dollar (HOT.U) on the TSX. Regardless of which ticker unitholders invest through, AHIP provides its monthly cash distributions in U.S. dollars.

5
Well positioned for the economic environment
Daily guestroom rates can change daily, to mitigate any inflationary risk
▪ Unlike other REIT sectors where revenue is derived from long-term leases, hotel REITs provide anatural inflationary hedge due to the daily pricing adjustments of guestroom rates
▪ Revenue management allows our hotel manager to price rooms inventory according to daily changes in demand and room rate trends
Long-term, fixed rate debt structure shields AHIP from short-term changes in interest rates
▪ AHIP has an average term remaining on its mortgages of 7.6 years, and a weighted average loan face interest rate of 4.61%
▪ No significant debt maturities until June 2022
$0
$50
$100
$150
$200
$250
2018 2019 2020 2021 2022 2023 2024 2025 2026 2027
DEBT MATURITY LADDER (millions) Mortgages Convertible Debentures

Driving long-term returns and cash flow
Driving RevPAR (Revenue per available room) growth through:
▪ Revenue management (demand management)
▪ Hotel upgrades and renovations (PIP projects)
▪ Enhanced marketing and distribution (through brand partners such as Wyndham Hotel Group)
Investing in our hotels to make them best in class and drive higher market share and demand
▪ $20 million of pre-funded hotel upgrades/renovations (referred to as Property Improvement Plans, or PIPs) scheduled to occur during 2018
▪ Additional $10+ mil of PIP projects to occur in 2019
▪ By the end of 2020, 81% of AHIP’s Premium Branded hotels will have been recently renovated
Have introduced an internal asset management team
▪ Department is charged with overseeing and enhancing the performance of the hotel portfolio to drive strongerreturns for unitholders
▪ Working closely with AHIP’s external hotel manager, the Asset Management team monitors the supply and demand dynamics of specific hotel markets to ensure that each property is consistently well positioned to maximize profitability
▪ Developing long-term strategic plans for each hotel property, including all hotel upgrades and PIP projects
6
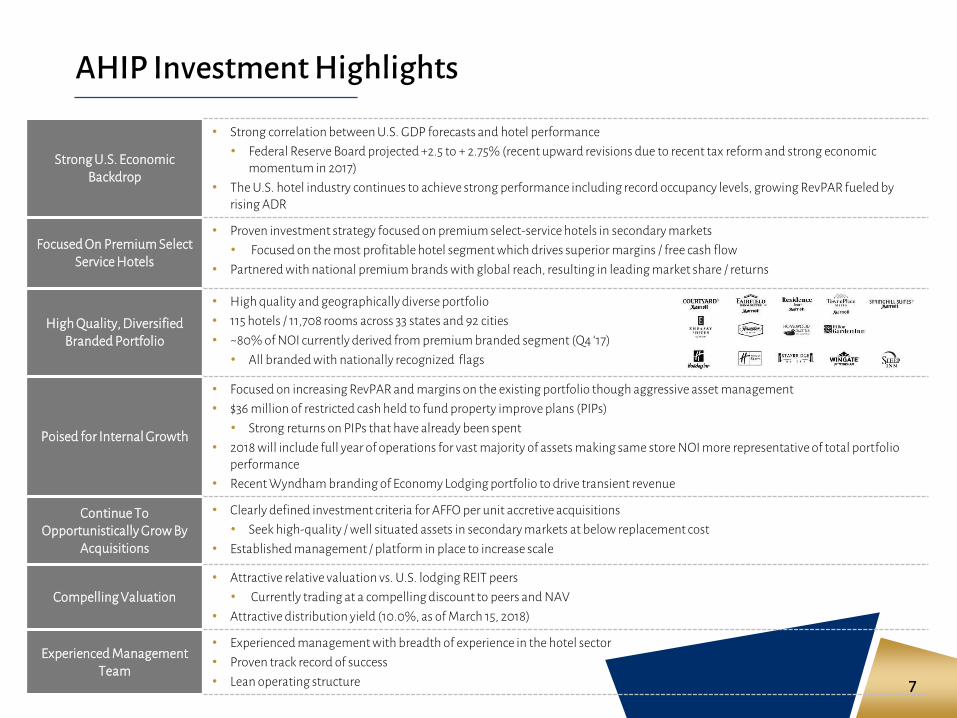
AHIP Investment Highlights
7
Strong U.S. Economic Backdrop
• Strong correlation between U.S. GDP forecasts and hotel performance
• Federal Reserve Board projected +2.5 to + 2.75% (recent upward revisions due to recent tax reform and strong economic momentum in 2017)
• The U.S. hotel industry continues to achieve strong performance including record occupancy levels, growing RevPAR fueled by rising ADR
Focused On Premium Select Service Hotels
• Proven investment strategy focused on premium select-service hotels in secondary markets
• Focused on the most profitable hotel segment which drives superior margins / free cash flow
• Partnered with national premium brands with global reach, resulting in leading market share / returns
High Quality, Diversified Branded Portfolio
• High quality and geographically diverse portfolio
• 115 hotels / 11,708 rooms across 33 states and 92 cities
• ~80% of NOI currently derived from premium branded segment (Q4 ‘17)
• All branded with nationally recognized flags
Poised for Internal Growth
• Focused on increasing RevPAR and margins on the existing portfolio though aggressive asset management
• $36 million of restricted cash held to fund property improve plans (PIPs)
• Strong returns on PIPs that have already been spent
• 2018 will include full year of operations for vast majority of assets making same store NOI more representative of total portfolio performance
• Recent Wyndham branding of Economy Lodging portfolio to drive transient revenue
Continue ToOpportunistically Grow By
Acquisitions
• Clearly defined investment criteria for AFFO per unit accretive acquisitions
• Seek high-quality / well situated assets in secondary markets at below replacement cost
• Established management / platform in place to increase scale
Compelling Valuation
• Attractive relative valuation vs. U.S. lodging REIT peers
• Currently trading at a compelling discount to peers and NAV
• Attractive distribution yield (10.0%, as of March 15, 2018)
Experienced Management Team
• Experienced management with breadth of experience in the hotel sector
• Proven track record of success
• Lean operating structure

Strong U.S. Economic Backdrop
• U.S. tax reform expected to drive further GDP growth
• Oxford Economics sees a +0.4% increase to GDP from tax reform alone, bringing their forecast 2018 U.S. GDP growth to 2.8%
• Tax reform expected to drive increased demand and U.S. hotels and corresponding gains in guest spending².
• Gains are expected to exceed those for the broader economy as both leisure and corporate travel more directly benefit from increased consumer and corporate spending²
• STR forecasts for 2018¹:
• ADR increase of +2.4%
• Revenue per available room growth of + 2.7%
• Increased supply across most markets will be largely offset by strong occupancy forecasts
• Potential for inflation
• AHIP could have opportunity to raise ADR each night (‘rent’ is determined real time considering supply/demand and economic factors)
8¹ STR Forecasts provided in January 2018² Oxford Economics (parent company of Tourism Economics), data a result of an analysis completed for the American Hotel and Lodging Association

Quality Branded Hotel Portfolio
• AHIP has strategically grown its portfolio since IPO with a focus on increasing the quality and size of the assets that it owns, purchasing hotels in larger markets and geographically diversifying its asset base
9
HOTEL PORTFOLIO EVOLUTION
Portfolio composition (by NOI)
RevPAR $46.38¹ $71.20
ADR $53.87¹ $95.32
Portfolio size 32 hotels / 2,565 rooms 115 hotels / 11,708 rooms
Average # of rooms per hotels 80 115
Average value per hotel $4.9 million $14.4 million
AT TIME OF IPO TODAY (Annual, or as at Dec. 31, 2017)
¹ As disclosed at IPO
Premium Branded
Economy Lodging
Rail Hotels
100% Rail80%
20%

Brand Diversity
10
World-class brand partners with global distribution, effective brand segmentation, guest loyalty programs and premier system standards
• Strong national and regional sales, revenue management and operational teams to drive increased revenue
• External hotel management team with extensive experience to drive margin growth
• Capital reinvestment and asset preservation to increase market share and long-term value creation
67 Premium Branded hotels; 7,684 guestroomsNOI, 80%
NOI, 20%
Premium Branded Hotels
Economy Lodging Hotels
*Net Operating Income (NOI) for Q4 2017
PREMIUM BRANDED HOTELS COMPRISE 80% OF OUR NOI*
46 Economy Lodging hotels; 4,024 guestrooms¹
Favourable contract terms
• Royalty fee carveouts related to AHIP’s existing rail crew contract revenue• Advantageous fee schedule for first several years of the 15-year contract
Many benefits to drive stronger performance at AHIP’s Economy Lodging hotels
• Expect to draw more transient guests
• Stronger brand recognition
• Access to Wyndham’s worldwide reservations network
• Ability to offer guests access to Wyndham’s award-winning rewards program
• Ability to drive higher occupancy for rooms otherwise not used by rail crew contract guests
On Nov. 1, 2017, AHIP announced an agreement to rebrand 46 (all) of our Economy Lodging Hotels under Wyndham hotel brands
PREMIUM BRANDED HOTELS BRANDS
ECONOMY LODGING HOTELS BRANDS
¹ Additional two properties owned are not currently open

Why U.S. Secondary Markets? Why Select Service Hotels?
11
0.0 1.0 2.0 3.0 4.0 5.0
Primary Secondary Markets
Economic Outlook
• GDP forecasts are the highest correlation to performance of the U.S. hotel industry
• The U.S. Federal Reserve Board projects 2.5% to2.75%+ GDP growth in 2018; Oxford Economics projects 2.8% growth
• The U.S. hotel industry continues to achieve strong performance including record occupancy levels, growing RevPAR fueled by rising ADR
Area of Opportunity3.4M guestrooms
U.S.
Canada
U.S. Secondary Markets
• Includes cities such as Cincinnati and Baltimore
• 3.4 million guestrooms (vs 1.6 in Primary markets)
• Deep pipeline of high quality assets
• Strategically located within or near large population centres (>2M pop.), transportation corridors and demand generators
Select Service Hotel Advantages
• Strong consumer demand and broad appeal
• Simple, efficient operational model
• Higher margins with lower volatility
Million guestrooms
400,000 guestrooms
1. Source: CBRE Hotels’ Americas Research - Hotel Horizons® March 2017 – May 2017, STR2. Source: STR Inc., Tourism Econometrics
Top 6 Cities
Top 25 Cities
GUESTROOMS BY COUNTRY / MAJOR CITIES

Poised for Internal Growth
Hotel portfolio to benefit from strong U.S. economy and expected impact of U.S. tax reform
• Oxford Economics predicts an o.4% incremental U.S. GDP growth due to tax changes, bringing forecast GDP growth to +2.8% in 2018
• Oil and Gas regions in the U.S. are seeing meaningful improvement from prior years
• AHIP’s Premium Branded Oklahoma hotels have seen a 26.5% increase in RevPAR in Q4 2017 relative to Q4 2016
• Wyndham brand agreement expected to drive incremental transient guest business to our Economy Lodging hotels
• 2017 AFFO per unit impacted by timing differential of capital raised and deployed• Closing of financings and closing of acquisitions
• Overallotment options
• PIP programs: US$36 million of undeployed pre-funded PIP capital is with lenders and not generating incremental returns.
• Cash will be deployed during 2018 and 2019 for scheduled renovations.
• Once deployed over the next 12-24 months, this restricted cash is expected to have a slightly positive impact on FFO per share, assuming an 8% yield (the acquisition all-in Cap rate)
• PIP program in process
• While PIP programs are scheduled to have as minimal impact as possible, some displacement will occur in the short term; however, these renovations are expected to drive better long-term results and market share
12

AFTER
BEFORE
Capital Investment & Renovation History
13
Current Reserve Funds allow AHIP to complete scheduled PIPs over the next 24 months with minimal disruption to AFFO and the payout ratio.
$12,200 $13,200
$25,000
$36,100 $35,800 $35,600
$17,100
$0
$5,000
$10,000
$15,000
$20,000
$25,000
$30,000
$35,000
$40,000
YE 2015 YE 2016 Q1 2017 Q2 2017 Q3 2017 Q4 2017 2018E
RESERVE FUND (’000)
$36 million of restricted cash held on deposit for upcoming PIP renovations in 2018 & 2019.
• No need to raise additional capital for upcoming hotel renovations
• Cash on deposit is not return generating until deployed for hotel improvements
The Residence Inn Pittsburgh Cranberry received a comprehensive, high-impact renovation. $3.3 million invested into 96 guestroom improvements and extensive lobby and common area renovations. These investments positioned hotel to be one of the most competitive hotels within the market.
10.1%RevPAR Growth
13.9%Market Share Gain¹
¹ March 2015 vs. March 2014
AFTER
BEFORE
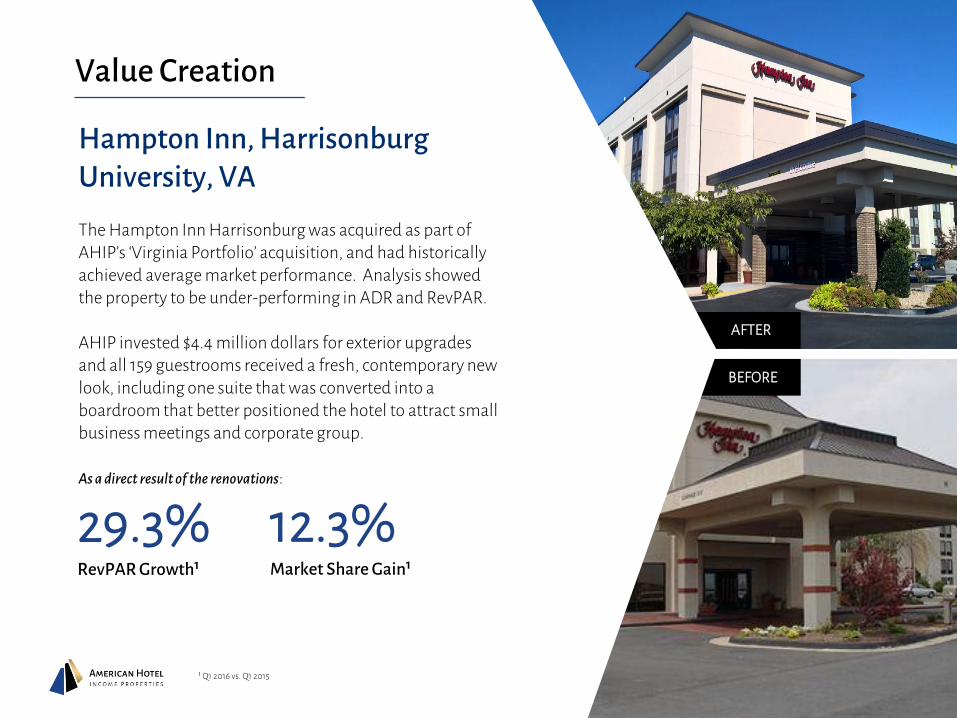
Hampton Inn, Harrisonburg University, VA
The Hampton Inn Harrisonburg was acquired as part of AHIP’s ‘Virginia Portfolio’ acquisition, and had historically achieved average market performance. Analysis showed the property to be under-performing in ADR and RevPAR.
AHIP invested $4.4 million dollars for exterior upgrades and all 159 guestrooms received a fresh, contemporary new look, including one suite that was converted into a boardroom that better positioned the hotel to attract small business meetings and corporate group.
As a direct result of the renovations:
29.3%RevPAR Growth¹
12.3%Market Share Gain¹
Value Creation
14¹ Q1 2016 vs. Q1 2015

Investment Case Study: Virginia Portfolio
15
Four hotels were acquired in Virginia in November 2013 for a purchase price of US$37.1 million and US$7.6 million of PIPs & reserve
VIRGINIA ACQUISITION: PIPS AND PERFORMANCE(Capex in US$000’s)
AVG. REVPAR INDEX PER YEAR: VIRGINIA ACQUISITION (Market share measure in region of hotel. 100 = ‘average’ market share )
• Portfolio consists of 3 Hampton Inns and 1 Fairfield Inn & Suites• 402 guestrooms in total
• First year after acquisition usually involves higher levels of renovations = temporary impact on ANOI (displacement, construction)
• New supply in markets can at times impact RevPAR and ANOI
• AHIP and its hotel manager can use PIPs defensively to drive market share in these situations
4,471
215
2,9452,544
3%
27%
-10%
6%
-15%
-10%
-5%
0%
5%
10%
15%
20%
25%
30%
0
500
1,000
1,500
2,000
2,500
3,000
3,500
4,000
4,500
5,000
2015 2016 2017 3-yr AnnualAverage
Capex ANOI per key - Annual growth
133
137
131
100
105
110
115
120
125
130
135
140
2015 2016 2017
HAMPTON INN, HARRISONBURG SOUTH
New supply entered hotel markets in 2017
New supply entered hotel markets in 2017

Investment Case Study: NC & GA Portfolio
16
Four hotels were acquired in North Carolina and Georgia in July 2014 for a purchase price of US$30.5 million and US$1.8 million of PIPs & reserve
$927
$249
$617 $598
-20%
37%
7% 5%
-30%
-20%
-10%
0%
10%
20%
30%
40%
0
100
200
300
400
500
600
700
800
900
1,000
2015 2016 2017 3-yr AnnualAverage
Capex ANOI per key - Annual growth
108
111
113
100
102
104
106
108
110
112
114
116
2015 2016 2017
NC & GA ACQUISITION: PIPS AND PERFORMANCE(Capex in ‘000)
AVG. REVPAR INDEX PER YEAR: NC & GA ACQUISITION (Market share measure in region of hotel. 100 = ‘average’ regional market share)
• Portfolio consists of 2 Fairfield Inn & Suites, 1 Hampton Inn, 1 Springhill Suites• 387 guestrooms in total
• First year after acquisition usually involves higher levels of renovations = temporary impact on ANOI (displacement, construction)
• Following years benefit from the upgrades (increased market share and ANOI)
FAIRFIELD INN & SUITES, KINGSLAND, GA
$252
$1,748
$3,161
$1,7208%
18%
-1%
8%
-5%
0%
5%
10%
15%
20%
25%
0
500
1,000
1,500
2,000
2,500
3,000
3,500
2015 2016 2017 3-yr AnnualAverage
Capex ANOI per key - Annual Growth
Investment Case Study: NC & FL Portfolio
17
Four hotels were acquired in North Carolina and Florida in November 2014 for a purchase price of US$41.0 million and US$6.9 million of PIPs & reserve
NC & FL ACQUISITION: PIPS AND PERFORMANCE(Capex in ‘000)
AVG. REVPAR INDEX PER YEAR: NC & FL PORTFOLIO ACQUISITION (Market share measure in region of hotel. 100 = ‘average’ market share)
• Portfolio consists of 2 Fairfield Inn & Suites, 1 Hampton Inn, 1 Courtyard• 353 guestrooms in total
• First year after acquisition usually involves higher levels of renovations = temporary impact on ANOI (displacement, construction)
• New supply in markets can at times impact RevPAR and ANOI
• AHIP and its hotel manager can use PIPs defensively to drive market share in these situations
137 138 138
100
105
110
115
120
125
130
135
140
145
2015 2016 2017
HAMPTON INN, STATEVILLE, NC
Maintained strong market share in spite of new supply
New supply entered hotel markets in 2017

Selective and Opportunistic Acquisition Strategy
18
AHIP seeks to acquire properties that meet the following criteria:
• Accretive to AFFO per unit
• Stabilized in-place income
• All-in trailing capitalization rate >8% (all in, fully-loaded, including PIP costs)
• Acquisition cost below replacement cost
• Strong demand generators
• Limited new supply
• Complement existing premium branded, select-service hotels
• Targeted geographic diversification within secondary U.S. markets

Experienced Management Team
19
Rob O’NeillChief Executive Officer
Ian McAuleyPresident
Azim LalaniChief Financial Officer
Anne YuVice President, Finance
▪ Hotel industry veteran ▪ Co-Founder of Coast Hotels and O’Neill Hotels & Resorts▪ Founder of CHIP REIT, which was subsequently sold to B.C. Investment Management Corp. for C$1.2 billion
▪ Co-Recipient of the Canadian Hotel Industry Entrepreneur of the Year Award from the Canadian Hotel Investment Conference
▪ President and CEO of Continuum Health Care Holdings Ltd. which was sold▪ Co-Founder, President and Chief Operating Officer of Superior Lodging Corp., Recipient of Hotelier Magazine’s Pinnacle
Awards – Company of the Year▪ Co-Founder and partner in InnVentures Hospitality Corp., a Vancouver-based boutique hotel management and
consulting firm
▪ More than 20 years of experience in financial reporting, corporate finance, operations, business valuation, taxation and risk management
▪ Senior Vice President of Operations for two TSX-listed commercial REITs▪ Vice President of Real Estate and Risk Management at SilverBirch Hotels & Resorts▪ Audit Manager at KPMG
▪ More than 15 years experience in financial reporting, internal controls, corporate finance and Canadian and US tax. ▪ Manager at Pricewaterhouse Coopers▪ Controller and Manager of Financial Reporting of Sterling Shoes Inc. ▪ Controller of Ventyx Software Solutions Inc. (formerly MDSI Mobile Data Solutions Inc.)
Executive team has over 95 years of collective real estate investing experience

Financial HighlightsAs at Q4 2017
20

89.2%83.4%
90.9%
40.0%
60.0%
80.0%
100.0%
120.0%
Q1 2015 Q2 2015 Q3 2015 Q4 2015 2015 Q1 2016 Q2 2016 Q3 2016 Q4 2016 2016 Q1 2017 Q2 2017 Q3 2017 Q4 2017 2017
Seasonality and AFFO Payout Ratio
28.6%30.2% 29.6%
20.0%
25.0%
30.0%
35.0%
Q1 2015 Q2 2015 Q3 2015 Q4 2015 2015 Q1 2016 Q2 2016 Q3 2016 Q4 2016 2016 Q1 2017 Q2 2017 Q3 2017 Q4 2017 2017
Seasonality and EBITDA Margin
Seasonal impacts on performance
21
Hotels REITs are more seasonal that other real estate investment trusts/sectors
AHIP is best reviewed and evaluated on an annual basis to account for seasonal changes
• Revenue and EBITDA margin is typically much higher in Q2 and Q3 than in Q1 and Q4, therefore AFFO payout ratio also sees fluctuations (due to stable monthly distributions and seasonally affected AFFO)

Track Record of Growth (USD$)
22
$220,031
$65,759
$48,052
$93,143
$143,767
$173,515
$303,710
$-
$50,000
$100,000
$150,000
$200,000
$250,000
$300,000
$350,000
2013 2014 2015 2016 2017
REVENUE GROWTH ($'000)
$11,183
$24,427
$41,175
$52,355
$89,761
$-
$15,000
$30,000
$45,000
$60,000
$75,000
$90,000
$105,000
2013 2014 2015 2016 2017
EBITDA GROWTH ($'000)

Financial Highlights (USD$)
23
Q4 2017Three months ended
December 31, 2017
Q4 2016Three months ended
December 31, 2016
201712 months ended
December 31, 2017
201612 months ended
December 31, 2016
Number of Guestrooms 11,708 8,156 11,708 8156
Revenue (‘000) $82,222 $44,346 $303,710 $173,515
EBITDA (‘000) $20,435 $12,072 $89,761 $52,355
EBITDA Margin 24.9% 27.2% 29.6% 30.2%
FFO per diluted unit $0.17 $0.19 $0.82 $0.92
AFFO per diluted unit $0.14 $0.17 $0.70 $0.80
AFFO Payout Ratio 115.1% 103.5% 90.9% 83.4%
Debt/Gross Book Value 53.9% 44.0%
WA Loan Interest Rate 4.61% 4.59%
WA Loan Term 7.59 years 7.70 years

Appendices
24
• Geographic diversity – map of properties
• Portfolio Growth – by Guestrooms
• 2018 PIP schedule

Geographic Diversity based on Demand
Consistent with AHIP’s investment strategy, all properties are strategically located within or near:
▪ Larger population centers
▪ Transportation corridors
▪ Demand generators
115 hotels in 92 cities totaling 11,708 guestrooms
25
Economy Lodging HotelsPremium Branded Hotels

11,708Guestrooms (As at Q4 2017)
8.5%CAGR since Q1 2013
44%Growth since Q4 2016
Portfolio Growth – Total Guestrooms
26
2,50
5
2,56
4
2,64
1
3,11
3
3,51
6
3,57
1
3,95
8 5,11
9
5,22
8
5,86
0
6,79
7
6,91
5
7,0
48
7,0
95
7,11
9 8,15
6 9,38
3
11,5
70
11,5
70
11,7
08
-
2,000
4,000
6,000
8,000
10,000
12,000
14,000
GUESTROOM GROWTH

Upcoming PIP projects
27
Scheduled Renovation Dates
Hotel Name and Guestrooms Q1 2018 Q2 2018 Q3 2018 Q4 2018
Embassy Suites Cincinnati (227 guestrooms) X X
Embassy Suites DFW South (305 guestrooms) X X
Hilton Garden Inn White Marsh (155 guestrooms) X
Staybridge Suites Tampa East/Brandon (100 guestrooms) X
Residence Inn Baltimore White Marsh (131 guestrooms) X
Embassy Suites Columbus (284 guestrooms) X X
Fairfield Inn & Suites Jacksonville (89 guestrooms) X
Residence Inn Chattanooga (109 guestrooms) X
Homewood Suites Dover Rockaway (108 guestrooms) X
Homewood Suites Allentown (108 guestrooms) X
Homewood Suites Bethlehem (113 guestrooms) X
The following hotel properties are scheduled to undergo PIP projects estimated to be more than US$500,000 in 2018:

28
ahipreit.com
(604) 630-3134
800-925 West Georgia Street Vancouver, BC V6C 3L2 Canada
Questions? Please contact us at: