investor presentation · package as a professional securities ... 1 206 1 229 2012 2013 2014 2015...
TRANSCRIPT

Investor presentation

Contents
Financial results, capital 2
Funding , liquidity
Loan portfolio
3
4
Appendix: Ural region, RCC 5
Credit highlights, history 1
Credit highlights
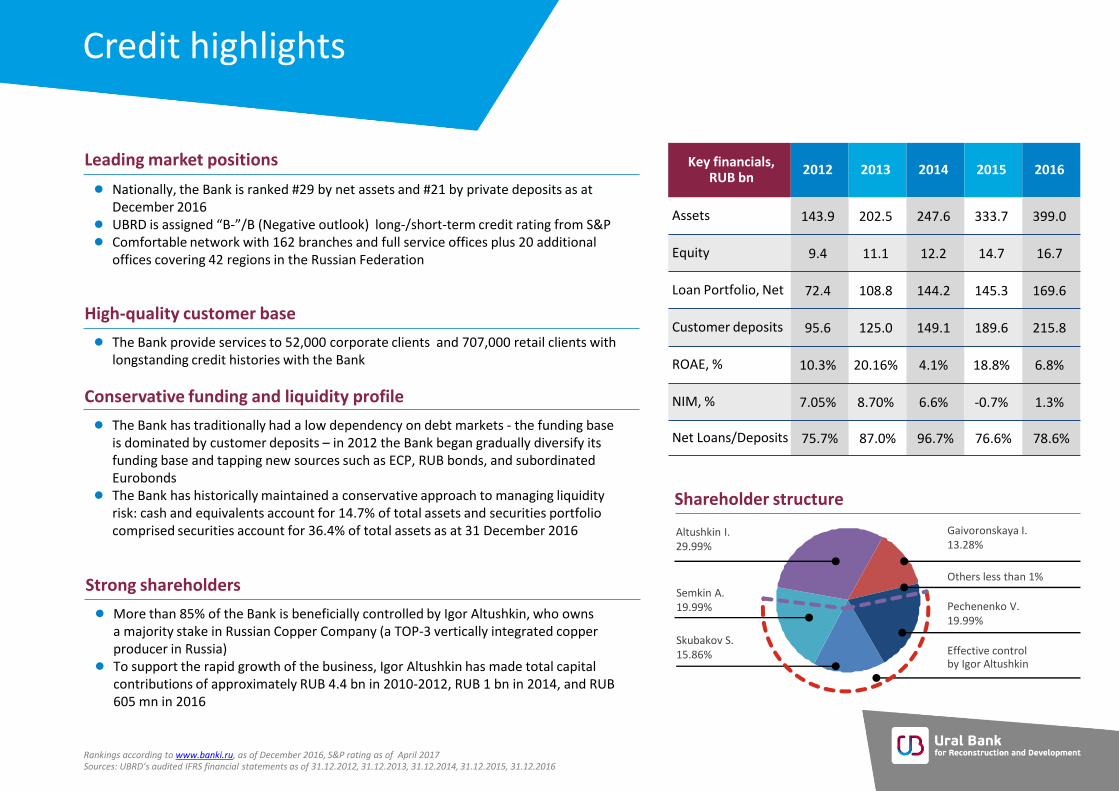
● Nationally, the Bank is ranked #29 by net assets and #21 by private deposits as at December 2016
● UBRD is assigned “B-”/B (Negative outlook) long-/short-term credit rating from S&P ● Comfortable network with 162 branches and full service offices plus 20 additional
offices covering 42 regions in the Russian Federation
Leading market positions
● The Bank has traditionally had a low dependency on debt markets - the funding base is dominated by customer deposits – in 2012 the Bank began gradually diversify its funding base and tapping new sources such as ECP, RUB bonds, and subordinated Eurobonds
● The Bank has historically maintained a conservative approach to managing liquidity risk: cash and equivalents account for 14.7% of total assets and securities portfolio comprised securities account for 36.4% of total assets as at 31 December 2016
Conservative funding and liquidity profile
● More than 85% of the Bank is beneficially controlled by Igor Altushkin, who owns a majority stake in Russian Copper Company (a TOP-3 vertically integrated copper producer in Russia)
● To support the rapid growth of the business, Igor Altushkin has made total capital contributions of approximately RUB 4.4 bn in 2010-2012, RUB 1 bn in 2014, and RUB 605 mn in 2016
Strong shareholders
● The Bank provide services to 52,000 corporate clients and 707,000 retail clients with longstanding credit histories with the Bank
High-quality customer base
Altushkin I. 29.99%
Key financials, RUB bn
2012 2013 2014 2015 2016
Assets 143.9 202.5 247.6 333.7 399.0
Equity 9.4 11.1 12.2 14.7 16.7
Loan Portfolio, Net 72.4 108.8 144.2 145.3 169.6
Customer deposits 95.6 125.0 149.1 189.6 215.8
ROAE, % 10.3% 20.16% 4.1% 18.8% 6.8%
NIM, % 7.05% 8.70% 6.6% -0.7% 1.3%
Net Loans/Deposits 75.7% 87.0% 96.7% 76.6% 78.6%
Shareholder structure
Rankings according to www.banki.ru, as of December 2016, S&P rating as of April 2017 Sources: UBRD’s audited IFRS financial statements as of 31.12.2012, 31.12.2013, 31.12.2014, 31.12.2015, 31.12.2016
Effective control by Igor Altushkin
Semkin A. 19.99%
Gaivoronskaya I. 13.28%
Pechenenko V. 19.99%
Others less than 1%
Skubakov S. 15.86%

UBRD History
2012 Introduction of a new strategy aimed at strengthening market position, increasing profitability and developing new products
Capital contribution of RUB 2.0 bn by controlling shareholder
2013 UBRD entered international debt capital market with USD200 mn ECP programme
Debut Subordinated Eurobond issue of USD68 mn
2014 Capital contribution of RUB 1,044 by controlling shareholder
Enters TOP-30 leading Russian banks by CBR
2015 UBRD acquires 99.99% of Yekaterinburg-based Vuz Bank
2016 New 2020 Strategy adopted: focus on quality of business processes, products and services , measured approach to each client segment
1990–2004
1990 UBRD started providing banking services to commercial and retail customers in the Ural region
1993 Became the first commercial bank in the Sverdlovsk region to receive a general CBR license. The same year UBRD became the first regional bank to join SWIFT
2000 The Bank received a FCSM1 license
package as a professional securities market participant
UBRD became a member of International Payment Systems MasterCard Europe and VISA International
2002 UBRD conversion into Open Joint Stock Company registered by the CBR
2004 As a result of a strategic merger between UBRD and Sverdlsotsbank, UBRD became the largest commercial bank in the Sverdlovsk region
2005 Debut RUB local bond issuance by a 100%-owned subsidiary – UBRD-Finance with UBRD’s guarantee
2006 UBRD became a member of the Association of Russian Banks
Status of the Bank in VISA Int. system promoted to Principal Member
2007 Subordinated loan from ABN AMRO BANK NV in the amount of $50 mn for 10 years
2008 UBRD entered the Ural Chamber of Commerce
2010 RUB 0.5 bn capital injection by
controlling shareholder
2011 Controlling shareholder made a 1.86 bn capital contribution
2005–2011 2012–2016
1Federal Commission for the Securities Market

Multichannel sales network
Branches and full service offices dynamics
Additional offices dynamics
ATM network dynamics
42
● UBRD’s regional network includes multifunctional offices and ATMs in 42 regions of Russia
● 707,000 active retail & 52,000 active corporate clients
regions
900 1 121
1 329 1 206 1 229
2012 2013 2014 2015 2016
118
167 150 161 162
2012 2013 2014 2015 2016
286
442
208
19 20
2012 2013 2014 2015 2016
Financial results and capital
Investor presentation | 2016
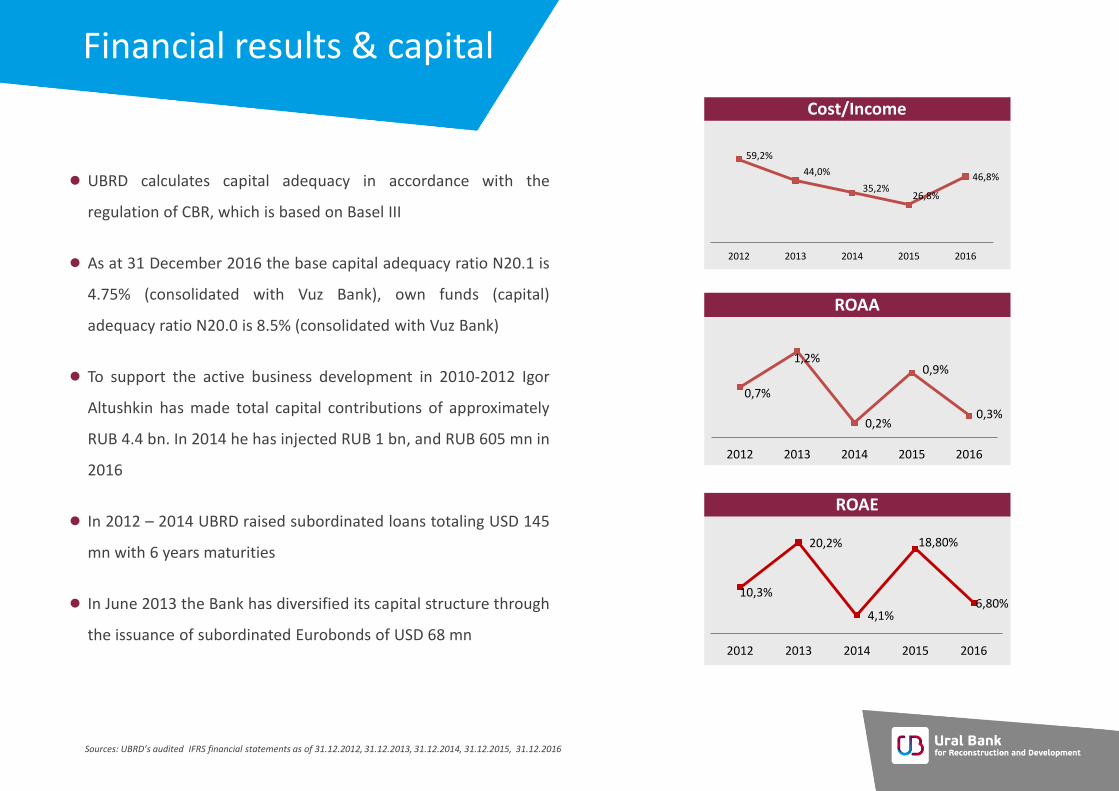
Cost/Income
Financial results & capital
Sources: UBRD’s audited IFRS financial statements as of 31.12.2012, 31.12.2013, 31.12.2014, 31.12.2015, 31.12.2016
● UBRD calculates capital adequacy in accordance with the
regulation of CBR, which is based on Basel III
● As at 31 December 2016 the base capital adequacy ratio N20.1 is
4.75% (consolidated with Vuz Bank), own funds (capital)
adequacy ratio N20.0 is 8.5% (consolidated with Vuz Bank)
● To support the active business development in 2010-2012 Igor
Altushkin has made total capital contributions of approximately
RUB 4.4 bn. In 2014 he has injected RUB 1 bn, and RUB 605 mn in
2016
● In 2012 – 2014 UBRD raised subordinated loans totaling USD 145
mn with 6 years maturities
● In June 2013 the Bank has diversified its capital structure through
the issuance of subordinated Eurobonds of USD 68 mn
ROAA
ROAE
59,2%
44,0%
35,2% 26,8%
46,8%
2012 2013 2014 2015 2016
10,3%
20,2%
4,1%
18,80%
6,80%
2012 2013 2014 2015 2016
0,7%
1,2%
0,2%
0,9%
0,3%
2012 2013 2014 2015 2016

Funding and liquidity
Investor presentation | 2016

Sustainable resource
● The funding base is dominated by stable, organic sources –
customer deposits and current accounts
● The Bank's deposit base is well diversified – single name
concentrations are low
● The Bank gradually diversifies its funding base:
Registered programme for issuance of local bonds RUB 32
bn worth and includes 7 issues
— ECP programme of USD 200 mn limit
— Debut Subordinated Eurobond of USD 68 mn issued in the
international capital markets
Sources: UBRD’s audited IFRS financial statements as of 31.12.2012, 31.12.2013, 31.12.2014, 31.12.2015, 31.12.2016
Resource base dynamics, RUB mn
Cost of funding
base
8 940 19 189 19 259 12 710 14 312
66 820 85 129 99 453
141 519 167 990
27 820
39 859 49 640
48 027
42 673
2012 2013 2014 2015 2016
Legal entities
Individuals
Debt securities issued
6,81% 7,46% 7,80%
11,00%
7,40%
2012 2013 2014 2015 2016

Debt capital markets
Outstanding issues Volume Coupon, % Put option Maturity
Subordinated Eurobonds USD 68 mn 12% — December 27, 2018
Local RUB bonds, Series BO-05 RUB 3 bn 12% October 18, 2017 April 10, 2020
Matured issues Volume Coupon, % Put option Maturity
ECP USD 7.5 mn YTM 6.375% — September 12, 2014
ECP USD 35.8 mn YTM 6.00% — April 25, 2014
ECP USD 7.5 mn YTM 6.25% — January 08, 2014
ECP USD 50 mn YTM 7.25% — August 08, 2013
Local RUB bonds, Series 02 RUB 2 bn 10.75% — May 01, 2014
Local RUB bonds, Series BO-01 RUB 2 bn 12.5% — September 29, 2015
Local RUB bonds, Series BO-08 RUB 3 bn 13% — September 19, 2016
Funding history on public debt markets
The Bank has a low dependence on the capital markets

Liquid assets
● UBRD consistently maintains adequate level of liquidity
on its balance sheet: cash and cash equivalents account for 14.7%
of total assets and securities account for 36.4% of total assets as at
31 December 2016
● A significant part of the securities portfolio is formed by Eurobonds
of Russian issuers. Most issuers, considering downgrades the
rating of Russia, had a BB rating.
● Almost the entire portfolio of securities is available
for repo operations with the CBR
Sources: UBRD’s audited IFRS financial statements as of 31.12.2012, 31.12.2013, 31.12.2014, 31.12.2015, 31.12.2016
Securities portfolio structure, %
Securities portfolio structure by credit rating
75,99%
23,26%
0,71%
BBB
BB
B
89,7% 95,0% 96,7%
16,3% 11,1%
34,8%
28,9%
9,1% 4,5% 2,9%
0,6% 1,0%
7,1%
59,0%
24,81% 23,4%
16,1%
25,6%
36,4%
2012 2013 2014 2015 2016
Corporate bonds Corporate Eurobonds Municipal bonds
Government bonds Securities/Assets

Strong interbank relations
● Trade & Export Structured Finance, Treasury, Debt Capital Markets –
key products in interbank markets that UBRD is committed to develop
● ECAs, State Owned FIs and Multinationals –
crucial partners for long term and special purpose funding (UBRD already
maintains close cooperation with Hermes, US Exim, SACE, EXIAR,
Vnesheconombank Group, Agency for Housing Mortgage Lending)
● UBRD benefits from mutually advantageous cooperation with highly
reputable institutions in different fields, and intends to further strengthen
its cooperation

Loan portfolio
Investor presentation | 2016

Loan portfolio overview
● Retail Business: NPLs 90+ are within industry’s average –
17.9% The Bank has been actively working with payroll
clients, who form the major part of the loan portfolio.
● Corporate Business: UBRD keeps its optimal lending
strategy continuing work with the payroll clients and
borrowers with positive credit history. NPLs 90+ stand at
1.3%.
● SME: The loan portfolio volume continues to decline due to
Bank’s conservative approach and cautiousness of the
clients
Gross loan book dynamics
Reserves levels on loan portfolio (%)
Sources: UBRD’s audited IFRS financial statements as of 31.12.2012, 31.12.2013, 31.12.2014, 31.12.2015, 31.12.2016
35 437 65 525 67 734 55 657 49 939
36 439
43 333 81 224 97 715 125 629
4 587
8 068
9 301 4 683 3 162
2012 2013 2014 2015 2016
Retail loans Corporate loans SME
9,2 10,3
16,3 18,6
16,7
6,2
10,3
24,6 24,8
14,5
1,4 1,3 0,9 0,7 0,3
2012 2013 2014 2015 2016
Retail SME Corporate

Key investment highlights
UBRD is the core bank and leading banking brand in the Ural region
“Corner” bank with extensive branch network
Large and liquid securities portfolio
Low dependence on wholesale financing, gradually diversifying its
funding base
Strong and supportive shareholder
Strategy focused on profitable retail and SME
Appendix
Investor presentation | 2016

Ural Federal District overview
● 14% of 2014 Russian GDP
● 20% of manufacturing and 7% of agricultural production in Russia
● Urals account for nearly 18% of all fixed assets of the Russian
Federation, more than 10% of Russia's retail trade turnover, 13% of
the volume of construction works and over 16% of total investment in
fixed assets
● More than 52% of the total Russian exports (including export oil and
gas).
● Ural FD generated about 25.3% of total federal tax inflows in 2014
● #2 by income per capita in Russia. The average nominal wage in the
region is 1.21 times the national average
● The structure of export is dominated by oil and gas, then products
metallurgy, mechanical engineering, chemical and timber industry
Sources: Rosstat;Plenipotentiary of the President of the Russian Federation in the Urals Federal District web-site
● Import includes products of light industry, food industry, medicine,
machinery and equipment, ores and concentrates
● Foreign trade turnover of about USD 21.6 bn; stable positive balance:
exports exceed imports by 1.9
● Steady growth of investments: international investments increased by
2.8% in 2014
● Ekaterinburg will host the World Cup in 2018

RCC Group
● Russian Copper Company (RCC) consistently holds leading positions in production of copper being ranked TOP-3
1 producer in Russia
● The Company accounted for 21% of Russian and 1% of the world copper market (as of 2015)
2
● RMK's revenue in 2015 increased by 38.7% to RUB 74.9 bn from RUB 54 bn. Adjusted net profit of RMK (unadjusted for exchange rate differences) went up 36.9% to RUB 14.1 bn from RUB 10.3 bn. n 2015, the company's revenue in US dollar terms was USD 1.299 bn, EBITDA amounted to USD 477 mn, EBITDA margin was 35.1%.
2
● This fact indicates a quite comfortable stay in the market and highly professional financial and economic policies in the enterprise.
Strong market positions
● RCC business model covers the full production cycle, including mining, hydrometallurgical, metallurgical and trading divisions
● RCC has operations in Russia and in Kazakhstan
● RCC production capacity is 200 ths t of cathode copper2 and up to 190
ths t of copper wire rod2
Vertically integrated production
● The Group has 24 licenses for the right of exploration and mining of mineral resources (copper, zinc, nickel) on the territory of Russia and Kazakhstan.
● Reserves totaled 6.1 mn t of copper and 2 mn t of zinc (JORC, as of 31.12.2015)
2
Resource base
Metallurgy
Mining
Ore production
Trading and Management
In development
Sources: 1The National Rating Agency;
2RCC data
Sverdlovsk region
Orenburg region
Kazakhstan
Chelyabinsk region

International business department Tel: +7 495 230 01 84/85/87 7 Bolshoi Strochenovskiy pereulok 5th Floor, 503 Office 115054 Moscow ubrr.ru
Contacts